Standoff Ultraviolet Raman Scattering Detection of...
27
SANDIA REPORT SAND2011-7955 Unlimited Release Printed October 2011 Standoff Ultraviolet Raman Scattering Detection of Trace Levels of Explosives Thomas A. Reichardt, Scott E. Bisson, and Thomas J. Kulp Prepared by Sandia National Laboratories Albuquerque, New Mexico 87185 and Livermore, California 94550 Sandia National Laboratories is a multi-program laboratory managed and operated by Sandia Corporation, a wholly owned subsidiary of Lockheed Martin Corporation, for the U.S. Department of Energy's National Nuclear Security Administration under contract DE-AC04-94AL85000. Approved for public release; further dissemination unlimited.
Transcript of Standoff Ultraviolet Raman Scattering Detection of...

SANDIA REPORT
SAND2011-7955 Unlimited Release Printed October 2011
Standoff Ultraviolet Raman Scattering Detection of Trace Levels of Explosives
Thomas A. Reichardt, Scott E. Bisson, and Thomas J. Kulp Prepared by Sandia National Laboratories Albuquerque, New Mexico 87185 and Livermore, California 94550 Sandia National Laboratories is a multi-program laboratory managed and operated by Sandia Corporation, a wholly owned subsidiary of Lockheed Martin Corporation, for the U.S. Department of Energy's National Nuclear Security Administration under contract DE-AC04-94AL85000. Approved for public release; further dissemination unlimited.

2
Issued by Sandia National Laboratories, operated for the United States Department of
Energy by Sandia Corporation.
NOTICE: This report was prepared as an account of work sponsored by an agency of
the United States Government. Neither the United States Government, nor any agency
thereof, nor any of their employees, nor any of their contractors, subcontractors, or their
employees, make any warranty, express or implied, or assume any legal liability or
responsibility for the accuracy, completeness, or usefulness of any information,
apparatus, product, or process disclosed, or represent that its use would not infringe
privately owned rights. Reference herein to any specific commercial product, process, or
service by trade name, trademark, manufacturer, or otherwise, does not necessarily
constitute or imply its endorsement, recommendation, or favoring by the United States
Government, any agency thereof, or any of their contractors or subcontractors. The
views and opinions expressed herein do not necessarily state or reflect those of the United
States Government, any agency thereof, or any of their contractors.
Printed in the United States of America. This report has been reproduced directly from
the best available copy.
Available to DOE and DOE contractors from
U.S. Department of Energy
Office of Scientific and Technical Information
P.O. Box 62
Oak Ridge, TN 37831
Telephone: (865)576-8401
Facsimile: (865)576-5728
E-Mail: [email protected]
Online ordering: http://www.osti.gov/bridge
Available to the public from
U.S. Department of Commerce
National Technical Information Service
5285 Port Royal Rd
Springfield, VA 22161
Telephone: (800)553-6847
Facsimile: (703)605-6900
E-Mail: [email protected]
Online order: http://www.ntis.gov/help/ordermethods.asp?loc=7-4-0#online

3
SAND2011-7955
Unlimited Release
Printed October 2011
Standoff Ultraviolet Raman Scattering of Trace Levels of Explosives
Thomas A. Reichardt, Scott E. Bisson, and Thomas J. Kulp
Remote Sensing and Energetic Materials
Sandia National Laboratories
PO Box 969, MS 9056
Livermore, California 94551-0956
Abstract
Ultraviolet (UV) Raman scattering with a 244-nm laser is evaluated for standoff
detection of explosive compounds. The measured Raman scattering albedo is
incorporated into a performance model that focused on standoff detection of trace
levels of explosives. This model shows that detection at ~100 m would likely
require tens of seconds, discouraging application at such ranges, and prohibiting
search-mode detection, while leaving open the possibility of short-range point-
and-stare detection. UV Raman spectra are also acquired for a number of
anticipated background surfaces: tile, concrete, aluminum, cloth, and two
different car paints (black and silver). While these spectra contained features in
the same spectral range as those for TNT, we do not observe any spectra similar
to that of TNT.

4

5
CONTENTS
1. Introduction .............................................................................................................. 7
2. Experiment ............................................................................................................... 9
2.1. Assembly of a lab-scale Raman transmitter and receiver .................................. 10
2.2. Laboratory system calibration ............................................................................ 11
2.3. Sample preparation ........................................................................................... 14
3. Results .................................................................................................................... 16
3.1. Raman scattering albedo ................................................................................... 16
3.2. Comparison with literature results ...................................................................... 17
3.3. Performance calculations .................................................................................. 18
4. Summary ................................................................................................................ 21
References .................................................................................................................. 23
Figures
FIG. 1. SCHEMATIC DIAGRAM OF RAMAN LIDAR INSTRUMENT. ...................................................................... 9 FIG. 2. SCHEMATIC DIAGRAM OF LABORATORY RAMAN INSTRUMENT. ............................................................ 10 FIG. 3. SCHEMATIC DIAGRAM OF THE INSTRUMENT CONFIGURATION FOR SPECTRAL CALIBRATION. ...................... 11 FIG. 4. SPECTRA FOR CALIBRATION PROCEDURE. THE LAMP SOURCE (TOP GRAPH) PROVIDES A CALIBRATED
IRRADIANCE AT A DEFINED STAND-OFF DISTANCE. THIS IRRADIANCE REFLECTS FROM THE CALIBRATED
REFLECTANCE SURFACE TO GENERATE A RADIANCE THAT IS SEEN BY THE DETECTOR IN UNITS OF COUNTS. THE
COUNTS PER PIXEL (MIDDLE GRAPH) CAN THEN BE RELATED TO THE ENERGY REFLECTED BY THE SURFACE, PROVIDING THE CONVERSION BETWEEN COUNTS AND J/SR (BOTTOM GRAPH). ....................................... 14
FIG. 5. PHOTOGRAPH OF A DROPLET FALLING TO THE SURFACE AFTER GENERATION BY THE INKJET. ...................... 15 FIG. 6. PHOTOGRAPH OF THE INKJET APPARATUS USED TO COAT SUBSTRATES. ................................................. 15 FIG. 7. RAMAN SCATTERING SIGNAL (LOWER WAVEFORM) FROM TNT. DATA FROM SHORT AND CARTER [25]
(UPPER WAVEFORM) ARE SHOWN FOR COMPARISON. ........................................................................ 16 FIG. 8. LASER SPATIAL FORMATTING FOR LIDAR CALCULATIONS. ................................................................... 19 FIG. 9. TRANSMITTED LASER POWER FOR LIDAR PERFORMANCE CALCULATIONS. ............................................. 19 FIG. 10. INTEGRATION TIME REQUIRED FOR DETECTION. ................................................................................ 19 FIG. 11. SPECTRA OF COMMON BACKGROUNDS. WHILE THESE SPECTRA CONTAINED FEATURES IN THE SAME SPECTRAL
RANGE AS THOSE FOR TNT, THEY ARE NOT SIMILAR TO THAT OF TNT. .................................................. 20
Tables
TABLE 1. INSTRUMENT VARIABLES FOR QUANTITATIVE SPECTRAL CALIBRATON. ................................................... 13 TABLE 2. RAMAN SCATTERING ALBEDO MEASUREMENTS. ............................................................................... 17 TABLE 3. RAMAN SCATTERING CROSS SECTIONS OF TNT. ................................................................................ 18

6

7
1. Introduction
Standoff detection of trace levels of explosive compounds has been held at the highest priority by
defense and security concerns for the past decade [1,2]. As a result, investments have been made
toward developing optical standoff detection approaches [3], including visible Raman scattering [4,5],
laser-induced breakdown spectroscopy (LIBS) [6,7], photofragment (PF)-based approaches [8],
coherent anti-Stokes Raman scattering (CARS) [9], and both passive and active infrared detection
[10]. Thus far not one of these approaches has demonstrated the potential to achieve standoff
detection of explosives traces with a field-deployable system on a variety of surfaces in realistic
conditions. However, very recently the Swedish Defense Research Agency reported the use of
ultraviolet (UV) Raman scattering for field-detection of vapor-phase nitromethane at 13 m [11].
Compared to the aforementioned alternatives, we note four differentiating features of UV Raman
scattering: (1) Raman scattering is non-destructive, allowing repeatable optical sampling and signal
averaging; (2) Raman scattering provides a unique chemical fingerprint of the molecule for improved
specificity; (3) Raman scattering is a linear process, so the laser beam does not have to be focused at
the sample to enhance the signal; (4) UV Raman scattering potentially allows the use of eye-safe laser
fluences at UV wavelengths; (5) the use of UV lasers corresponds to Raman shifts of ~10 nm, less
than the Stokes fluorescence shift from common materials, providing “fluorescence-free”
measurements. While the first three advantages apply to Raman scattering in the visible wavelength
range as well, the last two advantages are specific to UV probing. Also, compared to visible Raman
scattering, UV Raman scattering from explosive compounds is expected to generate signals greater by
several orders of magnitude due to the resonance enhancement of the Raman cross section [11-15].
In this work we evaluate the potential of standoff detection of explosives at trace levels by UV Raman
scattering on typical surfaces, for use as either a stand-alone approach or as a confirmatory channel.
We acquire UV Raman scattering of trace levels of the explosive TNT using a spectrally calibrated
system. The measured results are implemented into a performance model to allow assessment of
instrument performance. In addition to characterizing the photons resulting from the explosive
compounds, the other two quantities required for detection assessment are the relative number and
distinguishability of the photons generated by common backgrounds and interferences (in comparison
to those generated by the explosive compounds). In other words, the ultimate performance of a
detection system depends not only on capturing a sufficient number of photons from the explosive,
but also on whether those photons both sufficiently exceed and are sufficiently distinguishable from
those resulting from backgrounds and interferences.

8

9
2. Experiment
A Raman LIDAR consists of a co-located transmitter and receiver, which are responsible for
projecting excitation light onto the target and collecting Raman scattering from it. A simple
schematic diagram of a Raman LIDAR is shown in Fig. 1. The transmitter is a laser that is used in
conjunction with formatting and steering optics (not shown) so that its beam intersects the field-of-
view of the receiver at the point to be measured on the target. The receiver collects the scatter from
the target using a large optic, such as a telescope, imaging the radiating target area onto the entrance
aperture of some type of spectral-dispersion device, such as the Czerny-Turner spectrograph
illustrated in Fig. 1. A rejection filter is placed in the path between the receiver optic and the
spectrograph, which rejects the strong backscatter at the laser frequency (i.e., photons not frequency-
shifted by Raman scattering). The spectrograph disperses the light across an array detector, which
records it and converts it to digital data.
Fig. 1. Schematic diagram of Raman LIDAR instrument.
The radiometric properties of a LIDAR instrument are sufficiently well understood that one can
accurately predicts its performance from appropriate laboratory measurements. This is the approach
taken in this project. The following steps were taken to generate a confident performance estimate:
(1) assembly of a lab-scale Raman transmitter and receiver; (2) calibration of the instrument in
radiometric units; (3) comparison to published Raman cross-sections for selected explosives; and (4)
extrapolation to field instrumentation and conditions. The results in each of these areas are described
below.

10
2.1. Assembly of a lab-scale Raman transmitter and receiver The laboratory Raman system developed for this project is shown in Fig. 2. The primary differences
between it and a fieldable device lie in the type of transmitter and receiver optics used. Also, as
shown in Fig. 2, the illumination and collection axes are orthogonal rather than nearly parallel, for
reasons of mechanical convenience. Otherwise, the laser, spectrograph, and detector array all exhibit
performance comparable to similar components that would be integrated into a fieldable device. The
extrapolation of the performance of this system to that of a fieldable instrument (i.e., one which
would use transmitter and receiver optics suitable for measuring a remote target) is straightforward.
Fig. 2. Schematic diagram of laboratory Raman instrument.
The specific components of the lab system are described as follows. The probe laser is a frequency-
doubled continuous-wave (cw) Ar-ion laser (Cambridge Lasers Laboratories Model 3500) producing
244-nm light. The laser is formatted to a diameter of about 1-mm at the sample. It is worth noting
that earlier measurements were made with tighter focusing (about 0.2 mm diameter); however, that
caused photodegradation of the explosive.
The receiver used for these measurements is only slightly modified from a system previously
fabricated for the assessment of photofragment laser-induced fluorescence detection of surface-bound
analytes [16,17]. The Raman scattering signal is collected by a pair of lenses (50-mm diameter; 300-
mm focal length) that image the optical signal onto the entrance slit of a grating spectrograph. The
spectrograph is a Czerny-Turner type (McPherson Inc., Chelmsford, MA; Model 218) that accepts
light at f/5.3. Thus, its acceptance solid angle is slightly under-filled by that of the input light (f/6).
Its entrance slit is oriented parallel to the laser beam axis and is adjusted to a width (typically 50 m)
to maintain acceptable spectral resolution. Once dispersed, the optical signal is imaged by the
spectrograph onto the photocathode of an intensified charge-coupled device (ICCD) array detector
(Andor Model DH501i-25F-04) having 1024×128 pixels. Spectroscopic measurements are conducted
by on-chip binning of the array pixels in the vertical dimension to create a linear, 1024-element-long
spectrum. The photocathode has a near-uniform quantum efficiency of about 13-15% over the

11
wavelength range of 200-300 nm (encompassing all signals measured in this project). The intensifier
is gated to amplify photoelectron signals at gains of up to 400X for a 90-ms gate width.
2.2. Laboratory system calibration The calibration of the relevant laser parameter (power) is accomplished using an ordinary laser power
meter and requires no more discussion. The receiver calibration is carried out by placing a diffusely
scattering material (Spectralon) at the sample location and illuminating it with a UV lamp of known
radiance. This allows the measured counts on a channel of the ICCD to be related to radiance from
the sample (W/sr) within the appropriate wavelength range intercepted by that channel.
Fig. 3. Schematic diagram of the instrument configuration for spectral calibration.
The calibration function can be derived as follows. The manufacturer-supplied lamp spectral
irradiance, [I(λ)]mfg (Wcm-2
nm-1
), has been measured using a detector placed at 300 mm (rmfg)
distance from the lamp and oriented at normal incidence to its illumination axis. In the configuration
illustrated in Fig. 3, the irradiance I’ on the Spectralon target is
cos,,'
2
1
mfg
mfg1
r
rIrI , (1)
where the Spectralon target is oriented normal to the spectrometer axis and r1 and ϕ are the distance
(m) from the lamp to the Spectralon target and the angle of the incidence (rad) of the lamp
illumination onto the Spectralon target, respectively.
The radiance, R (Wcm-2
nm-1
sr-1
) from the Spectralon to the spectrometer is

12
,,',, 1
1
rIrR , (2)
where ρ(λ) is the reflectance of the Spectralon, assumed to be a Lambertian reflector.
The ICCD photocathode area that corresponds to a single point in the calibration spectrum is
vh2pxpc nnwA , (3)
where wpx is the width of a (square) pixel at the photocathode and nv and nh are the number of pixels
binned in the vertical and horizontal dimensions. Because the spectrometer magnification is 1:1
between the slit plane and the photocathode plane, this is the same area that collects light at the slit
plane. Also, because the Spectralon is imaged onto the slit plane at 1:1 magnification (identical lens
focal lengths) at normal incidence, Apc is equal to the area from which light is collected on the
Spectralon.
The range of wavelengths spanned by this area is
hnD , (4)
where D is the dispersion of the spectrometer (nm/pixel).
The calibration factor C (counts/J) that relates energy E (J) radiated by the sample (during a fixed
observation time) to counts N measured by the detector channel is
|||||| ECN , (5)
ECN , (6)
where Eq. (5) represents the calibration for parallel polarized light and Eq. (6) represents that for
perpendicular polarization.
Because the measurements were all made with a depolarizer in the receiver light path, polarization
can be ignored, and the calibration factor is
ENC / , (7)
The energy radiated by the Spectralon that is available for the ith pixel to measure depends on the
spectrum radiated, the spatial extent of the light on the Spectralon, and on the ratio of the slit with to
the effective pixel size of the array (assuming all magnification is 1:1). The most rigorous way to
quantify this available energy would be to generate an instrument spectral response function. For
simplicity, we used a geometric approximation in which we assume that if N pixel fields of view are
spanned by the slit (and the spectrum is flat over the corresponding wavelength range), then the
irradiance on pixel i will be N times that within one pixel field-of-view.
The energy incident on pixel i during the time period τ (s) is

13
pc
px
slit
wAR
wE ii , (8)
where wslit is the width (µm) of the slit and λi is the wavelength (nm) corresponding to pixel i.
Rearranging previous equations gives
Dnnwwr
I
NC
vhii
ii
2pxslit
2
1
mfg
mfgcos
r
. (9)
The appropriate values for the instrument variables are listed in Table 1, and ρ is assumed to be
spectrally flat and equal to 0.9. Inserting these values yields
DwI
NC
slitmfg
42.5, (10)
where the dependences of I, N, and C on λ are shown in Fig. 4. This equation allows the calibration
function to be generated from a measurement of N at a given gain setting.
Table 1. Instrument variables for quantitative spectral calibraton.
INSTRUMENT VARIABLE VALUE
rmfg 300 mm
rl 225 mm
ϕ 11.8˚
wpx 26 x 10-4
cm
nh 1
nv 128

14
Fig. 4. Spectra for calibration procedure. The lamp source (top graph) provides a calibrated irradiance at a defined stand-off distance. This irradiance reflects from the calibrated reflectance surface to generate a radiance that is seen by the detector in units of counts. The counts per pixel (middle graph) can then be related to the energy reflected by the surface, providing the conversion between counts and J/sr (bottom graph).
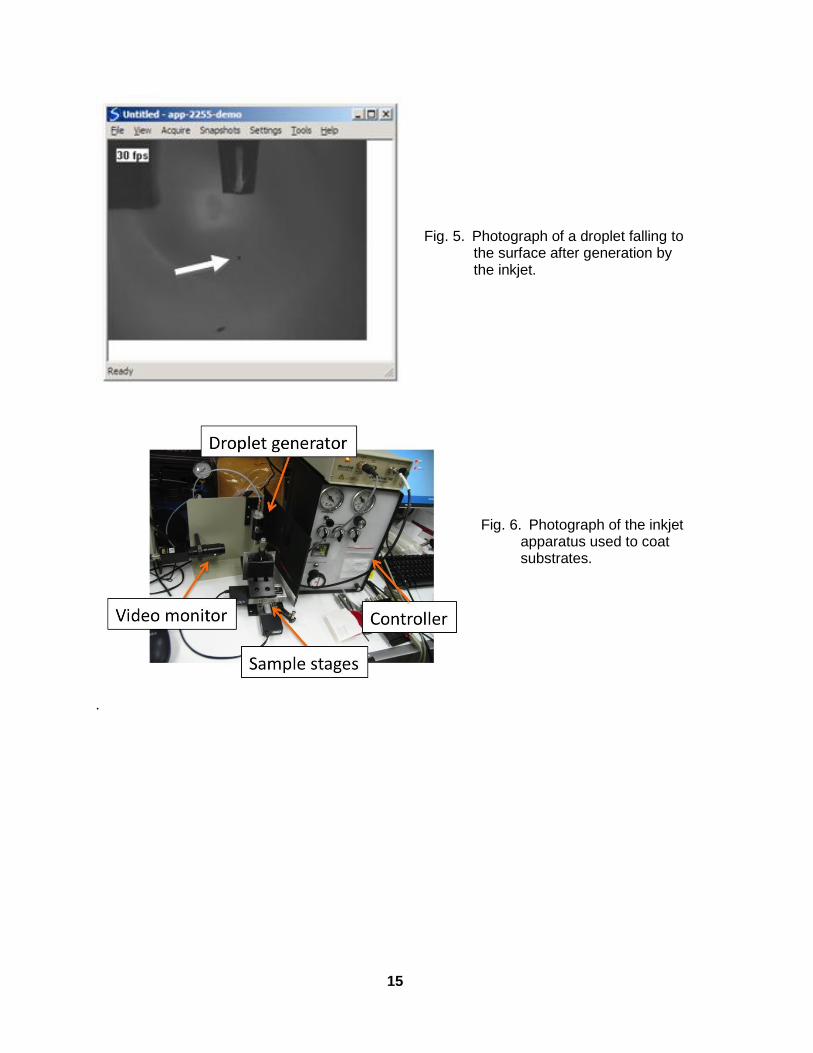
2.3. Sample preparation A droplet generator from Microfab Technologies (Plano, TX) is used to create samples with a
uniform surface coverage. The Microfab system uses a piezoelectric-driven inkjet printing head to
produce individual droplets (see Fig. 5) of highly repeatable size at a wide range of repetition rates.
During deposition, the print head is mounted above a pair of orthogonal motor-driven stages (see Fig.
6) programmed to move the sample surface underneath the droplet deposition area in a raster pattern.
The dimensions of the raster and the droplet release frequency are adjusted to create the desired
coverage of simulant on the sample.
15
Fig. 5. Photograph of a droplet falling to the surface after generation by the inkjet.
.
Fig. 6. Photograph of the inkjet apparatus used to coat substrates.

16
3. Results
The goals of this work are to acquire quantitative UV Raman scattering spectra for comparison to
literature results as well as to extend the performance of this approach to other detection scenarios.
The former goal is accomplished through probing quantitative deposits of TNT with the calibrated
Raman system, while the latter goal is accomplished through application of the LIDAR equation.
3.1. Raman scattering albedo Calculation of the Raman scattering albedo directly follows from the calibration described in Section
2.2. We deposit concentrations of 1, 5, and 20 µg/cm2 on a gold-coated disk. The disk is nominally
rotated during data acquisition, but the signal is also assessed with a stationary target to evaluate any
decrease in the signal due to photodegradation from repeated probing.
Figure 7 displays our calibrated Raman scattering spectrum of TNT on the gold substrate. Included is
the spectrum of TNT presented by Short and Carter [18]. The spectral resolution of our detection
system is lower than that of Short and Carter [18], and we therefore see some blending of the spectral
features. Nevertheless, the main spectral features are evident in our acquired spectrum. The Raman
signal is provided in terms of the Raman scattering albedo, which is spectrally integrated on a per-
pixel basis.
Fig. 7. Raman scattering signal (lower waveform) from TNT. Data from Short and Carter [18] (upper waveform) are shown for comparison.
We acquired data as presented in Fig. 7 for multiple deposits and for each one calculated the
spectrally integrated Raman scattering albedo for the 1340-cm-1
feature. Our results are listed in
Table 2.

17
Table 2. Raman scattering albedo measurements.
CONCENTRATION
(µg/cm2)
RAMAN SCATTERING ALBEDO
(J/sr-mJ)
SUBSTRATE MOTION
1 1.5×10⁻¹⁴
Rotating
5 1.8×10⁻¹⁴
Rotating
5 1.3×10⁻¹⁴
Rotating
5 1.1×10⁻¹⁴
Rotating
20 1.9×10⁻¹⁴
Rotating
20 1.6×10⁻¹⁴
Stationary
20 1.6×10⁻¹⁴
Stationary
20 6.7× 10⁻¹⁵
Stationary
3.2. Comparison with literature results Several publications make reference to the resonance enhancement of Raman cross sections of
explosive compounds. For comparison to our results, we have identified three publications reporting
absolute cross sections for TNT in the wavelength region of our work. These are listed in Table 3.
One [14] of these three studies detected UV Raman scattering of a TNT surface deposit, while the
other two examined TNT diluted in a liquid solvent [12] and in the vapor phase [11]. Comparing
these latter two results to the former, and to our data as well, requires considering the optical depth of
the surface deposit. The absorption cross section of TNT is 6×10-17
cm2/molecule at 244 nm [12], so
with a molecular weight of 227.13 g/mol, the TNT concentration corresponding to the 1/e penetration
length into the deposit (C1/e) is
226
217-231/e g/cm 6g/cm106/moleculecm106molmolecules/ 1002.6
g/mol 227.13
C . (11)
Note that the density of TNT is 1.654 g/cm2, so the layer thickness L1/e corresponding to a 6µg/cm
2
deposit is only
nm 40cm104g/cm 654.1
g/cm106 6
3
26
1/e
L . (12)
The probe beam is therefore attenuated to 1/e of the incident value after passing through the initial 40
nm of the deposit. Recognizing that the exiting signal will be similarly attenuated as well, this likely
explains why the Raman scattering albedo is not a strong function of the deposited concentration for
the range of concentrations assessed in our experiments we considered: for concentrations >6 µg/cm2,
signal will be collected from only the top layer of the deposit. Perhaps this also explains why the
Raman scattering cross section of Nagli et al. [14] (measured on a surface deposit) is so much lower
than the other two reported values. In the final row of Table 3, we include the Raman scattering cross
section calculated from the 1 µg/cm2 deposit.

18
Table 3. Raman scattering cross sections of TNT.
STUDY RAMAN SCATTERING CROSS SECTION
(cm2/sr-molecule)×10
28
SAMPLE PROBED
Nagli et al. [14] 1-2 Solid deposit
Sedlacek et al. [12]* 500 Sample diluted in solution
Ehlerding et al. [11]* 300 Vapor phase
This study 60 Solid deposit (1 µg/cm2)
*Measured at 248 nm
3.3. Performance calculations With quantitative knowledge of the Raman scattering albedo, a LIDAR model can be used to
extrapolate our detection of explosives to other distances. The LIDAR equation calculating the
number of signal photons Sph is
photonfieldeffsignalatmlaseratmlaserph / EQCSatPS , (13)
where Plaser is the transmitted laser power (W), Δt is the integration time (s), τatm(λlaser) is the
atmospheric transmission at the laser wavelength, τatm(λsignal) is the atmospheric transmission at the
signal wavelength, aeff is the effective Raman albedo (J/mJ-sr), S is the fraction of light that passes
through the spectrograph slit, C is the detection efficiency (counts/J-sr), Q is the photons per count (as
provided by the ICCD manufacturer), and Ephoton is the photon energy at the signal wavelength (J).
Assuming the laser is optimally matched to the slit (S = 1), with C = C’/Ωlab, and approximating equal
atmospheric transmission τatm at the laser and signal wavelengths, we can re-write Eq. (13) as
photon
lab
fieldeff
2
atmlaserph /' EQCatPS
. (14)
Equation (14) can be used to extrapolate performance to other distances. The laser beam is assumed
to be formatted into a sheet that matches the collection volume defined by the spectrograph slit (see
Fig. 8). Rather than constraining performance by assuming a particular transmitted laser power, we
instead constrain performance by limiting the laser intensity on the target to that used in the
laboratory (see Fig. 9). This should avoid significant photodegradation of the sample during a point-
and-stare measurement. Based on our prior LIDAR work, we assume that 300 photons must be
collected to provide reliable detection. As illustrated by Fig. 10, the collection of this number of
photons requires >10 s for all ranges considered.

19
Fig. 8. Laser spatial formatting for LIDAR calculations.
Fig. 9. Transmitted laser power for LIDAR performance calculations.
Fig. 10. Integration time required for detection.
Finally, the Raman scattering detection of explosives depends on both the signal strength as well as
the distinguishability of the explosive signature from that of other materials. In an effort to assess the

20
distinguishability of the TNT Raman spectrum from common backgrounds, UV Raman spectra are
also acquired for a number of anticipated background surfaces: tile, concrete, aluminum, cloth, and
two different car paints (black and silver). While these spectra contained features in the same spectral
range as those for TNT, we do not observe any spectra similar to that of TNT.
Fig. 11. Spectra of common backgrounds. While these spectra contained features in the same spectral range as those for TNT, they are not similar to that of TNT.

21
4. Summary
A calibrated continuous-wave (cw) ultraviolet (244-nm probe) Raman instrument was assembled and
characterized. Quantitative amounts of TNT were deposited on a gold-coated surface and probed
with the instrument. The signal level does not scale linearly with concentration. Rather, due to the
absorption by TNT, with a 244-nm absorption cross section of 6×10-17
cm2, the laser penetrates only
~40 nm into the sample. This corresponds to a deposit of 6 µg/cm2, so deposits of this and higher
concentrations are subject to optical thickness effects. For such deposits, rather than a Raman
scattering cross section with units of cm2/sr, it is better to consider a Raman scattering albedo, with
units of J/sr-mJ. For the Raman scattering feature at 1340 cm-1
, we calculate a Raman scattering
albedo of 1.5×10⁻¹⁴
J/sr-mJ.
Our measured Raman scattering albedo was incorporated into a performance model that focused on
standoff detection of trace levels of explosives. This model showed that detection at ~100 m would
likely require tens of seconds, discouraging application at such ranges, and prohibiting search-mode
detection, while leaving open the possibility of short-range point-and-stare detection.
Finally, the Raman scattering detection of explosives depends on both the signal strength as well as
the distinguishability of the explosive signature from that of other materials. In an effort to assess the
distinguishability of the TNT Raman spectrum from common backgrounds, UV Raman spectra were
also acquired for a number of anticipated background surfaces: tile, concrete, aluminum, cloth, and
two different car paints (black and silver). While these spectra contained features in the same spectral
range as those for TNT, we did not observe any spectra similar to that of TNT.
Future work is anticipated to focus on advancing the technology for application to realistic detection
scenarios. Recognizing the advantages of implementing Raman scattering at UV wavelengths, the
research community is making progress on UV laser sources [19] and spectrometers [20] optimized
for Raman scattering. Yellampalle et al. [21,22] have reported the wavelength dependence of UV
Raman-scattering albedos for a wide range of explosive compounds. Also, Raman scattering has
already been implemented to image explosive-contaminated surfaces in both microscope imaging
[23] and stand-off imaging [24,25] geometries.

22

23
References
1. A. A. Faust, C. J. de Ruiter, A. Ehlerding, J. E. McFee, E. Svinsas, and A. D. van Rheenen,
“Observations on military exploitation of explosives detection technologies,” Proc. of SPIE 8017,
801716 (2011)
2. S. Désilets, N. Hô, P. Mathieu, J. R. Simard, E. Puckrin, J. M. Thériault, H Lavoie, F. Théberge,
F. Babin, D. Gay, R. Forest, J. Maheux, G. Roy, and M. Châteauneuf, “Standoff detection of
explosives, a challenging approach for optical technologies,” Proc. of SPIE 8031, 80312C (2011).
3. S. Wallin, A. Pettersson, H. Östmark, and A. Hobro, “Laser-based standoff detection of
explosives: a critical review,” Anal. Bioanal. Chem. 395, 259-274 (2009).
4. M. L. Ramírez-Cedeño, W. Ortiz-Rivera, L. C. Pacheco-Londoño, and S. P. Hernández-Rivera,
“Remote detection of hazardous liquids concealed in glass and plastic containers,” IEEE Sensors
Journal 10, 693-698 (2010).
5. B. Zachhuber, G. Ramer, A. Hobro, E. t. H. Chrysostom, and B. Lendl, “Stand-off Raman
spectroscopy: a powerful technique for qualitative and quantitative analysis of inorganic and
organic compounds including explosives,” Anal. Bionanal. Chem. 400, 2439-2447 (2011).
6. J. L. Gottfried, F. C. De Lucia Jr., C. A. Munson, and A. W. Miziolek, “Laser-induced
breakdown spectroscopy for detection of explosives residues: A review of recent advances,
challenges, and future prospects,” Anal. Bioanal. Chem. 395, 283-300 (2009).
7. F. J. Fortes and J. J. Laserna, “The development of fieldable laser-induced breakdown
spectrometer: No limits on the horizon,” Spectrochimica Acta B 65, 975-990 (2010)
8. C. M. Wynn, S. Palmacci, R. R. Kunz, and M. Aernecke, “Noncontact optical detection of
explosive particles via photodissociation followed by laser-induced fluorescence,” Opt. Express
19, 18671-18677 (2011)
9. M. T. Bremer, P. J. Wrzesinski, N. Butcher, V. V. Lozovoy, and M. Dantus, “Highly selective
standoff detection and imaging of trace chemicals in a complex background using single-beam
coherent anti-Stokes Raman scattering,” Appl. Phys. Lett. 99, 101109 (2011).
10. A. Mukherjee, S. V. der Porten, and C. Kumar, N. Patel, “Standoff detection of explosive
substances at distances of up to 150 m,” Appl. Opt. 49, 2072-2078 (2010).
11. A. Ehlerding, I. Johansson, S. Wallin, and H. Östmark, “Stand-off detection of vapor-phase
explosives by resonance enhanced Raman spectroscopy,” Proc. of SPIE 7835, 783507 (2010).
12. A. J. Sedlacek, III, S. Chritesen, T. Chyba, and P. Ponsardin, “Application of UV-Raman
spectroscopy to the detection of chemical and biological threats,” Proc. of SPIE 5269, 23-33
(2004).
13. G. Comanescu, C. K. Manka, J. Grun, S. Nikitin, and D. Zabetakis, “Identification of explosives
with two-dimensional ultraviolet resonance Raman spectroscopy,” Appl. Spectrosc. 62, 833-839
(2008).
14. L. Nagli, M. Gaft, Y. Fleger, and M. Rosenbluh, “Absolute Raman cross-sections of some
explosives: Trend to UV,” Opt. Mater. 30, 1747-1754 (2008).
15. P. Jander and R. Noll, “Automated detection of fingerprint traces of high explosives using
ultraviolet Raman spectroscopy,” Appl. Spectrosc. 63, 559-563 (2009).

24
16. S. E. Bisson, J. M. Headrick, T. A. Reichardt, R. L. Farrow, T. J. Kulp, “A two-pulse, pump-
probe method for short-range, remote standoff detection of chemical warfare agents,”
Proceedings of SPIE 8018, 80180Q (2011).
17. T. J. Kulp, S. E. Bisson, T. A. Reichardt, J. M. Headrick, and R. L. Farrow, “Two-pulse rapid
remote surface contamination measurement,” Sandia Report SAND2010-7978 (2010).
18. B. J. Short and J. C. Carter, “Ultraviolet resonant Raman enhancements in the detection of
explosives,” Lawrence Livermore National Laboratory Report LLNL-TH-413751 (2009).
19. J. Kilmer, A. Iadevaia, and Y. Yin, “Laser sources for Raman spectroscopy,” Proc. of SPIE 8039,
803914 (2011).
20. N. Hagen and D. J. Brady, “Coded aperture DUV spectrometer for standoff Raman
spectroscopy,” Proc. of SPIE 7319, 73190D (2009).
21. B. Yellampalle, M. Sluch, S. Asher, and B. Lemoff, “Explosive sensing using multiple-
excitation-wavelength resonance-Raman scattering,” Paper ATuE4 presented at the 2011
Conference on Lasers and Electro-Optics (CLEO 2011), Baltimore, MD, May 1-6, 2011.
22. B. Yellampalle, M. Sluch, S. Asher, and B. Lemoff, “Multiple-excitation-wavelength resonance-
Raman explosives detection,” Proc. of SPIE 8018, 801819 (2011).
23. E. D. Emmons, A. Tripathi, J. A. Guicheteau, S. D. Christesen, and A. W. Fountain III, “Raman
chemical imaging of explosive contaminated fingerprints,” Appl. Spectrosc. 63, 1197-1203
(2009).
24. M. Nordberg, M. Åkeson, H. Östmark, and T. E. Carlsson, “Stand-off detection of explosive
particles by imaging Raman spectroscopy,” Proc. of SPIE 8017, 80171B (2011).
25. H. Östmark, M. Nordberg, and T. E. Carlsson, “Stand-off detection of explosives particles by
multispectral imaging Raman spectroscopy,” Appl. Opt. 50, 5592-5599 (2011).

25
Distribution:
1 MS9056 Thomas A. Reichardt (electronic copy)
1 MS9056 Scott E. Bisson (electronic copy)
1 MS9056 Thomas J. Kulp (electronic copy)
1 MS9056 Wen L. Hsu (electronic copy)
1 MS9004 Duane Lindner (electronic copy)
1 MS0899 RIM – Reports Management, 9532 (electronic copy)

26