A study on Moringa oleifera leaves as a supplement to West ...

EFFECT OF MORINGA OLEIFERA LEAVES EXTRACT ON MOLECU LAR
SIGNALING IN COLON CANCER CELLS
By
Miss Jintana Tragulpakseerojn
A Thesis Submitted in Partial Fulfillment of the Requirements for the Degree
Doctor of Philosophy Program in Pharmaceutical Technology
Graduate School, Silpakorn University
Academic Year 2016
Copyright of Graduate School, Silpakorn University

EFFECT OF MORINGA OLEIFERA LEAVES EXTRACT ON MOLECU LAR
SIGNALING IN COLON CANCER CELLS
By
Miss Jintana Tragulpakseerojn
A Thesis Submitted in Partial Fulfillment of the Requirements for the Degree
Doctor of Philosophy Program in Biopharmaceutical Sciences
Graduate School, Silpakorn University
Academic Year 2016
Copyright of Graduate School, Silpakorn University

ผลของสารสกดใบมะรมตอ molecular signaling ในเซลลมะเรงลาไสใหญ
โดย นางสาวจนตนา ตระกลปกษโรจน
วทยานพนธน6เปนสวนหน8งของการศกษาตามหลกสตรปรญญาเภสชศาสตรดษฎบณฑต สาขาวชาเภสชศาสตรชวภาพ
บณฑตวทยาลย มหาวทยาลยศลปากร ปการศกษา 2559
ลขสทธBของบณฑตวทยาลย มหาวทยาลยศลปากร

The Graduate School, Silpakorn University has approved and accredited the thesis title of “Effect of Moringa oleifera leaves extract on molecular signaling in colon cancer cells” submitted by Miss Jintana Tragulpakseerojn as a partial fulfillment of the requirements for the degree of Doctor of Philosophy in Biopharmaceutical Sciences. ……...............................................................................
(Associate Professor Panjai Tantatsanawong, Ph.D.)
Dean of Graduate School ............/............/............
The Thesis Advisors
1. Associate Professor Auayporn Apirakaramwong, Ph.D. 2. Assistant Professor Perayot Pamonsinlapatham, Ph.D. 3. Associate Professor Penpan Wetwitayaklung, Ph.D.
The Thesis Examination Committee
………………………….….…….. Chairman (Associate Professor Chatchai Chinpaisal, Ph.D.) ............../................./............. ………………………….….…….. Member (Professor Toshihiko Toida, Ph.D.) ............../................./............. ………………………….….…….. Member (Associate Professor Auayporn Apirakaramwong, Ph.D.) ............../................./............. ………………………….….…….. Member (Assistant Professor Perayot Pamonsinlapatham, Ph.D.) ............../................./............. ………………………….….…….. Member (Associate Professor Penpun Wetwitayaklung, Ph.D.) ............../................./.............
iv
55355801 : MAJOR : BIOPHARMACEUTICAL SCIENCES KEY WORDS : COLON CANCER / MORINGA OLEIFERA LEAVES / MOLECULAR
SIGNALING JINTANA TRAGULPAKSEEROJN : EFFECT OF MORINGA OLEIFERA LEAVES EXTRACT ON MOLECULAR SIGNALING IN COLON CANCER CELLS. THESIS ADVISORS : ASSOC. PROF.AUAPORN APIRAKARAMWONG, Ph.D., ASST. PROF. PERAYOT PAMONSINLAPATHAM AND ASSOC. PROF. PENPAN WETWITAYAKLUNG, Ph.D. 87 pp.
Moringa oleifera Lam. is an edible plant and used for traditional medicine, with a wide
distribution in Thailand. Many studies have examined the nutritional and medicinal properties,
especially anti-cancer properties. It has been reported that the crude extract of M. oleifera
leaves represents the effects of subG1 phase inhibition, apoptotic induction and some
molecular signaling involvement in different cancer cell lines. However, the effects of M.
oleifera leaves on molecular mechanism of cancer in human colon cancer cells have not been
studied. Therefore, it is of interest to determine whether M. oleifera leaves can affect on colon
cancer cells at a molecular level. First, the cytotoxicity effect on colon cancer cells was
screened using fractionated M. Oleifera leaves extractc. M. oleifera leaves extract was
fractionated by Sephadex LH-20 column chromatography and then all fractions were
analyzed with UV spectrophotometry to yield four pooled fractions (MOL1-MOL4) according to
their absorbance profile pattern at 260 nm. The obtained four pooled fraction were evaluated
the toxicity on colon HCT116 cancer cells in a comparison to commercial flavonols and
flavonol glycosides (kaempferol, astragalin and isoquercetin) which have been found in M.
oleifera leaves. The four pooled fractions (MOL1-MOL4) displayed a significant anti-
proliferative activity against HCT116 cells. Comparatively, the proliferation of MOL2, MOL3 or
MOL4 treated cells were more inhibited than that of MOL1 treated cells at 24 and 48 hr. In the
other words, MOL2, MOL3 and MOL4 of M. oleifera leaves extracts were high toxic on colon
cancer cells while MOL1 was less toxic.
Among four pooled fractions of M. oleifera leaves, MOL1 and MOL2 were found to
decrease pERK1/2 activation of HCT116 cells in a dose-dependent manner. For MOL3 and
MOL4, they decreased pERK1/2 activation more than MOL1 and MOL2 which were
concomitant with their higher antiproliferative activity. The findings indicated that the M.
oleifera leaves extracts may inhibit the growth of HCT116 cells through the reduction of
pERK1/2 signaling pathway.
Program of Biopharmaceutical Sciences Graduate School, Silpakorn University
Student's signature.................................................. Academic Year 2016
Thesis Advisors' signature 1.................................2.................................3.................................

v
55355801 : สาขาวชาเภสชศาสตรชวภาพ คาสาคญ : มะเรงลาไสใหญ / มะรม / สญญาณโมเลกล จนตนา ตระกลปกษโรจน : ผลของสารสกดใบมะรมตอ molecular signaling ในเซลลมะเรงลาไสใหญ. อาจารยทBปรกษาวทยานพนธ : ภญ.รศ.ดร.อวยพร อภรกษอรามวง, ภก. ผศ.ดร. พรยศ ภมรศลปธรรม และ ภญ.รศ.ดร.เพญพรรณ เวชวทยาขลง . 87 หนา. มะรมเปนพชทBรบประทานไดและใชเปนยาพIนบานโดยทBวไปในประเทศไทย มการศกษาวจยมากมายเกBยวกบคณคาสารอาหาร และคณสมบตทางยาของมะรม โดยเฉพาะอยางยBงคณสมบตในการตานมะเรง เคยมรายงานระบวา สารสกดหยาบของใบมะรมมฤทธL ยบย Iงการแบงเซลลระยะ subG1, เหนBยวนากระบวนการตายของเซลลมะเรง และสงผลตอโมเลกลสญญาณบางอยางในเซลลมะเรงหลายชนด อยางไรกตามยงไมเคยมรายงานเกBยวกบผลของใบมะรมตอกลไกระดบโมเลกลในเซลลมะเรงลาไสใหญ ดงนIนการวจยเพBอใหทราบวาใบมะรมมผลตอเซลลมะเรงลาไสใหญในระดบโมเลกลหรอไม จงเปนสBงทBนาสนใจ โดยขIนแรก ทาการตรวจสอบความเปนพษตอเซลลมะเรงลาไสใหญเบIองตน ดวยการใชสารสกดจากใบมะรมทBแยกเปนสวนยอย ๆ สารสกดจากใบมะรมถกนามาแยกเปนสวนยอย ๆ ดวยเทคนคโครมาโตกราฟ ชนดคอลมภ ทBใช Sephadex LH20 เปนตวกลาง หลงจากนIน fraction ทIงหมดถกนามาวเคราะหดวย UV spectrophotometry แลวจงนามารวมกนเปน pool fraction ตามลกษณะคาการดดกลนแสงทB 260 นาโนเมตร ไดเปนสารสกด 4 สวน (MOL1-MOL4) ซB งสารสกด 4 สวนนI ใชทดสอบความเปนพษตอเซลลมะเรงลาไสใหญ (HCT116) โดยเปรยบเทยบกบสารฟลาโวนอล และฟลาโวนอล ไกลโคไซดบรสทธL (kaempferol , astragalin และ isoquercetin) ทBมรายงานวาพบในใบมะรม สารสกด 4 สวน (MOL1- MOL4) ยบย Iงการเจรญของเซลล HCT116 อยางมนยสาคญ เมBอเปรยบเทยบกน พบวา MOL2, MOL3 และ MOL4 ยบย Iงการเจรญของเซลลมากกวา MOL1 เมBอบมเปนเวลา 24 และ 48 ชBวโมง หรอกลาวไดวา MOL2, MOL3 และ MOL4 มความเปนพษสงตอเซลลลาไสใหญ ในขณะทB MOL1 มความเปนพษตBากวา
ในสารสกด 4 สวนจากใบมะรม MOL1 และ MOL2 ลดการกระตนของ pERK1/2 ในเซลล HCT116 ในลกษณะแปรผนตามปรมาณของสารสกดทBใช สาหรบ MOL3 และ MOL4, สารสกดทIงสองสวนลดการกระตน pERK1/2 ไดมากกวา MOL1 และ MOL2 ซB งสอดคลองกบฤทธL การยบย IงการเจรญของเซลลทBสงกวา จากผลการศกษาชIใหเหนวาสารสกดจากใบมะรมอาจยบย Iงการเจรญของเซลลมะเรงลาไสใหญ HCT116 ผานการลดวถสญญาณ pERK1/2
สาขาวชาเภสชศาสตรชวภาพ บณฑตวทยาลย มหาวทยาลยศลปากร ลายมอชBอนกศกษา.................................................................................. ปการศกษา 2559 ลายมอชBออาจารยทBปรกษาวทยานพนธ 1.....................................2.....................................3.....................................

vi
ACKNOWLEDGEMENTS
I wish to express sincere appreciation to every people who contributed
in diverse ways to the success of my research. I would like to gratefully and sincerely
thank my thesis advisor, Associate Professor Dr. Auaporn Apirakaramwong and
Assistant Professor Dr. Perayot Pamonsinlapatham whose encouragement, guidance
and support from the initial to the final level enabled me to develop an understanding
of the dissertation. I would like to acknowledge Associate Professor Dr. Penpun
Wetwitayaklung as my co-advisor who helped me develop ideas and experiments. I
also would like to appreciate Ms. Areerut Sripattanaporn for her helpful support and
supplying me in laboratory instruments.
I would like to express my appreciation to Dr. Lawan Siangjong for her
assistance in Western Blot analysis.
I would like to sincere thanks to all teachers, follow graduate students,
researchers and the staff in Faculty of pharmacy, Silpakorn University, for giving me
the place, equipments, knowledge and friendship.
My next appreciation goes to the graduate school of Silpakorn
University for financial support. The Silpakorn Research and Development Institute
for facility support.
Finally, I would like to show my greatest appreciation to my family for
everything especially love, caring, understanding, encouragement, and believing in
me.

vii
TABLE OF CONTENTS
Page
English Abstract……………………………………………………………….. iv
Thai Abstract….……………………………………………………………….. v
Acknowledgements……………………………………………………………. vi
List of Tables………..…………………………………………………………. viii
List of Figures………………….………………………………………………. x
List of Abbreviations.…………………………….……………………………. xiii
Chapter
1 Introduction….…….……………………………………………………... 1
2 Literature Reviews……………………………………………………….. 3
3 Materials and Methods…………………………………………………… 24
4 Results and Discussion…………………………………………………… 33
5 Conclusions………………………………………………………………. 50
References….………………………………………..……………………….... 51
Appendix…………………………………………………………………….… 57
Biography ……………………………………………………………………... 86

viii
LIST OF TABLES
Table Page
2.1 Common traditional medicinal uses from various parts of M.
oleifera…………………………………………………………...
5
2.2 Some chemical constituents of the isolated molecules from M. oleifera
leaves.….........................................................................................
8
2.3
4.1
Example of phytochemicals and their main dietary sources....………….
Phytochemicals present in M. oleifera leaves using different solvent
extract.…........................................................................................
22
38
4.2 Toxicity of each pooled fractions in HCT116 and NHF cells at 24 and
48 h....……………………………………………………………...
45
4.3 Toxicity of STD compounds in HCT116 cells at 24 and 48 h. ……….. 45
A.1 Detection of each fraction from fractionation of M. oleifera leaves
extract using UV-spectrophotometer at 260 nm............................
59
A.2 The percentage of cell viability of MOL1 on HCT116 cells at 24 h....... 64
A.3 The percentage of cell viability of MOL2 on HCT116 cells at 24 h....... 64
A.4 The percentage of cell viability of MOL3 on HCT116 cells at 24 h....... 64
A.5 The percentage of cell viability of MOL4 on HCT116 cells at 24 h.….. 65
A.6 The percentage of cell viability of MOL1 on HCT116 cells at 48 h....... 65
A.7 The percentage of cell viability of MOL2 on HCT116 cells at 48 h....... 65
A.8 The percentage of cell viability of MOL3 on HCT116 cells at 48 h.….. 66
A.9 The percentage of cell viability of MOL4 on HCT116 cells at 48 h....... 66
A.10
A.11
A.12
A.13
A.14
A.15
A.16
A.17
The percentage of cell viability of MOL1 on NHF cells at 24 h……….
The percentage of cell viability of MOL2 on NHF cells at 24 h……….
The percentage of cell viability of MOL3 on NHF cells at 24 h……….
The percentage of cell viability of MOL4 on NHF cells at 24 h……….
The percentage of cell viability of MOL1 on NHF cells at 48 h……….
The percentage of cell viability of MOL2 on NHF cells at 48 h……….
The percentage of cell viability of MOL3 on NHF cells at 48 h……….
The percentage of cell viability of MOL4 on NHF cells at 48 h……….
66
67
67
67
67
68
68
68

ix
Table
A.18
A.19
The percentage of cell viability of astragalin on HCT116 cells at 24 h..
The percentage of cell viability of kaempferol on HCT116 cells at 24h
Page
69
69
A.20
A.21
A.22
A.23
The percentage of cell viability of isoquercetin on HCT116 cells at 24
h…………………………………………………………………..
The percentage of cell viability of astragalin on HCT116 cells at 48 h.
The percentage of cell viability of kaempferol on HCT116 cells at 48
h…………………………………………………………………..
The percentage of cell viability of isoquercetin on HCT116 cells at 48
h…………………………………………………………………..
69
70
70
70
A.24 The relative protein expression values (pERK1/2) from Image J
analysis…………………………………………………………...
82

x
LIST OF FIGURES
Figure Page
2.1 Moringa oleifera Lam., a typical Moringaceae. The M. oleifera tree
products; (a) flowers, (b) leaves and (c) pods of plant. ………...
4
2.2 Structural of major phytochemicals found M. oleifera leaves………... 10
2.3
2.4
2.5
Each part of long colon (intestine) and rectal can produce cancer.
There are often referred to as colorectal cancers. Colonoscopy
can detect the picture of colon cancer. .………………………...
Intracellular signaling pathways in colorectal cancer…………………
General scheme of signaling cascades in cancer cells. The binding of
EGF results in the activation and phosphorylation of EGFR on
its tryrosine residues and leads to the activation of downstream
kinases, such as Ras or STAT3. Once triggered, the signal is
amplified and results in the activation of various transcription
factors. This event causes a many cellular responses including
cell transformation, cell proliferation, metastasis and
angiogenesis. Some flavonoid compound targets the Raf1 and
MEK1 signaling pathway such as quercetin and myricetin.
However, it has not been reported to inhibite the colon cancer
cells ………………......................................................................
12
14
17
2.6 Morphology of HCT116 cell line at low and high density. Phase-
contrast micrographs depict the individual cell cultures 24 and
72 hr after trypsinization and seeding. Scale bar, 100 µm…….
18
2.7
3.1
3.2
3.3
Example of an anti-cancer drug that obtained from plants including
vinblastine, vincristine, ellipticine and taxol.………………..….
Conceptual framework of this research……………………………….
TLC plate showing distances traveled by the spot and the solvent
after solvent front nearly reached the top of the adsorbent……..
Chemical structures of kaempferol(1), isoquercetin(2) and astragalin(3)
19
28
30
30

xi
Figure
3.4
3.5
4.1
4.2
Preparation of pooled fractions from M. oleifera leaves extract
through column chromatography………………………………..
Morphology of HCT116 and NHF cell lines. Phase-contrast
micrographs depict the individual cell cultures 24 h after
trypsinization and seeding. Scale bar, 100 µm.…………………
Chromatograms of the fractionation from M. oleifera leaves extracts.
Fractions were collected using 70% EtOH as an eluent. A
whole leaf extract at the weight of 1 g was applied onto the
column packed with Sephadex LH-20. Collected fractions were
measured at OD 260 nm, giving a yield of seven groups, 1-
7………………………................................................................
The separation of grouped fractions and STD compounds on the
silica plates under UV irradiation at (a) 254 nm and (b) 365 nm
using chloroform: hexane (70: 30) as a mobile phases. The
fraction f1 - f7 represents in the spot 1-7. The STD compounds,
astragalin, isoquercetin and kaempferol, represents in the spot
8-10. …………………………………………………………….
Page
30
31
35
36
4.3 The separation of grouped fractions (f1-f7), and STD compounds on
the silica plates using chloroform: hexane (70: 30) as a mobile
phases after spraying with 50% H2SO4 and heating at 95 °C.
The fraction f1 - f7 represents in the spot 1-7. The STD
compounds, astragalin, isoquercetin and kaempferol, represents
in the spot 8-10………………………………………………….
37
4.4
Effects of each pooled fraction (MOL1-MOL4) on the growth of
HCT116 cells using WST-1 assay. Cells were treated with
indicated concentration of each pooled fraction. Cells were
continuous exposed to the pooled fractions (a) MOL1 or (b)
MOL2-MOL4 at 24 h. Each value is the mean ± SD of triplicate
of cultures. *P<0.05, significantly different from the negative
control as treatment with 0.5% of DMSO..…………………….
40

xii
Figure
4.5
4.6
Effects of each pooled fraction (MOL1-MOL4) on the growth of
HCT116 cells using WST-1 assay. Cells were treated with
indicated concentration of each pooled fraction. Cells were
continuous exposed to the pooled fractions (a) MOL1 or (b)
MOL2-MOL4 at 48 h. Each value is the mean ± SD of triplicate
of cultures. *P<0.05, significantly different from the negative
control as treatment with 0.5% of DMSO. ……………………
Effects of STD compounds on the growth of HCT116 cells using
MTT assay. Cells were exposed to the STD compounds,
kaempferol (a), astragalin (b) and isoquercetin (c) at 24 or 48 h.
Each value is the mean ± SD of triplicate of cultures. *P<0.05,
significantly different from the negative control as treatment
with 0.5% of DMSO. ………………….……………………….
Page
41
42
4.7 Effects of each pooled fraction (MOL1-MOL4) on the growth of
NHF cells using WST-1 assay. Cells were treated with indicated
concentration of each pooled fraction. Cells were continuous exposed
to the pooled fractions MOL1-MOL4 at 24 h (a) or 48 h (b). Each
value is the mean ± SD of triplicate of cultures. *P<0.05,
significantly different from the negative control as treatment with
0.5% of DMSO. ………………………….……………………….…
44
4.8 Effect of treatment with each pooled fraction, (a) isoquercetin, (b)
MOL1, MOL2, (c) MOL3 and MOL4 for 24 and 48 h on
phospho-ERK expression in HCT116 cells, using western bolt.
Tubulin was used as loading control. Cisplatin 100 ug/ml was
used as control..…………………………………………………
48
A.1 IC40 data of MOL1 in HCT116 cells at 24 h………………………….. 71
A.2 IC40 data of MOL2 in HCT116 cells at 24 h………………………….. 72
A.3
A.4
A.5
IC40 data of MOL3 in HCT116 cells at 24 h ………………………….
IC40 data of MOL4 in HCT116 cells at 24 h ………………………….
IC40 data of MOL2 in NHF cells at 24 h………………………………
72
73
73

xiii
Figure
A.6
A.7
A.8
A.9
A.10
A.11
A.12
A.13
A.14
A.15
A.16
A.17
A.18
A.19
IC40 data of MOL3 in NHF cells at 24 h……………………………..
IC40 data of MOL4 in NHF cells at 24 h……………………………..
IC40 data of MOL1 in HCT116 cells at 48 h…………………………
IC40 data of MOL2 in HCT116 cells at 48 h…………………………
IC40 data of MOL3 in HCT116 cells at 48 h…………………………
IC40 data of MOL4 in HCT116 cells at 48 h…………………………
IC40 data of MOL2 in NHF cells at 48 h……………………………..
IC40 data of MOL3 in NHF cells at 48 h………………………………
IC40 data of MOL4 in NHF cells at 48 h………………………………
IC40 data of kaempferol in HCT116 cells at 24 h…………………..…
IC40 data of isoquercetin in HCT116 cells at 24 h…………………….
IC40 data of kaempferol in HCT116 cells at 48 h…………………..….
IC40 data of isoquercetin in HCT116 cells at 48 h……………………
Standard curve of BSA………………………………………………..
Page
74
74
75
75
76
76
77
77
78
78
79
79
80
80
xiv
LIST OF ABBREVIATIONS
® Registered trademark
% w/v Percent weight by volume
% v/v Percent volume by volume oC Degree celsius
φ Diameter
µg Microgram
µL Microliter
µm Micrometer
Abs Absorbance
Akt Protein kinase B
Avg Average
BSA Bovine serum albumin
CC Column chromatography
cm Centimetre
cm2 Square centimetre
DMSO Dimethyl sulfoxide
e.g. exempli gratia (Latin); for example
Eq Equation
ERK1/2 Extracellular signal-regulated kinases 1 and 2
et al. And others
etc. et cetera (Latin); and other things/ and so forth
EtOH Ethanol
FBS Fetal bovine serum
g Gram
h Hour
H-NMR Proton nuclear magnetic resonance
HCl Hydrochloride
H2SO4 Sulfuric acid

xv
IC40 Inhibition concentration at 40% cell viability
i.e. id est (Latin); that is
i.d. Diameter
kV Kilovolt
MAPK Mitogen-activated protein kinase
MEK MAPK/ERK kinase
MeOH Methanol
mg Milligram
min Minute
mL Milliliter
MTT
3-(4,5-dimethylthiazol-2-yl)-2,5-diphenyltetrazolium
bromide
MW Molecular weight
nm Nanometer
MOL
OH
Pooled fractions of M. oleifera leaves
Hydroxide
PAGE Polyacrylamide gel electrophoresis
PBS Phosphate buffer saline
pH Potentia hydrogenii (latin); power of hydrogen
p-values Probability values
PVDF Polyvinylidene difluoride
p38 MAPK p38 Mitogen-activated protein kinases
rpm Round per minute
SD Standard deviation
SDS Sodium dodecyl sulfate
STD Standard
TBS-T Tris buffer saline with 0.1% tween20
TLC Thin layer chromatography
UV-Vis Ultraviolet and Visible Spectrophotometry
WB Western Blot

1
CHAPTER 1
INTRODUCTION
1.1 Statement and significance of the research problem
Cancer is a leading cause of death, with 8.2 million deaths in 2012 [1-2]. In fact,
the phytochemical constituents present in plant-based foods and medicinal plants are
mainly responsible for their anti-cancer effects [3]. Since natural compounds are
obtained from diverse sources, many anti-cancer drugs are discovered as a successful
story of current drugs, such as ellipticine, paclitaxel, vincristine, and vinblastine [4-5].
Moringa oleifera Lam. (M. oleifera), a short, slender and perennial plant,
belongs to the Moringaceae family and is widely cultivated in different locations of
Southeast Asia, including India, Sri Lanka, Malaysia, and Philippines, and also in
Africa, tropical America, and Mexico [6]. M. oleifera is an edible plant and used for
traditional medicine formulation. Over the past two decades, many studies have
examined the nutritional and medicinal properties of M. oleifera [7-8]. For example,
M. oleifera leaves showed anti-bacterial effects [9], anti-fungal activities [10], and
other medicinal activities. The extracts from roots and leaves of M. oleifera showed
inhibition of proliferative of epithelial ovarian cancer cells [11] and human epidermal
carcinoma KB cells [12]. Much attention has been paid to phytochemicals that are
contained in M. oleifera leaves. Some bioactive phytochemicals found in M. oleifera
leaves are identified as quercetin, chlorogenic acid, astragalin, and kaempferol. Their
contents are shown to vary with geography, seasons, and also the methods for
collection of leaves and extraction [13-15, 17].
From our preliminary studies, crude methanol extracts from M. oleifera leaves
showed anti-proliferative activities against human HCT116 colon cancer cells. In this
study, M. oleifera leaves extracts were fractionated by gel filtration chromatography
on Sephadex LH-20 and the fractionated extracts were examined for cytotoxicity
activity in HCT116 cells. Furthermore, the effect on cell viability of fractionated
extracts was conducted in a comparison to flavonoids; kaempferol, astragalin,

2
isoquercetin. Kaempferol is a major flavonoid found in M. oleifera leaves and it
induces apoptosis in HCT116 cells [20]. While astragalin and isoquercetin are
flavonol glycosides also found in M. oleifera leaves and have been reported for anti-
proliferative activity [15, 16]. The result showed that the treatment of HCT116 cells
with each pooled fraction (MOL1, MOL2, MOL3 or MOL4) as well as kaempferol
and isoquercetin inhibit cell proliferation in a dose-dependent manner whereas
astragalin did not inhibit cell proliferation. Recently, it was found that M. oleifera
leaves extract has a strong relation to Mitogen-activated protein kinase (MAPK) gene
that regulates many cellular functions including cell proliferation, differentiation,
migration, and apoptosis [18-19]. Therefore, it is of interest to evaluate especially
Extracellular signal-related kinase (ERK), a member of MAPK family, pathway for
anti-cancer activity of M. oleifera leaves extract comparing with the antiproliferative
flavonol glycoside “isoquercetin” found in our M. oleifera leaves extracts.
1.2 Objective of this research
1. To prepare the fractionated of M. oleifera leaves extracts through column
chromatography method on Sephadex LH-20.
2. To examine the effects of the fractionated M. oleifera leaves extracts on colon
cancer cells viability.
3. To study underlying mechanisms of anti-colon cancer effect of active
fractionated M. oleifera leaves extracts.
1.3 The research of hypothesis
1. Drumstick (M. oleifera) leaves extract have phytochemicals with colon tumor
suppressing ability.
2. Affecting of some molecular signalings of active fractionated extract on colon
cancer should be clarified.
3
CHAPTER 2
LITERATURE REVIEWS
2.1 Moringa oleifera Lam.
2.1.1 General informations
2.1.2 Pharmacological effects
2.1.3 Phytochemical components from leaves
2.2 Cancer
2.2.1 Colorectal cancer
2.2.1.1 Intracellular mechanism
2.2.1.2 Human colorectal carcinoma cells (HCT116 cells)
2.2.2 Plant-derived drug
2.2.3 Phytochemicals from plants

4
2.1 Moringa oleifera Lam.
2.1.1 General informations
M. oleifera is a member of Moringaceae that grows 10-15 meters high. It is
a small native tree of the sub-Himalayan regions of North West India and now widely
cultivated in tropical and subtropical regions. There are different common names of
this tree i.e. Ma-rum (Thailand), Drumstick (India, Nepal, Sri Lanka), Horseradish
tree (USA, Indonesia, Malaysia) [21]. It can grow rapidly. The plant has tripinnate
leaves, white petals’s flowers, pods 15-30 cm length and seeds. M. oleifera is an
important food commodity which has caught enormous attention as the natural
nutrition of the tropical countries such as India, Indonesia, Pakistan, Philippines,
Hawaii, Africa, Bangladesh, Afghanistan and Thailand [6, 22]. In nutritional and
medicinal view, almost every part of the plant has value for food such as leaves,
fruits, flower and immature pods.
Figure 2.1 Moringa oleifera Lam., a typical Moringaceae. The M. oleifera tree parts;
(a) flowers, (b) leaves and (c) pods.
2.1.2 Pharmacological effects
M. oleifera is used as a traditional medicinal drug in many countries (Table
2.1). Almost all parts of this plant are considered to possess medicinal properties
including roots, roots bark, bark, gum, twigs, leaves, flowers, pods and seeds [21].
(a) (b) (c)

5
Table 2.1 Common traditional medicinal uses from various parts of M. oleifera
Part of plant Route Traditional uses Country
1. Root
2. Root bark
3. Bark
4.Twigs
5. Gum
6. Flowers
7. Pod
8. Seeds
Orally
Orally
Orally
Orally
Orally
Orally
Orally
Orally
Abortifacient
Amenorrhea
Relieve fever
Analgesic, hypotensive,
sedative, arthritis
Cardiotonic, antipyretic,
stimulant for fainting
Diuretic, Menstrual promoter
Menstrual promoter
Abortifacient
Purgative, vermifuge,
antispasmodic
Malaria
Abortifacient
Aphrodisiac
Cough remedy
Diabetes, ascites, edema, spleen
enlargement, inflammatory
swelling, abdominal tumors,
colic, dyspepsia, fever, ulcers,
paralysis, lumbago, skin diseases
Treat fevers, tonic
Cough remedy
East Africa, Nepal
Malaysia
Nepal
Nigeria
Thailand
East and West Indies
Malaysia
East Africa, Nepal
Mauritius
Togo
New Caledonia
Nepal
West Indies
Saudi Arabia
Guam
West Indies

6
Table 2.1 Common traditional medicinal uses from various parts of M. oleifera (cont.)
Part of plant Route Traditional uses Country
9. Leaves
Externally
Ointment
Rub over
the breast
Orally
Headach
Sore eyes
Reduce milk flow
Induce vomiting (useful in
poisoning)
Nervous shock
Galactogogue
Malaria
Diuretic
Syphilitic ulcers
Fiji
Fiji
New Caledonia
Fiji
Haiti
Philippines
Togo
USA
West Indies
Source: Ross, I.A. (2003). “Moringa pterygosperma Gaertn.” Midicinal Plants of
The World , volume1, 2nd Edition: 368–370.
Nowadays, many studies have shown the biological acitvities of each part of
this plant including;
Anti-cancer. Pod exerts suppressive effects in a colitis-related colon carcinogenesis
model induced by azosymethan/dextran sodium sulfate in male mice [23]. Isolated
compound of seeds, niazimicin, possess to be a potent chemo-preventive agent. This
study shows that niazimicin exhibited 50% delay in the promotion of tumors and
decreased the incidence of papilloma bearing mice [24]. It has been reported that the
leaf extract had potent antiproliferative activity and apoptosis inducing capacity on
human epidermal carcinoma (KB) cells and epithelial ovarian cancer cells [11-12],
and it also increased the cytotoxicity of chemotherapy on pancreatic cancer cells
(Panc-1) [46]. In cancerous human lung cells (A549), Tiloke et al. (2013) reported
that leaf extract induced apoptosis and increased oxidative stress [47]. In another
study by Purwal et al. (2010), tumorous mice were treated with methanol extract of
leaves at concentration of 1 g/kg body weight of mice. The result showed that

7
methanol extract of leaves were effective in delaying the tumor growth and increased
the survival time of mice [48].
Anti-diabetic and anti-hyperglycemic. The ethanolic leaves extract were
administered orally to deabetic rats for two weeks. At doses of 250 and 500 mg/kg of
extract significantly lowered the fasting blood glucose levels and improved insulin
sensitivity and beta-cell function in diabetic rats [28]. The study by Tende et al.
(2011) reported that the hypoglycemic and anti-hyperglycemic activity of the leaves
may be probably due to the presence of terpenoids, which appeared to be involved in
the stimulation of the β-cells and the subsequent secretion of prefored insulin [29].
Soliman (2013) also found that the ethanolic leaves extract was capable of reducing
hyperglycemia in streptozocin diabetic male rats [30].
Anti-inflammation. Isolated compounds of pods were investigated with the
lipopolysaccharide (LPS)-induced murine macrophage RAW 264.7 cells. In this
finding, 4-[(2'-O-acetyl-α-L-rhamnosyloxy)benzyl]isothiocyanate possessed potent
NO-inhibitory activity at IC50 of 1.67 µM [31].
Anti-microbial. In vitro study, leaves were reported to possess antimicrobial potential
both as bacterial [9] and fungal [10]. The seed flour extracts showed the antibacterial
activity against four bacteria, B. cereus, S. aureus, E. coli and Y. enterocolitica, in the
study of Govardhan Singh et al [34].
Anti-oxidant. The flowers and leaves hydroethanolic extracts showed a significant
reduction in the severity of the liver damage by oxidative stress in rat [32]. Moreover,
the extracts of M. oleifera both mature and tender leaves have a potent antioxidant
activity against free radicals, prevent oxidative damage to major biomolecules and
afford significant protection against oxidative damage [49]. The seed flour extracts
showed the presence of polyphenols, gallic acid, vanilin, catechin, caffeic acid,
epicatechin, p-coumaric acid, ferulic acid, protocatechuic acid, quercetin, cinnamic
acid, and exhibited an effective antioxidant activity [34]
Anti-ulcerogenic. According to Verma et al. (2012), the effect of 50% ethanolic leaf
extract of M. oleifera on pylorus ligation-induced, ethanol-induced, cold-restraint,
stress-induce and aspirin-induced gastric ulcers were investigated. The results of all
these assays represented the reduced total ulcerogenic effect, by showing a dose-
dependent anti-ulcerogenic activity reduction by the 50% ethanolic leaf extract. The

8
extract was found to decrease acid-pepsin secretion as well as exhibited ulcer
protective properties [33].
2.1.3 Phytochemical components from leaves
Phytomedicines are believed to have benefits over conventional drugs and
are regaining interest in current research. Recently, the edible plant and medicinal
plant has become a popular study which has been linked to a-wide range of in vitro
activities [12]. Several isolated compounds were reported for M. oleifera leaves
(Table 2.2).
Table 2.2 Some chemical constituents of the isolated molecules from M. oleifera
leaves. Chemical compound Reference Glucosinolate: 4-(α-L-rhamno-pyranosyloxy)-benzylglucosinolate
4-(α-L-rhamno-pyranosyloxy)-benzylglucosinolate monoacetyl
31 31
Flavonoids: Kaempferol 3-O-glucoside (astragalin) Kaempferol 3-O-(6''-malonyl-glucoside) 3-Methoxy quercetin Quercetin 3-O-glucoside (isoquercetin) Quercetin 3-O-(6''-malonyl-glucoside) Quercetin 3-O-rhamnosylglucoside (Rutin)
31 31 21 31 31 31
Phenolic acid: Chlorogenic acids (3-caffeoylquinic, 5-caffeoylquinic)
31
Nitriles: Niazicin B Niazimicin Niaziminin A and B Niazinin A and B Niazirin Niazirinin Niaziridin
21 23, 24 21 23, 24 23, 24 21 32
Carbamate: O-methyl 4-[(2’,3’,4’-tri-O-acetyl-α-L-rhamnosyloxy)benzyl]carbamate
O-ethyl 4-[(2’,3’,4’-tri-O-acetyl-α-L-rhamnosyloxy)benzyl]carbamate
O-methyl 4-[(4’-tri-O-acetyl-α-L-rhamnosyloxy)benzyl]carbamate
23 23 23

9
Table 2.2 Some chemical constituents of the isolated molecules from M. oleifera
leaves (continued).
Chemical compound Reference
Thiocarbamate:
O-methyl 4-[(2’,3’,4’-tri-O-acetyl-α-L-rhamnosyloxy)benzyl]thiocarba-
mate
O-ethyl 4-[(α-L-rhamnosyloxy)benzyl]thiocarbamate
23
23
Miscellaneous:
Alpha-tocopherol
Amylase
Ascobic acid
Aurantiamide acetate
Beta carotene
Choline
Gossypitin
Moringinine (benzylamine)
Nicotinic acid
Oxalic acid
Protein
Quercetagetin
Starch
Vitamin A, B-1 and B-2
21
21
21
35
21
21
21
35
21
21
21
21
21
21

10
Figure 2.2 Structural of major phytochemicals found M.oleifera leaves.
Source: Mbikay, M. (2012). "Therapeutic potential of Moringa oleifera leaves in
chronic hyperglycemia and dyslipidemia: a review." Frontiers in
Pharmacology 3, 1-12.
2.2 Cancer
Cancer or malignant tumor originates from abnormal growth of cells in the body.
The proliferation of cells is uncontrolable and becomes to abnormal large size (except
the leukemia) or tumors. In case of invasion and metastasis of cancer cells, the cancer
cells usually destroy normal cells or other healthy tissues and lead to death [21].
Cancers have unique molecular characteristics that make their cells different from
normal cells. The molecular characteristics of cancers can be classified into two
phenotypes: the overexpression of oncogenes and the down-regulation of tumor
suppressor genes [36]. Cancer is one of the leading causes of death worldwide after
cardiovascular and infectious diseases. The cancer incidence is varied in different
regions of the world and its trend increases every year. The highest incidence rates are
reported in North America, Australia, New Zealand, Europe, and Japan. Additionally,
the cancer incidence in male patient is higher than that in female patient [22]. Because
the human population is continually growing and aging, the incidence of cancer is

11
becoming even more common. Moreover, environmental factors, which are the major
causes of cancer, are likely to contribute to increased cancer mortality in the future
because people are becoming more subjected to tobacco, poor diet, obesity, infection,
radiation, and environmental pollutants [37].
The treatments of cancer are conventional and novel therapy. Conventional
therapies are surgery, radiotherapy and chemotherapy. Novel therapies are the
biological therapies and more specific to tumor types or target tumor including:
monoclonal antibodies, vaccines, gene therapy and small molecule signaling
inhibitors. The kind of surgery varies depending on the type of cancer and the
patients' physical fitness. This therapy is not generally an appropriate modality in
some cancer, for example the lymphomas, leukaemias and small cell lung cancer [24].
In chemotherapy, drugs are designed to arrest the cell cycle of cancerous cells.
However, their mode of action involves targeting rapidly dividing cells, hence they
are known to cause severe side effects to rapidly dividing normal cells in the body
such as; bone marrow cells, immune cells and hair follicle cells that portray similar
characteristices [21]. Radiation as well as conventional cancer treatment, this therapy
works by damaging the deoxyribonucleic acid (DNA) of the cancerous cells, but this
may also damage the DNA of normal cells leading to adverse side effects [25].
Therefore, due to less toxicity and adverse effects of phytochemicals constituents
present in medicinal plants, the research on medicinal plants and cancer has been
intensified [26].
2.2.1 Colorectal cancer
Colorectal cancer, which may arise anywhere along the length of the colon
or rectum, frequently begin as polyps that are benign outgrowths emerging from the
epithelial lining of the colon or rectum. The colorectal cancer is the third most
common worldwide cancer incidence and is the top five most common form of
malignancy in both Thai’s men and women [1, 4, 23]. The risk of developing this
cancer is affected by age, with rates increasing dramatically after 50 years of age.
High saturated animal fat and calories are also likely risk factors. And diets low in
vegetables or fruits are linked to increased risk, especially smoking and alcohol
consumption.

12
Figure 2.3 Each part of long colon (intestine) and rectal can produce cancer. (Adapted from http://www.mayoclinic.org/diseases-conditions/colon-cancer/home/ovc-20188216)
2.2.1.1 Intracellular mechanism and some molecular targets
All cells in the human body are covered by lipid bilayer membranes. The
basic structure of cell membrane consists of lipid bilayer, protein and glycocalyx
carbohydrate. Moreover, the membrane structure is composed of the functional
domains, called lipid rafts or microdomain. Size of lipid rafts is in the range of 70 to
370 nm [38]. Lipid rafts are evidenced to be essential for many processes such as
signal transduction trafficking and adhesion in cells. They contain high content of
cholesterol and glycosphingolipid. Because of their tight packing of lipids, lipid rafts
are insoluble in nonionic detergents. Many proteins apportion into lipid rafts; for
instance, glycosylphosphatidylinositol (GPI)-anchored protein, calveolae,
transmembrane proteins and membrane proteins associated with cell signaling [38].
These proteins can change their size and composition in response to intra- or
extracellular stimuli. In spite of a small alteration of protein partitioning into lipid
rafts, it can cause signaling cascades [39].
The different observations of colorectal cancer lipid rafts can be generally
categorized under the following main topics of investigation: cell death-mediated
mechanisms, caveolae in cancer cell growth and function, unique structrue-function
molecular associations, and intervention studies with bioactive compounds [39].

13
The Figure 2.4, the lipid bilayer of the cell membrane is depicted in light
blue, membrane microdomains or lipid rafts in light purple, and the pear-shaped
caveolae associated with these rafts in dark purple. MRP is Multidrug-resistance
protein, GlcCer is Glucosyl-ceramide, FADD is Fas-associated protein with death
domain, TRADD is Tumor necrosis factor receptor type 1-associated DEATH domain
protein, PI3K is Phosphoinositide 3-kinase, Akt is Serine/threonine protein kinase,
ERK is Extracellular signal-regulated kinase, MAPK is Mitogen-activated protein
kinase, IRS1 is Insulin receptor substrate1, ASK1 is Apoptosis signal-regulating
kinase1, SHC is Src homology 2 domain, TNF-α is Tumor necrosis factor-α , IGF-I is
Insulin-like growth factor-I, VDR is Vitamin D receptor, Vit D is Vitamin D, RAF is
Proto-oncogene serine/threonine-protein kinase, RAS is RAt sarcoma, TfR2 is the
second transferrin receptor, Tf is Transferrin, JNKs is c-Jun N terminal kinases,
ICAM-I is Intercellular adhesion molecule I, IFN-γ is Interferon-γ, MHC-I is major
histocompatibility complex I, FAK is Focal adhesion kinase, ECM is Extracellular
matrix, FASE is Fatty acid synthase, SCD-1 is Stearoyl-coenzyme A desaturase 1,
ACC1 is Acetyl-CoA carboxylase and Cav is Caveolin.
Most of human colon adenocarcinoma cell lines, lipid rafts divide pro-
apototic from anti-apoptotic insulin-like growth factor I (IGF-I) receptor signaling
when exposed to tumor necrosis factor-α (TNF-α). In fugure 2.4, the paradoxical pro-
apoptotic action of IGF-1 is transported through the PI3K/Akt pathway and that
integrity of lipid rafts is important for suitable anti-apoptotic cell signaling. On the
other hand, the activation of the ERK1/2 and p38 MAPK pathway that convey the
IGF-I anti-apoptotic signaling is independent of lipid rafts [39].

Figure 2.4 Intracellular signaling pathways in colorectal cancer. Source: Jahn,K. A., Su, Y. and Braet, F. (2011). “Multifaceted nature of membrane microdomains in colorectal cancer.”
World Journal of Gastroenterology 17, 6 (February): 681–690. 14

15
The example of bioactive compounds from food and natural product that
can induce cell death in colorectal cancer cells are resveratrol and quercetin.
Resveratrol belongs to a class of polyphenolic compounds. It was reported to induce
apoptosis in SW480 cells via caspase-8/caspase-3-mediated apoptosis cascade.
Furthermore, resveratrol reveals induced cell death receptor Fas within lipid rafts on
cell surface and caused formation of the death-inducing signaling complex. Quercetin
belongs to a class of flavonoid compounds. It was reported to induce apoptosis in
SW480 and HT-29 cells. Quercetin exposure enhanced apoptosis caused by TNF-
related apoptosis-inducing ligand (TRIAL) via the death receptors (DR) 4 and 5
within lipid rafts on cell membrane [39].
Cisplatin is a strong chemotherapeutic agent and widely used for
treatment of various cancers. It belongs to a class of alkylating agent. It induces
apoptosis in human colon adenocarcinoma cells through the inhibition of the Na+/H+
membrane exchanger-1 and leads to an overall intracellular acidification. It also
caused membrane fluidity. Membrane stabilization by cholesterol excess or
monosialoganglioside-1 treatment can be counteracted by cisplatin treatment.
Additionally, cisplatin, lipid-interfering compound, prevent the aggregation of the Fas
receptor on the cell surface of HT-29 cells. Therefore, the action of cisplatin is
through the Fas-signaling pathway [39].
The overexpression of cell signaling receptors is one of the common
oncogenic alterations in cancer. When the receptors are overexpressed; the
downstream signaling pathways are hyperactivated, and tumors are generated with
unlimited proliferation potential and an unstable genotype [36].
Extracellular signal-regulated kinase (ERK) is one of members of
Mitogen-activated protein kinase (MAPK) family. Extracellular signal-regulated
kinases (ERK1 and ERK2) are activated and play a critical role in transmitting signals
initiated by EGF, UV, TPA and platelet-derived growth factor (PDGF). The mojority
of tumor phenotypes is linked to the deregulation of the ERK pathway [40].
The Figure 2.5, AP-1 is activator protein 1, ATF-1 is Cyclic AMP-
dependent transcription factor, EGFR is epidermal growth factor receptor, IκB is
inhibitor kappaB, IKK is IκB kinase, MEK is mitogen-activated protein-ERK kinase,
MEKK1 is MEK kinase 1, MKK is mitogen-activated protein kinase kinase, MMP is

16
matrix metallopeptidase, MSK is mitogen- and stress-activated protein kinase, NFAT
is Nuclear factor of activated T-cells, NIK is NF-κB-inducing kinase, RSK is
ribosomal s6 kinase, S6K is s6 kinase, SFK is Src family kinase, STAT3 is signal
transducer and activator of transcription 3 and VEGF is vascular endothelial growth
factor.
Generally, cancer cells are initiated by many stimuli outside the cells.
When cells are stimulated and EGFR are activated (figure 2.5). The cascades are
started. The activated signals lead to stimulate the transcription factors of many genes
such as cyclin D1, MMP and VEGF. The expression of those genes results in the
imbalance of cell cycle control. Therefore, the abnormal cells can be arise [40].

17
Figure 2.5 General scheme of signaling cascades in cancer cells. The binding of EGF
results in the activation and phosphorylation of EGFR on its tryrosine residues and leads to the activation of downstream kinases, such as Ras or STAT3. Once triggered, the signal is amplified and results in the activation of various transcription factors. This event causes a many cellular responses including cell transformation, cell proliferation, metastasis and angiogenesis [40]. Some flavonoid compound targets the Raf1 and MEK1 signaling pathway such as quercetin and myricetin. However, it has not been reported to inhibite the colon cancer cells [41].
Source: Kang, N.J. et al. (2011). "Polyphenols as small molecular inhibitors of signaling cascades in carcinogenesis." Pharmacology & Therapeutic 130: 310-324.

18
2.2.1.2 Human colorectal carcinoma cells (HCT116 cells)
The human colorectal carcinoma cells (HCT116 cells) originated from
colon ascendens organ of 48-year old male colorectal carcinoma patient [52]. This
cell type is an epithelial cell. HCT116 cells are positive for transforming growth
factor β1 and β2 (TGF β1 and β2) expression. This cell line has a mutation in colon
13 of the ras proto-oncogene and can be used as a positive control for PCR assay of
mutation in this colon [43]. HCT116 line is a type of colorectal cancer cells because
the mutant ras has been identified in colorectal cancer around 50% [44]
Figure 2.6 Morphology of HCT116 cell line at low and high density. Phase-contrast
micrographs depict the individual cell cultures 24 and 72 hr after
trypsinization and seeding. Scale bar, 100 µm.
Source: ATCC, American Type Culture Collection: All Products (CCL-247TM).
<www.atcc.org/Products/All/CCL-247.aspx> (Retrieved 2016-03-03).
2.2.2 Plant-derived drug
There are many reasons for the increased use of natural products. Plants are
natural source of anticancer drugs. Several of the drugs obtained from plants act as
topoisomerase inhibitors; included in this category are etoposide and teniposide,
derived from a substance present in the mayapple plant [42], and topotecan and

19
irinotecan, derived from a substance present in the bark of the Chinese camptotheca
tree. And also the tetracyclic ellipticine comes from Ochrosia elliptica plant and acts
as an inhibition of DNA topoisomerase II. Another group of plant-derived drugs
attack the microtubules that make up the mitotic spindle. This class of drugs includes
vinblastine and vincristine, obtained from the Madagascar periwinkle and Taxol
(Paclitaxel), discovered in the bark of the Taxus brevifolia tree. Vinblastine and
vincristine block the process of microtubule assembly, whereas Taxol stabilizes
microtubules and promotes the formation of abnormal microtubule bundles. In either
case, the mitotic spindle is disrupted and cells can not divide [4, 5].
Figure 2.7 Example of an anti-cancer drug that obtained from plants including
vinblastine, vincristine, ellipticine and taxol.
2.2.3 Phytochemicals from plants
Phytochemicals are the bioactive nonnutrient plant compounds.
Phytochemicals are believed to have health benefits and still remain interested.
Recently, the edible plant and medicinal plant continue being a popular study which
exhibits a wide range of properties with potential relevance for fighting cancer.
Studies to date have demonstrated that phytochemicals in common fruit and
vegetables can have complementary and overlapping mechanisms of action, including
scavenging of oxidative agents, hormone metabolism, stimulation of the immune

20
system and regulation of gene expression in cell proliferation and apoptosis [20, 40,
45-48, 50-51].
Apigenin presents in parsley, celery and other vegetables. It induces
apoptosis in human colon cancer cells and increases melanogenesis in B16 cells by
activating the p38 MAPK pathway at least partially and suggests that apigenis or its
derivatives may potentially be used for treating hypopigmentation disorders [45].
Crocetin comes from flower of saffron. It affects the growth of cancer cells
by inhibiting nucleic acid synthesis, enhancing anti-oxidative system, inducing
apoptosis and hindering growth factor signaling pathways. [45].
Curcumin, a mojor curcumanoid in the spice turmetic, is a potent inhibitior
of NF-κB. It was also demonstrated that curcumin down-modulates Syk activity
accompanied by down-regulation of Akt activation [40].
Cyanidin inhibit carcinogenesis by blocking of NF-κB and AP-1 from the
MAPK pathway [40]. Cyanidin is able to reduce the proliferation of human colon
cancer cells and intestinal tumor development in apc mice. Cyanidin initiated a dose-
dependent apoptosis in human leukemia Molt 4B cells characterized by DNA
fragmentation and this might be due to production of free oxygen, which induces
intracellular oxidative stress [46].
Epigallocatechin gallate (EGCG) is a major component of green tea. EGCG
can have pro-oxidant effect generating H2O2 in a time- and dose-dependent manner
when added to cell culture media consequently provoking stressful and/or cytotoxic
effects. The apoptosis induced in human oral squamous carcinoma cells by EGCG
was attributed to the generation of H2O2 in the cell culture medium [47].
Fisetin is found in various sources, for example strawberries and apple.
Fisetin pretreatment enhanced the radiosensitivity of p53-mutant HT-29 human
colorectal cancer cells. Fisetin treatment also prolonged radiation-induced G2/M arrest
in HT-29 cells [40].
Kaempferol is a flavonoid that can be found in grapefruit and other edible
plants. Studies on kaempferol are few but differ as to antiproliferative activity based
on concentration. It was reported to induce apoptosis in colon cancer cells [20].
Kaempferol induces autophagy through AMPK and Akt signaling molecules and

21
causes G2/M arrest via downregulation of CDK1/cyclinB in hepatic cancer cells (SK-
HEP-1) [48]. In contrast, it has low toxicity against normal cells [50].
Lycopene is a red pigment and demonstrates antioxidant activity and effect
on breast, endometrial, prostate and colon cancer cells. It was also found to suppress
insulin-like growth factor-I-stimulated growth [45].
Resveratrol has shown antitumor initiation activities such as inhibition of
free radical formation in HL-60 cells treated with 12-O-tetradecanoylphorbol-13-
acetate. The anti-initiation activity of resveratrol might be related to its antioxidant
and antimutagenic effects. The antitumor effect of resveratrol also correlates with its
ability to reduce tumor neovascularization of angiogenesis [46].
Rosmarinic acid is a natural antioxidant found in medicinal herbs such as
rosemary. The extracts of rosemary play important roles in anti-inflammation anti-
proliferation and anti-tumor. It has been found that rosmarinic acid inhibits migration,
adhesion and invasion in Ls174-T human colon cancer cells [45].
Cancer reduction by polyphenolic-rich foods may be mediated by an
indirect antioxidant function by 1) inhibiting redox-sensitive transcription factors such
as NF-κB and AP-1 2) inhibiting pro-oxidant enzymes such as inducible nitric oxide
synthase, lipoxygenases, cyclooxygenases and xanthine oxidase or 3) inducing phase
II and antioxidant enzymes such as glutatione S-transferases and superoxide
dismutases [51].
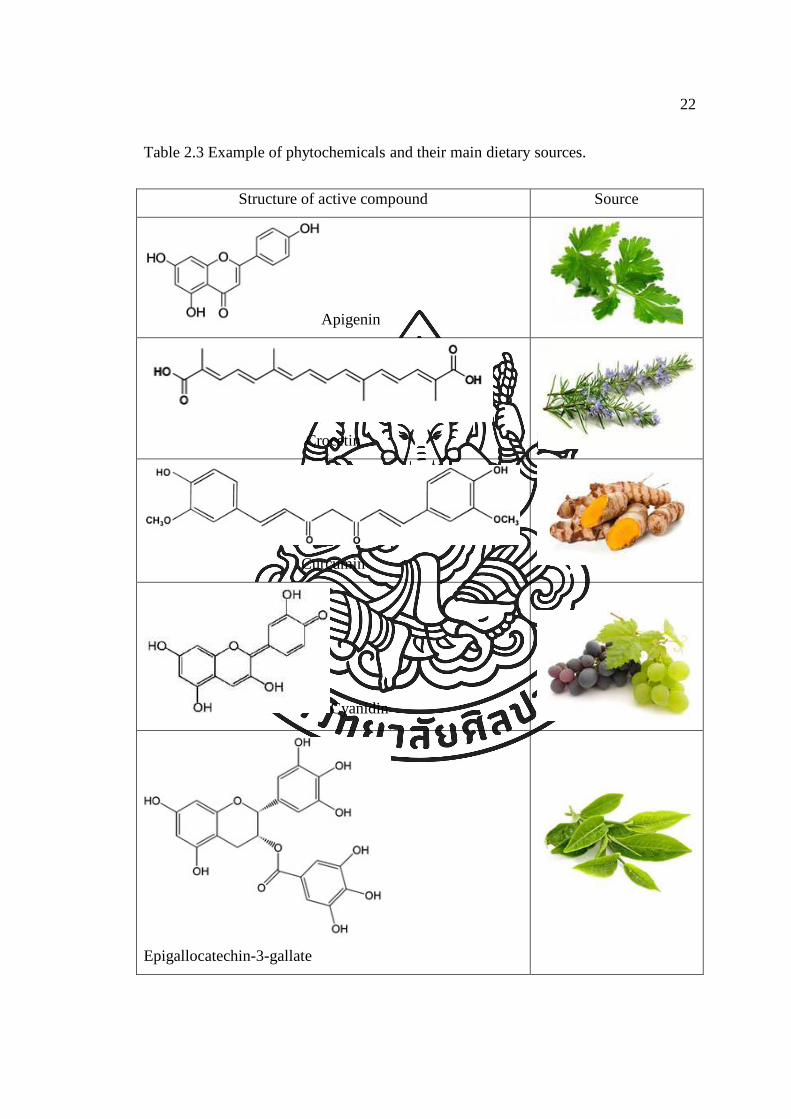
22
Table 2.3 Example of phytochemicals and their main dietary sources.
Structure of active compound Source
Apigenin
Crocetin
Curcumin
Cyanidin
Epigallocatechin-3-gallate

23
Table 2.3 Example of phytochemicals and their main dietary sources (continued).
Structure of active compound Source
Fisetin
Kaempferol
Lycopene
Resveratrol
Rosmarinic acid

24
CHAPTER 3
MATERIALS AND METHODS
3.1 Materials
3.2 Equipments
3.3 Methods
3.3.1 Plant material collection and extraction
3.3.2 Fractionation of M. oleifera leaves extract
3.3.2.1 Fractionation on Sephadex LH-20 chromatography
3.3.1.2 Detection of fractions using UV-spectrophotometer and TLC
3.3.1.3 TLC procedures
3.3.3 Evaluation of pooled fractions
3.3.3.1 Cytotoxicity assay
3.3.3.2 Intracellular mechanism assay (Western Blot Analysis/ WB)
3.3.4 Statistical analysis

25
3.1 Materials
Amersham ECL gel 4-12% (GE Healthcare, Waukesha, WI, USA)
Astragalin (Sigma Aldrich®, St. Louis, MO, USA)
Bio-Rad Protein Assay kit ((Bio-Rad Laboratories, USA)
Bovine serum albumin (BSA)
Bradford reagent
Chloroform (VWR Intrnational Ltd. England analytical reagent grade)
Cisplatin (Sigma Aldrich®, St. Louis, MO, USA)
Dimethyl sulphoxide (DMSO) (Fisher Scientific; analytical reagent grade)
Dulbecco's Modified Eagle Medium (D-MEM) (GIBCOTM, Grand Island, NY,
USA)
Enhanced chemiluminescence (ECL) reagent
Ethanol (Merck, Germany; purity ≥ 99.9%)
Fetal bovine serum (FBS) (GIBCOTM, Grand Island, NY, USA)
Glacial acetic acid (Merck, Germany; purity ≥ 99.8%)
Hexane (VWR Intrnational Ltd. England analytical reagent grade)
Horseradish peroxidase–conjugated secondary antibodies
Hydrochloric acid (Scharlau Chemie S.A., Spain; purity ≥ 99.8%)
Isoquercetin (Sigma Aldrich®, St. Louis, MO, USA)
Kaempferol (Sigma Aldrich®, St. Louis, MO, USA)
Leaves of M. oleifera
L-glutamine (200 mM) (GIBCOTM, Grand Island, NY, USA)
Methanol (Merck, Germany; purity ≥ 99.9%)
Non-essential amino acid (PAA laboratories, Austria)
Penicillin (GIBCOTM, Grand Island, NY, USA)
Primary antibodies (p38 MAPK, Akt and pERK1/2 monoclonal antibody)
PVDF membranes (Amersham HybondTM-P, GE Healthcare, Waukesha, WI,
USA)
Sephadex LH-20 (GE Healthcare, Waukesha, WI, USA)
Silica gel PSQ 100B (Fuji Sylisia, Kasugai, Japan)
Sodium bicarbonate (Analar® BDH; VWR International Ltd.)
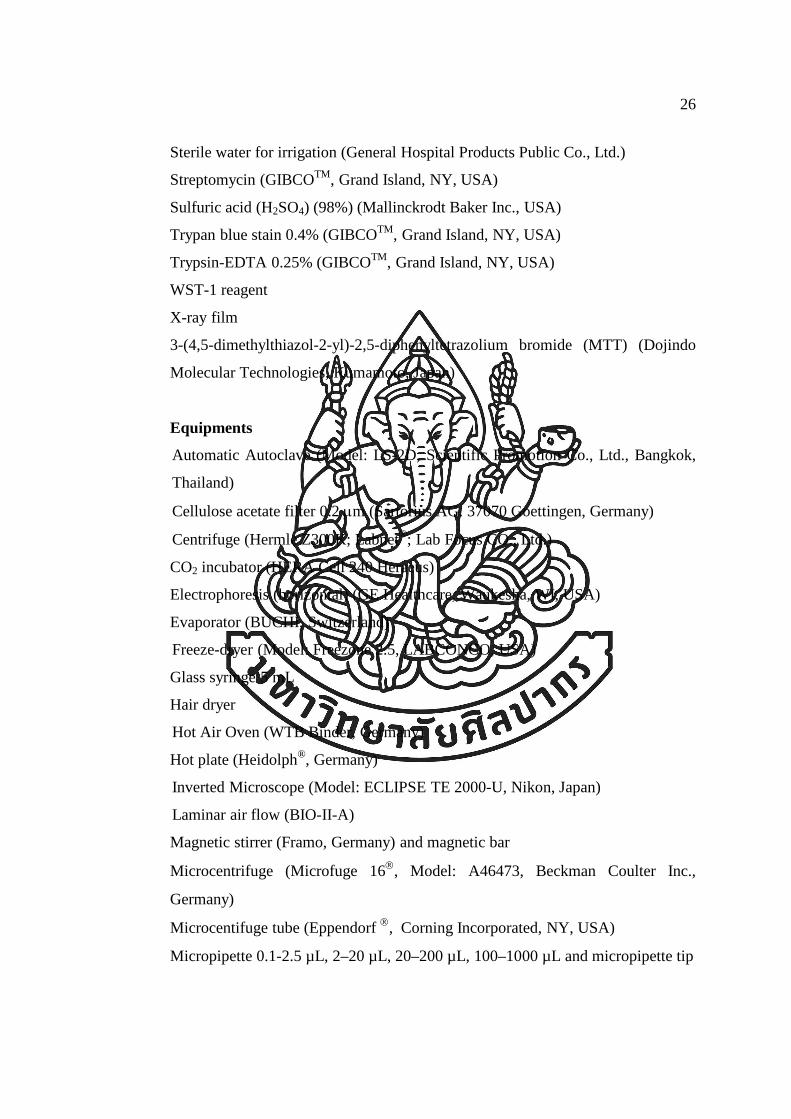
26
Sterile water for irrigation (General Hospital Products Public Co., Ltd.)
Streptomycin (GIBCOTM, Grand Island, NY, USA)
Sulfuric acid (H2SO4) (98%) (Mallinckrodt Baker Inc., USA)
Trypan blue stain 0.4% (GIBCOTM, Grand Island, NY, USA)
Trypsin-EDTA 0.25% (GIBCOTM, Grand Island, NY, USA)
WST-1 reagent
X-ray film
3-(4,5-dimethylthiazol-2-yl)-2,5-diphenyltetrazolium bromide (MTT) (Dojindo
Molecular Technologies, Kumamoto, Japan)
Equipments
Automatic Autoclave (Model: LS-2D, Scientific Promotion Co., Ltd., Bangkok,
Thailand)
Cellulose acetate filter 0.2 µm (Sartorius AG. 37070 Goettingen, Germany)
Centrifuge (Hermle Z300K; Labnet®; Lab Focus CO., Ltd.)
CO2 incubator (HERA Cell 240 Heraeus)
Electrophoresis (horizontal) (GE Healthcare, Waukesha, WI, USA)
Evaporator (BUCHI, Switzerland)
Freeze-dryer (Model: Freezone 2.5, LABCONCO, USA)
Glass syringe 5 mL
Hair dryer
Hot Air Oven (WTB Binder, Germany)
Hot plate (Heidolph®, Germany)
Inverted Microscope (Model: ECLIPSE TE 2000-U, Nikon, Japan)
Laminar air flow (BIO-II-A)
Magnetic stirrer (Framo, Germany) and magnetic bar
Microcentrifuge (Microfuge 16, Model: A46473, Beckman Coulter Inc.,
Germany)
Microcentifuge tube (Eppendorf , Corning Incorporated, NY, USA)
Micropipette 0.1-2.5 µL, 2–20 µL, 20–200 µL, 100–1000 µL and micropipette tip

27
Microplate reader (Model No; AOPUS01 and A153601; A Packard bioscience
company)
Nylon membrane filter (pore size 0.45 µm, Merck Millipore, Bedford, MA, USA)
Open column chromatography 5 cm diameters, 45 cm length
pH meter (Horiba compact pH meter B-212, Japan)
Reagent spray bottle
Sartorius® filter set (Sartorius BORO 3.3 Goettingen, Germany)
Solvent filtration kit (all glass membrane filter holder, borosilicate glass (47mm)
with sintered disc for membrane support, aluminum (duck) clamp, vacuum pump)
Sonicate Bath
Soxhlet Extractor
Spectrofluorometer (RF-1501, Shimadzu, Tokyo, Japan)
Thin-layer chromatography (TLC) developing tank
Tissue culture plate (96-, 6-Well plate) (Corning Incorporated, NY, USA)
UV-Vis spectrophotometer (Agilent model 8453 E, Germany)
Vortex mixer (Model: Labnet, USA)

28
MeOH extract
Fractionation using Sephadex LH-20 C.C.
3.2 Methods
Figure 3.1 Conceptual framework of this research
3.3.1 Plant material collection and extraction
Fresh leaves of M. oleifera were collected from January-December 2012-
2013 in Nakhon-Pathom province, Thailand. The dried leaves were extracted 100%
methanol at 50-60 °C for 3 days using a Soxhlet Extractor and were completely dried
using an evaporator. The crude extract was stored at 4 °C with protection from light.
3.3.2 Fractionation of M. oleifera leaves extract
3.3.2.1 Fractionation on Sephadex LH-20 chromatography
In this experiment, the crude methanol extract from M. oleifera
leaves was freshly dissolved in 70% (v/v) aqueous ethanol at 1 g/ 20 ml and filtered
M. oleifera leaves
Crude extracts
Dry and keep at 4 °C, protect light
Active fraction No active fr
Pooled fractions
Cytotoxicity
Intracellular mechanism
29
through 0.45-µm pore filter membranes (Merck Millipore, Bedford, MA, USA) just
before use. The extract from M. oleifera leaves was fractionated using a glass
chromatography column (i.d. 5 x 45 cm) packed with swollen Sephadex LH-20 in
70% (v/v) ethanol as the mobile phase. Each fraction was collected every 10 ml until
the UV absorbance at 260 nm of each fraction was not detected.
3.3.2.2 Detection of fractions using UV-spectrophotometer and TLC
Each fraction was determined at UV 260 nm using a
spectrophotometer and plotted the chromatogram between absorbance at 260 nm and
number of fractions. And also each fraction were grouped on the basis of their
spectral readings and then it was determined using TLC. Then, the grouped fractions
were later grouped again on the basis of their TLC profile. The pooled fractions were
concentrated to dryness on a rotary evaporator and freeze-drying and stored at -20 °C
in the dark prior to further analysis.
3.3.2.3 TLC procedures
The separation of each grouped fraction on column chromatography
was carried out by comparing with standard (STD) compound solutions, isoquercetin,
astragalin and kaempferol, prepared in absolute ethanol and applied as a thin line 1
cm from the bottom of the silica plate and dried. The plate was then developed
vertically in a closed chamber containing mobile phase (choloform: hexane 7:3)
which was previously saturated at room temperature for 15 min. The mobile phase
was allowed to migrate for a distance of 8.3 cm from the starting point. Subsequently,
the plate was removed from the chamber and air dried. Each sample on plate was
directly visualized both under UV irradiation at short (254 nm) and long waveleght
(365 nm). The spots of component from pooled fractions were detected by spraying
the plate with 50% (w/v) sulfuric acid reagent and heated at 95 ◦C for 2-3 min. The
separated components are visualized as coloured bands. The bands containing pure
natural product are evaluated the Rf value as equation below;
Rf value = distance traveled by substance distance traveled by solvent front

30
Figure 3.2 TLC plate showing distances traveled by the spot and the solvent after solvent front nearly reached the top of the adsorbent.
Figure 3.3 Chemical structures of kaempferol (1), isoquercetin (2) and astragalin (3).
Figure 3.4 Preparation of pooled fractions from M. oleifera leaves extract through column chromatography
MeOH extraction
M. oleifera leaves
Crude extracts
Fractions (f), f1-f7
Sephadex LH-20 CC, 70% EtOH
UV spectrophotometer (260 nm)
Pooled fractions of M. oleifera leaves (MOL), MOL1-MOL4
TLC
142 fractions

31
3.3.3 Evaluation of pooled fractions
Model of experiment studies: colon cancer cell lines HCT116 (from colon
ascendens organ of 48-year old male colorectal carcinoma patient) and NHF (from
normal human fibroblast) [52].
Figure 3.5 Morphology of HCT116 and NHF cell lines. Phase-contrast micrographs
depict the individual cell cultures 24 h after trypsinization and seeding.
Scale bar, 100 µm.
3.3.3.1 Cytotoxicity assay
HCT116 and NHF cells were maintained in DMEM supplemented
with 10% (v/v) heat-inactivated FBS at 37 °C, 5% CO2. Cells were plated at a density
1x10⁴ cells/well onto 96-well plate. Cells were incubated with varying concentrations
of the M. oleifera pooled fractions for 24 or 48 h in triplicate cultures, compared with
cisplatin as positive controls. Cells incubated with 0.5% DMSO (vehicle) was used as
a negative control. After the incubation period, each well was washed with phosphate-
buffed saline (PBS) and replaced with 1 mg/ml MTT or 1x WST-1 solution for 4 h
incubation. The resulting crystals product from MTT assay was dissolved in 100 µl of
100% DMSO and measured at 550 nm using a microplate reader. The results from
WST-1 assay were measured at 550 nm using a microplate reader. The percentage of
cell viability was calculated as previously described [12].
3.3.3.2 Intracellular mechanism assay (Western Blot Analysis/ WB)
HCT116 cells were plated at a density 1x10⁵ cells/ mL onto 6-well
plate and incubated overnight. Cells were incubated with varying concentrations of
100 µm
HCT116 NHF

32
the M. oleifera pooled fractions for 24 or 48 h in triplicate cultures, compared with
positive and negative controls. After treatment with samples, cells were washed with
PBS, pH 7.4 and lysed with lysis buffer (with 1 mM Na3VO4 and 1 mM NaF
inhibitor) on ice for 15 min. Cell lysates were clarified by centrifugation at 13,000 g
for 10 min at 4 °C, and protein concentrations of supernatants were quantified by
Bradford assay. Equivalent amounts of total cellular proteins (5-25 µg) were
separated by 10% gel SDS-PAGE. Each protein sample was added with sample
loading buffer and boiled for 5 min and kept on ice immediately prior to
electrophoresis through a 10% gel SDS-PAGE at 110 volts for 90 min. Proteins were
then transferred onto PVDF membranes. The process was carried out for 1 h on ice.
For immunodetection of the proteins, membranes were blocked in 5% BSA in TBS-T
buffer for 1 h. Probing of nitrocellulose or PVDF membranes with primary antibodies
at 4 °C overnight and detection of horseradish peroxidase–conjugated secondary
antibodies by enhanced chemiluminescence (ECL) was done. For example, the probe
used was antibodies against pERK1/2 polyclonal antibody (anti-rabbit ERK1/2). The
chemiluminescence reagent was poured into the membrane and incubated for 1-5 min
at room temperature and then removed excess chemiluminescence reagent. The
membrane was placed and covered with plastic wrap. It must be gently smooth out
any air between membrane and plastic wrap. The imaging film was put on top of the
membrane for 5-10 min depended on the signal of protein. The film was developed
and analyzed using ImageJ software.
3.3.4 Statistical analysis
All experimental measurements were performed in triplicate. The results are
expressed as mean ± standard deviation. Statistical analysis of the data was evaluated
using one-way analysis of variance (ANOVA) (SPSS software version 16.0). The
significance level was set to p < 0.05.

33
CHAPTER 4
RESULTS AND DISCUSSION
4.1 Fractionation of M. oleifera leaves extract
4.1.1 Detection of fractions using UV-spectrophotometer
4.1.2 Detection of fractions using TLC
4.2 Evaluation of pooled fractions
4.2.1 Cytotoxicity assay
4.2.1.1 HCT116 cells
4.2.1.2 NHF cells
4.2.2 Intracellular mechanism assay (Western Blot Analysis/ WB)

34
4.1 Fractionation of M. oleifera leaves extract
Detection of fractions using UV-spectrophotometer
In the fractionation process of M. oliefera leaves extract, several
fractions were collected every 10 ml from Sephadex LH-20 chromatography. The
chromatograms of the eluates detected by UV spectrophotometer at 260 nm as shown
in Figure 4.1 and Table A.1. The chromatograms showed several inner peaks of
fractions from the M. oleifera leave extracts. The fractionation of M. oleifera leaves
was divided into seven groups (f1-f7) according to their absorbance at 260 nm.
Because of the absorbance of fraction number 27 to 95 was over 1.000 thus the
dilution of these fraction numbers was prepared and then detected the absorbance at
260 nm (Fig. 4.1(b) and Table A.1). According to their absorbance, fraction number
22 to 46 was combined into group 1, f1. Fraction number 47 to 53 was combined into
group 2, f2. Fraction number 54 to 76 was combined into group 3, f3. Fraction
number 77 to 87 was combined into group 4, f4. Fraction number 88 to 99 was
combined into group 5, f5. Fraction number 100 to 131 was combined into group 6,
f6. For another fraction from fraction number 131 was combined into last group, f7.
35
(a)
0.0
1.0
2.0
3.0
4.0
0 10 20 30 40 50 60 70 80 90 100 110 120 130 140
Abs
at 2
60 n
m
Faction number
(b)
0.0
0.5
1.0
1.5
2.0
27 37 47 57 67 77 87
Abs
at 2
60 n
m
Fraction number (1:10 dilution)
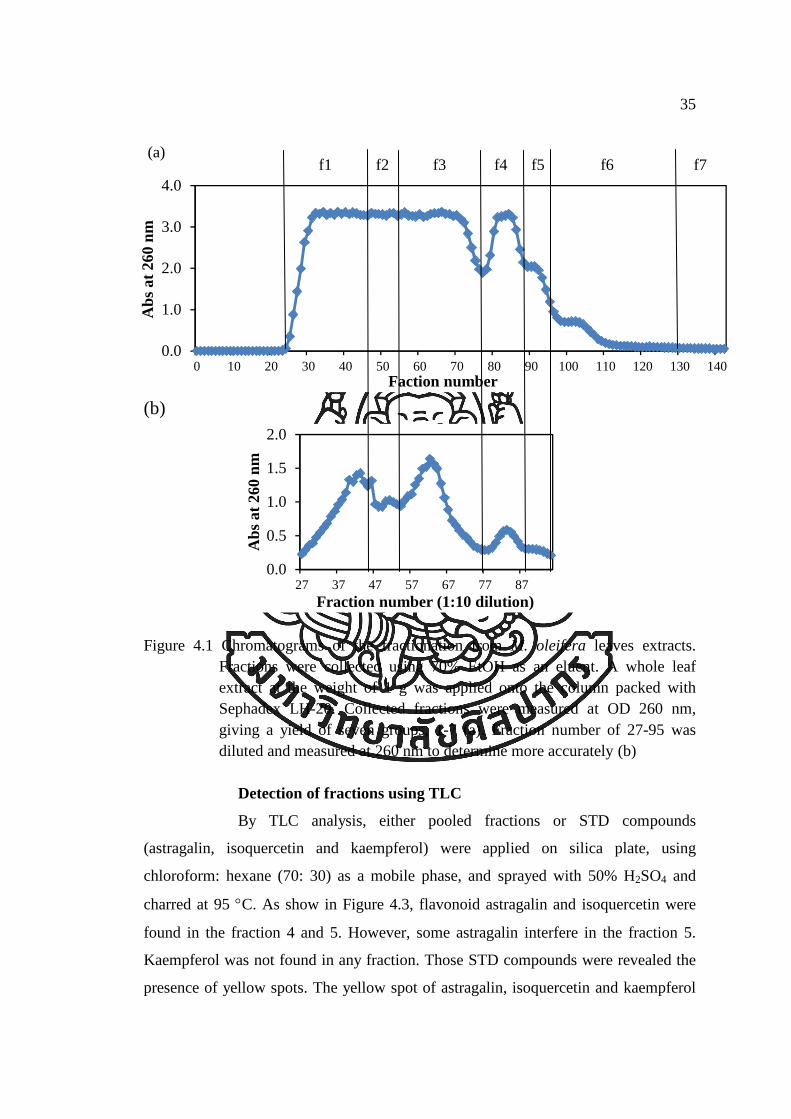
Figure 4.1 Chromatograms of the fractionation from M. oleifera leaves extracts.
Fractions were collected using 70% EtOH as an eluent. A whole leaf extract at the weight of 1 g was applied onto the column packed with Sephadex LH-20. Collected fractions were measured at OD 260 nm, giving a yield of seven groups, 1-7 (a). Fraction number of 27-95 was diluted and measured at 260 nm to determine more accurately (b)
Detection of fractions using TLC
By TLC analysis, either pooled fractions or STD compounds
(astragalin, isoquercetin and kaempferol) were applied on silica plate, using
chloroform: hexane (70: 30) as a mobile phase, and sprayed with 50% H2SO4 and
charred at 95 °C. As show in Figure 4.3, flavonoid astragalin and isoquercetin were
found in the fraction 4 and 5. However, some astragalin interfere in the fraction 5.
Kaempferol was not found in any fraction. Those STD compounds were revealed the
presence of yellow spots. The yellow spot of astragalin, isoquercetin and kaempferol
f1 f2 f3 f4 f5 f6 f7

36
show the Rf at 0.545, 0.331 and 0.777, respectively (Fig 4.3). The grouped fraction f1,
f2 and f3 were combined into MOL1 according to their spots pattern on silica plate.
For the grouped fraction f4, f5 and f6, their spot pattern shows an uniqe pattern. Then,
the grouped fraction f4, f5 and f6 were renamed to the MOL2, MOL3 and MOL4,
respectively. Last grouped fraction f7 did not have any spot. Therefore, seven grouped
fractions, f1-f7, were regrouped to four fractions, MOL1 to MOL4.
(a) (b)
Figure 4.2 The separation of grouped fractions and STD compounds on the silica
plates under UV irradiation at (a) 254 nm and (b) 365 nm using
chloroform: hexane (70: 30) as a mobile phases. The fraction f1 - f7
represents in the spot 1-7. The STD compounds, astragalin, isoquercetin
and kaempferol, represent in the spot 8-10.

37
Figure 4.3 The separation of grouped fractions (f1-f7), and STD compounds on the
silica plates using chloroform: hexane (70: 30) as a mobile phases after spraying with 50% H2SO4 and heating at 95 °C. The fraction f1 - f7 represents in the spot 1-7. The STD compounds, astragalin, isoquercetin and kaempferol, represent in the spot 8-10.
It is not surprising that astragalin and isoquercetin were obtained from
M. oleifera leaves as they have been reported in previous studies [53]. Astragalin and
isoquercetin are a flavonoid glycoside and are obtained from various leaves such as
Diospyros kaki, mulberry, Sapium sebiferum [54-57]. These isolated compounds
(astragain, isoquercetin) were also obtained from MOL2 and MOL3 of M. oleifera
leaves. However, some astragalin in MOL2 was also found in the MOL3 (Fig. 4.3). It
should eliminate the interfering astragalin component by removing some fractions
from chromatogram (Fig. 4.1) before grouping as the procedure reported by
Tragulpakseerojn et al. [16].
8.30 cm
4.53 cm
6.45 cm
2.75 cm
1 2 3 4 5 6 7 8 9 10

38
Table 4.1 Phytochemicals present in M. oleifera leaves using different solvent extract.
Soruce: Kasolo, J.N. et al. (2010) "Phytochemicals and uses of Moringa oleifera
leaves in Ugandan rural communities." Journal of Medicinal Plants
Research 4, 9: 753-757.
Selection of the solvent extraction approach is important. For example,
Kasolo et al. reported that if M. oleifera leaves were extracted using ether or water
solvent, the amount of steroids and triterpenoids or anthraquinones were found
highest content compared with other compound (Table 4.1) [58]. However, the
phytochemicals present in ethanol extract of M. oleifera leaves exhibited the steroid
and triterpenoids, flavonoids, anthraquinones and reducing sugars in the moderate
concentration [58]. Additionally, the previous findings show that among different
solvents (absolute EtOH, absolute MeOH, aqueous EtOH (80% v/v), aqueous MeOH
(80% v/v)), the extraction made under reflux and shaking techniques using aqueous
alcohol (80% v/v of EtOH and MeOH) exhibits highest total phenolics and total
flavonoid content [59].
Moreover, they, MOL1 to MOL4, were found to yield of 794.5, 12.3, 9.5
and 14.3 mg per 1 g of dried weight, respectively. In M. oleifera leaves, first elution
pooled fraction, MOL1, gave the highest yield (79.45%) while subsequent pooled
fractions gave the lower yields of 1.23% (w/w), 0.95% (w/w) and 1.43% (w/w),
respectively. Each pooled fractions were further evaluated for biological activities.

39
4.2 Evaluation of pooled fractions
4.2.1 Cytotoxicity assay
4.2.1.1 HCT116 cells
A primary screening for antitumor activity was carried out
with antiproliferation assay by using the four pooled fractions (MOL1-MOL4). It was
found that pooled fractions showed a relatively high antiproliferative activity in
HCT116 cells. Firstly, they were examined the antiproliferative activity by WST-1
and MTT reduction assay in colon cancer, HCT116, cells. Studies on cell viability of
HCT116 cells with and without the addition of four pooled fractions are illustrated in
Figure 4.4 and 4.5. The four pooled fractions, MOL1-MOL4, showed anti-
proliferative effects in a dose-dependent manner during 24 and 48 h (Figure 4.4 and
4.5). When cells were incubated for 24 and 48 h, MOL2, MOL3 and MOL4 were
significantly more cytotoxic than MOL1. It suggests that the components present in
MOL2, MOL3 and MOL4 are more effective than those in MOL1. In addition,
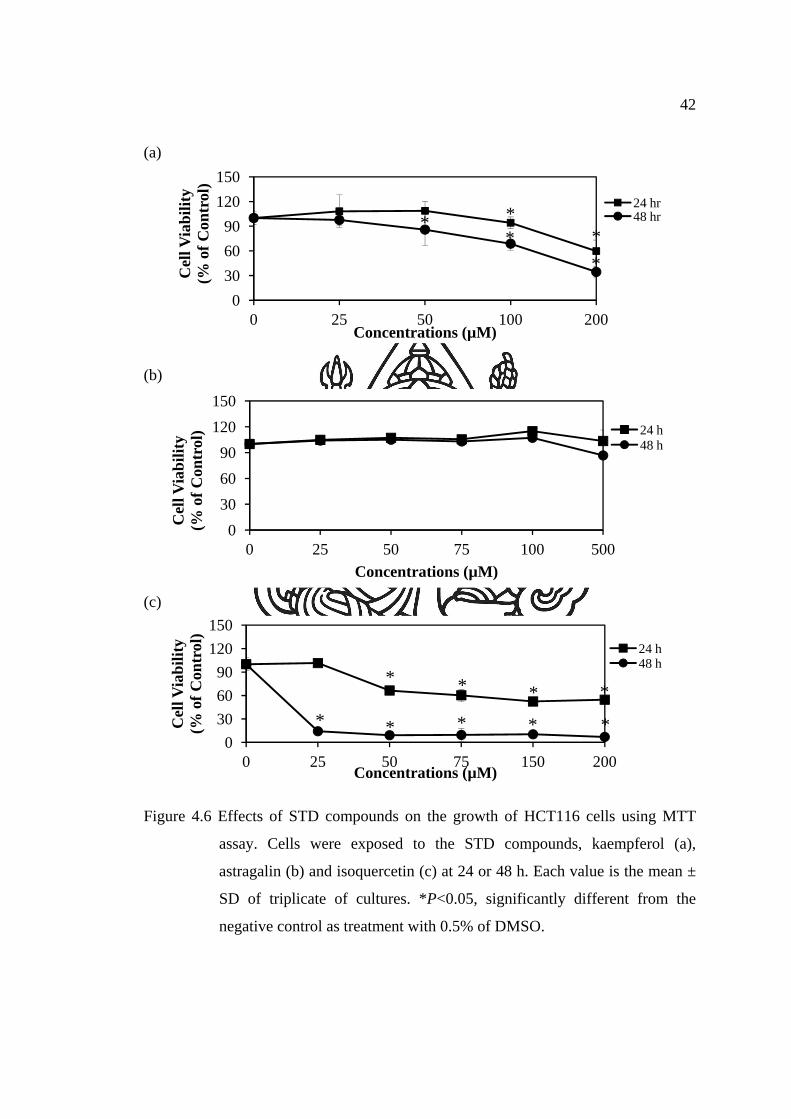
slightly decrease of viability in the HCT116 cells was observed in the treatment of
kaempferol (Figure 4.6a). HCT116 cells were less affected by kaempferol than that by
pooled fractions. As shown in Figure 4.6b, the treatment of astragalin did not effect
on HCT116 cell proliferation. When cells were incubated with isoquercetin, a strong
decrease of cell viability was observed (Figure 4.6c). It suggests that isoquercetin
which could be isolated from M. oleifera leaves is more effective than kaempferol and
astragalin.

40
(a)
0
30
60
90
120
150
0 50 100 250 500
Cel
l Via
bilit
y(%
of C
onto
l)
Concentrations (µg/mL)
MOL1
(b)
0
30
60
90
120
150
0 1 5 10 25 50
Cel
l Via
bilit
y(%
of C
ontr
ol)
Concentrations (µg/mL)
MOL2
MOL3
MOL4
Figure 4.4 Effects of each pooled fraction (MOL1-MOL4) on the growth of HCT116
cells using WST-1 assay. Cells were treated with indicated concentration
of each pooled fraction. Cells were continuous exposed to the pooled
fractions (a) MOL1 or (b) MOL2-MOL4 at 24 h. Each value is the mean ±
SD of triplicate of cultures. *P<0.05, significantly different from the
negative control as treatment with 0.5% of DMSO.
*
*
* * *
*

41
(a)
0
30
60
90
120
150
0 50 100 250 500
Cel
l V
iab
ilit
y(%
of
Con
trol
)
Concentrations (g/mL)
MOL1
(b)
0
30
60
90
120
150
0 1 5 10 25 50
Cel
l V
iab
ilit
y(%
of
Con
trol
)
Concentrations (g/mL)
MOL2
MOL3
MOL4
Figure 4.5 Effects of each pooled fraction (MOL1-MOL4) on the growth of HCT116
cells using WST-1 assay. Cells were treated with indicated concentration
of each pooled fraction. Cells were continuous exposed to the pooled
fractions (a) MOL1 or (b) MOL2-MOL4 at 48 h. Each value is the mean ±
SD of triplicate of cultures. *P<0.05, significantly different from the
negative control as treatment with 0.5% of DMSO.
*
*
*
*
* *
*
42
(a)
0
30
60
90
120
150
0 25 50 100 200
Cel
l Via
bil
ity
(% o
f C
ontr
ol)
Concentrations (µM)
24 hr48 hr
(b)
0
30
60
90
120
150
0 25 50 75 100 500
Cel
l Via
bil
ity
(% o
f C
ontr
ol)
Concentrations (µM)
24 h48 h
(c)
0
30
60
90
120
150
0 25 50 75 150 200
Cel
l Via
bil
ity
(% o
f C
ontr
ol)
Concentrations (µM)
24 h48 h
Figure 4.6 Effects of STD compounds on the growth of HCT116 cells using MTT
assay. Cells were exposed to the STD compounds, kaempferol (a),
astragalin (b) and isoquercetin (c) at 24 or 48 h. Each value is the mean ±
SD of triplicate of cultures. *P<0.05, significantly different from the
negative control as treatment with 0.5% of DMSO.
* * * *
* * * * *
*
*
* **

43
Since cisplatin (cis-diamminedichloroplatinum II) is an anti-
cancer drug using for chemotherapy of many cancers including colon cancer [60], it
was used as a positive control in this study. When HCT116 cells were treated with
100 µg/ml cisplatin for 24 and 48 h, it showed low toxicity to the cells (Table A.2 and
A.6). This concentration of cisplatin may be not enough to reduce HCT116 cell
proliferation. Sergent et al. reported that cisplatin at high dose (200 µg/ml) exhibits
apoptosis induction on colon cancer HCT116 cells. Additionally, the efficiency of
cisplatin is low in colorectal cancer (CRC), with fewer than 20% clinical responses
when used alone [62]. Moreover, dysregulation of apoptosis pathways is generally
assumed to be important for resistance to cisplatin [61]. It suggests that the HCT116
cells are quite tolerant to to cisplatin treatment.
4.2.1.2 NHF cells
To evaluate whether the effect of four pooled fractions
(MOL1-MOL4) on colon cancer (HCT116) cells differed from that on human normal
fibroblast (NHF) cells, the antiproliferative assay was carried out.
It was found that pooled fractions showed antiproliferative
activity effect on NHF cells in a dose-dependent manner during 24 and 48 h. (Figure
4.7). When cells were incubated for 24 and 48 h, MOL2, MOL3 and MOL4 were
more cytotoxic than MOL1. Its results were concomitant to the results from HCT116
cells. It suggests that the components present in MOL2, MOL3 and MOL4 are more
effective than those in MOL1. Moreover, it was noticed that cisplatin was not
cytotoxic at concentration of 100 µg/ml on NHF cells (Table A.10 and A.14).
Generally, the efficiency of chemotherapeutic drugs, such as cisplatin, is low in non-
cancer cells because normal cells do not have a rapid proliferation therefore NHF
cells show a decrease sensitivity to cisplatin [61].

44
(a)
0
30
60
90
120
150
0 10 25 50 75 100 250 500
Cel
l Via
bil
ity
(% o
f C
ontr
ol)
Concentrations (µg/ml)
MOL1
MOL2
MOL3
MOL4
(b)
0
30
60
90
120
150
0 10 25 50 75 100 250 500
Cel
l Via
bil
ity
(% o
f C
ontr
ol)
Concentrations (µg/ml)
MOL1
MOL2
MOL3
MOL4
Figure 4.7 Effects of each pooled fraction (MOL1-MOL4) on the growth of NHF cells
using WST-1 assay. Cells were treated with indicated concentration of
each pooled fraction. Cells were continuous exposed to the pooled
fractions MOL1-MOL4 at 24 h (a) or 48 h (b). Each value is the mean ±
SD of triplicate of cultures. *P<0.05, significantly different from the
negative control as treatment with 0.5% of DMSO.
The toxicity of each pooled fractions in both cells was also done at 24 and
48 h, determining the effect of different cell line. The results showed that the
cytotoxicity of each pooled fractions was dose-dependent. The cytotoxicities of
* * * ** *
*
* ** *
*
* * *
* *
* *
* * *
* *

45
MOL4 at both inclubation times were extremely higher toxic in colon cancer
(HCT116) cells than that in human normal fibroblast (NHF) cells (Table 4.1).
Moreover, the cytotoxicities of all pooled fractions, except the MOL1 were higher in
HCT116 cells than that in NHF cells at 24 and 48 h. The results also suggested that
the cytotoxic effect of almost pooled fractions from M. oleifera leaves in HCT116
cells was higher than that in NHF cells.
From the effect of STD compounds on HCT116 cell proliferation (Tabel 4.2)
by MTT reduction assay, the results show that isoquercetin was strongest effective in
cell proliferation at both 24 and 48 h. The results of kaempferol revealed that it
decrease the viability of HCT116 cells in an inclubation time-dependent manner.
However, the results of astragalin indicated that it was ineffective on HCT116 cells at
24 and 48 h.
Table 4.2 Toxicity of each pooled fractions in HCT116 and NHF cells at 24 and 48 h.
Samples
IC40 (approximately) (µg/mL)
24 h 48 h
HCT116 NHF HCT116 NHF
MOL1
MOL2
MOL3
MOL4
517.540
43.799
21.145
8.936
> 500
106.190
52.498
17.041
462.600
46.290
24.869
4.031
>500
51.520
39.197
17.697
Table 4.3 Toxicity of STD compounds in HCT116 cells at 24 and 48 h.
STD compound IC40 (approximately) (µM)
24 h 48 h
Astragalin
Kaempferol
Isoquercetin
> 500.000
205.896
68.518
> 500.000
126.648
5.412
46
Note that, the cytotoxicity test between each MOL and STD compound
should be tested in the same method. In this study, the WST-1 stock solution was
limited therefore, the similar principle assay, MTT method, was selected to use in
STD compounds cytotoxicity assay.
The difference in colon cancer cell proliferation inhibition between MOL1,
MOL2, MOL3 and MOL4 was probably due to the presence of different components
and/or different amounts of active components in different pooled fraction of M.
oleifera leaves extract. Since isoquercetin is one of components obtained from MOL3,
the strong inhibitory effect of MOL3 on colon cancer cell growth from cell growth
inhibition activity of isoquercetin may be partly.
It is worth to note that cancer cells, compared to normal cells, are more
susceptible to be killed by anticancer drugs and polyphenols as well. This is probably
because cancer cells are rapidly dividing cells [61]. In fact, by using the same
concentration, each MOL decreases cell proliferation in cancer cell line, but having a
little effect in normal cells.
The dose-dependent effect of MOL on cell proliferation inhibition was
demonstrated in colon HCT116 cells, i.e., MOL3 and MOL4 at a low concentration
(20-50 ug/ml) decreased HCT116 cell proliferation, while MOL1 at higher
concentration (more than 500 ug/ml) could caused the antiproliferative activity.
4.2.2 Intracellular mechanism assay (Western Blot Analysis/ WB)
To this session, the investigation whether each fractionated fraction (MOL)
induced growth arrest in the HCT116 cell was associated with the activation of ERK,
cell lysate from MOL-treated cells at different times (24 and 48 h) and concentrations
(2 times of IC40, IC40 and half times of IC40 value) were subjected to western blot
analysis using an anti-phospho-ERK antibody to detect phosphorylated ERK.
However, the maximum concentration of MOL1 is 1.5 times of IC40 value because of
the limited of the % of DMSO. Normally, the % of DMSO must be lower than 1% v/v
of DMSO. The same blots were subsequently reblotted with an antibody that
recognized total tubulin to verify equal amounts of the protein in various samples. As
shown in Figure 4.8, treatment of HCT116 cell with isoquercetin, MOL1, MOL2,

47
MOL3 and MOL4 possess different effect on ERK signaling. Treatment of HCT116
cells with 11, 5.5, 2.7 µM of isoquercetin showed a slight effect on pERK signaling at
24 hr. Although, it mediated up-regulation of pERK at 48 hr, thereby further reduced
proliferation of HCT116 cells might be due to another signaling pathway.
As shown in Figure 4.8 (b), treatment of HCT116 cell with MOL1 and
MOL2 led to a dose-dependent reduction of pERK. MOL1 and MOL2 reduced the
cellular levels of antiproliferative protein pERK1/2. It suggested that the blockage of
the serine/ threonine kinase ERK activity by MOL1 and MOL2 is important for
inhibition of colon cancer cell proliferation because active phosphorylated ERK
enhances the proliferative of cells [44].
In addition, a MOL3 and MOL4 possing strong antiproliferative activity
showed stronger effect on phosphorylation of ERKs reduction (Figure 4.8 (c)).
Moreover, the strong antiproliferation activity of isoquercetin may involve other
mechanisms. It has been reported that isoquercetin inhibit colon, HCT116, DLD-1
and SW480, cancer growth through Wnt/β-catenin signaling pathway [63]. Therefore,
it might be worthfully to make a further experiment for MOL3 with Wnt/β-catenin
signaling pathway.

48
Figure 4.8 Effect of treatment with each pooled fraction ,(a) isoquercetin, (b) MOL1, MOL2, (c) MOL3 and MOL4 for 24 and 48 h on phospho-ERK expression in HCT116 cells, using western bolt. Tubulin was used as loading control. *Cisplatin 100 ug/ml was used as control.
(a)
(b)
(c)

49
The results MOL1, MOL2, MOL3 and MOL4 indicated that the inhibition of
HCT116 cell growth was related to the reduction of pERK1/2 signaling pathway.
However, the pERK1/2 signaling data alone is insufficient to conclude that
bioactivities of each pooled fraction from M. oleifera leaves promote cytotoxicity by
dimimishing pERKs signaling. Other intracellular signaling of cancer i.e. 1) some
member of the MAPK family, p38 kinase or c-Jun N-terminal kinase (JNKs) which
are responsible for the regulation of diverse functions including proliferation,
differentiation and apoptosis, and 2) PI3/Akt pathway, which is important for
promoting cell survival and growth, should be further investigated.

50
CHAPTER 5
CONCLUSIONS
Base on the findings of this study, the following conclusions were made;
5.1 Fractionation of M. oleifera leaves extract
Fractionated the extract from M. oleifera leaves by gel filtration chromatography
on Sephadex LH-20 is used for fractionation of natural products on the basis of
molecular size. The fractionation of M. oleifera leaves was divided into four groups
(MOL1-MOL4) according to their absorbance at 260 nm and TLC profile.
5.2 Evaluation of pooled fractions
5.2.1 Cytotoxicity assay
MOL2, MOL3 and MOL4 were observed to be significantly more cytotoxic
on colon HCT116 cancer cells than MOL1. It may be deduced that the components
present in MOL2, MOL3 and MOL4 are more effective than those in MOL1. While
all pooled fraction was observed to be more specifically effect on colon cancer cells
than normal cells.
Among the STD compound in M. oleifera leaves, isoquercetin showed
strongest effect on HCT116 cells.
5.3 Intracellular mechanism assay (WB)
Molecular target of MOL1, MOL2, MOL3 and MOL4 is pERKs, which
cooperates in MEK/ERK activation. This could partially explain the potent anti-
proliferative effect it was observed in vitro.
51
REFERENCES
[1] WHO, World Health Organization (2014): World cancer burden 2012.
<http://publications.cancerresearchuk.org/cancerstats/statsworldwide/worl
dfactsheet.html> (Retrieved 2015-05-10).
[2] Brenner, H., Kloor, M. and Pox, C.P. (2014). “Colorectal cancer.” The Lancet
383, 9927: 1490-1502.
[3] Zhou, J.R., et al. (2003): “Soy phytochemicals and tea bioactive components
synergistically inhibit androgen-sensitive human prostate tumors in mice.”
Journal of Nutrition 133, 516-521.
[4] Sultana, S., et al. (2014). “Medicinal plants combating against cancer-a green
anticancer approach.” Asian Pacific journal of cancer prevention 15,
4385-4394.
[5] เกษร นนทจต และ สมจรง รงแจง (2555). “เคมของยา: ยาท#เก#ยวของกบการรกษามะเรง.” พมพคร+ งท#3, 99.
[6] Sharma, J., et al. (2013). “Natural polymers-promising potential in drug delivery.”
International Journal of PharmTech Research 5, 684-699.
[7] Anwar, F. et al. (2007). “Moringa oleifera: a food plant with multiple medicinal
uses.” Phytotherapy Research 21, 17-25.
[8] Mbikay, M. (2012). “Therapeutic potential of Moringa oleifera leaves in chronic
hyperglycemia and dyslipidemia: a review”. Frontiers in Pharmacology 3,
1-12.
[9] Peixoto, J.R.O.et al. (2011). “In vitro antibacterial effect of aqueous and ethanolic
Moringa leaf extracts.” Asian Pacific Journal of Tropical Medicine 4,
201-204.
[10] Chuang, P.et al. (2007). “Anti-fungal activity of crude extracts and essential oil
of Moringa oleifera Lam.” Bioresource Technology 98, 232-236.
[11] Bose, C.K. (2007). “Possible role of Moringa oleifera Lam. root in epithelial
ovarian cancer.” Medscape general medicine 9, 26.
[12] Sreelatha, S. et al. (2011). “Antiproliferation and induction of apoptosis by
Moringa oleifera leaf extract on human cancer cells.” Food and Chemical
Toxicology 49, 1270-1275.

52
[13] Iqbal, S. and Bhanger, M.I. (2006). “Effect of season and production location on
antioxidant activity of Moringa oleifera leaves grown in Pakistan.” Journal
of Food Composition and Analysis 19, 544-551.
[14] Makkar, H.P.S. and Becker, K. (1996). “Nutritional value and antinutritional
components of whole and ethanol extracted Moringa oleifera leaves.”
Animal Feed Science and Technology 63, 211-228.
[15] Khalafalla, M.M. et al. (2010). “Active principle from Moringa oleifera Lam
leaves effective against two leukemias and a hepatocarcinoma.” African
Journal of Biotechnology 9, 8467-8471.
[16] Tragulpakseerojn, J. et al. (2014). "Apoptosis activities of the extract from
Moringa oleifera leaves on human HCT116 colon cancer cells."
Fundamental Toxicological Sciences 1, 4: 143-149.
[17] Karthivashan, G. et al. (2013). “Identification of bioactive candidate compounds
responsible for oxidative challenge from hydro-ethanolic extract of
Moringa oleifera leaves.” Journal of Food Science 78, C1368-C1375.
[18] Slattery, M.L. et al. (2012). “MAPKinase genes and colon and rectal cancer.”
Carcinogenesis, 33(12), 2398-2408.
[19] McCubrey, J.A. et al. (2007). “Roles of the Raf/MEK/ERK pathway in cell
growth, malignant transformation and drug resistance.” Biochimica et
Biophysica Acta 1773, 8: 1263-84.
[20] Li, W. et al. (2009). “Kaempferol induces apoptosis in human HCT116 colon
cancer cells via the Ataxia-Telangiectasia mutated-p53 pathway with the
involvement of p53 upregulated modulator of apoptosis.” Chemico-
Biological Interactions 177, 121-127.
[21] Ross, Ivan A. (2003). "Moringa pterygosperma" Medicinal Plants of the World
, 367-376.
[22] Charoensin, S. (2014). “Antioxidant and anticancer activities of Moringa
oleifera leaves.” Journal of Medicinal Plants Research 8, 7: 318-325.
[23] Budda, Sirintip et al. (2011). "Suppressive effects of Moringa oleifera Lam pod
against mouse colon carcinogenesis induced by azosymethane and dextran

53
sodium sulfate." Asian Pacific Journal of Cancer Prevention 12, 3221-
3228.
[24] Guevara, Amelia P. et al. (1999). "An antitumor promoter from Moringa oleifera
Lam." Mutation Research 440, 181-188.
[25] Berkovich, L. et al. (2013). “Moringa oleifera aqueous leaf extract down-
regulates nuclear factor-kappaB and increases cytotoxic effect of
chemotherapy in pancreatic cancer cells.” Complementary and
Alternative Medicine13, 212-219.
[26] Tiloke, C. et al. (2013). “The antiproliferative effect of Moringa oleifera crude
aqueous leaf extract on cancerous human alveolar epithelial cells.”
Complementary and Alternative Medicine 13, 226.
[27] Purwal, L. et al. (2010). “In vivo anticancer activity of the leaves and fruits of
moringa oleifera on mouse melanoma.” Pharmacologynoline 1, 655-665.
[28] Chinedu, Anyanwu Anthony et al. (2014). "Effect of the ethanolic leaf extract of
Moringa oleifera on insulin resistance in streptozotocin induced diabetic
rats." Journal of Plant Sciences 2, 6-1: 5-12.
[29] Tende, J.A. et al. (2011). “Effect of ethanolic leaves extract of Moringa oleifera
on blood glucose levels of streptozocin-induced diabetics and
normoglycemic wister rats.” British Journal of Pharmacolog and
Toxicology 2, 1: 1-4.
[30] Soliman, G.Z.A. (2013). “Anti-diabetic activity of dried Moringa oleifera leaves
in normal and streptozotocin (Stz)-induced diabetic male rats.”
Biochemistry 3, 9: 18-23.
[31] Cheenpracha, Sarot et al. (2010). "Potential anti-inflammatory phenolic
glycosides from the medicinal plant Moringa oleifera fruits." Bioorganic
and Medicinal Chemistry 13, 6598-6602.
[32] Fakurazi, Sharida et al. (2012). "Moringa oleifera hydroethanolic extracts
effectively alleviate acetaminophen-induced hepatotoxicity in
experimental rats through their antioxidant nature.” Molecules 17, 8334-
8350.

54
[33] Verma, V.K. et al. (2012). “Anti-ulcer and antioxicant activity of Moringa
oleifera (Lam) leaves against aspirin and ethanol induced gastric ulcer in
rats.” Research Journal of Pharmaceuticaly 2, 2: 46-57.
[34] Govardhan Singh, R.S. et al. (2013). "Phenolic composition, antioxidant and
antimicrobial activities of free and bound phenolic extracts of Moringa
oleifera seed flour." Journal of Functional Foods 5, 1883-1891.
[35] Mbikay, Majambu. (2012). "Therapeutic potential of Moringa oleifera leaves in
chronic hyperglycemia and dyslipidemia: a review." Frontiers in
Pharmacology 3, 1-12.
[36] Mitra, A.K. et al. (2014). “Advanced drug delivery in cancer therapy.”
Advanced drug delivery, 323-340.
[37] Kleinsmith, L.J. (2006), "Identifying the causes of cancer." Principles of cancer
biology. 60-79.
[38] Sittiwet, C. (2014), "Rafts, Caveolae and intracellular cholesterol trafficking."
วารสารวทยาศาสตรบรพา 19(1), 147-159.
[39] Jahn, K. A. et al. (2011). “Multifaceted nature of membrane microdomains in
colorectal cancer.” World Journal of Gastroenterology 17, 6
(February): 681–690.
[40] Kang, N. J. et al. (2011). "Polyphenols as small molecular inhibitors of signaling
cascades in carcinogenesis." Pharmacology and Therapeutics 130, 310-
324.
[41] Bode, A. M. and Dong, Z. (2013). "Signal transduction and moleular targets of
selected flavonoids". Antioxidants and redox signaling. 19(2): 163-179.
[42] Ross, Warren et al. (1984). "Role of Topoisomerase II in mediating
epipodophyllotoxin-induced DNA cleavage." Cancer research 44, 55857-
5860.
[43] ATCC, American Type Culture Collection: All Products (CCL-247TM).
<www.atcc.org/Products/All/CCL-247.aspx> (Retrieved 2016-03-03).
[44] Ruddon, R.W. (1995). “Cancer Biology”. Oxford University Press: New York.
55
[45] Wang, H. et al. (2012). "Plants against cancer: A review on natura
phytochemicals in preventing and treating cancers and their druggability."
Anti-Cancer Agents in Medicinal Chemistry 12, 10: 1281-1305.
[46] Nichenametla, S. N. et al. (2014). "A review of the effects and mechanisms of
polyphenolics in cancer" Critical Reviews in Food Science and
Nutrition 46, 161-183.
[47] Archivio, M. D. et al. (2008). "Modulation effects of polyphenols on
apoptosisinduction: relevance for cancer prevention." International
Journal of Molecular Sciences 9, 213-228.
[48] Huang, Wen-Wen et al. (2013). "Kaempferol induces autophagy through AMPK
and Akt signaling molecules and causes G2/M arrest via downregulation
of CDK1/cyclin B in SK-HEP-1 human hepatic cancer cells."
International Journal of oncology 42, 2069-2077.
[49] Sreelatha, S. and Padma, P.R. (2009). "Antioxidant activity and total phenolic
content of Moringa oleifera leaves in two stages of maturity." Plant Foods
for Human Nutrition 64, 303-311.
[50] Yoshida, Tatsushi et al. (2008). "Kaempferol sensitizes colon cancer cells to
TRAIL-induced apoptosis." Biochemical and Biophysical Research
Communications 375, 129-133.
[51] Finley, J. W. (2005). "Proposed criteria for assessing the efficacy of cancer
reduction by plant foods enriched in carotenoids, glucosinolates,
polyphenols and selenocompounds." Annals of Botany 95, 1075-1096.
[52] Ahmed, D. et al. (2013). “Epigenetic and genetic features of 24 colon cancer cell
lines.” Oncogenesis 2, 1-8.
[53] Vongsak, B. et al. (2013). “Simultaneous determination of crypto-chlorogenic
acid, isoquercetin, and astragalin contents in Moringa oleifera leaf extracts
by TLC-densitometric method.” Evidence-Based Complementary and
Alternative Medicine, 1-7.
[54] Xue, Y., Miyakawa et al. (2011). “Isolation and tyrosinase inhibitory effects of
polyphenols from the leaves of Persimmon, Diospyros kaki.” Journal of
Agricultural and Food Chemistry 59, 6011-6017.

56
[55] Katsube, T. et al. (2006). “Antioxidant flavonol glycosides in mulberry (Morus
alba L.) leaves isolated based on LDL andtioxidant activity.” Food
Chemistry 97, 25-31.
[56] Fu, R., Zhang, Y.et al. (2015). “Phenolic composition and effects on allergic
contact dermatitis of phenolic extracts Sapium sebiferum (L.) Roxb.
leaves.” Journal of Ethnopharmacology 162, 176-180.
[57] Choi, J.et al.(2013). “Antioxidant effect of astragalin isolated from the leaves of
Morus alba L. against free radical-induced oxidative hemolysis of human
red blood cells.” Archives of Pharmacal Research 36, 912-917.
[58] Kasolo, J.N. et al. (2010). "Phytochemicals and uses of Moringa oleifera leaves
in Ugandan rural communities." Journal of Medicinal Plants Research
4, 9: 753-757.
[59] Sultana, B., Anwar, F. and Ashraf, M. (2009). “Effect of Extraction
solvent/technique on the antioxidant activity of selected medicinal plant
extracts.” Molecules 14, 2167-2180.
[60] Cepeda, V., Fuertes, M. A., Castilla, J., Alonso, C., Quevedo, C., Perez, J. M.
(2007). “Biochemical mechanisms of cisplatin cytotoxicity.” Anticancer
Agents Med Chem 7(1), 3-18.
[61] Fayad, W. et al. (2009). "Restriction of cisplatin induction of acute apoptosis to a
subpopulation of cells in a three-dimensional carcinoma culture model."
International Journal of Cancer 125, 2450-2455.
[62] Sergent, C. et al. (2002). "Human colon cancer cells surviving high doses of
cisplatin or oxaliplatin in vitro are not defective in DNA mismatch repair
proteins." Cancer Chemother Pharmacol 49, 445-452.
[63] Amado, N.G. et al. (2014). "Isoquercitrin suppresses colon cancer cell growth in
vitro by tarteting the Wnt/ β-catenin signaling pathway." The Journal of
Biological Chemistry 289, 51: 35456-35467.

31
APPENDIX

32
APPENDIX A

59
1. Fractionation of M. oleifera leaves extracts
Table A.1 Detection of each fraction from fractionation of M. oleifera leaves extract
using UV-spectrophotometer at 260 nm
Fraction no.
n (no dilution) n (1:10 dilution)
1 2 3 Avg 1 2 3 Avg
1 0.000 0.000 0.000 0.000 - - - -
2 0.000 0.000 0.000 0.000 - - - -
3 0.000 0.000 0.000 0.000 - - - -
4 0.000 0.000 0.000 0.000 - - - -
5 0.000 0.000 0.000 0.000 - - - -
6 0.000 0.000 0.000 0.000 - - - -
7 0.000 0.000 0.000 0.000 - - - -
8 0.000 0.000 0.000 0.000 - - - -
9 0.000 0.000 0.000 0.000 - - - -
10 0.000 0.000 0.000 0.000 - - - -
11 0.000 0.000 0.000 0.000 - - - -
12 0.000 0.000 0.000 0.000 - - - -
13 0.000 0.000 0.000 0.000 - - - -
14 0.000 0.000 0.000 0.000 - - - -
15 0.000 0.000 0.000 0.000 - - - -
16 0.000 0.000 0.000 0.000 - - - -
17 0.000 0.000 0.000 0.000 - - - -
18 0.000 0.000 0.000 0.000 - - - -
19 0.000 0.000 0.000 0.000 - - - -
20 0.000 0.000 0.000 0.000 - - - -
21 0.000 0.000 0.000 0.000 - - - -
22 0.001 0.001 0.001 0.001 - - - -
23 0.010 0.011 0.010 0.010 - - - -
24 0.061 0.060 0.060 0.060 - - - -
25 0.353 0.353 0.352 0.353 - - - -
26 0.882 0.882 0.882 0.882 - - - -
27 1.441 1.440 1.439 1.440 0.229 0.228 0.228 0.228
28 1.980 1.988 1.986 1.985 0.288 0.288 0.287 0.288
29 2.621 2.649 2.616 2.629 0.358 0.358 0.357 0.358

60
Table A.1 Detection of each fraction from fractionation of M. oleifera leaves extract
using UV-spectrophotometer at 260 nm (continued)
Fraction no.
n (no dilution) n (1:10 dilution)
1 2 3 Avg 1 2 3 Avg
30 2.873 2.919 2.924 2.905 0.389 0.389 0.388 0.389
31 3.199 3.247 3.226 3.224 0.478 0.476 0.476 0.477
32 3.282 3.339 3.399 3.340 0.543 0.543 0.543 0.543
33 3.240 3.330 3.372 3.314 0.617 0.616 0.615 0.616
34 3.350 3.341 3.409 3.367 0.686 0.686 0.686 0.686
35 3.275 3.238 3.336 3.283 0.784 0.782 0.784 0.783
36 3.286 3.336 3.390 3.337 0.860 0.859 0.860 0.860
37 3.300 3.218 3.359 3.292 0.956 0.956 0.956 0.956
38 3.372 3.342 3.377 3.364 1.036 1.035 1.035 1.035
39 3.317 3.305 3.317 3.313 1.138 1.137 1.136 1.137
40 3.445 3.285 3.324 3.351 1.327 1.326 1.326 1.326
41 3.266 3.377 3.266 3.303 1.299 1.297 1.298 1.298
42 3.301 3.395 3.339 3.345 1.356 1.406 1.431 1.398
43 3.353 3.249 3.361 3.321 1.400 1.432 1.452 1.428
44 3.235 3.252 3.400 3.296 1.294 1.302 1.307 1.301
45 3.237 3.346 3.268 3.284 1.233 1.232 1.231 1.232
46 3.236 3.338 3.243 3.272 1.318 1.312 1.315 1.315
47 3.292 3.390 3.339 3.340 0.972 0.969 0.965 0.969
48 3.298 3.344 3.305 3.316 0.932 0.931 0.927 0.930
49 3.315 3.292 3.311 3.306 0.938 0.929 0.922 0.930
50 3.295 3.296 3.310 3.300 1.003 1.004 1.003 1.003
51 3.205 3.328 3.291 3.275 1.024 1.025 1.024 1.024
52 3.252 3.305 3.420 3.326 0.996 0.995 0.996 0.996
53 3.296 3.353 3.354 3.334 0.965 0.965 0.965 0.965
54 3.223 3.293 3.295 3.270 0.939 0.941 0.940 0.940
55 3.342 3.297 3.256 3.298 1.015 1.016 1.015 1.015
56 3.293 3.374 3.376 3.348 1.083 1.087 1.070 1.080
57 3.239 3.306 3.286 3.277 1.114 1.113 1.114 1.114
58 3.265 3.310 3.226 3.267 1.251 1.251 1.251 1.251
59 3.265 3.210 3.281 3.252 1.343 1.344 1.343 1.343
60 3.270 3.258 3.377 3.302 1.488 1.489 1.490 1.489

61
Table A.1 Detection of each fraction from fractionation of M. oleifera leaves extract
using UV-spectrophotometer at 260 nm (continued)
Fraction no.
n (no dilution) n (1:10 dilution)
1 2 3 Avg 1 2 3 Avg
61 3.240 3.269 3.219 3.243 1.522 1.521 1.521 1.521
62 3.235 3.269 3.292 3.265 1.638 1.637 1.637 1.637
63 3.279 3.339 3.317 3.312 1.565 1.566 1.565 1.565
64 3.276 3.313 3.388 3.326 1.494 1.497 1.495 1.495
65 3.264 3.361 3.353 3.326 1.280 1.271 1.269 1.273
66 3.280 3.388 3.425 3.364 1.063 1.062 1.062 1.062
67 3.253 3.325 3.373 3.317 0.883 0.884 0.883 0.883
68 3.303 3.296 3.320 3.306 0.734 0.728 0.727 0.730
69 3.253 3.227 3.292 3.257 0.661 0.658 0.656 0.658
70 3.264 3.260 3.322 3.282 0.584 0.583 0.581 0.583
71 3.162 3.206 3.212 3.193 0.521 0.519 0.521 0.520
72 3.082 3.085 3.125 3.097 0.474 0.473 0.474 0.474
73 2.830 2.831 2.856 2.839 0.407 0.407 0.407 0.407
74 2.501 2.506 2.497 2.501 0.350 0.350 0.350 0.350
75 2.177 2.183 2.187 2.182 0.320 0.320 0.320 0.320
76 1.986 1.981 1.981 1.983 0.296 0.295 0.295 0.295
77 1.890 1.889 1.890 1.890 0.284 0.284 0.284 0.284
78 1.981 1.978 1.979 1.979 0.292 0.292 0.292 0.292
79 2.319 2.318 2.320 2.319 0.325 0.324 0.323 0.324
80 2.848 2.904 2.919 2.890 0.396 0.396 0.396 0.396
81 3.185 3.192 3.299 3.225 0.494 0.493 0.493 0.493
82 3.217 3.301 3.226 3.248 0.564 0.559 0.554 0.559
83 3.299 3.292 3.227 3.273 0.587 0.587 0.587 0.587
84 3.304 3.300 3.350 3.318 0.557 0.557 0.557 0.557
85 3.158 3.209 3.295 3.221 0.492 0.492 0.492 0.492
86 2.913 2.937 2.941 2.930 0.420 0.419 0.418 0.419
87 2.444 2.460 2.473 2.459 0.338 0.338 0.338 0.338
88 2.134 2.147 2.144 2.142 0.306 0.306 0.306 0.306
89 2.035 2.036 2.035 2.035 0.305 0.305 0.305 0.305
90 2.043 2.037 2.041 2.040 0.301 0.301 0.300 0.301
91 2.037 2.046 2.044 2.042 0.294 0.294 0.294 0.294

62
Table A.1 Detection of each fraction from fractionation of M. oleifera leaves extract
using UV-spectrophotometer at 260 nm (continued)
Fraction no.
n (no dilution) n (1:10 dilution)
1 2 3 Avg 1 2 3 Avg
92 1.956 1.964 1.957 1.959 0.286 0.286 0.286 0.286
93 1.772 1.771 1.773 1.772 0.267 0.267 0.267 0.267
94 1.486 1.486 1.486 1.486 0.238 0.238 0.238 0.238
95 1.187 1.189 1.189 1.188 0.209 0.209 0.209 0.209
96 0.948 0.949 0.949 0.949 - - - -
97 0.803 0.804 0.804 0.804 - - - -
98 0.724 0.722 0.716 0.721 - - - -
99 0.706 0.704 0.699 0.703 - - - -
100 0.699 0.697 0.696 0.697 - - - -
101 0.712 0.711 0.712 0.712 - - - -
102 0.714 0.713 0.714 0.714 - - - -
103 0.690 0.690 0.690 0.690 - - - -
104 0.640 0.641 0.640 0.640 - - - -
105 0.562 0.563 0.563 0.563 - - - -
106 0.470 0.467 0.467 0.468 - - - -
107 0.380 0.379 0.379 0.379 - - - -
108 0.300 0.300 0.300 0.300 - - - -
109 0.242 0.241 0.241 0.241 - - - -
110 0.203 0.203 0.203 0.203 - - - -
111 0.167 0.165 0.165 0.166 - - - -
112 0.151 0.151 0.150 0.151 - - - -
113 0.136 0.135 0.138 0.136 - - - -
114 0.128 0.128 0.128 0.128 - - - -
115 0.126 0.126 0.126 0.126 - - - -
116 0.124 0.124 0.124 0.124 - - - -
117 0.114 0.113 0.114 0.114 - - - -
118 0.106 0.106 0.106 0.106 - - - -
119 0.106 0.101 0.098 0.102 - - - -
120 0.094 0.093 0.093 0.093 - - - -
121 0.097 0.097 0.097 0.097 - - - -
122 0.104 0.104 0.104 0.104 - - - -

63
Table A.1 Detection of each fraction from fractionation of M. oleifera leaves extract
using UV-spectrophotometer at 260 nm (continued)
Fraction no.
n (no dilution) n (1:10 dilution)
1 2 3 Avg 1 2 3 Avg
123 0.096 0.097 0.097 0.097 - - - -
124 0.103 0.099 0.096 0.099 - - - -
125 0.092 0.092 0.092 0.092 - - - -
126 0.085 0.085 0.085 0.085 - - - -
127 0.083 0.083 0.082 0.083 - - - -
128 0.082 0.082 0.082 0.082 - - - -
129 0.077 0.077 0.078 0.077 - - - -
130 0.076 0.076 0.076 0.076 - - - -
131 0.068 0.068 0.068 0.068 - - - -
132 0.069 0.069 0.068 0.069 - - - -
133 0.067 0.067 0.067 0.067 - - - -
134 0.063 0.064 0.064 0.064 - - - -
135 0.062 0.063 0.063 0.063 - - - -
136 0.060 0.060 0.060 0.060 - - - -
137 0.061 0.061 0.061 0.061 - - - -
138 0.059 0.059 0.059 0.059 - - - -
139 0.054 0.055 0.054 0.054 - - - -
140 0.057 0.057 0.057 0.057 - - - -
141 0.055 0.055 0.055 0.055 - - - -
142 0.056 0.056 0.056 0.056 - - - -
2. Determination of pooled fractions yield from fractionation
% Yield of pooled fraction = W1 x 100%
W0
W1 = the weight of pooled fraction after dryness
W0 = the weight of the initial dried M. oleifera leaves extract (1 g)

64
3. Cytotoxicity evaluation using WST-1 assay
Table A.2 The percentage of cell viability of MOL1 on HCT116 cells at 24 h.
n Concentration (µg/ml)
control DMSO* Cisplatin* 50 100 250 500
1 95.25 111.16 89.78 104.20 102.96 100.72 53.97
2 113.40 102.46 109.75 115.56 120.20 106.52 59.93
3 91.35 100.39 89.86 114.56 124.10 111.58 65.24
Avg 100.00 104.67 96.46 111.44 115.75 106.27 59.71
SD 11.77 5.72 11.51 6.29 11.25 5.43 5.64
*0.5% of DMSO as a negative control and 100 µg/ml of cisplatin as a positive control
Table A.3 The percentage of cell viability of MOL2 on HCT116 cells at 24 h.
n Concentration (µg/ml)
control DMSO* Cisplatin* 1 5 10 25 50
1 95.25 111.16 89.78 126.42 135.04 135.78 73.94 64.41
2 113.4 102.46 109.75 148.63 117.38 123.10 65.82 62.17
3 91.35 100.39 89.86 124.18 137.03 139.76 83.56 54.13
Avg 100 104.67 96.46 133.08 129.81 132.88 74.44 60.24
SD 11.77 5.72 11.51 13.52 10.81 8.70 8.88 5.41
*0.5% of DMSO as a negative control and 100 µg/ml of cisplatin as a positive control
Table A.4 The percentage of cell viability of MOL3 on HCT116 cells at 24 h.
n Concentration (µg/ml)
control DMSO* Cisplatin* 1 5 10 25 50
1 95.25 111.16 89.78 110.91 126.91 107.27 41.86 33.49
2 113.4 102.46 109.75 105.61 99.72 107.85 34.32 30.92
3 91.35 100.39 89.86 115.56 123.43 99.64 35.56 27.02
Avg 100 104.67 96.46 110.69 116.69 104.92 37.25 30.48
SD 11.77 5.72 11.51 4.98 14.80 4.58 4.04 3.26
*0.5% of DMSO as a negative control and 100 µg/ml of cisplatin as a positive control

65
Table A.5 The percentage of cell viability of MOL4 on HCT116 cells at 24 h.
n Concentration (µg/ml)
control DMSO* Cisplatin* 1 5 10 25 50
1 95.25 111.16 89.78 125.01 66.48 46.50 34.73 34.90
2 113.4 102.46 109.75 133.63 78.25 52.89 35.89 31.00
3 91.35 100.39 89.86 134.04 78.75 45.84 37.39 30.67
Avg 100 104.67 96.46 130.89 74.50 48.41 36.00 32.19
SD 11.77 5.72 11.51 5.10 6.94 3.89 1.33 2.35
*0.5% of DMSO as a negative control and 100 µg/ml of cisplatin as a positive control
Table A.6 The percentage of cell viability of MOL1 on HCT116 cells at 48 h.
n Concentration (µg/ml)
control DMSO* Cisplatin* 50 100 250 500
1 95.91 95.12 96.13 94.95 109.97 91.41 40.49
2 96.30 95.34 103.12 92.81 99.67 99.62 60.18
3 107.79 98.31 78.83 93.03 109.10 98.31 56.08
Avg 100.00 96.26 92.69 93.59 106.25 96.45 52.25
SD 6.75 1.78 12.50 1.18 5.72 4.41 10.39
*0.5% of DMSO as a negative control and 100 µg/ml of cisplatin as a positive control
Table A.7 The percentage of cell viability of MOL2 on HCT116 cells at 48 h.
n Concentration (µg/ml)
control DMSO* Cisplatin* 1 5 10 25 50
1 95.91 95.12 96.13 105.87 103.55 108.49 93.38 57.52
2 96.30 95.34 103.12 122.86 99.27 104.95 92.68 57.61
3 107.79 98.31 78.83 94.29 91.93 114.69 107.83 41.10
Avg 100.00 96.26 92.69 107.67 98.25 109.38 97.96 52.07
SD 6.75 1.78 12.50 14.37 5.88 4.93 8.56 9.51
*0.5% of DMSO as a negative control and 100 µg/ml of cisplatin as a positive control

66
Table A.8 The percentage of cell viability of MOL3 on HCT116 cells at 48 h.
n Concentration (µg/ml)
control DMSO* Cisplatin* 1 5 10 25 50
1 95.91 95.12 96.13 117.31 111.41 110.85 44.46 25.68
2 96.30 95.34 103.12 95.87 92.11 123.99 48.65 15.16
3 107.79 98.31 78.83 105.87 85.43 109.80 55.99 39.87
Avg 100.00 96.26 92.69 106.35 96.32 114.88 49.70 26.90
SD 6.75 1.78 12.50 10.73 13.49 7.91 5.84 12.41
*0.5% of DMSO as a negative control and 100 µg/ml of cisplatin as a positive control.
Table A.9 The percentage of cell viability of MOL4 on HCT116 cells at 48 h.
n Concentration (µg/ml)
control DMSO* Cisplatin* 1 5 10 25 50
1 95.91 95.12 96.13 114.03 52.89 43.11 25.37 16.25
2 96.30 95.34 103.12 102.72 48.65 38.13 35.25 22.97
3 107.79 98.31 78.83 107.18 41.45 18.87 28.00 17.08
Avg 100.00 96.26 92.69 107.98 47.66 33.37 29.54 18.77
SD 6.75 1.78 12.50 5.70 5.79 12.80 5.11 3.67
*0.5% of DMSO as a negative control and 100 µg/ml of cisplatin as a positive control.
Table A.10 The percentage of cell viability of MOL1 on NHF cells at 24 h.
n Concentration (µg/ml)
control DMSO* Cisplatin* 10 25 50 75 100 250 500
1 103.82 90.78 98.00 79.51 77.53 81.45 75.95 81.22 92.81 94.93
2 104.63 89.70 97.23 79.42 74.46 75.99 76.94 80.59 87.31 87.58
3 91.55 91.37 95.48 82.89 84.88 83.16 88.44 82.76 88.53 91.46
Avg 100.00 90.62 96.90 80.61 78.95 80.20 80.44 81.52 89.55 91.33
SD 7.33 0.85 1.29 1.98 5.35 3.74 6.94 1.11 2.89 3.68
*0.5% of DMSO as a negative control and 100 µg/ml of cisplatin as a positive control.

67
Table A.11 The percentage of cell viability of MOL2 on NHF cells at 24 h.
n Concentration (µg/ml)
control DMSO* Cisplatin* 10 25 50 75 100 250 500
1 103.82 90.78 98.00 80.77 81.45 75.63 69.59 47.94 41.22 22.46
2 104.63 89.70 97.23 81.72 78.70 82.76 78.52 67.65 42.62 22.73
3 91.55 91.37 95.48 73.11 81.67 77.07 74.46 61.83 42.53 23.63
Avg 100.00 90.62 96.90 78.53 80.61 78.49 74.19 59.14 42.12 22.94
SD 7.33 0.85 1.29 4.72 1.66 3.77 4.47 10.13 0.78 0.61
*0.5% of DMSO as a negative control and 100 µg/ml of cisplatin as a positive control.
Table A.12 The percentage of cell viability of MOL3 on NHF cells at 24 h.
n Concentration (µg/ml)
control DMSO* Cisplatin* 10 25 50 75 100 250 500
1 103.82 90.78 98.00 77.03 79.96 63.27 38.06 19.75 18.36 16.51
2 104.63 89.70 97.23 81.63 84.70 63.45 36.76 20.79 17.63 15.74
3 91.55 91.37 95.48 81.45 78.83 70.26 41.85 23.05 18.49 17.32
Avg 100.00 90.62 96.90 80.04 81.16 65.66 38.89 21.20 18.16 16.52
SD 7.33 0.85 1.29 2.61 3.11 3.98 2.65 1.68 0.46 0.79
*0.5% of DMSO as a negative control and 100 µg/ml of cisplatin as a positive control.
Table A.13 The percentage of cell viability of MOL4 on NHF cells at 24 h.
n Concentration (µg/ml)
control DMSO* Cisplatin* 10 25 50 75 100 250 500
1 103.82 90.78 98.00 79.65 40.50 20.11 17.99 18.17 19.03 17.90
2 104.63 89.70 97.23 80.55 39.87 21.65 18.08 17.27 19.17 17.41
3 91.55 91.37 95.48 87.09 41.13 23.72 20.66 18.27 18.90 20.11
Avg 100.00 90.62 96.90 82.43 40.50 21.83 18.91 17.90 19.03 18.48
SD 7.33 0.85 1.29 4.06 0.63 1.81 1.51 0.55 0.14 1.44
*0.5% of DMSO as a negative control and 100 µg/ml of cisplatin as a positive control.
Table A.14 The percentage of cell viability of MOL1 on NHF cells at 48 h.
n Concentration (µg/ml)
control DMSO* Cisplatin* 10 25 50 75 100 250 500
1 119.65 109.18 87.09 122.93 86.26 74.18 70.78 81.63 108.22 124.79
2 94.16 102.76 118.75 99.81 99.23 93.32 94.99 76.17 89.53 88.57
3 86.19 87.80 89.79 83.49 90.56 74.31 82.47 77.07 92.68 127.36
Avg 100.00 99.91 98.54 102.08 92.01 80.60 82.74 78.29 96.81 113.57
SD 17.48 10.97 17.55 19.82 6.61 11.01 12.11 2.93 10.01 21.69
*0.5% of DMSO as a negative control and 100 µg/ml of cisplatin as a positive control.

68
Table A.15 The percentage of cell viability of MOL2 on NHF cells at 48 h.
n Concentration (µg/ml)
control DMSO* Cisplatin* 10 25 50 75 100 250 500
1 119.65 109.18 87.09 79.58 76.17 56.65 52.47 29.80 24.28 27.75
2 94.16 102.76 118.75 77.26 72.90 69.69 46.95 37.32 26.27 25.05
3 86.19 87.80 89.79 83.24 76.49 61.01 48.23 28.39 22.29 22.22
Avg 100.00 99.91 98.54 80.03 75.19 62.45 49.22 31.83 24.28 25.01
SD 17.48 10.97 17.55 3.01 1.99 6.64 2.89 4.80 1.99 2.76
*0.5% of DMSO as a negative control and 100 µg/ml of cisplatin as a positive control.
Table A.16 The percentage of cell viability of MOL3 on NHF cells at 48 h.
n Concentration (µg/ml)
control DMSO* Cisplatin* 10 25 50 75 100 250 500
1 119.65 109.18 87.09 95.50 121.71 42.58 22.03 22.67 23.76 19.40
2 94.16 102.76 118.75 94.93 101.80 40.33 21.00 25.11 22.41 19.78
3 86.19 87.80 89.79 90.69 98.59 50.67 24.34 20.87 23.31 20.55
Avg 100.00 99.91 98.54 93.71 107.36 44.53 22.46 22.89 23.16 19.91
SD 17.48 10.97 17.55 2.63 12.53 5.44 1.71 2.13 0.69 0.59
*0.5% of DMSO as a negative control and 100 µg/ml of cisplatin as a positive control.
Table A.17 The percentage of cell viability of MOL4 on NHF cells at 48 h.
n Concentration (µg/ml)
control DMSO* Cisplatin* 10 25 50 75 100 250 500
1 119.65 109.18 87.09 103.85 33.20 21.84 21.32 26.72 19.33 19.72
2 94.16 102.76 118.75 83.88 35.13 20.68 22.41 24.98 19.91 19.27
3 86.19 87.80 89.79 79.25 36.16 20.94 20.68 23.70 19.08 18.69
Avg 100.00 99.91 98.54 89.00 34.83 21.15 21.47 25.13 19.44 19.23
SD 17.48 10.97 17.55 13.07 1.50 0.61 0.88 1.51 0.43 0.52
*0.5% of DMSO as a negative control and 100 µg/ml of cisplatin as a positive control.

69
4. Cytotoxicity evaluation using MTT assay
Table A.18 The percentage of cell viability of astragalin on HCT116 cells at 24 h.
n Concentration (µΜ)
control DMSO* Adriamycin* 25 50 75 100 500
1 102.165 105.848 46.042 99.548 103.328 106.042 116.995 101.002 2 99.160 101.874 39.160 109.435 110.307 108.078 109.725 117.383 3 98.675 96.543 33.538 105.460 108.271 102.359 118.158 92.181
Avg 100.000 101.422 39.580 104.814 107.302 105.493 114.960 103.522 SD 1.890 4.669 6.263 4.975 3.589 2.899 4.570 12.789
*0.5% of DMSO as a negative control and 0.5 µg/ml of adriamycin as a positive control.
Table A.19 The percentage of cell viability of kaempferol on HCT116 cells at 24 h.
n Concentration (µΜ)
control DMSO* Adriamycin* 25 50 100 200 500
1 101.124 87.828 79.963 70.225 98.127 83.333 46.816 32.772 2 107.303 75.094 86.704 101.685 88.202 75.281 60.674 45.880 3 91.573 82.022 54.869 93.071 79.775 72.097 39.139 76.217
Avg 100.000 81.648 73.845 88.327 88.702 76.904 48.876 51.623 SD 7.925 6.375 16.776 16.258 9.186 5.791 10.915 22.285
*0.5% of DMSO as a negative control and 0.5 µg/ml of adriamycin as a positive control.
Table A.20 The percentage of cell viability of isoquercetin on HCT116 cells at 24 h.
n Concentration (µΜ)
control DMSO* Cisplatin* 25 50 75 150 200
1 99.830 96.657 91.446 96.617 63.981 66.331 57.046 58.104 2 91.798 101.084 79.104 102.063 63.589 57.634 48.387 51.091 3 108.371 97.754 89.604 105.786 71.542 56.732 51.796 62.374
Avg 100.000 98.498 86.718 101.489 66.371 60.232 52.410 54.597 SD 8.288 2.306 6.658 4.611 4.483 5.301 4.362 4.959
*0.5% of DMSO as a negative control and 100 µg/ml of cisplatin as a positive control.

70
Table A.21 The percentage of cell viability of astragalin on HCT116 cells at 48 h.
n Concentration (µΜ)
control DMSO* Cisplatin* 25 50 75 100 500
1 97.757 99.595 85.596 106.736 100.992 100.992 108.056 85.234 2 96.697 100.992 83.836 101.768 109.557 103.502 108.056 85.596 3 105.546 99.595 94.394 103.502 104.485 104.485 105.546 89.426
Avg 100.000 100.060 87.942 104.002 105.011 102.993 107.219 86.752 SD 4.832 0.807 5.656 2.522 4.307 1.801 1.449 2.323
*0.5% of DMSO as a negative control and 100 µg/ml of cisplatin as a positive control.
Table A.22 The percentage of cell viability of kaempferol on HCT116 cells at 48 h.
n Concentration (µΜ)
control DMSO* Cisplatin* 25 50 100 200 500
1 101.648 101.019 36.848 99.041 79.898 61.654 32.355 6.201 2 104.434 102.367 42.061 103.355 107.669 77.561 42.241 6.561 3 93.919 95.986 31.995 90.503 70.012 67.136 28.760 5.752
Avg 100.000 99.790 36.968 97.633 85.860 68.784 34.452 6.171 SD 5.448 3.363 5.034 6.541 19.524 8.081 6.981 0.405
*0.5% of DMSO as a negative control and 100 µg/ml of cisplatin as a positive control.
Table A.23 The percentage of cell viability of isoquercetin on HCT116 cells at 48 h.
n Concentration (µΜ)
control DMSO* Cisplatin* 25 50 75 150 200
1 99.331 102.340 73.438 14.605 7.380 9.617 10.183 7.174 2 104.217 98.714 77.064 12.754 8.974 7.945 10.003 6.917 3 96.452 93.006 73.181 15.582 11.365 11.211 11.031 6.223
Avg 100.000 98.020 74.561 14.314 9.240 9.591 10.405 7.046 SD 3.926 4.706 2.171 1.437 2.006 1.633 0.549 0.182
*0.5% of DMSO as a negative control and 100 µg/ml of cisplatin as a positive control.
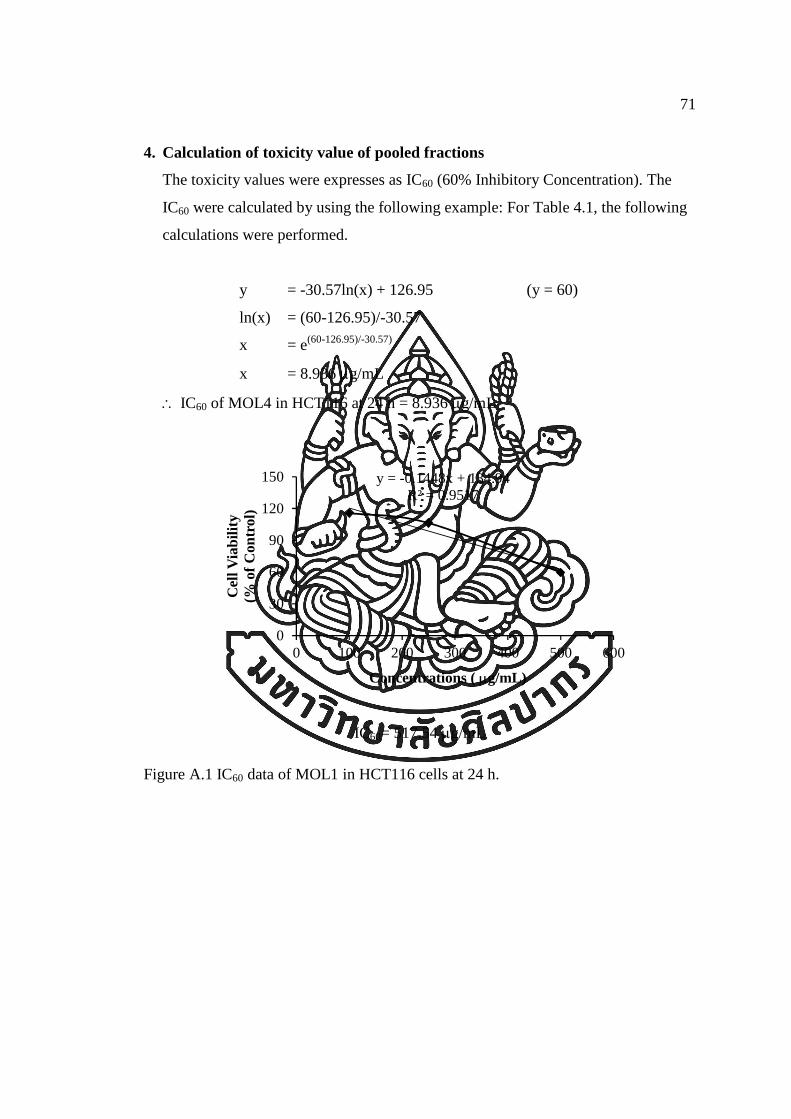
71
4. Calculation of toxicity value of pooled fractions
The toxicity values were expresses as IC60 (60% Inhibitory Concentration). The
IC60 were calculated by using the following example: For Table 4.1, the following
calculations were performed.
y = -30.57ln(x) + 126.95 (y = 60)
ln(x) = (60-126.95)/-30.57
x = e(60-126.95)/-30.57)
x = 8.936 µg/mL
∴ IC60 of MOL4 in HCT116 at 24 h = 8.936 µg/mL
y = -0.1448x + 134.94R² = 0.9517
0
30
60
90
120
150
0 100 200 300 400 500 600
Cel
l Via
bilit
y(%
of C
ontro
l)
Concentrations ( µg/mL)
IC60= 517.54 µg/mL
Figure A.1 IC60 data of MOL1 in HCT116 cells at 24 h.

72
y = -46.11ln(x) + 234.18R² = 0.9348
0
30
60
90
120
150
0 10 20 30 40 50 60
Cel
l Via
bilit
y(%
of C
ontr
ol)
Concentrations (µg/mL)
IC60 = 43.799 µg/mL
Figure A.2 IC60 data of MOL2 in HCT116 cells at 24 h.
y = -42.42ln(x) + 189.44R² = 0.919
0
30
60
90
120
150
0 10 20 30 40 50 60
Cel
l Via
bilit
y(%
of C
ontr
ol)
Concentrations ( µg/mL)
IC60 = 21.145 µg/mL
Figure A.3 IC60 data of MOL3 in HCT116 cells at 24 h.

73
y = -30.57ln(x) + 126.95R² = 0.9722
0
30
60
90
120
150
0 5 10 15 20 25 30
Cel
l Via
bilit
y(%
of C
ontr
ol)
Concentrations (µg/mL)
IC60 = 8.936 µg/mL
Figure A.4 IC60 data of MOL4 in HCT116 cells at 24 h.
y = -33.3ln(x) + 106.42R² = 0.9865
0
30
60
90
120
150
0 2 4 6 8 10 12
Cel
l Via
bilit
y(%
of C
ontro
l)
Concentrations (µg/mL)
IC60 = 106.19 µg/mL
Figure A.5 IC60 data of MOL2 in NHF cells at 24 h.

74
y = -0.8267x + 103.4R² = 0.9898
0
30
60
90
120
150
0 20 40 60 80 100 120
Cel
l Via
bilit
y(%
of C
ontro
l)
Concentrations ( µg/mL)
IC60= 52.498 µg/mL
Figure A.6 IC60 data of MOL3 in NHF cells at 24 h.
y = -38.08ln(x) + 167.98R² = 0.981
0
30
60
90
120
150
0 10 20 30 40 50 60
Cel
l Via
bilit
y(%
of C
ontro
l)
Concentrations (µg/mL)
IC60 = 17.041 µg/mL
Figure A.7 IC60 data of MOL4 in NHF cells at 24 h.

75
y = -0.1393x + 124.44R² = 0.9569
0
30
60
90
120
150
0 100 200 300 400 500 600
Cel
l Via
bilit
y(%
of C
ontr
ol)
Concentrations ( µg/mL)
IC60 = 462.600 µg/mL
Figure A.8 IC60 data of MOL1 in HCT116 cells at 48 h.
y = -1.4736x + 128.22R² = 0.964
0
30
60
90
120
150
0 20 40 60
Cel
l Via
bilit
y(%
of C
ontro
l)
Concentrations ( µg/mL)
IC60 = 46.290 µg/mL
Figure A.9 IC60 data of MOL2 in HCT116 cells at 48 h.
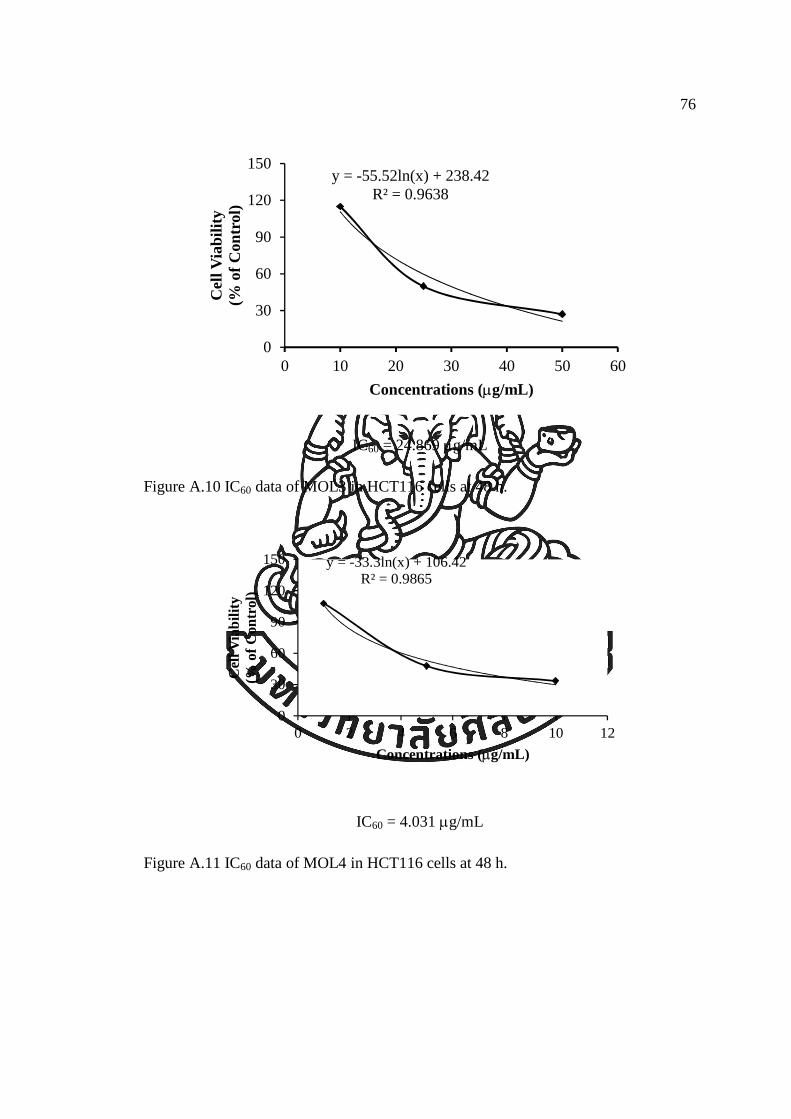
76
y = -55.52ln(x) + 238.42R² = 0.9638
0
30
60
90
120
150
0 10 20 30 40 50 60
Cel
l Via
bilit
y(%
of C
ontr
ol)
Concentrations (µg/mL)
IC60 = 24.869 µg/mL
Figure A.10 IC60 data of MOL3 in HCT116 cells at 48 h.
y = -33.3ln(x) + 106.42R² = 0.9865
0
30
60
90
120
150
0 2 4 6 8 10 12
Cel
l Via
bilit
y(%
of C
ontr
ol)
Concentrations (µg/mL)
IC60 = 4.031 µg/mL
Figure A.11 IC60 data of MOL4 in HCT116 cells at 48 h.

77
y = -0.5358x + 87.606R² = 0.9893
0
30
60
90
120
150
0 20 40 60 80 100 120
Cel
l Via
bilit
y(%
of C
ontro
l)
Concentrations ( µg/mL)
IC60 = 51.52 µg/mL
Figure A.12 IC60 data of MOL2 in NHF cells at 48 h.
y = -1.1085x + 103.45R² = 0.993
0
30
60
90
120
150
0 20 40 60 80
Cel
l Via
bilit
y(%
of C
ontro
l)
Concentrations ( µg/mL)
IC60 = 39.197 µg/mL
Figure A.13 IC60 data of MOL3 in NHF cells at 48 h.

78
y = -43.04ln(x) + 183.67R² = 0.9379
0
30
60
90
120
150
0 10 20 30 40 50 60
Cel
l Via
bilit
y(%
of C
ontro
l)
Concentrations ( µg/mL)
IC60 = 17.697 µg/mL
Figure A.14 IC60 data of MOL4 in NHF cells at 48 h.
y = -0.2917x + 120.06R² = 0.9712
0
30
60
90
120
150
0 100 200 300
Cel
l Via
bilit
y(%
of C
ontr
ol)
Concentrations (µM)
Figure A.15 IC60 data of kaempferol in HCT116 cells at 24 h.
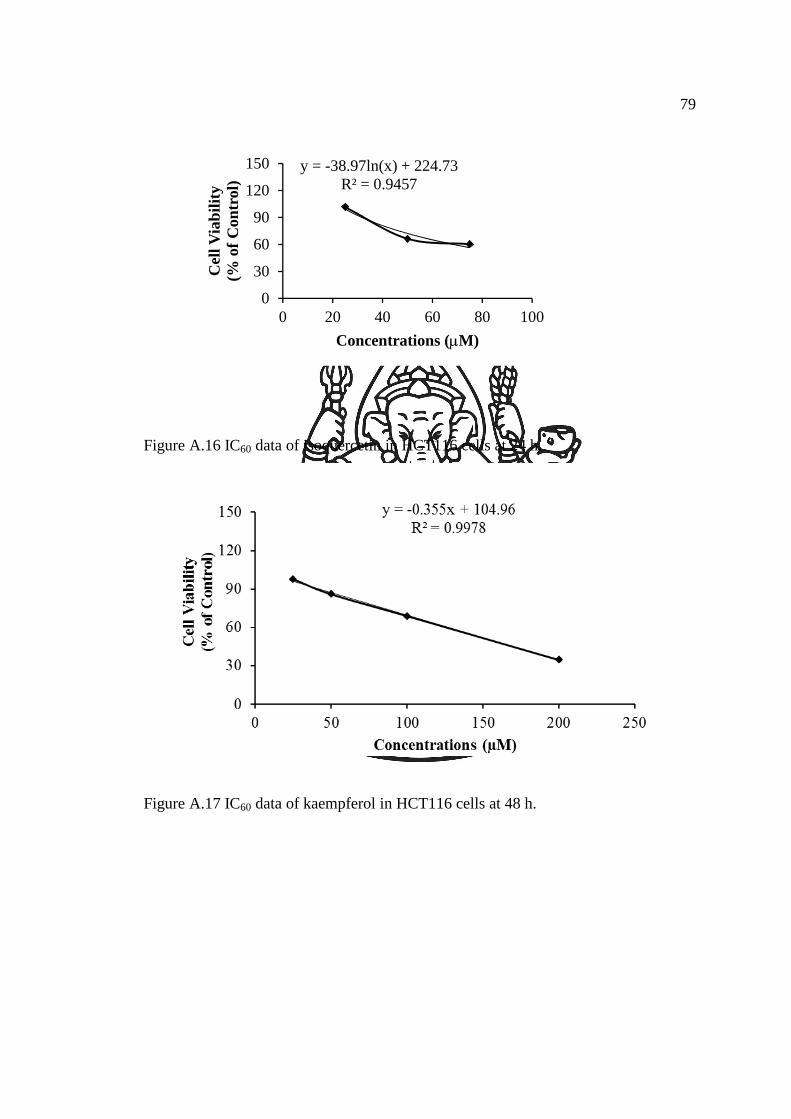
79
y = -38.97ln(x) + 224.73R² = 0.9457
0
30
60
90
120
150
0 20 40 60 80 100
Cel
l Via
bilit
y(%
of C
ontr
ol)
Concentrations (µM)
Figure A.16 IC60 data of isoquercetin in HCT116 cells at 24 h.
Figure A.17 IC60 data of kaempferol in HCT116 cells at 48 h.

80
y = 77.799e-0.048x
R² = 0.8824
0
30
60
90
120
150
0 10 20 30 40 50 60
Cel
l Via
bilit
y(%
of C
ontr
ol)
Concentrations (µM)
Figure A.18 IC60 data of isoquercetin in HCT116 cells at 48 h.
5. Calculation of protein amount of each treatment
Plot a calibration graph using absorbance values at 550 nm and concentration of
protein standard or BSA. Note that the zero protein (dye only) value should be
included as a data point.
y = 0.0615x + 0.3504R² = 0.9789
0.000
0.200
0.400
0.600
0.800
0 1 2 3 4 5
Abs
orba
nce
(550
nm
)
BSA (µg/µL)
Figure A.19 Standard curve of BSA
81
Calculate the concentration of the unknown sample base on the linear equation of the
calibration curve (Fig. A 19).
The amount of protein was calculated by using the following example:
y = 0.0615x + 0.3504 (y = 0.607 or absorbance of unknown protein)
0.607 = 0.0615x + 0.3504
x = (0.607 – 0.3504)/0.0615
x = 4.172 µg/µL
Amount of unknow protein = 4.172 µg/µL

82
6. Calculation of relative protein expression values of each treatment The relative protein expressions values were analyzed using ImageJ software and
calculated follow this equation;
Relative protein expression = pERK protein level
Total tubulin protein level
Table A 24 The relative protein expression values (pERK1/2) from Image J analysis.
Treatment pERk1/2 level Tubulin level Relative protein expression
24 hr 48 hr 24 hr 48 hr 24 hr 48 hr
Control
Cisplatin
MOL1-750
MOL1-517
MOL1-258
15.099
-
5.112
10.703
15.289
18.399
11.801
4.762
12.12
6.714
14.825
-
10.302
10.969
14.115
10.022
14.384
11.733
8.366
5.283
1.018
-
0.496
0.976
1.083
1.836
0.820
0.406
1.449
1.271
Control
MOL2-88
MOL2-44
MOL2-22
14.882
0
26.296
22.411
10.307
0
11.431
14.673
9.939
10.805
16.892
16.868
9.034
14.139
14.098
8.226
1.497
0.000
1.557
1.329
1.141
0.000
0.811
1.784
Control
MOL3-43
MOL3-21
MOL3-11
42.54
0
0
0
41.579
0
15.881
0
10.863
4.768
18.274
13.461
19.655
13.119
10.613
9.247
3.916
0.000
0.000
0.000
2.115
0.000
1.496
0.000
Control
Cisplatin
MOL2-18
MOL2-9
MOL2-4.5
24.558
25.561
0
0
0
49.881
-
0
0
0
13.44
15.622
14.814
15.746
9.808
10.714
-
2.665
7.616
9.576
1.827
1.636
0.000
0.000
0.000
4.656
-
0.000
0.000
0.000
Control
Isoq.-11
Isoq.-5.5
Isoq.-2.7
4.56
5.27
3.289
6.959
12.833
32.665
14.19
20.234
6.442
6.475
9.4
11.269
19.318
23.09
12.899
11.108
0.708
0.814
0.350
0.618
0.664
1.415
1.100
1.822

APPENDIX B

84
BUFFER FORMULAR
Table 10x Phosphate buffer saline (PBS)
Component Amount
NaCl 80 g
KCl 2 g
Na2HPO4.7H2O 21.7 g
KH2PO4 2 g
dH2O q.s to 1,000 mL
Store at room temperature.
Table 10x Sample loading buffer
Component Amount
β-mercaptomethanol 5 mL
Glycerol 5 mL
Bromophenol blue 0.02%
Store at -20 °C protected from light.
Table 10x SDS PAGE Running buffer
Component Amount
Tris base 30.3 g
SDS 10 g
Glycine 144.1 g
dH2O q.s to 1,000 mL
Store at room temperature.
Table 10x Transfer buffer (pH 7.0)
Component Amount
Glycine 288 g
Tris 60.4 g
dH2O q.s to 1,000 mL
Store at 4 °C.

85
Table 1x Transfer buffer
Component Amount
10x Transfer buffer 100 mL
EtOH 200 mL
dH2O q.s to 1,000 mL
Store at 4 °C.
Table 5x Tris buffer saline (TBS) (pH 7)
Component Amount
Tris 6.057 g
NaCl 87.66 g
dH2O q.s to 1,000 mL
Store at room temperature.
Table 1x Tris buffer saline-tween (TBS-T)
Component Amount
1x TBS 40 mL
Tween-20 0.2 mL
dH2O q.s to 200 mL
Store at room temperature.
Table 5% BSA/Tris buffer saline-tween (BSA/TBS-T)
Component Amount
BSA 2.5 g
1x TBS-T q.s to 50 mL
Store at 4 °C.

86
BIOGRAPHY
Name Jintana Tragulpakseerojn, Miss
Date of Birth Jauary 11, 1985
Place of Birth Ratchaburi, Thailand
Education
2012-2016 Doctor of Philosophy, Ph.D. in Biopharmaceutical
Sciences, Silpakorn University, Thailand
2008-2009 Master of Science in Pharmaceutical Sciences of
Pharmacy, Silpakorn University, Thailand
2001-2005 Bachelor of Science in Microbiology, Silpakorn University,
Thailand
Work experience
2006-2007 Research assistance at Pharmacy, Silpakorn University,
Thailand
2010-2011 Research assistance at Pharmacy, Silpakorn University,
Thailand
Presentation
Poster
1. Jintana Tragulpakseerojn, Perayot Pamonsinlapatham, Chavalit
Sithisombut, and Auayporn Apirakaramwong. “Effect of Moringa oleifera
L. extracts on in vitro colony formation of human tumor cells.” The 4th
International Conference on Natural Products for Health and Beauty
(NATPRO4), 28th – 30th Nov 2012, Chiang Mai, Thailand.
2. Jintana Tragulpakseerojn, Perayot Pamonsinlapatham, Penpun
Wetwitayaklung, Nopparat Nuntharatanapong, and Auayporn
Apirakaramwong. “The effect of Moringa oleifera ethanolic leaf extract
and its 2 major active components on colon cancer cell viability.” The 6th
International Conference on Natural Products for Health and Beauty
(NATPRO6), 21st – 23rd Jan 2016, Khon Kaen, Thailand.

87
Scientific Publication:
1. Jintana Tragulpakseerojn, Perayot Pamonsinlapatham, Penpun
Wetwitayaklung, Tatsuro Yoneyama, Naoki Ishikawa, Masami Ishibashi,
Naoto Yamaguchi and Auayporn Apirakaramwong. Anti-proliferative effect
of Moringa oleifera leaf extract on human colon cancer HCT116 cell line.
Tropical Journal of Pharmaceutical Research. 2017; 16(2).