Effect of milk pasteurization on lipolysis during ripening ...
13
HAL Id: hal-00895429 https://hal.archives-ouvertes.fr/hal-00895429 Submitted on 1 Jan 2000 HAL is a multi-disciplinary open access archive for the deposit and dissemination of sci- entific research documents, whether they are pub- lished or not. The documents may come from teaching and research institutions in France or abroad, or from public or private research centers. L’archive ouverte pluridisciplinaire HAL, est destinée au dépôt et à la diffusion de documents scientifiques de niveau recherche, publiés ou non, émanant des établissements d’enseignement et de recherche français ou étrangers, des laboratoires publics ou privés. Effect of milk pasteurization on lipolysis during ripening of ovine cheese manufactured at different times of the year Felisa Chávarri, M. Angeles Bustamante, Arantza Santisteban, Mailo Virto, Marta Albisu, Luis Barrón, Mertxe de Renobales To cite this version: Felisa Chávarri, M. Angeles Bustamante, Arantza Santisteban, Mailo Virto, Marta Albisu, et al.. Effect of milk pasteurization on lipolysis during ripening of ovine cheese manufactured at different times of the year. Le Lait, INRA Editions, 2000, 80 (4), pp.433-444. 10.1051/lait:2000136. hal- 00895429
Transcript of Effect of milk pasteurization on lipolysis during ripening ...

HAL Id: hal-00895429https://hal.archives-ouvertes.fr/hal-00895429
Submitted on 1 Jan 2000
HAL is a multi-disciplinary open accessarchive for the deposit and dissemination of sci-entific research documents, whether they are pub-lished or not. The documents may come fromteaching and research institutions in France orabroad, or from public or private research centers.
L’archive ouverte pluridisciplinaire HAL, estdestinée au dépôt et à la diffusion de documentsscientifiques de niveau recherche, publiés ou non,émanant des établissements d’enseignement et derecherche français ou étrangers, des laboratoirespublics ou privés.
Effect of milk pasteurization on lipolysis during ripeningof ovine cheese manufactured at different times of the
yearFelisa Chávarri, M. Angeles Bustamante, Arantza Santisteban, Mailo Virto,
Marta Albisu, Luis Barrón, Mertxe de Renobales
To cite this version:Felisa Chávarri, M. Angeles Bustamante, Arantza Santisteban, Mailo Virto, Marta Albisu, et al..Effect of milk pasteurization on lipolysis during ripening of ovine cheese manufactured at differenttimes of the year. Le Lait, INRA Editions, 2000, 80 (4), pp.433-444. �10.1051/lait:2000136�. �hal-00895429�

Original article
Effect of milk pasteurizationon lipolysis during ripening of ovine cheesemanufactured at different times of the year
Felisa CHÁVARRIa, M. Angeles BUSTAMANTEa,Arantza SANTISTEBANa, Mailo VIRTOa, Marta ALBISUb,
Luis J.R. BARRÓNc, Mertxe DE RENOBALESa*
a Bioquímica y Biología Molecular, Facultad de Farmacia, Universidad del País Vasco /Euskal Herriko Unibertsitatea, Aptdo. 450, 01080 Vitoria-Gasteiz, Spain
b Nutrición y Bromatología, Facultad de Farmacia, Universidad del País Vasco /Euskal Herriko Unibertsitatea, Aptdo. 450, 01080 Vitoria-Gasteiz, Spain
c Tecnología de Alimentos, Facultad de Farmacia, Universidad del País Vasco /Euskal Herriko Unibertsitatea, Aptdo. 450, 01080 Vitoria-Gasteiz, Spain
(Received 30 July 1999; accepted 24 January 2000)
Abstract — Lipolysis was studied in cheeses manufactured with pasteurized and raw ovine milk witha starter culture added in winter, spring and summer, up to 180 d of ripening. Pasteurized milkcheeses had significantly lower levels of lipolysis than raw milk cheeses in winter after 180 d ofripening and in spring both after 90 and 180 d of ripening. The relative amounts of individual FFAafter 180 d of ripening changed from winter to summer, both in pasteurized and in raw milk cheeses.In pasteurized milk cheeses made in winter the predominant FFA were C18:1 (2152 ± 386 µmol.kg–1),C4 (1954 ± 354 µmol.kg–1), C16 (1541 ± 406 µmol.kg–1) and C10 (1452 ± 188 µmol.kg–1). In con-trast, in pasteurized milk cheeses made in summer C16 (2860 ± 1305 µmol.kg–1) and C18:1 (2677 ±973 µmol.kg–1) were the major FFA. The percent FFA composition of both types of cheeses changedduring ripening: short-chain (C4 to C10) FFA increased from approximately 25% to approximately40 to 45%, whereas long chain (≥ C16:0) FFA decreased from approximately 55% to approximately40 to 45% in winter and spring. However, in both types of cheese made in summer long chain FFArepresented 52% and volatile FFA represented approximately 28 to 32% of the total after 180 ripen-ing days. Milk pasteurization reduced the levels of acetic acid by 99% after 90 ripening days at thethree times of the year studied.
ovine milk cheese / pasteurized milk cheese / season / cheese ripening / lipolysis
Lait 80 (2000) 433–444 433© INRA, EDP Sciences
* Correspondence and reprintsTel.: (34) 945 013097; fax: (34) 945 130756; e-mail: [email protected]

F. Chávarri et al.
1. INTRODUCTIONPasteurization introduces several changes
in the milk which can certainly modify thecharacteristics of the cheese made with it.In addition to the well-known reduction ofmesophilic aerobic organisms, it inactivatesor decreases the activity of milk lipoproteinlipase and other milk enzymes [2, 12, 19]while activating plasmin [15]. Many wheyproteins are denatured favouring their inter-action with κ-casein [24] which, in turn,does not readily interact with chymosin [25],thus increasing rennetting time. Milk pas-teurization also increases cheese yield [36].Because most cheeses are manufacturedwith either pasteurized or raw milk, com-parisons between pasteurized and raw milkcheeses of the same type are not frequentlyreported. Furthermore, the influence of milkpasteurization on lipolysis has not been wellcharacterized. Milk pasteurization affectsboth proteolytic [23] and lipolytic processes[17, 29, 38] in different manners whichapparently do not depend on the origin ofthe milk used. Reduced levels of lipolysishave been reported in both a bovine cheesesuch as Cheddar [29] and in an ovine cheese
like Manchego [17] when compared to thecorresponding cheeses manufactured withraw milk. In contrast, in the Portuguese Serracheese manufactured with ovine milk andplant coagulant, pasteurization increased thelevels of lipolysis [38]. In any case, as aresult of milk pasteurization, flavour is alsoaffected, with that of cheeses made frompasteurized milk being less intense than theflavour of their raw milk counterparts [18].
Idiazabal cheese is a typical product ofthe Basque Country region of NorthernSpain, made from raw milk of the ‘latxa’breed of sheep according to the traditionalmethod approved by its Denomination ofOrigin [4]. It is presently protected by theEuropean Union [14]. Although its Denom-ination of Origin does not actually acceptmilk pasteurization, the present study wasundertaken in an attempt to determine itspossible authenticity through a scientificknowledge of the characteristics of thischeese made with pasteurized milk andrelate sensory and analytical parameters. Inthe present paper we report the changesintroduced by milk pasteurization onlipolysis.
434
Résumé — Effet de la pasteurisation du lait sur la lipolyse au cours de l’affinage du fromage debrebis fabriqué à différentes saisons de l’année.Le travail a été consacré à l’étude de la lipolysedans des fromages fabriqués à partir de lait de brebis pasteurisé et cru, additionné d’un levain lactique,en hiver, au printemps et en été, jusqu’à 180 j d’affinage. La lipolyse est significativement plusfaible dans les fromages pasteurisés que dans ceux élaborés avec du lait cru en hiver après 180 jd’affinage et au printemps après 90 et 180 j d’affinage. Le passage de l’hiver à l’été modifie la teneurrelative des différents acides gras libres (AGL) après 180 j d’affinage dans les fromages pasteuriséset dans ceux élaborés avec du lait cru. Dans les fromages pasteurisés fabriqués pendant l’hiver, lesacides gras les plus abondants sont C18:1 (2 152 ± 386 µmol.kg–1), C4 (1 954 ± 354 µmol.kg–1), C16(1 541 ± 406 µmol.kg–1) et C10 (1 452 ± 188 µmol.kg–1). En revanche, dans les fromages pasteuri-sés fabriqués pendant l’été les plus abondants sont C16 (2 860 ± 1 305 µmol.kg–1) et C18:1(2 677 ± 973 µmol.kg–1). Les pourcentages d’acides gras libres sont modifiés dans les deux sortes defromage au cours de l’affinage, tandis que la teneur en acides gras à chaîne courte (C4 à C10)augmente de 25 % à 40–45 %, la teneur en acides gras à chaîne longue (= C16) diminue de 55 % à40–45 % en hiver comme au printemps. Par contre, dans les deux types de fromage fabriqués pendantl’été, les acides gras à chaîne longue représentent 52 % et les acides gras volatils 28–32 % du total après180 j d’affinage. La pasteurisation du lait diminue les niveaux d’acide acétique de 99 % après 90 jd’affinage dans les trois saisons de l’année étudiées.
fromage au lait de brebis / fromage au lait pasteurisé / saison / affinage / lipolyse

Lipolysis in pasteurized ovine cheese
5 (third week in April) and 8 (third week inJune) were also taken after 15, 30, 60 and120 d of ripening. Cheese samples werewrapped in plastic film and aluminum foiland frozen at –80 °C until analyzed.
2.2. Free fatty acid analysis
Gas-liquid chromatographic analysis ofeach cheese sample was made in duplicate.FFA were analyzed underivatized by gas-liquid chromatography as described previ-ously [11]. Briefly, cheese (1.0 g) wasground and extracted from an acidic mediumwith diethyl ether:heptane (1:1, v/v) afteraddition of an internal standard mixture con-sisting of pentanoic, nonanoic and heptade-canoic acids (1.0 mg each acid per mLdiethyl ether:heptane). Triacylglycerols wereseparated from the FFA on aminopropyl-bonded phase columns (500 mg, WatersCorporation, Milford, MA, USA; previouslyequilibrated with heptane) by elution withchloroform:isopropanol (2:1, v/v). FFA wereeluted with 5.0 mL diethyl ether containing20 mL formic acid per L. This fraction con-taining underivatized FFA was injecteddirectly into the gas chromatograph (HewlettPackard, model 5890, series II, equippedwith a flame ionization detector) and FFAwere separated on a fused silica capillarycolumn (25 m× 0.32 mm) coated with freefatty acid phase (cross-linked polyethyleneglycol, 0.52 µm layer thickness). The carriergas (helium) flow rate was 2 mL.min–1, andthe temperature was raised from 65 °C to240 °C at 10 °C.min–1, then held at 240 °Cfor 20 min. All solvents (Merck, Darmstadt,Germany) were of the highest grade avail-able and were not redistilled before use.
2.3. Microbiological analyses
During cheese ripening total log counts ofmicroorganisms were determined in dupli-cate after 90 and 180 d. Mesophiles weredetermined as described [1]. The method ofBroome et al. [9] was used to determine the
2. MATERIALS AND METHODS
2.1. Cheese manufacture
Cheeses were made in the pilot plant ofQueserías Araia (Araia, Alava, Spain). Theindustrial ewe’s milk was from several local,commercial flocks of latxasheep. The lac-tation period for an individual flock extendsapproximately 5 months between Novemberand July, depending on the altitude wherethe flock is located, with flocks on lowerelevations starting lactation earlier. Industrialcheesemaking (using mixed milk from dif-ferent flocks) extends from December untilthe end of June. Thus, industrial milk in Jan-uary contains a large percentage of milkfrom flocks in their early lactation stage,while industrial milk in June correspondsto the late lactation period of most flocks. InApril milk could be a mixture (of unknowncomposition) of milk from late, mid- andearly lactation period flocks. Milk had beenrefrigerated at 4 to 6 °C for up to 48 h priorto cheesemaking. Cheeses were madeaccording to the traditional method for theindustrial production of Idiazabal cheeseapproved by its Denomination of Origin [4],using commercial calf rennet (Ch. Hansen,Madrid, Spain), in 200-L vats. A starter cul-ture (90% citrate-positive Lactococcus lac-tis and 10% Lactobacillus caseissp. casei),isolated from Idiazabal [34] was used bothfor raw milk and pasteurized milk cheeses.Milk was pasteurized at 72 °C for 15 s inthe factory upon arrival. Cheeses of bothtypes (1.0 to 1.2 kg and 13 cm diameter)were made in three consecutive weeks inwinter (last week in January and first twoweeks in February), spring (last three weeksin April) and summer (last three weeks inJune) (total of 9 batches with 2 vats in eachbatch: raw and pasteurized milk). From eachvat, two different cheeses were taken foranalysis after 1, 90 and 180 d of ripening,with the entire cheeses used for analysis oneach sampling day. In addition to these sam-pling days, cheeses from each experimentalunit of batches 2 (first week in February),
435

F. Chávarri et al.
total counts of lactic acid bacteria. Yeastswere determined as described by Caballeroet al. [10]. Pseudomonas and micrococciwere determined with the methods ofBlazevic et al. [6] and García et al. [16],respectively. The method of Isenberg et al.[22] was used to determine the total countsof enterococci.
2.4. Statistical analysis
The BMPD statistical package [7] wasused for statistical treatment of the results.Three-way split-plot analysis of variance(ANOVA) was done to establish the pres-ence or absence of significant difference inthe FFA contents of the cheese, consider-ing time of the year and pasteurization asfactors and ripening time as sub-plot factor[20, 28]. Eta-square is referred to as sizeeffect. Student’s t-tests were done to deter-mine the presence of significant differencesin FFA contents on different days of ripen-ing (1, 90 and 180) between the two types ofcheeses (raw and pasteurized ones) made atdifferent times of the year (winter, springand summer). Simple linear regression anal-ysis was done to fit the total FFA contentwith the ripening time (for batches 2,5 and 8).
3. RESULTS AND DISCUSSION
The influence of the factors ‘milk pas-teurization’, ‘season of the year’ and ‘ripen-ing time’ on the concentration of individ-ual FFA, short-, medium- and long-chainFFA and total lipolysis was analyzed by athree-way ANOVA (Tab. I). Milk pasteur-ization significantly affected (P = 0.01) thelevels of short-chain (C4-C10) FFA as wellas their total amount, whereas season of theyear and ripening time significantly affectedall variables studied. The size effect of‘ripening time’ was largest for all variablesexcept for C2 which was primarily affected(largest size effect value) by ‘milk pasteur-
ization’. The size of the effect ‘ripeningtime’ was particularly large for short-chainFFA and the long-chain FFA stearic, oleicand linoleic acids. There was a significantinteraction (P = 0.001) between ‘milk pas-teurization’ and ‘season of the year’ whichaffected the concentration of all variablesstudied except that of C4, indicating thatthe effect of pasteurization was not the samethroughout the cheesemaking season. Theinteraction between ‘season of the year’and ‘ripening time’ significantly affected(P = 0.05) the concentrations of all vari-ables studied. In contrast, the interactionbetween ‘milk pasteurization’ and ‘ripen-ing time’ was significant primarily for theconcentration of short-chain FFA and totallipolysis. Short-chain FFA, both individually(except C4) and collectively, were the onlyvariables significantly affected by the threefactors simultaneously.
As observed in Table I, lipolysis (as totalFFA) was primarily affected by ‘milk pas-teurization’ and ‘season of the year’. Thevalue obtained for total lipolysis in Idiazabalcheese manufactured with pasteurized milkwas approximately 40% lower in cheesesmanufactured in spring than in those man-ufactured in winter, and between 50 and 60%lower than those manufactured in summerafter 90 and 180 ripening days (Tab. II). Incheeses manufactured with raw milk, lipol-ysis in spring was between 30 and 40%lower than in winter and summer. The lev-els of lipolysis in pasteurized milk cheeseswere significantly lower than those in rawmilk cheeses after 180 ripening days in win-ter (about 30% lower) and 90 and 180 ripen-ing days in spring (about 20% lower;Tab. II). In summer, although the meanlipolysis values on each ripening day werehigher for pasteurized milk cheeses than forraw milk cheeses, these differences werenot statistically significant due, most likely,to the large standard deviations obtained forpasteurized milk cheeses.
The physico-chemical composition of thecheeses made with raw milk was not
436

Lipolysis in pasteurized ovine cheese437
Table I. Significance levels and size effects of the three-way analysis of variance for the effects “milk pasteurization” (P), “season of the year” (S) and“ripening time” (T).Tableau I. Les niveaux de signification de l’analyse de variance à trois facteurs pour les effets « pasteurisation du lait » (P), « saison » (S) et « duréed’affinage » (T).
FFA P S T PS PT ST PST
sig size effect sig size effect sig size effect sig size effect sig size effect sig size effect sig size effect
C2 *** 0.604 *** 0.080 *** 0.475 ** 0.062 *** 0.160 * 0.062 *** 0.091
C4 *** 0.062 *** 0.075 *** 0.612 NS 0.016 NS 0.026 * 0.056 NS 0.037
C6 *** 0.058 *** 0.362 *** 0.849 *** 0.132 ** 0.055 *** 0.253 ** 0.068
C8 ** 0.045 *** 0.485 *** 0.851 *** 0.122 NS 0.024 *** 0.296 ** 0.069
C10 *** 0.061 *** 0.361 *** 0.683 *** 0.125 ** 0.057 *** 0.279 *** 0.110
C12 NS 0.000 *** 0.095 *** 0.508 *** 0.080 NS 0.002 ** 0.071 NS 0.036
C14 NS 0.011 *** 0.347 *** 0.562 *** 0.138 NS 0.007 *** 0.180 NS 0.047
C16 NS 0.011 *** 0.448 *** 0.627 *** 0.151 NS 0.005 *** 0.205 NS 0.041
C16:1 * 0.027 *** 0.304 *** 0.559 *** 0.142 NS 0.017 *** 0.127 NS 0.049
C18 * 0.026 *** 0.600 *** 0.782 *** 0.127 NS 0.012 *** 0.273 NS 0.021
C18:1 * 0.034 *** 0.521 *** 0.808 *** 0.098 NS 0.018 *** 0.244 NS 0.017
C18:2 NS 0.010 *** 0.535 *** 0.785 *** 0.107 NS 0.004 *** 0.260 NS 0.024
C18:3 NS 0.003 *** 0.343 *** 0.626 *** 0.099 NS 0.004 *** 0.142 NS 0.022
Short (C4–C10) *** 0.100 *** 0.382 *** 0.810 *** 0.091 ** 0.056 *** 0.278 *** 0.101
Medium (C12–C14) NS 0.001 *** 0.269 *** 0.580 *** 0.128 NS 0.004 *** 0.145 NS 0.046
Long (> C16) NS 0.006 *** 0.477 *** 0.736 *** 0.130 NS 0.003 *** 0.215 NS 0.029
Total *** 0.376 *** 0.196 *** 0.790 *** 0.081 ** 0.063 ** 0.087 NS 0.046
*** P < 0.001; ** P < 0.01; * P < 0.05; NS: not significant.

F. Chávarri et al.
significantly different from that of cheesesmade with pasteurized milk after 90 and180 ripening days. The average value of thepH for both types of cheeses in all seasonsstudied was 5.1 ± 0.1, water activity was0.955 ± 0.005, the percent dry matter was66.6 ± 0.5 and the percent total nitrogen perdry matter was 5.7 ± 0.1 [27]. McSweeneyet al. [29] did not observe changes in thephysico-chemical composition of raw andpasteurized milk Cheddar cheeses. In con-trast to the physico-chemical composition,pasteurized milk cheeses made in winter andspring had (averages on days 90 and 180of ripening) between 15 and 20% lower totalcounts of mesophiles (7.20 ± 0.19 cfu.g–1
cheese), lactic acid bacteria (7.18 ±0.14 cfu.g–1) and enterococci (6.60 ±0.92 cfu.g–1) than cheeses made with rawmilk, whereas in summer the reduction inthese groups of microorganisms was onlybetween 5 and 10%. In pasteurized milkcheeses yeasts were reduced by about 70%(0.69 ± 0.36 cfu.g–1), micrococci by 55%(winter and spring: 1.84 ± 0.39 cfu.g–1) or45% (summer: 1.97 ± 1.13 cfu.g–1) andpseudomonas by 30% (2.05 ± 1.73 cfu.g–1).Milk pasteurization in summer appeared tobe less effective in reducing the total countsof the above-mentioned microorganismsthan in winter and spring. Beuvier et al. [5]reported reductions in the total counts ofenterococci, mesophiles, micrococci andyeasts in Swiss-type cheese made with pas-teurized milk with respect to the countsobserved in cheese made with raw milk.Likewise, in their review article, Martleyand coworkers [26] found lower total countsof mesophiles and lactic acid bacteria in var-ious types of cheeses made with pasteur-ized milk than in the same cheeses madewith raw milk.
The effect of milk pasteurization on lipol-ysis levels appears to vary widely with thetype of cheese. Both McSweeney et al. [29]and Gaya et al. [17] report decreases in thelevels of lipolysis between 38 and 50% forCheddar and Manchego cheeses, respectively,when compared to their corresponding raw
milk counterparts, as reported herein. Incontrast, Sousa and Malcata [38] reporthigher levels of lipolysis in cheeses madewith pasteurized sheep’s milk than in thosemade with raw milk and attribute the dif-ferences to the higher percentage of fatretained in the pasteurized milk curd [21]. Inour case both types of cheeses made in win-ter and spring had approximately 53% fat,whereas those made in summer had approx-imately 56% [27], indicating that pasteur-ization did not significantly affect the levelof fat in cheese.
438
Table II. Total amounts of FFA (µmol.kg–1
cheese) accumulated during ripening of cheesesmanufactured in winter, spring and summer withraw and pasteurized milk.Tableau II. Quantités totales d’acides gras(µmol.kg–1) accumulés pendant l’affinage desfromages fabriqués en hiver, au printemps et enété avec du lait cru et pasteurisé.
Ripening day Raw Pasteurized
Winter1 2 272 ± 1 221a 1 535 ± 218a
90 8 820 ± 1 427a 7 298 ± 1 688a
180 15 543 ± 1 949a 10 812 ± 2 251b
Spring 1 1 112 ± 78a 1 018 ± 152a
90 5 410 ± 927a 4 237 ± 610b
180 8 298 ± 425a 6 526 ± 1 034b
Summer1 1 352 ± 401a 1 855 ± 803a
90 8 668 ± 2 237a 10 341 ± 4657a
180 11 436 ± 1 532a 13 827 ± 5 783a
Amounts represent the mean ± standard deviation of the12 values obtained for the three batches made at eachtime of the year on each ripening day. Different super-scripts within each time of the year and for each ripen-ing day represent statistically significant differences(P < 0.05) between raw and pasteurized milk cheeses.
Les valeurs représentent les moyennes ± écart-type de12 résultats obtenus pour les trois lots fabriqués àchaque saison de l’année et pour chaque période d’affi-nage. La présence de lettres différentes représentel’existence de différences statistiquement significa-tives (p < 0,05) entre les fromages fabriqués à partirde lait cru et pasteurisé.
Lipolysis in pasteurized ovine cheese
FFA were C18:1 (2 152 ± 386 µmol.kg–1
cheese), C4 (1 954 ± 354 µmol.kg–1 cheese),C16 (1 541 ± 406 µmol.kg–1 cheese) andC10 (1 452 ± 188 µmol.kg–1 cheese). Inspring, when total lipolysis levels were sig-nificantly lower than in winter or summer,the major FFA in pasteurized milk cheeseswere C4 (1368 ± 318 µmol.kg–1 cheese)and C18:1 (1148 ± 161 µmol.kg–1 cheese).However, the FFA profile of summercheeses made with pasteurized milk wasvery different, with a clear predominanceof the long chain FFA C16 (2 860 ±1305 µmol.kg–1 cheese) and C18:1 (2677± 973 µmol.kg–1 cheese) over C14 (1901± 986 µmol.kg–1 cheese) and C4 (1526 ±524 µmol.kg–1 cheese). The two-foldincrease in C14 (with respect to its value incheeses made in winter), in particular, wasquite remarkable.
The profiles of FFA in raw milk cheesesafter 180 ripening days were comparable tothose of pasteurized milk cheeses for thethree seasons of the year, with significantlyhigher levels of C4 (2742 ± 400 µmol.kg–1
cheese), C18:1 (2 739 ± 181 µmol.kg–1
cheese) and C10 (2597 ± 1162 µmol.kg–1
cheese) in winter cheeses (Fig. 1). The maindifferences found between these two typesof cheese was a lower relative amount ofC14 in summer cheeses and an almost dou-ble amount of C10 in winter cheeses madewith raw milk. The dramatic reduction inthe amount of C10 from winter to summercheeses was comparable to that reported byChávarri et al. [13] for raw milk cheeseswith no starter culture added.
Ovine milk has been reported to have ahigher fat content towards the end of thelactation period [3, 30, 32], a fact that wouldagree with the higher fat content of summercheeses. Ovine milk lipoprotein lipase activ-ity exhibited its highest levels of activity atthe beginning of lactation and it decreasedsubstantially as the lactation period pro-gressed [12], with significantly lower valuesobtained from milk samples collected insummer, when most flocks are at the end oftheir lactation period. Likewise, pasteuriza-tion has been shown to reduce sheep’s milklipoprotein lipase activity by 75–90% [12].
Although lipolysis was assessed routinelyafter 1, 90 and 180 ripening days, batches 2(winter), 5 (spring) and 8 (summer) weremonitored also after 45, 60 and 120 ripeningdays to study the rate of FFA accumulation.In all cases, the values obtained fitted a lin-ear regression curve for the entire ripeningperiod studied (Tab. III). In pasteurized milkcheeses, FFA accumulated at a lower ratethan in raw milk cheeses in winter andspring, consistent with the lower levels oflipolysis presented.
The levels of individual FFA were sig-nificantly affected by the factors ‘season ofthe year’ and ‘ripening time’, whereas ‘milkpasteurization’ significantly affected thelevels of short-chain FFA and, to a lesserextent, those of palmitoleic, stearic and oleicacids (Tab. I). Figure 1 depicts the levels ofindividual FFA in raw and pasteurizedcheeses made in winter, spring and summerafter 180 ripening days. In pasteurized milkcheeses made in winter, the predominant
439
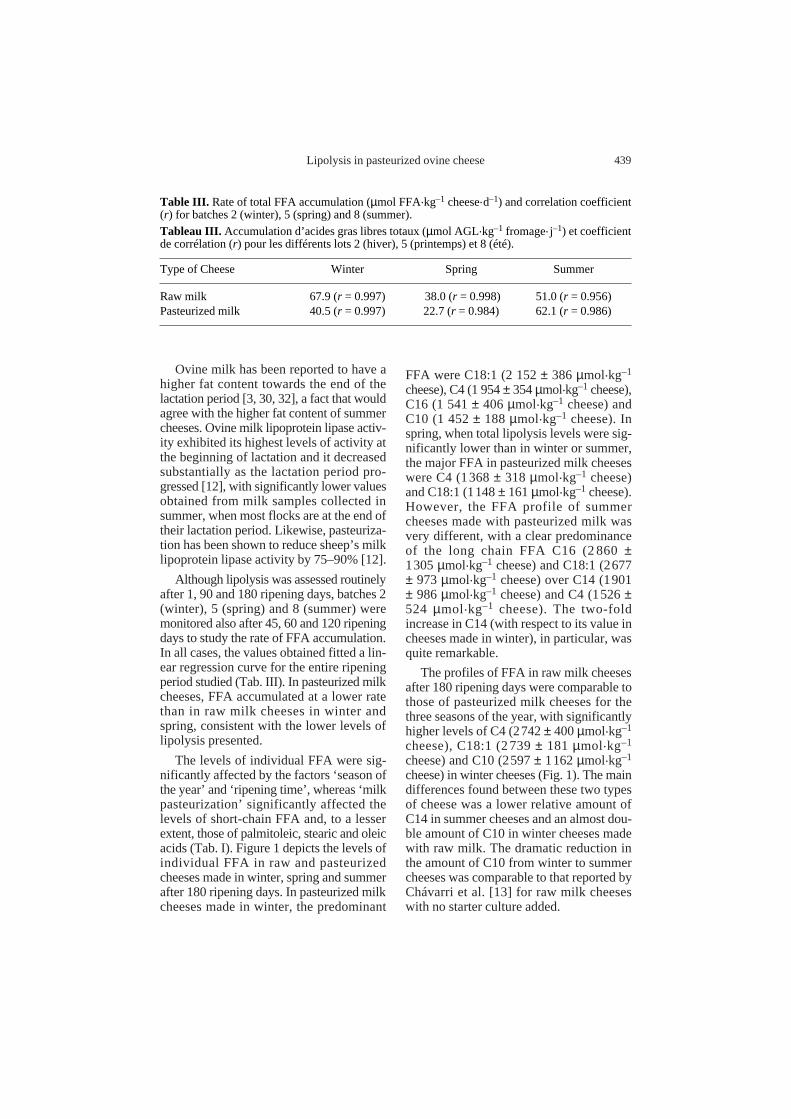
Table III. Rate of total FFA accumulation (µmol FFA.kg–1 cheese.d–1) and correlation coefficient(r) for batches 2 (winter), 5 (spring) and 8 (summer).Tableau III. Accumulation d’acides gras libres totaux (µmol AGL.kg–1 fromage.j–1) et coefficientde corrélation (r) pour les différents lots 2 (hiver), 5 (printemps) et 8 (été).
Type of Cheese Winter Spring Summer
Raw milk 67.9 (r = 0.997) 38.0 (r = 0.998) 51.0 (r = 0.956) Pasteurized milk 40.5 (r = 0.997) 22.7 (r = 0.984) 62.1 (r = 0.986)

F. Chávarri et al.440
Figure 1. Individual FFA (µmol.kg–1 cheese) accumulated during ripening of cheeses made with raw(h) and pasteurized (■) milk after 180 ripening days in winter, spring and summer. Student’s t-testwas used to determine whether or not the differences between the amounts of individual FFAs weresignificant.Figure 1. Acides gras libres (µmol.kg–1 fromage) accumulés pendant l’affinage des fromages fabri-qués à partir de lait cru (h) et pasteurisé (■) après 180 j d’affinage, en hiver, au printemps et en été.L’analyse statistique des résultats a été faite en employant le test t de Student.
Lipolysis in pasteurized ovine cheese
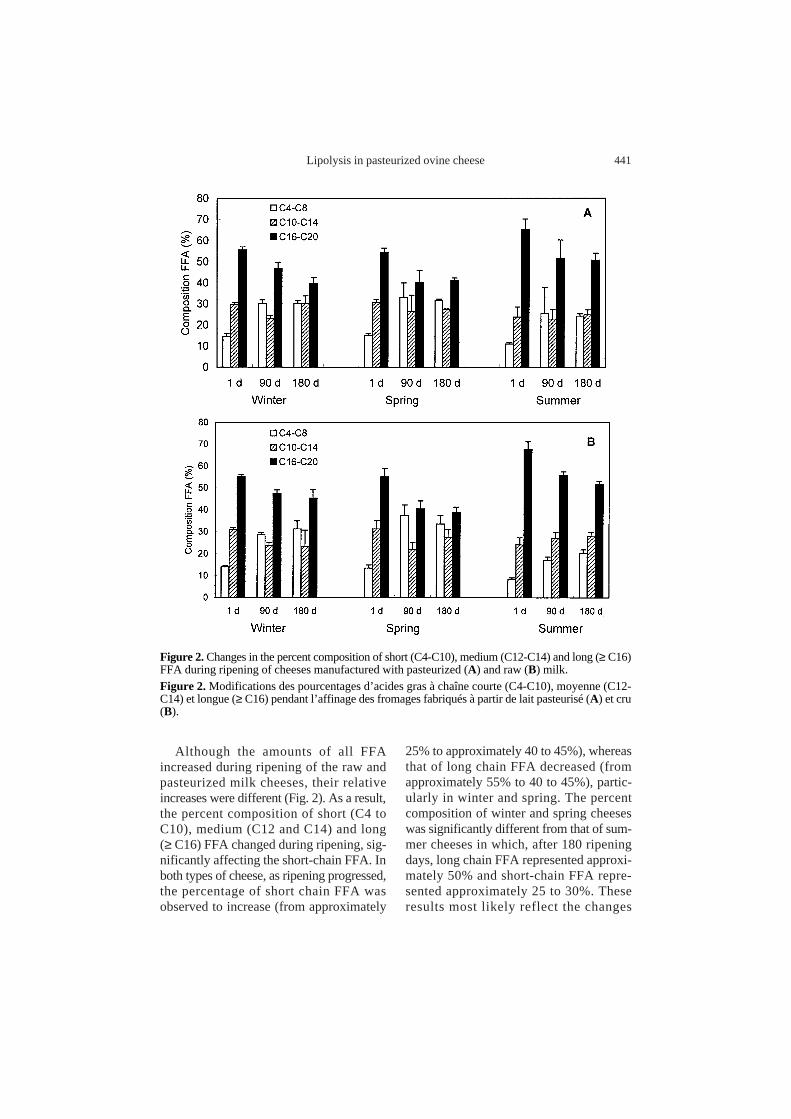
25% to approximately 40 to 45%), whereasthat of long chain FFA decreased (fromapproximately 55% to 40 to 45%), partic-ularly in winter and spring. The percentcomposition of winter and spring cheeseswas significantly different from that of sum-mer cheeses in which, after 180 ripeningdays, long chain FFA represented approxi-mately 50% and short-chain FFA repre-sented approximately 25 to 30%. Theseresults most likely reflect the changes
Although the amounts of all FFAincreased during ripening of the raw andpasteurized milk cheeses, their relativeincreases were different (Fig. 2). As a result,the percent composition of short (C4 toC10), medium (C12 and C14) and long(≥ C16) FFA changed during ripening, sig-nificantly affecting the short-chain FFA. Inboth types of cheese, as ripening progressed,the percentage of short chain FFA wasobserved to increase (from approximately
441
Figure 2. Changes in the percent composition of short (C4-C10), medium (C12-C14) and long (≥ C16)FFA during ripening of cheeses manufactured with pasteurized (A) and raw (B) milk.Figure 2. Modifications des pourcentages d’acides gras à chaîne courte (C4-C10), moyenne (C12-C14) et longue (≥ C16) pendant l’affinage des fromages fabriqués à partir de lait pasteurisé (A) et cru(B).
F. Chávarri et al.
observed in the composition of ovine milkfat as lactation progressed [33]: in winterand spring the percentage of short andmedium chain fatty acids (between 4 and12 carbon atoms) was significantly higherthan in summer, whereas in summer that oflong chain and unsaturated fatty acids wassignificantly higher than in the other twoseasons. Alternatively, these results couldalso be due to the presence of a microbiallipolytic activity (or activities) with a dif-ferent substrate specificity.
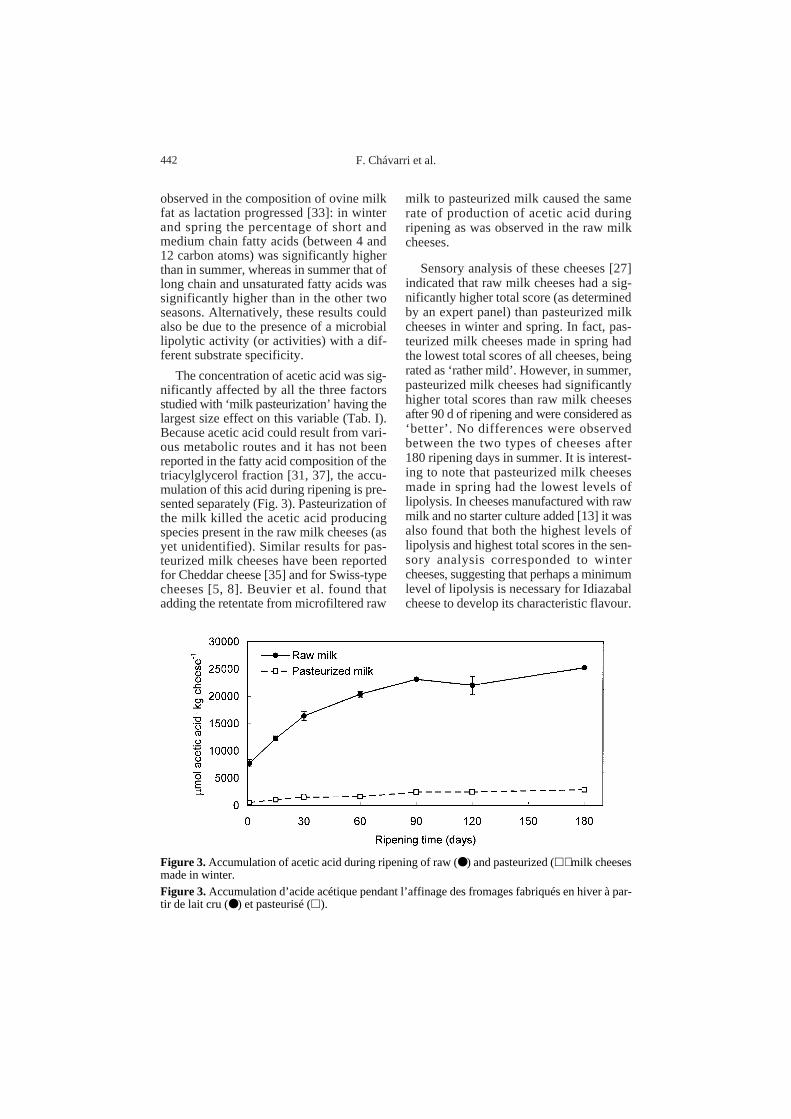
The concentration of acetic acid was sig-nificantly affected by all the three factorsstudied with ‘milk pasteurization’ having thelargest size effect on this variable (Tab. I).Because acetic acid could result from vari-ous metabolic routes and it has not beenreported in the fatty acid composition of thetriacylglycerol fraction [31, 37], the accu-mulation of this acid during ripening is pre-sented separately (Fig. 3). Pasteurization ofthe milk killed the acetic acid producingspecies present in the raw milk cheeses (asyet unidentified). Similar results for pas-teurized milk cheeses have been reportedfor Cheddar cheese [35] and for Swiss-typecheeses [5, 8]. Beuvier et al. found thatadding the retentate from microfiltered raw
milk to pasteurized milk caused the samerate of production of acetic acid duringripening as was observed in the raw milkcheeses.
Sensory analysis of these cheeses [27]indicated that raw milk cheeses had a sig-nificantly higher total score (as determinedby an expert panel) than pasteurized milkcheeses in winter and spring. In fact, pas-teurized milk cheeses made in spring hadthe lowest total scores of all cheeses, beingrated as ‘rather mild’. However, in summer,pasteurized milk cheeses had significantlyhigher total scores than raw milk cheesesafter 90 d of ripening and were considered as‘better’. No differences were observedbetween the two types of cheeses after180 ripening days in summer. It is interest-ing to note that pasteurized milk cheesesmade in spring had the lowest levels oflipolysis. In cheeses manufactured with rawmilk and no starter culture added [13] it wasalso found that both the highest levels oflipolysis and highest total scores in the sen-sory analysis corresponded to wintercheeses, suggesting that perhaps a minimumlevel of lipolysis is necessary for Idiazabalcheese to develop its characteristic flavour.
442
Figure 3.Accumulation of acetic acid during ripening of raw (●) and pasteurized (h) milk cheesesmade in winter. Figure 3. Accumulation d’acide acétique pendant l’affinage des fromages fabriqués en hiver à par-tir de lait cru (●) et pasteurisé (h).

Lipolysis in pasteurized ovine cheese
[5] Beuvier E., Berthaud K., Cegarra S., Dasen A.,Pochet S., Buchin S., Duboz G., Ripening andquality of Swiss-type cheese made from raw,pasteurized or microfiltered milk, Int. Dairy J. 7(1997) 311–323.
[6] Blazevic D.J., Koepcke M.H., Matsen J.M., Inci-dence and identification of Pseudomonas fluo-rescens and Pseudomonas putida in the clini-cal laboratory. Appl. Microbiol. 25 (1973)107–110.
[7] BMDP Statistical Software, University of Cal-ifornia Press, Berkeley, CA, USA, 1983.
[8] Bouton Y., Grappin R., Comparaison de la qua-lité de fromages à pâte pressée cuite fabriqués àpartir de lait cru ou microfiltré, Lait 75 (1995)31–44.
[9] Broome M.C., Krause D.A., Hickey M.W., Theisolation and characterization of lactobacillifrom Cheeddar cheese, Aus. J. Dairy Technol. 11(1990) 60–66.
[10] Caballero M., Arroyo J.A., Zubero J., Microbi-ología del queso tipo Camembert fabricado enEspaña, Rev. Esp. Lechería 10 (1986) 31–39.
[11] Chávarri F., Virto M., Martín C., Nájera A.I.,Santisteban A., Barrón L.J.R., de Renobales M.,Determination of free fatty acids in cheese: com-parison of two analytical methods, J. Dairy Res.64 (1997) 445–452.
[12] Chávarri F., Santisteban A., Virto M., deRenobales M., Alkaline phosphatase, acid phos-phatase, lactoperoxidase and lipoprotein lipaseactivities in industrial ewe’s milk and cheese,J. Agric. Food Chem. 46 (1998) 2926–2932.
[13] Chávarri F., Bustamante M.A., Santisteban A.,Virto M., Barrón L.J.R., de Renobales M.,Changes in free fatty acids during ripening ofIdiazabal cheese manufactured at different timesof the year, J. Dairy Sci. 82 (1999) 885–890.
[14] DOCE, Reglamento (CE) No. 1107/96 de laComisión de 12 de junio de 1996 relativo al reg-istro de las indicaciones geográficas y de lasdenominaciones de origen con arreglo al pro-cedimiento establecido en el artículo 17 delReglamento (CEE) nº 2081/92 del Consejo,Diario Oficial de las Comunidades Europeas(DOCE), 148 (1996) 1–10.
[15] Fox P.F., Law J., McSweeney P.L.H., WallaceJ., Biochemistry of cheese ripening, in: Fox P.F.(Ed.), Cheese: Chemistry, physics and micro-biology, Vol. 1, Chapman & Hall, London, Eng-land, 1993, pp. 389–438.
[16] García M.C., Otero A., García M.L., Moreno,B. Species identification of staphylococci andmicrococci isolated from ewe’s milk cheeses,J. Dairy Res. 55 (1988) 269–276.
[17] Gaya P., Medina M., Rodríguez–Marín A.,Núñez M., Accelerated ripening of ewe’s milkManchego cheese: the effect of elevated ripen-ing temperatures, J. Dairy Sci. 73 (1990) 26–32.
4. CONCLUSION
The three effects studied, ‘milk pasteur-ization’, ‘season of the year’ and ‘ripeningtime’, significantly affected all the FFAaccumulated during ripening. Milk pas-teurization decreased the total level of lipol-ysis (as compared to raw milk cheeses) incheeses made in winter and spring, but itdid not alter the proportions of short,medium and long chain FFA at these timesof the year. Yet, results of the sensory anal-ysis indicated that pasteurized cheese wasdifferent from raw cheese and suggestedthat higher levels of lipolysis could beimportant for the development of the char-acteristic flavour of Idiazabal cheese.
ACKNOWLEDGEMENTS
The authors would like to thank M.A.Marquínez for excellent technical assistance,cheesemaster A. Pérez de Albéniz for makingthe cheeses and Queserías Araia (Araia, Alava,Spain) for the use of their pilot cheese manufac-turing plant and ripening chambers. F. Chávarriacknowledges a predoctoral fellowship from theDept. of Industry, Agriculture and Fisheries of theBasque Government. This work was supportedby a grant from the Spanish Ministry of Educa-tion and Science (CICYT ALI93-0895-C02-02)and the Basque Government (GV 101.123-A038/92).
REFERENCES
[1] AFNOR. Directives générales pour le dénom-brement des microorganismes, Méthode parcomptage des colonies obtenues à 30 °C, NF V08-011 Paris-La Défense, 1978.
[2] Andrews A.T., Anderson M., Goodenough P.W.,A study of the heat stabilities of a number ofindigenous milk enzymes, J. Daiy Res. 54 (1987)237–246.
[3] Anifantakis E.M., Comparison of the physico-chemical properties of ewe’s and cow’s milk,in: Production and utilization of ewe’s and goat’smilk, Bulletin International Dairy Federation,Brussels, Belgium, 1986, pp. 42–53.
[4] Basque Government (Dept. Agriculture andFisheries), Idiazabal cheese, Denomination ofOrigin Control Board, Bol. O. Pais Vasco 252(1986) 6357–6373.
443

F. Chávarri et al.
[18] Grappin R., Beuvier E., Possible implicationsof milk pasteurization on the manufacture andsensory quality of ripened cheese: a review, in:Removal of fats, oils and grease in the pretreat-ment of Dairy Wastewaters, Bull. 327 Interna-tional Dairy Federation, Brussels, Belgium,1997, pp. 16–19.
[19] Grieve P.A., Kitchen B.J., Proteolysis in milk.The significance of proteinases originating frommilk leucocytes and a comparison of the actionof leucocyte, bacterial and natural milk pro-teinases on casein, J. Dairy Res. 52 (1985)101–112.
[20] Hunter E.A., McNulty D.A., Banks J.M., Sta-tistical design and analysis of experiments incheese technology, Lebensm. Wissens. Tech-nol. 30 (1997) 1221–1228.
[21] Irvine O.R., Bryant L.R., Hill D.C., SprouleW.H., A comparison of the yields of Cheddarcheese, Can. Dairy Ice Cream J. 27 (1948)49–52.
[22] Isenberg H.D., Goldberg D., Sampson I., Lab-oratory studies with a selective Enterococcusmedium, J. Appl. Microbiol. 20 (1970) 433–438.
[23] Krause I., Brockhardt A., Klostermeyer H.,Characterization of cheese ripening by freeamino acids and biogenic amines and influenceof bactofugation and heat–treatment of milk,Lait 77 (1997) 101–108.
[24] Lawrence R.C., Incorporation of whey proteinsin cheese, in: Factors affecting the yield ofcheese, Special Issue 9301 International DairyFederation, Brussels, Belgium, (1993) 79–87.
[25] Lieske B., Influence of preliminary treatments onstructural properties of casein micelles affect-ing the rennetability, Lait 77 (1997) 201–209.
[26] Martley F.G., Crow V.L., Interactions betweennon–starter microorganisms during cheese man-ufacture and ripening, Int. Dairy J. 3 (1993)461–483.
[27] Mendía C., Cambios proteolíticos y organolép-ticos del Queso Idiazabal elaborado en difer-entes épocas del año: influencia de la pasteri-zación de la leche y del cultivo iniciador, Ph.D.Diss., Universidad Pública de Navarra, Pam-plona, Spain, 1998.
[28] McNulty D., Skeie S., Rüegg M., BachmannH.–P., McSweeney P., Grappin R., Guidelinesfor experimental design and data analysis instudies on cheese, Office for official publica-tions of the European Communities (1998).
[29] McSweeney P.L.H., Fox P.F., Lucey J.A.,Jordan K.N., Cogan T.N., Contribution of theindigenous microflora to the maturation of Ched-dar cheese, Int. Dairy J. 3 (1993) 631–634.
[30] Muir D.D., Horne D.S., Law A.J.R., Steele W.,Ovine milk. I. Seasonal changes in compositionof milk from a commercial Scottish flock, Milch-wissenshaft 48 (1993) 363–366.
[31] Nájera A.I., Barcina Y., de Renobales M.,Barrón L.J.R., Changes in triacylglycerols dur-ing the ripening of Idiazabal cheese, J. Agric.Food Chem. 46 (1998) 3252–3256.
[32] Perea S., Influencia de la época del año y pas-teurización sobre la composición triglicérica dela leche de oveja latxa, Tesis de Licenciatura,Universidad del País Vasco/Euskal HerrikoUnibertsitatea, Vitoria-Gasteiz, Spain, 1998.
[33] Perea S., de Labastida E.F., Nájera A.I.,Chávarri F., Virto M., de Renobales M.,Barrón L.J.R., Seasonal changes in the fat com-position of lachasheep milk used for Idiazabalcheese manufacture, Z. Lebensm.-Unters.Forsch. A (in press).
[34] Pérez-Elortondo F.J., Aldámiz-Echevarría P.,Albisu M., Barcina Y., Indigenous lactic acidbacteria in Idiazabal ewes’ milk cheese, Int.Dairy J. 8 (1998) 725–732.
[35] Reiter B., Fryer T.F., Pickering A., ChapmanH.R., Lawrence R.C., Sharpe M.E., The effect ofthe microbial flora on the flavor and FFA com-position of Cheddar cheese, J. Dairy Res. 34(1967) 257–272.
[36] Richard J., Auclair J., Lenoir J., Schneid N.,Hermier J., Cerf O., Maubois J.-L., DesmazeaudM., Bergère J.L., La leche de quesería, in: Eck A.(Ed.), El Queso, Ediciones Omega, Barcelona,Spain, 1993.
[37] Ruiz-Sala P., Hierro M.T.G., Martínez-CastroI., Santamaría G., Tryglyceride composition ofewe, cow and goat milk fat, J. Am. Oil Chem.Soc. 73 (1996) 283–293.
[38] Sousa M.J., Malcata F.X., Ripening of ovinemilk cheeses: effects of plant rennet, pasteur-ization and addition of starter on lipolysis, FoodChem. 59 (1997) 427–432.
444
Abbreviations used: FFA: free fatty acids;C4: butyric acid; C6: caproic acid;C8: caprylic acid; C10: capric acid;C12: lauric acid; C14: myristic acid;C16: palmitic acid; C16:1: palmitoleic acid;C18: stearic acid; C18:1: oleic acid (itincludes any trans isomers that could bepresent); C18:2: linoleic acid; C18:3:γ-linolenic acid.