Effect of Manufacturing Methods Used in the Stability of ...
127
University of Rhode Island University of Rhode Island DigitalCommons@URI DigitalCommons@URI Open Access Dissertations 2013 Effect of Manufacturing Methods Used in the Stability of Effect of Manufacturing Methods Used in the Stability of Amorphous Solid Solutions and Predictions to Test them Amorphous Solid Solutions and Predictions to Test them Kaoru Tominaga University of Rhode Island, [email protected] Follow this and additional works at: https://digitalcommons.uri.edu/oa_diss Recommended Citation Recommended Citation Tominaga, Kaoru, "Effect of Manufacturing Methods Used in the Stability of Amorphous Solid Solutions and Predictions to Test them" (2013). Open Access Dissertations. Paper 41. https://digitalcommons.uri.edu/oa_diss/41 This Dissertation is brought to you for free and open access by DigitalCommons@URI. It has been accepted for inclusion in Open Access Dissertations by an authorized administrator of DigitalCommons@URI. For more information, please contact [email protected].
Transcript of Effect of Manufacturing Methods Used in the Stability of ...

University of Rhode Island University of Rhode Island
DigitalCommons@URI DigitalCommons@URI
Open Access Dissertations
2013
Effect of Manufacturing Methods Used in the Stability of Effect of Manufacturing Methods Used in the Stability of
Amorphous Solid Solutions and Predictions to Test them Amorphous Solid Solutions and Predictions to Test them
Kaoru Tominaga University of Rhode Island, [email protected]
Follow this and additional works at: https://digitalcommons.uri.edu/oa_diss
Recommended Citation Recommended Citation Tominaga, Kaoru, "Effect of Manufacturing Methods Used in the Stability of Amorphous Solid Solutions and Predictions to Test them" (2013). Open Access Dissertations. Paper 41. https://digitalcommons.uri.edu/oa_diss/41
This Dissertation is brought to you for free and open access by DigitalCommons@URI. It has been accepted for inclusion in Open Access Dissertations by an authorized administrator of DigitalCommons@URI. For more information, please contact [email protected].

EFFECT OF MANUFACTURING METHODS USED IN THE STABILITY OF
AMORPHOUS SOLID SOLUTIONS AND PREDICTIONS TO TEST THEM
BY
KAORU TOMINAGA
A DISSERTATION SUBMITTED IN PARTIAL FULFILLMENT OF THE
REQUIREMENTS FOR THE DEGREE OF
DOCTOR OF PHILOSOPHY
IN
BIOMEDICAL AND PHARMACEUTICAL SCIENCES
UNIVERSITY OF RHODE ISLAND
2013

DOCTOR OF PHILOSOPHY DISSERTATION
OF
KAORU TOMINAGA
APPROVED:
Dissertation Committee:
Major Professor______M. Serpil Kislalioglu ____
_____David Worthen ___
____Michael Greenfield _
____Nasser H. Zawia _____________
DEAN OF THE GRADUATE SCHOOL
UNIVERSITY OF RHODE ISLAND
2013

ABSTRACT
With the advent of combinatorial chemistry and high throughput screening of drug
molecules, poorly water soluble molecules have been entering the development stage
as new drug candidates. The poor aqueous solubility of these molecules is one of the
limiting factors for them to succeed as a new drug product. This had led to converting
these drugs in most cases are crystalline to amorphous solid dispersion with use of
amorphous polymers to improve the solubility.
Although amorphous solid dispersion of a poorly water drug can improve the
solubility, careful selection of polymer is a necessity in order to stabilize the high
energy nature of the amorphous solid dispersion. Miscibility of a drug and a polymer
is important. With specific interaction between the drug and the polymer, the
dispersion can remain miscible much longer. Another factor that needs to be
considered when formulating an amorphous solid dispersion is the amount of drug that
is incorporated into the polymer. Over saturating the polymer with the drug can cause
instability of the dispersion and crystallization may occur which will lead to reduced
solubility.
In this work, effects of processing method, polymer selection and the drug
concentrations for the preparation of amorphous solid dispersion as well as prediction
of drug-polymer miscibility have been studied. Hot melt extrusion (HME), rotary
evaporation (Rot) and spray drying (SD) processing methods used in the study with

Eudragit E 100 (EPO), HPMCAS LF and PVPVA 64 polymers. Drug concentration
was another factor that was explored.
The objective of this dissertation were: (1) to prepare amorphous solid dispersion of
nifedipine with polymers (2) to characterize the solid dispersions (3) to determine the
factors which contributes to successful amorphous solid dispersion (4) to evaluate
prediction methods used to study drug and polymer miscibility and solubility (5) to
use a thermodynamic prediction model to determine solubility of nifedipine at room
temperature.
In the first manuscript, amorphous solid dispersions of nifedipine and polymers were
prepared. Physical and chemical characterizations of the solid dispersions indicated
solid dispersions prepared with EPO polymer were unstable although intrinsic
dissolution rates (IDR) of those samples had higher rates than those prepared with
HPMCAS LF or PVPVA 64 polymers. The instability was explained by the lack of
specific hydrogen bond interaction while the high IDR was explained by the low glass
transition temperature (Tg) of the polymer. With lower Tg, molecular mobility would
be higher and therefore the drug could dissolve at a faster rate. ANOVA analysis of
factorial design showed all factors (process, polymer and drug concentration) affected
the IDR. Further optimization of experiments may be necessary to determine the
dominant factor for improving IDR.
In the second manuscript, we have calculated three different ways to calculate the
Flory-Huggins interaction parameter, χ. Although using melting point depression
approach and solubility parameter of a drug and a polymer are common to estimate the

miscibility of the two, there were assumptions that needed to be addressed. We have
modified the melting point depression approach by calculating a better estimate of
volume fractions needed to calculate the interaction parameter.
In the third manuscript, we have taken a recently published thermodynamic prediction
model, which can estimate the stable drug concentration that can be incorporated into
an amorphous solid dispersion at room temperature, to predict the solubility of
nifedipine with EPO, HPMCAS LF and PVPVA 64 polymers in amorphous solid
dispersions prepared by HME, Rot and SD processes. The predictions showed less
stable nifedipine concentration could be incorporated into HME processed solid
dispersions than samples prepared by Rot or SD processes. Overall, nifedipine-
PVPVA 64 solid dispersion prepared by SD method was predicted to incorporate
nifedipine concentration up to 30 % w/w.
v
ACKNOWLEDGMENTS
First and foremost, I would like to thank my advisor, Dr. M. Serpil Kislalioglu for the
guidance and support she has given to me continuously throughout my graduate
studies with such patience, compassion and encouragement. I am truly grateful for
having Dr. K as my mentor at the University of Rhode Island. I am also thankful for
Hoffmann-La Roche for giving me the opportunity as well as the fellowship to work
on my Ph. D research in the PARD at Nutley, NJ. I would like to sincerely thank Drs.
Waseem Malick, Duk Soon Choi, Harpreet Sandhu, Navnit Shah, for their support at
Roche. I would also like to thank everyone in the pre-formulation and formulation
group. They have given me encouragements and advice from day one when I started
my research work. I would like to give a special thank you to Dr. Tarik Roshdy who
has volunteered so much of his time for me to run my samples using FT-IR and XRD.
I really appreciated the talks we had in Roche.
I would like to thank the College of Pharmacy at University of Rhode Island,
especially Ms. Kathleen Hayes, Ms. Gerralyn Perry and Ms. Anna Villa, without them
I would have been buried with all the paperwork.
I am also grateful for all of my friends with whom I was able to share the ups and
downs of living the life as a graduate student. This whole experience would have been
a completely different story had I not have the friendships with every single one of
you. Dr. Dimple Pabla, Dr. Lina Adwan and Ms. Agnieszka Lorenc, you have been
my inspiration throughout my struggles and I admire you all so much the way you are.

vi
Lastly, I would like to thank my parents, Ryuichi and Kazuko, my sister Sanae and my
brother Shigeto, for all of their support. Thank you for believing in me that I could do
this and giving me the encouragements I needed to complete my doctoral program.
vii
PREFACE
This dissertation has been prepared in the manuscript format as outlined in the
formatting guideline provided by the Graduate School of University of Rhode Island.
The entire dissertations were divided into three manuscript sections.
Manuscript 1: Evaluation of Processing Method, Polymer Selection and Drug Load
on Amorphous Solid Dispersion of Nifedipine
Manuscript 2: Testing the use of “heat of fusion” in calculations of interaction
parameter (χ) in Flory-Huggins and its comparison with the use of melting point
depression and solubility parameters
Manuscript 3: A Study of Stability Prediction of the Nifedipine Solid Dispersions
Prepared with Hot Melt Extrusion, Spray Drying and Rotary Evaporation

viii
TABLE OF CONTENTS
ABSTRACT .................................................................................................................. ii
ACKNOWLEDGMENTS ........................................................................................... v
PREFACE ................................................................................................................... vii
TABLE OF CONTENTS .......................................................................................... viii
LIST OF TABLES ...................................................................................................... ix
LIST OF FIGURES .................................................................................................... xi
MANUSCRIPT 1 .......................................................................................................... 1
MANUSCRIPT 2 ........................................................................................................ 48
MANUSCRIPT 3 ........................................................................................................ 74
APPENDIX 1 ............................................................................................................ 109
ix
LIST OF TABLES
TABLE PAGE
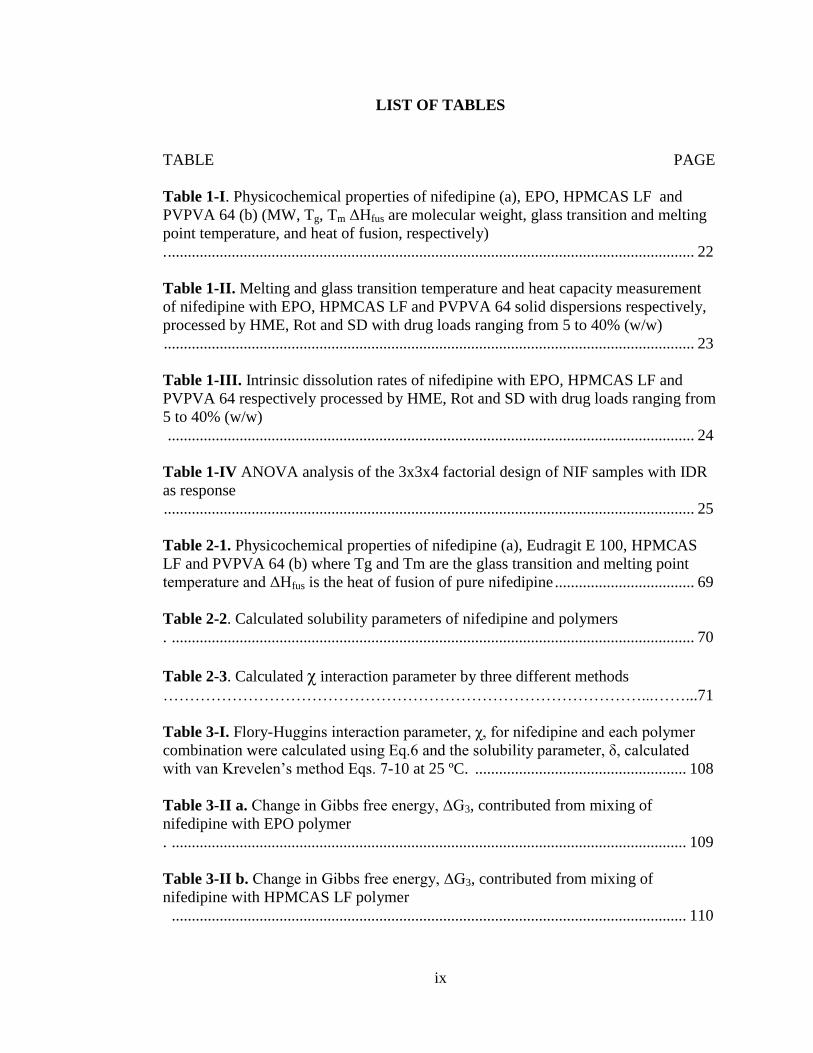
Table 1-I. Physicochemical properties of nifedipine (a), EPO, HPMCAS LF and
PVPVA 64 (b) (MW, Tg, Tm ΔHfus are molecular weight, glass transition and melting
point temperature, and heat of fusion, respectively)
. .................................................................................................................................... 22
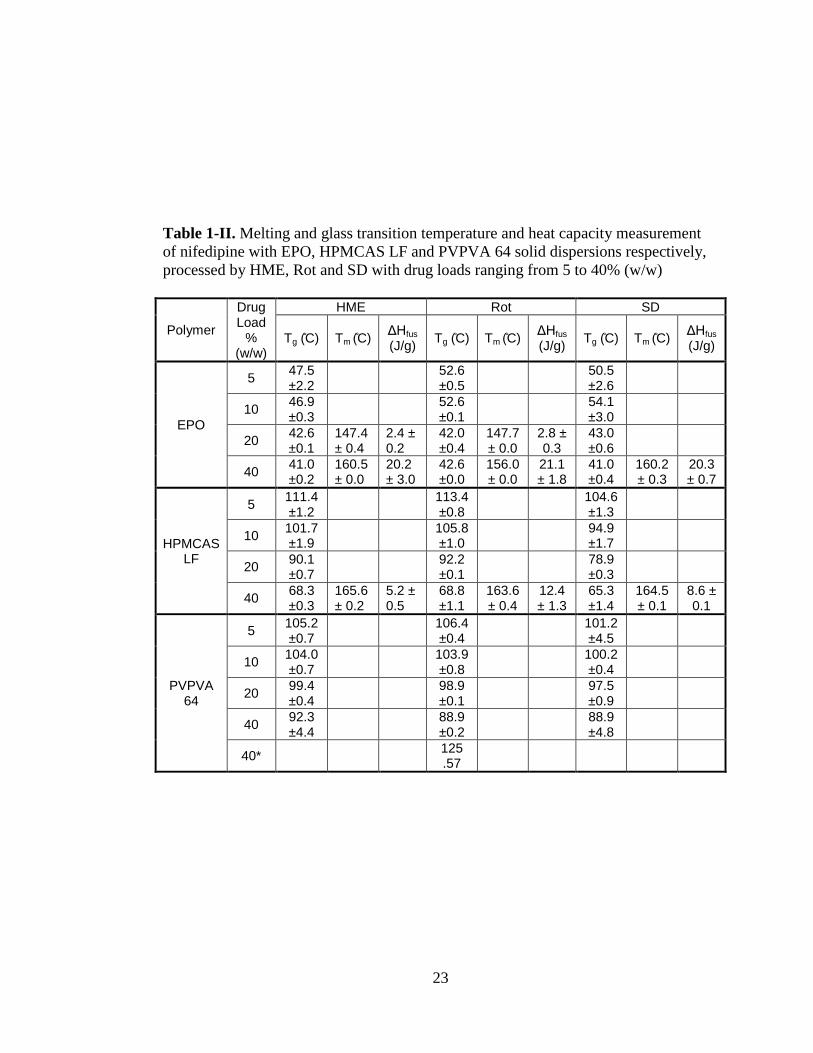
Table 1-II. Melting and glass transition temperature and heat capacity measurement
of nifedipine with EPO, HPMCAS LF and PVPVA 64 solid dispersions respectively,
processed by HME, Rot and SD with drug loads ranging from 5 to 40% (w/w)
..................................................................................................................................... 23
Table 1-III. Intrinsic dissolution rates of nifedipine with EPO, HPMCAS LF and
PVPVA 64 respectively processed by HME, Rot and SD with drug loads ranging from
5 to 40% (w/w)
.................................................................................................................................... 24
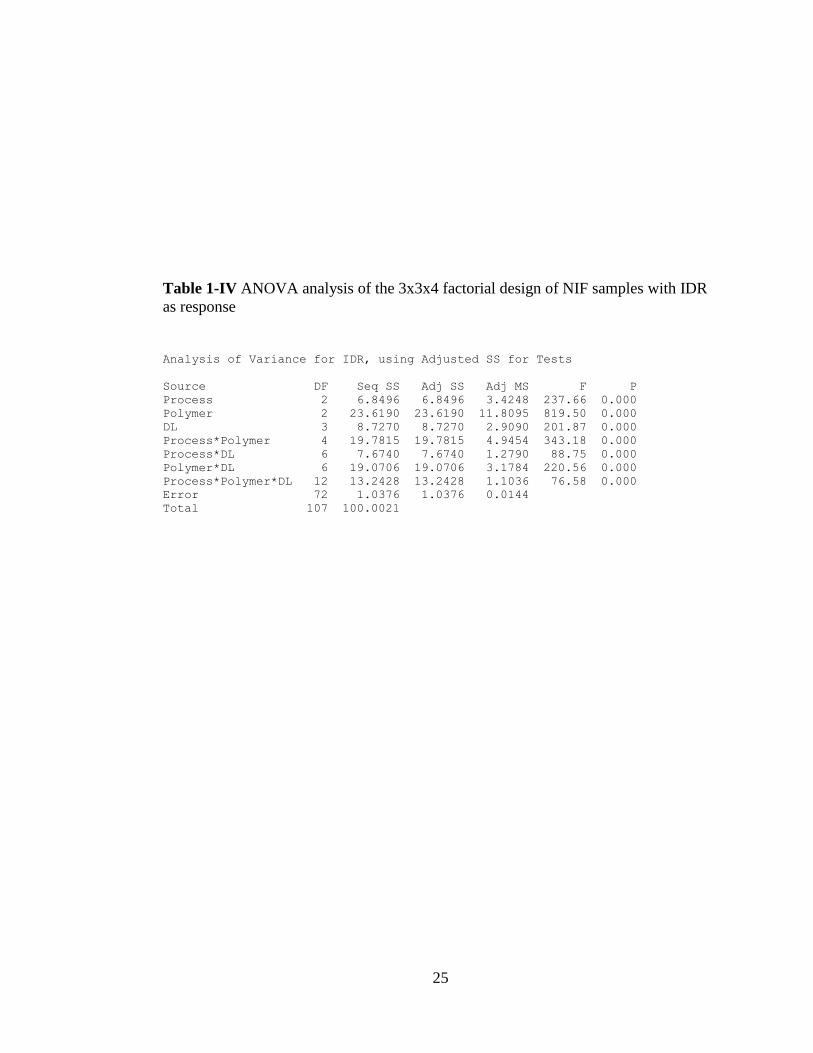
Table 1-IV ANOVA analysis of the 3x3x4 factorial design of NIF samples with IDR
as response
..................................................................................................................................... 25
Table 2-1. Physicochemical properties of nifedipine (a), Eudragit E 100, HPMCAS
LF and PVPVA 64 (b) where Tg and Tm are the glass transition and melting point
temperature and ΔHfus is the heat of fusion of pure nifedipine ................................... 69
Table 2-2. Calculated solubility parameters of nifedipine and polymers
. ................................................................................................................................... 70
Table 2-3. Calculated χ interaction parameter by three different methods
………………………………………………………………………………...……...71
Table 3-I. Flory-Huggins interaction parameter, χ, for nifedipine and each polymer
combination were calculated using Eq.6 and the solubility parameter, δ, calculated
with van Krevelen’s method Eqs. 7-10 at 25 ºC. ..................................................... 108
Table 3-II a. Change in Gibbs free energy, ΔG3, contributed from mixing of
nifedipine with EPO polymer
. ................................................................................................................................. 109
Table 3-II b. Change in Gibbs free energy, ΔG3, contributed from mixing of
nifedipine with HPMCAS LF polymer
................................................................................................................................. 110

x
Table 3-II c. Change in Gibbs free energy, ΔG3, contributed from mixing of
nifedipine with PVPVA 64 polymer
................................................................................................................................... 111

xi
LIST OF FIGURES
FIGURE PAGE
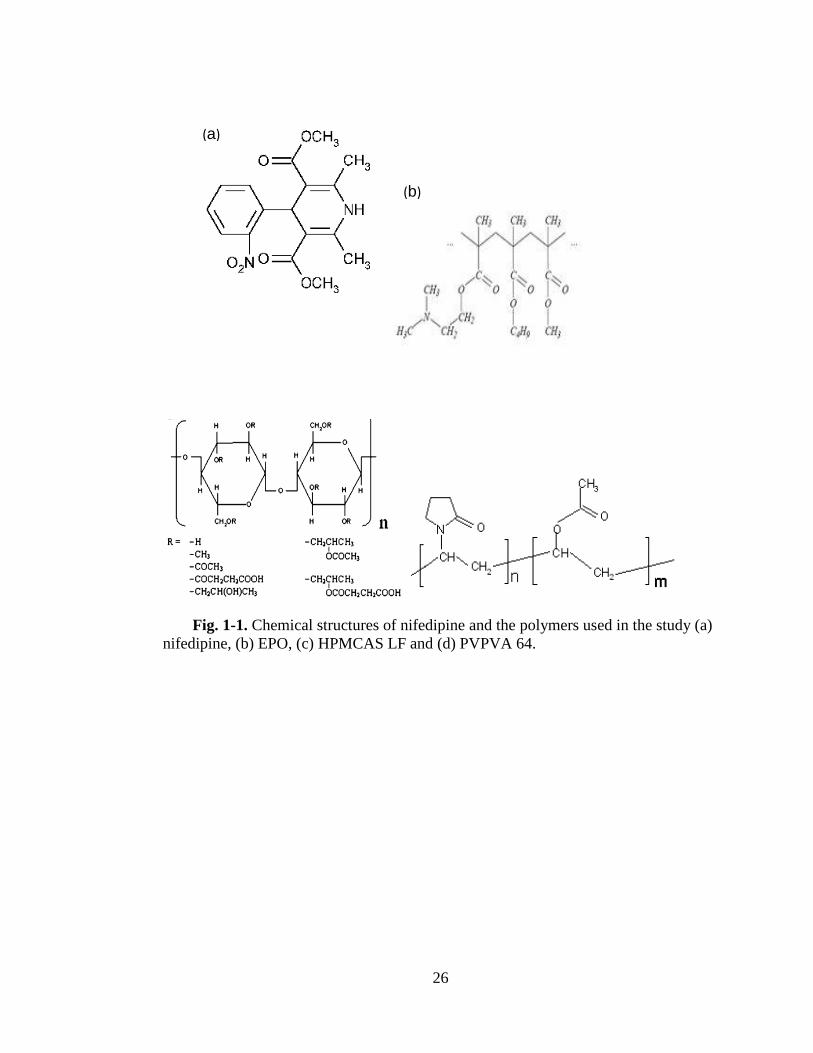
Fig. 1-1.Chemical structures of nifedipine and the polymers used in the study (a)
nifedipine, (b) EPO, (c) HPMCAS LF and (d) PVPVA 64. ...................................... .26
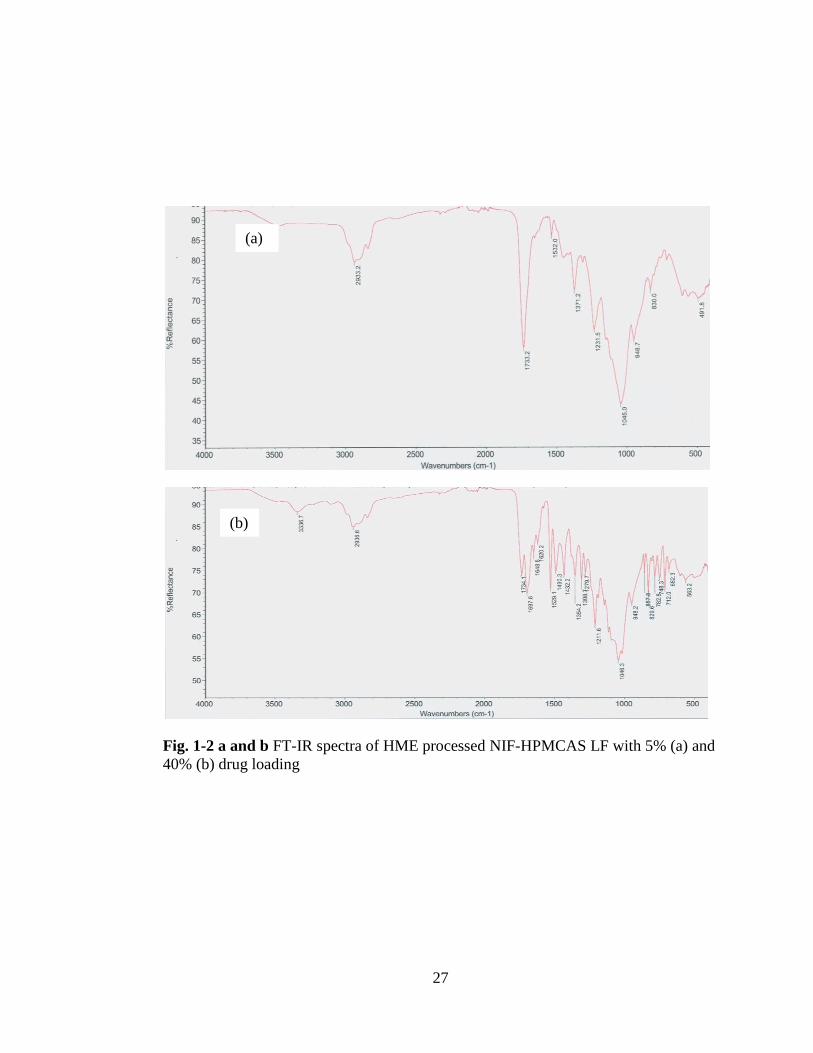
Fig. 1-2 a and b FT-IR spectra of HME processed NIF-HPMCAS LF with 5% (a) and
40% (b) drug
loading……………………………………………………………………………... 27
Fig. 1-3 a and b ... FT-IR spectra of HME processed NIF-PVPVA 64 with 5% (a) and
40% (b) drug loading .................................................................................................. 28
Fig. 1-4. DSC thermogram of HME processed 40% DL of nifedipine-EPO ............. 29
Fig. I-5. DSC thermogram of HME processed 40% NIF-HPMCAS LF .................... 30
Fig. 1-6. XRD diffractogram of HME processed NIF-EPO samples at 5, 10, 20 and 40
% nifedipine concentrations ....................................................................................... 31
Fig. 1-7 XRD Diffraction of HME processed NIF-HPMCAS LF samples with 5, 10,
20 and 40 % drug concentrations ................................................................................ 32
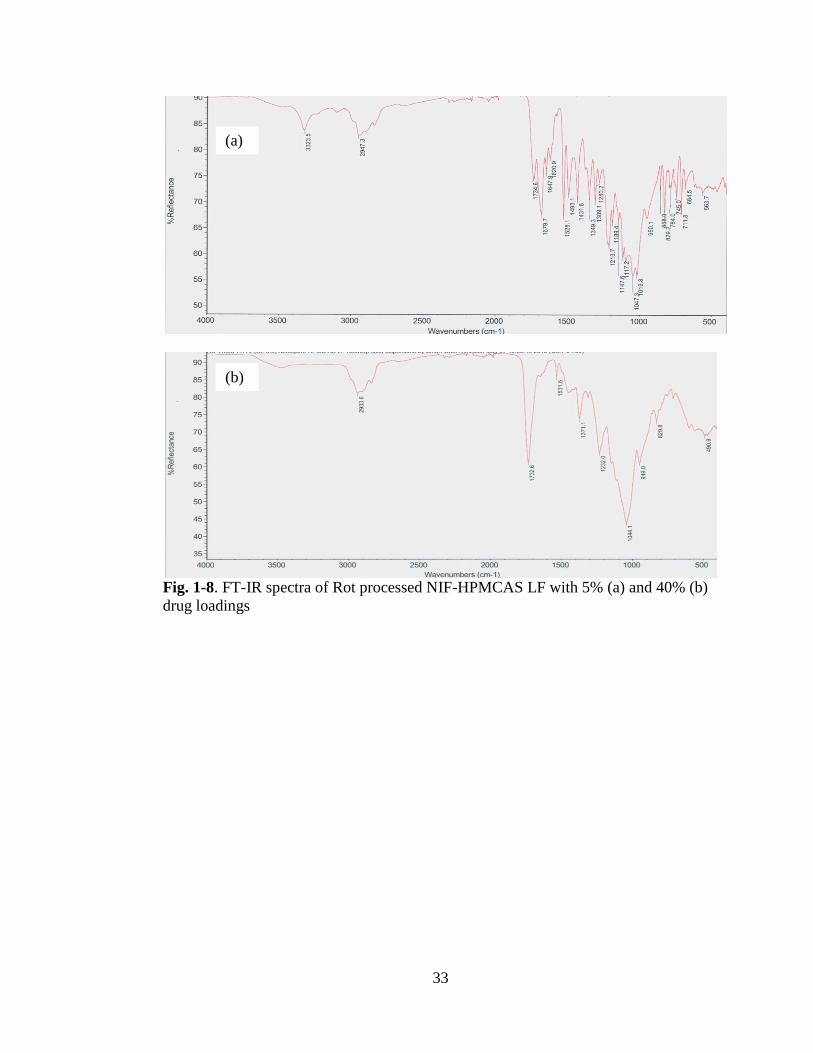
Fig. 1-8 .. FT-IR spectra of Rot processed NIF-HPMCAS LF with 5% (a) and 40% (b)
drug loadings ............................................................................................................... 33
Fig. 1-9. FT-IR spectra of Rot processed NIF-PVPVA 64 with 5% (a) and 40% (b)
drug loadings .............................................................................................................. 34
Fig. 1-10 DSC thermogram of Rot processed 40% NIF-PVPVA 64 with a presence of
two Tgs ........................................................................................................................ 35
Fig. 1-11 XRD spectrograms of Rot processed NIF-PVPVA 64 at 5, 10, 20 and 40 %
nifedipine concentrations ............................................................................................ 36
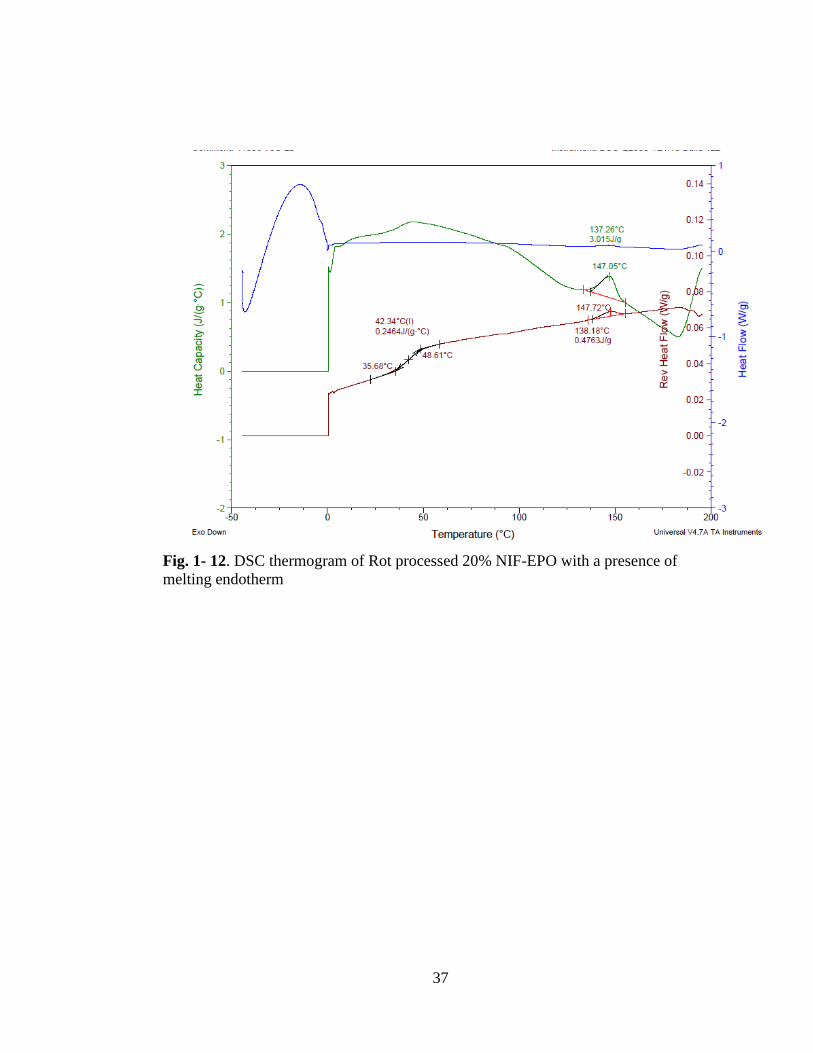
Fig. 1-12. DSC thermogram of Rot processed 20% NIF-EPO with a presence of
melting endotherm ...................................................................................................... 37
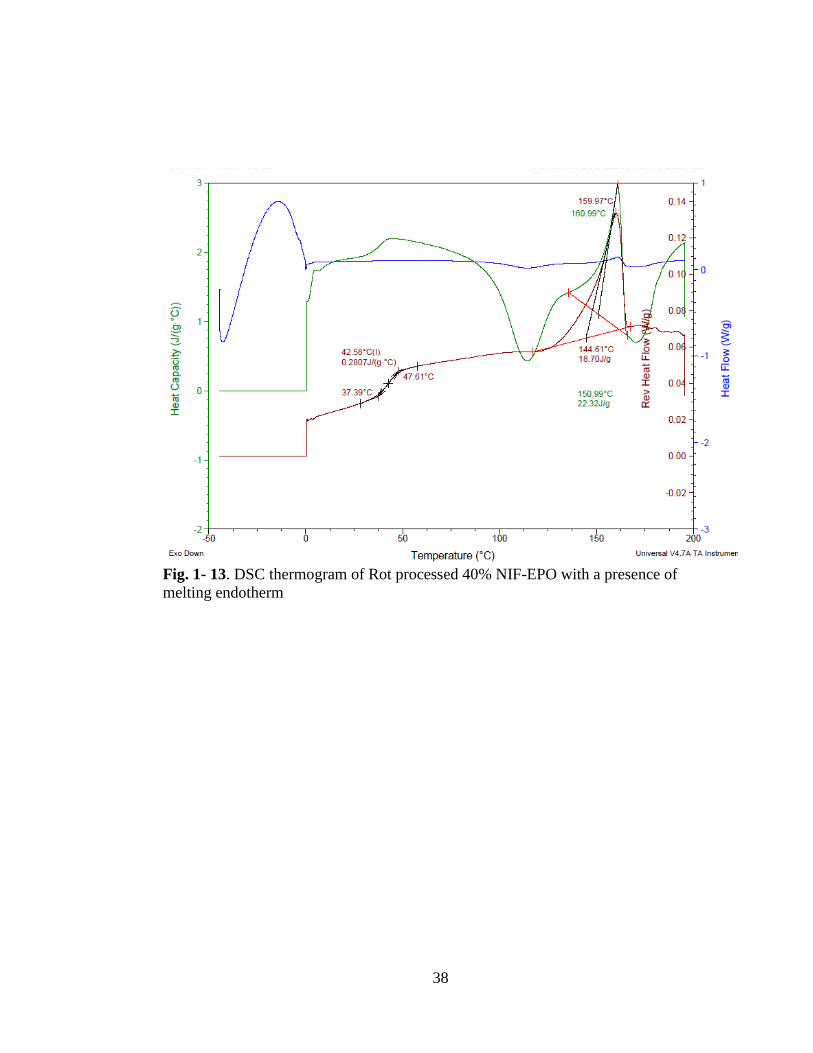
Fig. 1-13. DSC thermogram of Rot processed 40% NIF-EPO with a presence of
melting endotherm ...................................................................................................... 38
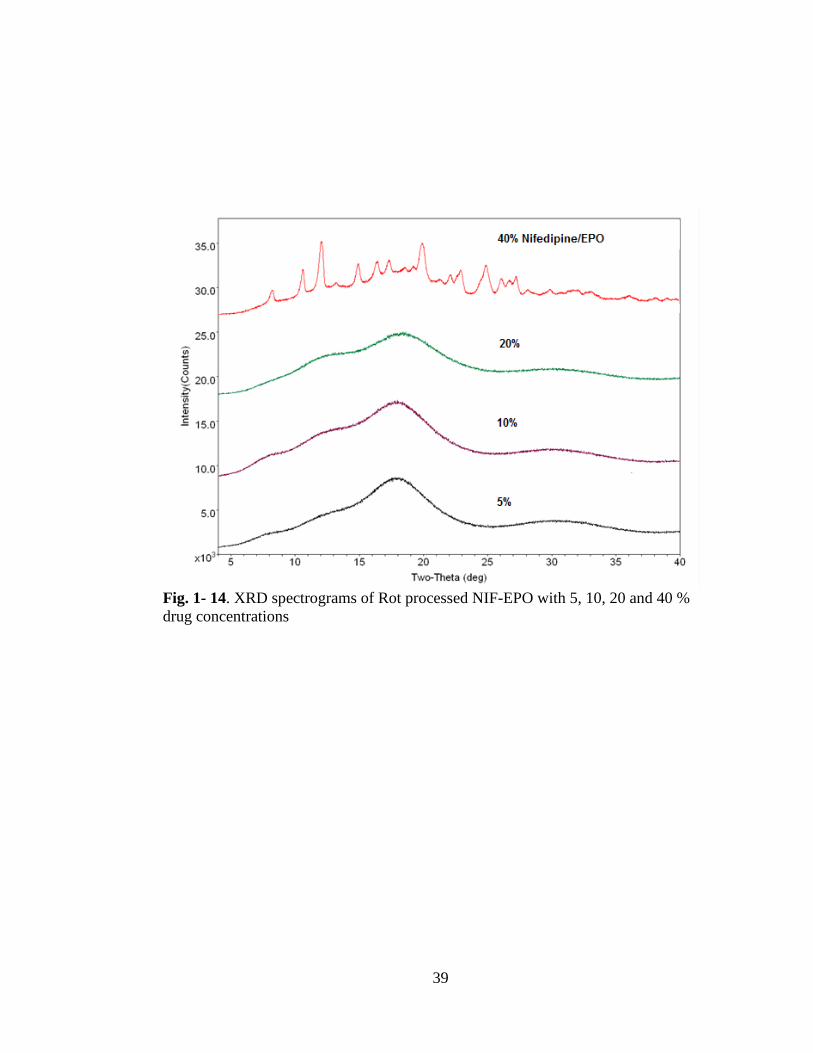
Fig. 1-14.XRD spectrograms of Rot processed NIF-EPO with 5, 10, 20 and 40 % drug
concentrations ............................................................................................................. 39

xii
Fig. 1-15.DSC thermogram of Rot processed 40% NIF-HPMCAS LF with a presence
of melting endotherm .................................................................................................. 40
Fig. 1-16. XRD spectrograms of Rot processed NIF-HPMCAS LF with 5, 10, 20 and
40 % drug concentrations ........................................................................................... 41
Fig. 1-17. DSC thermogram of SD processed 40% NIF-EPO with a presence of
melting endotherm ...................................................................................................... 42
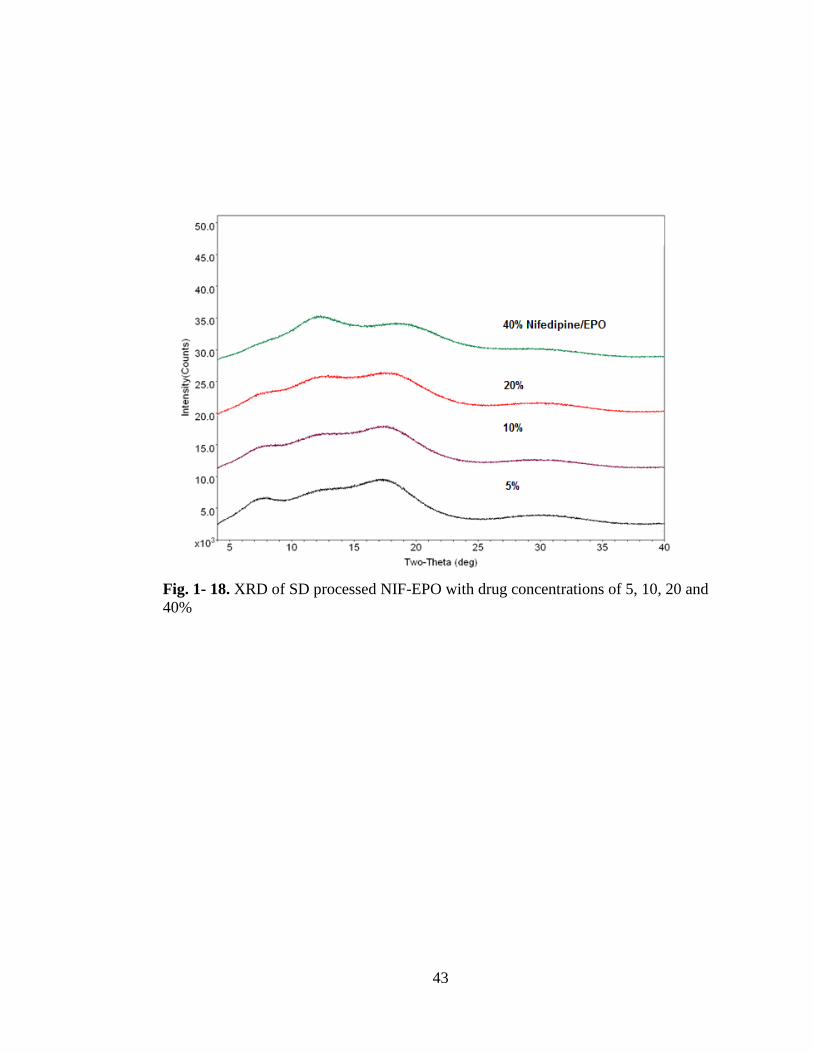
Fig. 1-18. XRD of SD processed NIF-EPO with drug concentrations of 5, 10, 20 and
40% ............................................................................................................................. 43
Fig 1-19 DSC thermogram of SD processed 40% NIF-HPMCAS LF with a presence
of melting endotherm .................................................................................................. 44
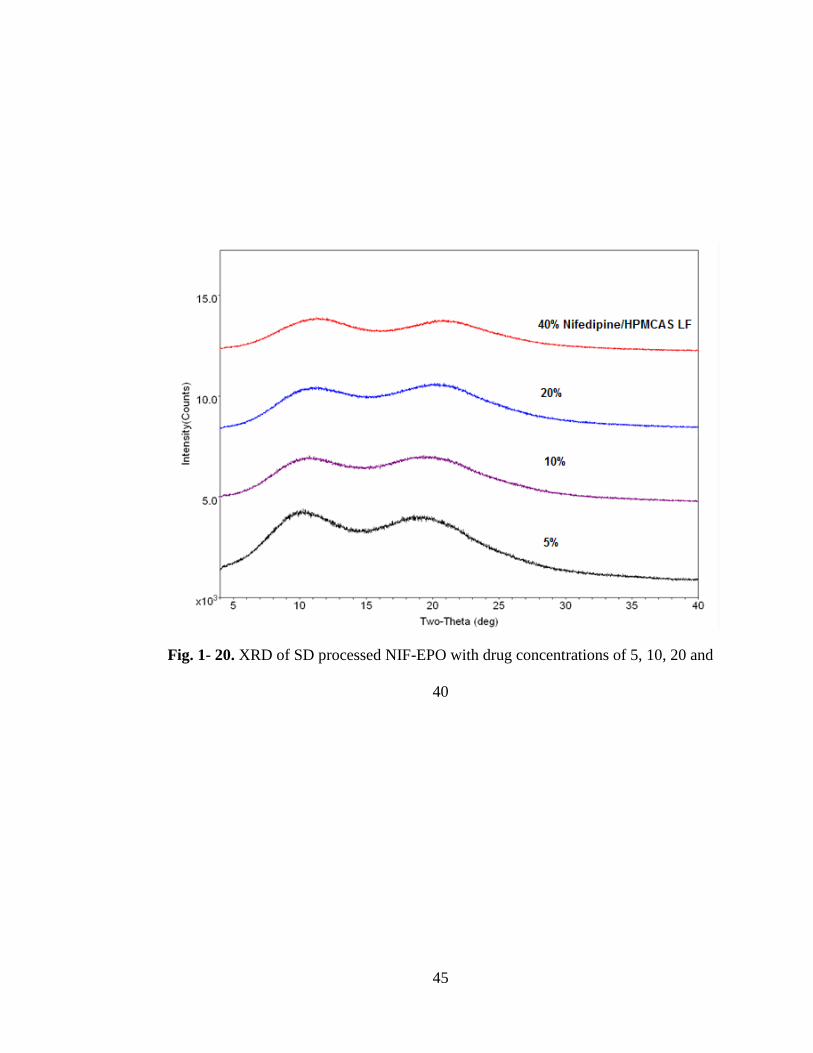
Fig 1-20 XRD of SD processed NIF-HPMCA with drug concentrations of 5, 10, 20
and 40% ....................................................................................................................... 45
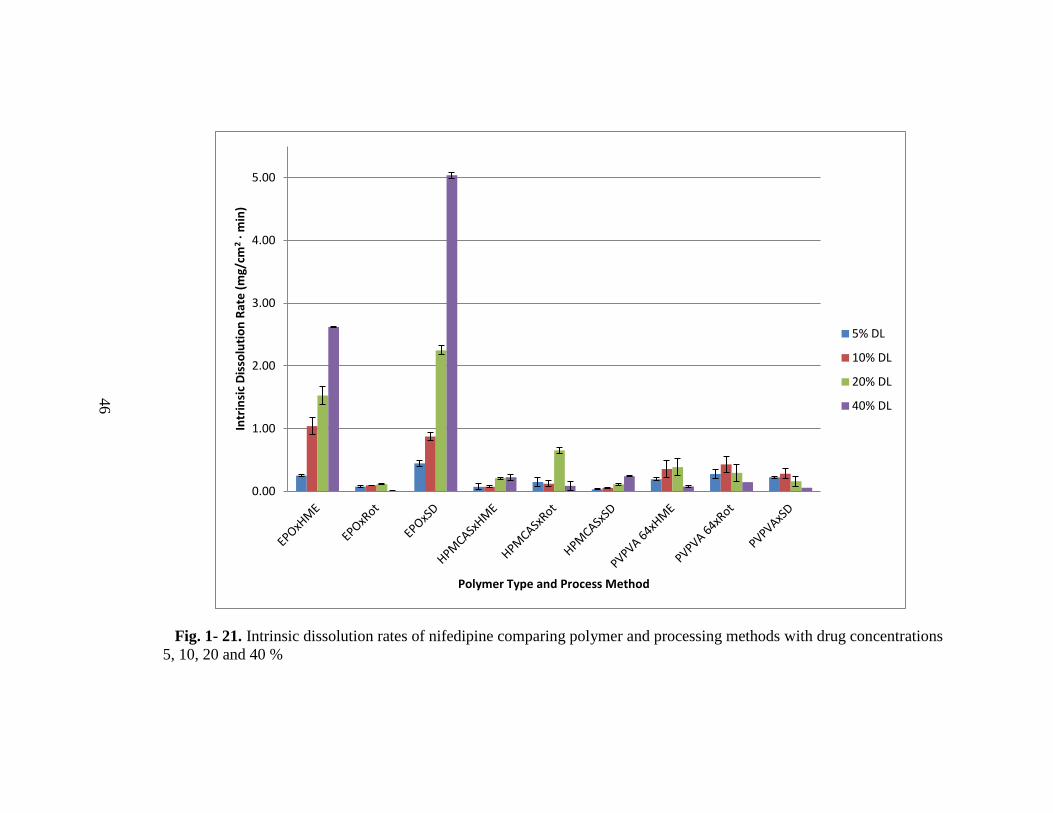
Fig. 1-21. Intrinsic dissolution rates of nifedipine comparing polymer and processing
methods with drug concentrations 5, 10, 20 and 40 % ............................................. ..46
Fig. 1-22. Interaction plots of process methods, polymer types and nifedipine
concentration in the samples. Polymer 1, 2 and 3 are EPO, HPMCAS LF and PVPVA
64 respectively and process 1, 2 and 3 are HME, Rot and SD respectively.
................................................................................................................................... ..47
Fig. 2-1 a-c Overlay plot of heat capacity measurements from DSC of nifedipine-
polymer mixtures (EPO, HPMCAS LF and A respectively) annealed at C
for 18 hours of various concentrations (a) 90 % (w/w) (b) 80 % (w/w) (c) 70% (w/w)
(d) 60 % (w/w) and (e) 50 % (w/w)
…………………………………………………………………………………. ……72
Fig.. 2-2 a-c. Plot of change in heat of fusion against drug weight fraction for each
nifedipine -polymer , EPO, HPMCAS LF and PVPVA 64, respectively
. ................................................................................................................................... 73
Fig. 3-1 a-c. Calculated changes in the total Gibbs free energy of amorphous solid
dispersions of nifedipine-EPO solid dispersions were prepared by hot melt extrusion
with drug concentrations , 0, 20 and 40% w/w. (c) ΔG3 was calculated with Flory-
Huggins interaction parameter, χ, by using the solubility parameter (a), heat of fusion
calculation (b) and melting point depression method (c).
……………………………………………………………………………….…......98
Fig. 3-2. Overall change in Gibbs free energy of amorphous solid dispersions of
nifedipine with EPO prepared by hot melt extrusion with drug concentrations 5, 10, 20
xiii
and 40% w/w.
………………………………………………………………………………………99
Fig. 3-3. Calculated changes in total Gibbs free energy of amorphous solid dispersions
of nifedipine with EPO prepared by rotary evaporation with drug concentrations 5, 10,
20 and 40% w/w
.................................................................................................................................. 100
Fig. 3-4. Calculated changes in total Gibbs free energy of amorphous solid dispersions
of nifedipine with EPO prepared by Spray drying with drug concentrations 5, 10, 20
and 40% w/w ............................................................................................................ 101
Fig. 3-5. Calculated changes in total Gibbs free energy amorphous solid dispersions of
nifedipine with HPMCAS LF prepared by hot melt extrusion with drug concentrations
5, 10, 20 and 40% w/w
.................................................................................................................................. 102
Fig. 3-6. Calculated changes in total Gibbs free energy of amorphous solid dispersions
of nifedipine with HPMCAS LF prepared by rotary evaporation with drug
concentrations 5, 10, 20 and 40% w/w
.................................................................................................................................. 103
Fig. 3-7. Calculated changes in total Gibbs free energy of amorphous solid dispersions
of nifedipine with HPMCAS LF prepared by spray drying with drug concentrations 5,
10, 20 and 40% w/w
................................................................................................................................... 104
Fig. 3-8. Calculated changes in total Gibbs free energy of amorphous solid dispersions
of nifedipine with PVPVA 64 prepared by hot melt extrusion with drug concentrations
5, 10, 20 and 40% w/w
. ................................................................................................................................. 105
Fig. 3-9. Calculated changes in total Gibbs free energy of amorphous solid dispersions
of nifedipine with PVPVA 64 prepared by rotary evaporation with drug concentrations
5, 10, 20 and 40% w/w
. ................................................................................................................................. 106
Fig. 3-10. Calculated changes in total Gibbs free energy of nifedipine-polymer
amorphous solid dispersions of nifedipine with PVPVA 64 prepared by spray drying
with drug concentrations 5, 10, 20 and 40% w/w
. ................................................................................................................................. 107
Fig. 3-11. Comparison of processing methods (HME, Rot and SD) and the resulting
change in Gibbs free energy of nifedipine-PVPVA 64 solid dispersions ................. 108

xiv
Fig. IA-1. A schematic diagram of a bench top conical twin-screw extruder …...... 109
Fig. IA-2. Diagram of spray dryer………………………………………………... ..110
Fig. IA-3 A schematic drawing of an intrinsic dissolution apparatus setup………...111
1
MANUSCRIPT 1
Evaluation of Processing Method, Polymer Selection and Drug Load on Amorphous
Solid Dispersion of Nifedipine
Kaoru Tominaga1, Harpreet Sandhu
2, Navnit Shah
2, Dharmendra Singhal
2, Waseem
Malick2, Serpil Kislalioglu
1,*
1Biomedical and Pharmaceutical Sciences, University of Rhode Island, 41 Lower
College Road, Kingston, RI 02881
2Pharmaceutical and Analytical Research and Development, Hoffmann-La-Roche Inc.,
340 Kingsland St, Nutley, NJ 07110
*To Whom All Correspondence Should Be Addressed, Phone: 401-874-5017, Fax:
401-874-2181, e-mail: [email protected]
Publication Status: To be submitted to Pharmaceutical Research

2
Abstract
Purpose: To evaluate the characteristics of amorphous solid dispersions of nifedipine
processed with hot melt extrusion (HME), rotary evaporation(ROT) and spray
drying(SD) at 5,10,20 and 40% w/w drug loadings, to determine the differences
involved in the final products.
Methods: Amorphous solid dispersion of nifedipine with Eudragit E 100 (Polymethyl
methacrylate), HPMCAS LF and PVPVA 64 were prepared via hot melt extrusion,
rotary evaporation and spray drying processes. The solid dispersions were analyzed
with DSC, FT-IR, PXRD and the intrinsic dissolution rates (IDR) were determined.
Results: NIF-EPO samples prepared by HME and SD showed the highest IDR.
However, analytical characterizations of the same samples show unstable amorphous
solid dispersion. To keep the molecular mobility of the amorphous solid dispersion to
a minimum to inhibit recrystallization, a system such as NIF-PVPVA 64 may be give
a better stable amorphous solid dispersions.
Keywords
Amorphous, Process Methods, Solid Dispersion, Intrinsic Dissolution Rate, Polymer
Introduction
Amorphous solid dispersions are one of the forms used in the pharmaceutical industry
to manipulate poorly water soluble drug molecules; to improve their solubility in
aqueous media and to achieve higher level of bioavailability. In an amorphous solid
dispersion, the hydrophobic drug is dispersed in an amorphous hydrophilic polymer
carrier by different means. The action of the polymer is twofold: to stabilize the

3
amorphous state of the drug and to improve the dissolution of the drug (1-5, 11). In
some cases, the use of polymer have shown to prevent precipitation of the drug from a
supersaturated solution created as the result of higher solubility of the amorphous form
compared to the crystalline one. (6, 7)
In the literature, the effects of processing methods on the final product properties are
rarely mentioned; for example, etravirine was processed by two different methods; via
film casting, and solvent evaporation and the effects of methodologies used on the
final solid dispersions were compared (7).
Weuts et al., studied the changes occurred in the melt and the spray dried powder and
they found that melting process provided a higher miscibility and longer stability
whereas the spray drying method was not sufficient to produce stable products (8).
Patterson et al. mentioned the differences in the drug properties obtained by quench
cooling and ball milling methods. However, the effects of each method used, were
different on each of the drugs used for testing (9).
Amorphous solid dispersion can be prepared by several methods such as physical
manipulation (i.e. milling) (9, 10), precipitation from solvents (11), melting (9, 12, 13)
and solvent removal (11,13). The two most commonly used amorphous processing
methods in the pharmaceutical industry are melting (fusion) and solvent removal. The
fusion method employs high temperatures to melt both the drug and the polymer
together; disperse the drug molecules throughout the polymer matrix and quench cool
the mixture by either extruding the mixture or by placing the molten mixture in an ice
bath or liquid nitrogen. The solvent removal method can produce an amorphous solid
4
dispersion by dissolving a poorly water soluble drug and a polymer in the same
organic solvent. In most cases a type of alcohol is used as a solvent and then the
solvent is removed by evaporation, lyophilization, vacuum drying or supercritical
condition respectively.
Comparison of the effects of the processing methods, including the effects of different
polymers used on the final products has been studied very little. We believe that the
methods that we have selected will produce products of different characteristics. The
reasoning behind this can be, for example, to investigate the differences in the rate of
solvent evaporation for rotary evaporation compared to spray drying. In spray drying
the solvent can evaporate from the droplets of drug-polymer combination in
“milliseconds” which can lead to a successful solid dispersion (13). The typical
evaporation capacity of the rotary evaporation and spray-drying differs since rotary
dryer can have evaporation rate of 30-80 kg H2O/ h∙m3 compared to spray dryer which
has 1-3 kg H2O/ h∙ m3 (17).
Janssens et al. compared spray dried amorphous solid dispersion of itraconazole to
film casted samples (11). The crystallization temperature of itraconazole reported for
the two processing methods showed that the onset of crystallization for the film casted
samples were lower which meant that the solid dispersions prepared by this process
gave less stable products by influencing the crystallization behavior of the drug in the
polymer.

5
In this study, amorphous solid dispersions of nifedipine (NIF), which is a calcium
channel blocker, used for the treatment of high blood pressure and to control angina,
with three different polymers, Eudragit E 100 [Poly(butyl methacrylate-co-(2-
demethylaminoeethyl) methacrylate-co-methyl methacrylate)], HPMCAS LF
(hydroxypropylmethylcellulose acetate succinate), PVPVA 64 (polyvinyl pyrrolidone
vinyl acetate) coprecipites. They were prepared by using hot melt extrusion (HME),
spray drying (SD) and rotary evaporation (Rot). The processed formulations were
analyzed for physical, thermal and chemical properties by using modulated differential
scanning calorimetry (MDSC), Fourier transform infrared spectroscopy (FT-IR),
powder X-ray diffraction (PXRD). The intrinsic dissolution rates were also measured
to relate properties obtained with the solubility of the final product.
MATERIALS AND METHODS
MATERIALS
The API (Active pharmaceutical ingredient) used was, nifedipine (NIF) purchased
from RIA International (East Hanover, NJ). Eudragit E-100 (EPO) polymer which was
kindly provided by Evonik (Parsippany, NJ), HPMCAS LF from Shin-Etsu Chemical
Co., Ltd (Biddle Sawyer Corp, New York, NY) and PVPVA 64 was purchased from
BASF (Florham Park, NJ).
Methylene chloride was used as the solvent in both spray drying and rotary
evaporation processes as received. For processing NIF with HPMCAS LF, methanol
was used because HPMCAS LF does not dissolve in methylene chloride. Both
solvents were purchased from Sigma-Aldrich Co. (St. Louis, MO).
6
Fig. 1-1 shows the chemical structures of the drug and the polymers and Table I lists
the physical-chemical properties of the drug and the polymers.
METHODS
Hot Melt Extrusion (HME)
Physical mixtures of NIF and EPO were prepared using a mortar and pestle with drug
loadings of 5, 10, 20 and 40 % w/w. The mixture was then extruded using Haake
Minilab micro compounder (Thermo Scientific, Waltham, MA). The extruded material
was ground and sized through a # 40 sieve. A diagram of a hot melt extruder is shown
in Appendix 1, Fig IA-1
In this machine, the physical mixture went into the extruder through the funnel on the
left hand side and softened with the temperature applied and extrudes out from the
flush hole. The extrusion screw speed was set to 50 RPM throughout the experiments
and no shear force was additionally applied to the mixture.
Rotary Evaporation (Rot)
The same physical mixtures prepared for HME were used for rotary evaporation.
Physical mixtures of 5-10 grams were dissolved in 50-100 mL of methylene chloride,
for EPO and PVPVA 64 respectively. The solvents were removed by using a rotary
evaporator apparatus (Büchi Rotavapor from Büchi (New Castle, DE). The rotary
evaporator was set to approximately 30 RPM for all experiments conducted. The
7
samples were collected by removing the foamy film formed on the walls of the flask
with a metal spatula and ground by using a mortar and pestle. The particles were sized
through a # 40 sieve.
Spray Drying (SD)
A Mini Spray Dryer B-290 (Büchi, New Castle, DE) attached to Inert Loop B-295
cooling block was used in the spray drying experiment to manufacture amorphous
solid dispersion of nifedipine prepared with three different polymers respectively. A
solution of NIF and polymer in methylene chloride (methanol in the case when
HPMCAS LF) was used as the polymer matrix having drug loads ranging from 5-40%
w/w. A solid content of 3 to 5% w/w solid content were used in order to adjust the
workability of the sample.
In Appendix I, the geometry of the spray dryer is shown in Fig. IA-2.
In this spray dryer, the solution is atomized from (1) while nitrogen is continuously
supplied from (2). The atomized droplets are dried in the heated chamber (3) and are
collected in the collection vessel through cyclone in (4). Smaller particles are removed
from the nitrogen flow by a filter located in (5) and the gas flows out to (6) to be
condensed to collect the solvent.
In our experiments, the pump speed was set to 24%, inlet temperature to 7 C, and
aspirator to 90% on the control panel. The two-fluid nozzle was used to allow
compressed air to disperse the pumped liquid into fine droplets. An electronic heater
was used to heat the nitrogen gas which would dry the droplets to evaporate the
solvent. The droplets would continue to dry in the spray cylinder and, a cyclone

8
created, separated the particles into the collection container or into the outer filter.
Aspirator located at the end of the spray dryer was used to generate the nitrogen flow
and to collect the used solvent into the cooling block.
Materials collected were transferred into an amber colored vial and were kept in
desiccators until further analysis.
Methods Used for Analytical Tests
Modulated differential scanning calorimetry (MDSC)
NIF-polymer samples were thermally analyzed with a MDSC instrument Q2000 (TA
Instruments, New Castle, DE). Samples to be scanned were weighed (6- 8 mg) and
placed in to aluminum pans with lids. Heating was controlled throughout the
measurement and the samples were heated from room temperature up to 20- 30°C
above the melting point of the pure drug at a rate of 5°C/ minute unless noted
otherwise. The samples were kept at the highest temperature for two minutes and then
cooled down to -50°C at -50°C/minute cooling rate. The samples were kept at the
lowest temperature for a maximum of 2 minutes and then heated up to 20-30 °C above
the melting point of the drug.
Fourier transform-infrared spectroscopy (FT-IR)
FT-IR used was Nicolet 6700 FT-IR spectrometer (Thermo Scientific, Waltham, MA)
to collect infrared spectra. The FT-IR was equipped with Smart Orbit ATR
(Attenuated Total Reflection) objective lens with a diamond crystal in reflection
mode. OMNIC software program was used to analyze the data.
9
Powder X-ray diffraction (PXRD)
PXRD was performed by using X-ray diffraction obtained with Bruker D8 XRD. The
samples were analyzed using Cu, K α radiation to determine the crystalline or
amorphous phases of the drugs. The X-Ray pattern was collected in the angular range
of < 2θ < 40° in the step scan mode (step width 0.02°, scan rate °/ per minute).
Intrinsic dissolution rate determination (IDR)
Dissolution studies using solid dispersions samples obtained, which contained 5, 10,
20 and 40% w/w NIF and the three polymers respectively, were prepared by HME,
Rot and SD, were conducted to determine the intrinsic dissolution rates. USP II
apparatus with an amber vessel was used for the study. Fig. IA-3 in Appendix I shows
the setup of an intrinsic dissolution vessel with a die, containing a drug compact
exposing a single surface to the dissolution media at the bottom. Approximately 200
mg of sample was weighed and compressed in a disk with a press using 2000 lbs.
force with 5 second dwelling time. Dissolution media used in the experiments were
500 mL of 0.1 N hydrochloric acid with pH of 1.2 for NIF-EPO samples. Phosphate
buffer with pH6.8 was used for all other samples. Temperature used was 37 C. IDR
was determined using the initial linear profile of the dissolution plot. The 3x3x4
factorial design of experiments were analyzed with a general linear model of ANOVA
to determine the effects of processing methods, polymer choice and drug
concentration on IDR.
10
RESULTS
Products Obtained with Hot Melt Extrusion (HME)
In HME, we observed significant changes at the –NH stretch and the C=O of the ester
groups with the wavelength changing at 3318 cm-1
and at1676 cm-1
peaks which
agrees with previous reporting (23) that indicate hydrogen bond interaction with NIF-
HPMCAS LF and NIF-PVPVA 64 samples occurred, see Figs. 1-.2 and 3. No
significant interaction was present with NIF-EPO samples. The peak at 3318 cm-1
which is associated with the –NH moiety, shifts to a lower wave number and the peak
broadening and shift to a higher wave number of the C=O have been linked to
hydrogen bonding interaction between nifedipine and polymer solid dispersions (24,
25).
According to the DSC thermograms, HME process creates amorphous solid
dispersions up to 20 % drug concentrations for all polymers and up to 40 % drug
concentration for NIF-PVPVA 64 solid dispersions. With NIF-EPO and NIF-
HPMCAS LF samples, at 40 % drug concentration, melting endotherms were
observed, see Figs. 1.4 and 1.5. Although all the samples prepared by HME process
had one Tg which are shown in Table , suggesting a one-phase amorphous solid
dispersion, a melting endotherm seen at 6 C which was preceded with a
recrystallization peak of the NIF-EPO sample indicated thermal instability;
crystallization of NIF was not apparent in the XRD data, Fig. 1- 6. There was also a
melting endotherm that was observed at 6 C of the NIF-HPMCAS LF sample at 40
% drug concentration, which was not preceded by a recrystallization peak. This may

11
suggest that there were small nifedipine clusters in the solid dispersion that did not
convert to amorphous form that had melted while the sample was heated in the DSC
instrument, see Fig. 1- 7. They were too small to be detected by the XRD.
The findings from the XRD can suggest the possible limitation of high-angle x-ray
diffraction. The presence of the melting endotherm may be the result of applied heat
resulted in an unstable amorphous solid dispersion by the DSC, which caused
recrystallization of the drug.
When the dissolution rates of the samples obtained with HME were investigated
(Table III ), it is seen that the increasing dissolution rates are obtained with increasing
drug concentrations with EPO and HPMCAS LF. This is an expected finding.
However, with PVPVA 64 polymer, dissolution rates are not following the same path.
The reason may be that the high solubility of PVPVA 64 in water compared to EPO
and HPMCAS LF. When the polymer engulfing the nifedipine molecules in a solid
dispersion dissolves immediately, it exposes the drug molecules to the dissolution
medium resulting high concentration of drug, which may be the reason of rapid
crystallization and precipitation resulting lower intrinsic dissolution rate.
Products obtained with Rotary evaporation (Rot)
Rotary evaporation also caused hydrogen bonding of nifedipine with; HPMAS and
PVPVA 64, see Figs. 1-8 and 1-9. However, the DSC data, with PVPVA 64, Fig 1- 0,
demonstrates the presence of two glass transition temperatures. The first appears at
.0 C and the second at 2 . 7 C. Although the X-ray diffractions showed
amorphous product at all drug concentrations, shown in Fig. 1-11, the DSC data may

12
indicate the presence of two amorphous phases, one being the drug-rich, the other
being the polymer rich regions since the change in the glass transition temperatures
have shifted from a lower temperature to a higher one that is closer to the glass
transition temperature of the polymer. Occurrence of two glass transition temperature
regions could be the result of phase separation of the amorphous solid dispersions.
This was suggested by Rumondor et al. (16).
n the C spectrogram, 20 % F-E O sample showed a melting endotherm at
47.07 C which suggests that there are crystalline nifedipine present in the solid
dispersion, see Fig. 1- 12. In 40 % NIF-EPO sample, also a similar melting endotherm
is present, at 0. C, Fig. 1-13. The melting endotherm is accompanied with a
recrystallization peak which suggests that it is a combination of crystalline nifedipine
and unstable amorphous nifedipine that reverted to the crystalline form.
The XRD results for the NIF-EPO solid dispersions confirm the presence of
crystalline nifedipine at 40 % drug concentration Fig. 1- 14. Sample prepared with
HPMCAS LF polymer e hibited a melting endotherm at 40 % nifedipine
concentration at 63.3 C, Fig. 1- 15. This melting endotherm indicates the presence
of undissolved nifedipine that had melted during the DSC scan. This crystalline
nifedipine was also detected in the XRD spectrogram in Fig 1-16.
The intrinsic dissolution rates calculated , increase up to 20 % NIF-EPO samples and
decrease about 50 times for 40 % drug concentration Table I.III. The presence of
13
both undissolved and unstable amorphous nifedipine could be the cause for the
reduced dissolution rate.
For NIF-HPMCAS LF samples, there is a linear relationship between the drug
concentration and the IDR. With increase in the drug concentration, the IDR will also
increase even at 40 % drug concentration which contains crystalline nifedipine. The
reason for not seeing the reduction in the IDR at 40 % drug concentration, maybe the
result of HPMCAS LF’s ability to inhibit precipitation of amorphous drug in
dissolution media.
For PVPVA polymer, dissolution rates appear to be random and not consistent with
increasing drug concentration. As explained earlier, the two glass transition regions
seen in Fig. 1- 10, the possible phase separated nifedipine may be the cause for
inconsistent trend.
Products Obtained with Spray Drying (SD)
Spray dried samples showed no interaction between nifedipine and EPO but showed
strong interaction between nifedipine and PVPVA 64 at 2937 cm-1
and 1698 cm-1.
Similar interactions were seen given in Fig 1-8 and1- . amples prepared with E O
were amorphous up to 20 % drug concentration, according to the C thermogram
which showed melting endotherm at 0.67 C accompanied by a recrystallization
peak, Fig. 1- 17. This recrystallization was not apparent in the XRD diffractograms
shown in Fig. 1- 18.
14
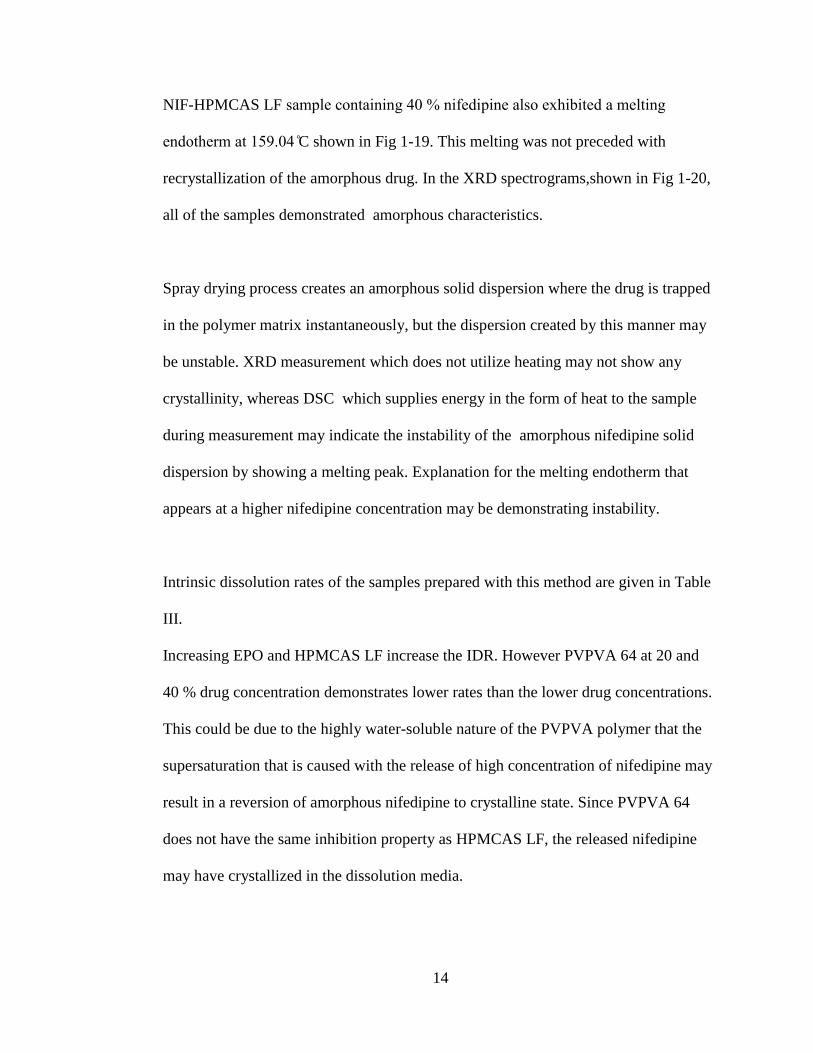
NIF-HPMCAS LF sample containing 40 % nifedipine also e hibited a melting
endotherm at .04 C shown in Fig 1-19. This melting was not preceded with
recrystallization of the amorphous drug. In the XRD spectrograms,shown in Fig 1-20,
all of the samples demonstrated amorphous characteristics.
Spray drying process creates an amorphous solid dispersion where the drug is trapped
in the polymer matrix instantaneously, but the dispersion created by this manner may
be unstable. XRD measurement which does not utilize heating may not show any
crystallinity, whereas DSC which supplies energy in the form of heat to the sample
during measurement may indicate the instability of the amorphous nifedipine solid
dispersion by showing a melting peak. Explanation for the melting endotherm that
appears at a higher nifedipine concentration may be demonstrating instability.
Intrinsic dissolution rates of the samples prepared with this method are given in Table
III.
Increasing EPO and HPMCAS LF increase the IDR. However PVPVA 64 at 20 and
40 % drug concentration demonstrates lower rates than the lower drug concentrations.
This could be due to the highly water-soluble nature of the PVPVA polymer that the
supersaturation that is caused with the release of high concentration of nifedipine may
result in a reversion of amorphous nifedipine to crystalline state. Since PVPVA 64
does not have the same inhibition property as HPMCAS LF, the released nifedipine
may have crystallized in the dissolution media.

15
Over all , spray drying process can incorporate 20% of drug in the solid dispersion
regardless of the type, molecular weight and structure of the polymers used.
Intrinsic Dissolution Rates Comparison
In Fig. 1- 21, the IDR of all the samples prepared by HME, Rot and SD using three
different polymers, EPO, HPMCAS LF and PVPVA 64 at four different drug
concentrations are shown. From this plot, it can be seen that NIF-EPO sample that was
spray dried with 40 % drug concentration has the highest IDR. To attain a better idea
of factors that affected the IDR, we have looked into other properties of the prepared
solid dispersion.
Investigation of TableI- gives us information about the ΔHfus which is indicating that
the drug was not reverted to the amorphous form. n HME method, the value of ΔHfus
is 2.4 J/g for NIF-EPO sample at 20 % drug concentration and 20.2 J/g at 40 % drug
concentration. For NIF-HPMCAS LF sample, at 40 %, there was a melting endotherm
with ΔHfus measuring 5.2 J/g.
For Rot, in E O, ΔHfus is 2.8 J/g for the NIF-EPO sample at 20 % drug concentration
and 21.1 J/g at 40 % drug concentration. NIF-HPMCAS LF e hibited ΔHfus of 12.4
J/g at 40 % drug concentration.
For SD process both NIF-EPO and NIF-HPMCAS LF samples at 40 % drug
concentrations were presented with, ΔHfus as 20.3 and 8.6 J/g respectively. These
findings suggest that Rot process is the least efficient method to convert crystalline
drug into amorphous solid dispersions where the crystalline drug is still present at 20
% concentration. On the other hand, SD is the most efficient process where all

16
polymer converted nifedipine into amorphous solid dispersion up to 20 % drug
concentration.
The ANOVA analysis of the IDR of the amorphous solid dispersions in order to
determine the factors that may influence the intrinsic dissolution rate showed that
interaction of all three factors (i.e. processing, polymer type and drug concentration)
which will change the IDR of amorphous nifedipine solid dispersions with changes in
any one factor or factors combined.
For example, investigating the interaction plots shown in Fig. 1- 22, we can conclude
that if we want to choose the best processing method with the highest drug
concentration, we should choose SD method. On the other hand, if we want to choose
the optimum process and polymer combination, we should select SD with EPO. EPO
at 40 % drug concentration yields the highest IDR. Since all three factors affect the
IDR significantly, we cannot conclude that any one of the factor is the dominant one,
in terms of yielding a high intrinsic dissolution rate. Since process conditions were not
optimized for preparing the amorphous solid dispersions, optimization of each process
and using design of experiments may provide the answer to this question.
Discussions
The results from the IDR experiments show that NIF-EPO samples prepared by HME
or SD have higher dissolution rate. The slightly acidic nature of nifedipine results in
the higher intrinsic dissolution rate in an acidic aqueous medium as shown with
amorphous solid dispersions prepared with EPO at all three processing methods.

17
Overall, the higher drug loading resulted in faster dissolution rates across all three
polymers and processing methods.
The MDSC measurements, resulted with a melting endotherm appearing at the drug
loading of 20%,w/w, as it is seen in NIF-EPO systems Fig. 1-4, indicated
metastability even though its IDR is high. There is high risk in such solid dispersions,
because the metastable amorphous NIF, can revert back to the crystalline form either
during dissolution or while the samples sit on the shelf. Therefore, NIF-PVPVA 64
samples should be used as more suitable combinations processed by any of the
methods tested in this study, even if their IDR are lower. The risk of crystalline
conversion of these samples will be much lower as FT-IR analysis demonstrated a
secondary interaction between NIF and PVPVA 64 polymer. With such an
interaction, the polymer can slow down crystalline conversion and even more, it could
possibly stabilize the supersaturated solution for a longer time period during
dissolution.
It has been shown that amorphous solid dispersion of nifedipine prepared with EPO
with spray drying process yielded the highest intrinsic dissolution rates. This could be
due to lack of hydrogen bond interaction of the drug with the polymer which means
that the water molecules in the dissolution media won’t compete with the polymer to
remove the amorphous drug molecule from the bulk. On the other hand, without
polymer-drug interaction, the metastable amorphous nifedipine may convert easily to
its stable crystalline form. This is evident in the MDSC data presented as the melting

18
endotherm in 20 and 40% drug loads of NIF-EPO samples. Additionally, the low Tg,
of NIF-EPO solid dispersion systems may be unstable according to the well known
Tg -50°C rule, declaring that the glass transition temperature of the solid dispersion
should be above 50°C of the storage temperature to keep the system stable [28]. With
the high molecular mobility environment, the high intrinsic dissolution rate may not
translate to sustained supersaturated nifedipine solution but may result in fast
precipitation of the reverted crystal nifedipine.
Conclusion
Amorphous solid dispersions of NIF with three polymers via HME, Rot and SD were
made. The highest IDR was achieved when NIF-EPO sample was prepared by spray
drying and second highest IDR with HME, with 40% drug loading. The reasons of the
differences obtained were explained. However, these samples may not be the best
candidates to proceed for formulation due to their unstable amorphous character. In
that case, NIF-PVPVA 64 samples may be a better choice which the polymer has a
better stabilizing ability compared to EPO polymer

19
References
[1] W. L. Chiou, S. Riegelman, Pharmaceutical applications of solid dispersion
systems, J. Pharm. Sci. 60 (1971) 1281-1302.
[2] C. Leuner, J. Dressman, Improving drug solubility for oral delivery using solid
dispersions, Eur. J. Pharm. Biopharm. 50 (2000) 47-60.
[3] S. Janssens, G. Van den Mooter, Review: physical chemistry of solid dispersions,
J. Pharm. Pharmocology 61 (2009) 1571-1586.
[4] T. Vasconcelos, B. Sarmento, P. Costa, Solid dispersions as strategy to improve
oral bioavailability of poor water soluble drugs, Drug Discovery Today, 12 (2007)
1068-1076.
[5] N. Blagden, M. de Matas, P.T. Gavan, P. York, Crystal engineering of active
pharmaceutical ingredients to improve solubility and dissolution rates, Adv. Drug
Delivery Rev. 59 (2007) 617–630.
[6] F. Usui, K. Maeda, A. Kusai, K. Nishimura, K. Yamamoto, Inhibitory effects of
water-soluble polymers on precipitation of RS-8359, Int. J. Pharm. 154 (1997) 59-66.
[7] H. R. Guzman, M. Tawa, Z. Zhang, P. Ratanabanangkoon, P. Shaw, C. R.
Gardner, H. Chen, J.P. Moreau, O. Almarsson, J. F. Remenar, Combined use of
crystalline salt forms and precipitation inhibitors to improve oral absorption of
celecoxib from solid oral formulations, J. Pharm. Sci. 96 (2007) 2686-2702.
[8] I. Weuts, F. Van Dycke, J. Voorspoels, S. De Cort, S. Stokbroekx, R. Leemans, M.
E. Brewster, D. Xu, B. Segmuller, Y. T. A.Turner, C. J. Roberts, M. C. Davies, S.
Qi,D. Q.M. Craig, M. Reading, Physicochemical properties of the amorphous drug,
cast films, and spray dried powders to predict formulation probability of success for
solid dispersions: Etravirine, Pham. Tech. 100 (2011) 260-274.
[9]S. Janssens, A. De Zeure, A. Paudel, J. Van Humbeeck, P. Rombaut, G. Van den
Mooter, Influence of preparation methods on solid state supersaturation of amorphous
solid dispersions: A case study with itraconazole and Eudragit E100, Pharm. Res. 27,
(2010) 775-785.
[10] J. E. Patterson, M. B. James, A. H. Forster, T. Rades, Melt extrusion and spray
drying of carbamazepine and dipyridamole with polyvinylpyrrolidone/vinyl acetate
copolymers, Drug Dev. Ind. Pharm. 34 (2008) 95-106.
[11] M. Alleso, N. Chieng, S. Rehder, J. Rantanen, T. Rades, J. Aaltonen, Enhanced
Dissolution rate and synchronized release of drugs in binary systems through
formulation: Amorphous naproxen-cimetidine mixtures prepared by mechanical
activation, J. Control. Release 136 (2009) 45-53.

20
[12] A. P. Simonelli, S. C. Mehta, W. I. Higuchi, Dissolution rates of high energy
polyvinylpyrrolidone (PVP) sulfathiazole coprecipitates, J. Pharm. Sci. 58 (1969) 538-
549.
[13] K. Six, H. Berghmans, C. Leuner, J. Dressman, K. Van Werde, J. Mullens, L.
Benoist, M. Thimon, L. Meublat, G. Verreck, J. Peeters, M. Brewster, G. Van den
Mooter, Characterization of solid dispersions of itraconazole and
hydroxypropylmethylcellulose prepared by melt extrusion, Part II, Pharm. Res. 20
(2003) 1047-1054.
[14] J. E. Patterson, M. B. James, A. H. Forster, R. W. Lancaster, J. M. Butler, T.
Rades, Preparation of glass solutions of three poorly water soluble drugs by spray
drying, melt extrusion and ball milling, Int. J. Pharm. 336 (2007) 22–34
[15] G. F. almieri, . Wehrle, . Martelli, nteractions between lonidamine and β- or
hydroxypropyl-β-cyclodextrin, Drug Dev. Ind. Pharm. 24 (1998) 653-660.
[16] A.S. Mujumdar, A.S. Menon, Handbook of industrial drying Vol 1. 1995 1-40.
[17] C.Z. Chuaia, K. Almdalc, J. Lyngaae-Jørgensen, Phase continuity and inversion
in polystyrene/poly(methyl methacrylate) blends, Polymer 44 (2003) 481–493.
[18] Rumondor, A. C. F., Patrick J. Marsac, Lindsay A. Stanford, and Lynne S.
Taylor, Phase Behavior of Poly(vinylpyrrolidone) Containing Amorphous Solid
Dispersions in the Presence of
Moisture Mol. Pharm. 6 (2009) 1492-1505.
[19] S. Guns, A. Dereymaker, P. Kayaert, V. Mathot, J. A. Martens, G. Van den
Mooter, Comparison between hot-melt extrusion and spray-drying for manufacturing
solid dispersions of the graft copolymer of ethylene glycol and vinylalcohol, Pharm.
Res. 28 (2011) 673-682.
[20] H. Friedrich, A. Nada, R. Bodmeier, Solid state and dissolution rate
characterization of co-ground mixtures of nifedipine and hydrophilic carriers, Drug
Dev. Ind. Pharm. 31 (2005) 719-728.
[21 ] H.K. Chan, D. J.W. Grant, Influence of compaction on the intrinsic dissolution
rate of modified acetaminophen and adipic acid crystals, Int. J. Pharm. 57 (1989) 117-
124.
[22] L. X. Yu, A. S. Carlin, G. L. Amidon, A. S. Hussain, Feasibility studies of
utilizing disk intrinsic dissolution rate to classify drugs, Int. J. Pharm. 270 (2004) 221-
227.

21
[23] X.C. Tang, M. J. Pikal, L. S. Taylor, A Spectroscopic investigation of hydrogen
bond patterns in crystalline and amorphous phases in dihydropyridine calcium channel
blockers, Pharm. Res. 19 (2002) 477-483.
[24] F. Cilurzo, P. Minghetti, A. Casiraghi, L. Montanari, Characterization of
nifedipine solid dispersions, Int. J. Pharm. 242 (2002) 313-317.
[25] J. Huang, R. J. Wigent, J. B. Schwartz, Drug-polymer interaction and its
significance on the physical stability of nifedipine amorphous dispersion in
microparticles of an ammonio methacrylate copolymer and ethylcellulose binary
blend, J. Pharm. Sci. 97 (2008) 251-261.
[26] P.J. Marsac, H. Konno, and L. S. Taylor, A Comparison of the Physical Stability
of Amorphous Felodipine and Nifedipine Systems, Pharm. Res. 23 (2006) 2306-2316.
[27] B. C. Hancock, S. L. Shamblin, G. Zografi, Molecular mobility of amorphous
pharmaceutical solids below their glass transition temperatures, Pharm. Res. 12 (1995)
799-8006.
[28] M. Savolainen , K. Kogermann, A. Heinz, J. Aaltonen, L. Peltonen, C. Strachan,
J. Yliruusi, Better understanding of dissolution behaviour of amorphous drugs by in
situ solid-state analysis using Raman spectroscopy, Eur. J. Pharm. Biopharm. 71
(2009) 71-79.

22
. Table 1-I. Physicochemical properties of nifedipine (a), EPO, HPMCAS LF and PVPVA 64 (b) (MW, Tg, Tm ΔHfus are
molecular weight, glass transition and melting point temperature, and heat of fusion, respectively)
(a) MW (g/mol) Tg and Tm
(°C)
Aqueous
solubility
H-
bonding Charge pKa ΔHfus
Nifedipine 346.335 Tm 172.1
.6 μg/mL 1 donor 7
acceptors Neutral 3.93 106.4±3.63
Tg 47±1
(b)
Polymer Polymer type
Monomer
MW
(g/mol)
MW
(g/mol) Tg (°C)
Solubility H-
bonding Charge
Aqueous
Solubility in
Methanol
Eudragit E
100 Copolymer 399.522 135000 52
1g of
polymer
dissolves in
7g
7
acceptors Cationic ≤pH .
HPMCAS
LF Homopolymer 286.28 18000 120
Freely
soluble
9
acceptors Anionic ≥pH .
6 donors
PVP-
VA64
Random
copolymer 197.23
45000-
70000 100
Freely
soluble
3
acceptors Non-ionic pH 5-7
23
Table 1-II. Melting and glass transition temperature and heat capacity measurement
of nifedipine with EPO, HPMCAS LF and PVPVA 64 solid dispersions respectively,
processed by HME, Rot and SD with drug loads ranging from 5 to 40% (w/w)
Polymer
Drug Load
% (w/w)
HME Rot SD
Tg C) Tm C) ΔHfus
(J/g) Tg C) Tm C)
ΔHfus
(J/g) Tg C) Tm C)
ΔHfus
(J/g)
EPO
5 47.5 ±2.2
52.6 ±0.5
50.5 ±2.6
10 46.9 ±0.3
52.6 ±0.1
54.1 ±3.0
20 42.6 ±0.1
147.4 ± 0.4
2.4 ± 0.2
42.0 ±0.4
147.7 ± 0.0
2.8 ± 0.3
43.0 ±0.6
40 41.0 ±0.2
160.5 ± 0.0
20.2 ± 3.0
42.6 ±0.0
156.0 ± 0.0
21.1 ± 1.8
41.0 ±0.4
160.2 ± 0.3
20.3 ± 0.7
HPMCAS LF
5 111.4 ±1.2
113.4 ±0.8
104.6 ±1.3
10 101.7 ±1.9
105.8 ±1.0
94.9 ±1.7
20 90.1 ±0.7
92.2 ±0.1
78.9 ±0.3
40 68.3 ±0.3
165.6 ± 0.2
5.2 ± 0.5
68.8 ±1.1
163.6 ± 0.4
12.4 ± 1.3
65.3 ±1.4
164.5 ± 0.1
8.6 ± 0.1
PVPVA 64
5 105.2 ±0.7
106.4 ±0.4
101.2 ±4.5
10 104.0 ±0.7
103.9 ±0.8
100.2 ±0.4
20 99.4 ±0.4
98.9 ±0.1
97.5 ±0.9
40 92.3 ±4.4
88.9 ±0.2
88.9 ±4.8
40*
125 .57

24
Table 1-III. Intrinsic dissolution rates of nifedipine with EPO, HPMCAS LF and
PVPVA 64 respectively processed by HME, Rot and SD with drug loads ranging from
5 to 40% (w/w)
Polymer Drug Load % (w/w)
Intrinsic Dissolution Rate (mg/min/cm2)
HME Rot SD
EPO
5 0.499 ± 0.026 0.147 ± 0.021 0.891 ± 0.095
10 2.077 ± 0.279 0.191 ± 0.009 1.748 ± 0.14
20 3.053 ± 0.017 0.223 ± 0.574 4.497 ± 0.574
40 5.24 ± 0.995 0.0044 ± 0.0004 10.077 ± 0.442
HPMCAS LF
5 0.139 ± 0.096 0.295 ± 0.141 0.065 ± 0.021
10 0.147 ±0.034 0.233 ± 0.091 0.109 ± 0.023
20 0.418 ± 0.059 1.30 ± 0.227 0.221 ± 0.013
40 0.452 ± 0.124 0.174 ± 0.057 0.478 ± 0.198
PVPVA 64
5 0.383 ± 0.045 0.552 ± 0.129 0.449 ± 0.031
10 0.71 ± 0.276 0.856 ± 0.269 0.562 ± 0.161
20 0.769 ± 0.164 0.588 ± 0.236 0.324 ± 0.086
40 0.153 ± 0.094 0.293 ± 0.064 0.113 ± 0.015
25
Table 1-IV ANOVA analysis of the 3x3x4 factorial design of NIF samples with IDR
as response
Analysis of Variance for IDR, using Adjusted SS for Tests
Source DF Seq SS Adj SS Adj MS F P
Process 2 6.8496 6.8496 3.4248 237.66 0.000
Polymer 2 23.6190 23.6190 11.8095 819.50 0.000
DL 3 8.7270 8.7270 2.9090 201.87 0.000
Process*Polymer 4 19.7815 19.7815 4.9454 343.18 0.000
Process*DL 6 7.6740 7.6740 1.2790 88.75 0.000
Polymer*DL 6 19.0706 19.0706 3.1784 220.56 0.000
Process*Polymer*DL 12 13.2428 13.2428 1.1036 76.58 0.000
Error 72 1.0376 1.0376 0.0144
Total 107 100.0021
26
Fig. 1-1. Chemical structures of nifedipine and the polymers used in the study (a)
nifedipine, (b) EPO, (c) HPMCAS LF and (d) PVPVA 64.
(b)
(a)
27
Fig. 1-2 a and b FT-IR spectra of HME processed NIF-HPMCAS LF with 5% (a) and
40% (b) drug loading
(b)
(a)

28
Fig. 1-3 a and b FT-IR spectra of HME processed NIF-PVPVA 64 with 5% (a) and
40% (b) drug loading
(b)
(a)

29
Fig. 1-4. DSC thermogram of HME processed 40% DL of nifedipine-EPO

30
Fig.1-5. DSC thermogram of HME processed 40% NIF-HPMCAS LF

31
Fig.1-6. XRD diffractogram of HME processed NIF-EPO samples at 5, 10, 20 and 40
% nifedipine concentrations

32
Fig. 1-7 XRD diffractions of HME processed NIF-HPMCAS LF samples with 5, 10,
20 and 40 % drug concentrations
33
Fig. 1-8. FT-IR spectra of Rot processed NIF-HPMCAS LF with 5% (a) and 40% (b)
drug loadings
(b)
(a)

34
Fig. 1-9. FT-IR spectra of Rot processed NIF-PVPVA 64 with 5% (a) and 40% (b)
drug loadings
(a)
(b)

35
Fig. 1-10. DSC thermogram of Rot processed 40% NIF-PVPVA 64 with a presence of
two Tgs

36
Fig. 1- 11. XRD spectrograms of Rot processed NIF-PVPVA 64 at 5, 10, 20 and 40 %
nifedipine concentrations
37
Fig. 1- 12. DSC thermogram of Rot processed 20% NIF-EPO with a presence of
melting endotherm
38
Fig. 1- 13. DSC thermogram of Rot processed 40% NIF-EPO with a presence of
melting endotherm
39
Fig. 1- 14. XRD spectrograms of Rot processed NIF-EPO with 5, 10, 20 and 40 %
drug concentrations

40
Fig. 1- 15. DSC thermogram of Rot processed 40% NIF-HPMCAS LF with a
presence of melting endotherm

41
Fig. 1- 16. XRD spectrograms of Rot processed NIF-HPMCAS LF with 5, 10, 20 and
40 % drug concentrations

42
Fig. 1- 17. DSC thermogram of SD processed 40% NIF-EPO with a presence of
melting endotherm
43
Fig. 1- 18. XRD of SD processed NIF-EPO with drug concentrations of 5, 10, 20 and
40%

44
Fig. 1- 19. DSC thermogram of SD processed 40% NIF-HPMCAS LF with a presence
of melting endotherm
45
Fig. 1- 20. XRD of SD processed NIF-EPO with drug concentrations of 5, 10, 20 and
40
46
Fig. 1- 21. Intrinsic dissolution rates of nifedipine comparing polymer and processing methods with drug concentrations
5, 10, 20 and 40 %
0.00
1.00
2.00
3.00
4.00
5.00
Intr
insi
c D
isso
luti
on
Rat
e (
mg/
cm2
∙ min
)
Polymer Type and Process Method
5% DL
10% DL
20% DL
40% DL

47
SDRotHME
0.10
0.08
0.06
0.04
0.02
0.00
Process
Me
an
EPO
HPMCAS LF
PVPVA 64
Polymer
Interaction Plot for IDR
Fig. 1-22. Interaction plots of process methods, polymer types and nifedipine
concentration in the samples. 1, 2 and 3 are EPO, HPMCAS LF and PVPVA 64
respectively and for process 1, 2 and 3 are HME, Rot and SD respectively

48
Manuscript 2
Testing the use of “heat of fusion” in calculations of interaction parameter (χ) in
Flory-Huggins and its comparison with the use of melting point depression and
solubility parameters
Kaoru Tominaga1, Serpil Kislalioglu
1,*, Harpreet Sandhu
2, Navnit Shah
2, Waseem
Malick2
1Biomedical and Pharmaceutical Sciences, University of Rhode Island, 7
Greenhouse Road, Kingston, RI 02881
2Pharmaceutical and Analytical Research and Development, Hoffmann-La-Roche
Inc.,
340 Kingsland St, Nutley, NJ 07110
*To Whom All Correspondence Should Be Addressed, Phone: 401-874-5017, Fax:
401-874-2181, e-mail: [email protected]
Publication Status: To be submitted to European Journal of Pharmaceutics and
Biopharmaceutics

49
Abstract
Flory-Huggins (F-H) interaction parameter is used to predict the miscibility of
drug-polymer amorphous solid dispersions. Most commonly used method to
determining the interaction parameter is by using the solubility parameters or by
measuring the melting point depression of the two mixed components. Although
these are very popular methods, they are not without limitations. For the solubility
parameters, there is a problem with accurate calculations and with melting point
depression, the temperature and composition of the system keeps changing even
though the interaction parameter is dependent on these values. By annealing the
drug-polymer mixture at a set temperature and by determining the equilibrium
solubility of nifedipine in polymers, we have been able to improve on the
determination of the F-H interaction parameters.
Keywords: Flory-Huggins interaction parameter, melting point depression,
solubility parameter, DSC, nifedipine, miscibility, polymer

50
1. Introduction
Most of the poorly water soluble drugs have crystalline structures. Therefore
they are challenging to prepare as pharmaceutical formulations due to the low
solubility which leads to low bioavailability. In many cases for such a drug, this
property can be the limiting factor minimizing the success of the product.
There have been numerous techniques used to formulate such drugs by improving
their solubility by manipulating the morphological and other physical-chemical
properties. One such technique is to prepare an amorphous solid dispersion of a
drug in a water soluble polymer. Compared to the crystalline state, a drug in an
amorphous state has higher solubility in a solution due to the higher energy state
which is the result of greater entropy and free energy [1]. However in the
amorphous form, the drug is thermodynamically unstable for the same reason.
Suitable polymers can modify crystallinity of the drug and degree of crystallization
thus, improve the thermodynamic stability.
The purpose of producing an amorphous solid dispersion of a drug in an
amorphous polymer is to improve the bioavailability of the drug. In this way, high
therapeutic concentrations can be incorporated into the formulation. In many
cases, if therapeutic concentration is high, the supersaturation state is created.
However in the supersaturated state, faster crystallization of the drug may occur
during storage as the result of higher kinetic driving force (the molecular mobility
of drug in the polymer matrix) and the thermodynamic instability of the
amorphous drug.

51
In order to extend shelf-life, besides limiting drug concentration, polymers with
high glass transition temperatures (Tgs) should be kept at much lower storage
temperature (when temperature of storage is deducted from the glass transition
temperature of the solid dispersion, the value obtained should be higher than 0 C)
in order to minimize molecular mobility of the drug [1-5]. The drug which is
transformed to an amorphous state by the interaction with the polymer must stay
so during the shelf life of the product. Therefore knowing the degree of the
miscibility of the polymer with the drug is very important.
Flory-Huggins define this interaction parameter, χ, eq. ( )
…………..( )
where ΔGmix is the change in Gibbs free energy, R is the gas constant and T is
temperature, nd, p is the number of moles of drug and polymer respectively, ϕd,p is
the volume fractions of the drug and the polymer respectively and χ is the
interaction parameter. The first two terms of the equation is the entropy
contribution of the system and the last term is the contribution from the change in
enthalpy as the result of mixing in eq. (1).
Flory-Huggins interaction parameter, χ, is defined as “ the thermodynamic
interaction energy of a solvent and a solute” [6] and has been used as a predictive
tool to determine the interaction between a drug and a polymer in the molten state.
The calculated χ can tell whether the drug will be miscible with the polymer used
where (χ<0). Very little or no interaction will produce a (χ>0) value. In a strong

52
interaction state between the drug and polymer, the amorphous mixture of the drug
will remain stable much longer than if there was no interaction with the polymer.
1.1 Solubility parameter for calculating χ
The Flory-Huggins interaction parameter can be calculated using the solubility
parameters of Hildebrand [6], by measuring melting point depression or with
computational analysis of the drug and a polymer [6-13].
olubility parameters, δ, show similar values for similarly structured solvents and
solutes which can be used to select a better solvent for a solute to make a solution.
Solubility parameter can be used to predict the solubility of the solid drug in the
polymer in the solid form.
olubility parameter, δ, is defined as the square root of cohesive energy density
which is related to the change in the internal energy per volume of a substance eq.
(2).
……………………………………..………………………...... (2)
The cohesive energy has been predicted by using structural group contributions of
the compounds. The three groups that contribute to the cohesive energy are the
dispersion forces, polar interaction and hydrogen bonding interaction which is
represented in eq. 3.
………………………………………….…………..(3)

53
Since the solubility parameter is the square root of the cohesive energy density,
individual solubility parameter component can be represented in eq. (4) suggested
by Hansen [15].
…………………………………………………….…(4)
By using the solubility parameters of a solvent and a solute, Hildebrand and Scott
[16] developed an equation to calculate the Flory-Huggins interaction parameter
shown in eq. (5).
+0.34……………………………………..…( )
where χ is the interaction parameter, v is the volume of each lattice site, R is the
gas constant and T is the absolute temperature. The first term is the enthalpy
contribution and 0.34 is the value for entropy.
Flory-Huggins theory is based on the Gibbs free energy and it is used to determine
the thermodynamic miscibility of a solute in a solvent system shown in eq. (6)
……………………………………………… (6)
where entropy of mixing will usually be positive due to mixing of two components
but depending on the sign of ΔHmix. The miscibility can be favored when ΔGmix is
negative, where, the solute will readily solubilize in the solvent. They will not mix
if ΔGmix is positive.
Eq. (5) can be rewritten to determine the interaction parameter shown in eq. (1).
In eq. (1), since the number of moles and volume fraction will always remain as
positive values, the sign of the enthalpy term will be determined by the value of
54
the interaction parameter, χ. Therefore, calculating the Flory-Huggins interaction
parameter can be useful to predicting the solubility of a component in a system.
1.2. Calculations based on melting point depression
Marsac et al. [7] have argued that sometimes specific hydrogen bonding between a
drug and a polymer contributes to the miscibility which cannot be distinguished by
the solubility parameter calculations. The changes occurred in the melting point of
an insoluble drug and a polymer is specific for each polymer which can be
measured by the melting point depressions. Starting from that finding the
interaction parameter, χ, can be calculated.
Melting point depression of a drug and polymer systems have been measured and
studied by number of groups in hope to determine the Flory-Huggins interaction
parameter [6,8,12]. Nishi and Wang [17] determined the melting point depression
of a crystalline polymer (poly (vinylidene fluoride), PVF2) by melting it with an
amorphous one (poly (methyl methacrylate), PMMA) at 10-80% (w/w) PVF2 to
PMMA ratio. They explained that the depression of melting temperature of the
crystalline polymer as the result of mixing of the crystalline polymer with the
amorphous one which led to an energy reduction in the overall mixture. This was
not the result of morphological effects such as particle size reduction etc. as
speculated earlier. They have successfully calculated the interaction parameter for
the crystalline and amorphous polymers.
Therefore the melting point depression method was more specifically used to
calculate the interaction parameter instead of using solubility parameter [7]. The
idea is based on the two compounds’ melting point temperature to be specific to its
55
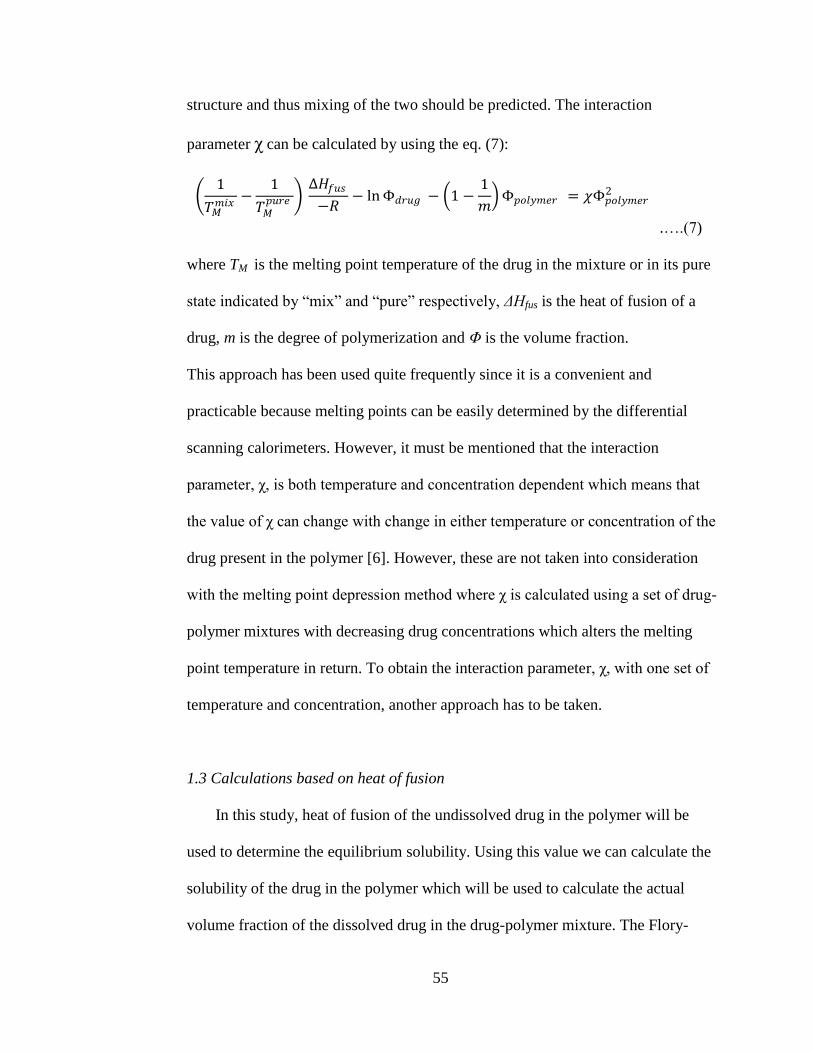
structure and thus mixing of the two should be predicted. The interaction
parameter χ can be calculated by using the eq. (7):
.….(7)
where TM is the melting point temperature of the drug in the mixture or in its pure
state indicated by “mi ” and “pure” respectively, ΔHfus is the heat of fusion of a
drug, m is the degree of polymerization and Φ is the volume fraction.
This approach has been used quite frequently since it is a convenient and
practicable because melting points can be easily determined by the differential
scanning calorimeters. However, it must be mentioned that the interaction
parameter, χ, is both temperature and concentration dependent which means that
the value of χ can change with change in either temperature or concentration of the
drug present in the polymer [6]. However, these are not taken into consideration
with the melting point depression method where χ is calculated using a set of drug-
polymer mixtures with decreasing drug concentrations which alters the melting
point temperature in return. To obtain the interaction parameter, χ, with one set of
temperature and concentration, another approach has to be taken.
1.3 Calculations based on heat of fusion
In this study, heat of fusion of the undissolved drug in the polymer will be
used to determine the equilibrium solubility. Using this value we can calculate the
solubility of the drug in the polymer which will be used to calculate the actual
volume fraction of the dissolved drug in the drug-polymer mixture. The Flory-
1
𝑀𝑚𝑖𝑥
1
𝑀𝑝𝑢𝑟𝑒
𝑓𝑢𝑠
lnΦ𝑑𝑟𝑢𝑔 1
1
𝑚 Φ𝑝𝑜𝑙𝑦𝑚𝑒𝑟 = Φ𝑝𝑜𝑙𝑦𝑚𝑒𝑟
2

56
Huggins interaction parameter, χ, have been calculated for a drug-polymer system
of nifedipine with three polymers: (Eudragit E 100, hydroxypropyl
methylcellulose acetate succinate and poly (vinyl pyrrolidone vinyl acetate) by
using the melting point depression approach with the actual volume fraction of
drug in the mixture and one annealing temperature that is specific for one
measurement at a time.
The Flory-Huggins theory eq. (6) takes into account of the size differences
between a small molecule (i.e. drug) and a larger molecule (i.e. polymer) by
accepting that the segments of the polymer chain are in equal size as the smaller
molecule (drug). Since then, research groups have taken this work and applied to
crystalline drug and amorphous polymer systems to calculate the interaction
parameters [6-12]. The idea is that when a crystalline drug is mixed in an
amorphous polymer and they are miscible, the chemical potential of the drug will
be smaller than the pure drug which will be shown through a depression in the
melting point of the drug in the mixture. However, it must be noted again that the
interaction parameter, χ, is dependent on drug concentration (melting of the drug at
a specific volume fraction) and the melting temperature of each combination. With
the melting point depression approaches these two are not constant throughout
which can lead to overestimated value of χ than the actual one.
In this paper, an amorphous solid dispersion of a drug and a polymer that are
“miscible” means that the amorphous drug and amorphous polymer e ist as a one-
phase by a liquid-liquid mixing of the two components in the molten state [5].
2. Materials and Methods
57
2.1. Materials
Eudragit E-100, EPO (Methacrylate copolymer) was kindly provided by Evonik
(Parsippany, NJ). Nifedipine was purchased from RIA International (East
Hanover, NJ ), HPMCAS LF (hydroxypropyl methylcellulose acetate succinate)
by Shin-Etsu Chemical Co., Ltd (Biddle Sawyer Corp, New York, NY) and
PVPVA 64 (polyvinyl pyrrolidone co-vinyl acetate 64) by BASF (Florham Park,
NJ) were purchased. Chemical structures and physical-chemical properties of the
drug and polymers used are given in Figure 1-1 and in table 1.
2.2. Methods
2.2.1. Solubility parameter calculations
Solubility parameters of nifedipine and polymers were calculated using Eqs. (18) -
(20).
2.2.1.1. Sample preparation, annealing; characterization of the annealed samples;
the measurement of heat of fusion and melting point temperature determination
Physical mixtures of nifedipine and a selected polymer; EPO, HPMCAS LF and
VA 64, respectively, in loads of 30 to 90% (w/w) were prepared in a mortar by
mildly stirring the weighed amount of the drug and the polymers. The samples
were packed into aluminum pans individually (5-7 mg each) and annealed at a set
temperature (130, and 6 C) in a muffle furnace for 18 hours. The annealing
temperatures were chosen based on the drugs melting point (172-173 °C). We
selected two temperatures (10 and 20 °C) below the melting point of the drug and
another temperature based on the polymer with the highest glass transition
58
temperature was also selected and our third temperature was 0 °C above the
glass transition temperature ( 30 C). At this temperature, there is no chemical
decomposition and the polymer will be flexible.
Following thermal annealing, each sample pan was quench-cooled and reheated at
10 °C/ minute in a Differential Scanning Calorimeter (DSC) Q2000 (TA
Instruments, New Castle, DE) to measure the change in heat capacity and the
melting point of the sample. Heat of fusion (ΔHfus) of nifedipine obtained from the
DSC measurement was used to calculate the weight fraction of the undissolved
nifedipine in a gram of polymer. The weight fraction was used to estimate the
volume fraction (φ) of dissolved nifedipine. By applying this value, the volume
fractions used in the Flory-Huggins equation were corrected accordingly for χ
calculation. The value of χ was also calculated from the observed melting point
depression (ΔTm) data and estimated φ (from the total weight fraction in the
formulation). The solubility parameters were determined based on eq. (3) and
Hildebrand and cott’s method eq. (4) was used to calculate the interaction
parameter.
2.2.1.2. Determination of χ by the use of melting point depression
In an amorphous solid dispersion, mixing of a crystalline drug which has a high
melting temperature with an amorphous polymer having some miscibility with the
drug, will lower the melting temperature of the drug in a mixture containing
increasing amounts of polymer furthermore. Their melting point temperature
should be determined individually and placed in eq. (7).
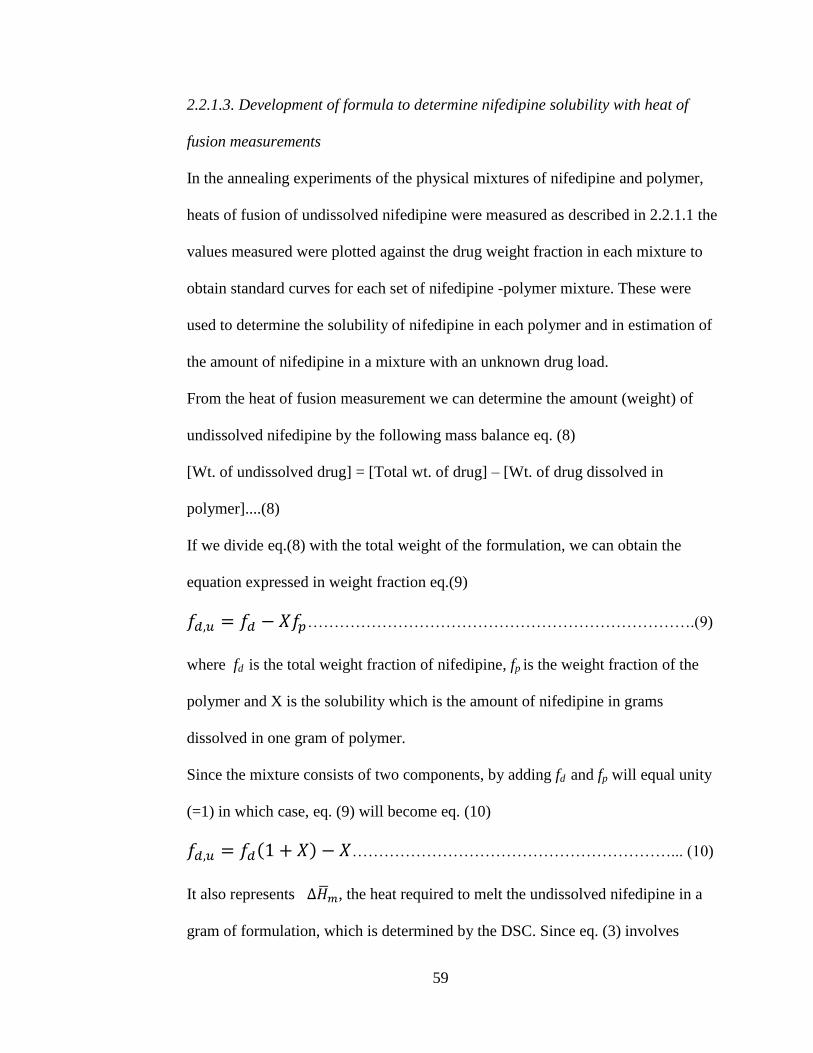
59
2.2.1.3. Development of formula to determine nifedipine solubility with heat of
fusion measurements
In the annealing experiments of the physical mixtures of nifedipine and polymer,
heats of fusion of undissolved nifedipine were measured as described in 2.2.1.1 the
values measured were plotted against the drug weight fraction in each mixture to
obtain standard curves for each set of nifedipine -polymer mixture. These were
used to determine the solubility of nifedipine in each polymer and in estimation of
the amount of nifedipine in a mixture with an unknown drug load.
From the heat of fusion measurement we can determine the amount (weight) of
undissolved nifedipine by the following mass balance eq. (8)
[Wt. of undissolved drug] = [Total wt. of drug] – [Wt. of drug dissolved in
polymer]....(8)
If we divide eq.(8) with the total weight of the formulation, we can obtain the
equation expressed in weight fraction eq.(9)
𝑓 𝑓 𝑓 ……………………………………………………………….( )
where fd is the total weight fraction of nifedipine, fp is the weight fraction of the
polymer and X is the solubility which is the amount of nifedipine in grams
dissolved in one gram of polymer.
Since the mixture consists of two components, by adding fd and fp will equal unity
(=1) in which case, eq. (9) will become eq. (10)
𝑓 𝑓 ……………………………………………………... ( 0)
It also represents , the heat required to melt the undissolved nifedipine in a
gram of formulation, which is determined by the DSC. Since eq. (3) involves

60
calculation of Δhm, which is the molar heat of fusion of nifedipine per gram of the
drug, we can replace fd,μ with leading to eq. (11)
𝑓 ………………………………………..………………........(11)
and rearranging eq. (11) and substituting it into eq. (10) it will yield eq. (12)
𝑓 ……………………………….…............(12)
Once heat of fusions ( ) are obtained they can be plotted against weight
fraction of nifedipine, having the slope Δ and the intercept of Δ
as shown in Figure 3 a, b and c.
Once the solubility of nifedipine in a given polymer is determined, the interaction
parameter, χ, can be further obtained by using eq. (15).
…………………………( )
The solubility parameters of the polymers and nifedipine were calculated using the
Hoftyzer and Van Krevalen method and are reported in Table 2. Each solubility
parameter component can be calculated using the equations shown below:
δd= V
Fdi……………………………………………………………………( 6)
δp=V
Fpi 2
……………………………………………………………………( 7)
δh=V
Ehi ……………………………………………………………………( )
In the aforementioned equation, Fdi is molar attraction constant due to dispersion
component, Fdi is molar attraction constant due to dispersion component and V is
the molar volume of substance.
61
3. Results
Once the solubility parameters were calculated, Flory-Huggins interaction
parameters were calculated using eq. (4) and are reported in Table 2.
The heat of fusion of undissolved nifedipine in each polymer mixture will change
depending on the concentration of polymer in the mixture as well as the polymer
used shown in Fig 2a-c. Plotting the change in heat of fusion of nifedipine (ΔHm)
annealed at different temperatures at different weight fraction of nifedipine and
polymer physical mixtures will yield slopes shown in Figure 2-2 a-c. From the
estimated solubility, the interaction parameters were calculated and are reported in
Table 3. The only problem with determining the solubility of nifedipine came
when the solubility value of nifedipine in E O annealed at 30 C which was
negative because the nifedipine was not soluble in EPO after a certain increase in
the polymer concentration at that temperature. Since the solubility value was
negative, we could not calculate the interaction parameter. The standard curves
obtained for nifedipine dispersed in EPO, HPMCAS LF and PVPVA 64
respectively, seem to be all linear (R2= 0.9972, 0.9992 and 0.974 respectively in
the given order); indicating that the solubility (X) of nifedipine can be determined
from these graphs. The related equations are shown by eqs. (8)-(12). Accordingly,
we obtained 6.7% solubility with nifedipine in EPO, 13.9% in PVPVA 64 and
13.2% in HPMCAS LF with no further calculations. This rough estimates could be
used in formulation developments since it is fast method for comparisons and
evaluations. Nifedipine-EPO EPO, which has the lower Tg ( 2 C) than the other

62
two polymers ( 00 and 20 C) seems to dissolve more drug. Therefore, at the
annealing temperatures, EPO chains are much more flexible compared to the other
two polymers which may lead to more mixing. The more miscible the drug is with
the polymer, the slope tends to be smaller.
If the hydrogen bonding was the dominant cause of the drug-polymer miscibility,
as seen from Table1, HPMCAS LF should have been the best candidate for
solubilizing the drug having 1 donor and 7 acceptor sites whereas EPO has only 7
acceptors and PVPVA 64 has 3 acceptors. However, the Tg of values in Table 1
show that HPMCAS LF has the highest Tg and this polymer property is
dominating the miscibility of the drug-polymer mixture.
As the annealing temperature increases, the interaction parameter, χ, obtained in
the heat of fusion as well as melting point depression show a decreasing trend
except for nifedipine-HPMCAS LF combination around and 6 C, which
could be explained by the insignificant differences created by small increase of
temperature from to 6 C. When these two are grouped and compared with
the interaction parameter value calculated at 30 C, the same decreasing trend can
be seen.
The decreasing trend in the interaction parameter values can be explained by the
increase in polymer mobility and flexibility at elevated temperatures.
Following the annealing processes of drug polymer mixtures, melting points were
measured and used to calculate the interaction parameter as well shown in Table 3
under melting point depression.

63
4. Discussions
The χ values calculated by each method, heat of fusion and melting point
depression as well as from solubility parameters are shown in Table 2.3. As the
annealing temperature increases, the interaction parameter calculated by the heat
of fusion and melting point depression methods show a trend to decrease which
should be the case with the polymer being more mobile and flexible ready to
incorporate more drug molecules within themselves. The interaction parameters
calculated from solubility parameters a different trend compared to those
calculated from the other two methods. It has been suggested that solubility
parameter calculation by itself maybe too limited to be used as a guide for
predicting the miscibility of a drug in polymer [17, 20]. For example, the solubility
parameter calculations may not be as accurate or specific to the state (crystalline
vs. amorphous) of the compound as it should be and it could change with changes
in the temperature of the system. Since the solubility parameter values used for the
calculation were taken at a lower temperature than the annealing temperature, this
discrepancy may be explained. Also it has been suggested that solubility parameter
may change with the change in system’s temperature [ 7] and suggested earlier, it
does not differentiate specific bonding interaction that could contribute to a stable
mixture [21]. With this in mind, the results obtained using the solubility parameter
calculations show a deviation from the interaction parameters calculated using the
other two methods. In general, χ values calculated by melting point depression
were lower than the χ calculated by heat of fusion method. This could be so,
because the heat of fusion method takes into consideration only the dissolved
64
portion of the drug and only that particular amount is used to calculate the actual
weight fraction. Melting point depression does not take into account the actual
weight fraction of the dissolved drug which leads to a gross over estimation of
solubilized drug in each drug-polymer system.
The second problem with the use of melting point depression approach is that the
temperatures used to calculate χ keep changing with the change in drug fraction in
each system. Since χ is temperature dependent, it would be a better choice to use
one temperature setting (i.e. the heat of fusion approach) than to use a range of
temperatures.
Since the melting point depression method calculates the interaction parameter
from a slope where the change in temperature is plotted against the change in the
fraction of the polymer, the χ obtained from the slope is neither from one
temperature nor a single concentration. Therefore, the melting point depression
method does not follow the assumption of the Flory-Huggins theory for interaction
parameter calculations where it is temperature and concentration dependent.
However, the heat of fusion method determined the solubility of nifedipine in the
polymer and then determined the equilibrium solubility of the drug. The calculated
amount of the dissolved nifedipine volume fraction was used to determine volume
fraction of the polymer. Also, by annealing the mixtures of nifedipine and the
polymer at a set temperature, the miscibility of the two were determined at one
temperature setting which meant that the temperature and the concentration were
kept constant for calculating the interaction parameter.

65
There are several assumptions that are made in this solubility estimation that need
to be addressed. Firstly, during the annealing process, not all of the drug will melt
because the melting point of the drug was not exceeded while annealing. The
changes in the heat of fusion are the result of the change in the polymer
concentration only. If the total mass of the drug were melted, we will not observe a
heat of fusion. Secondly, the heat of fusion of nifedipine, per gram, remains the
same without taking into account of the formation of other polymorphs. Thirdly,
there is no surface effect added to the equation since the assumption is that the
particles in the physical mixture are not small enough to cause melting point
depression by giving off excess energy. Since the amount of drug in the physical
mixture is at the higher end, it can be assumed that the residual undissolved drug
left in the mixture, the particles are large enough to not contribute to providing
excess energy. Lastly, the period of time which the physical mixture is being
annealed is long enough for the drug to thoroughly mix with the polymer at the
selected annealing temperature and thus the dissolved drug is homogeneously
spread within the polymer.
There was a trend that could be observed with using the heat of fusion method
especially with the PVPVA 64 polymer where the increase in the annealing
temperature resulted in a smaller interaction parameter, χ, value whereas the
melting point depression method does not show that trend but does the opposite
with increasing values. This shows that the melting point depression method is not
sensitive to temperature change of the system.

66
5. Conclusions
We have been able to show that by annealing a drug in a polymer before obtaining
the melting point depression temperature of nifedipine in polymer systems and
calculate the solubility of the drug in polymer, we can correct the overestimated
volume fraction of the actual dissolved drug in the polymer. Also by using an
annealing method, there is only one temperature value that was used throughout
the experiment. These have been done in order to stay true to the obtaining the
Flory-Huggins interaction parameter where the composition and temperature must
stay constant. This is something research groups have not considered doing
previously which we believe adds value to estimating a more accurate interaction
parameter values. The solubility determination of nifedipine in polymer mixtures
using the heat of fusion method have shown to give a crude estimation for
selecting a polymer which can dissolve the highest amount of nifedipine. This can
be used as a quick method of detection while selecting different polymers for
amorphous drug-polymer mixtures.

67
References
[1] B.C. Hancock Disordered Drug Delivery: Destiny, Dynamics and the Deborah
Number J. Pharm. Pharmacol. 54 (2002) 737-746.
[2] F. Qian, J. Huang, M. A. Hussain Drug-Polymer Solubility and Miscibility:
Stability Consideration and Practical Challenges in Amorphous Solid Dispersion
Development J. Pharm. Sci. 99 (2010) 2941-2947.
[3] M. Vasanthavada, W.Q. Tong, Y. Joshi, M.S. Kislalioglu Phase Behavior of
AMorhous Molecular Dispersions I: Determination of the Degree and Mechanism
of Solid Solubility Pharm. Res. 21 (2004) 1598-1606.
[4] M. Mosharraf, C. Nystrom Apparent Solubility of Drugs in Partially
Crystalline Systems Drug Dev. Ind. Pharm. 9 (2003) 603-622.
[5] I.Weuts, F. Van Dycke, J. Voorspoles, S. De Cort, S. Stokbroekx, R. Leemans,
M.E. Brewster, D. Xu, B. Segmuller, Y. T. A. Turner, C.J. Roberts, M.C. Davies,
S. Qi, D.Q.M. Craig, M. Reading Physicochemical Peroperties of the Amorphous
Drug, Cast Films, and Spray Dried Powders to Predict Formulation Probability of
Success for Solid Dispersions: Etravine J. Pharm. Sci. 100 (2011) 260-274.
[6] D. W.Van Krevelen, K. Te Nijenhius Properties of polymers 4th
ed. Chapter 7,
Oxford, UK: Elsevier Scientific Publication. (2009)
[7] P.J. Marsca, S.L. Shamblin, L.S. Taylor Theoretical and Practical Approaches
for Prediction of Drug-Polymer Miscibility and Solubility Pharm. Res. 23 (2006)
2417-2426.
[8] K. Pajula, M. Taskinen, V.P. Letho, J. Ketolainen, O. Korhonen Predicting the
Formation and Stability of Amorphous Small Molecule Binary Mixtures from
Computationally Determined Flory-Huggins Interaction Parameter and Phase
Diagram Mol. Pharm. 7 (2010) 795-804.
[9] Y. Zhao, P. Inbar, H.P. Chokshi, A. W. Malick, D.S. Choi Prediction of the
Thermal Phase Diagram of Amorphous Solid Dispersions by Flory-Huggins
Theory J. Pharm. Sci. 100 (2011) 3196-3207.
[10] J. Gupta, C. Nunes, H. S. Vyas, S. Jonnalagadda Prediction of Solubility
Parameters and Miscibility of Pharmaceutical Compound sby Molecular Dynamics
Simulations Phys. Chem. 8 (2011) 2014-2022.
[11] Lecthford, K, Liggins R. Burt, H. Solubilization of Hydrophobic Drugs by
Methoxy Poly(Ethylene Glycol)-Block-Polycaprolactone Diblock Copolymer
Micelles: Theoretical and Experimental Data and Correlations J. Pharm. Sci. 97
(2008) 1179-1190.
68
[12] A. Paudel, J.V. Humbeeck, G. Van den Mooter Theoretical and Experimental
Investigation on the Solid Solubility and Miscibility of Naproxen in
Poly(vinylpyrrolidone) Mol. Pharm. 7 (2010) 1133-1148.
[13] D. Lin Y. Huang A Thermal Analysis Method to Predict the Complete Phase
Diagram of Drug-Polymer Solid Dispersions Int. J. Pharm. 399 (2010) 109-115.
[14] Y. Sun, J. Tao, G.G.Z. Zhang, L. Yu Solubilities of Crystalline Drugs in
Polymers: An Improved analytical Method and Comparison of Solubilities of
Indomethacin and Nifedipineedipine in PVP, PVP/VA, and PVAc J. Pharm. Sci.
99 (2010)4023-4031.
[15] C. M. Hansen, The Universality of the Solubility Parameter Ind Eng Chem
Prod Res Dev 8 (1969) 2-11.
[16] J. Hildebrand and R. Scott 1950 Solubility of non-electrolytes. 3rd
ed. New
York: Reinhold
[17] T. Nishi, T.T. Wang Melting Point Depression and Kinetic Effects of Cooling
on Crystallization in Poly(vinylidene fluoride)-Poly(methyl methacrylate)
Mixtures Macromol. 8 (1975) 909-915.
[18] J. A. Baird, L. S. Taylor Evaluation and Modeling of the Eutectic
Composition of Various Drug-Polyethylene glycol Solid Dispersions Pharm. Dev.
Tech. 16 (2011) 201-2211.
[19] D. J. Greenhalgh, A.C. Williams, P. Timmins, P. York Solubility Parameters
as Predictors of Miscibility in solid Dispersions J. Pharm. Sci. 88 (1999) 1182-
1190.
[20] J. Albers, K. Matthee, K. Knop, P. Kleinbudde Evaluation of Predictive
Models for Stable Solid Solution Formation J. Pharm. Sci. 100 (2011) 667-680.
[21] D. Singhal W. Curatolo Drug polymorphism and Dosage Form Design: A
Practical Perspective Adv. Drug Deliv. Rev. 56 (2004) 335-347.
[20] R. Nair, N. Nyamweya, S. Gonen, L. J. Martinez-Miranda, S.W. Hoag
Influence of various drugs on the glass transition temperature of
Poly(vinylpyrrolidone): a thermodynamic and spectroscopic investigation Int. J.
Pharm. 225(2001) 83-96.
[21] J. Albers. K. Matthee, K. Knop, P. Kleinebudde Evaluation of Predictive
Models for Stable Solid Solution Formation J. Pharm. Sci. 100 (2011) 667-680.
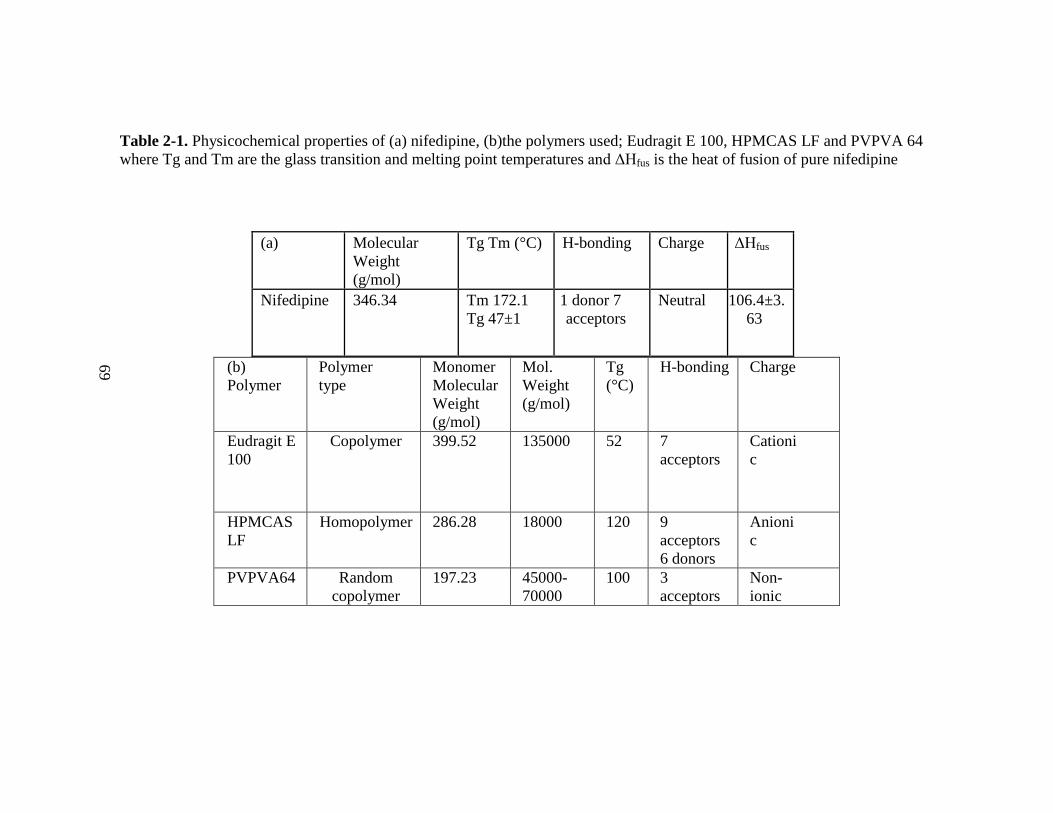
69
Table 2-1. Physicochemical properties of (a) nifedipine, (b)the polymers used; Eudragit E 100, HPMCAS LF and PVPVA 64
where Tg and Tm are the glass transition and melting point temperatures and ΔHfus is the heat of fusion of pure nifedipine
(b)
Polymer
Polymer
type
Monomer
Molecular
Weight
(g/mol)
Mol.
Weight
(g/mol)
Tg
(°C)
H-bonding Charge
Eudragit E
100
Copolymer 399.52 135000 52 7
acceptors
Cationi
c
HPMCAS
LF
Homopolymer 286.28 18000 120 9
acceptors
6 donors
Anioni
c
PVPVA64 Random
copolymer
197.23 45000-
70000
100 3
acceptors
Non-
ionic
(a) Molecular
Weight
(g/mol)
Tg Tm (°C) H-bonding Charge ΔHfus
Nifedipine 346.34 Tm 172.1
Tg 47±1
1 donor 7
acceptors
Neutral
106.4±3.
63

70
Table 2-2. Calculated solubility parameters of nifedipine and polymers
R group mono MW (g/mol)
δi
(J/cm3)1/2
vi (cm
3/mol)
δ van Krevelen)
Eudragit EPO (Methyl:Butyl=1:1)
R=CH3 257.33 20.76 221.58
R=C4H9 299.41 19.96 270.69 20.4
HPMCAS
R=H (C 12 H 20 O 10) 324.3 38.40 147.94
R=CH3 (C 18 H 32 O 10) 408.4 20.95 293.74
R=COCH3 (C 24 H 32 O 16) 576.5 23.20 378.94 R=COCH2CH2COOH (C 36 H 44 O 28) 924.7 28.14 499.18 R=CH2CH(OH)CH3 (C 30 H 56 O 16) 672.8 26.02 463.96 R=CH2CH(OCOCH3)CH3 (C 42 H 68 O 22) 925 20.96 694.96 R=CH2CH(OCOCH2CH2COOH)CH3 (C 54 H 80 O 34) 1273.2 24.49 815.2 26.0
PVP VA64
1-vinyl-2-pyrrolidone 111.1 25.96 82.28
vinyl acetate 86.1 22.28 66.87 24.3
Nifedipine 346.34 24.8

71
Table 2-3. Calculated χ interaction parameter by three different methods
Flory-Huggins χ Parameter
Solubility Parameter Calculated χ
Physical Mixture
Annealing Temp (K)
Heat of Fusion
Melting point
depression
Nifedipine-EPO
403.15 C) N/A 0.623
2.165 428.15 C) 1.46 -0.0055
438.15 C) 1.34 -0.259
Nifedipine-HPMCAS LF
403.15 C) 3.41 0.420
0.166 428.15 C) 1.26 0.315
438.15 C) 2.12 0.386
Nifedipine-PVPVA 64
403.15 C) 2.41 -1.391
3.48 428.15 C) 1.45 -1.313
438.15 C) 1.39 -0.554
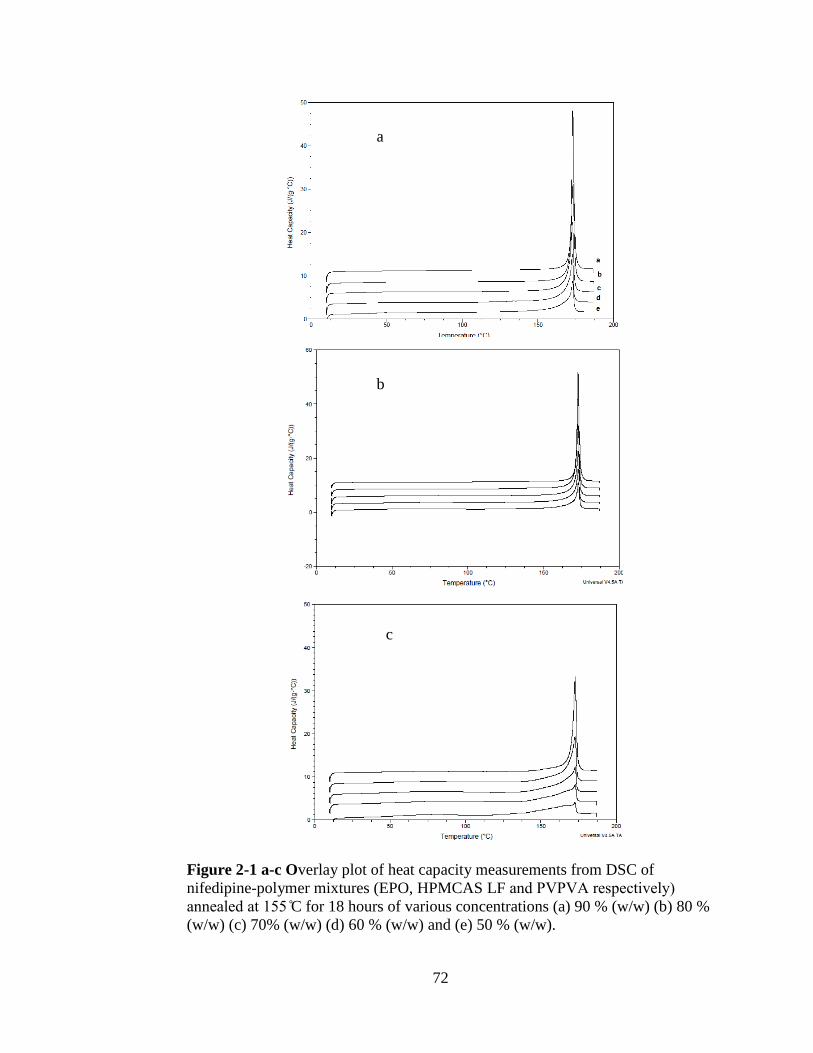
72
Figure 2-1 a-c Overlay plot of heat capacity measurements from DSC of
nifedipine-polymer mixtures (EPO, HPMCAS LF and A respectively)
annealed at C for 18 hours of various concentrations (a) 90 % (w/w) (b) 80 %
(w/w) (c) 70% (w/w) (d) 60 % (w/w) and (e) 50 % (w/w).
b
c
a

73
Figure. 2-2 a-c. Plot of change in heat of fusion against drug weight fraction for
each nifedipine -polymer , EPO, HPMCAS LF and PVPVA 64, respectively
y = 35.495x - 2.2806 R² = 0.9972
10
15
20
25
30
35
0.5 0.6 0.7 0.8 0.9 1
Δh
fus
Drug wt. fraction (% w/w)
Δhfus vs. Drug weight fraction (Nifedipine-EPO)
y = 37.522x - 4.4328 R² = 0.9992
10
15
20
25
30
35
0.5 0.6 0.7 0.8 0.9 1
Δh
fus
Drug wt. fraction (%w/w)
Δhfus vs. Drug weight fraction (Nifedipine-HPMCAS LF)
y = 37.948x - 4.6219 R² = 0.974
10
15
20
25
30
35
0.5 0.6 0.7 0.8 0.9 1
Δh
fus
Drug wt. fraction (% w/w)
Δhfus vs. Drug weight fraction (Nifedipine-PVPVA 64)
b
a
c
74
Manuscript 3
A Study of Stability Prediction of the Nifedipine Solid Dispersions Prepared with Hot
Melt Extrusion, Spray Drying and Rotary Evaporation
Kaoru Tominaga1, Serpil Kislalioglu
1,*, Harpreet Sandhu
2, Robert Bellantone
3, Navnit
Shah2, Waseem Malick
2
1Biomedical and Pharmaceutical Sciences, University of Rhode Island, 41 Lower
College Road, Kingston, RI 02881
2Pharmaceutical and Analytical Research and Development, Hoffmann-La-Roche Inc.,
340 Kingsland St, Nutley, NJ 07110
3
Arnold and Marie Schwartz College of Pharmacy and Health Sciences, Long
Island University, 75 Dekalb Avenue, Brooklyn, NY 11201
*To Whom All Correspondence Should Be Addressed, Phone: 401-874-5017, Fax:
401-874-2181, e-mail: [email protected]
Publication Status: To be submitted to European Journal of Pharmaceutics and
Biopharmaceutics
75
Abstract
Miscibility and solubility prediction studies of poorly water soluble drugs with
amorphous water soluble polymer have been reported. However, these studies have
some drawbacks to be used universally for any drug-polymer combinations. Specific
drug-polymer interaction and temperature used in the experimental setting and
temperature used in the prediction of the drug solubility are two of the most important
factors that need to be considered.
The solubility of nifedipine with amorphous polymers, Eudragit E 00 (E O,
H MCA LF and A 64, in amorphous solid dispersions prepared by hot melt
e trusion (HME), rotary evaporation (Rot) and spray drying ( ) processes, were
predicted at room temperature (2 C). The prediction was carried out by using a
thermodynamic model utilizing heat capacity measurements made with differential
scanning calorimeter (DSC) and Flory-Huggins interaction parameter, χ. The model
calculated the change in Gibbs free energy of the amorphous solid dispersions
prepared at the range of nifedipine drug concentrations. By calculating the χ
interaction parameter using the solubility parameters of nifedipine and polymers and
measuring the changes in the amorphous solid dispersion of nifedipine from room
temperature to its melting point temperature, we were able to estimate the solubility of
nifedipine in the polymers at room temperature.
Keywords: amorphous; solid dispersion; Flory-Huggins interaction parameter; Gibbs
free energy; solubility parameter; DSC; HME; rotary evaporation; spray drying

76
Introduction
With the use of modern high throughput screening (HTS) techniques and
combinatorial chemistry in drug discovery, more compounds that are poorly soluble in
water are entering the drug pipelines of pharmaceutical companies. To enhance the
solubility of these poorly soluble drugs, solid dispersions, or amorphous molecular
level dispersions in polymeric systems have been used as pharmaceutical dosage
forms. By dispersing the drug molecularly in a polymer matrix, given that the
interaction between the drug and the polymer is not too strong, the dissolution and/ or
apparent solubility of the drug which will lead to greater absorption and bioavailability
of the drug can be increased [1-8].
There are two important criteria when preparing a solid dispersion of a drug in an
amorphous polymer. Firstly; the drug must be molecularly miscible with the polymer.
Secondly, the drug incorporated in the system should be accommodated by the
polymer molecules to have an acceptable shelf life. In other words, it should stay as an
amorphous solid dispersion and not crystallize out during the shelf life. The miscibility
of a drug in a polymer is important because it affects the stabilization of the drug when
it is dispersed in the polymer matrix. It also lowers the chemical potential (Δμ) of the
drug as the result of mixing with the polymer [8].
Drug concentration can also affect the stability of the drug in the system i.e. with high
drug concentration, the solid dispersion becomes unstable. The equilibrium solubility
of the crystalline drug will be much less than the solubility of amorphous drug. The
amorphous drug will have an e perimentally determined “apparent” solubility and not
an equilibrium solubility since the amorphous drug will be metastable.

77
There have been various approaches to understand the miscibility of a drug and a
polymer in an amorphous solid dispersion [9-14]. These include measurement of the
changes in the glass transition temperatures [9-11], determination of Flory-Huggins
interaction parameter by using melting point depression method or solubility
parameters [12-14], measuring the miscibility of a drug in a monomer or oligomer of
the same polymer [14] or using a hot stage microscope to visibly determine miscibility
of the melt [9]. However, there are limitations to the methods mentioned above such
as:
(1) Polymers used in these experiments tend to have high glass transition temperatures
which reduce the molecular mobility in the solid dispersion. They will be highly
viscous and may not be suitable to determine miscibility on a hot stage microscope.
(2) Determining miscibility with the use of a liquid monomer or an oligomer will limit
the types of polymers that can be used to determine miscibility. Also there are
assumptions that can interfere with the accuracy of such monomers, i.e. the interaction
of a drug with a monomer will be the same as the drug with the polymer which could
be different from drug-oligomer
(3) Melting point depression can only be measured where the drug and the polymer
are in their liquid state.
An amorphous solid dispersion may contain high drug concentrations if the drug is
miscible with the polymer in that case the concentration of the drug incorporated to
the amorphous polymer is much higher than the solubility of its crystalline state. If the
drug concentration exceeds the miscibility of the drug in the polymer, there is danger

78
of recrystallization. Therefore, it is important to determine the solubility and the
miscibility of the drug in the polymer of interest to estimate the drug concentration
that can be incorporated into the polymer without jeopardizing high amounts of
amorphous drug reverting to the crystalline state.
n this paper, the term “solubility” is referred to the solubility of a crystalline drug in a
polymer as an amorphous molecular dispersion (solid form), where the chemical
potential of the solid state of the drug is equal to its liquid state. “Miscibility” is
referred to that amount of liquefied drug that can mix with a liquid polymer. Since the
temperature at which this mixing occurs is much higher than the glass transition
temperature at this condition, reaching equilibrium state is very difficult.
The solubility of a drug in a solid dispersion can be expressed with the change in the
chemical potential (Δµ) of its pure form. f Δμ of the drug in the solid dispersion is
lower than the Δμ of the pure drug, the drug present in the solid dispersion will
dissolve fully and the final concentration of the drug will be its apparent solubility.
The term “apparent solubility” refers to a metastable or supersaturated solution which
may initially contain high concentration of the drug and over time reduced
concentrations that are thermodynamically stable. f Δμ of the solid dispersion is
higher than that of the pure drug, then some of the drug dissolved as solid dispersion
will revert back to the pure crystals in the polymer matrix and precipitate. The
maximum amount of drug that can be loaded in a solid dispersion is, when μ of the

79
drug in the solid solution is equal to μ of the drug at a solid state [10]. This is the
highest stable concentration of drug in a drug-polymer matrix that can be achieved.
In addition to the methods determining miscibility of a crystalline drug with a polymer
discussed, there are other methods that have been developed to estimate the drug-
polymer miscibility by using Flory-Huggins solution Theory [15], which were carried
out by measuring melting point depression or solubility parameter [12-14]. The
calculation of χ according to solubility parameter and melting point depression were
already explained in the previous paper [16]. However, these authors have explained
the solid-solid solubility by using data obtained when both components were in the
liquid state.
For predicting amorphous solubility of a drug in a solid polymer, a temperature that is
close to the room temperature (2 C) should be used to mimic the real-life conditions.
ot all methods used utilize this temperature. n such cases, solubility parameter (δ)
can be used. The only problem in its use is that; it does not take into account the
specific secondary bondings in the calculations. To incorporate information of these
bondings is important since they increase miscibility of a drug with a polymer.
Another predictive method published recently, proposed a thermodynamic model to
calculate the miscibility of a drug at room temperature [8]. These authors analyzed
changes involved in the Gibbs free energy of solid dispersions (ΔGSS) as the result of
formation of the amorphous solid dispersion by calculating the contributions of three
80
components (ΔG1, ΔG2 and ΔG3). The heat capacities of pure drug, pure polymer and
the solid dispersions prepared are measured with differential scanning calorimeter
(DSC) and the values were used to calculate ΔG1:
𝑓 𝑓 𝑑 𝑓 𝑓
𝑑
where ΔG1 is one of the component of the total change in the Gibbs free energy, CP is
heat capacity, T is initial temperature and TM is the drug melting temperature, f
denotes the weight fraction,1, 2 and 12 denote the drug, polymer and the mixture,
respectively in Eq. 1.
ΔG2 is calculated by measuring ΔhM, which is the molar enthalpy of melting of the
pure drug, via DSC and replacing the value obtained in Eq. 2.
where ΔG2 is the second component of ΔGSS and n is the number of moles per gram of
formulation in Eq. 2. ΔG3 is obtained purely by calculation using Flory-Huggins
solution theory in Eq. 3.
where R is gas constant, ϕ is volume fraction and χ(T) is Flory-Huggins interaction
parameter at temperature T. ΔGSS is calculated by using Eq. 4.
ΔGSS is the combination of the total components of ΔG 1-3 where ΔGSS is the total
change of Gibbs free energy of the solid dispersion and by using ΔGSS value obtained,
we can determine Δµ.

81
where P is pressure.
The plot of change in Gibbs free energy versus drug concentration while normalizing
each by the weight of polymer in the formulation, we will be able to obtain the slope
shown in Eq. 5. Since we have different drug and polymer weight fractions for each
formulation, ΔGSS should be calculated per gram of formulation. By plotting the right
hand side of Eq. 6 against the drug weight fraction, the slope can be determined.
𝑓
ΔG*
SS is the change in Gibbs free energy per gram of formulation and f denotes the
weight fraction.
The change in the Gibbs free energy of the solid dispersion can be related to the
chemical potential of the drug in the solid dispersion. The drug concentration where
supersaturation of the drug may occur (Δµ1,SS > 0) can be determined from the slope of
ΔGSS that is plotted against drug fraction in the solid dispersion. The drug
concentration where separation occurs will have a positive slope.
Flory-Huggins interaction parameter, χ, can be determined using solubility parameter,
δ, of a drug and a polymer as shown in Eq.7 which is based on Hansen’s idea to
correlate solubility to cohesive energy [17]. The solubility parameter can be calculated
by using the method developed by van Krevelen and Hoftyzer as shown in Eq. 7 [18].
where V is molar volume per structure unit
82
where δ is the solubility parameter and d, p and h represents dispersion, polar and
hydrogen bonding, respectively. Solubility parameter components δd, δp and δh can be
calculated as shown in Eqs. 9-11.
where F is the group contribution from dispersion
where E is the molar cohesive energy.
n this paper Bellantone et al.’s solubility estimations will be used for the solid
dispersions obtained with three different methods, hot melt extrusion (HME), rotary
evaporation (Rot) and spray drying (SD) and polymers used for the preparations were,
EPO, HPMCAS LF and PVPVA 64. Heat capacities of the prepared samples were
measured for further calculations. We have also used three different methods of
calculating Flory-Huggins interaction parameter, χ, as previously reported to compare
the resulting ΔG3 values.
Materials
The API (Active pharmaceutical ingredient) used in this study was nifedipine (NIF)
which was purchased from RIA International (East Hanover, NJ). Eudragit E-100
(EPO) was kindly provided by Evonik (Parsippany, NJ), HPMCAS LF by Shin-Etsu
83
Chemical Co., Ltd (Biddle Sawyer Corp, New York, NY) and PVPVA 64 was
purchased from BASF (Florham Park, NJ)
Methylene chloride was used as the solvent in both spray drying process and rotary
evaporation process except for processing NIF (with HPMCAS LF in which case
methanol was used). Both solvents were purchased from Sigma-Aldrich Co. (St.
Louis, MO).
Methods
1. Hot melt extrusion (HME)
Physical mixtures of NIF and EPO were prepared using a mortar and pestle with drug
loadings of 5, 10, 20 and 40 % w/w. The mixture was then extruded using Haake
Minilab micro compounder (Thermo Scientific, Waltham, MA). The extruded material
was ground and sized through a # 40 sieve. The physical mixture went into the
extruder through the funnel on the left hand side and softened with the temperature
applied and extrudes out from the flush hole. The extrusion screw speed was set to 50
RPM throughout the experiments and no shear force was additionally applied to the
mixture.
2. Rotary evaporation (Rot)
The same physical mixtures prepared for HME were used for rotary evaporation. 5-10
grams of the physical mixture was dissolved in 50-100 mL of methylene chloride,
with HPMCAS LF methanol had to be used as solvent, and the solvent was removed

84
by using a rotary evaporator apparatus Büchi Rotavapor from Buchi (New Castle,
DE). The samples were collected by removing the foamy film created on inside of the
flask with a metal spatula and ground by using a mortar and pestle. The particles were
sized through a # 40 sieve.
3. Spray drying (SD)
Mini Spray Dryer B-290 (Büchi, New Castle, DE) attached to Inert Loop B-295
cooling block was used in the spray drying experiment to manufacture amorphous
solid dispersion of nifedipine with three different polymers. A solution of NIF and
polymer was made using either methylene chloride or methanol (in the case when
HPMCAS LF was chosen as the polymer matrix) with drug loads ranging from 5-40%
w/w and the solid content of 3-5% w/w.
All the collected materials were transferred into amber colored vials and were kept in
a desiccator until further analysis was required
Modulated Differential Scanning Calorimetry MDSC
NIF-polymer samples were thermally analyzed with a MDSC instrument Q2000 (TA
Instruments, New Castle, DE). Samples were weighed (6- 8 mg) and placed in to
aluminum pans with lids. Heating was controlled throughout the measurement and the
samples were heated from room temperature up to 20- 30°C above the melting point
of the pure drug at a rate of 5°C/ minute unless noted otherwise.
85
True Density Measurements of Polymers
E O, H MCA -LF and A 64 polymers were dried in a vacuum oven for 72
hours at 40 C. The true density was measured using AccuPyc 1340 (Micrometrics,
Norcross, GA) and Helium gas used as the analyzer gas with 10 repeated cycles. The
true density measurements were used to determine the theoretical change in glass
transition temperatures using Gordon-Taylor equation of solid dispersions and
compare them to experimentally determined glass transition temperatures.
PXRD
PXRD was performed using X-Ray Diffraction Bruker D8 PXRD (Bruker AXS, WI).
The samples were analyzed using Cu K α radiation to determine the crystalline or
amorphous phases of the drugs. The X-Ray pattern was collected in the angular range
of < 2θ < 40° in the step scan mode (step width 0.02°, scan rate 1°/ per minute)
Estimation of the stable drug load in a polymer mixture
The estimation for the most stable drug loads were calculated using Bellantone’s
method described in [8]. The Flory-Huggins interaction parameter were determined
using heat of fusion method which was previously reported, melting point depression
method and with the use of solubility parameters.
Results and Discussions
The Flory-Huggins interaction parameter, χ, obtained for each polymer was calculated
using Eq. 6 and the results are shown in Table I. From the interaction parameter
obtained with A 64, it is observed that the product has the lowest χ therefore it

86
will show the highest miscibility. PVPVA 64 will be the most likely candidate to form
a stable amorphous solid dispersion with nifedipine.
The changes in total Gibbs free energy against nifedipine weight fractions were
calculated and plotted in Figs. 3- 1 a-c. There are three components that make up the
total change in the free energy which includes ΔG1 and ΔG2 that are calculated from
the C data using Eqs. and 2 and ΔG3 which is calculated by using Flory-Huggins
theory and can be determined by Eq. 3. In Figs. 3-1 a-c, the ΔG1, ΔG2 and ΔG3
components of ΔGSS were calculated according to solubility parameter, melting point
depression and heat of fusion methods [16]. ΔG1 and ΔG2 were found the same in but
ΔG3 differs in each application. However, the slopes the changes appear to be very
small meaning that they are not sensitive enough to detect the stable concentration. In
the total change in Gibbs free energy of nifedipine-EPO solid dispersions processed by
HME, shown in Fig. 3- 2, no clear deflection point is observed. On the other hand,
both Rot and SD processed nifedipine-EPO have minima at 10-15 % nifedipine
concentration as seen in Figs. 3- 3 and 4. This may suggest that the use of HME for
the nifedipine-EPO mixtures may not provide sufficient mixing to form a stable solid
dispersion. Both Rot and SD were efficient for more effective mixing.
Using HME method, nifedipine-HPMCAS LF solid dispersions showed similar results
to EPO, having no minimum concentration seen in the ΔGSS vs. weight fraction of
nifedipine curve in Fig. 3- 5.
For Rot and SD processed solid dispersions the predicted concentrations were 10 and
15 % as seen in Figs. 3- 6 and 7. This could be due to the high viscosity of the
87
polymer during the HME processing which may interfere with mixing of the drug with
the polymer well. The use of solvent could improve this drawback.
Using this prediction model, Nifedipine-PVPVA 64 solid dispersions appear to be the
best candidates for forming stable amorphous solid dispersions. The solid dispersions
prepared with this polymer show clearly identified minima in the plots drawn, Figs. 3-
8-10. For plots obtained as in Fig. 3- 10 the lowest concentration (15 % in this case) is
taken to be on the safe side.
In Fig. 3- , the processing effects on the ΔGSS for each method used to prepare
nifedipine-PVPVA 64 amorphous solid dispersions are presented. With the HME
method, the predicted drug concentration is 5 % which is much lower than that of the
Rot or SD methods. This may indicate that HME method used is not effective in
incorporating higher concentration of the drug compared to the other two methods. SD
provided drug concentration of 15 %, shown in Fig. 3- 11 that can be accepted as the
concentration that can be used to maintain amorphous character of the solid
dispersion. Although some ΔGSS observed in SD which pointed out 10-30 % drug
concentration could be incorporated, for safe incorporation in such cases it is advisable
to use the lower concentration that provides the same ΔG reduction [8].
As it was indicated earlier, ΔG3s calculated with each polymer used were different
with the use of Flory-Huggins interaction parameter, χ, calculated using three different
methods. They are presented on Table 3-II a-c for each method. For all of the methods
used, ΔG3 change with increasing drug concentration is similar and the overall trend
does not change. This finding indicates that mixing of nifedipine with polymers, ΔG3,
88
is not the most important factor to determine the solubility of nifedipine in the
polymers used as it has been suggested by Pajula et al. [12] and Marsac et al. [14].
Changes in the enthalpy and entropy of a crystalline drug to an amorphous solid
dispersion may be the result of different bond modes or another translational change
for the stabilization of the amorphous solid dispersions.
There are some evidence of phase separation occurring in the higher drug
concentration with some of the nifedipine-polymer combinations. In Figs 3-3, 3-4, 3-8
and 3-9 which show the prediction models of solid dispersions prepared by Rot and
SD for NIF-EPO and HME and Rot for NIF-PVPVA 64, there were sudden change in
the slopes of ΔG/w2 vs. drug weight fraction plots which could be the indication of
existence of two separate phases [18]. At the concentration region above 20 %,
amorphous nifedipine may be coexisting with crystalline nifedipine. This was
confirmed with XRD analysis for 40% drug concentration of Rot processed NIF-EPO
sample but not for the other samples. With the use of DSC, melting endotherms were
present for 20 and 40 % Rot and SD processed NIF-EPO samples but none was
present in the NIF-PVPVA 64 samples. Therefore, it is possible that phase separation
of nifedipine and EPO can occur. However, NIF-PVPVA 64 solid dispersions may
require further testing to confirm the existence of the two phases. Since these
predictions are made for determining suitable drug concentration that will remain
stable over the period of pharmaceutical products’ shelf life, we need to select the drug
concentration where there is only one, amorphous, phase present.
89
Conclusions
By applying Bellantone et al. prediction equations, SD samples of nifedipine-PVPVA
64 polymer at 15-30 % nifedipine concentrations were predicted to be the most stable
solid dispersions which agreed with the Flory-Huggins interaction parameter
calculation to be the most miscible drug-polymer combinations between the three
polymers tested.
Data obtained can be treated in an hour time when all the equations are fed into a
spreadsheet for plotting the change in the Gibbs free energy.
ΔG3 component which was accepted as the main variable in the former to be a small
contributor compared to ΔG1 solubility estimations, was found that its contribution
was small compared to ΔG1.
90
References
[1] W. L. Chiou, S. Riegelman, Pharmaceutical applications of solid dispersion
systems, J. Pharm. Sci. 60 (1971) 1281-1302.
[2] C. Leuner, J. Dressman, Improving drug solubility for oral delivery using solid
dispersions, Eur. J. Pharm. Biopharm. 50 (2000) 47-60.
[3] S. Janssens, G. Van den Mooter, Review: physical chemistry of solid dispersions,
J. Pharm. Pharmocology 61 (2009) 1571-1586.
[4] T. Vasconcelos, B. Sarmento, P. Costa, Solid dispersions as strategy to improve
oral bioavailability of poor water soluble drugs, Drug Discovery Today, 12 (2007)
1068-1076.
[5] N. Blagden, M. de Matas, P.T. Gavan, P. York, Crystal engineering of active
pharmaceutical ingredients to improve solubility and dissolution rates, Adv. Drug
Delivery Rev. 59 (2007) 617–630.
[6] F. Usui, K. Maeda, A. Kusai, K. Nishimura, K. Yamamoto, Inhibitory effects of
water-soluble polymers on precipitation of RS-8359, Int. J. Pharm. 154 (1997) 59-66.
[7] H. R. Guzman, M. Tawa, Z. Zhang, P. Ratanabanangkoon, P. Shaw, C. R.
Gardner, H. Chen, J.P. Moreau, O. Almarsson, J. F. Remenar, Combined use of
crystalline salt forms and precipitation inhibitors to improve oral absorption of
celecoxib from solid oral formulations, J. Pharm. Sci. 96 (2007) 2686-2702.
[8] R. Bellantone A Method to Predict the Equilibrium Solubility of Drugs in Solid
Polymers near Room Temperature Using Thermal Analysis, J. Pharm. Sci. 101 (2012)
4549-4558.
91
[9] A. Forster, J. Hempenstall, I. Tucker and T. Rades, The Potential of Small-Scale
Fusion Experiments and Gordon-Taylor Equation to Predict the Suitability of
Drug/Polymer Blends for Melt Extrusion, Drug Dev. Ind. Pharm. 27 (2001) 549-560.
[10]F. Qian, J, Huang and M.A. Hussain, Drug-Polymer Solubility and Miscibility:
Stability Consideration and Practical Challenges in Amorphous Solid Dispersion
Development, J. Pharm. Sci. 99 (2010) 2941-2947.
[11] M. Vasanthavada, W.Q. Tong, Y. Joshi and M.S. Kislalioglu, Phase Behavior of
Amorphous Molecular Dispersions I: Determination of the Degree and Mechanism of
Solid Solubility, Pharm. Res. 21 (2004) 1598-1606
[12] K. Pajula, M, Taskinen, V.P. Lehto, J. Ketolainen and O. Korhonen, Predicting
the Formation and Stability of Amorphous Small Molecule Binary Mixtures from
Computationally Determined Flory-Huggins Interaction Parameter and Phase
Diagram, Mol. Pharm. 7 (2010) 795-804.
[13] A. Paudel, J. Van Humbeck, and G. Van den Mooter, Theoretical and
Experimental Investigation on the Solid Solubility and Miscibility of Naproxen in
Poly(vinylpyrrolidone), Mol. Pharm. 7 (2010) 1133-1148.
[14] P. J. Marsac, S. L. Shamblin and L.S. Taylor, Theoretical and Practical
Approaches for Prediction of Drug-Polymer Miscibility and Solubility, Pharm. Res.
33 (2006) 2417-2426.
[15] P. J. Flory Principles of Polymer Chemistry, Cornell University Press (1953)
[16] K.Tominaga, Harpreet Sandhu, Navnit Shah, Dharmendra Singhal, Waseem
Malick, Robert Bellantone, Serpil Kislalioglu, Testing the use of “heat of fusion” in
calculations of interaction parameter (χ) in Flory-Huggins and its comparison with the

92
use of melting point depression and solubility parameters (2013) prepared for
publication
[17] J. H. Hildebrand and R. L. cott “The olubility of on-electrolytes”, 3rd Ed,
Reinhold Publishing Corp, New York, 1950.
[18] D. W.Van Krevelen, K. te Nijenhuis Properties of polymers 4th
ed. Chapter 7,
Oxford, UK: Elsevier Scientific Publication. (2009)

93
Table 3-I. Flory-Huggins interaction parameter, χ, for nifedipine and each polymer
combination were calculated using Eq.6 and the solubility parameter, δ, calculated
with van Krevelen’s method Eqs. 7-10 at 25 ºC.
Calculated χ C
EPO HPMCAS LF PVPVA 64
Nifedipine 2.165 0.166 0.027

94
Table 3-II a. Change in Gibbs free energy, ΔG3, contributed from mixing of
nifedipine with EPO polymer
Drug load %
(w/w)
∆G3 J/g
(Heat of Fusion)
∆G3 J/g
(Melting Pt. Depression)
∆G3 J/g
(Sol. Parameter)
40 -2.67 -8.66 0.21
20 -2.33 -4.86 -1.08
10 -1.62 -2.80 -1.06
5 -1.05 -1.61 -1.02

95
Table 3-II b. Change in Gibbs free energy, ΔG3, contributed from mixing of
nifedipine with HPMCAS LF polymer
Drug load %
(w/w)
∆G3 J/g
(Heat of Fusion)
∆G3 J/g
(Melting Pt. Depression)
∆G3 J/g
(Sol. Parameter)
40 -1.17 -4.19 -4.67
20 -1.37 -2.83 -3.06
10 -1.11 -1.82 -1.93
5 -0.78 -1.13 -1.19

96
Table 3-II c. Change in Gibbs free energy, ΔG3, contributed from mixing of
nifedipine with PVPVA 64 polymer
Drug load %
(w/w)
∆G3 J/g
(Heat of Fusion)
∆G3 J/g
(Melting Pt. Depression)
∆G3 J/g
(Sol. Parameter)
40 -1.21 -11.15 6.10
30 -1.39 -8.01 3.47
20 -1.52 -6.02 1.79
15 -1.34 -4.46 0.95
10 -1.21 -3.36 0.37
5 -0.84 -1.89 -0.06
1 -0.28 -0.49 -0.13

97
Fig. 3-1 a-c. Calculated changes in the total Gibbs free energy of amorphous solid
dispersions of nifedipine-EPO solid dispersions were prepared by hot melt
e trusion with drug concentrations , 0, 20 and 40% w/w. (c) ΔG3 was calculated
with Flory-Huggins interaction parameter, χ, by using the (a) solubility parameter,
(b) heat of fusion calculation and (c) melting point depression method

98
-10
0
10
20
30
40
50
60
70
0.00 0.20 0.40 0.60
DG
/ w
2 (J
/g)
Drug Wt. Fraction
Contributions to Total DGSS
G1 G2 G3
Nifedipine in EPO HME
-10
0
10
20
30
40
50
60
0.00 0.10 0.20 0.30 0.40 0.50
DG
/ w
2 (J
/g)
Drug Wt. Fraction
Contributions to Total DGSS
G1
G2
G3
Nifedipine in EPO HME (Heat of Fusion)
-20
-10
0
10
20
30
40
50
60
70
0.00 0.10 0.20 0.30 0.40 0.50
DG
/ w
2 (J
/g)
Drug Wt. Fraction
Contributions to Total DGSS
G1 G2 G3
Nifedipine in EPO HME (Meling Pt. Depression)
a
c
b

99
Fig. 3-2. Overall change in Gibbs free energy of amorphous solid dispersions of
nifedipine with EPO prepared by hot melt extrusion with drug concentrations 5, 10, 20
and 40% w/w.
0
10
20
30
40
50
60
70
80
0.00 0.10 0.20 0.30 0.40 0.50
DG
SS
/ w
2 (J
/g)
Drug Wt. Fraction
DGSS (per gram polymer) vs. drug weight fraction
Nifedipine in EPO HME

100
Fig. 3-3. Calculated changes in total Gibbs free energy of amorphous solid dispersions
of nifedipine with EPO prepared by rotary evaporation with drug concentrations 5, 10,
20 and 40% w/w
-20
-10
0
10
20
30
40
50
60
0.00 0.10 0.20 0.30 0.40 0.50
DG
SS
/ w
2 (J
/g)
Drug Wt. Fraction
DGSS (per gram polymer) vs. drug weight fraction
Nifedipine in EPO Rotavap
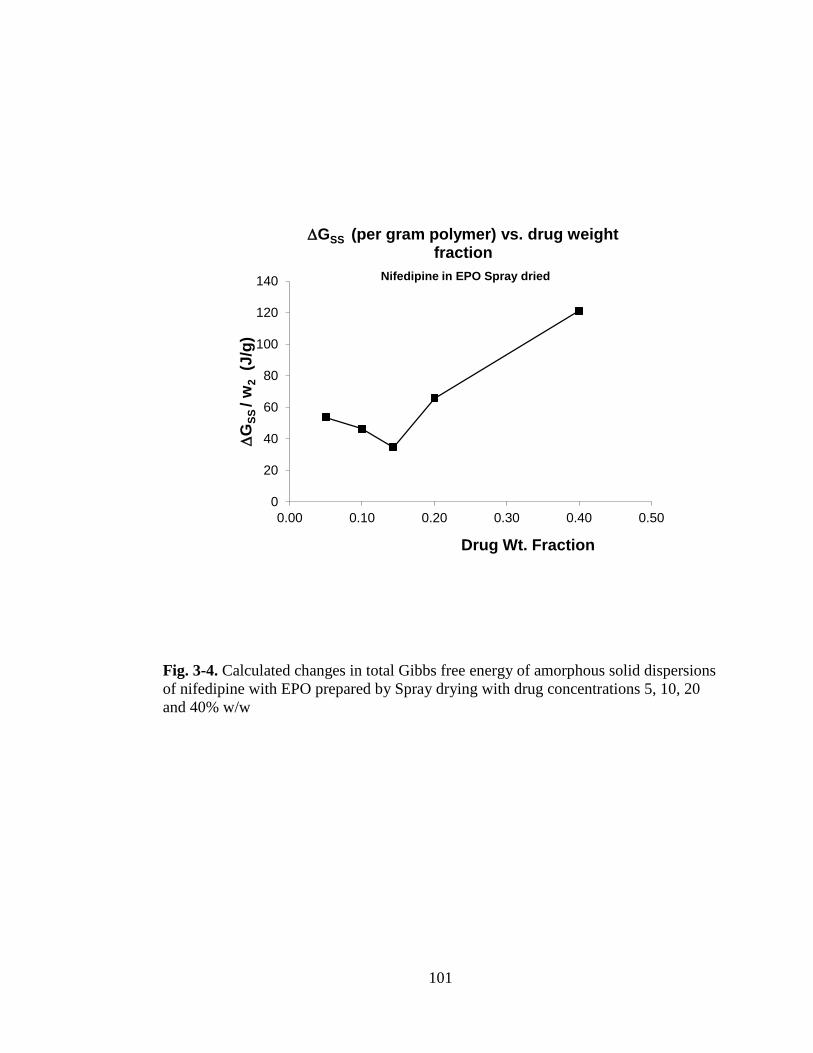
101
Fig. 3-4. Calculated changes in total Gibbs free energy of amorphous solid dispersions
of nifedipine with EPO prepared by Spray drying with drug concentrations 5, 10, 20
and 40% w/w
0
20
40
60
80
100
120
140
0.00 0.10 0.20 0.30 0.40 0.50
DG
SS
/ w
2 (J
/g)
Drug Wt. Fraction
DGSS (per gram polymer) vs. drug weight fraction
Nifedipine in EPO Spray dried

102
Fig. 3-5. Calculated changes in total Gibbs free energy amorphous solid dispersions of
nifedipine with HPMCAS LF prepared by hot melt extrusion with drug concentrations
5, 10, 20 and 40% w/w
-20
-10
0
10
20
30
40
50
0.00 0.10 0.20 0.30 0.40 0.50
DG
SS
/ w
2 (J
/g)
Drug Wt. Fraction
DGSS (per gram polymer) vs. drug weight fraction
Nifedipine in HPMCAS LF HME

103
Fig. 3-6. Calculated changes in total Gibbs free energy of amorphous solid dispersions
of nifedipine with HPMCAS LF prepared by rotary evaporation with drug
concentrations 5, 10, 20 and 40% w/w
-10
-5
0
5
10
15
20
25
30
0.00 0.10 0.20 0.30 0.40 0.50
DG
SS
/ w
2 (J
/g)
Drug Wt. Fraction
DGSS (per gram polymer) vs. drug weight fraction
Nifedipine in HPMCAS LF Rotavap

104
Fig. 3-7. Calculated changes in total Gibbs free energy of amorphous solid dispersions
of nifedipine with HPMCAS LF prepared by spray drying with drug concentrations 5,
10, 20 and 40% w/w
0
10
20
30
40
50
60
0.00 0.10 0.20 0.30 0.40 0.50
DG
SS
/ w
2 (J
/g)
Drug Wt. Fraction
DGSS (per gram polymer) vs. drug weight fraction
Nifedipine in HPMCAS LF Spray Dried

105
Fig 3-8. Calculated changes in total Gibbs free energy of amorphous solid dispersions
of nifedipine with PVPVA 64 prepared by hot melt extrusion with drug concentrations
5, 10, 20 and 40% w/w
-15
-10
-5
0
5
10
0.00 0.10 0.20 0.30 0.40 0.50
DG
SS
/ w
2 (J
/g)
Drug Wt. Fraction
DGSS (per gram polymer) vs. drug weight fraction
Nifedipine in PVPVA 64 HME

106
Fig 3-9. Calculated changes in total Gibbs free energy of amorphous solid dispersions
of nifedipine with PVPVA 64 prepared by rotary evaporation with drug concentrations
5, 10, 20 and 40% w/w
-30
-20
-10
0
10
20
30
40
50
60
0.00 0.10 0.20 0.30 0.40 0.50
DG
SS
/ w
2 (J
/g)
Drug Wt. Fraction
DGSS (per gram polymer) vs. drug weight fraction
Nifedipine in PVPVA 64 Rotavap

107
Fig 3-10. Calculated changes in total Gibbs free energy of nifedipine-polymer
amorphous solid dispersions of nifedipine with PVPVA 64 prepared by spray drying
with drug concentrations 5, 10, 20 and 40% w/w
-40
-20
0
20
40
60
80
100
120
140
0.00 0.10 0.20 0.30 0.40 0.50
DG
SS
/ w
2 (J
/g)
Drug Wt. Fraction
DGSS (per gram polymer) vs. drug weight fraction
Nifedipine in PVPVA 64 Spray Dried
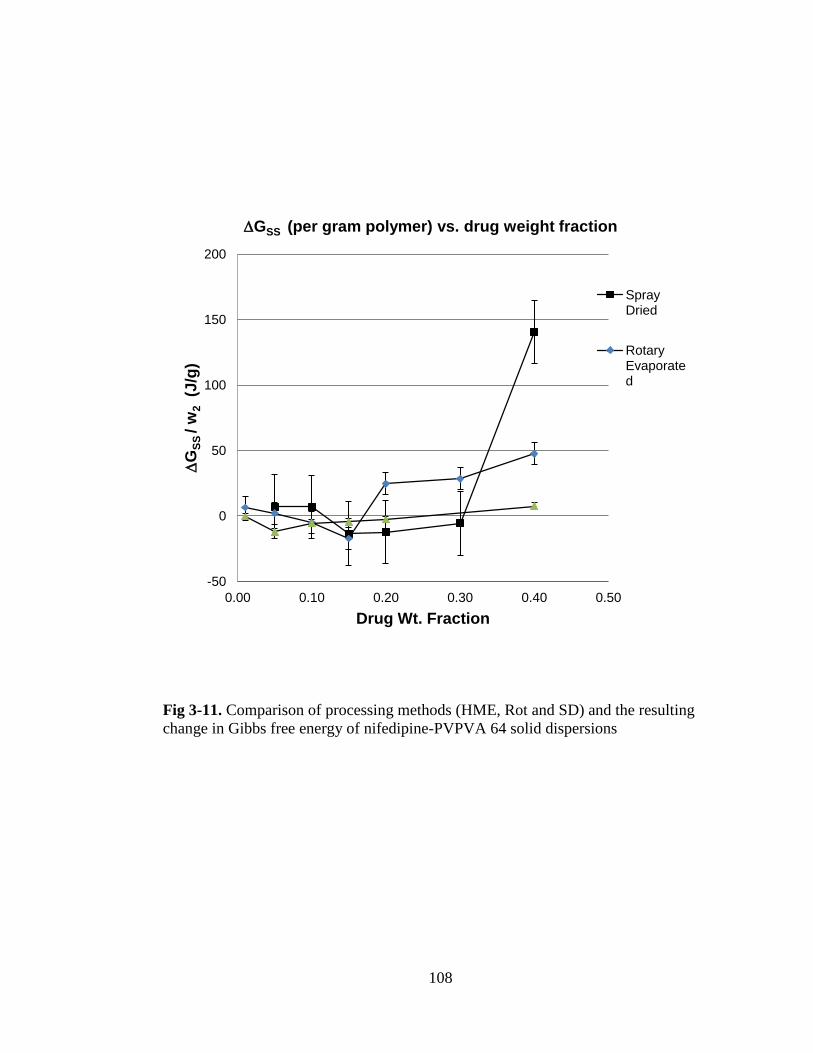
108
Fig 3-11. Comparison of processing methods (HME, Rot and SD) and the resulting
change in Gibbs free energy of nifedipine-PVPVA 64 solid dispersions
-50
0
50
100
150
200
0.00 0.10 0.20 0.30 0.40 0.50
DG
SS
/ w
2 (J
/g)
Drug Wt. Fraction
DGSS (per gram polymer) vs. drug weight fraction
Spray Dried
Rotary Evaporated

109
APPENDIX I
Fig. IA-1. A schematic diagram of a bench top conical twin-screw extruder.

110
Fig. IA-2. Diagram of spray dryer
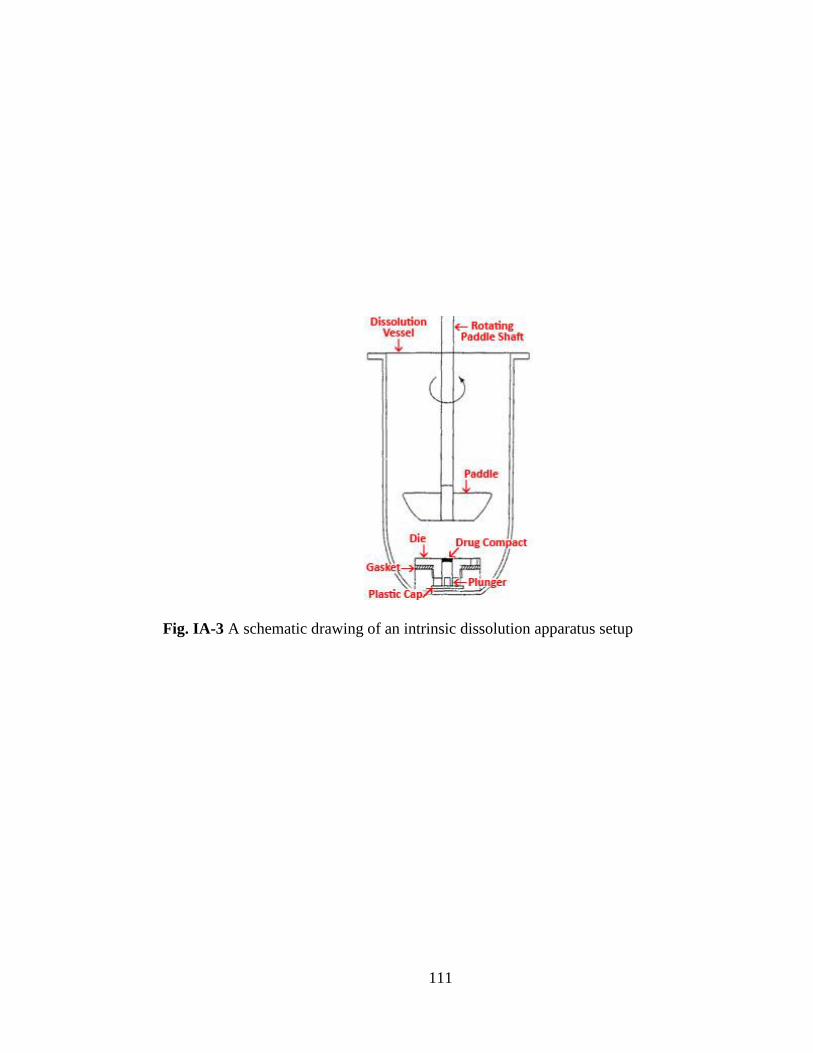
111
Fig. IA-3 A schematic drawing of an intrinsic dissolution apparatus setup