Effect of microfiltration on heat stability of milk ...
118
Effect of microfiltration on heat stability of milk concentrates by Isis Rodrigues Toledo Renhe A Thesis presented to The University of Guelph In partial fulfilment of requirements for the degree of Doctor of Philosophy in Food Science Guelph, Ontario, Canada © Isis Rodrigues Toledo Renhe, January, 2017
Transcript of Effect of microfiltration on heat stability of milk ...
Effect of microfiltration on heat stability of milk
concentrates
by
Isis Rodrigues Toledo Renhe
A Thesis
presented to
The University of Guelph
In partial fulfilment of requirements
for the degree of
Doctor of Philosophy
in
Food Science
Guelph, Ontario, Canada
© Isis Rodrigues Toledo Renhe, January, 2017
ABSTRACT
EFFECT OF MICROFILTRATION ON HEAT STABILITY OF MILK
CONCENTRATES
Isis Rodrigues Toledo Renhe Advisor:
University of Guelph, 2016 Professor M. Corredig
Co-advisor:
Professor A. Hill
Heat stability of milk concentrates may increase by removal of whey proteins. In this
thesis, physico-chemical changes caused by partial whey protein removal by microfiltration (MF)
were evaluated. The impact of these changes on the processing properties of retentates, especially
heat stability, was also assessed.
Ultrafiltration (UF) and MF were compared to establish the effect of protein composition,
while maintaining the same protein concentration in the milk dispersions. Results demonstrated
that changes on heat coagulation time (HCT) were due to the reduction of whey proteins.
However, all treatments showed better stability than what is reported in the literature. It was
hypothesized that the differences were due to the processing history and reconstitution conditions
of the concentrates used in previous works.
Diafiltration (DF) using water or permeate (PF) was also tested, to determine if a further
increase in the ratio of protein to other solids may have an impact on the heat stability of the milk
concentrates. At the same concentration factor, DF had a major impact on retentates composition
when compared to UF and MF; however, this difference could not only be attributed to a
decrease in lactose and ions, but also to an increase in pH. The analysis of the heat-induced
complexes residual in the unsedimented fraction after UHT reinforced the positive impact of DF
on heat stability, with the sample presenting fewer aggregates and with smaller sizes compared to
UF or MF milk concentrates.
Because calcium chelators are important in obtaining shelf stable products in protein
concentrates subjected to high heat treatments, the impact of these salts at different
concentrations and pH on the stability of a fresh microfiltered concentrate was evaluated. As the
original sample was quite stable, no major changes were observed in short period of time. The
results stressed, once again, the effect of processing history, and the difference in processing
functionality between fresh and reconstituted concentrates. Indeed the present results were in
contrast with literature reports.
The work in this thesis contributes to a better understanding of the differences in
processing functionality between milk protein concentrates depending on their processing
history. This is critical to improved utilization of the concentrates in high protein nutritional
beverages.
iv
Table of Contents
CHAPTER 1 .................................................................................................................... 1
Introduction ..................................................................................................................... 1
CHAPTER 2 .................................................................................................................... 6
Literature review ............................................................................................................. 6
2.1. Milk proteins.......................................................................................................................... 6
2.2. Concentration of milk by membrane filtration ...................................................................... 9
2.3. The casein micelle structure and its colloidal and soluble calcium phosphate equilibrium 13
2.4. Heating of milk and milk protein concentrates ................................................................... 15
CHAPTER 3 .................................................................................................................. 23
Effect of partial whey protein depletion during membrane filtration on thermal stability of
milk concentrates ........................................................................................................... 23
3.1. Abstract ................................................................................................................................ 23
3.2. Introduction ......................................................................................................................... 24
3.3. Material and Methods .......................................................................................................... 28
3.3.1. Sample preparation ....................................................................................................... 28
3.3.2. Heat treatment and heat stability ................................................................................... 29
3.3.3. Sample characterization ................................................................................................ 29
3.3.4. Viscosity ....................................................................................................................... 30
3.3.5. Light scattering ............................................................................................................. 30
3.3.6. Total, soluble and diffusible calcium and phosphate .................................................... 31
3.3.7. Characterization of soluble protein aggregates ............................................................. 32
3.3.8. Statistical analysis ......................................................................................................... 33
3.4. Results and Discussion ........................................................................................................ 33
3.4.1. Characterization of the concentrates ............................................................................. 33
3.4.2. Heat stability of the concentrates .................................................................................. 39
v
3.4.3. Characterization of the heat induced aggregates .......................................................... 42
3.5. Conclusions ......................................................................................................................... 50
CHAPTER 4 .................................................................................................................. 51
A comparison of the heat stability of fresh milk protein concentrates obtained by
microfiltration, ultrafiltration and diafiltration ......................................................... 51
4.1. Abstract ................................................................................................................................ 51
4.2. Introduction ......................................................................................................................... 52
4.3. Material and Methods .......................................................................................................... 55
4.3.1. Sample preparation ....................................................................................................... 55
4.3.2. Heat treatment ............................................................................................................... 55
4.3.3. Sample characterization ................................................................................................ 56
4.3.4. Viscosity ....................................................................................................................... 56
4.3.5. Light scattering ............................................................................................................. 57
4.3.6. Total, soluble and diffusible calcium and phosphate .................................................... 57
4.3.7. Characterization of soluble protein aggregates ............................................................. 58
4.3.8. Statistical analysis ......................................................................................................... 58
4.4. Results and Discussion ........................................................................................................ 59
4.4.1. Sample characterization ................................................................................................ 59
4.4.2. Heat stability and heat-induced changes ....................................................................... 64
4.5. Conclusions ......................................................................................................................... 74
CHAPTER 5 .................................................................................................................. 75
Effect of calcium chelators on heat stability and heat-induced changes of milk microfiltered
concentrates ................................................................................................................... 75
5.1. Abstract ................................................................................................................................ 75
5.2. Introduction ......................................................................................................................... 76
5.3. Material and Methods .......................................................................................................... 79
5.3.1. Sample preparation ....................................................................................................... 79
5.3.2. Sample characterization ................................................................................................ 80
vi
5.3.3. Viscosity ....................................................................................................................... 81
5.3.4. Light scattering ............................................................................................................. 81
5.3.5. Statistical analysis ......................................................................................................... 82
5.4. Results and Discussion ........................................................................................................ 82
5.4.1. General characterization of the retentates ..................................................................... 82
5.4.2. HCT as a function of chelators concentration ............................................................... 83
5.4.3. Effect of heating on final pH as a function of chelators concentration ........................ 87
5.4.4. Effect of heating on particle size as a function of chelators concentration .................. 89
5.4.5. Effect of heating on turbidity as a function of chelators concentration ........................ 91
5.4.6. Effect of heating on viscosity as a function of chelators concentration ....................... 93
5.5. Conclusions ......................................................................................................................... 95
CHAPTER 6 .................................................................................................................. 96
General conclusions ....................................................................................................... 96
References .................................................................................................................... 100
vii
List of Figures
Figure 3.1: Apparent diameter, measured by dynamic light scattering, and turbidity, measured by
diffusing wave spectroscopy, for unheated (black) and heat treated (gray) samples. .................... 43
Figure 3.2: Viscosity of samples versus shear rate before heating (open symbols) and after heat
treatment of 10 min at 120°C (filled symbols) for samples at 2x concentration (A) and milk and
4x concentration (B). ○ Milk; ○ 2xMF; Δ 2xUF; □ 4xMFD; ◊ 4xUFD; Δ 4xMF; □ 4xUF. ......... 44
Figure 3.3: Viscosity of samples at a shear rate of 100 s-1 before (gray) and after heat treatment
of 10 min at 120°C (black). ............................................................................................................ 46
Figure 3.4: Size Exclusion Chromatography of the centrifugal supernatants of original
concentrates (A) and after heating at 120°C for 10 min (B). Milk; ● 2xMF; ○2xUF; ▼ 4xMFD;
Δ 4xUFD; ■ 4xMF; □ 4xUF. ......................................................................................................... 47
Figure 3.5: SDS-PAGE patterns under non-reducing (A) and reducing conditions (B) of heated
samples serum collected from the SEC column from 60 to 90 min. The bands in the gels are
identified as (i) αs-casein; (ii) β-casein; (iii) κ-casein; (iv) β-lactoglobulin; and (v) α-lactalbumin.
........................................................................................................................................................ 49
Figure 4.1: SDS-PAGE patterns under non-reducing (A) and reducing conditions (B) of the
centrifugal supernatants of fresh ultrafiltered (UF), microfiltered (MF) concentrates, as well as
microfiltered concentrates diafiltered with permeate (PF) or water (DF). The bands in the gels
are identified as (i) αs-casein; (ii) β-casein; (iii) κ-casein; (iv) β-lactoglobulin; and (v) α-
lactalbumin. .................................................................................................................................... 62
viii
Figure 4.2: Diameter (A) and turbidity (B) measured for UF and MF concentrates, as well as
concentrates diafiltered with permeate or water (PF and DF, respectively). Samples unheated
(black), heat treated at 120°C for 10 min (light gray) or UHT (dark gray). Values are the average
of two measurements. Bars represent values of standard deviation, different letters represent
statistical significance at p<0.05. ................................................................................................... 69
Figure 4.3: Size Exclusion Chromatography of the soluble phase of original concentrates (A);
after heating at 120°C for 10 min (B); and after UHT (C). ● UF; ○ MF; ▼ PF; Δ DF. Note the
difference in scale in (A). ............................................................................................................... 72
Figure 4.4: SDS-PAGE patterns under reducing conditions of the serum in UHT treated samples
collected from size exclusion chromatography at elution time ranging from 60-70 min (A), 70-80
min (B) and 80-90 min (C). The bands in the gels are identified as (i) αs-casein; (ii) β-casein; (iii)
κ-casein; (iv) β-lactoglobulin; and (v) α-lactalbumin. ................................................................... 73
Figure 5.1: Heat coagulation time (HCT) as a function of calcium chelator concentration and at
the different pH values, 6.5 (top panel), 6.7 (center panel), 6.9 (bottom panel). Values are the
result of at least two repetitions measured; error bars represent standard deviation. * symbol
indicates statistical differences from the original concentrate (with no salts added) (p˂0.05).
Lines are only to guide the eye. ...................................................................................................... 85
Figure 5.2: Turbidity of retentates after heat treatment of 120°C/10 min as a function of calcium
chelator concentration and at the different pH values, 6.5 (top panel), 6.7 (center panel), 6.9
(bottom panel). Values are the result of at least two replicates; error bars represent standard
deviation. * symbol indicates statistical differences from the original sample (p˂0.05). Lines are
only to guide the eye. ..................................................................................................................... 92
ix
Figure 5.3: Viscosity of retentates after heat treatment of 120°C/10 min as a function of calcium
chelator concentration and at the different pH values, 6.5 (top panel), 6.7 (center panel), 6.9
(bottom panel). Values are the result of at least two repetitions measured; error bars represent
standard deviation. * symbol indicates statistical differences from the original sample (p˂0.05).
Lines are only to guide the eye. ...................................................................................................... 94
x
List of Tables
Table 3.1: Composition (mean ± SD) of fresh retentates, at 2x and 4x concentration. 4xMF and
UF concentrates were also diluted back to 2x using UF permeate (MFD and UFD, respectively).
Values are the means of at least 3 independent runs. The same superscript letter indicates no
significant difference (p˂0.05). ...................................................................................................... 34
Table 3.2: Apparent diameter of casein micelles, measured by dynamic light scattering, and
turbidity, measured by diffusing wave spectroscopy, for fresh UF and MF retentates, at 2x and 4x
volume fraction, as well as samples rediluted with UF permeate from 4x to 2x concentration
(MFD and UFD). Values are the means (and STD) of at least 3 independent runs. The same
superscripts in the same line indicate no significant difference (p˂0.05). ..................................... 36
Table 3.3: Composition of Calcium and inorganic phosphorous in the retentates and their
corresponding soluble and diffusible phases. Values are the means of at least 3 independent runs.
The same superscripts in the same line indicate no significant difference (p˂0.05). .................... 38
Table 3.4: Heat stability of retentates measured as heat coagulation time (HCT) at 120°C. Values
are the means of at least 3 independent runs. The same superscripts indicate no significant
difference (p˂0.05). ........................................................................................................................ 40
Table 4.1: Concentration of total solids, total protein, and soluble protein (after centrifugation),
as well as amount of a-lactalbumin and % of whey protein retained after filtration, as measured
by HPLC. Values are means ± SD of at least 2 independent runs. The same superscripts in the
same line indicate no significant difference (p˂0.05). ................................................................... 60
xi
Table 4.2: Calcium and phosphate composition of retentates. Values are the means of at least 2
independent runs. The same superscripts in the same line indicate no significant difference
(p˂0.05). ......................................................................................................................................... 63
Table 4.3: Casein size, turbidity and viscosity (mean±SD) of retentates. Values are the means of
at least 2 independent runs. The same superscripts in the same line indicate no significant
difference (p˂0.05). ........................................................................................................................ 65
Table 4.4: Heat stability of retentates measured as heat coagulation time (HCT) at 120°C
(mean±SD). Values are the means of at least 2 independent runs. The same superscripts indicate
no significant difference (p˂0.05). ................................................................................................. 67
Table 5.1: Final pH of retentates after heat treatment of 120°C/10 min as a function of calcium
chelator concentration and at the different pH values (mean ± SD). Values are the result of at
least two repetitions measured. The same superscripts in the same column and within the same
type of chelator indicate no significant difference (p˂0.05). ......................................................... 88
Table 5.2: Particle size of retentates before and after heat treatment of 120°C/10 min as a
function of calcium chelator concentration and at the different pH values (mean ± SD). Values
are the result of at least two repetitions measured. The same superscripts in the same column and
within the same type of chelator indicate no significant difference (p˂0.05). ............................... 90
1
CHAPTER 1
Introduction
New technologies in dairy processing are continuously explored with a view to
increase products' quality, improve production yields or reduce cost. Membrane separation
technologies are now widespread in the dairy industry. The focus of this work is the
application of microfiltration for partial removal of serum proteins before further
processing of milk. Although it is understood that extensive microfiltration and diafiltration
can remove most of the whey proteins, fractions with different concentrations of whey
protein can be obtained by modulating process conditions. A better understanding of the
role played by whey proteins in the processing properties of the final retentates is then
necessary to be able to understand what level of whey protein removal may be critical to
their processing functionality.
Even though the role played by whey proteins in the processing functionality of
skim milk is well known, there may be differences in their role in retentates prepared by
membrane filtration. For example, recent studies suggest that membrane filtration may
affect the integrity of the casein micelles and the composition of the serum phase, and these
effects are influenced by the extent of concentration and processing conditions (Ferrer et
al., 2011; Nair et al., 2014). The presence of different protein aggregates in the serum phase
of retentates may have important consequences, and for this reason, the impact of whey
proteins removal on the processing properties of the microfiltered retentates needs to be
studied.
2
Whey proteins are well known for their low heat stability and their removal has
been proposed as a technological approach to increase heat stability of dairy products. This
research focused on the heat stability properties of concentrates containing different
amounts of whey proteins. It was hypothesized that a reduction in the whey protein to
casein ratio in the retentates will affect the protein aggregation during heating, with
consequences on heat stability. However, the processing history may have an even more
profound impact; therefore, careful control of the experimental conditions is necessary.
The removal of whey proteins by membrane filtration is an established unit
operation in the dairy industry for obtaining milk protein concentrates. However, these
products are usually employed as powders, therefore, after filtration, concentration by
evaporation and drying are also necessary steps. Some of the characteristics and properties
attributed to these ingredients may result from powder production processing, and
especially from the reconstitution process. Finally, diafiltration, that is the addition of water
to the retentates during concentration, is applied to further concentrate the protein
dispersions. The addition of water to retentates increases the removal of the soluble
components which include salts such as calcium and phosphates. These salts are in
equilibrium between the soluble phase and the micellar phase, where they have an
important role in the structure and stability of the casein micelles. So, the removal of
soluble salts leads to changes in the caseins supramolecular assembly, with impact on their
processing functionality. Considering that these are the usual processes employed during
the production of milk concentrates, there may be profound differences between
reconstituted and fresh milk concentrates. Hence, there is a need to carefully control
3
processing conditions to better understand the contribution of whey proteins in retentates
prepared by microfiltration.
Micellar casein retentates are concentrates obtained by microfiltration, as in this
case, the filtration allows for permeation of the whey proteins. The heat stability of micellar
casein retentates has been studied in some detail (Beliciu et al., 2012; Crowley et al., 2015;
De Kort et al., 2012; Eshpari et al., 2014; Sauer & Moraru, 2012); however, most of the
work has focused on retentates with little residual whey protein, extensively diafiltered, and
reconstituted from powders.
In the first part of this research (Chapter 3) microfiltered retentates at different
concentrations were obtained and compared to the corresponding ultrafiltered retentates, to
evaluate the impact of concentration and whey protein removal on their heat stability. The
composition of the soluble aggregates after heat treatment was evaluated to understand the
changes in the population of whey protein induced aggregates in these retentates.
Results in Chapter 4 report the characterization of retentates produced by
ultrafiltration, microfiltration, microfiltration with diafiltration, and microfiltration with
additional filtration with permeate from ultrafiltration to evaluate the impact of ionic
composition, especially calcium and phosphate, on the properties of these retentates and
their heat-induced aggregates. The impact of ultra-high temperature (UHT) treatment on the
formation of soluble aggregates and on the casein structure, and their potential impact on
the physical stability of the UHT products, was also studied in this chapter.
Milk concentrates are frequently used to produce shelf-stable high protein
beverages, which includes a heat treatment step that can be either in-container sterilization
or UHT. Because of the changes caused by heating, these treatments are usually carried out
4
in combination with the addition of ion chelators such as phosphates and citrates. These
chelating agents are able to modulate the salt fractions through displacement of calcium,
protecting the integrity of the casein micelle and the heat stability of the whole system.
Most of the knowledge of these systems is based on research derived from skim milk
studies, or from reconstituted powders. The effect of such chelators on fresh microfiltered
retentates has never been reported. Chapter 5 summarizes changes in physical and chemical
properties of microfiltered concentrates after chelators addition at different concentrations
and pH values.
In summary, a lot is known about heat stability and the role that whey proteins play
in imparting such stability to milk, but reports on concentrated milks are few and most were
carried out with reconstituted powders, hence, the results may not apply to fresh retentates.
Therefore, the objective of this thesis was to provide advanced knowledge on the
processing behavior of milk concentrated by membrane filtration. Better understanding of
the details of processing effects will lead to optimal use of microfiltration retentates in dairy
products.
The main hypothesis of this thesis is that partial removal of whey proteins without
diafiltration may be the key to improving heat stability of concentrates without the
necessity of further adjustments.
The thesis had the following objectives:
1. Evaluate the impact of concentration by filtration and the partial removal of whey
proteins on the heat stability of milk retentates;
2. Study the importance of diafiltration and calcium equilibrium on the properties of milk
retentates and the formation of heat-induced aggregates;
5
3. Evaluate the impact of ultra-high temperature (UHT) treatments on the characteristics of
milk retentates and its lasting impact on the product's shelf-life;
4. Study the effect of chelating salts on the characteristics of heat treated retentates.
6
CHAPTER 2
Literature review
2.1. Milk proteins
The main components in cow's milk are water, lactose, fat and proteins. The protein
fraction of milk is approximately 3.3% w/w or about 25% of milk solids (Walstra et al.,
2006b). Caseins are the principal milk proteins, constituting about 78% of the total
proteins, and occuping 10% of the total volume of milk. Caseins precipitate near their
isoelectric point, at pH 4.6 (Walstra et al., 2006a), and they are distinguished from serum
proteins, which remain in solution at this pH when native. The four main casein proteins,
αs1-, αs2-, β-, and κ-casein, are self-associated in milk in what is often referred to as a
“casein micelle”, a complex structure rich in calcium phosphate (Swaisgood, 2003).
Caseins are rich in phosphoserine residues, which enable high calcium binding capacity.
Calcium sensitivity refers to the tendency of a protein to precipitate at high concentrations
of calcium, and the order of calcium sensitivity is αs2 > αs1 > β > κ-casein (Gaucheron,
2005; Swaisgood, 2003), with κ-casein being the most soluble in the presence of calcium.
The formation of dairy matrices such as cheese and yogurt are based on the destabilization
of the casein micelles and the creation of a protein network.
There is still some uncertainty regarding the details of the supramolecular structure
of the casein micelle. Scientists have described this structure with various models, i.e., a
nanocluster, dual-binding or submicellar model, by interpreting various experimental data
7
according to the principles of colloidal physical chemistry (Dalgleish et al., 2004; de Kruif
& Holt, 2003; de Kruif et al., 2012; Horne, 1998, 2006; Swaisgood, 2003; Walstra, 1999).
The heterogeneity of the micellar structure has been clearly shown by microscopy, with
cryo-TEM images highlighting the presence of clusters of calcium phosphate (Dalgleish,
2011; Dalgleish & Corredig, 2012; De Kruif & Holt, 2003; Marchin et al., 2007).
The submicellar model describes different substructures with different distribution
of individual caseins linked by calcium phosphate (Walstra, 1999). The internal sub-
micelles are depleted of κ-casein, which is mainly present in the submicelles at the surface
of the micelles. The existence of this structure has been questioned by recent studies with
electron microscopy and X-ray scattering (SAXS), which showed inconsistencies in the
model that could not be explained with experimental data (De Kruif et al., 2012; Pignon et
al., 2004). The dual-binding model for casein micelles describes the protein assembly from
a polymerization point of view and considers that κ-casein is key to control the size of the
micelles during synthesis (Horne, 1998, 2006). However, this model raises some questions
as it lacks details on the interior of the casein micelle (Dalgleish, 2011). The dual-binding
model has similarities to the nanocluster model when considering calcium phosphate
nanoclusters as the structures binding with the protein. Phosphoserine clusters are
concentrated along the protein sequence forming phosphate centers, which link to calcium
phosphate. The nanocluster model comes from the thesis that the specific assembly of the
casein micelles is directed by salt bridging of calcium phosphate nanoclusters with specific
binding sites on the calcium sensitive caseins (De Kruif & Holt, 2003). De Kruif et al.
(2012) found a correlation between data from small-angle neutron (SANS) and X-ray
8
scattering with the nanocluster model and considered this model the one which best fits
“the main features of the casein micelle”.
A general agreement about the structure of the casein is that most of the κ-casein is
present on the surface of the casein micelle. This protein plays a role in the stabilization of
the casein micelle, contributing to the steric and electrostatic stability of this colloidal
protein particle through the presence of a polyelectrolyte hairy layer on the surface
(Dalgleish & Corredig, 2012; De Kruif & Holt, 2003; Swaisgood, 2003). A study with
field-emission scanning electron microscopy described the surface of the micelle as non-
homogeneous, with protuberances covered by bunches of κ-casein (Dalgleish et al., 2004).
This structure would explain the lower amount of κ-casein in relation to what would be
necessary to cover the surface of the casein micelle. The images also suggested the
presence of a tubular structure throughout the micelle (Dalgleish et al., 2004).
Serum proteins, nearly synonymous with whey proteins, constitute the soluble
protein fraction of milk that remains after isoelectric precipitation of caseins at pH 4.6.
Comprising about 20% w/w of the total proteins, serum proteins are globular and possess
different processing functionalities compared to the caseins, including lower heat stability
(Anema, 2009; Walstra et al., 2006d). β-lactoglobulin is the main whey protein,
representing about 50% of whey proteins. It is present in native milk as a dimer and
possesses one free thiol group, which is buried within the structure but becomes highly
reactive after heating (Anema, 2009; Donato & Guyomarc’h, 2009). The heat induced
structure modifications expose the free thiol group that enables formation of disulfide
bonds leading to formation of aggregates of β-lactoglobulin with itself and other cysteine
containing proteins. Because of its higher concentration, compared to other whey proteins,
9
and its denaturation reactions, β-lactoglobulin tends to dominate whey ingredients
properties during processing (O’Mahony & Fox, 2013). α-lactalbumin is the second most
abundant protein in the serum phase, representing approximately 20% of the whey proteins.
It is a metallo-protein that binds Ca2+, and it does not usually associate. This protein is also
sensitive to heat treatment, but, because its denaturation is somehow reversible, it can be
considered quite stable especially when no other protein is present (O’Mahony & Fox,
2013; Walstra et al., 2006d). On the other hand, in the presence of -lactoglobulin, it
participates in the formation of heat induced aggregates (Anema, 2009). α-lactalbumin's
biological function has been related to lactose synthesis, and it seems to play a major role in
determining milk composition and volume of production (O’Mahony & Fox, 2013). Other
minor proteins present on the serum phase of milk include blood serum albumin (BSA),
immunoglobulins, proteose peptone, and lactoferrin.
2.2. Concentration of milk by membrane filtration
Membrane filtration is a physical separation process based on size differences
between the constituents of a fluid. In the dairy industry, the application of this technology
was motivated by the search for solutions for whey utilization (Ryder, 1985). For many
years whey was indeed considered a low value byproduct of cheese manufacture; however,
the increase in demand for whey proteins has changed the approach to whey utilization. For
example, by separating whey proteins from milk using membrane technologies it is
possible to generate a better starting material for the purification of nutritionally valuable
serum proteins than by separating the proteins from cheese whey (Brans et al., 2004). With
10
this process, the native whey protein concentrates not contain peptides from culture
fermentation, color, enzymes, casein macropeptide, or undesirable off flavors derived from
the cheese making process.
During membrane filtration, the fractionation of the constituents is mainly based on
size, but charges in the membrane material and shape of molecules may also impact the rate
of transmission through the filter (Goulas & Grandison, 2008). During membrane filtration,
selective permeation produces two distinct streams. One is the retentate, containing all
material that cannot pass through the membrane plus the sufficient serum to carry them; the
other is the permeate, containing the remaining portion of solvent and permeable particles.
Membrane filtration can result in a broad range of products, depending on the permeation
characteristics of the membranes (Goulas & Grandison, 2008).
Ultrafiltration uses membranes with pore sizes ranging from 3 to 300 nm and is
used for selective concentration of proteins (Walstra et al., 2006a). In milk, all the
macromolecules are kept in the retentate, and the permeate is composed of water, lactose
and salts. Protein and colloidal minerals increase in the retentate, while soluble mineral and
nonprotein nitrogen decrease (Mistry & Maubois, 2004). Water activity, ionic strength and
pH are kept the same while the ratio of protein to lactose changes due to the removal of this
sugar during permeation (Walstra et al., 2006b).
Microfiltration consists of membranes > 0.1 µm (Maubois, 2002). Membranes with
pore size bigger than 5 µm and 1.4 µm are usually used for removal of somatic cells and
microorganisms, respectively (Maubois, 2002). The application of this technology aims to
increase milk quality through the previous removal of somatic cells before further
mechanical treatments could lead to the release of a detrimental complex enzymatic system.
11
A similar idea is applied for the removal of microorganisms. In this case, the objective is to
decrease microorganisms allowing less intense heat treatments and a product with extended
shelf life.
At the interface between UF and MF is the fractionation of milk proteins with
membranes of pore size ranging between 0.1 and 0.2 µm (Brandsma & Rizvi, 2001). In this
process, the ratio between caseins and whey proteins is changed, and some soluble caseins
can also be removed depending on product history and processing conditions. The retentate
is rich in caseins and the permeate holds soluble proteins. Both can be used for the
development of beverages of tailored composition, or for products with reduced lactose
(Farkye & ur-Rehman, 2011).
With the possibility of making retentates with different amounts of whey proteins,
opportunities have emerged to revisit some processing challenges such as the release of
whey during cheese making, and the heat stability of milk concentrates. For example, it has
been demonstrated that the presence of whey proteins in higher concentration in curd made
with UF milk leads to differences in the final cheese structure, ripening, flavor and moisture
(Goulas & Grandison, 2008; Hinrichs, 2001; Ryder, 1985).
Membrane filtration can affect the processing functionality of the retentates. For
example, ultrafiltered milk retentates have modified renneting functionality (Ferrer et al.,
2011). Ultrafiltration also increases the concentrates' buffering capacity with shifting of
maximum peak consistent with the higher concentration of calcium and phosphate (Li &
Corredig, 2014). It was proposed that these changes are a consequence of insoluble calcium
loss, changes in the proportion of casein to colloidal calcium and phosphate, and re-
arrangements in the micelle, since no differences were observed in the casein micelles' size
12
(Ferrer et al., 2011; Li & Corredig, 2014). Other study showed that with concentration,
there is a change in the composition of the serum phase, namely, an increase in soluble
proteins with concentration which leads to increased serum viscosity, refractive index and
turbidity (Nair et al., 2014). At volume fractions higher than 0.32, turbidity can no longer
be predicted by using theoretical models for hard spheres, suggesting an increased
interaction between the casein micelles in concentrates. The viscosity of retentates presents
shear thinning behavior when volume fraction exceed 0.4 (Nair et al., 2014).
The demand for new products with extended shelf life such as high protein
beverages generated the search for knowledge capable of solving common problems in
these products like gelation and formation of aggregates. Dairy based ingredients are
frequently used to achieve the desired characteristics of these products and other food
products (Agarwal et al., 2015; Crowley et al., 2015). However, as heat stability is
dependent on concentration, some processing challenges may be faced (Crowley et al.,
2015). Solubility and poor reconstitutability also become a main concern when powders are
used (Eshpari et al., 2014), besides the decrease in stability resulting from drying (Beliciu
et al., 2012). Another point of concern is the use of diafiltration which, in addition to
microfiltration, enables up to 95% of whey protein removal (Nelson & Barbano, 2005).
With diafiltration, water is used to dilute the retentate for further filtration, allowing a
bigger removal of whey proteins, lactose and salts. One of the positive aspects of this
process are the changes in milk salt equilibria, which is important to casein stability. All
these challenges, associated with the not fully studied changes caused by filtration, create a
demand for the development of alternative uses of already established or new technologies
13
for the production of dairy ingredients. A better understanding of the processing behavior
of microfiltered retentates may be the key to offering more functional ingredients.
2.3. The casein micelle structure and its colloidal and soluble calcium phosphate
equilibrium
As briefly described above, minerals have an important role in the structure and
stability of casein micelles, especially calcium and phosphate. Calcium concentration in
milk is 26-32 mMol. kg -1 and total phosphorus is 30-32 mMol. kg -1 (Lucey & Horne,
2009). About two-thirds of calcium and half of the inorganic phosphate are in the colloidal
phase, linked to the caseins through phosphoserine binding sites (Gaucheron, 2005). The
equilibrium between the colloidal and soluble fraction has a critical role in the processing
functionality of milk proteins (Gaucheron, 2005). As an example, the amount and
distribution of calcium is important to the meltability of mozzarella and processed cheeses
(Kapoor & Metzger, 2008). Calcium, inorganic phosphate and other minerals are
distributed between the serum phase (soluble) and the colloidal phase (casein micelle) and
their partition between phases depends on pH, temperature, and protein concentration,
among others (Lucey & Horne, 2009). In the soluble phase, they can be further divided as
free, in ionic form, or linked to proteins such as α-lactalbumin. This metallo-protein has one
atom of calcium per molecule (O’Mahony & Fox, 2013). Micellar calcium is partly
associated with casein via phosphoserine residues (calcium caseinate) and to colloidal
inorganic phosphate (calcium phosphate). Calcium can also be associated to citrate.
14
Variability of salts composition may come from the animal, while changes in the
distribution between colloidal and soluble are more likely to be induced by process
technology. For example, acidification leads to protonation of acid-basic amino acid groups
with consequent release of calcium phosphate from the caseins into the serum phase
(Gaucheron, 2005). Heat treatment decreases the solubility of calcium phosphate, inducing
the formation of calcium colloidal phosphate (CCP), with a decrease of calcium and
phosphate in the soluble phase. This change can be reversible for temperature treatments up
to 90°C (for a few minutes), but higher heating regimes cause irreversible changes
(Gaucheron, 2005; Lucey & Horne, 2009). Cooling has the inverse effect, resulting in the
solubilization of CCP, which can also be credited to partial dissociation of the casein
micelles, especially of β-casein. With membrane filtration, changes in the ratio between
colloidal and soluble fraction may be observed, with an increase in the CCP and the
removal of some soluble calcium phosphate. If diafiltration is applied, the removal of
soluble calcium is more extensive and can affect the casein micelle integrity (Li &
Corredig, 2014). Chelating agents are another important technological agent that may
modulate ionic distribution. Chelating molecules have an affinity for cations and are
capable of displacing micellar calcium, increasing the heat stability of milk (De Kort et al.,
2012). It is important to point out that increasing concentration of chelating agents leads to
the dissociation of casein micelles (Lucey & Horne, 2009).
In summary, as the processing properties of casein micelles depend on the structure
and the ionic equilibrium between the colloidal and soluble phases, the processing history
of concentrates is of critical importance to determine their functionality.
15
2.4. Heating of milk and milk protein concentrates
Heat stability of milk and milk protein concentrates is an important characteristic
that needs to be controlled. Heat stability is usually measured through the determination of
the Heat Coagulation Time (HCT), which consists of the measurement of the time required
for the sample to show visible signs of coagulation when placing the sample in an oil bath.
pH is the most important factor affecting HCT, both in milk and milk concentrates (Singh,
2004). HCT-pH profile can be changed by altering the concentrations of calcium,
magnesium, phosphate, urea, β-lactoglobulin, and κ-casein, among others (Singh, 2004).
Heating processes are vital to increasing the shelf life of food and can be more or less
severe depending on the desired outcome. Milk is known for its considerable high heat
stability, but problems are reported for extensive heat, as for example during the
manufacture of evaporated milk (Singh, 2004).
High contents of prolyl residues in the structure of caseins result in open and
flexible molecules, with good surface-active and stabilizing properties (Broyard &
Gaucheron, 2015). Caseins are relatively stable to heating of milk because of this flexible
structure, with little secondary and tertiary structure. The casein micelle structure shows
minimal changes during heating, although treatments over 90°C lead to an increase in the
casein micelle size due to the aggregation of whey proteins via disulfide and hydrophobic
interactions (Anema, 2009). In addition, some dissociation can be noticed by the increase of
non-sedimentable casein (O’Connell & Fox, 2003). The dissociation is mainly of κ-casein
(~40%) and is pH dependent.
16
Whey proteins are very heat sensitive, due to their globular structure, and although
β-lactoglobulin has a denaturation temperature of 78°C, changes start at temperatures as
low as 65°C (Iametti et al., 1996; O’Connell & Fox, 2003; Singh & Havea, 2003). Heat
instability in milk usually appears as flocculation, gelation or protein precipitation
(O’Connell and Fox, 2003). Aggregate formation will depend on the protein concentration
and the ratio of whey to casein proteins. In summary, there are 3 main reactions involving
milk proteins after heating: casein micelle dissociation; whey proteins denaturation; and
interactions of whey proteins with other whey proteins and/or caseins (Anema, 2009).
When heated, whey proteins are denatured and interact with themselves or associate
with casein micelles, mostly via complexes with κ-casein. Under the general understanding
of denaturation, which is the change of secondary and tertiary structure of the proteins, α-
lactalbumin is more heat-labile than β-lactoglobulin (Anema, 2009). β-lactoglobulin
possesses one free thiol group that becomes highly reactive during heating, causing
aggregates to form (Anema, 2009; Donato & Guyomarc’h, 2009). α-lactalbumin is also
sensitive to heat treatment but because its denaturation is partially reversible, it can be
considered quite stable especially when no other protein is present (O’Mahony & Fox,
2013; Walstra et al., 2006d). However, in the presence of -lactoglobulin, it participates in
the formation of heat induced aggregates with κ-casein (Anema, 2009; Donato & Dalgleish,
2006). α-lactalbumin has an initial denaturation temperature of 62°C (Singh & Havea,
2003). There is evidence that whey proteins first aggregate with themselves and then with
κ-casein (Guyomarc’h et al., 2003).
The interactions between whey proteins and caseins are affected by time,
temperature, rate of heating and pH, and concentration of proteins. The complexes may be
17
soluble in the serum, and the distribution of the complexes between serum and micellar
phases can be modulated by changing the pH of the initial milk (Alexander & Dalgleish,
2005; Dalgleish & Corredig, 2012). Heating at pH higher than 6.7 leads to increase of
protein in the serum phase, while lower pH presents a decrease in soluble proteins (Donato
& Dalgleish, 2006). The formation of heat induced complexes may lead to age gelation of
dairy products (Donato & Guyomarc’h, 2009). Other changes during heating are also
responsible for the decrease of milk stability. Degradation of lactose and formation of
organic acids will cause a decrease in pH; the reaction of lactose with caseins through the
Maillard reaction causes the formation of glycosylated complexes; calcium may associate
with citrate and precipitate as calcium phosphate (O’Connell & Fox, 2003). All these
factors can impact the general stability of milk to heating.
Heating has a major impact on the colloidal properties of the milk proteins. After
heating, interactions between denatured whey proteins and other proteins, as well as casein
micelles dissociation may be observed (Anema, 2009). The aggregates formed during
heating impact the characteristics of the final dairy matrix and can be desirable or
undesirable depending on the required processing functionality. For example, the formation
of heat induced aggregates has a positive impact on the texture of acidified protein gels.
With extensive heating, acid coagulation happens at higher pH, the final gel has higher
viscosity and firmness, and the capacity of whey retention is increased (Donato &
Guyomarc’h, 2009). On the other hand, high heating treatment is not desirable for cheese
making because of the impacts on coagulation (Alexander & Dalgleish, 2005; Donato &
Guyomarc’h, 2009).

18
For an even longer shelf-life of food products, ultra-high temperatures (UHT) can
be applied. UHT is a continuous commercial sterilization process that increases bacterial
destruction minimizing denaturation of nutritional components. Heat treatments of milk at
140°C show the regular formation of whey proteins and κ-casein aggregates but authors
have reported that the aggregate size does not increase with the increase of heating time
(Singh & Latham, 1993). At normal milk pH, most of the complexes formed are associated
with casein micelles. An increase of small particles is also noted, and attributed to thermal
degradation of proteins as well as the formation of soluble aggregates (Singh & Latham,
1993). Although milk is quite stable to UHT treatment, studies using micellar casein
concentrates reported poor heat stability of milk protein dispersions to UHT, at different
protein concentrations (Beliciu et al., 2012). However, details on the type of aggregates
formed or the composition of the serum phase in these systems are still to be determined.
The dependence of aggregate distribution in milk on pH changes has also been
observed during heating of milk concentrated by osmotic stressing (Nair et al., 2013). The
amount of protein in the soluble phase increases with concentration, regardless of heat
treatment. The initial pH of the concentrated suspensions also impacts the type of soluble
aggregates formed. At lower pH (6.4), concentrated milk presented smaller aggregates with
a higher ratio of caseins to whey proteins (Nair et al., 2013). Heat treatment of concentrates
prepared by ultrafiltration also showed differences in the composition and size of the
unsedimentable aggregates based on length of heat treatment and concentration of proteins,
with longer treatment and higher concentrations resulting in more aggregates (Li et al.,
2015). Additional diafiltration resulted in more soluble protein and more aggregates with a
different size than ultrafiltered samples with no diafiltration applied. α-lactalbumin was
19
present in a larger amounts in aggregates after more intense heat treatments (Li et al.,
2015).
Because of the recognized poor stability of whey proteins, ingredients with reduced
amounts of these proteins may be used in high protein beverages, among other products.
Examples of these ingredients are micellar casein concentrates and isolates (Beliciu et al.,
2012; de Kort et al., 2012; Sauer & Moraru, 2012). The production of these ingredients
involves multiple filtration steps, followed by a drying step.
Studies have been conducted on the stability of milk concentrates or isolates at
different protein concentration and pH values, and under different environments, such as
variable calcium concentration and distribution and the presence of chelators (Beliciu et al.,
2012; Crowley et al., 2015; De Kort et al., 2012; Sauer & Moraru, 2012). However, no
research has focused on the role of whey proteins in these systems. Studies on micellar
concentrates have shown low colloidal stability, high viscosity of dispersions after
sterilization because of heat induced aggregation of the proteins (Beliciu et al., 2012). It
was observed that the instability increases with increasing temperature as a consequence of
changes in mineral equilibrium and partial disintegration of casein micelles. It was
proposed that the instability can be prevented by increasing the pH of the concentrates prior
to heating (Sauer & Moraru, 2012). The results report poor heat stability at pH lower than
6.9, with visible aggregation, and an increase of casein micelle size after heating at pH 6.9
but not at higher pH (Sauer & Moraru, 2012). At pH higher than 6.9, differences in casein
size after heat treatment were not observed. These results would be in agreement with the
reports on heating unconcentrated skim milk at different initial pH values (Donato &
Dalgleish, 2006); however, there was no characterization of the soluble complexes formed
20
during heating in the concentrated milk. De Kort et al. (2012) also reported a positive
impact of increasing the pH on heat stability of micellar caseins. The same study
demonstrated that calcium chelators increase heat stability to varying degrees depending on
the chelator type and concentration. Sodium hexametaphosphate, sodium phytate, disodium
uridine monophosphate, disodium hydrogen and trisodium citrate presented different
calcium binding capacities, suggesting a differential dissociation of casein micelles as
reason for turbidity decrease (de Kort et al., 2011). Dissociation of casein with consequent
increase of soluble casein was also the cause of the increase in viscosity of the heated
suspensions (de Kort et al., 2011, 2012).
The importance of pH was also demonstrated in milk protein concentrates.
Suspensions reconstituted to 8.5% protein were analyzed for heat stability as a function of
pH (Crowley et al., 2015). Concentrates with a protein content lower than 70% (on a dry
basis) showed good heat stability at lower pH (6.6-6.7), with heat coagulation time (HCT)
increasing with the increase of protein ration to other solids in the powder. This would
indicate that increased diafiltration improved heat stability. Concentrates with high protein
content presented better heat stability with the increase of pH (>6.9) (especially those
prepared by reconstituting MPC85 and MPC 90) (Crowley et al., 2015). The change in the
pH stability suggests the important role played by the diafiltration process, because of the
removal of soluble salts, and the possible solubilization of colloidal calcium phosphate
during rehydration. The changes in the soluble phase can be seen through the differences in
Ca-ion activity found between suspensions with 3.5% and 8.5% protein content (Crowley
et al., 2014, 2015).
21
It could then be hypothesized that removal of whey proteins may improve heat
stability of concentrates; however, continuous diafiltration to achieve higher protein
concentrations, with consequent removal of soluble salts, may overcome the positive effect
of whey proteins removal because of the solubilization of colloidal calcium phosphate
during rehydration.
The use of fresh retentates as a base for dairy beverages has been much less studied.
As most of the research reported on the functional properties of high protein solutions has
been conducted with reconstituted powders, the results may not apply to fresh, liquid
samples. There are profound changes occurring in the calcium and phosphate equilibrium
during concentration and drying, and this needs to be taken into close consideration in heat
stability studies. The impact of the interactions between whey proteins and caseins on the
product properties has also not been studied.
In addition, the partial removal of whey proteins on microfiltered retentates could be
a nutritional differential for the category. Whey protein and casein are considered high
quality proteins because of their digestibility, bioavailability, and amino acid profiles with a
high proportion of essential amino acids (McGregor & Poppitt, 2013). The consumption of
dairy products is also associated with a decrease in metabolic related disorders, and
improved metabolic health (McGregor & Poppitt, 2013). Keeping part of the whey proteins
would allow the combination of the two different nutritional benefits of milk proteins and
their different amino acid profiles. Whey proteins are fast-acting proteins, which mean that
they are rapidly absorbed. On the other hand, caseins show slow absorption and slow amino
acid release in the blood stream, with important consequences to satiety (Agarwal et al.,
2015; McGregor & Poppitt, 2013).
22
The objective of this work was to understand the effect of a reduction in whey
protein on the heat stability of milk concentrates while controlling the ionic composition of
the serum phase. The use of microfiltration to reduce the amount of whey proteins present
in the serum phase of the retentates, varying ratios between caseins and whey proteins, may
provide a solution to problems related to heat stability of milk concentrates. In addition, the
improved knowledge of the relationship between composition and stability may provide
opportunities to create novel functional ingredients.
23
CHAPTER 3
Effect of partial whey protein depletion during membrane filtration on thermal
stability of milk concentrates
3.1. Abstract
Membrane filtration technologies are widespread unit operations in the dairy
industry, often employed to obtain ingredients of tailored processing functionalities. The
objective of this work was to better understand the effect of partial removal of whey
proteins by microfiltration (MF) on the heat stability of the concentrates. Control retentates
at the corresponding volume fraction were obtained using ultrafiltration (UF). Pasteurized
milk was microfiltered (80 kDa polysulfone membrane) or ultrafiltered (30 kDa cellulose
membrane) without the addition of water (diafiltration), to reach two and four times
concentration (based on volume reduction). The final concentrates showed no differences in
pH, casein micelle size, or minerals in the serum phase. The MF retentates had 20 and 40%
decrease in whey protein concentration compared to the corresponding UF retentates, for
2x and 4x concentration, respectively. The heat coagulation time decreased with increasing
protein concentration in the retentates. MF retentates had a higher thermal stability than the
corresponding UF controls. There was a significant increase in the average diameter for
casein micelles after heating in UF but not MF retentates. The turbidity (measured by light
scattering) increased after heating, but to a higher extent for UF retentates than for MF
retentates at the same protein concentration. It was concluded that the reduced amount of
24
whey protein in the MF retentates caused a significant increase in the heat stability,
compared to the corresponding UF retentates. This difference was not due to ionic
composition differences, nor pH, but to the type and amount of complexes formed in the
serum phase.
3.2. Introduction
Dairy based ingredients as milk protein concentrates (MPC) and milk protein
isolates (MPI) have been largely used to achieve the desired characteristics of high protein
beverages, in high demand in the marketplace (Agarwal et al., 2015). To obtain these
ingredients, different membrane filtration may be used, and depending on processing
conditions, the protein concentration and the composition of the soluble phase can be
modulated.
Milk contains caseins and whey proteins, and these proteins have very different heat
denaturation behavior. Whey proteins in their native form show a globular structure, which
unfolds at temperatures > 62°C (Singh & Havea, 2003). Caseins, on the other hand, are
relatively stable to heating in their monomeric form, because of their flexible structure. The
changes in the supramolecular structure of casein micelles after heating can cause profound
differences to their colloidal stability. Some pH dependent dissociation of the caseins can
be noted after heating, along with increased non-sedimentable casein, with κ-casein as the
main contributor (O’Connell & Fox, 2003). Furthermore heating over 90°C leads to an
increase of the casein micelle size, due to the association, also pH dependent, between
whey proteins and caseins (Donato & Dalgleish, 2006).
25
When heated, whey proteins are denatured and interact with themselves or associate
with casein micelles, and form complexes mostly with κ-casein and s2 casein, by
disulphide bridge formation. The interactions between whey proteins and caseins have been
widely studied in skim milk, and are affected by time, temperature, rate of heating, pH, and
protein concentration (Anema, 2009; Li et al., 2015). The formation of heat induced
complexes may lead to age gelation of dairy products (Donato & Guyomarc’h, 2009). The
complexes may be soluble in the serum or associated with the micelles, and the distribution
of the complexes between serum and micellar phases can be modulated by changing the pH
of the initial milk (Alexander & Dalgleish, 2005; Dalgleish & Corredig, 2012). At pH
lower than that of the original milk (pH 6.7), aggregates are mostly associated with the
micelle surface, while at a higher pH (i.e. 7.0) there is an increase of unsedimentable
aggregates (Donato & Dalgleish, 2006). Changes in the initial pH of the milk can also lead
to changes in size and composition of aggregates. Higher pH (>6.7) in milk causes the
formation of smaller complexes and with a higher ratio between κ-casein and whey proteins
(Donato & Dalgleish, 2006). Although it is known that the extent of whey protein
denaturation increases with protein concentration, increasing the concentration of other
solids in milk seems to protect the denaturation (Anema et al., 2006). The details on the
formation of soluble and colloidal heat denatured aggregates in milk concentrated by
filtration are not fully understood. It is known that concentration increases the amount of
protein in the soluble phase and leads to calcium phosphate solubilization, with a
consequent increase in the formation of unsedimentable protein and soluble aggregates
(Ferrer et al., 2011; Li & Corredig, 2014).
26
The heat instability in milk is usually shown by flocculation, gelation or protein
precipitation (O’Connell & Fox, 2003). The aggregate formation, as well as the instability,
will depend on the protein concentration and the ratio of whey to casein proteins (Anema,
2009; Donato et al., 2007). Other changes during heating may also be responsible for the
decrease in milk stability. Degradation of lactose and formation of organic acids will cause
a decrease in pH; the reaction of lactose with caseins through the Maillard reaction causes
the formation of glycosylated complexes; calcium may associate with citrate and precipitate
as calcium phosphate. All these factors can impact the general stability of milk to heating
(O’Connell & Fox, 2003).
In designing high protein milk beverages, products from membrane filtration are
often used. While with ultrafiltration all the major proteins are concentrated in the retentate,
using larger pore size membranes, often referred to as microfiltration, it is possible to
selectively concentrate caseins while transmitting whey proteins in the permeate. The
permeate contains native milk serum proteins, and these proteins have reduced off-flavors
when compared with proteins from cheese whey (Evans et al., 2010). The retentate fraction
obtained by microfiltration is often referred to as micellar casein concentrate, as depending
on the extent of diafiltration, it is possible to achieve high levels of whey protein removal
(Nelson & Barbano, 2005). Because of their sensitivity to heat, whey proteins removal has
been proposed as a way to produce more heat stable beverages. However, whey proteins
also present high nutritional value, especially in combination with caseins, and their partial
removal might be the key to finding a balance between nutrition and stability control of
milk concentrates (McGregor & Poppitt, 2013).
27
Micellar casein concentrates have also been suggested as a solution to develop
shelf-stable high protein beverages (Sauer & Moraru, 2012). Studies have been conducted
on the stability of micellar caseins at different pH values, with variable calcium
concentration and distribution, and with or without chelators (De Kort et al., 2012; Sauer &
Moraru, 2012). Previous studies have demonstrated poor heat stability of protein
concentrates at pH lower than 6.9, with visible aggregation after sterilization, both by UHT
or retort processes (Sauer & Moraru, 2012). There is an increase in the average casein
micelle size after heating at pH 6.9, but not at higher pH (Sauer & Moraru, 2012). The
positive impact of increasing the pH on heat stability was also reported by De Kort et al.
(2012), who also demonstrated that calcium chelators increase heat stability of the
concentrates to varying degrees depending on the chelator type and concentration.
As most of the research reported on the heat stability of milk concentrates has been
conducted on reconstituted suspensions, the results may not apply to fresh concentrates.
There are profound changes occurring in the calcium and phosphate equilibrium during
concentration and drying, and this needs to be taken into close consideration in heat
stability studies. The objective of this work was to understand the effect of a reduction in
whey protein in the heat stability of milk concentrates while controlling the ionic
composition of the serum phase. The use of microfiltration to reduce the amount of whey
proteins present in the serum phase of the retentates, varying ratios between caseins and
whey proteins, may provide a solution to problems related to heat stability of milk
concentrates, as well as an opportunity to create novel functional ingredients.
28
3.3. Material and Methods
3.3.1. Sample preparation
Pasteurized skim milk (Sealtest/Agropur, supplied by Crown Dairy Ltd., Guelph,
Canada) was four times concentrated in a plate and frame membrane system (PUROSEP
LT-2, SmartFlow Technologies, Apex, NC, USA) as previously described (Li et al., 2015).
The membranes used were either 30 or 80 kDa molecular cutoff. The plate and frame
system differs from common spiral wound systems by allowing low transmembrane
pressure and better molecular weight cut off due to low fouling of the membranes. Samples
were collected at two and four times concentration in both processes, based on volume
reduction, by measuring the amount of permeate. Retentates concentrated four times were
also diluted back to two times concentration with permeate obtained by ultrafiltration. This
procedure allowed making samples with the same protein volume fraction, but with a
difference in the ratio of casein to whey proteins. By using ultrafiltered permeate it was
possible to maintain a similar ionic composition of the serum phase for all the samples.
In total, seven samples were examined: skimmed milk control; microfiltered milk
2x and 4x concentrated (2xMF; 4xMF); ultrafiltered milk 2x and 4x concentrated (2xUF;
4xUF); and 4x MF and UF rediluted to 2x with UF permeate (4xMFD; 4xUFD). In
addition, the concentrates were also subjected to dialysis with ultrafiltered permeate at 4°C
overnight, to further ensure all the samples had the same ionic composition. A cellulose
dialysis membrane (Fisher Scientific, Whitby, ON, Canada) with a molecular mass cutoff
of 6–8 kDa was used. Dialysis was conducted at a ratio of 1 liter of permeate per 50 mL of
sample.
29
3.3.2. Heat treatment and heat stability
The thermal stability of retentates was determined by heat coagulation time (HCT),
defined as the time at 120°C required to induce visible coagulation. The system used was a
silicone oil bath (Haake AC200 - ThermoFisher Scientific, Newington, NH) fitted with a
custom made circulation device. Three mL aliquots were transferred to a heat-resistant
screw-cap test tube and immersed in the oil bath at 120°C (Eshpari et al., 2014). The
samples were kept under agitation and the elapsed time between the immersion and the first
visible precipitation was recorded as the HCT.
To further characterize the effect of heating on the various concentrates, aliquots (9
mL) of retentate were transferred to a glass tube and heated at 120°C for 10 min in the
silicone oil bath (see above). The samples were immediately cooled to room temperature by
immersion in an ice bath, and further analysis was carried out.
3.3.3. Sample characterization
Total solids was determined by drying approximately 2 g of sample in an aluminum
dish. The samples were dried at 105°C in a gravity-flow convection oven over pre-dried
sand (Fisher Scientific, Pittsburgh, PA) overnight. The pH of the retentates was measured at
25°C, under agitation, using an Accumet pH meter (Fisher Scientific, Pittsburgh, PA),
calibrated before use.
Total protein concentration was measured by Dumas method Leco FP-528 (Leco
Corp., St. Joseph, MI, USA) using a conversion factor of 6.38 to convert the nitrogen
concentration into protein. The soluble fraction was obtained by ultracentrifugation
(62,000xg for 1 h at 20°C) and the colorimetric DC protein assay method (Bio-Rad,
30
Mississauga, ON, Canada) was used to measure the protein. The whey protein
concentration was measured by HPLC (Thermo Instruments Canada Inc., Mississauga, ON,
Canada). The supernatant (20 μL), separated by centrifugation (62,000 x g for 1 h) was
injected into a Nova-Pak C18 column (Waters, Mississauga, ON, Canada) and eluted in a
1mL/min flow gradient of 0.1% v/v trifluoroacetic (TFA) (solvent A) and acetonitrile,
MilliQ water, and TFA in a ratio 900:100:1 (v/v/v) (solvent B). The gradient started with
2% eluent B, increasing to 70% B in 40 min, achieving 100% B in 41 min, and kept at
100% until 47 min. Eluted peaks were detected at 280 nm.
3.3.4. Viscosity
Viscosity was measured using a controlled stress rheometer (Paar Physica MC 301,
Anton Paar, Graz, Austria) using cone and plate geometry, with a set gap of 0.51 mm. The
temperature of the system was controlled at 25°C. The milk retentate samples were
subjected to a shear sweep test from 10 to 300 s-1 and values at 100 s-1 were used for
statistical analysis.
3.3.5. Light scattering
Particle size distribution was determined by dynamic light scattering (DLS)
(Zetasizer Nano, Malvern Instruments, Worcestershire, UK). The samples were extensively
diluted (1:1000) with filtered (0.22μm PVDF filters, Fisher Scientific) permeate from
ultrafiltration.
Transmission diffusing wave spectroscopy (DWS) was employed to measure the
turbidity in situ without dilution. The photon transport mean free path (l*), which is defined
31
as the length scale over which the scattered light has been totally randomized (Alexander &
Dalgleish, 2005; Nicolai, 2007) was measured. l* depends on physical properties of the
scattering particles, particles' concentration, the refractive index contrast, as well as the
interparticle spatial correlation (Alexander et al., 2006).
For the analysis, a solid-state laser light with a wavelength of 532 nm and a power
of 350 mW (Verdi V2 from Coherent, Santa Clara, CA, USA) was used to illuminate the
samples held in a 5-mm path length optical glass cuvette (Hellma Canada Ltd., Concord,
ON, Canada). The temperature was maintained at 25°C with a water bath. The scattered
light was collected and fed via two matched photomultipliers (HC120-03, Hamamatsu,
Loveland, OH, USA) to the correlator (FLEX2K-12×2, Bridgewater, NJ, USA) and
analyzed using software developed specifically for the equipment (Mediavention Inc., ON,
Canada). Correlation functions and intensity of transmitted scattered light were measured at
intervals during 2 min. The viscosity and refractive index of the continuous phase used to
calculate the radius were 1.021×10⁻³ Pa.s and 1.34, respectively (Alexander et al. 2006;
Alexander and Dalgleish 2005).
3.3.6. Total, soluble and diffusible calcium and phosphate
Total calcium was measured after precipitation of milk samples with 1 M HCl and
water in an Eppendorf microcentrifuge tube, followed by centrifugation for 15 min at
4,500×g (Eppendorf centrifuge, Brinkmann Instruments Ltd., Mississauga, ON, Canada)
and the clear supernatant used for analysis. Soluble fractions were analyzed from the
supernatants after centrifugation at 62,000xg for 1 h at 20°C. The diffusible phase was
obtained after ultrafiltration of soluble phases in concentrators with molecular weight cutoff
32
of 10 kDa (Corning® Spin-X® UF), at 5,000xg for 30 min and used for both calcium and
phosphate analysis. For total and soluble phosphate analysis, 0.5 mL of original samples
and soluble phase were incinerated at 500°C for 8 hours and then solubilized with 1 mL of
1M nitric acid before dilution in water.
An Advanced Compact Ion chromatography (Ω Metrohm ion analysis, Metrohm
Ltd., Herisau, Switzerland) was used to measure calcium and phosphate (Zhao & Corredig,
2015). For calcium determination, a cation column (Metrosep C4/150, Metrohm) was
employed. Samples were eluted at a flow rate of 0.9 mL min−1 with 0.7 mM dipicolinic
acid and 1.7 mM HNO3 as the mobile phase. For the determination of phosphate fractions,
HPLC-grade water was used as acceptor solution and the samples were eluted on an anion
column (Metrosep A Supp5-150/4.0, Metrohm). Samples were eluted at a flow rate of 0.5
mL min−1 of 1.0 mM sodium hydrogen carbonate and 3.2 mM sodium carbonate.
3.3.7. Characterization of soluble protein aggregates
Soluble protein aggregates were characterized by Size Exclusion Chromatography
(SEC) using ÄKTA purifier 10 system (GE Healthcare, Uppsala, Sweden) as previously
described (Li et al., 2015). The soluble phase was obtained through centrifugation at
62000xg for 1h. 10 mL fractions were collected from 40 to 170 min for further analysis of
the differences in the type and composition of the soluble aggregates through
electrophoresis. The fractions were freeze-dried and then diluted in 1 mL sample buffer
without β-mercaptoethanol. The electrophoresis analysis of the peak eluted between 60 and
90 min was conducted under both reducing (with β-mercaptoethanol) and non-reducing
conditions. SDS-PAGE was performed using a Bio-Rad electrophoresis unit (Bio-Rad
33
Power Pac HC, Mississauga, ON, Canada) at 175 V for 50 min. The resolving gel
contained 15% acrylamide and the stacking gel contained 4% acrylamide. Aliquots of 5 μL
of 1% (w/w) standard solutions (sodium caseinate and WPI 85) were loaded onto the gels.
For the SEC peaks, 10 μL of the 4x samples or 20 μL of milk and 2x samples were loaded
on the non-reducing analysis; and 8 μL of the 4x samples or 16 μL of milk and 2x samples
were loaded on the reducing analysis. The gels were stained with Coomassie blue,
destained in multiple steps with solutions of methanol and acetic acid, scanned (Bio-Rad
Laboratories, Mississauga, ON, Canada) and then analyzed for integrated intensities of the
protein bands using Image lab software (Bio-Rad, version 5.2.1).
3.3.8. Statistical analysis
The experiment was carried out in triplicate (i.e. three separate milk batches).
Statistical significances were evaluated using analysis of variance (ANOVA) at p˂0.05 and
T-test. The mean values were compared using Tukey test, with all data processed using
Statistica 12 software.
3.4. Results and Discussion
3.4.1. Characterization of the concentrates
Table 3.1 summarizes the amount of solids, protein and soluble protein, including
native whey protein, present in control milk as well as in the various fresh concentrates
prepared by microfiltration (MF) and ultrafiltration (UF). Samples of 4x MF and UF
concentrates rediluted with UF permeate to 2x concentration are also shown in Table 3.1,
and indicated as MFD and UFD.
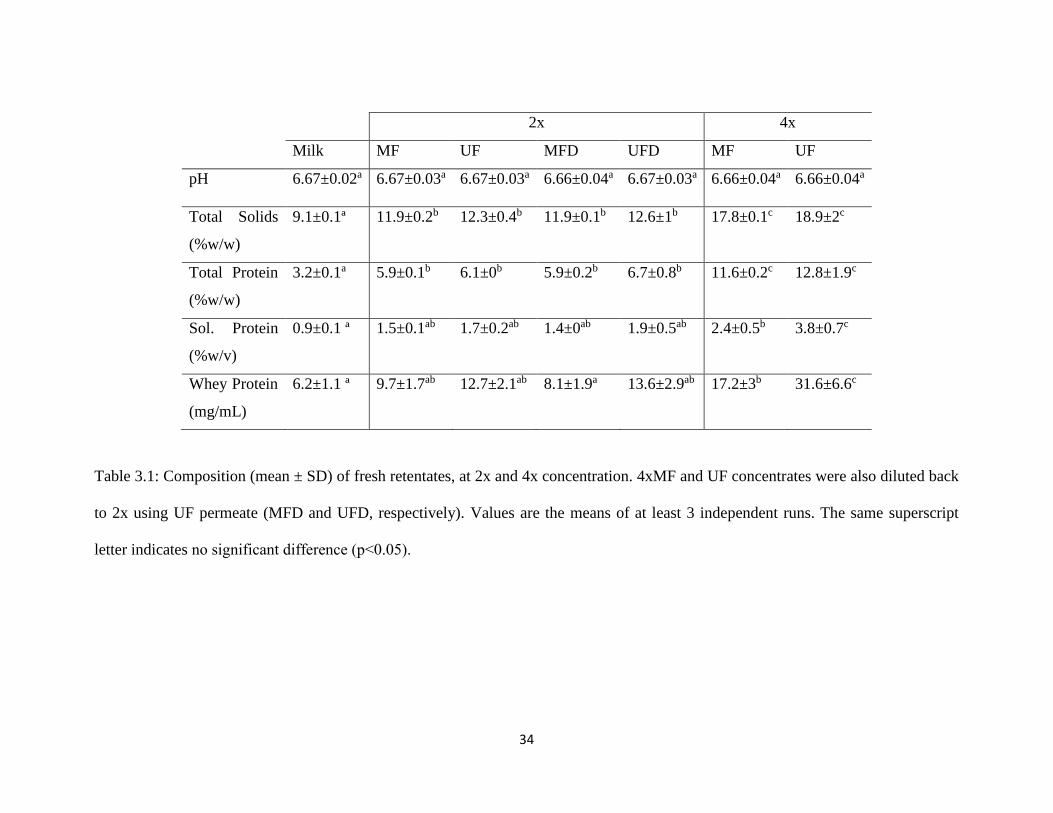
34
2x 4x
Milk MF UF MFD UFD MF UF
pH 6.67±0.02a 6.67±0.03a 6.67±0.03a 6.66±0.04a 6.67±0.03a 6.66±0.04a 6.66±0.04a
Total Solids
(%w/w)
9.1±0.1ª 11.9±0.2b 12.3±0.4b 11.9±0.1b 12.6±1b 17.8±0.1c 18.9±2c
Total Protein
(%w/w)
3.2±0.1a 5.9±0.1b 6.1±0b 5.9±0.2b 6.7±0.8b 11.6±0.2c 12.8±1.9c
Sol. Protein
(%w/v)
0.9±0.1 ª 1.5±0.1ab 1.7±0.2ab 1.4±0ab 1.9±0.5ab 2.4±0.5b 3.8±0.7c
Whey Protein
(mg/mL)
6.2±1.1 ª 9.7±1.7ab 12.7±2.1ab 8.1±1.9a 13.6±2.9ab 17.2±3b 31.6±6.6c
Table 3.1: Composition (mean ± SD) of fresh retentates, at 2x and 4x concentration. 4xMF and UF concentrates were also diluted back
to 2x using UF permeate (MFD and UFD, respectively). Values are the means of at least 3 independent runs. The same superscript
letter indicates no significant difference (p˂0.05).
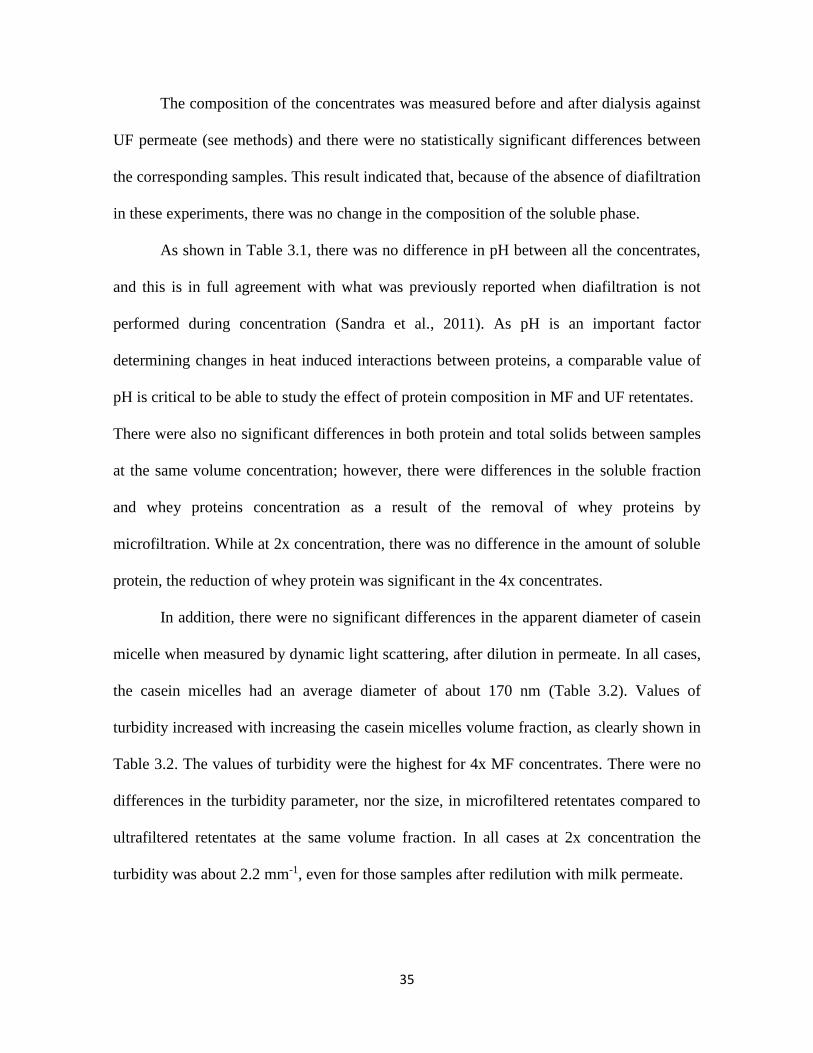
35
The composition of the concentrates was measured before and after dialysis against
UF permeate (see methods) and there were no statistically significant differences between
the corresponding samples. This result indicated that, because of the absence of diafiltration
in these experiments, there was no change in the composition of the soluble phase.
As shown in Table 3.1, there was no difference in pH between all the concentrates,
and this is in full agreement with what was previously reported when diafiltration is not
performed during concentration (Sandra et al., 2011). As pH is an important factor
determining changes in heat induced interactions between proteins, a comparable value of
pH is critical to be able to study the effect of protein composition in MF and UF retentates.
There were also no significant differences in both protein and total solids between samples
at the same volume concentration; however, there were differences in the soluble fraction
and whey proteins concentration as a result of the removal of whey proteins by
microfiltration. While at 2x concentration, there was no difference in the amount of soluble
protein, the reduction of whey protein was significant in the 4x concentrates.
In addition, there were no significant differences in the apparent diameter of casein
micelle when measured by dynamic light scattering, after dilution in permeate. In all cases,
the casein micelles had an average diameter of about 170 nm (Table 3.2). Values of
turbidity increased with increasing the casein micelles volume fraction, as clearly shown in
Table 3.2. The values of turbidity were the highest for 4x MF concentrates. There were no
differences in the turbidity parameter, nor the size, in microfiltered retentates compared to
ultrafiltered retentates at the same volume fraction. In all cases at 2x concentration the
turbidity was about 2.2 mm-1, even for those samples after redilution with milk permeate.
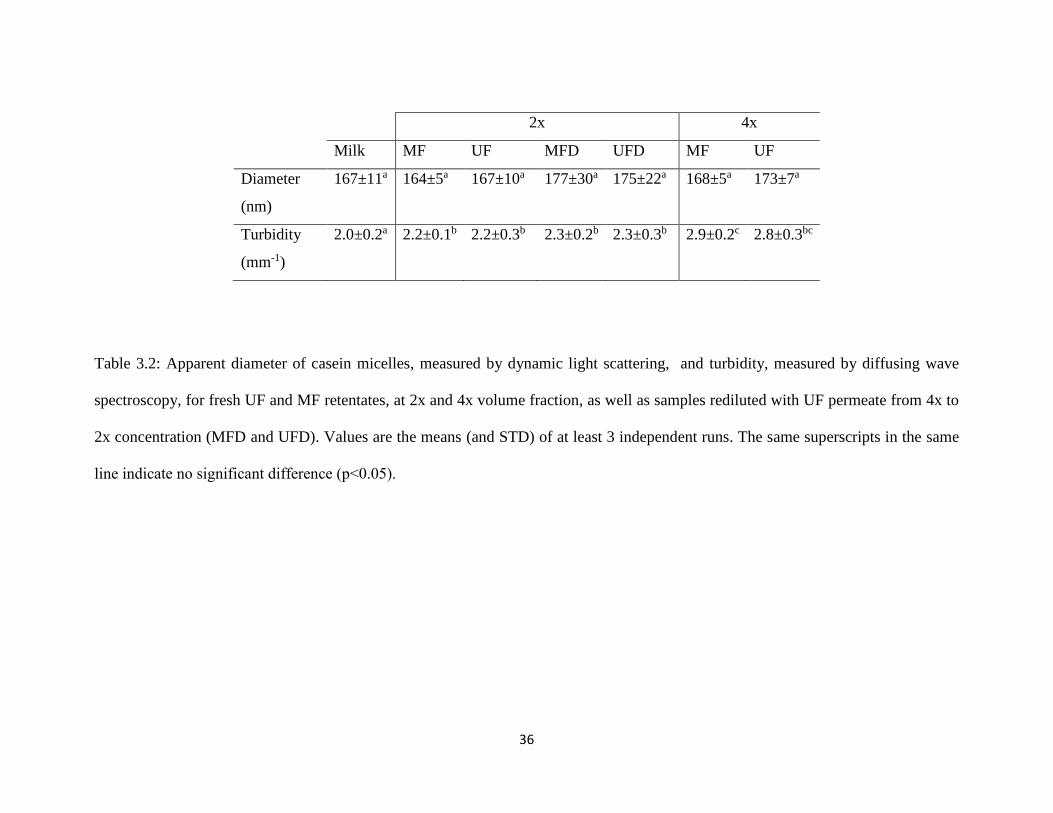
36
2x 4x
Milk MF UF MFD UFD MF UF
Diameter
(nm)
167±11a 164±5a 167±10a 177±30a 175±22a 168±5a 173±7a
Turbidity
(mm-1)
2.0±0.2a 2.2±0.1b 2.2±0.3b 2.3±0.2b 2.3±0.3b 2.9±0.2c 2.8±0.3bc
Table 3.2: Apparent diameter of casein micelles, measured by dynamic light scattering, and turbidity, measured by diffusing wave
spectroscopy, for fresh UF and MF retentates, at 2x and 4x volume fraction, as well as samples rediluted with UF permeate from 4x to
2x concentration (MFD and UFD). Values are the means (and STD) of at least 3 independent runs. The same superscripts in the same
line indicate no significant difference (p˂0.05).
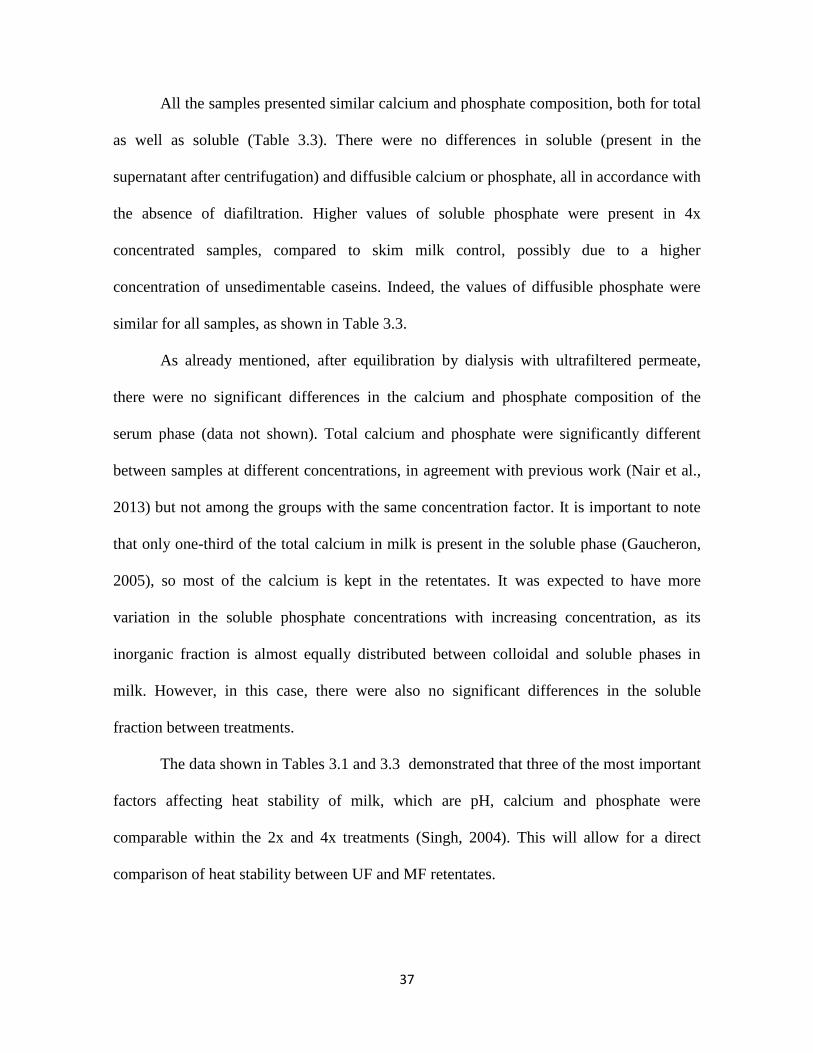
37
All the samples presented similar calcium and phosphate composition, both for total
as well as soluble (Table 3.3). There were no differences in soluble (present in the
supernatant after centrifugation) and diffusible calcium or phosphate, all in accordance with
the absence of diafiltration. Higher values of soluble phosphate were present in 4x
concentrated samples, compared to skim milk control, possibly due to a higher
concentration of unsedimentable caseins. Indeed, the values of diffusible phosphate were
similar for all samples, as shown in Table 3.3.
As already mentioned, after equilibration by dialysis with ultrafiltered permeate,
there were no significant differences in the calcium and phosphate composition of the
serum phase (data not shown). Total calcium and phosphate were significantly different
between samples at different concentrations, in agreement with previous work (Nair et al.,
2013) but not among the groups with the same concentration factor. It is important to note
that only one-third of the total calcium in milk is present in the soluble phase (Gaucheron,
2005), so most of the calcium is kept in the retentates. It was expected to have more
variation in the soluble phosphate concentrations with increasing concentration, as its
inorganic fraction is almost equally distributed between colloidal and soluble phases in
milk. However, in this case, there were also no significant differences in the soluble
fraction between treatments.
The data shown in Tables 3.1 and 3.3 demonstrated that three of the most important
factors affecting heat stability of milk, which are pH, calcium and phosphate were
comparable within the 2x and 4x treatments (Singh, 2004). This will allow for a direct
comparison of heat stability between UF and MF retentates.
38
Table 3.3: Composition of Calcium and inorganic phosphorous in the retentates and their corresponding soluble and diffusible phases.
Values are the means of at least 3 independent runs. The same superscripts in the same line indicate no significant difference (p˂0.05).
2x 4x
mM Milk MF UF MFD UFD MF UF
Ca T 21±3a 38±3b 40±5b 39±3b 41±8b 81±9c 83±14c
Ca Sol 10.5±1.5a 11.5±1.8a 12.2±1.9a 12.6±2.4a 12.7±2a 12.4±3.1a 13.1±2.9a
Ca Diff 7.5±1.7a 7.5±2.1a 7.1±1.7a 6.6±1.9a 7.1±1.6a 6.7±1.3a 7.0±1.7a
Pi T 32±9a 45±6ab 46±6ab 48±6b 51±14b 79±14d 63±21bd
Pi Sol 14.2±1.5a 16.0±0.5ab 16.3±0.6ab 15±2.7ab 16.9±1.1ab 17.2±1.9b 17.5±1.2b
Pi Diff 9.2±1.0a 9.2±1.5a 9.4± 1.1a 8.8±1.7a 8.9±1.5a 8.5±1.4a 8.5±1.8a
39
3.4.2. Heat stability of the concentrates
The heat stability of the retentates was tested using an oil bath at 120°C and
measuring the time before the visible appearance of aggregation. As shown in Table 3.4, in
all cases, the heat coagulation time was > 30 min. Heat coagulation time for skim milk
control was around 60 min, in accordance with an earlier report for milk at pH 6.7
(O’Connell & Fox, 2003). It is known that heat coagulation time decreases with protein
concentration (Singh, 2004). For the ultrafiltered samples, the coagulation time decreased
to 37 and 28 min, for 2xUF and 4xUF concentrates, respectively. When the 4x concentrate
was re-diluted to a 2x concentrate with permeate (4xUFD), the heat coagulation time
returned to the values of the corresponding 2xUF concentrate, indicating that, with all the
other conditions being comparable, only the protein concentration has an impact on heat
stability. A similar trend was also noted for the microfiltered samples; however, in this
case, all the minimum coagulation times were significantly higher than those of the
corresponding ultrafiltered concentrates. It was possible then to conclude that the reduced
ratio between whey proteins and caseins in microfiltered retentates caused a significant
increase in the heat stability of the retentates when compared to control UF retentates.
As previously mentioned, this difference was not due to soluble calcium and
phosphate composition differences, nor to differences in pH. 4xMF retentates contained 17
± 3 mg/mL of whey proteins, about 40% less whey proteins than the 4xUF control
retentates (Table 3.1). 2x concentrates prepared with MF, containing 20% less whey
proteins than UF control, showed an increase in the heat coagulation time of about 11 min.
A 4x concentrate prepared by MF showed statistically similar heat stability to that of a
2xUF concentrates, with a heat coagulation time of about 38 min.
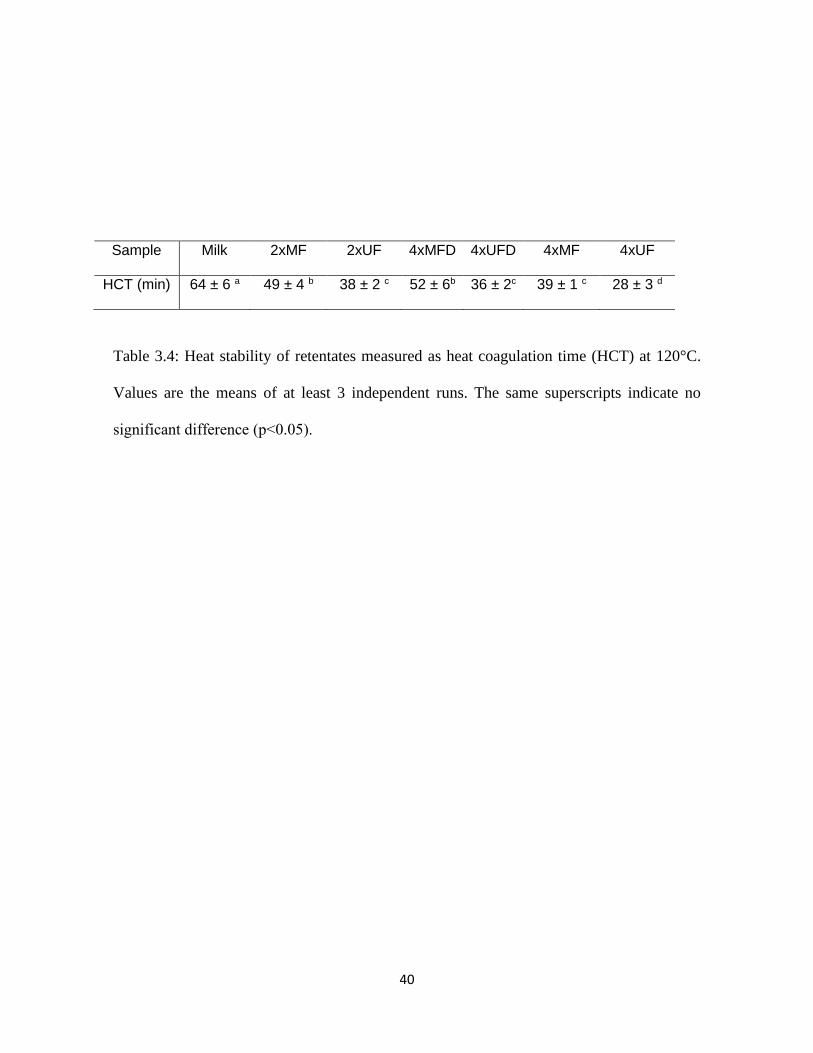
40
Sample Milk 2xMF 2xUF 4xMFD 4xUFD 4xMF 4xUF
HCT (min) 64 ± 6 a 49 ± 4 b 38 ± 2 c 52 ± 6b 36 ± 2c 39 ± 1 c 28 ± 3 d
Table 3.4: Heat stability of retentates measured as heat coagulation time (HCT) at 120°C.
Values are the means of at least 3 independent runs. The same superscripts indicate no
significant difference (p˂0.05).
41
These results are in contrast with data published in a previous study, whereby the
concentrates heated at same pH, but with lower protein contents than those of the current
work, showed instability in a broad range of heating treatments (Sauer & Moraru, 2012). In
the previous work, samples of micellar casein concentrate were reconstituted to 8% (w/v)
protein concentration, adjusted to different pH values from 6.5 to 7.3 and subjected to heat
treatments at temperatures from 110°C to 150°C (come up time of 52 s, followed by
immediate cooling). The authors reported poor heat stability at pH lower than 6.9, with
visible aggregation after heating at 110 and 120°C, and complete coagulation for
temperatures higher than 130°C (Sauer & Moraru, 2012). At pH 6.9, casein micelle size
increased with temperature after heating but the same was not observed at higher pH values
(Sauer & Moraru, 2012). Another study using fresh micellar casein fractions, with protein
concentrations between 5 and 10%, showed significant increases in viscosity and visible
aggregation after treatment with UHT or retorting regimens (Beliciu et al., 2012).
The cause of the inconsistency may be the use of reconstituted powders, which have
a dramatically different processing history, as well as the use of extensively diafiltered
fresh retentates. Indeed, micellar caseins were prepared using concentration and
diafiltration, in addition to drying. Diafiltration alters the salt balance of the system,
resulting in losses of colloidal calcium ions and compositional changes in the serum phase,
with consequent decreased stability of casein micelles (Li & Corredig, 2014; Sikand et al.,
2013). The original pH of the samples after redilution was higher (7.1) than what was
observed in this study (6.7) (Sauer & Moraru, 2012). The initial values for total and soluble
calcium and phosphate concentrations were also much lower compared to the values
measured in the present study (Table 3.3). This hypothesis is also supported by previous
42
work (Eshpari et al., 2014) that showed that milk concentrates (obtained with diafiltration)
reconstituted to 5% (w/w solids) have short heat coagulation times. On the other hand,
reconstituted powders obtained from concentrates where only ultrafiltration was applied
showed high heat stability, but at a higher pH than that employed in this study (Eshpari et
al., 2014).
3.4.3. Characterization of the heat induced aggregates
To be able to better understand the changes occurring during high temperature
heating, and to compare the present results with literature, concentrates were heated at
120°C for 10 min and subsequently characterized for viscosity, apparent particle size and
type and amount of soluble proteins present. Figure 3.1 shows the differences in apparent
particle diameter and turbidity for the retentates before and after heat treatment. Only the
4x UF retentates showed a significant increase of casein micelle apparent diameter after
heating. Milk and MF samples kept the same particle size at all levels of concentration. On
the other hand, the turbidity parameter 1/l*, measured by diffusing wave spectroscopy,
increased in all the samples after heating. 4x UF presented the highest turbidity and was
different from all the other samples. In addition, 4x MF concentrates showed a 1/l* value
comparable to that of 2x concentrates. All results pointed to the importance of the whey
proteins/casein ratio to the heat stability and functional properties of the retentates.
The viscosity of the various retentates was measured and showed an increase with
concentration, in agreement with the literature (Nair et al., 2014; Nair et al., 2013; Walstra
et al., 2006) (Figure 3.2). All the samples presented shear thinning behavior to different
degrees both before and after heating.
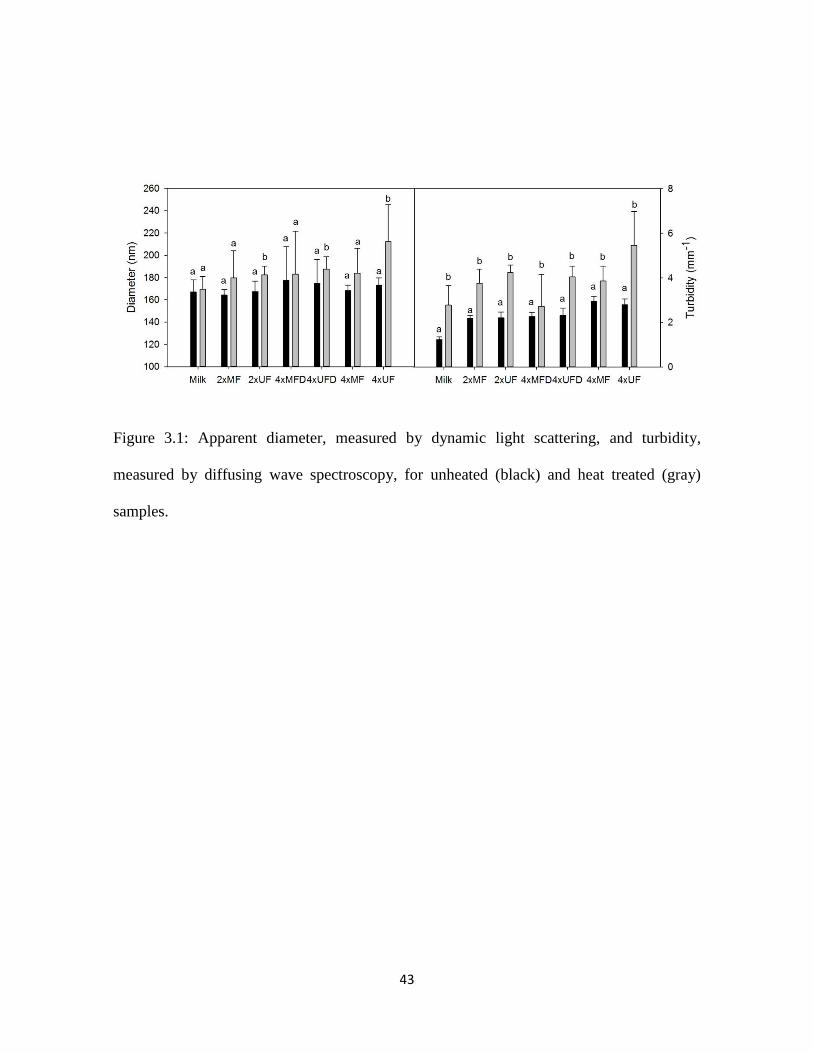
43
Figure 3.1: Apparent diameter, measured by dynamic light scattering, and turbidity,
measured by diffusing wave spectroscopy, for unheated (black) and heat treated (gray)
samples.
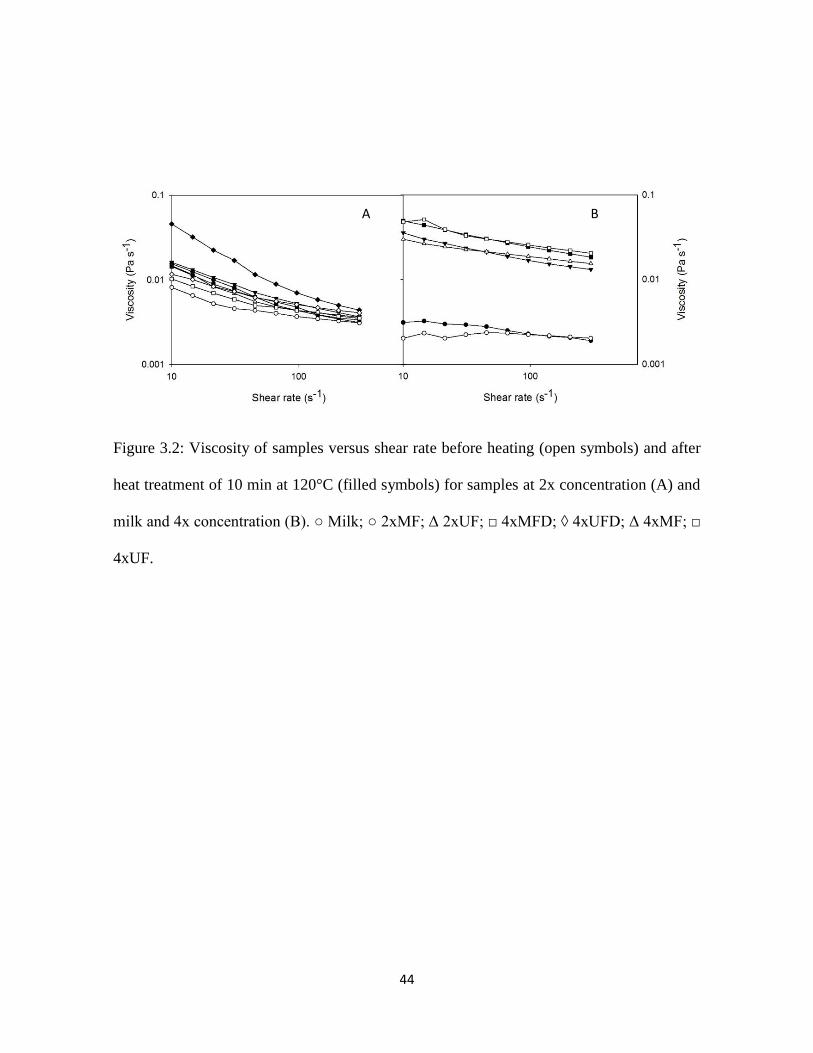
44
Figure 3.2: Viscosity of samples versus shear rate before heating (open symbols) and after
heat treatment of 10 min at 120°C (filled symbols) for samples at 2x concentration (A) and
milk and 4x concentration (B). ○ Milk; ○ 2xMF; Δ 2xUF; □ 4xMFD; ◊ 4xUFD; Δ 4xMF; □
4xUF.
A B
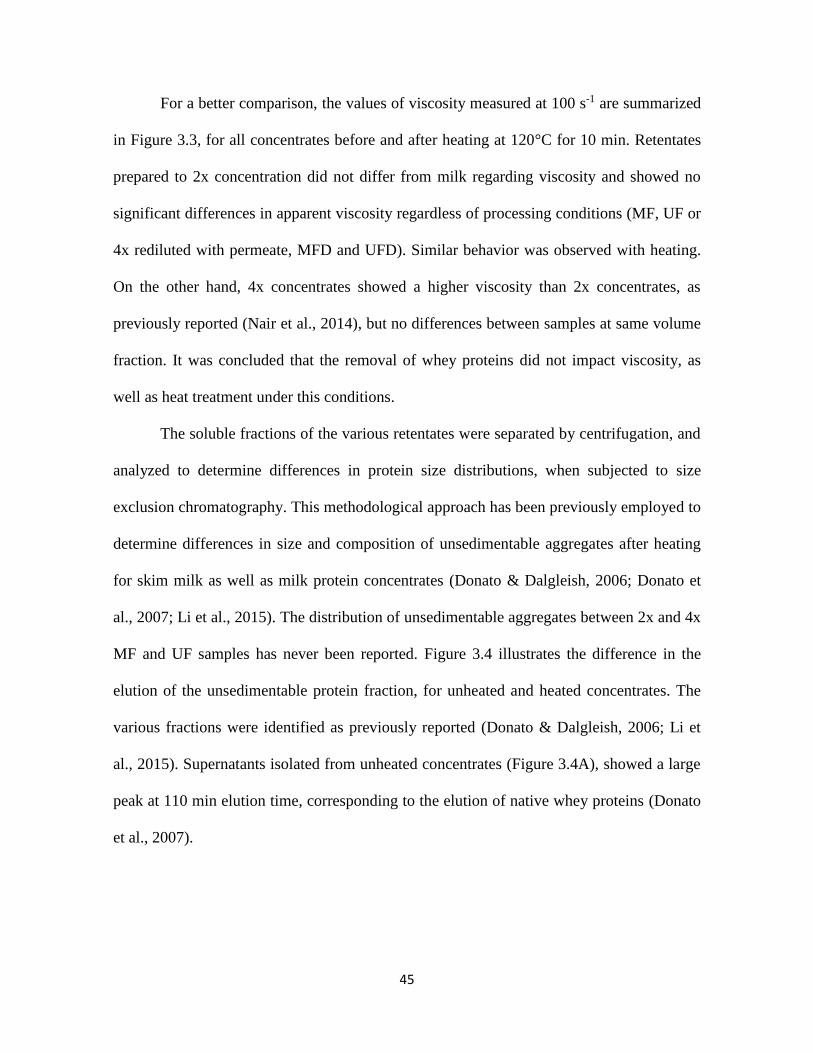
45
For a better comparison, the values of viscosity measured at 100 s-1 are summarized
in Figure 3.3, for all concentrates before and after heating at 120°C for 10 min. Retentates
prepared to 2x concentration did not differ from milk regarding viscosity and showed no
significant differences in apparent viscosity regardless of processing conditions (MF, UF or
4x rediluted with permeate, MFD and UFD). Similar behavior was observed with heating.
On the other hand, 4x concentrates showed a higher viscosity than 2x concentrates, as
previously reported (Nair et al., 2014), but no differences between samples at same volume
fraction. It was concluded that the removal of whey proteins did not impact viscosity, as
well as heat treatment under this conditions.
The soluble fractions of the various retentates were separated by centrifugation, and
analyzed to determine differences in protein size distributions, when subjected to size
exclusion chromatography. This methodological approach has been previously employed to
determine differences in size and composition of unsedimentable aggregates after heating
for skim milk as well as milk protein concentrates (Donato & Dalgleish, 2006; Donato et
al., 2007; Li et al., 2015). The distribution of unsedimentable aggregates between 2x and 4x
MF and UF samples has never been reported. Figure 3.4 illustrates the difference in the
elution of the unsedimentable protein fraction, for unheated and heated concentrates. The
various fractions were identified as previously reported (Donato & Dalgleish, 2006; Li et
al., 2015). Supernatants isolated from unheated concentrates (Figure 3.4A), showed a large
peak at 110 min elution time, corresponding to the elution of native whey proteins (Donato
et al., 2007).
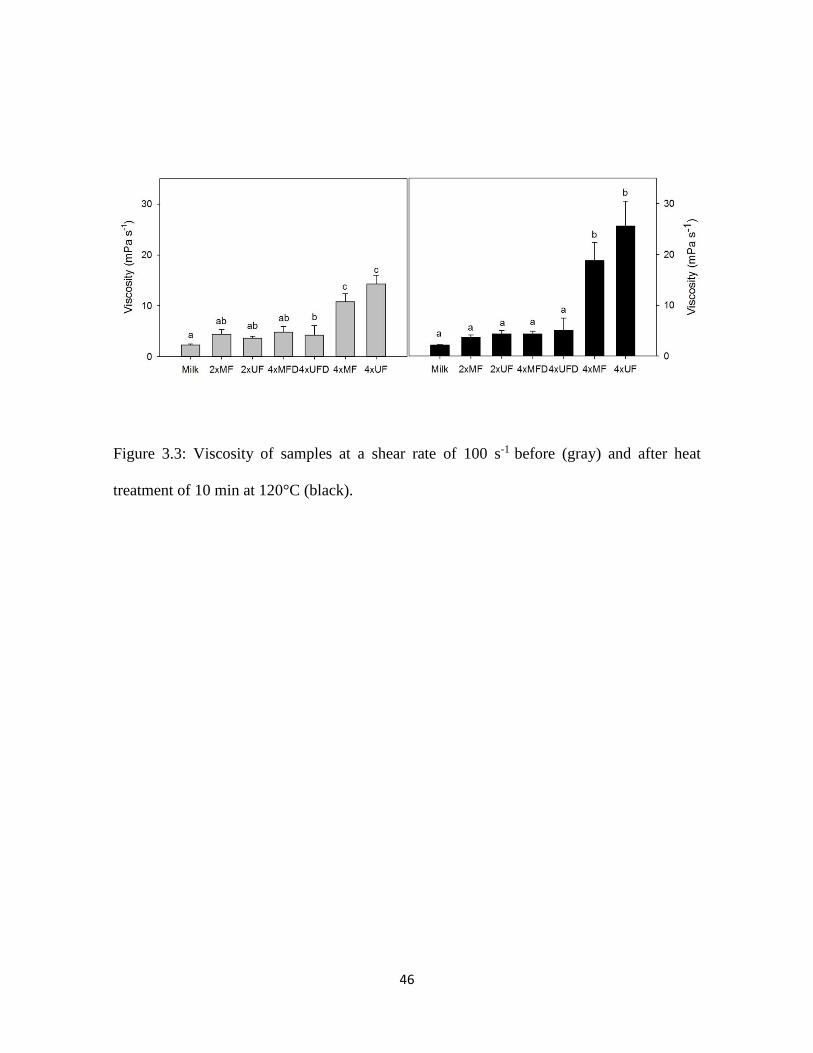
46
Figure 3.3: Viscosity of samples at a shear rate of 100 s-1 before (gray) and after heat
treatment of 10 min at 120°C (black).
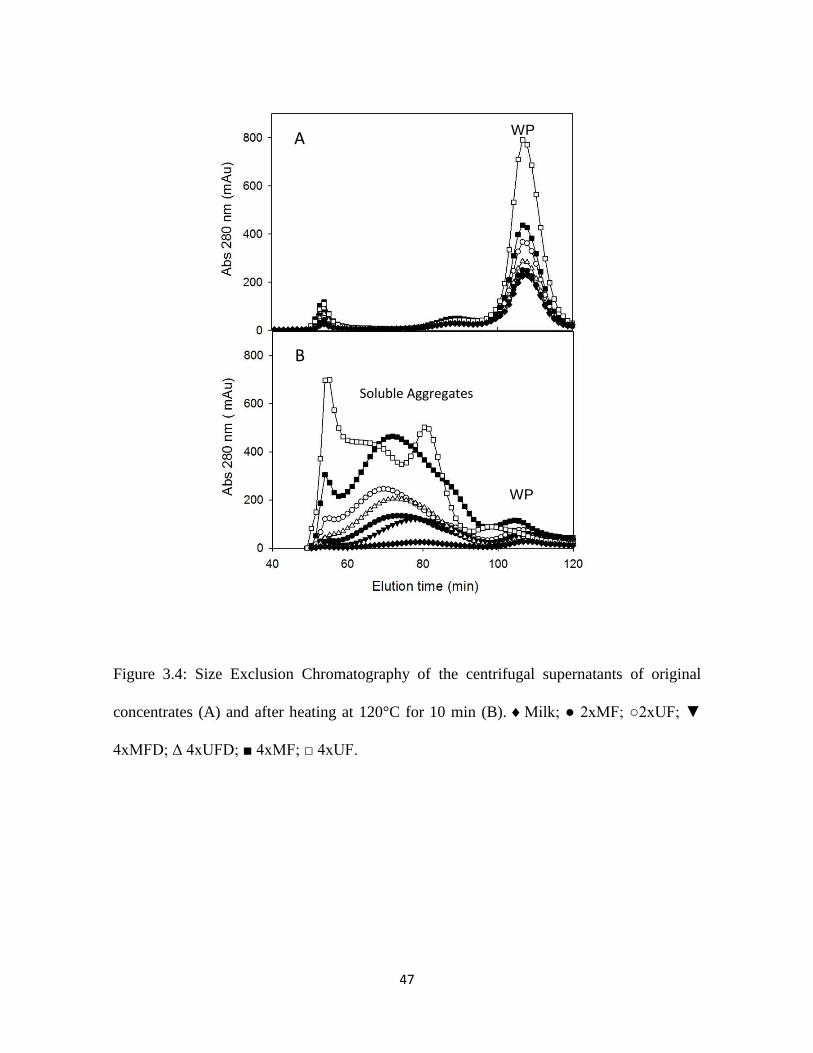
47
Figure 3.4: Size Exclusion Chromatography of the centrifugal supernatants of original
concentrates (A) and after heating at 120°C for 10 min (B). Milk; ● 2xMF; ○2xUF; ▼
4xMFD; Δ 4xUFD; ■ 4xMF; □ 4xUF.
Soluble Aggregates
WP
WP A
B
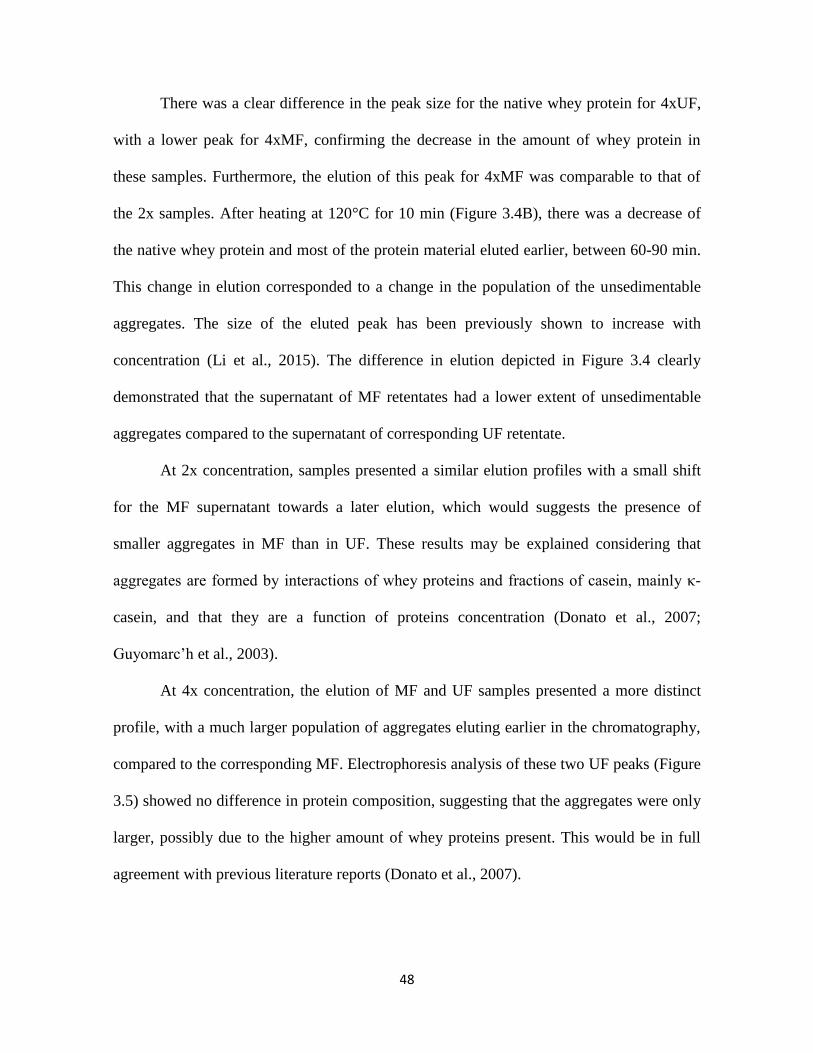
48
There was a clear difference in the peak size for the native whey protein for 4xUF,
with a lower peak for 4xMF, confirming the decrease in the amount of whey protein in
these samples. Furthermore, the elution of this peak for 4xMF was comparable to that of
the 2x samples. After heating at 120°C for 10 min (Figure 3.4B), there was a decrease of
the native whey protein and most of the protein material eluted earlier, between 60-90 min.
This change in elution corresponded to a change in the population of the unsedimentable
aggregates. The size of the eluted peak has been previously shown to increase with
concentration (Li et al., 2015). The difference in elution depicted in Figure 3.4 clearly
demonstrated that the supernatant of MF retentates had a lower extent of unsedimentable
aggregates compared to the supernatant of corresponding UF retentate.
At 2x concentration, samples presented a similar elution profiles with a small shift
for the MF supernatant towards a later elution, which would suggests the presence of
smaller aggregates in MF than in UF. These results may be explained considering that
aggregates are formed by interactions of whey proteins and fractions of casein, mainly κ-
casein, and that they are a function of proteins concentration (Donato et al., 2007;
Guyomarc’h et al., 2003).
At 4x concentration, the elution of MF and UF samples presented a more distinct
profile, with a much larger population of aggregates eluting earlier in the chromatography,
compared to the corresponding MF. Electrophoresis analysis of these two UF peaks (Figure
3.5) showed no difference in protein composition, suggesting that the aggregates were only
larger, possibly due to the higher amount of whey proteins present. This would be in full
agreement with previous literature reports (Donato et al., 2007).
49
Figure 3.5: SDS-PAGE patterns under non-reducing (A) and reducing conditions (B) of
heated samples serum collected from the SEC column from 60 to 90 min. The bands in the
gels are identified as (i) αs-casein; (ii) β-casein; (iii) κ-casein; (iv) β-lactoglobulin; and (v)
α-lactalbumin.
50
With exception of milk, to allow for a straight comparison between samples, the 2x
concentration were loaded to twice the volume compared to fractions isolated from the
elution of 4x supernatants. Hence, darker bands would indicate a higher concentration of
protein present in the eluted fraction. The fractions analyzed from the elution of 4x
supernatants presented more intense bands than those from the 2x supernatants, indicating
the presence of higher amount of aggregates after heating. By the differences between the
non-reducing and the reducing gels, it is possible to observe that whey proteins are mainly
aggregated with other proteins forming soluble protein complexes. The electrophoretic
analysis under reducing conditions clearly revealed that the whey proteins formed
complexes with κ-casein and α-casein.
3.5. Conclusions
Microfiltered and ultrafiltered retentates did not have the same heat stability
behavior nor similar physical and chemical characteristics after heat treatment at 120 °C for
10 min. The fresh retentates analyzed showed good heat stability, and heat coagulation > 30
min. The results demonstrate that it is possible to modulate the heat stability of concentrates
by carefully controlling the composition of the soluble phase during membrane filtration.
All samples showed comparable pH values and soluble calcium and phosphate
concentrations. The results show for the first time that it is not necessary to fully deplete
milk concentrates of whey proteins to maintain high heat stability, although the amount of
whey protein present will affect the composition of the soluble aggregates, and,
importantly, retain the nutritional value of the whey proteins.
51
CHAPTER 4
A comparison of the heat stability of fresh milk protein concentrates obtained by
microfiltration, ultrafiltration and diafiltration
4.1. Abstract
Dairy proteins have been largely used to produce high protein drinks and stability to
heat treatment is one of the challenges to obtain long-term shelf life. The objective of this
work was to evaluate the impact of different technological changes, such as concentration,
whey protein removal and ionic strength, on the heat stability and heat-induced changes of
different concentrates obtained by filtration. Pasteurized milk was 3x concentrated by
ultrafiltration or microfiltration, with additional microfiltration with water or permeate from
ultrafiltration (diafiltration). Diafiltration with water impacted pH, total solids, whey
protein concentration and total and soluble calcium and phosphate. These changes did not
affect the apparent diameter of the casein micelles, and had a positive effect on heat
coagulation time (HCT), which was significantly longer (50 min) in the DF sample,
compared to the other concentrates (about 30 min). UHT treatments increased the particle
size as well as the turbidity of retentates. A further analysis of the protein composition of
the unsedimentable fraction confirmed the difference between diafiltration with permeate
and with water, highlighting the importance of soluble protein composition on the
processing functionality of milk concentrates.
52
4.2. Introduction
Dairy ingredients, such as milk protein concentrates and isolates and micellar casein
concentrates and isolates, are frequently used to achieve the desired nutritional and
functional characteristics in high protein beverages, currently in high demand in the
marketplace (Agarwal et al., 2015; de Kort et al., 2011; Farkye & ur-Rehman, 2011). To
obtain these ingredients, different membrane filtration technologies may be used to
concentrate milk before spray drying, and depending on processing conditions, the protein
concentration and the composition of the soluble phase can be modulated.
When ultrafiltration (UF) is used, all the major proteins are concentrated in the
retentate, while, if larger pore sizes are used, with microfiltration (MF), it is possible to
selectively concentrate caseins while transmitting whey proteins in the permeate. The
retentate fraction obtained by microfiltration is referred to as micellar casein concentrate.
During this type of filtration, the amount of whey proteins present can be further decreased
if diafiltration (DF) is used. This process consists of dilution of retentate with water to
continue the selective removal of soluble molecules such as lactose, salts and whey
proteins, in the case of MF. Depending on the extent of DF applied it is possible to achieve
up to 95% of whey protein removal (Nelson & Barbano, 2005).
During extensive DF, in addition to the changes in the concentration ratio between
colloidal and soluble fractions, the extensive removal of soluble calcium may affect the
integrity of the casein micelles' supramolecular structure (Li & Corredig, 2014). Indeed,
minerals play an important role in the structure and stability of the casein micelles,
especially calcium and phosphate, with consequences on the processing functionality of the
53
concentrates (Gaucheron, 2005). Calcium, inorganic phosphate and other minerals are
distributed between the serum phase (soluble) and the colloidal phase (casein micelle)
depending on pH, temperature and protein concentration, among other factors (Lucey &
Horne, 2009). In milk protein beverages, the supramolecular structure of the caseins may be
very important to their heat stability. In these products, the extended shelf-life is achieved
by intense heat treatments such as ultra-high temperature (UHT) or retorting.
Heat stability of milk protein concentrates is a challenge considering the inverse
relationship between heat stability and protein concentration in milk systems (Singh, 2004).
The interactions between whey proteins and caseins have been widely studied in skim milk.
When heated, whey proteins are denatured and interact with themselves or associate with
casein micelles, and form complexes mostly with κ-casein and s2 casein. Protein protein
interactions are affected by time, temperature, rate of heating, pH, and protein
concentration (Anema, 2009; Donato & Dalgleish, 2006; Donato & Guyomarc’h, 2009; Li
et al., 2015). Because of their sensitivity to heat, removal of whey proteins has been
proposed as a way to obtain beverages with superior heat stability.
Micellar casein concentrates and isolates have been suggested as an ideal ingredient
for the development of dairy beverages (Agarwal et al., 2015). Studies have been conducted
on the stability of micellar casein concentrates at different pH values, variable calcium
concentration and distribution, and the presence of chelators (Beliciu et al., 2012; de Kort et
al., 2012; Sauer & Moraru, 2012). These studies report poor heat stability of high protein
solutions after simple redilution, and extra steps such as pH adjustment and addition of
calcium chelators are necessary to achieve longer heat coagulation times and to avoid
precipitation and coagulation during the commercial life of the product (Beliciu et al.,
54
2012; de Kort et al., 2012; Sauer & Moraru, 2012). However, these results are based on
studies on reconstituted powder dispersions, with a mineral balance substantially different
than that of the original milk.
As most of the research reported on the heat stability of milk concentrates has been
conducted on reconstituted suspensions, the results may not apply to fresh retentates. In
other words, the processing history of the retentates may be critical to their stability. In fact,
results reported in Chapter 3 showed that under particular processing conditions, fresh
retentates obtained by UF or MF were heat stable at pH 6.7, up to 4x concentration. It was
concluded that the removal of whey proteins increased the heat stability, as, at the same
concentration factor and under comparable serum composition, MF concentrates showed a
longer heat coagulation time than the corresponding UF concentrates. Due to differences in
the processing history, it was hypothesized that the discrepancies between these results and
prior literature reports may be caused by the use of diafiltration, drying and reconstitution
of the concentrates. These steps may lead to a change in calcium equilibrium, causing a
decrease in the heat stability of the concentrates. Nonetheless, the differences in processing
history make comparison of research findings quite a challenge.
The objective of this research was to study the impact of diafiltration and whey
protein removal on heat stability of fresh concentrates obtained using membrane filtration.
Concentrates were obtained using UF, MF and DF, and compared at the same protein
concentration. Concentrates were diafiltered using water or permeate from UF, to evaluate
the effect of diafiltration with or without control of the composition of the serum phase.
This work will improve the current understanding of which are the critical factors affecting
the processing functionality of fresh protein concentrates.
55
4.3. Material and Methods
4.3.1. Sample preparation
Pasteurized skim milk (Sealtest/Agropur supplied by Crown Dairy Ltd., Guelph,
Canada) was three times concentrated by microfiltration (MF) or ultrafiltration (UF) based
on volume, by measuring the amount of permeate. A custom made pilot scale spiral-wound
system was used with a PVDF 800 kDa cutoff membrane for the microfiltration (Synder®
Filtration, Vacaville, CA, USA) and a polyethersulfone (PES) with 10 kDa cutoff for the
ultrafiltration (Koch, San Diego, CA, USA). Two other treatments were evaluated, were
diafiltration was carried out either with water or permeate from ultrafiltration. In this case,
to the 3x MF retentates water or permeate was added back to the original volume, and then
microfiltration was continued up to 3x concentration.
In total 4 treatments were analyzed: 1) ultrafiltered retentate (UF); 2) microfiltered
retentate (MF); 3) MF diafiltered with UF permeate (PF); and 4) MF diafiltered with water
(DF). All treatments reached a 3x volume reduction (based on original volume).
4.3.2. Heat treatment
Thermal stability was evaluated by measuring the heat coagulation time (HCT),
defined as the time during heating at 120°C necessary for visible onset coagulation to
occur. The system used was a silicone oil bath (Haake AC200 - ThermoFisher Scientific,
Newington, NH) fitted with a custom made circulation device. Aliquots (3 mL) were
transferred to a heat-resistant screw-cap test tube and immersed in the oil bath at 120°C
(Eshpari et al., 2014). The samples were kept under agitation and the elapsed time between
the immersion and the first visible precipitation was recorded as the HCT.
56
The same system was used to heat treat the samples at 120°C for 10 min for further
evaluation of the impact of heat treatment on these retentates. The samples were
immediately cooled to room temperature by immersion in an ice bath. Samples were also
submitted to a commercial heat treatment of ultra-high temperature (UHT) with pre-heating
at 82°C, final temperature of 136°C and holding time of 6 s (MicroThermics, Raleigh, NC,
USA), followed by homogenization at 3,450 kPa before cooling to 4°C.
4.3.3. Sample characterization
Total solids were measured by drying approximately 2 g of sample in an aluminum
dish with pre-dried sand. The samples were dried at 105°C in a gravity-flow convection
oven (Fisher Scientific, Pittsburgh, PA) overnight. The pH of the retentates was measured
at 25°C, under agitation, using an Accumet pH meter (Fisher Scientific, Pittsburgh, PA),
calibrated before use. Total and soluble protein concentration was measured by Dumas
method Leco FP-528 (Leco Corp., St. Joseph, MI, USA) and a conversion factor of 6.38
was used to convert the nitrogen concentration into protein. The soluble fraction was
obtained by ultracentrifugation (100000xg for 1h at 20°C). The whey proteins were
measured by HPLC (Thermo Instruments Canada Inc., Mississauga, ON, Canada) as
described in section 3.3.3.
4.3.4. Viscosity
Viscosity was measured using a controlled stress rheometer (Paar Physica MC 301,
Anton Paar, Graz, Austria) using cone and plate geometry, with a set gap of 0.51 mm, and
at 25°C. The milk retentates samples were subjected to a shear sweep test from 10 to 300 s-
1 and values at 100 s-1 were reported.
57
4.3.5. Light scattering
Particle size distribution was determined by dynamic light scattering (Zetasizer
Nano-ZS, Malvern Instruments, Worcestershire, UK). The samples were diluted to the ratio
1μL sample: 1mL of filtered permeate from ultrafiltration (0.22μm PVDF filters, Fisher
Scientific) and analyzed at 25°C in a backscatter measurement angle of 173°.
Transmission diffusing wave spectroscopy (DWS) was used to measure the
characteristics of casein micelles in situ, without dilution. The equipment and the
parameters used are the same as described in section 3.3.5. DWS was used to measure the
photon transport mean free path (l*), which is defined as the length scale over which the
scattered light has been totally randomized. l* parameter can be related to turbidity (1/l*) in
highly turbid samples and depends on as particle size, particle concentration, and the
dispersion medium (Alexander et al., 2006).
4.3.6. Total, soluble and diffusible calcium and phosphate
The clear supernatant after precipitation with HCl and centrifugation for 15 min at
4,500×g (Eppendorf centrifuge, Brinkmann Instruments Ltd., Mississauga, ON, Canada)
was used for analysis of total calcium. Soluble fractions were analyzed from the
supernatants after centrifugation at 100,000xg for 1 h at 20°C. Diffusible phase was
obtained after ultrafiltration of soluble phases in concentrators with molecular weight cutoff
of 10 kDa (Corning® Spin-X® UF), at 5,000xg for 30 min and used for both calcium and
phosphate analysis. Ashes of original samples and soluble phase were solubilized with
nitric acid and diluted in water for total and soluble phosphate analysis.
58
An Advanced Compact Ion chromatography (Ω Metrohm ion analysis, Metrohm
Ltd., Herisau, Switzerland) was used to measure calcium and phosphate according to Zhao
& Corredig (2015) and described in section 3.3.6.
4.3.7. Characterization of soluble protein aggregates
Soluble protein aggregates were characterized by Size Exclusion Chromatography
(SEC) using ÄKTA purifier 10 system (GE Healthcare, Uppsala, Sweden) as previously
described (Li et al., 2015). In brief, 10 mL fractions were collected from the elution peaks,
for further analysis of the differences in the type and composition of the soluble aggregates
through electrophoresis. The fractions were freeze-dried and then diluted in 1 mL sample
buffer without β-mercaptoethanol. The electrophoresis analysis of selected peaks was
conducted under reducing (with β-mercaptoethanol) and non-reducing conditions. SDS-
PAGE was performed using a Bio-Rad electrophoresis unit (Bio-Rad Power Pac HC,
Mississauga, ON, Canada) as described in section 3.3.7. Aliquots of 5 μL of 1% (w/w)
standard solutions (sodium caseinate and WPI 85) were loaded onto the gels. For the SEC
peaks, 10 μL of samples were loaded on the gel.
4.3.8. Statistical analysis
The experiments were carried out in triplicate (i.e. three separate milk batches).
Statistical significances were evaluated using analysis of variance (ANOVA) at p˂0.05 and
T-test. The mean values were compared using Tukey test, with all data processed using
Statistica 12 software.
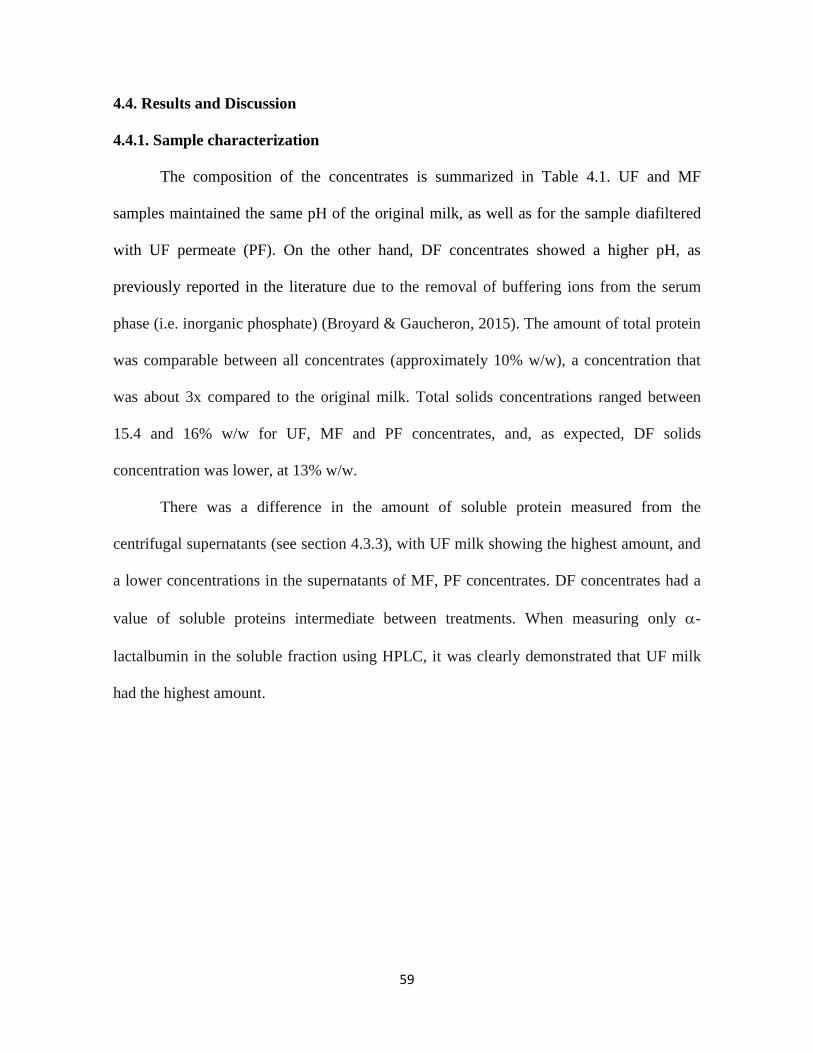
59
4.4. Results and Discussion
4.4.1. Sample characterization
The composition of the concentrates is summarized in Table 4.1. UF and MF
samples maintained the same pH of the original milk, as well as for the sample diafiltered
with UF permeate (PF). On the other hand, DF concentrates showed a higher pH, as
previously reported in the literature due to the removal of buffering ions from the serum
phase (i.e. inorganic phosphate) (Broyard & Gaucheron, 2015). The amount of total protein
was comparable between all concentrates (approximately 10% w/w), a concentration that
was about 3x compared to the original milk. Total solids concentrations ranged between
15.4 and 16% w/w for UF, MF and PF concentrates, and, as expected, DF solids
concentration was lower, at 13% w/w.
There was a difference in the amount of soluble protein measured from the
centrifugal supernatants (see section 4.3.3), with UF milk showing the highest amount, and
a lower concentrations in the supernatants of MF, PF concentrates. DF concentrates had a
value of soluble proteins intermediate between treatments. When measuring only -
lactalbumin in the soluble fraction using HPLC, it was clearly demonstrated that UF milk
had the highest amount.
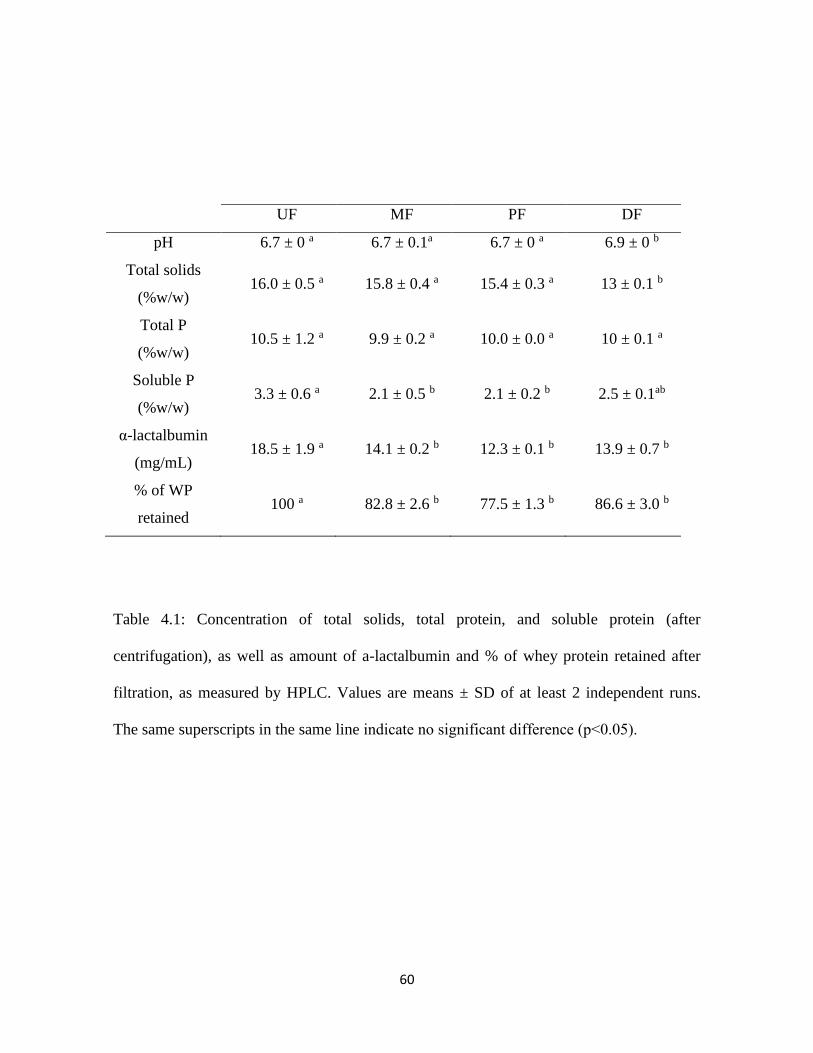
60
UF MF PF DF
pH 6.7 ± 0 a 6.7 ± 0.1a 6.7 ± 0 a 6.9 ± 0 b
Total solids
(%w/w) 16.0 ± 0.5 a 15.8 ± 0.4 a 15.4 ± 0.3 a 13 ± 0.1 b
Total P
(%w/w) 10.5 ± 1.2 a 9.9 ± 0.2 a 10.0 ± 0.0 a 10 ± 0.1 a
Soluble P
(%w/w) 3.3 ± 0.6 a 2.1 ± 0.5 b 2.1 ± 0.2 b 2.5 ± 0.1ab
α-lactalbumin
(mg/mL) 18.5 ± 1.9 a 14.1 ± 0.2 b 12.3 ± 0.1 b 13.9 ± 0.7 b
% of WP
retained 100 a 82.8 ± 2.6 b 77.5 ± 1.3 b 86.6 ± 3.0 b
Table 4.1: Concentration of total solids, total protein, and soluble protein (after
centrifugation), as well as amount of a-lactalbumin and % of whey protein retained after
filtration, as measured by HPLC. Values are means ± SD of at least 2 independent runs.
The same superscripts in the same line indicate no significant difference (p˂0.05).
61
All the MF treatments (with or without diafiltration) had lower levels of -
lactalbumin compared to UF concentrates. There was no significant difference between MF
and diafiltration, showing that under these conditions, there was no further removal of
whey proteins in the samples, during diafiltration. Approximately 20% of the original whey
proteins were removed with MF filtration, with or without diafiltration (Table 4.1). This
reduction for MF was similar to that reported in Chapter 3 at 2x concentration. The
discrepancy was attributed to the different filtration technology and membrane porosity
used in this study.
Figure 4.1 illustrates the electrophoretic pattern of the supernatant samples from the
four concentrates, analyzed under non-reducing and reducing conditions. As the same
volume of sample was loaded for all treatments (see methods), a straight comparison can be
made in terms of bands intensity. All samples showed a predominant presence of whey
proteins, with only little presence of soluble caseins. There were differences in the casein
patterns between UF and MF concentrates. In both cases, there was a clear presence of β-
casein, but more caseins were present in the supernatant of UF concentrate, especially when
run under reducing conditions. Furthermore, there seemed to be less soluble caseins in DF
concentrates, compared to PF or MF concentrates.
Calcium and phosphate play a major role in supramolecular structure changes of
casein micelles and are critical to the heat stability of milk (Lucey & Horne, 2009; Singh,
2004). The concentration of total, soluble and diffusible (non-associated with proteins)
calcium and inorganic phosphate for the various fresh retentates is summarized in Table
4.2.
62
Figure 4.1: SDS-PAGE patterns under non-reducing (A) and reducing conditions (B) of the
centrifugal supernatants of fresh ultrafiltered (UF), microfiltered (MF) concentrates, as well
as microfiltered concentrates diafiltered with permeate (PF) or water (DF). The bands in
the gels are identified as (i) αs-casein; (ii) β-casein; (iii) κ-casein; (iv) β-lactoglobulin; and
(v) α-lactalbumin.
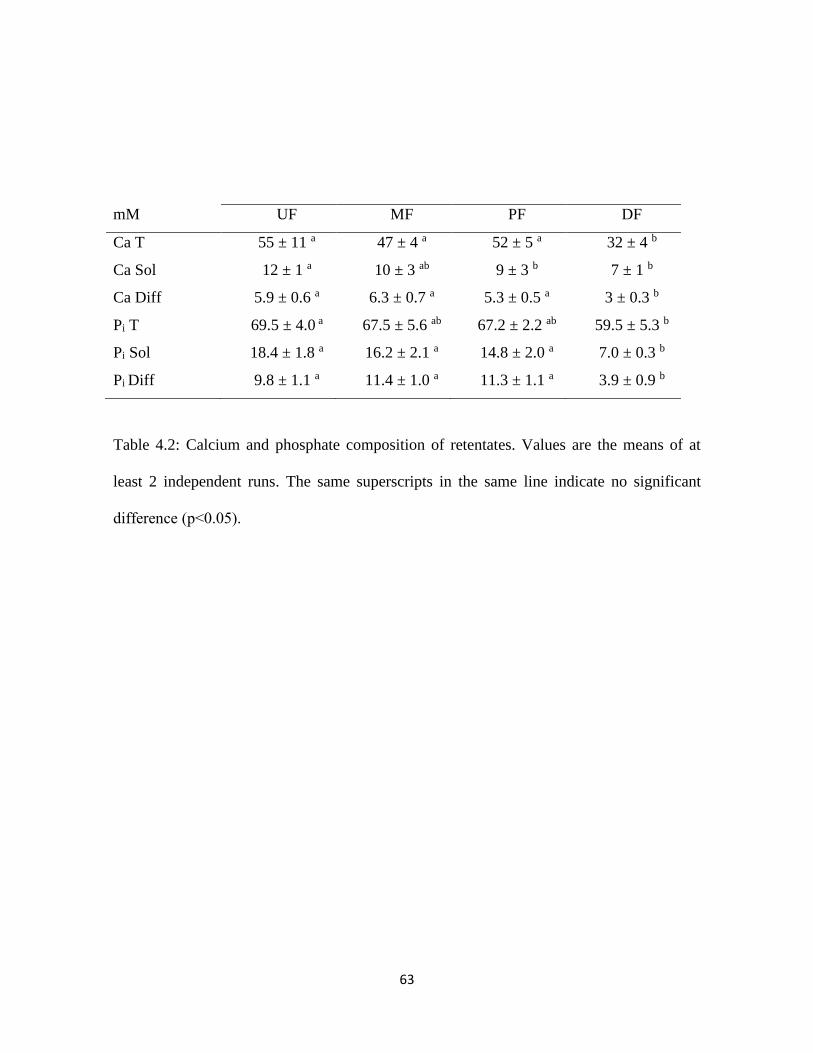
63
mM UF MF PF DF
Ca T 55 ± 11 a 47 ± 4 a 52 ± 5 a 32 ± 4 b
Ca Sol 12 ± 1 a 10 ± 3 ab 9 ± 3 b 7 ± 1 b
Ca Diff 5.9 ± 0.6 a 6.3 ± 0.7 a 5.3 ± 0.5 a 3 ± 0.3 b
Pi T 69.5 ± 4.0 a 67.5 ± 5.6 ab 67.2 ± 2.2 ab 59.5 ± 5.3 b
Pi Sol 18.4 ± 1.8 a 16.2 ± 2.1 a 14.8 ± 2.0 a 7.0 ± 0.3 b
Pi Diff 9.8 ± 1.1 a 11.4 ± 1.0 a 11.3 ± 1.1 a 3.9 ± 0.9 b
Table 4.2: Calcium and phosphate composition of retentates. Values are the means of at
least 2 independent runs. The same superscripts in the same line indicate no significant
difference (p˂0.05).
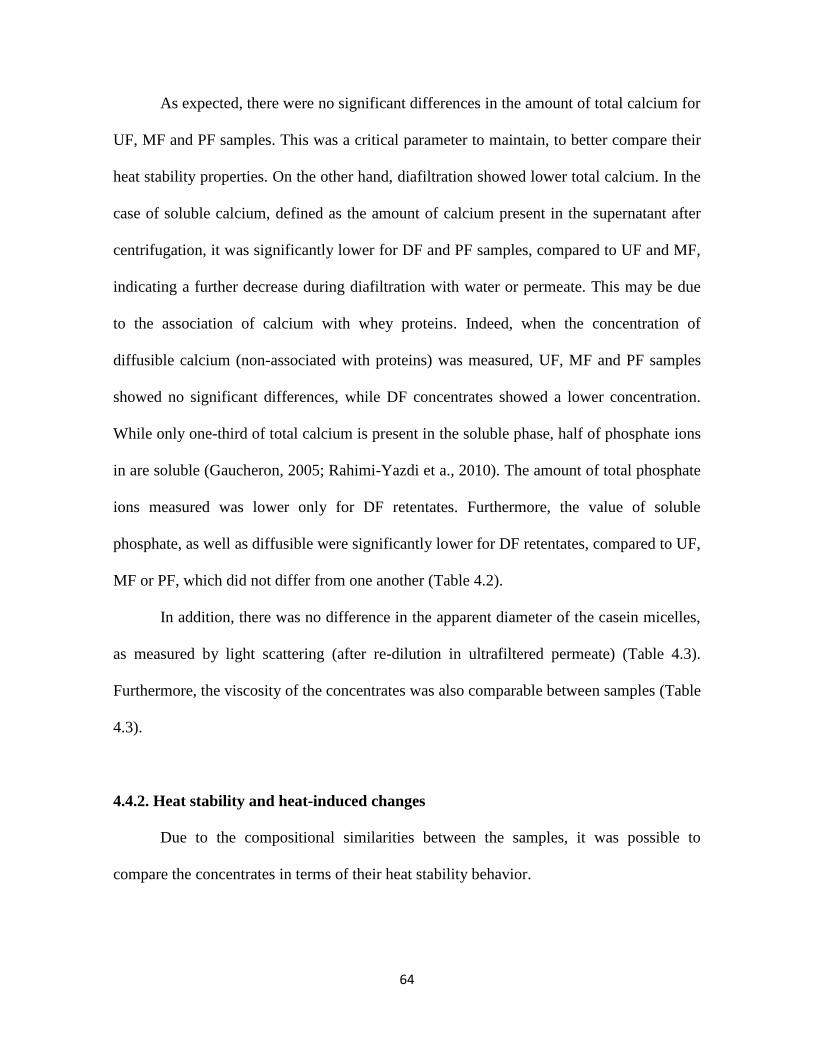
64
As expected, there were no significant differences in the amount of total calcium for
UF, MF and PF samples. This was a critical parameter to maintain, to better compare their
heat stability properties. On the other hand, diafiltration showed lower total calcium. In the
case of soluble calcium, defined as the amount of calcium present in the supernatant after
centrifugation, it was significantly lower for DF and PF samples, compared to UF and MF,
indicating a further decrease during diafiltration with water or permeate. This may be due
to the association of calcium with whey proteins. Indeed, when the concentration of
diffusible calcium (non-associated with proteins) was measured, UF, MF and PF samples
showed no significant differences, while DF concentrates showed a lower concentration.
While only one-third of total calcium is present in the soluble phase, half of phosphate ions
in are soluble (Gaucheron, 2005; Rahimi-Yazdi et a., 2010). The amount of total phosphate
ions measured was lower only for DF retentates. Furthermore, the value of soluble
phosphate, as well as diffusible were significantly lower for DF retentates, compared to UF,
MF or PF, which did not differ from one another (Table 4.2).
In addition, there was no difference in the apparent diameter of the casein micelles,
as measured by light scattering (after re-dilution in ultrafiltered permeate) (Table 4.3).
Furthermore, the viscosity of the concentrates was also comparable between samples (Table
4.3).
4.4.2. Heat stability and heat-induced changes
Due to the compositional similarities between the samples, it was possible to
compare the concentrates in terms of their heat stability behavior.
65
UF MF PF DF
Diameter (nm) 169 ± 5 a 168 ± 5 a 166 ± 3 a 165 ± 2 a
Viscosity (mPa s-1) 9.0 ± 2.0 a 8.0 ± 0.9 a 6.0 ± 1.4 a 8.0 ± 0.6 a
Table 4.3: Casein size, turbidity and viscosity (mean±SD) of retentates. Values are the
means of at least 2 independent runs. The same superscripts in the same line indicate no
significant difference (p˂0.05).
66
The results of the heat coagulation time, as measured by heating the concentrates in
an oil bath at 120°C are presented in Table 4.4. There was no significant difference
between UF, MF and PF samples. All treatments showed a HCT around 30 min. On the
other hand, the fresh DF concentrate showed a significantly longer HCT, with values close
to 50 min. There was a significant difference in the HCT between PF and DF, indicating
that the use of permeate for further filtration created a different ionic environment causing
the proteins to maintain a processing functionality similar to that of the original sample.
Furthermore, the removal of whey proteins, under these conditions, did not seem to be
sufficient to improve the HCT of the concentrates. The higher HCT of DF sample
suggested that other factors play an important role in heat stability. Firstly, the pH of DF
sample was 6.9 instead of 6.7, and it has been shown that pH plays an important role in
milk stability (Singh, 2004). In addition, although all the concentrates presented similar
total protein, the amount of total solids was lower in DF retentates. Finally, it was shown
that there was a lower amount of soluble calcium and phosphate ions compared to the other
treatments. All these factors would play a role in the heat stability of the concentrates.
Comparison with literature data was a challenge, as previous works, for the main
part, employed reconstituted concentrates and isolates, and not fresh retentates. Spray
drying causes other major changes to milk proteins such as loss of solubility and stability
(Beliciu et al., 2012; Eshpari et al., 2014) and simple solubilization in water may not be
sufficient to recover the original structure of casein (Eshpari et al., 2014). Furthermore, it
has been shown that an increase in pH and addition of phosphate can improve solubilization
and heat stability of milk powders (de Kort et al., 2012; Eshpari et al., 2014; Sauer &
Moraru, 2012).
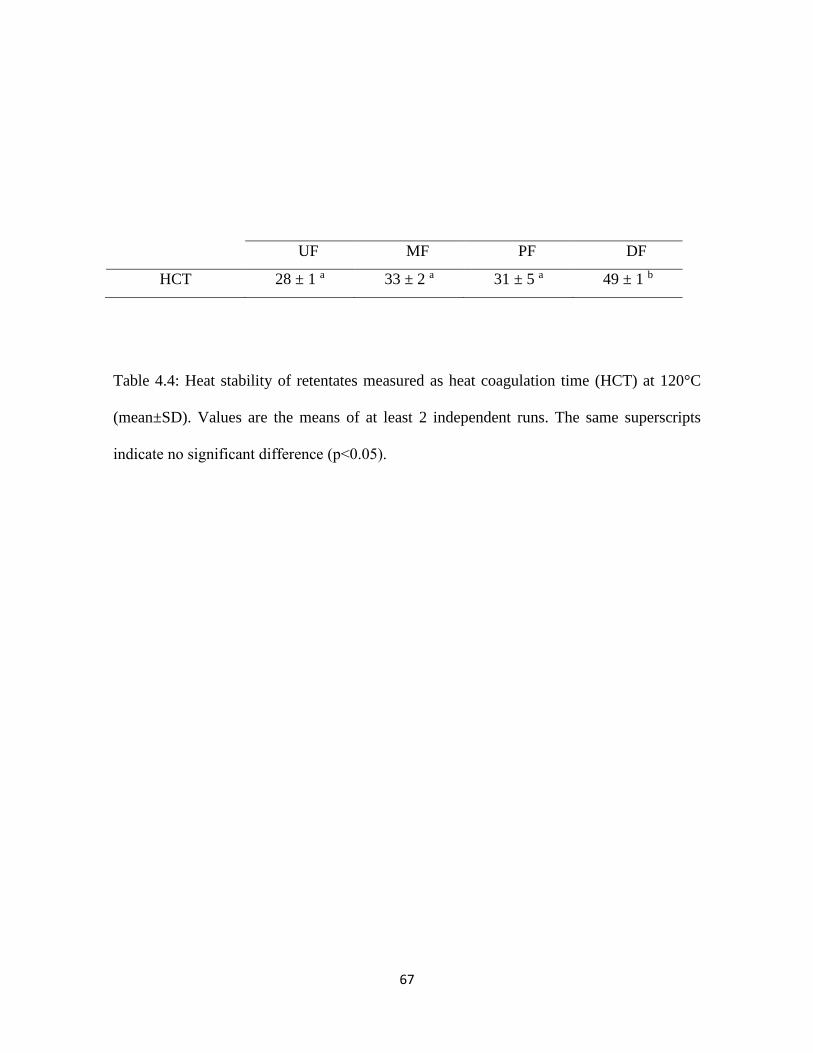
67
UF MF PF DF
HCT 28 ± 1 a 33 ± 2 a 31 ± 5 a 49 ± 1 b
Table 4.4: Heat stability of retentates measured as heat coagulation time (HCT) at 120°C
(mean±SD). Values are the means of at least 2 independent runs. The same superscripts
indicate no significant difference (p˂0.05).
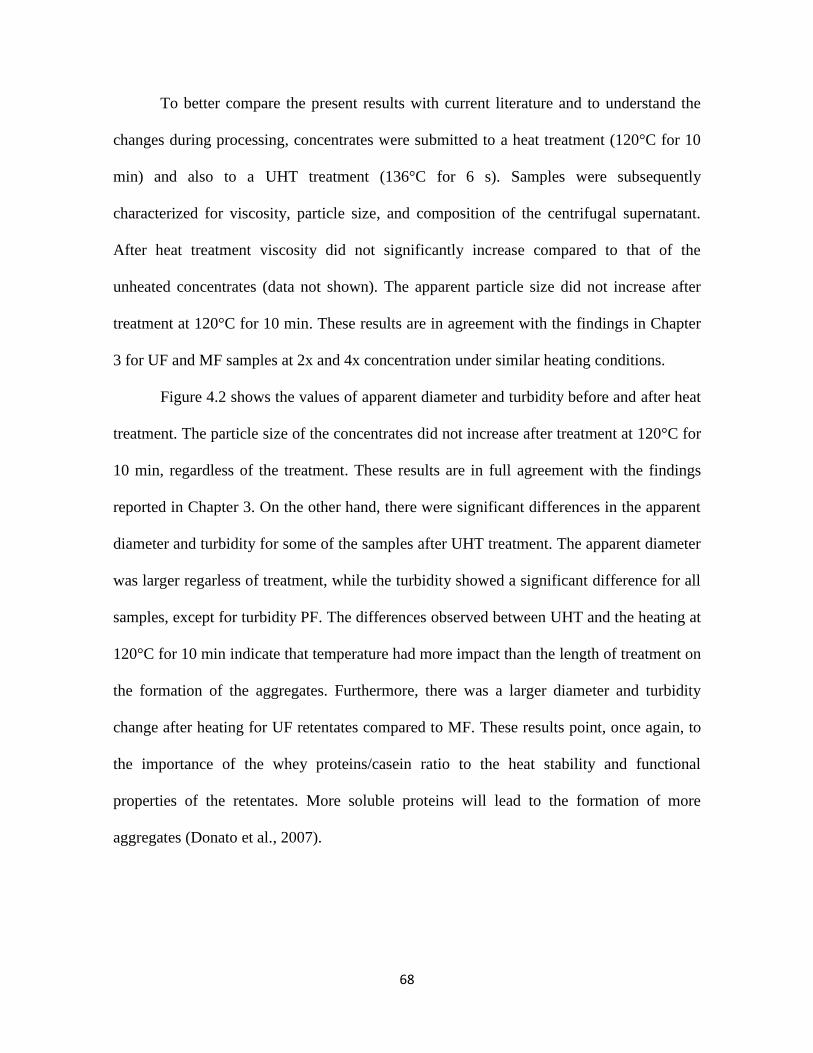
68
To better compare the present results with current literature and to understand the
changes during processing, concentrates were submitted to a heat treatment (120°C for 10
min) and also to a UHT treatment (136°C for 6 s). Samples were subsequently
characterized for viscosity, particle size, and composition of the centrifugal supernatant.
After heat treatment viscosity did not significantly increase compared to that of the
unheated concentrates (data not shown). The apparent particle size did not increase after
treatment at 120°C for 10 min. These results are in agreement with the findings in Chapter
3 for UF and MF samples at 2x and 4x concentration under similar heating conditions.
Figure 4.2 shows the values of apparent diameter and turbidity before and after heat
treatment. The particle size of the concentrates did not increase after treatment at 120°C for
10 min, regardless of the treatment. These results are in full agreement with the findings
reported in Chapter 3. On the other hand, there were significant differences in the apparent
diameter and turbidity for some of the samples after UHT treatment. The apparent diameter
was larger regarless of treatment, while the turbidity showed a significant difference for all
samples, except for turbidity PF. The differences observed between UHT and the heating at
120°C for 10 min indicate that temperature had more impact than the length of treatment on
the formation of the aggregates. Furthermore, there was a larger diameter and turbidity
change after heating for UF retentates compared to MF. These results point, once again, to
the importance of the whey proteins/casein ratio to the heat stability and functional
properties of the retentates. More soluble proteins will lead to the formation of more
aggregates (Donato et al., 2007).
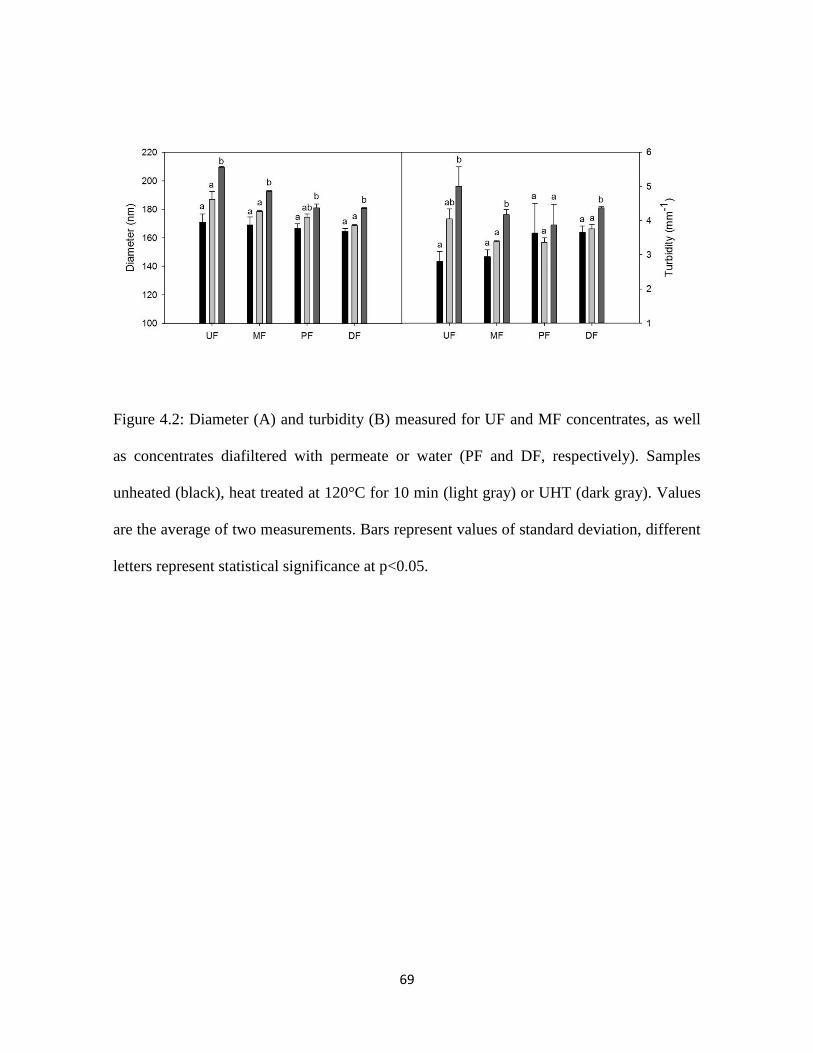
69
Figure 4.2: Diameter (A) and turbidity (B) measured for UF and MF concentrates, as well
as concentrates diafiltered with permeate or water (PF and DF, respectively). Samples
unheated (black), heat treated at 120°C for 10 min (light gray) or UHT (dark gray). Values
are the average of two measurements. Bars represent values of standard deviation, different
letters represent statistical significance at p<0.05.
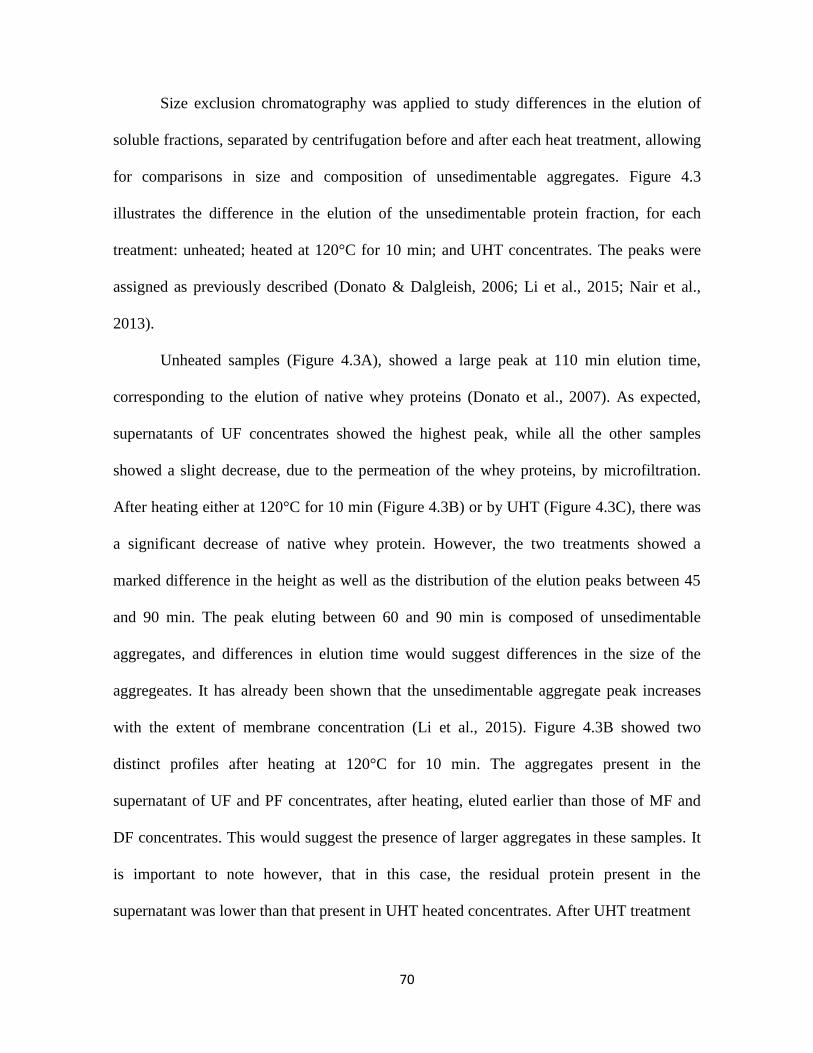
70
Size exclusion chromatography was applied to study differences in the elution of
soluble fractions, separated by centrifugation before and after each heat treatment, allowing
for comparisons in size and composition of unsedimentable aggregates. Figure 4.3
illustrates the difference in the elution of the unsedimentable protein fraction, for each
treatment: unheated; heated at 120°C for 10 min; and UHT concentrates. The peaks were
assigned as previously described (Donato & Dalgleish, 2006; Li et al., 2015; Nair et al.,
2013).
Unheated samples (Figure 4.3A), showed a large peak at 110 min elution time,
corresponding to the elution of native whey proteins (Donato et al., 2007). As expected,
supernatants of UF concentrates showed the highest peak, while all the other samples
showed a slight decrease, due to the permeation of the whey proteins, by microfiltration.
After heating either at 120°C for 10 min (Figure 4.3B) or by UHT (Figure 4.3C), there was
a significant decrease of native whey protein. However, the two treatments showed a
marked difference in the height as well as the distribution of the elution peaks between 45
and 90 min. The peak eluting between 60 and 90 min is composed of unsedimentable
aggregates, and differences in elution time would suggest differences in the size of the
aggregeates. It has already been shown that the unsedimentable aggregate peak increases
with the extent of membrane concentration (Li et al., 2015). Figure 4.3B showed two
distinct profiles after heating at 120°C for 10 min. The aggregates present in the
supernatant of UF and PF concentrates, after heating, eluted earlier than those of MF and
DF concentrates. This would suggest the presence of larger aggregates in these samples. It
is important to note however, that in this case, the residual protein present in the
supernatant was lower than that present in UHT heated concentrates. After UHT treatment
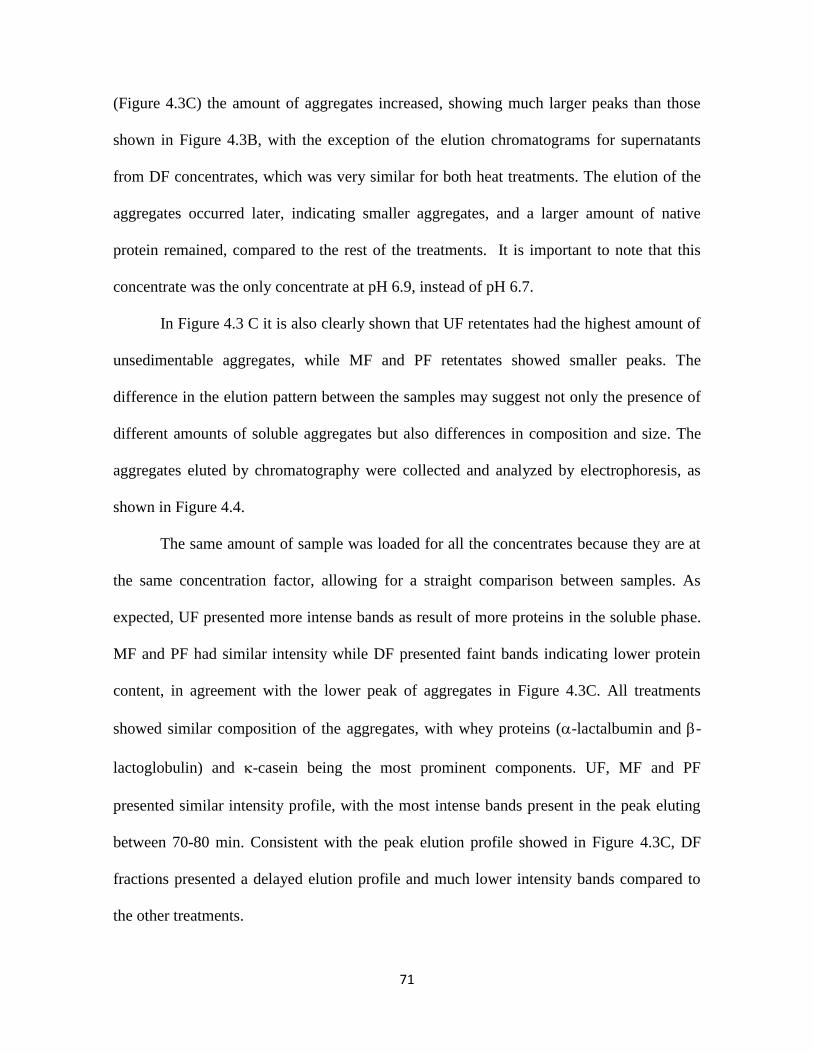
71
(Figure 4.3C) the amount of aggregates increased, showing much larger peaks than those
shown in Figure 4.3B, with the exception of the elution chromatograms for supernatants
from DF concentrates, which was very similar for both heat treatments. The elution of the
aggregates occurred later, indicating smaller aggregates, and a larger amount of native
protein remained, compared to the rest of the treatments. It is important to note that this
concentrate was the only concentrate at pH 6.9, instead of pH 6.7.
In Figure 4.3 C it is also clearly shown that UF retentates had the highest amount of
unsedimentable aggregates, while MF and PF retentates showed smaller peaks. The
difference in the elution pattern between the samples may suggest not only the presence of
different amounts of soluble aggregates but also differences in composition and size. The
aggregates eluted by chromatography were collected and analyzed by electrophoresis, as
shown in Figure 4.4.
The same amount of sample was loaded for all the concentrates because they are at
the same concentration factor, allowing for a straight comparison between samples. As
expected, UF presented more intense bands as result of more proteins in the soluble phase.
MF and PF had similar intensity while DF presented faint bands indicating lower protein
content, in agreement with the lower peak of aggregates in Figure 4.3C. All treatments
showed similar composition of the aggregates, with whey proteins (-lactalbumin and -
lactoglobulin) and -casein being the most prominent components. UF, MF and PF
presented similar intensity profile, with the most intense bands present in the peak eluting
between 70-80 min. Consistent with the peak elution profile showed in Figure 4.3C, DF
fractions presented a delayed elution profile and much lower intensity bands compared to
the other treatments.
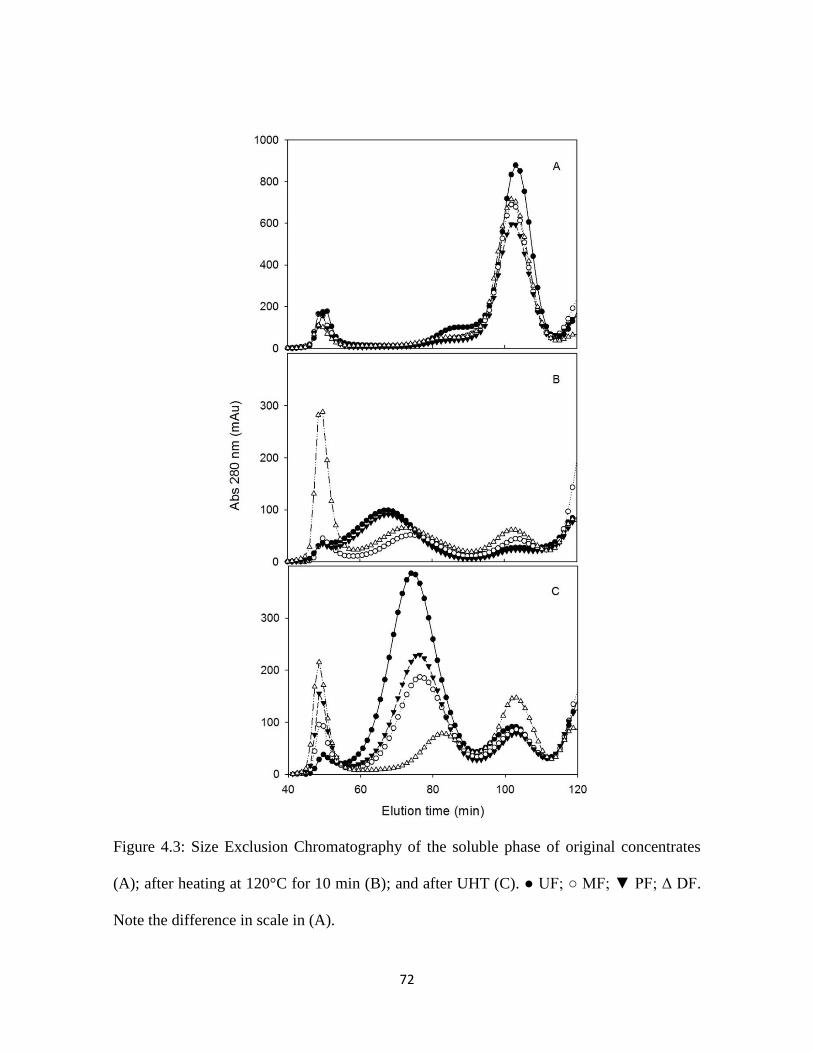
72
Figure 4.3: Size Exclusion Chromatography of the soluble phase of original concentrates
(A); after heating at 120°C for 10 min (B); and after UHT (C). ● UF; ○ MF; ▼ PF; Δ DF.
Note the difference in scale in (A).
73
Figure 4.4: SDS-PAGE patterns under reducing conditions of the serum in UHT treated
samples collected from size exclusion chromatography at elution time ranging from 60-70
min (A), 70-80 min (B) and 80-90 min (C). The bands in the gels are identified as (i) αs-
casein; (ii) β-casein; (iii) κ-casein; (iv) β-lactoglobulin; and (v) α-lactalbumin.
74
α- and β-casein were only presented on the last band of UF and MF samples (80-90
min), indicating their presence in the smaller, soluble aggregates eluting close to the native
whey proteins. The results shown in Figure 4.4 for fractions eluted from the supernatant of
UF concentrates are in agreement with previous reports on UF aggregates after heat
treatment (Li et al., 2015). The characteristics and size of formed aggregates reinforce the
importance of serum composition on concentrates properties and the higher heat stability of
diafiltered sample.
4.5. Conclusions
All fresh milk protein concentrates, regardless of the membrane treatment applied
showed good heat stability, with minimum HCT of 30 min. DF concentrates presented
significantly higher HCT, at approximately 50 min, due to the removal of calcium and
phosphate from the soluble phase, together with the higher pH and lower amount of lactose
In addition, analysis of the heat-induced aggregates showed importance differences in the
behaviour of the concentrates between different heating treatments (120C for 10 min versus
UHT), with differences in the amounts of soluble complexes present, as well as differences
in the composition and size of these soluble aggregates. This study brings novel
understanding of the heat stability of fresh concentrates, and how by modulating the
conditions during membrane filtration it is possible to improve the heat processing
properties of milk concentrates and perhaps their stability over their commercial shelf life.
75
CHAPTER 5
Effect of calcium chelators on heat stability and heat-induced changes of milk
microfiltered concentrates
5.1. Abstract
Milk protein concentrates have been used to produce high protein beverages, and
calcium chelators are often employed to increase their physical stability, when these
products are subjected to extensive heating treatments. In this work, the effect of different
calcium chelators on the heat stability of microfiltered milk protein concentrates was
investigated, by measuring heat coagulation time (HCT) and pH, particle size, turbidity and
viscosity after heat treatment. None of the samples coagulated at 120°C in less than 20 min,
and the highest values for HCT were observed at the original pH, 6.7. An optimum was
obtained when a combination of citrate and phosphate at 15 mEq L-1 was added to the
concentrates. Higher concentration of chelating salts decreased heat stability. The turbidity
of heated concentrates decreased with increasing chelators while viscosity increased. This
is the first study analyzing the effect of chelators on fresh microfiltered retentates, and the
results will aid in a better understanding of the use of these concentrates as ingredients for
the development of new and improved dairy protein drinks.
76
5.2. Introduction
Milk protein concentrates can be used to develop beverages tailored to specific
nutritional functionalities, from simple protein enriched drinks for athletes to beverages for
specific high risk populations or medical purposes (Agarwal et al., 2015; de Kort et al.,
2011; Farkye & ur-Rehman, 2011). These products usually have an extended shelf-life
achieved by intense heat treatments such as ultra-high temperature (UHT) or retorting. For
this reason, heat stability is a critical property of milk concentrates, as the physical and
chemical stability of the proteins is fundamental to obtain a final product with desired
characteristics. Heat stability of milk protein concentrates is a challenge considering the
inverse relationship between heat stability and protein concentration in milk systems
(Singh, 2004).
The Heat Coagulation Time (HCT) parameter is often used as a tool to measure the
heat stability properties of milk or milk concentrates. HCT is defined as the time elapsed
between placing the sample at a certain temperature, often in an oil bath, and the first
visible signs of coagulation. It is known that the HCT decreases with heating temperature
because of whey protein denaturation, formation of soluble aggregates between caseins and
whey proteins, degradation of lactose and formation of organic acids (causing a decrease in
pH), the formation of Maillard complexes between lactose and caseins, and precipitation of
calcium phosphate (Anema, 2009; O’Connell & Fox, 2003).
Protein concentration, pH, ionic composition of the serum phase would be the major
factors affecting the heat stability of milk protein concentrates (Singh, 2004). In addition,
the processing history during membrane concentration will impart changes in the heat
77
induced characteristics, with important consequences to stability. Recent work
demonstrated that with an increase in protein concentration in the milk concentrates, an
increase of soluble proteins, changes in buffering capacity and loss of insoluble calcium
may be noted (Ferrer et al., 2011; Li & Corredig, 2014; Nair et al., 2014).
Some technological solutions have been explored to improve heat stability of milk
concentrates, including removal of whey proteins through membrane filtration or/and the
addition of calcium chelators. Whey proteins are globular soluble proteins representing
about 20% of milk proteins and are known for their poor heat stability, which leads to
denaturation with consequent exposure of a reactive free thiol group (Anema, 2009; Donato
& Guyomarc’h, 2009). At temperatures higher than 65°C, whey proteins start to change
and react among themselves and with caseins forming aggregates that impact milk stability
and may result in age gelation of dairy products. Therefore, the removal of whey proteins
before heat treatment would prevent the formation of aggregates and consequently increase
the shelf life of dairy products.
Calcium and phosphate have an important role in the structure and stability of the
main milk protein, the caseins. These minerals are distributed between serum phase
(soluble) and colloidal phase (casein micelle) and their partition between phases depend on
pH, temperature and protein concentration, among others (Lucey & Horne, 2009). Heat
treatment decreases the solubility of calcium phosphate, inducing the formation of calcium
colloidal phosphate (CCP), and lower concentration of these salts can be observed in the
soluble phase (Gaucheron, 2005; Lucey & Horne, 2009). To avoid these changes that can
affect heat stability of milk, calcium chelators are used to increase the storage life and heat
stability of dairy products and to avoid deposits on heat exchangers (Broyard & Gaucheron,
78
2015). Chelators (e.g., citrate, phosphate, EDTA) bind to polyvalent metal ions causing an
indirect demineralization of casein micelles. The chelation of ionic calcium in the soluble
phase leads to solubilization of colloidal calcium phosphate with some dissociation of
casein micelle depending on the concentration and type of the salt (Broyard & Gaucheron,
2015; Lucey & Horne, 2009; Mizuno & Lucey, 2005). This dispersion can be observed by
a decrease in turbidity and increase in viscosity due to protein solubilization (de Kort et al.,
2011; Mizuno & Lucey, 2005).
The impact of whey proteins removal and the addition of calcium chelators on high
protein solutions have been studied (Beliciu et al., 2012; de Kort et al., 2011; de Kort et al.,
2012; Sauer & Moraru, 2012). These studies reported alterations in colloidal stability,
viscosity and flow behavior after sterilization of micellar casein concentrates (Beliciu et al.,
2012) that can be prevented by increasing the pH (Sauer & Moraru, 2012). Higher pH was
also reported to increase heat stability of micellar casein concentrates by de Kort et al.
(2012), who also demonstrated that calcium chelators increase heat stability to varying
degrees depending on the chelator type and concentration. However, the studies have been
conducted in solutions made from micellar casein concentrates and isolates in which the
mineral balance was changed by diafiltration. Most of these studies also used powders
dispersed in water as the starting material, so the soluble phase of these solutions was no
longer that of the original milk. Furthermore, the equilibrium between the colloidal and the
soluble fraction of calcium and phosphate may change depending on the processing history
of the concentrates, that is to say, the extent of diafiltration, the type of membrane, the
extent of fouling, the pH of the final retentates, etc. Therefore, fresh high protein milk
79
concentrates may not show the same behavior to calcium chelators than what has been
reported for reconstituted concentrates.
The present study focused on the effects of calcium chelators on the heat stability
and heat-induced changes of fresh microfiltered milk concentrates. These concentrates have
minimal mineral changes when diafiltration is not included in the process (see Chapters 3
and 4). The process of spray drying to produce the powders also decreases the stability of
micellar concentrates (Beliciu et al., 2012). In addition, the challenges in solubilization and
reconstitution of the powders, as well as the need for pH adjustment to achieve stable
products, indicate the importance of the soluble phase composition in these products. Whey
proteins add nutritional value, but they also encourage formation of aggregates and increase
viscosity of heated protein concentrates. Therefore, the knowledge of heat stability and
addition of calcium chelators to micellar casein concentrates can differ considerably from
that of a fresh milk concentrate. The present study evaluated the effect of calcium chelators
on heat-induced changes and heat stability of microfiltered retentates at different pH values.
5.3. Material and Methods
5.3.1. Sample preparation
Pasteurized skim milk (Sealtest/Agropur, supplied by Crown Dairy Ltd., Guelph,
Canada) was four times concentrated (based on volume) by microfiltration in a plate and
frame system (PUROSEP LT-2, SmartFlow Technologies, Apex, NC, USA) with a
polysulfone membrane with an 80 kDa molecular cutoff. The pH of the final concentrate
was adjusted to 6.50 ± 0.05, 6.70 ± 0.05, 6.90 ± 0.05, 7.10 ± 0.05 and 7.30 ± 0.05 using 1M
solutions of sodium hydroxide or hydrochloric acid (Fisher Scientific, Fair Lawn, NJ,
80
USA). Sodium phosphate dibasic (Na2HPO4), or trisodium citrate (Fisher Scientific, Fair
Lawn, NJ, USA) solutions were added to the adjusted samples at room temperature, then
agitated and left to equilibrate for 30 min. Stock solutions were prepared to achieve the
final concentrations of 0, 15, 30, 45 and 60 mEq L-1, alone or in combination.
The thermal stability of the concentrates was determined by measuring the heat
coagulation time (HCT), as defined as the time at 120°C necessary to observe visible onset
coagulation. A custom made circulation device was added to an oil bath (Haake AC200 -
ThermoFisher Scientific, Newington, NH) and a heat-resistant screw-cap test tube
containing 3 mL aliquot samples were immersed in the bath maintained at 120°C (Eshpari
et al., 2014). In addition, for further characterization of the samples after heating, all
treatments were heated at 120°C for 10 min in a silicone oil bath (Haake AC200 -
ThermoFisher Scientific, Newington, NH) and immediately cooled to room temperature by
immersion in an ice bath.
5.3.2. Sample characterization
The retentates were characterized for total solids and total, soluble and whey
protein. Heat stability of the samples was measured through Heat Coagulation Time (HCT)
analysis. Turbidity; viscosity; pH; and casein micelle size were measured after the heat
treatment of 120°C/10 min.
Total solids were measured by drying approximately 2 g of sample in an aluminum
dish with pre-dried sand. The samples were dried at 105°C in a gravity-flow convection
oven (Fisher Scientific, Pittsburgh, PA) overnight. The pH of the retentates was measured
at 25°C, under agitation, using an Accumet pH meter (Fisher Scientific, Pittsburgh, PA),
81
calibrated before use. Total and soluble protein concentration was measured by Dumas
method Leco FP-528 (Leco Corp., St. Joseph, MI, USA) and a conversion factor of 6.38
was used to convert the nitrogen concentration into protein. The soluble fraction was
obtained by ultracentrifugation (100000xg for 1h at 20°C). The whey proteins
concentration was measured by HPLC (Thermo Instruments Canada Inc., Mississauga, ON,
Canada) as described in section 3.3.3.
5.3.3. Viscosity
Viscosity was measured using a controlled stress rheometer (Paar Physica MC 301, Anton
Paar, Graz, Austria) using cone and plate geometry, with a set gap of 0.51 mm, and at
25°C. The milk retentates samples were subjected to a shear sweep test from 10 to 300 s-1
and values at 100 s-1 were reported.
5.3.4. Light scattering
Particle size distribution was determined by dynamic light scattering (DLS)
(Zetasizer Nano-ZS, Malvern Instruments, Worcestershire, UK). The samples were diluted
on the ratio 1μL sample: 1mL of filtered permeate from ultrafiltration (0.22μm PVDF
filters, Fisher Scientific) and analyzed at 25°C in a backscatter measurement angle of 173°.
Transmission diffusing wave spectroscopy (DWS) was used to measure the
turbidity, which is inversely correlated to the photon transport mean free path (l*). l* is
defined as the length scale over which the scattered light has been totally randomized, and
depends on instrument configuration, as the wavelength of the laser light, and
82
characteristics of the system, as particle size, particle concentration, and the dispersion
medium (Alexander et al., 2006).
5.3.5. Statistical analysis
The experiments were carried out in triplicate (i.e. three separate milk batches).
Statistical significances were evaluated using analysis of variance (ANOVA) at p˂0.05 and
T-test. The mean values were compared using Tukey test, with all data processed using
Statistica 12 software.
5.4. Results and Discussion
5.4.1. General characterization of the retentates
The milk concentrate used in this study had a pH similar to that of the original milk,
6.70 ± 0.01. It is important to note that no diafiltration was applied during concentration.
The final total solids of the concentrate was 17.0 ± 1.3 % (w/w), with a total protein
concentration of 12 ± 1 % (w/w), resulting in an approximately 4x microfiltered retentate,
with a ratio of protein to solids of about 0.70. The amount of unsedimentable protein,
present in the supernatant after centrifugation was 2.2 ± 0.1 % (w/w). Concentration was
also confirmed by the measurement of whey proteins using HPLC, and the values indicated
approximately 25% reduction in the final concentration.
It is known that the increase in volume fraction of casein micelles will increase the
buffering capacity, proportionate to the protein content (Covacevich & Kosikowski, 1979;
Mistry & Kosikowski, 1986; Salaün et al., 2005). Even after removal of whey proteins by
microfiltration, Salaün et al. (2005) reported an increase in buffering capacity in line with
83
micellar casein concentration, because whey proteins contribute only 5% of buffering
capacity while caseins are responsible for 35% (Salaün et al., 2007).
Testing was conducted after adjusting the pH in the range from 6.5-6.9. Samples
adjusted to 7.1 and 7.3 could not be tested, because after adjusting the pH of the retentates
using sodium hydroxide and stabilization for 30 min, an increase in viscosity was noted.
These results were in full contrast with the work reported in the literature on reconstituted
micellar casein concentrates, which stated a positive effect of these pH values on heat
stability (De Kort et al., 2012; Sauer & Moraru, 2012). This could be due to the absence of
β-lactoglobulin in micellar casein concentrates. This protein is known to change the
stability as a function of pH, by introducing peaks of maximum and minimum in the HCT-
pH profile (Fox & Hoynes, 1975; Singh, 2004). It is therefore important to note that, unlike
previous literature, this work was conducted on fresh casein micellar concentrates, and not
on reconstituted micellar isolates or concentrates. These may be the reasons for the
discrepancy with the literature data.
5.4.2. HCT as a function of chelators concentration
The effect of chelators on the HCT of microfiltered milk concentrate is shown in
Figure 5.1, for three different pH values, 6.5, 6.7 and 6.9. In the absence of chelators, in the
range between 6.5 and 6.9 the concentrates showed a HCT between 25 and 30 min. These
values of HCT are similar to the ones reported in Chapter 4, but in contrast from previous
work (de Kort et al., 2012) reporting immediate visible coagulation for concentrates at pH
6.7. In concentrates at pH 6.5, there was no significant effect of emulsifying salts on the
HCT, always between 25 and 30 min. At pH 6.7 HCT showed a similar pattern for all the
84
salts, with a maximum value of HCT at a concentration of 30 mEq L-1, followed by a
decrease at higher concentrations. An optimum HCT, with a statistically significant
difference, occurred when citrate and phosphate were combined, and the sample with the
chelators presented an average twice the HCT that the original sample, 80 min against 40
min when no chelators was added. Concentrations higher than 40 mEq L-1 showed a
distinct behavior, with a significantly lower HCT.
The bottom panel of Figure 5.1 shows HCT values for pH 6.9. These samples in
general, showed a lower HCT than for samples at original pH, and the concentrate with no
chelators showed a HCT of about 30 min. The addition of phosphate seemed to have a
positive impact on heat stability; however the differences were not statistically significant
due to large deviations between batches. As for the other pH values, at the highest
concentrations chelators had a negative effect on HCT (< 20 min).
The relatively high values of HCT at pH 6.5 reported in this study are not in
agreement with previous studies on reconstituted micellar casein concentrate (MCC),
whereby stability could be achieved only for samples with pH higher than 6.9 (Sauer &
Moraru, 2012). Furthermore, values of HCT lower than 20 min have been reported for milk
protein concentrates reconstituted to 8.5% (w/v) protein, when adjusted to pH 5.8 (Crowley
et al., 2015). Instability has also been reported for micellar casein concentrates at pH 6,7
when heated in a temperature range between 110°C and 150°C (Sauer & Moraru, 2012) and
for casein micellar dispersions reconstituted at 9% w/v protein (de Kort et al., 2012) at pH
6.7 without calcium chelators. In those studies, only after addition of chelating salts HCT
increased.
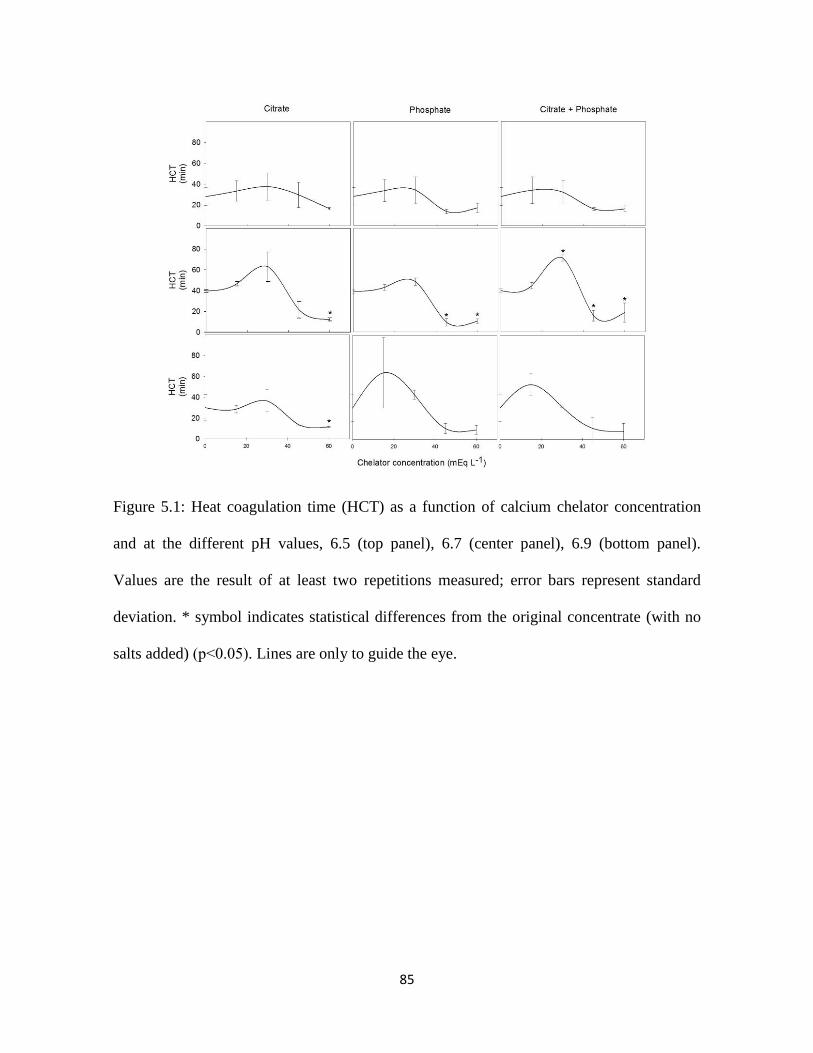
85
Figure 5.1: Heat coagulation time (HCT) as a function of calcium chelator concentration
and at the different pH values, 6.5 (top panel), 6.7 (center panel), 6.9 (bottom panel).
Values are the result of at least two repetitions measured; error bars represent standard
deviation. * symbol indicates statistical differences from the original concentrate (with no
salts added) (p˂0.05). Lines are only to guide the eye.
86
In addition, the present work reports for the first time a peak of the HCT at an
optimal concentration of calcium chelators, with a consequent decrease of HCT at the
highest concentrations for micellar concentrates.
The results obtained in this study also differ from literature for concentrates at pH
6.9. A previous study with a reconstituted milk casein concentrate at pH 7.0 reported a
minimum HCT of 40 min without chelators added, and values increasing with increasing
chelators concentration (de Kort et al., 2012). The discrepancy of this work from the earlier
literature may be attributed to the use of fresh sample, with a process of concentration
without the addition of water, diafiltration, while in the previous literature extensive
diafiltration, drying and reconstitution took place. These processes cause partial removal of
soluble calcium, reduction of colloidal calcium phosphate, casein dissociation and changes
in the equilibrium between soluble and colloidal calcium, all critical factors in changing the
functional properties of the casein micelles (Li & Corredig, 2014; Li et al., 2015; Lucey &
Horne, 2009).
The higher HCT in these concentrates may also be credited to the partial removal of
whey proteins, as showed in Chapter 3. However, it is important to point out that the HCT
of the concentrates without chelators, as a function of pH, showed a profile of type A milk,
which has a maximum in heat stability at pH 6.7. This may indicate that the removal of
whey proteins was not sufficient to convert the concentrate to a type B milk (where the heat
stability would increase with increasing pH). This may also be a discrepancy due to the
difference in behavior between fresh milk concentrates, and concentrates reconstituted from
powders, whereby the whey proteins may be at least partly denatured. This may be a reason
the results of this study differ from previous studies with micellar casein concentrates and
87
isolates, as heat stability was reported to increase at higher pH values (Beliciu et al., 2012;
de Kort et al., 2012; Sauer & Moraru, 2012).
In this work, in general, HCT increased with the addition of calcium chelators but
only at concentrations ≤ 30 mEq L-1, while higher concentrations showed a decrease of
HCT. A possible explanation for this behavior is the decrease of saturation of calcium on
the soluble phase, by the addition of calcium chelators, leading to a decrease in the
available calcium for precipitation caused by the loss of solubility during heating (Broyard
& Gaucheron, 2015). Therefore, the presence of chelators would prevent modifications on
the surface of the micelle and improve the heat stability of the concentrate. However, the
presence of an optimum might indicate that higher amounts of chelators cause
solubilization of micellar calcium phosphate, and partial dissociation of casein micelles
(Broyard & Gaucheron, 2015). Also, excess calcium, which has positive charge, may offset
the negative charges of caseins causing precipitation (Guo et al., 2003). In a previous work
it was shown that the presence of chelators may increase the viscosity due to the presence
of small aggregates induced by chelating salts (de Kort et al., 2011).
5.4.3. Effect of heating on final pH as a function of chelators concentration
To better identify possible changes in the physical and chemical properties of the
concentrates, the samples were heated at 120°C for 10 min, and their pH as a function of
chelator concentration is shown in Table 5.1. The original sample (no chelator added)
showed a decrease in pH, as expected for heated milk (Walstra et al., 2006). However, the
addition of chelators kept the adjusted initial pH or even increased it.
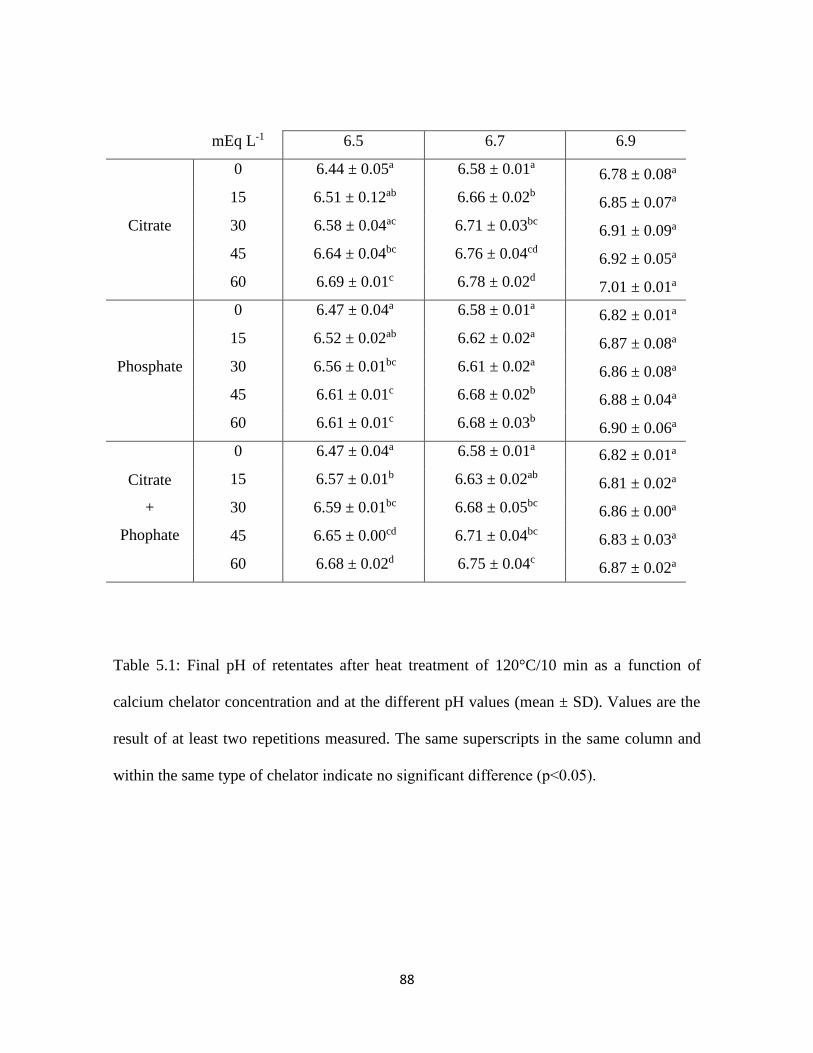
88
mEq L-1 6.5 6.7 6.9
Citrate
0 6.44 ± 0.05a
6.58 ± 0.01a
6.78 ± 0.08a
15 6.51 ± 0.12ab
6.66 ± 0.02b
6.85 ± 0.07a
30 6.58 ± 0.04ac
6.71 ± 0.03bc
6.91 ± 0.09a
45 6.64 ± 0.04bc
6.76 ± 0.04cd
6.92 ± 0.05a
60 6.69 ± 0.01c
6.78 ± 0.02d
7.01 ± 0.01a
Phosphate
0 6.47 ± 0.04a
6.58 ± 0.01a
6.82 ± 0.01a
15 6.52 ± 0.02ab
6.62 ± 0.02a
6.87 ± 0.08a
30 6.56 ± 0.01bc
6.61 ± 0.02a
6.86 ± 0.08a
45 6.61 ± 0.01c
6.68 ± 0.02b
6.88 ± 0.04a
60 6.61 ± 0.01c
6.68 ± 0.03b
6.90 ± 0.06a
Citrate
+
Phophate
0 6.47 ± 0.04a
6.58 ± 0.01a
6.82 ± 0.01a
15 6.57 ± 0.01b
6.63 ± 0.02ab
6.81 ± 0.02a
30 6.59 ± 0.01bc
6.68 ± 0.05bc
6.86 ± 0.00a
45 6.65 ± 0.00cd
6.71 ± 0.04bc
6.83 ± 0.03a
60 6.68 ± 0.02d
6.75 ± 0.04c
6.87 ± 0.02a
Table 5.1: Final pH of retentates after heat treatment of 120°C/10 min as a function of
calcium chelator concentration and at the different pH values (mean ± SD). Values are the
result of at least two repetitions measured. The same superscripts in the same column and
within the same type of chelator indicate no significant difference (p˂0.05).
89
When milk concentrates adjusted to pH 6.5 were heated without chelators, the pH
measured after heating was 6.45. At concentration citrate >45 mM or in the case of
phosphates >30 mM, the pH after heating was significantly higher than that of the original
adjusted retentates. At the initial pH (6.7), the addition of calcium chelators was effective in
controlling pH at almost all the concentrations, after heat treatment, when compared to the
original sample (no chelator added) as can be observed by the higher pH of the samples
with chelators. At initially adjusted pH 6.9 only citrate alone and at the highest
concentration had a positive impact in keeping or increasing the pH after heat treatment.
It has been previously reported that calcium chelators are effective in controlling the
decrease in pH caused by degradation of lactose and formation of organic acids after heat
treatment (O’Connell & Fox, 2003). This effect is due to acid-basic groups on the chelators,
which bind to protons and prevent the decrease of pH (Broyard & Gaucheron, 2015). The
pKa of citrate (6.4) and phosphate (7.2) salts are close to those of the fresh milk
concentrates. It is important to note that for fresh control samples, with no chelators added,
the decrease in pH after heating was smaller than that reported by de Kort et al. (2012) for
reconstituted micellar concentrates.
5.4.4. Effect of heating on particle size as a function of chelators concentration
To follow possible differences in apparent diameter of the casein micelles after
heating, the particle size was measured, as a function of pH and chelating salts, after
heating at 120°C for 10 min, as shown in Table 5.2. The unheated values correspond to the
sample without chelators after pH adjustment.
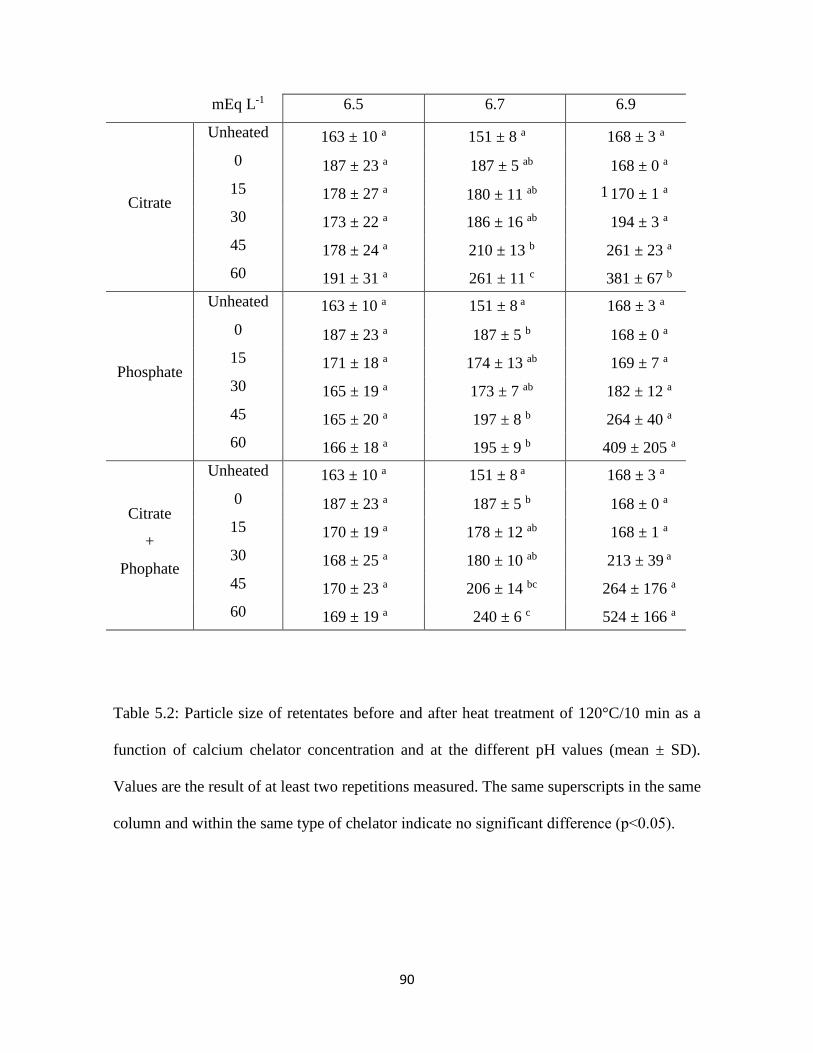
90
mEq L-1 6.5 6.7 6.9
Citrate
Unheated 163 ± 10 a 151 ± 8 a 168 ± 3 a
0 187 ± 23 a
187 ± 5 ab
168 ± 0 a
15 178 ± 27 a
180 ± 11 ab 1
170 ± 1 a
30 173 ± 22 a
186 ± 16 ab
194 ± 3 a
45 178 ± 24 a
210 ± 13 b
261 ± 23 a
60 191 ± 31 a
261 ± 11 c
381 ± 67 b
Phosphate
Unheated 163 ± 10 a 151 ± 8 a 168 ± 3 a
0 187 ± 23 a
187 ± 5 b
168 ± 0 a
15 171 ± 18 a
174 ± 13 ab
169 ± 7 a
30 165 ± 19 a
173 ± 7 ab
182 ± 12 a
45 165 ± 20 a
197 ± 8 b
264 ± 40 a
60 166 ± 18 a
195 ± 9 b
409 ± 205 a
Citrate
+
Phophate
Unheated 163 ± 10 a 151 ± 8 a 168 ± 3 a
0 187 ± 23 a
187 ± 5 b
168 ± 0 a
15 170 ± 19 a
178 ± 12 ab
168 ± 1 a
30 168 ± 25 a
180 ± 10 ab
213 ± 39 a
45 170 ± 23 a
206 ± 14 bc
264 ± 176 a
60 169 ± 19 a
240 ± 6 c
524 ± 166 a
Table 5.2: Particle size of retentates before and after heat treatment of 120°C/10 min as a
function of calcium chelator concentration and at the different pH values (mean ± SD).
Values are the result of at least two repetitions measured. The same superscripts in the same
column and within the same type of chelator indicate no significant difference (p˂0.05).
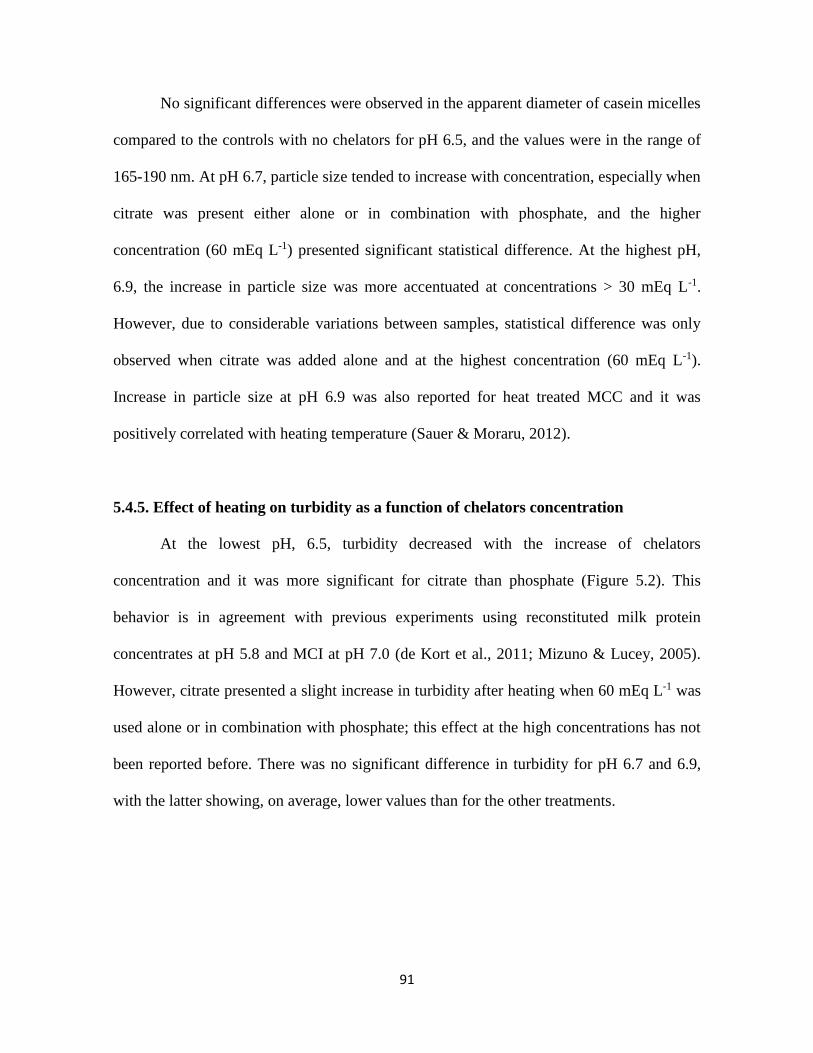
91
No significant differences were observed in the apparent diameter of casein micelles
compared to the controls with no chelators for pH 6.5, and the values were in the range of
165-190 nm. At pH 6.7, particle size tended to increase with concentration, especially when
citrate was present either alone or in combination with phosphate, and the higher
concentration (60 mEq L-1) presented significant statistical difference. At the highest pH,
6.9, the increase in particle size was more accentuated at concentrations > 30 mEq L-1.
However, due to considerable variations between samples, statistical difference was only
observed when citrate was added alone and at the highest concentration (60 mEq L-1).
Increase in particle size at pH 6.9 was also reported for heat treated MCC and it was
positively correlated with heating temperature (Sauer & Moraru, 2012).
5.4.5. Effect of heating on turbidity as a function of chelators concentration
At the lowest pH, 6.5, turbidity decreased with the increase of chelators
concentration and it was more significant for citrate than phosphate (Figure 5.2). This
behavior is in agreement with previous experiments using reconstituted milk protein
concentrates at pH 5.8 and MCI at pH 7.0 (de Kort et al., 2011; Mizuno & Lucey, 2005).
However, citrate presented a slight increase in turbidity after heating when 60 mEq L-1 was
used alone or in combination with phosphate; this effect at the high concentrations has not
been reported before. There was no significant difference in turbidity for pH 6.7 and 6.9,
with the latter showing, on average, lower values than for the other treatments.
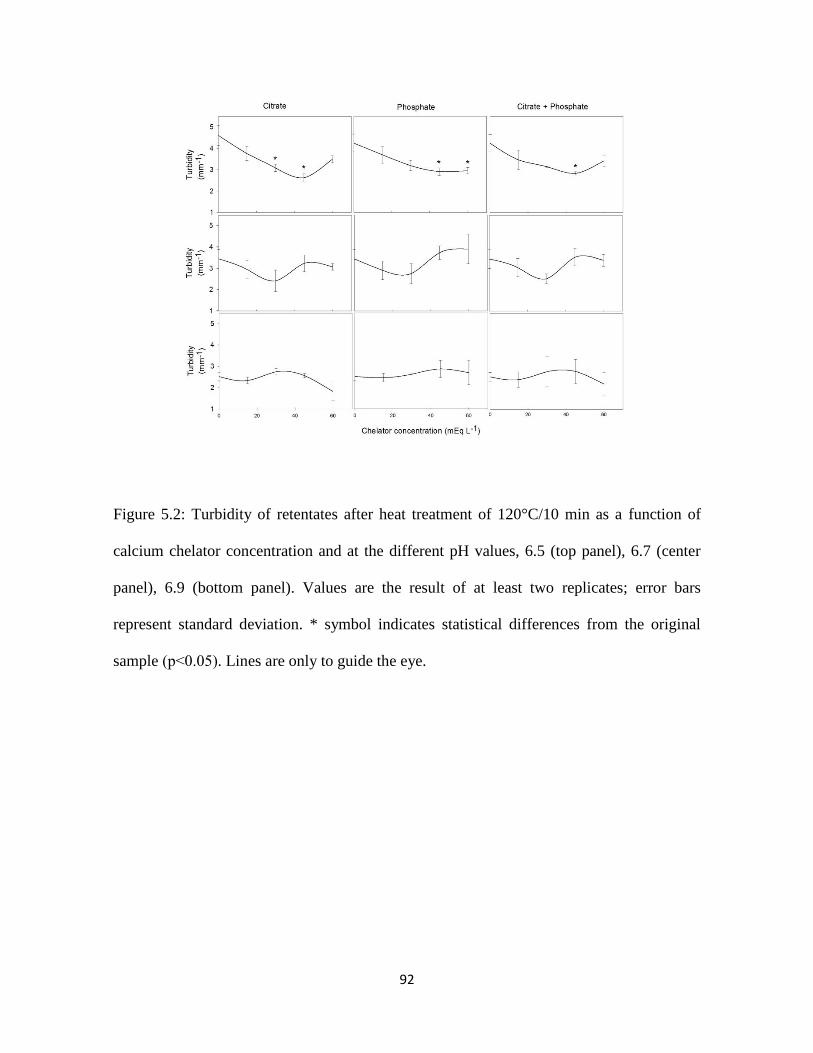
92
Figure 5.2: Turbidity of retentates after heat treatment of 120°C/10 min as a function of
calcium chelator concentration and at the different pH values, 6.5 (top panel), 6.7 (center
panel), 6.9 (bottom panel). Values are the result of at least two replicates; error bars
represent standard deviation. * symbol indicates statistical differences from the original
sample (p˂0.05). Lines are only to guide the eye.
93
Turbidity is inversely correlated to the photon transport mean free path (l*), which
depends on particle size, particle concentration, and the dispersion medium (Alexander et
al., 2006), so the changes can be taken as indications of changing structural organization of
the suspension, or changes in refractive index contrast due to changes in the serum phase
(Alexander et al., 2006; Alexander & Dalgleish, 2005).
5.4.6. Effect of heating on viscosity as a function of chelators concentration
Viscosity tended to increase with the increase of salts' concentration, as can be seen
in Figure 5.3. At pH 6.5, the changes were more intense when citrate was present, but
significant increase was only observed at the higher concentration (60 mEq L-1). Viscosity
was higher at pH 6.7, but behavior with calcium concentration was similar to the samples at
pH 6.5. It was less affected by phosphate, but it was only statistically different at the higher
concentration when citrate was added alone. Viscosity showed a slight increase with
chelator concentration of phosphate and a peak of maximum at 45 mEq L-1 when citrate
was present at pH 6.9.
Viscosity increased after heat treatment with the addition of chelators and with the
increase of their concentration. Similar behavior was reported for micellar casein
dispersions adjusted to pH 6.7, 7.0 and 7.3 after heating at 126°C (de Kort et al., 2012).
However, the fresh samples from our study presented much higher viscosity due to the
higher total protein concentration and the presence of a still considerable amount of whey
proteins. On the other hand, the fresh samples at pH 6.7 were still stable after heat
treatment, while the MCI solution coagulated at the same pH.
94
Figure 5.3: Viscosity of retentates after heat treatment of 120°C/10 min as a function of
calcium chelator concentration and at the different pH values, 6.5 (top panel), 6.7 (center
panel), 6.9 (bottom panel). Values are the result of at least two repetitions measured; error
bars represent standard deviation. * symbol indicates statistical differences from the
original sample (p˂0.05). Lines are only to guide the eye.
95
5.5. Conclusions
Despite the original good heat stability of fresh high protein microfiltered
concentrate, HCT were improved by the addition of chelators, especially at low
concentrations. Chelators showed optimum performance at concentrations between 15 and
30 mEq L-1. This can be attributed to reducing soluble calcium, and avoiding its
precipitation with heat treatment. Excess of chelators leads to solubilization of colloidal
calcium phosphate and partial dispersion of casein micelles with a decrease in HCT. This
study showed that fresh microfiltered retentates may be an ideal ingredient for the
development of new and improved dairy drinks, and that their behavior is quite different
than that of the reconstituted concentrates. However, studies on shelf life are necessary to
evaluate the long term stability of this product and addition of small amounts of chelators
may be necessary to optimize some properties.
96
CHAPTER 6
General conclusions
Milk proteins have been largely used to enrich food products and high protein
beverages have become a consumer’s trend in dairy markets. Milk powders such as milk
protein concentrates and isolates, and micellar casein concentrates and isolates have been
employed in many dairy products' to achieve desired technological and nutritional
properties (Beliciu et al., 2012; Crowley et al., 2014, 2015; de Kort et al., 2011, 2012;
Sauer & Moraru, 2012). A better understanding of the differences in properties depending
on processing history of the fresh concentrates was needed, as, so far, the knowledge was
mainly based on studies conducted with reconstituted powders.
As heat stability is key in the utilization of the concentrates, processing treatments
were targeted to obtain protein compositional differences, while controlling serum phase
composition, to better understand which factors may be critical in imparting particular
functionality to these ingredients.
The thesis focused on the processing properties of fresh concentrates containing
different amounts of whey proteins. It was hypothesized that heat stability is related to the
whey protein to casein ratio in the retentates as well as the composition of the serum phase.
MF and UF retentates, with similar serum composition showed no differences in pH
and calcium and phosphate concentration in the soluble phase, but showed different heat
stability. The differences in properties between samples at the same concentration factor
were attributed to the removal of whey proteins. The reduction of whey proteins in the MF
97
dispersions was also effective in maintaining the apparent casein diameter after heating,
while UF samples showed a significant increase in casein size after 10 min at 120°C.
Viscosity also increased in UF samples, especially at the high concentrations tested.
The results highlighted that the removal of whey proteins does not need to be
extensive to achieve improved heat stability; however, it was very clear that all other
compositional differences needed to be controlled. Hence, the importance of processing
history on the properties of these fresh retentates needs to be stressed.
In a second part of the research work, retentates produced by ultrafiltration (UF);
microfiltration (MF); microfiltration with diafiltration (DF); and microfiltration with
additional filtration with permeate from ultrafiltration (PF) were characterized. All these
concentrates were prepared on a pilot scale industrial unit. UF, MF and PF maintained the
pH of milk and showed similar values for total protein and total solids. While the addition
of water for diafiltration showed no impact on total proteins, the DF sample had a higher
pH and lower total solids, because of removal of lactose and ions during diafiltration with
water. Soluble protein and whey proteins decreased with the use of microfiltration system,
but no significant differences were observed after further filtration either with water or
permeate. Neither casein dissociation nor soluble aggregates formation was observed on the
fresh retentates. In this set of samples, diafiltered retentates had a higher heat coagulation
time, compared to the rest. The difference in pH, the removal of ions and lactose all had an
impact in the improvement of heat stability.
Considering the importance of whey proteins the formation of heat induced
aggregates in the concentrates, the retentates were submitted to heat treatment at 120°C for
10 min and ultra-high temperature (UHT) treatment. The samples only showed a significant
98
increase in particle size and turbidity after the UHT treatment and the increments were
bigger when more whey protein was present, i.e. UF sample. DF retentates showed the
lowest amount of soluble aggregates as well as the highest amount of non-denatured
residual whey protein, confirming the heat coagulation time observations.
The impact of the addition of the chelating molecules citrate and phosphate on the
heat-induced changes of microfiltered retentates was also studied at different concentrations
and pH values, and compared to literature reports. Heat coagulation time increased with
small concentrations of chelators but decreased at the higher concentrations. The stability
was good at all pH values, but a slight increase was observed at natural pH, i.e. 6.7. Citrate
and phosphate were effective on controlling the decrease in pH caused by heating. Higher
values were observed when citrate was used alone or in combination with phosphate. pH
6.5 presented the lower variation in particle size after heat treatment and the variations
increased with the increase of pH. This is in agreement with the hypothesis that at very high
concentration, chelators can have an adverse effect on stability, due to solubilisation of
casein, which could increase the viscosity. Overall, microfiltered retentates proved to be
very stable and the addition of chelators had very little impact on the samples. However,
studies of long-term changes on the product and on deposition on heat exchangers may lead
to the necessity of some adjustments that may be achieved by adding calcium chelators.
In summary, this study reinforced the importance of whey protein removal on the
heat stability of dairy products and also established that fresh concentrates may not need
further pH adjustments, or the addition of chelating agents. It was shown for the first time
that the removal of small amounts of protein can have a significant impact on heat stability
of the concentrates. Diafiltration showed to be an interesting tool to improve heat stability
99
by reducing lactose and ions from the serum phase. The work presented in this thesis
highlighted a number of discrepancies with previous literature, and stresses the importance
of processing history as well as reconstitution on the functional properties of the
ingredients.
100
References
Agarwal, S., Beausire, R. L. W., Patel, S., & Patel, H. (2015). Innovative uses of milk
protein concentrates in product development. Journal of Food Science, 80(S1), A23–
A29. http://doi.org/10.1111/1750-3841.12807
Alexander, M., Corredig, M., & Dalgleish, D. G. (2006). Diffusing wave spectroscopy of
gelling food systems: The importance of the photon transport mean free path (l*)
parameter. Food Hydrocolloids, 20(2–3 SPEC. ISS.), 325–331.
http://doi.org/10.1016/j.foodhyd.2005.02.021
Alexander, M., & Dalgleish, D. G. (2005). Interactions between denatured milk serum
proteins and casein micelles studied by diffusing wave spectroscopy. Langmuir : The
ACS Journal of Surfaces and Colloids, 21(24), 11380–6.
http://doi.org/10.1021/la0519958
Anema, S. G. (2009). The whey proteins in milk: thermal denaturation, physical
interactions and effects on the functional properties of milk. In A. Thompsom, M.
Boland, & H. Singh (Eds.), Milk proteins: from expression to food (1st ed., pp. 239–
282). Academic Press.
Anema, S. G., Siew, K. L., & Klostermeyer, H. (2006). Effect of protein, nonprotein-
soluble components, and lactose concentrations on the irreversible thermal
denaturation of β-lactoglobulin and α-lactalbumin in skim milk. Journal of
Agricultural and Food Chemistry, 54(19), 7339–7348.
http://doi.org/10.1021/jf061508+
Beliciu, C. M., Sauer, A., & Moraru, C. I. (2012). The effect of commercial sterilization
regimens on micellar casein concentrates. Journal of Dairy Science, 95(10), 5510–26.
http://doi.org/10.3168/jds.2011-4875
Brandsma, R. L., & Rizvi, S. S. H. (2001). Manufacture of Mozzarella cheese from highly-
concentrated skim milk microfiltration retentate depleted of whey proteins.
International Journal of Food Science and Technology, 36, 611–624.
Brans, G., Schroën, C. G. P. H., van der Sman, R. G. M., & Boom, R. M. (2004).
Membrane fractionation of milk: state of the art and challenges. Journal of Membrane
101
Science, 243(1–2), 263–272. http://doi.org/10.1016/j.memsci.2004.06.029
Broyard, C., & Gaucheron, F. (2015). Modifications of structures and functions of caseins:
a scientific and technological challenge. Dairy Science and Technology, 95(6), 831–
862. http://doi.org/10.1007/s13594-015-0220-y
Covacevich, H. R., & Kosikowski, F. V. (1979). Buffer, Lactic Fermentation, and Rennet
Coagulation Properties of Skim Milk Retentates Produced by Ultrafiltration. Journal
of Dairy Science, 62(2), 204–207. http://doi.org/10.3168/jds.S0022-0302(79)83227-0
Crowley, S. V., Boudin, M., Chen, B., Gazi, I., Huppertz, T., Kelly, A. L., & O’Mahony, J.
a. (2015). Stability of milk protein concentrate suspensions to in-container sterilisation
heating conditions. International Dairy Journal, 50, 45–49.
http://doi.org/10.1016/j.idairyj.2015.05.009
Crowley, S. V., Megemont, M., Gazi, I., Kelly, A. L., Huppertz, T., & O’Mahony, J. a.
(2014). Heat stability of reconstituted milk protein concentrate powders. International
Dairy Journal, 37(2), 104–110. http://doi.org/10.1016/j.idairyj.2014.03.005
Dalgleish, D. G. (2011). On the structural models of bovine casein micelles—review and
possible improvements. Soft Matter, 7(6), 2265. http://doi.org/10.1039/c0sm00806k
Dalgleish, D. G., & Corredig, M. (2012). The structure of the casein micelle of milk and its
changes during processing. Annual Review of Food Science and Technology, 3, 449–
67. http://doi.org/10.1146/annurev-food-022811-101214
Dalgleish, D. G., Spagnuolo, P. A., & Goff, H. D. (2004). A possible structure of the casein
micelle based on high-resolution field-emission scanning electron microscopy.
International Dairy Journal, 14(12), 1025–1031.
http://doi.org/10.1016/j.idairyj.2004.04.008
de Kort, E., Minor, M., Snoeren, T., van Hooijdonk, T., & van der Linden, E. (2011). Effect
of calcium chelators on physical changes in casein micelles in concentrated micellar
casein solutions. International Dairy Journal, 21(12), 907–913.
http://doi.org/10.1016/j.idairyj.2011.06.007
de Kort, E., Minor, M., Snoeren, T., Van Hooijdonk, T., & Van der Linden, E. (2012).
Effect of calcium chelators on heat coagulation and heat-induced changes of
102
concentrated micellar casein solutions: The role of calcium-ion activity and micellar
integrity. International Dairy Journal, 26(2), 112–119.
http://doi.org/10.1016/j.idairyj.2012.03.014
de Kruif, C. G., & Holt, C. (2003). Casein micelle structure, functions and interactions. In
P. F. Fox & P. L. H. Mcsweeney (Eds.), Advanced dairy chemistry - Volume 1
Proteins Part A (3rd ed., pp. 233–276). New York: Kluwer Academic / Plenunm
Publishers.
De Kruif, C. G., Huppertz, T., Urban, V. S., & Petukhov, A. V. (2012). Casein micelles and
their internal structure. Advances in Colloid and Interface Science, 171–172, 36–52.
http://doi.org/10.1016/j.cis.2012.01.002
Donato, L., & Dalgleish, D. G. (2006). Effect of the pH of heating on the qualitative and
quantitative compositions of the sera of reconstituted skim milks and on the
mechanisms of formation of soluble aggregates.
Donato, L., & Guyomarc’h, F. (2009). Formation and properties of the whey protein-κ-
casein complexes in heated skim milk - A review. Dairy Science and Technology, 89,
3–29.
Donato, L., Guyomarc’h, F., Amiot, S., & Dalgleish, D. G. (2007). Formation of whey
protein/κ-casein complexes in heated milk: Preferential reaction of whey protein with
κ-casein in the casein micelles. International Dairy Journal, 17(10), 1161–1167.
http://doi.org/10.1016/j.idairyj.2007.03.011
Eshpari, H., Tong, P. S., & Corredig, M. (2014). Changes in the physical properties,
solubility, and heat stability of milk protein concentrates prepared from partially
acidified milk. Journal of Dairy Science, 97, 7394–7401.
Evans, J., Zulewska, J., Newbold, M., Drake, M. A., & Barbano, D. M. (2010). Comparison
of composition and sensory properties of 80% whey protein and milk serum protein
concentrates. Journal of Dairy Science, 93(5), 1824–43.
http://doi.org/10.3168/jds.2009-2723
Farkye, N. Y., & Ur-Rehman, S. (2011). Concentrated fluid milk ingredients. In R. C.
Chandan & A. Kilara (Eds.), Dairy ingredients for food processing (1st ed., pp. 123–
103
140). Ames: Wiley-Blackwell.
Ferrer, M. A., Alexander, M., & Corredig, M. (2011). Does ultrafiltration have a lasting
effect on the physico-chemical properties of the casein micelles? Dairy Science &
Technology, 91(2), 151–170. http://doi.org/10.1007/s13594-011-0002-0
Fox, P. F., & Hoynes, M. C. T. (1975). Heat stability of milk: influence of colloidal
calcium phosphate and β-lactoglobulin. Journal of Dairy Research, 42, 427–435.
Gaucheron, F. (2005). The minerals of milk. Reproduction Nutrition Development, 45,
473–483. http://doi.org/0.1051/rnd:2005030
Goulas, A., & Grandison, A. S. (2008). Application of membrane separation. In T. J. Britz
& R. K. Robinson (Eds.), Advanced Dairy Science and Technology (1st ed., pp. 35–
74). Cambridge: Blackwell Publishing.
Guo, C., Campbell, B. E., Chen, K., Lenhoff, A. M., & Velev, O. D. (2003). Casein
precipitation equilibria in the presence of calcium ions and phosphates. Colloids and
Surfaces B: Biointerfaces, 29(4), 297–307. http://doi.org/10.1016/S0927-
7765(03)00018-3
Guyomarc’h, F., Law, A. J. R., & Dalgleish, D. G. (2003). Formation of soluble and
micelle-bound protein aggregates in heated milk. Journal of Agricultural and Food
Chemistry, 51(16), 4652–4660. http://doi.org/10.1021/jf0211783
Hinrichs, J. (2001). Incorporation of whey proteins in cheese. International Dairy Journal,
11, 495–503.
Horne, D. S. (1998). Casein interactions: Casting light on the black boxes, the structure in
dairy products. International Dairy Journal, 8(3), 171–177.
http://doi.org/10.1016/S0958-6946(98)00040-5
Horne, D. S. (2006). Casein micelle structure: Models and muddles. Current Opinion in
Colloid & Interface Science, 11(2–3), 148–153.
http://doi.org/10.1016/j.cocis.2005.11.004
Iametti, S., De Gregori, B., Vecchio, G., & Bonomi, F. (1996). Modifications occur at
different structural levels during the heat denaturation of beta-lactoglobulin. European
Journal of Biochemistry / FEBS, 237(1), 106–12. http://doi.org/10.1111/j.1432-
104
1033.1996.0106n.x
Kapoor, R., & Metzger, L. E. (2008). Process Cheese: Scientific and Technological
Aspects—A Review. Comprehensive Reviews in Food Science and Food Safety, 7(2),
194–214. http://doi.org/10.1111/j.1541-4337.2008.00040.x
Li, Y., & Corredig, M. (2014). Calcium release from milk concentrated by ultrafiltration
and diafiltration. Journal of Dairy Science, 97, 5294–5302.
http://doi.org/10.3168/jds.2013-7567
Li, Y., Dalgleish, D., & Corredig, M. (2015). Influence of heating treatment and membrane
concentration on the formation of soluble aggregates. Food Research International,
76, 309–316. http://doi.org/10.1016/j.foodres.2015.06.016
Lucey, J. A., & Horne, D. S. (2009). Milk Salts: Technological Significance. In P. F. Fox &
P. L. H. Mcsweeney (Eds.), Advanced dairy chemistry - Volume - Lactose, Water,
Salts and Minor Constitutents (3rd ed., pp. 351–389). New York: Springer.
Marchin, S., Putaux, J. L., Pignon, F., & Léonil, J. (2007). Effects of the environmental
factors on the casein micelle structure studied by cryo transmission electron
microscopy and small-angle x-ray scattering/ultrasmall-angle x-ray scattering. Journal
of Chemical Physics, 126(4), 126–135. http://doi.org/10.1063/1.2409933
Maubois, J.-L. (2002). Membrane microfiltration: a tool for a new approach in dairy
technology. Australian Journal of Dairy Technology, 57(2), 92–96.
McGregor, R. A., & Poppitt, S. D. (2013). Milk protein for improved metabolic health: a
review of the evidence. Nutrition & Metabolism, 10(1), 46–58.
http://doi.org/10.1186/1743-7075-10-46
Mistry, V. V., & Kosikowski, F. V. (1986). A Naturally Buffered Bulk Retentate Starter
from Ultrafiltered Milk. Journal of Dairy Science, 69(4), 945–950.
http://doi.org/10.3168/jds.S0022-0302(86)80485-4
Mistry, V. V., & Maubois, J.-L. (2004). Application of membrane separation technology to
cheese production. In P. F. Fox, P. L. H. McSweeney, T. M. Cogan, & T. P. Guinee
(Eds.), Cheese: Chemistry, Physics and Microbiology (3rd ed., pp. 261–286). Elsevier
Academic Press.
105
Mizuno, R., & Lucey, J. A. (2005). Effects of emulsifying salts on the turbidity and
calcium-phosphate-protein interactions in casein micelles. Journal of Dairy Science,
88(9), 3070–8. http://doi.org/10.3168/jds.S0022-0302(05)72988-X
Nair, P. K., Alexander, M., Dalgleish, D., & Corredig, M. (2014). Physico-chemical
properties of casein micelles in unheated skim milk concentrated by osmotic stressing:
Interactions and changes in the composition of the serum phase. Food Hydrocolloids,
34, 46–53. http://doi.org/10.1016/j.foodhyd.2013.01.001
Nair, P. K., Dalgleish, D. G., & Corredig, M. (2013). Colloidal properties of concentrated
heated milk. Soft Matter, 9(14), 3815. http://doi.org/10.1039/c2sm27540f
Nelson, B. K., & Barbano, D. M. (2005). A microfiltration process to maximize removal of
serum proteins from skim milk before cheese making. Journal of Dairy Science, 88(5),
1891–900. http://doi.org/10.3168/jds.S0022-0302(05)72865-4
Nicolai, T. (2007). Food characterisation using scattering methods. In D. J. McClements
(Ed.), Understanding and controlling the microstructure of complex foods (1st ed., pp.
288–310). Cambridge: Woodhead Publishing Limited.
O’Connell, J. E., & Fox, P. F. (2003). Heat-induced coagulation of milk. In P. F. Fox & P.
L. H. Mcsweeney (Eds.), Advanced dairy chemistry - Volume 1 Proteins Part B (3rd
ed., pp. 879–946). New York: Kluwer Academic / Plenunm Publishers.
O’Mahony, J. a., & Fox, P. F. (2013). Milk proteins: Introduction and historical aspects. In
P. L. H. Mcsweeney & P. F. Fox (Eds.), Advanced dairy chemistry - Volume 1A:
Proteins: Basics aspects (4th ed., pp. 43–85). New York: Springer.
Pignon, F., Belina, G., Narayanan, T., Paubel, X., Magnin, A., & Gésan-Guiziou, G.
(2004). Structure and rheological behavior of casein micelle suspensions during
Ultrafiltration process. Journal of Chemical Physics, 121(16), 8138–8146.
http://doi.org/10.1063/1.1800931
Rahimi-Yazdi, S., Ferrer, M. A., & Corredig, M. (2010). Nonsuppressed ion
chromatographic determination of total calcium in milk. Journal of Dairy Science,
93(5), 1788–93. http://doi.org/10.3168/jds.2009-2446
Ryder, D. N. (1985). Use of membranes in the manufacture of hard and semi hard cheeses.
106
Desalination, 53, 129–133.
Salaün, F., Mietton, B., & Gaucheron, F. (2005). Buffering capacity of dairy products.
International Dairy Journal, 15(2), 95–109.
http://doi.org/10.1016/j.idairyj.2004.06.007
Salaün, F., Mietton, B., & Gaucheron, F. (2007). Influence of mineral environment on the
buffering capacity of casein micelles. Milchwissenschaft, 62(1), 20–23.
Sandra, S., Cooper, C., Alexander, M., & Corredig, M. (2011). Coagulation properties of
ultrafiltered milk retentates measured using rheology and diffusing wave spectroscopy.
Food Research International, 44(4), 951–956.
http://doi.org/10.1016/j.foodres.2011.02.018
Sauer, A., & Moraru, C. I. (2012). Heat stability of micellar casein concentrates as affected
by temperature and pH. Journal of Dairy Science, 95(11), 6339–50.
http://doi.org/10.3168/jds.2012-5706
Sikand, V., Tong, P. S., & Walker, J. (2013). Effect of adding salt during the diafiltration
step of milk protein concentrate powder manufacture on mineral and soluble protein
composition. Dairy Science and Technology, 93(4–5), 401–413.
http://doi.org/10.1007/s13594-013-0110-0
Singh, H. (2004). Heat stability of milk. International Journal of Dairy Technology, 57(2–
3), 111–119. http://doi.org/10.1111/j.1471-0307.2004.00143.x
Singh, H., & Havea, P. (2003). Thermal denaturation, aggregation and gelation of whey
proteins. In P. F. Fox & P. L. H. Mcsweeney (Eds.), Advanced dairy chemistry -
Volume 1 Proteins Part B (3rd ed., pp. 1261–1287). New York: Kluwer Academic /
Plenum Publishers.
Singh, H., & Latham, J. M. (1993). Heat stability of milk: Aggregation and dissociation of
protein at ultra-high temperatures. International Dairy Journal, 3(3), 225–237.
http://doi.org/10.1016/0958-6946(93)90066-9
Swaisgood, H. E. (2003). Chemistry of the caseins. In P. F. Fox & P. L. H. Mcsweeney
(Eds.), Advanced dairy chemistry - Volume 1 Proteins Part A (3rd ed., pp. 139–201).
New York: Kluwer Academic / Plenunm Publishers.
107
Walstra, P. (1999). Casein sub-micelles: Do they exist? International Dairy Journal, 9(3–
6), 189–192. http://doi.org/10.1016/S0958-6946(99)00059-X
Walstra, P., Wouters, J. T. M., & Geurts, T. J. (2006a). Heat treatment. In P. Walstra, J. T.
M. Wouters, & T. J. Geurts (Eds.), Dairy Science and Technology (2nd ed., pp. 225–
272). Boca Raton: Taylor & Francis Group.
Walstra, P., Wouters, J. T. M., & Geurts, T. J. (2006b). Membrane processes. In Dairy
Science and Technology (2nd ed., pp. 341–356). Boca Raton: CRC Press.
Walstra, P., Wouters, J. T. M., & Geurts, T. J. (2006c). Milk: Main characteristics. In Dairy
science and technology (2nd ed., pp. 3–16). Boca Raton: CRC Press.
Walstra, P., Wouters, J. T. M., & Geurts, T. J. (2006d). Milk components. In Dairy science
and technology (2nd ed., pp. 63–88). Boca Raton: CRC Press.
Walstra, P., Wouters, J. T. M., & Geurts, T. J. (2006e). Milk properties. In P. Walstra, J. T.
M. Wouters, & T. J. Geurts (Eds.), Dairy Science and Technology (1st ed., pp. 159–
174). Boca Raton: CRC Press.
Zhao, Z., & Corredig, M. (2015). Changes in the physico-chemical properties of casein
micelles in the presence of sodium chloride in untreated and concentrated milk
protein. Dairy Science and Technology, 95(1), 87–99. http://doi.org/10.1007/s13594-
014-0200-7