Effect of major false-twist texturing parameters on...
10
Bulgarian Chemical Communications, Volume 48, Special Issue D, Supplement (pp. 55 – 64) 2016 55 Effect of major false-twist texturing parameters on tensile properties and crystallinity of polyester microfilament yarn and optimized by RSM M. Taghavi Deilamani¹*, A. Rashidi¹, M. E. Yazdanshenas¹, M. B. Moghadam², S. Eskandarnejad¹ 1 Textile Department, Islamic Azad University Science and Research Branch, Tehran, Iran 2 Department of Statistics, Allameh-Tabataba’i University, Tehran, Iran Received March 24, 2016; Accepted August 8, 2016 The effect of major texturing parameter in the aspect of tensile behavior and percent of Crystallinity for Microfilament polyester yarn were studied.D/Y ratio, draw ratio, First heater temperature and speed of texturing machine are the major process parameters that used and other texturing parameters were constant. PET (poly ethylene terephthalate) POY with 136 dtex 144 filament was used. The response surface methodology (RSM) was also useful for the experimental plane with four variables on the result. The yarn was textured by experimental plane and 4 major parameters were changed and 25 samples were produced. Than examined by measuring their strength, tenacity, elongation and degree of crystallinity.After wards, conclusions were drawn using the test value. The result was that, as the first Heater temperature increase, the value of tenacity, strength and elongation change slightly and when draw ratio increase, strength and tenacity increase, than the statistical analysis confirms the optimum conditions obtained by the experimental result. Keywords: false-twist texturing machine, microfilament PET, tensile properties, percent of crystallinity, response surface methodology (RSM). 1.INTRODUCTION Numerous studies have been conducted in recent years on the false-twist texturing method as well as polyester yarns texturized through this method. The most significant properties of man-made fibers are their flat surface, proper bulk, and good physical properties and suitable dye absorption [1]. During high speed spinning, the physical properties and microstructure of filaments such as tenacity, elongation, density and crystallinity are improved by the effect of orientation [2]. In this respect, the false- twist texturing method is considered as the main method [2]. Microfilament yarns are kind of textiles material with improved physical and microstructural properties (breaking strength; elongation, density; and crystallinity) at high spinning speeds due to their increased crystallinity [3-4]. Polyethylene terephthalate (PET) is one of the principal man-made fibers with widespread applications and the highest level of consumption. Among the polyethylene terephthalates, microfilament polyester has, in recent years, been widely used by consumers due to its diverse applicability and suitable properties. Microfilaments are filament with a linear density between 0.3 dtex to 1 dtex [6]. Fabrics woven with these filaments are lighter, more wrinkle-resistant, provide a better cover effect, and have a highly attractive appearance [5]. The favorable properties of these fibers include good strength (tenacity), and existence of regions which can improve dye absorption properties (due to their larger specific surface area or SSA). A reduction in the linear density of the filaments is accompanied by an increase in the contact surface of each filament section. In fact, an increase in specific surface area is tangibly associated with reduced linear density of the filaments [6-8]. For this reason, proper texturing of microfilament polyester yarn can greatly affect the mentioned properties. In most cases, three parameters (called “3t”) are examined in the texturing process: tension, twist, and temperature [2]. Figure 1. False-twist texturing machine. Draw ratio, D/Y ratio, and first heater temperature are among the parameters involved in this process. The ratio of disc surface speed to yarn speed (D/Y ratio) is calculated from the following * To whom all correspondence should be sent: E-mail: [email protected] 2016 Bulgarian Academy of Sciences, Union of Chemists in Bulgaria
Transcript of Effect of major false-twist texturing parameters on...

Bulgarian Chemical Communications, Volume 48, Special Issue D, Supplement (pp. 55 – 64) 2016
55
Effect of major false-twist texturing parameters on tensile properties and crystallinity
of polyester microfilament yarn and optimized by RSM
M. Taghavi Deilamani¹*, A. Rashidi¹, M. E. Yazdanshenas¹, M. B. Moghadam², S. Eskandarnejad¹
1 Textile Department, Islamic Azad University Science and Research Branch, Tehran, Iran
2Department of Statistics, Allameh-Tabataba’i University, Tehran, Iran
Received March 24, 2016; Accepted August 8, 2016
The effect of major texturing parameter in the aspect of tensile behavior and percent of Crystallinity for Microfilament
polyester yarn were studied.D/Y ratio, draw ratio, First heater temperature and speed of texturing machine are the major
process parameters that used and other texturing parameters were constant. PET (poly ethylene terephthalate) POY with
136 dtex 144 filament was used. The response surface methodology (RSM) was also useful for the experimental plane
with four variables on the result. The yarn was textured by experimental plane and 4 major parameters were changed and
25 samples were produced. Than examined by measuring their strength, tenacity, elongation and degree of
crystallinity.After wards, conclusions were drawn using the test value. The result was that, as the first Heater temperature
increase, the value of tenacity, strength and elongation change slightly and when draw ratio increase, strength and tenacity
increase, than the statistical analysis confirms the optimum conditions obtained by the experimental result.
Keywords: false-twist texturing machine, microfilament PET, tensile properties, percent of crystallinity, response
surface methodology (RSM).
1.INTRODUCTION
Numerous studies have been conducted in recent
years on the false-twist texturing method as well as
polyester yarns texturized through this method. The
most significant properties of man-made fibers are
their flat surface, proper bulk, and good physical
properties and suitable dye absorption [1]. During
high speed spinning, the physical properties and
microstructure of filaments such as tenacity,
elongation, density and crystallinity are improved by
the effect of orientation [2]. In this respect, the false-
twist texturing method is considered as the main
method [2]. Microfilament yarns are kind of textiles
material with improved physical and microstructural
properties (breaking strength; elongation, density;
and crystallinity) at high spinning speeds due to their
increased crystallinity [3-4]. Polyethylene
terephthalate (PET) is one of the principal man-made
fibers with widespread applications and the highest
level of consumption. Among the polyethylene
terephthalates, microfilament polyester has, in
recent years, been widely used by consumers due to
its diverse applicability and suitable properties.
Microfilaments are filament with a linear density
between 0.3 dtex to 1 dtex [6]. Fabrics woven with
these filaments are lighter, more wrinkle-resistant,
provide a better cover effect, and have a highly
attractive appearance [5]. The favorable properties
of these fibers include good strength (tenacity), and
existence of regions which can improve dye
absorption properties (due to their larger specific
surface area or SSA). A reduction in the linear
density of the filaments is accompanied by an
increase in the contact surface of each filament
section. In fact, an increase in specific surface area
is tangibly associated with reduced linear density of
the filaments [6-8]. For this reason, proper texturing
of microfilament polyester yarn can greatly affect
the mentioned properties. In most cases, three
parameters (called “3t”) are examined in the
texturing process: tension, twist, and temperature
[2].
Figure 1. False-twist texturing machine.
Draw ratio, D/Y ratio, and first heater
temperature are among the parameters involved in
this process. The ratio of disc surface speed to yarn
speed (D/Y ratio) is calculated from the following * To whom all correspondence should be sent:
E-mail: [email protected]
2016 Bulgarian Academy of Sciences, Union of Chemists in Bulgaria
M.T. Deilamani et al.: Effect of major false-twist texturing parameters on tensile properties and crystallinity …
56
formula: 𝐷
𝑌
=𝑐𝑖𝑟𝑐𝑢𝑚𝑓𝑒𝑟𝑒𝑛𝑡𝑖𝑎𝑙 𝑠𝑝𝑒𝑒𝑑 𝑜𝑓 𝑑𝑖𝑠𝑘𝑠(𝑚/𝑚𝑖𝑛)
𝑡ℎ𝑟𝑜𝑢𝑔ℎ𝑝𝑢𝑡 𝑠𝑝𝑒𝑒𝑑 𝑜𝑓 𝑦𝑎𝑟𝑛 (𝑚/𝑚𝑖𝑛) (1)
A low D/Y indicates that yarn tension decreases
before and increases after the twisting area [9-11].
Draw ratio is the ratio of the central shaft speed to
the input shaft speed (Fig. 1), calculated from the
following formula:
𝐷𝑟𝑎𝑤 𝑟𝑎𝑡𝑖𝑜
= 𝑐𝑒𝑛𝑡𝑒𝑟 𝑠ℎ𝑎𝑓𝑡 𝑠𝑝𝑒𝑒𝑑(𝑚/𝑚𝑖𝑛)
𝑖𝑛𝑝𝑢𝑡 𝑠ℎ𝑎𝑓𝑡 𝑠𝑝𝑒𝑒𝑑 (𝑚/𝑚𝑖𝑛) (2)
Draw ratio affects the following properties:
ultimate yarn density, strength (tenacity),
orientation, absorption and leveling at dyeing
process, filament rupture, etc. [2,10]. Increasing
texturing speed would improve physical and
microstructural properties of the fiber including
tensile strength (breaking strength), elongation,
density, and crystallinity due to the greater order
introduced in the crystal structure of the fiber [11-
13]. Examining the simultaneous effects of the four
main parameters on microfilament polyester yarn
properties is highly important and can greatly help
producers of this type of yarn.
Draw ratio and D/Y ratio together with heater
temperature are the main effective process
parameters. For dependent variables of crystallinity
and tenacity, independent parameters do not explain
fully on the changes on the structures [13].
Generally, it is observed that the tenacity increase
with an increase in the first heater temperature.
Because of the rise in temperature, crystallinity
increase within the yarn, which become more
orientated. On the other hand elongation decrease
when the temperature increase [14].
In this study the polyester Microfilament POY
yarn (136 dtex / 144 f) was used to conduct the tests.
This yarn is classified as a microfilament yarn with
a filament count of 0.85 denier (denier per filament)
which is further reduced upon texturing. Machine
speed is the primary parameter in false-twist
texturing as regards the four main parameters in
false-twist texturing. Due to its being equal to the
speed of the second shaft in the device, texturing
machine speed can have a considerable effect on the
physical and mechanical properties of the yarn. The
other important parameter is the ratio of disc surface
speed to yarn linear velocity (D/Y ratio). This
parameter mostly affects yarn twist and crimp, and
has a slight effect on the mechanical properties of the
yarn. Draw ratio is among the most important
texturizing factors and directly affects both
orientation and dye ability of the yarn. The ANOVA
was used to conduct the experiments.
Twenty five tests were designed in the
experimental process. Each test combined the four
studied parameters at different levels. The response
surface methodology (RSM) was used and the tests
were carried out via a RSM data generation scheme
called D-Optimal. The second order design model
was used. Tensile property tests were conducted on
all the samples. Due to the great number of tests
involved, percent crystallinity was determined only
for 8 samples, and the variations in the crystallinity
of these samples were used for examining the results.
2.EXPERIMENTAL
2.1.Materials
To conduct the tests, the polyester filament yarn,
POY 136 dtex 144 f (produced by Yas Nakh Alborz
Company, Iran) was used. To adapt test conditions
to the production conditions, we used a double-sided
RPR false-twist texturing machine (Model 3SDXP,
made in Italy) with 120 positions on either side as
shown in Figure 2. Polyurethane (PU) disks
(configuration 1-6-1) were used for false twisting.
The maximum speed of this texturing machine was
600 m/min. The yarn moved along a straight line,
and the machine had a primary heater about 2m long.
2.2.Microfilament polyester textured yarn
The first step before sampling was to design the
problem. The RSM was used for designing the tests.
Twenty five tests were designed for this experiment.
Each test was examined at four different levels. For
each sampling of microfilament polyester yarn, used
one position in machine. For all sampling, humidity
is 65% and environmental temperature is 24°C and
used 0.3% texturing oil for better opening yarn from
the bobbin. Four main parameters were studied:
texturing speed, draw ratio, D/Y ratio, and first
heater temperature. The other parameters were kept
constant during sampling.
2.3. Measurements
Yarn count. Upon completing the tests, the yarn
number was determined for all the samples. To this
end, we separated 9000 meters from each yarn
sample via a winding machine (WR-100, Iran) and
then measured the weight of this length to obtain the
yarn number in Deniers.
Tensile properties. The yarn strength, tenacity,
and elongation were measured for the 25 samples in
accordance with ASTM D3822 using a Tensolab 2
machine (made in Italy) and a constant rate of
elongation (CRE). The jaw speed for all the samples
was constant and equal to 500 m/min. Such as test
conditions were used for all the samples.
M.T. Deilamani et al.: Effect of major false-twist texturing parameters on tensile properties and crystallinity …
57
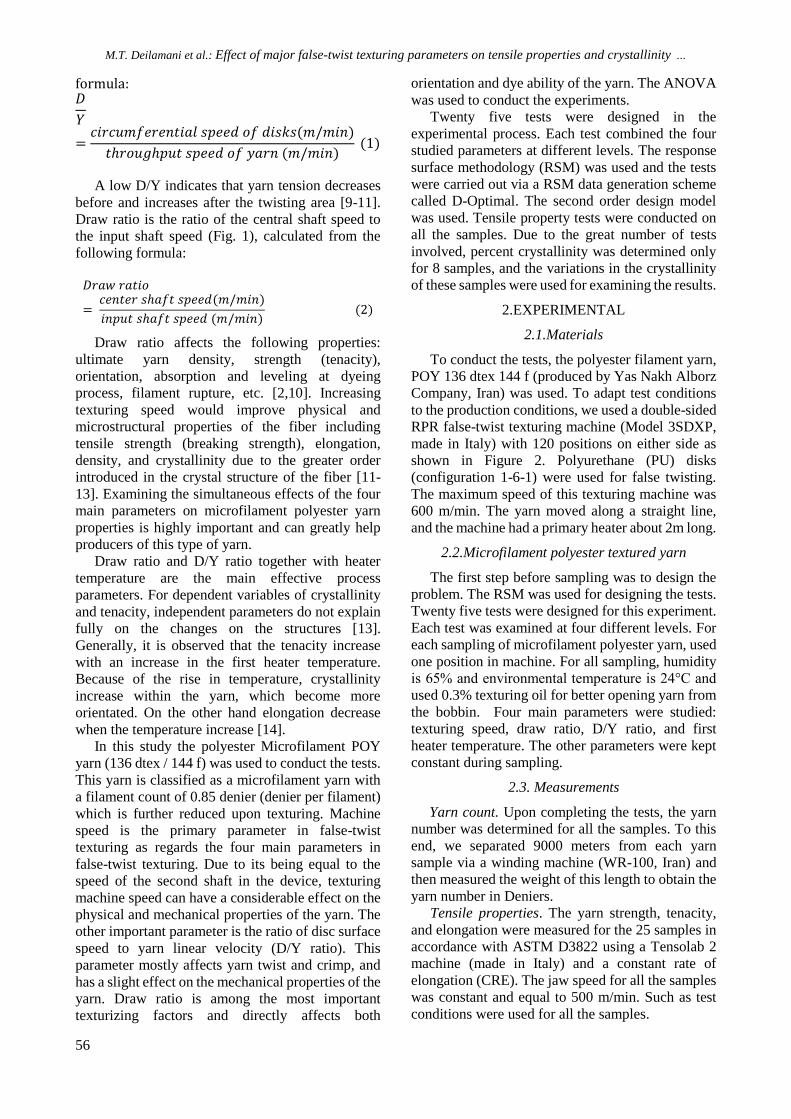
Table 1.Experimental for tenacity, strength and elongation
Differential scanning calorimetric (DSC). To
measure percent crystallinity, 8 of the 25 samples
were selected and the tests conducted on these
samples. The areas around the peaks can help in
identifying percent crystallinity of the samples. The
calculation of peak area on melting region according
to Eq. (3) is very helpful in process development.
Polyester microfilament yarns were tested in a DSC-
Maia-200 F3 unit (Netzsch, Germany) with micro
punched aluminum pans of 40µl. The testing
conditions were sample mass: 13.43 mg; initial
temperature: 20°c; final temperature: 600°c, heating
rate: 10°c min-1; purging gas: nitrogen 50mL min-1.
140.1 mJ/mg was used for ∆H_m^o (fusion) for
100% crystallinity PET.
%𝐶𝑟𝑦𝑠𝑡𝑎𝑙𝑙𝑖𝑛𝑖𝑡𝑦 = [∆𝐻𝑚 − ∆𝐻𝑐]/ ∆𝐻𝑚𝑜 × 100% (3)
∆𝐻𝑚: 𝑇ℎ𝑒 ℎ𝑒𝑎𝑡 𝑜𝑓 𝑚𝑒𝑙𝑡𝑖𝑛𝑔(𝐽/𝑔) ∆𝐻𝑐: 𝐶𝑜𝑙𝑑 𝑐𝑟𝑦𝑠𝑡𝑎𝑙𝑙𝑖𝑧𝑎𝑡𝑖𝑜𝑛(𝐽/𝑔)
∆Hmo : 𝑇ℎ𝑒 ℎ𝑒𝑎𝑡 𝑜𝑓 𝑚𝑒𝑙𝑡𝑖𝑛𝑔 𝑖𝑓 𝑡ℎ𝑒 𝑝𝑜𝑙𝑦𝑚𝑒𝑟 𝑤𝑒𝑟𝑒 100%𝐶𝑟𝑦𝑠𝑡𝑎𝑙𝑙𝑖𝑛𝑒(𝐽/𝑔).
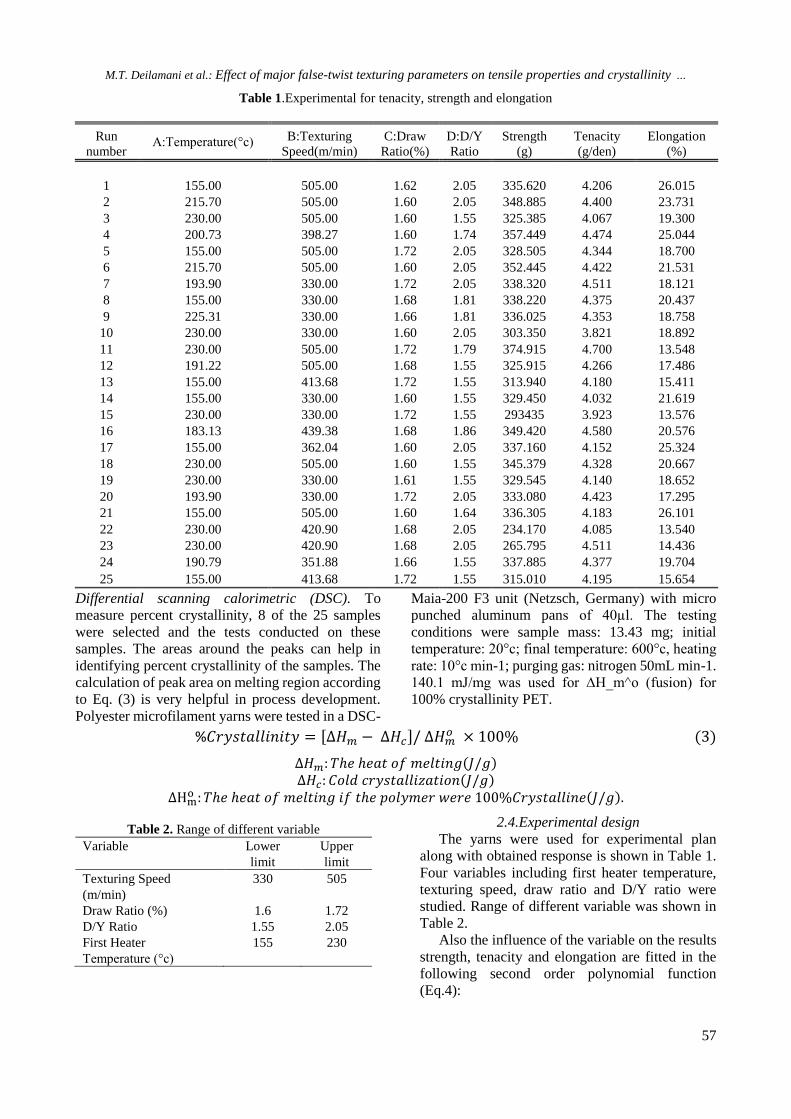
Table 2. Range of different variable
Variable Lower
limit
Upper
limit
Texturing Speed
(m/min)
330 505
Draw Ratio (%) 1.6 1.72
D/Y Ratio 1.55 2.05
First Heater
Temperature (°c)
155 230
2.4.Experimental design
The yarns were used for experimental plan
along with obtained response is shown in Table 1.
Four variables including first heater temperature,
texturing speed, draw ratio and D/Y ratio were
studied. Range of different variable was shown in
Table 2.
Also the influence of the variable on the results
strength, tenacity and elongation are fitted in the
following second order polynomial function
(Eq.4):
Elongation
(%)
Tenacity
(g/den)
Strength
(g)
D:D/Y
Ratio
C:Draw
Ratio(%)
B:Texturing
Speed(m/min) A:Temperature(°c) Run
number
26.015 4.206 335.620 2.05 1.62 505.00 155.00 1
23.731 4.400 348.885 2.05 1.60 505.00 215.70 2
19.300 4.067 325.385 1.55 1.60 505.00 230.00 3
25.044 4.474 357.449 1.74 1.60 398.27 200.73 4
18.700 4.344 328.505 2.05 1.72 505.00 155.00 5
21.531 4.422 352.445 2.05 1.60 505.00 215.70 6
18.121 4.511 338.320 2.05 1.72 330.00 193.90 7
20.437 4.375 338.220 1.81 1.68 330.00 155.00 8
18.758 4.353 336.025 1.81 1.66 330.00 225.31 9
18.892 3.821 303.350 2.05 1.60 330.00 230.00 10
13.548 4.700 374.915 1.79 1.72 505.00 230.00 11
17.486 4.266 325.915 1.55 1.68 505.00 191.22 12
15.411 4.180 313.940 1.55 1.72 413.68 155.00 13
21.619 4.032 329.450 1.55 1.60 330.00 155.00 14
13.576 3.923 293435 1.55 1.72 330.00 230.00 15
20.576 4.580 349.420 1.86 1.68 439.38 183.13 16
25.324 4.152 337.160 2.05 1.60 362.04 155.00 17
20.667 4.328 345.379 1.55 1.60 505.00 230.00 18
18.652 4.140 329.545 1.55 1.61 330.00 230.00 19
17.295 4.423 333.080 2.05 1.72 330.00 193.90 20
26.101 4.183 336.305 1.64 1.60 505.00 155.00 21
13.540 4.085 234.170 2.05 1.68 420.90 230.00 22
14.436 4.511 265.795 2.05 1.68 420.90 230.00 23
19.704 4.377 337.885 1.55 1.66 351.88 190.79 24
15.654 4.195 315.010 1.55 1.72 413.68 155.00 25
M.T. Deilamani et al.: Effect of major false-twist texturing parameters on tensile properties and crystallinity …
58
𝑅𝑒𝑠𝑝𝑜𝑛𝑠𝑒 = 𝑏𝑜+ ∑ bi 𝑋i + ∑ 𝑏𝑖𝑗 𝑋i𝑋j + ∑ 𝐶𝑖 𝑋i2 i ≥ j i = 1,2,3,4 (4)
In this equation, b_0 is an independent term
according to the mean value of the experimental
plan, b_(i )are regression coefficients that explain
the influence of the variables in their linear form,
b_ij are regression coefficients of the interaction
terms between variables and C_i are the coefficient
of quadratic form of variables [18]. The estimation
equation regression coefficients b_0 , b_ij, C_i
along with determination coefficient R for strength,
tenacity and elongation are presented in Table 3, 4
and 5.
Table3. Regression coefficient and determination coefficient of tenacity.
38.21528- 𝒃𝟎
0.20252 𝒃𝟏
0.035193 𝒃𝟐
16.71213 𝒃𝟑
19.65857 𝒃𝟒
-0.090206 𝒃𝟏𝟑
-1.47892E-004 𝒄𝟏
4.13842E-005 𝒄𝟐
-5.47912 𝒄𝟒
Table 4.Regression coefficient and determination coefficient of strength
-2452.51750 𝒃𝟎
14.77598 𝒃𝟏
-2.83234 𝒃𝟐
1041.97855 𝒃𝟑
1489.68916 𝒃𝟒
-6.63216 𝒃𝟏𝟑
-0.010763 𝒄𝟏
3.3222723E-003 𝒄𝟐
-415.43308 𝒄𝟒
Table 5.Regression coefficient and determination coefficient of elongation
157.68034- 𝒃𝟎
0.42356 𝒃𝟏
0.30459 𝒃𝟐
-38.58599 𝒃𝟑
179.09705 𝒃𝟒
-2.31895E-004 𝒃𝟏𝟐
-1.16336E-003 𝒃𝟏𝟑
-0.080321 𝒃𝟏𝟒
-0.18034 𝒃𝟐𝟑
2.64383E-003 𝒃𝟐𝟒
-4.05347 𝒃𝟑𝟒
-6.23757E-004 𝒄𝟏
4.13646E-005 𝐜𝟐
18.05989 𝒄𝟑
-43.05953 𝒄𝟒
3.RESULTS AND DISCUSSION
3.1.Yarns denier
The yarns denier are given in Table 6.
Increasing draw ratio led to decreased yarn denier
and greatly influenced the yarn denier. In addition,
increasing texturing speed had a significant effect
on yarn denier. Upon increasing polymer chain
stretch, the yarn would be arranged together
(aligned) in an orderly fashion and this order would
Tenacity coefficient Tenacity
Strength coefficient Strength
Elongation coefficient Elongation
M.T. Deilamani et al.: Effect of major false-twist texturing parameters on tensile properties and crystallinity …
59
result in reduced yarn diameter. At greater yarn
temperatures, the chains had greater freedom of
movement. Increased draw ratio combined with
increased temperature contributed to reducing yarn
denier.
Table 6.Denier of samples
Run 1 2 3 4 5 6 7 8 9 10 11 12
Count 79.78 79.3 80.02 79.9 75.1 79.74 75.02 77.29 77.19 79.38 74.3 76.33 Run 13 14 15 16 17 18 19 20 21 22 23 24 25
Count 75.13 81.7 74.86 76.25 81.14 79.83 79.58 75.27 80.33 78.88 75.68 77.21 75.06
3.2. Strength and Tenacity
Ghosh and Wolhar [12] and Pal et al. [10] found
that textured yarn tenacity increase when the draw
ratio is increase. Gupta et al. [15] also observed an
increase in tenacity with an increase in tension.
Overall, studies show that increasing draw ratio
would increase the microfilament polyester fiber
strength. In addition, increasing draw ratio also
increased the draw tenacity of the fibers. The
primary heater temperature also played a significant
role in this regard, i.e., greater temperatures led to
increased fiber strength and tenacity. In this study
similar result were obtained and the analysis of
variance (ANOVA) for tenacity and strength is given
in Tables 7 and 8.
Table 7. ANOVA for response surface quadratic model (Tenacity)
P-Value prob>F F Value Mean square DF sum of squares source
0.0396 2.77 0.20 8 1.62 Model
0.0287 5.78 0.42 1 0.42 A-Temp
0.4084 0.72 0.053 1 0.053 B-speed
0.5689 0.34 0.025 1 0.025 C-Ratio
0.7930 0.071 5.203E-003 1 5.203E-003 D-D/Y
0.0198 6.70 0.49 1 0.49 Ac
0.0498 4.50 0.33 1 0.33 A2
0.0320 5.52 0.40 1 0.40 B2
0.0301 5.67 0.41 1 0.41 D2
0.073 16 1.17 Residual
0.0814 3.66 0.095 11 1.04 Lack of fit
0.026 5 0.13 Raw Error
24 2.79 cor.total
Table 8.ANOVA for response surface quadratic model (Strength)
P-Value prob>F F Value Mean square DF sum of
squares source
0.0112 3.79 1671.29 8 13370.30 Model
0.0127 7.86 3465.59 1 3465.59 A-Temp
0.3673 0.86 379.53 1 379.53 B-speed
0.0160 7.25 3198.26 1 3198.26 C-Ratio
0.7648 0.093 40.84 1 40.84 D-D/Y
0.0262 6.00 2647.24 1 2647.24 Ac
0.0642 3.95 1743.14 1 1743.14 A2
0.0272 5.91 2605.31 1 2605.31 B2
0.0336 5.40 2380.73 1 2380.73 D2
440.89 16 7054.18 Residual
0.0690 4.00 575.78 11 6333.60 Lack of fit
144.12 5 720.59 Raw Error
24 20424.49 cor.total
M.T. Deilamani et al.: Effect of major false-twist texturing parameters on tensile properties and crystallinity …
60
It can be concluded that all terms in this model
are significant. According to the ANOVA result,
the fitted model for tenacity is Eq. 5:
𝑻𝒆𝒏𝒂𝒄𝒊𝒕𝒚 = +(−𝟑𝟖. 𝟐𝟏𝟓𝟐𝟖) + (𝟎. 𝟐𝟎𝟐𝟓𝟐 × 𝑨) + (𝟎. 𝟎𝟑𝟓𝟏𝟗𝟑 × 𝑩) + (𝟏𝟔. 𝟕𝟏𝟐𝟏𝟑 × 𝑪)
+ (𝟏𝟗. 𝟔𝟓𝟖𝟓𝟕 × 𝑫) + (−𝟎. 𝟎𝟗𝟎𝟐𝟎𝟔 × 𝑨 × 𝑪) + (−𝟏. 𝟒𝟕𝟖𝟗𝟐𝑬 − 𝟎𝟎𝟒 × 𝑨𝟐)
+ (𝟒. 𝟏𝟑𝟖𝟒𝟐𝑬 − 𝟎𝟎𝟓 × 𝑩𝟐) + (−𝟓. 𝟒𝟕𝟗𝟏𝟐 × 𝑫𝟐 )
(𝟓)
And the fitted model for strength is Eq. 6:
𝑺𝒕𝒓𝒆𝒏𝒈𝒕𝒉 = +(−𝟐𝟒𝟓𝟐. 𝟓𝟏𝟕𝟓𝟎) + (𝟏𝟒. 𝟕𝟕𝟓𝟗𝟖 × 𝑨) + (−𝟐. 𝟖𝟑𝟐𝟑𝟒 × 𝑩)
+ (𝟏𝟎𝟒𝟏. 𝟗𝟕𝟖𝟓𝟓 × 𝑪) + (𝟏𝟒𝟖𝟗. 𝟔𝟖𝟗𝟏𝟔 × 𝑫) + (−𝟔. 𝟔𝟑𝟐𝟏𝟔 × 𝑨 × 𝑪)
+ (−𝟎. 𝟎𝟏𝟎𝟕𝟔𝟑 × 𝑨𝟐) + (𝟑. 𝟑𝟐𝟕𝟐𝟑𝐄 − 𝟎𝟎𝟑 × 𝑩𝟐)
+ (−𝟒𝟏𝟓. 𝟒𝟑𝟑𝟎𝟖
× 𝑫𝟐 ) (𝟔)
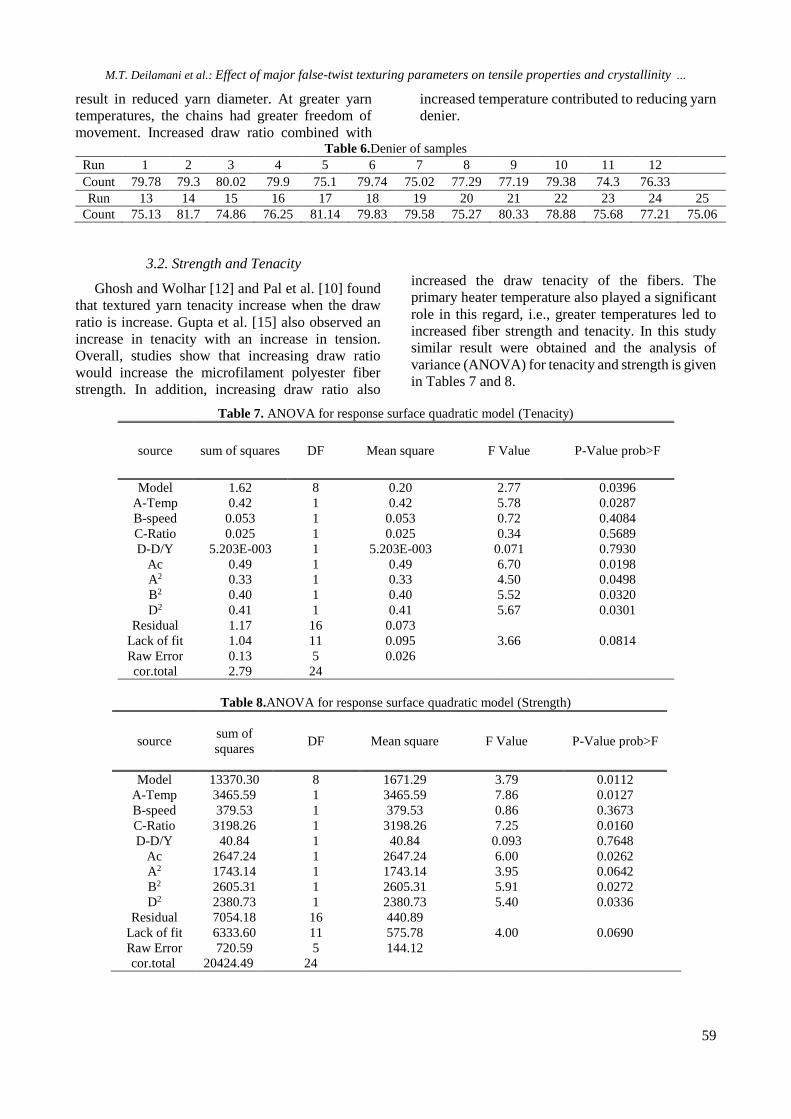
In this equation A, B, C and D are temperature
(°c), texturing speed (m\min), draw ratio (%) and
D/Y ratio, respectively. The response surface of the
model for tenacity shows in Figure 2. by using
design expert package software the optimum design
point with total desirability of 100% is: 203.53 °c
temperature, 343.54 m/min texturing speed, 1.63%
draw ratio and 1.88 for D/Y.
Figure 2. 3D plot of A and C with their continue plot (tenacity).
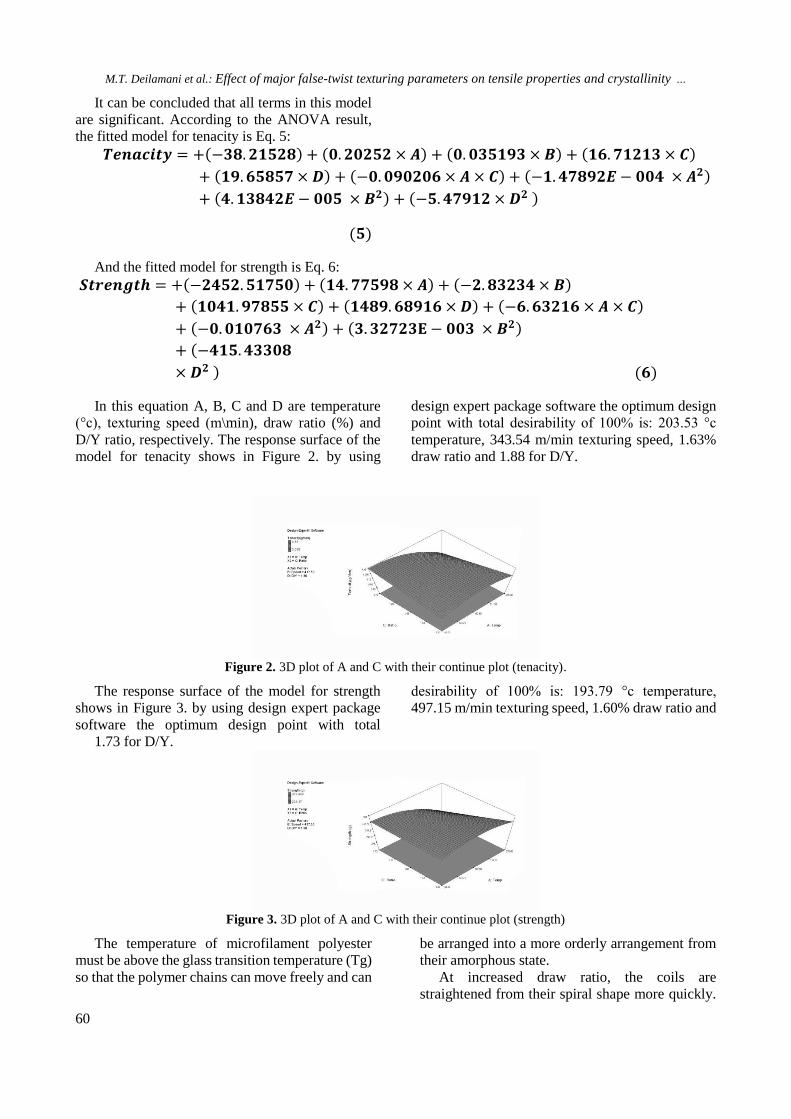
The response surface of the model for strength
shows in Figure 3. by using design expert package
software the optimum design point with total
desirability of 100% is: 193.79 °c temperature,
497.15 m/min texturing speed, 1.60% draw ratio and
1.73 for D/Y.
Figure 3. 3D plot of A and C with their continue plot (strength)
The temperature of microfilament polyester
must be above the glass transition temperature (Tg)
so that the polymer chains can move freely and can
be arranged into a more orderly arrangement from
their amorphous state.
At increased draw ratio, the coils are
straightened from their spiral shape more quickly.
M.T. Deilamani et al.: Effect of major false-twist texturing parameters on tensile properties and crystallinity …
61
Simultaneously with temperature increase, the
chains assume a more ordered arrangement and
lateral bonds are formed between the ordered
chains. Since the POY yarn is raw, simultaneous
tension and heat have a greater effect on the tensile
properties of the yarn as compared to the other two
parameters. The other important point is greater
twist which can reduce the artificial orientation. In
other words, if D/Y exceeds the normal limit, then
it can very slightly reduce artificial orientation.
3.3 Elongation
Elongation decreases with increasing strength.
The experimental results clearly show that the first
heater temperature has an insignificant influence
on the yarn count, tenacity and elongation. In this
study similar result were obtained and the analysis
of variance (ANOVA) for tenacity and strength is
given in Table 9.
It can be concluded that all terms in this model
are significant. According to the ANOVA result,
the fitted model for tenacity is Eq. 7:
𝑬𝒍𝒐𝒏𝒈𝒂𝒕𝒊𝒐𝒏 = +(−𝟏𝟓𝟕. 𝟔𝟖𝟎𝟑𝟒) + (𝟎. 𝟒𝟐𝟑𝟓𝟔 × 𝑨) + (𝟎. 𝟑𝟎𝟒𝟓𝟗 × 𝑩) + (−𝟑𝟖. 𝟓𝟖𝟓𝟗𝟗 × 𝑪)
+ (𝟏𝟕𝟗. 𝟎𝟗𝟕𝟎𝟓 × 𝑫) + (−𝟐. 𝟑𝟏𝟖𝟗𝟓𝐄 − 𝟎𝟎𝟒 × 𝑨 × 𝑩) + (−𝟏. 𝟏𝟔𝟑𝟑𝟔𝐄 − 𝟎𝟎𝟑 × 𝑨 × 𝑪)
+ (−𝟎. 𝟎𝟖𝟎𝟑𝟐𝟏 × 𝑨 × 𝑫) + (−𝟎. 𝟏𝟖𝟎𝟑𝟒 × 𝑩 × 𝑪) + (𝟐. 𝟔𝟒𝟑𝟖𝟑𝐄 − 𝟎𝟎𝟑 × 𝑩 × 𝑫)
+ (−𝟒. 𝟎𝟓𝟑𝟒𝟕 × 𝑪 × 𝑫) + (−𝟔. 𝟐𝟑𝟕𝟓𝟕𝐄 − 𝟎𝟎𝟒 × 𝑨𝟐) + (𝟒. 𝟏𝟑𝟔𝟒𝟔𝐄 − 𝟎𝟎𝟓 × 𝑩𝟐)
+ (𝟏𝟖. 𝟎𝟓𝟗𝟖𝟗 × 𝑪𝟐)(−𝟒𝟑. 𝟎𝟓𝟗𝟓𝟑
× 𝑫𝟐 ) (𝟕)
Table 9. ANOVA for response surface quadratic model (Elongation)
P-Value
prob>F F Value Mean square DF sum of squares source
<0.0001 15.20 24.32 14 340.51 Model
<0.0001 51.61 82.56 1 82.56 A-Temp
0.9773 8.545E-004 1.367E-003 1 1.367E-003 B-speed
<0.0001 131.86 210.95 1 210.95 C-Ratio
0.0305 6.34 10.14 1 10.14 D-D/Y
0.0682 4.18 6.68 1 6.68 AB
0.9945 4.955E-005 7.927E-005 1 7.927E-005 AC
0.0739 3.98 6.37 1 6.37 AD
0.0297 6.41 10.26 1 10.26 BC
0.8749 0.026 0.042 1 0.042 BD
0.8681 0.029 0.046 1 0.046 CD
0.1070 3.14 5.02 1 5.02 A2
0.6697 0.19 0.31 1 0.31 B2
0.9271 8.809E-003 0.014 1 0.014 C2
0.0033 14.68 23.49 1 23.49 D2
1.60 10 16.00 Residual
0.1355 2.88 2.37 5 11.87 Lack of fit
0.83 5 4.13 Raw Error
24 356.51 cor.total
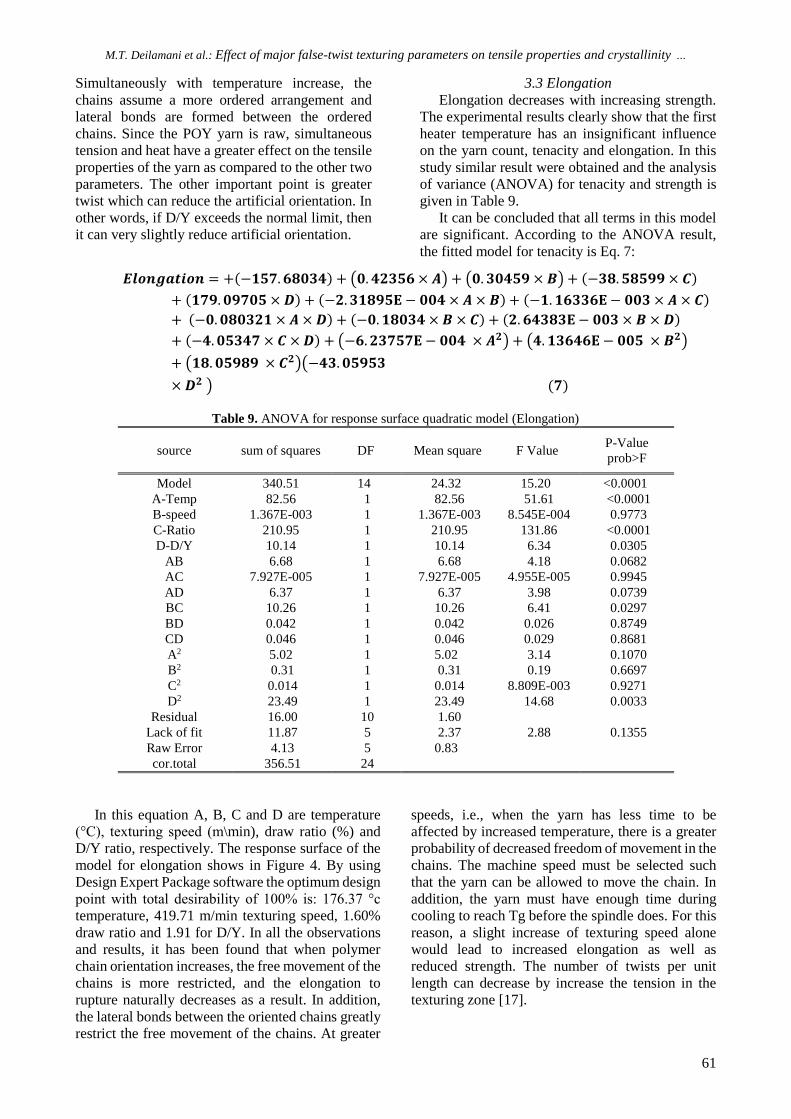
In this equation A, B, C and D are temperature
(°C), texturing speed (m\min), draw ratio (%) and
D/Y ratio, respectively. The response surface of the
model for elongation shows in Figure 4. By using
Design Expert Package software the optimum design
point with total desirability of 100% is: 176.37 °c
temperature, 419.71 m/min texturing speed, 1.60%
draw ratio and 1.91 for D/Y. In all the observations
and results, it has been found that when polymer
chain orientation increases, the free movement of the
chains is more restricted, and the elongation to
rupture naturally decreases as a result. In addition,
the lateral bonds between the oriented chains greatly
restrict the free movement of the chains. At greater
speeds, i.e., when the yarn has less time to be
affected by increased temperature, there is a greater
probability of decreased freedom of movement in the
chains. The machine speed must be selected such
that the yarn can be allowed to move the chain. In
addition, the yarn must have enough time during
cooling to reach Tg before the spindle does. For this
reason, a slight increase of texturing speed alone
would lead to increased elongation as well as
reduced strength. The number of twists per unit
length can decrease by increase the tension in the
texturing zone [17].
M.T. Deilamani et al.: Effect of major false-twist texturing parameters on tensile properties and crystallinity …
62
Figure 4. 3D plot of A and C with their continue plot (elongation)
Sassaki et al. claimed that the decrease in twist
was related to yarn elongation. According to Du and
Hearle [14], texturing yarn twist becomes higher
with increase draw ratio and yarn texturing twist
reaches its maximum at a certain level of D/Y ratio
(around 1.6). The draw ratio affects the yarn twist
level through the change in yarn radius. Besides, the
tension can be suppressed by the torsional and
bending stresses and increase molecular orientation
when draw ratio increase [17].
3.3.Degree of crystallinity
To measure percent crystallinity and discuss this
parameter, 8 samples were selected and the
variations of the main false-twist texturing
parameters on these 8 samples were studied. The
percentage crystallinity of the textured filament
yarns decrease with increasing twist amount, which
is determined by D/Y ratio [10]. However, any
noticeable difference could not be observed for draw
ratio, D/Y ratio and they interaction on crystallinity
[1]. The thermal behaviors of 8 samples obtained by
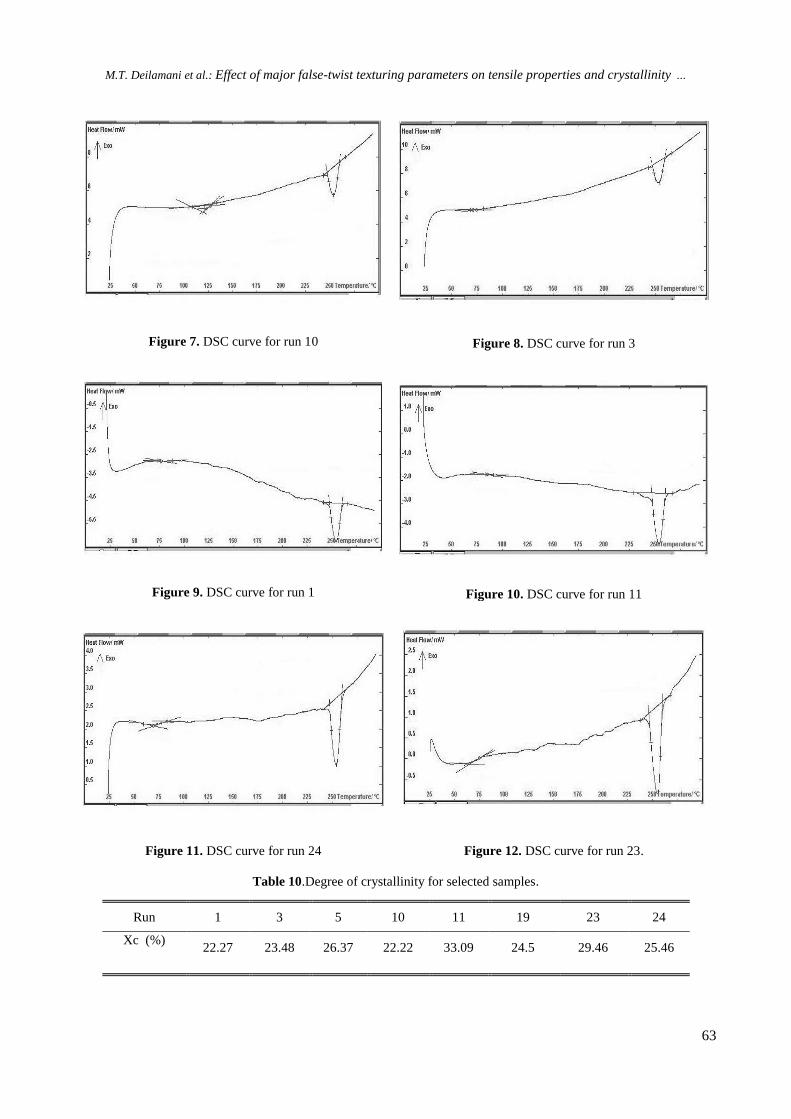
DSC curves are shown in Figure 5-12.
Then degree of crystallinity calculated from this
curves. The results can be obtained from DSC curves
as listed in Table 10This Table shows the maximum
amount of crystallinity between 8 samples at the run
11 that the first heater temperature and draw ratio
were high and the minimum amount of crystallinity
between 8 samples at the run 10 that draw ratio was
minimum amount. Increasing the first heater
temperature and draw had the greatest effect on the
polyester yarn percent crystallinity. Percent
crystallinity increased with increase tenacity. Due to
the ordered molecular chains and the fact that they
were aligned and had lateral bonds, their percent
crystallinity increased. In addition, increasing
temperature also allowed greater freedom of
movement in the chains and increased their
crystallinity. Increasing D/Y which increases twist
can break the chains in the crystals, leading to
increased disorderliness. If texturing speed exceeds
the optimum limit, the yarn heating time is reduced
and this can slightly reduce crystal formation.
Figure 5. DSC curve for run 19
Figure 6. DSC curve for run 5
M.T. Deilamani et al.: Effect of major false-twist texturing parameters on tensile properties and crystallinity …
63
Figure 7. DSC curve for run 10
Figure 8. DSC curve for run 3
Figure 9. DSC curve for run 1
Figure 10. DSC curve for run 11
Figure 11. DSC curve for run 24
Figure 12. DSC curve for run 23.
Table 10.Degree of crystallinity for selected samples.
24 23 19 11 10 5 3 1 Run
25.46 29.46 24.5 33.09 22.22 26.37 23.48 22.27 Xc (%)
64
4. CONCLUSION
The effect of 4 important parameters on tensile
properties and degree of crystallinity of the false-
twist textured microfilament polyester yarn were
studied. We produced 25 samples yarn with RSM
experimental plane. Statistical analysis showed that
the selected components were highly logical and
suitable for evaluation, and that they greatly
influenced the determined parameters. The greatest
effect was due to the primary heater temperature and
draw ratio which highly influenced the tensile
properties as well as crystallinity. Simultaneous
increase of heater temperature and POY yarn tension
led to greater orientation of the molecular chains,
and consequently, increased crystallinity. Increased
orientation in turn led to increased strength and
decreased elongation to rupture. Optimum level of 4
texturing parameters for best tenacity obtained at
203.53°C temperature, 343.54 m/min texturing
speed, 1.63% draw ratio and 1.88 for D/Y and at this
level the tenacity is 4.58187 g/den. Optimum level
of 4 texturing parameters for best strength obtained
at 193.79 °c temperature, 497.15 m/min texturing
speed, 1.60% draw ratio and 1.73 for D/Y and at this
level the strength is 365.038 g and finally optimum
level for best elongation obtained at 176.37 °c
temperature, 419.71 m/min texturing speed, 1.60%
draw ratio and 1.91 for D/Y and at this level the
elongation is 26.2205%.
Increasing texturing speed led to decreased
exposure of the yarn to heat in the heater, thus
reducing the possibility of heating the chains and
increasing orientation. Increase D/Y ratio to the
optimum limit somewhat reduced filament rupture.
In addition, orientation reduced perceptibly as D/Y
increased. This was due to the bending and torsional
stresses applied to the yarn. Degree of crystallinity
increase with increase draw ratio and first heater
temperature to optimum and after optimum amount
maybe decrease slowly. Overall, through test design
and statistical analysis, we can examine the exact
effects of these factors; and their effect is fully
perceptible.
Acknowledgement. The authors gratefully
acknowledge the support from Forghani Textile
Group (Iran) for allowing them to use the
texturing machine, laboratory and their kind
permission for the study.
REFERENCES
1. K. Yildirim, S. Altun, Y. Ulcay, Jeff J., 4, 26 (2009).
2. J. W.S. Hearle, L. Hollick, D.K. Wilson, Yarn
Texturing Technology; Woodhead Publ.; Cambridge,
2001.
3. H.H. Heuvel, R. Huismann, J. Appl. Poly Sci., 22, 299
(1978).
4. J. Shimizu, K. Toriumi, K. Tamai, Sen-i Gakkaishi, 33,
T-208 (1977).
5. C.L. Change, K.W. Yeung, Z.Y. Cui, R. J. Tex. App.,
1, 1, (1997).
6. M.D. Teli, Polyester Microfibre Fabric; J. T. A.,
March-April 1999, pp. 295-299.
7. S.M. Bukinshaw, Chemical Principles of Synthetic
Fibre Dyeing (London, Blackie Academic &
Professional), Chapman& Hall, (1995), p. 194.
8. J. Shin, M. Bide, J. Soc. Dyers Color, 116, 305 (2000).
9. J.J. Thwaites, J. Text. Inst., 3, 157 (1985).
10. S.K. Pal, R.S. Ganhi, V.K. Kothari, Textile Res.J..12,
770 (1996).
11. W. Salaman, K.J. Fielder, Practical Use of
Differential Calorimetry for Plastics; In: Handbook
of Plastics Analysis; H. Lobo, J.V. Bonilla (edrs).
Marcel Dekker: New York ,2003, pp.79-109.
12. S. Ghosh, J. Wolhar, Textile Res. J., 6, 373 (1981).
13. G.W. Du, W.S. Hearl, Textile Res. J, 6, 347 (1991).
14. S. Canoglu, Fibers &Textiles Eastern Europe, 17, 35
(2009).
15. V.B. Gupta, D.B. Gupta, S.C. Mittal, Textile Res. J,
8, 446 (1978).
16. T. Sassaki, K. Kuroda, T. Suminokura, J. Textile
Match. Soc. Japan, Trans., 23, 77 (1970).
17. M. Forouharshad, M. Montazer, M.B. Moghadam, O.
Saligheh, B.Y. Roudbari, J. Appl. Poly Sci., 125,
1261 (2012).
![Using double resonance long period gratings to measure ...bcc.bas.bg/BCC_Volumes/Volume_47_Special_B_2015/... · decades [5–7]. So far the method mostly employed for FO E-Coli sensors](https://static.fdocuments.in/doc/165x107/5f401a4d5967fe696e0577b4/using-double-resonance-long-period-gratings-to-measure-bccbasbgbccvolumesvolume47specialb2015.jpg)