
Effect of Loading Rates on Short-Beam Shear Testing of Fiberglass Reinforced Polyester Sucker-Rods
13
0/13 ENGT 3303 Effect of Loading Rates on Short-Beam Shear Testing of Fiberglass Reinforced Polyester Sucker-Rods C.G. Cruz 24 SEP 2014 Abstract One of the quality testing methods of fiberglass reinforced sucker-rods is measuring the interlaminar shear rate by applying a constant load on a specimen. In testing of these parts different loading rates are used yielding different results in the lab. Our test is to determine whether loading rate has a direct effect on final strength and if so, if it is statistically relevant. The method in which we tested involved and ASTM standard short-beam shear test to measure interlaminar shear rate with loading rates of 0.4 in/min, 0.2 in/min, and 0.05 in/min. Five Specimens are tested for each loading rate and data is recorded and analyzed to determine variance. Testing determined that loading rate did have a direct effect on final strength and that it was statistically relevant. Examination of data determined that 0.2 in/min yielded the closest set of data with only .95% variance and that the ASTM testing standard of 0.05 in/min yielded the greatest variance with 1.57%. Further analysis of the ASTM standard test reviled possible discrepancies in the exceptions we made to accommodate our specimen of sucker-rod. Further testing must be conducted in order to prove the exceptions made to the ASTM standard account for final strength variance under different loading rates. A ratio concept is talked about as a possible testing model. Introduction Fibergrate Composite Structures Company in Stephenville, Texas is currently testing a new fiberglass composite sucker-rod to be used predominantly in the oil field industry. New fiberglass reinforced material in this application offers certain strength, weight, and chemical resistance improvements over the current steel sucker-rod in use by industry today. As development and larger production of sucker-rod moves forward, certain quality management questions must be analyzed in order to ensure a consistently strong and safe product for consumers. One of the main concerns of quality control is a consistent interlaminar shear rate that meets industry standard. The transferring of loads within the fibers that reinforce the structure is directly related to the adherence of the polymer matrix to the fibers. In order to test such adhesion, a short-beam shear test is adapted from ASTM D2344-13 (“D2344”) [1]. In testing the material, three different loading rates have been used yielding different but similar results. In some loading scenarios, the measured interlaminar shear of fiber- reinforced composites can be affected by the loading rate that is applied during a test such as the short beam shear test. Our Hypothesis is that different loading rates during a short-beam shear test have a direct effect on part failure measurements and if so, if it is statistically relevant. Further testing will determine the effects of strain rate on the interlaminar shear properties of Fibergrate sucker rod due to loading rates of 0.4, 0.2 and 0.05 inches per minute.
-
Upload
christopher-cg-cruz -
Category
Documents
-
view
115 -
download
0
Transcript of Effect of Loading Rates on Short-Beam Shear Testing of Fiberglass Reinforced Polyester Sucker-Rods

0/13
ENGT 3303
Effect of Loading Rates on Short-Beam
Shear Testing of Fiberglass
Reinforced Polyester Sucker-Rods C.G. Cruz
24 SEP 2014
Abstract
One of the quality testing methods of fiberglass reinforced sucker-rods is measuring the
interlaminar shear rate by applying a constant load on a specimen. In testing of these parts different
loading rates are used yielding different results in the lab. Our test is to determine whether loading rate
has a direct effect on final strength and if so, if it is statistically relevant. The method in which we tested
involved and ASTM standard short-beam shear test to measure interlaminar shear rate with loading
rates of 0.4 in/min, 0.2 in/min, and 0.05 in/min. Five Specimens are tested for each loading rate and
data is recorded and analyzed to determine variance. Testing determined that loading rate did have a
direct effect on final strength and that it was statistically relevant. Examination of data determined that
0.2 in/min yielded the closest set of data with only .95% variance and that the ASTM testing standard of
0.05 in/min yielded the greatest variance with 1.57%. Further analysis of the ASTM standard test reviled
possible discrepancies in the exceptions we made to accommodate our specimen of sucker-rod. Further
testing must be conducted in order to prove the exceptions made to the ASTM standard account for
final strength variance under different loading rates. A ratio concept is talked about as a possible testing
model.
Introduction
Fibergrate Composite Structures Company in Stephenville, Texas is currently testing a new
fiberglass composite sucker-rod to be used predominantly in the oil field industry. New fiberglass
reinforced material in this application offers certain strength, weight, and chemical resistance
improvements over the current steel sucker-rod in use by industry today. As development and larger
production of sucker-rod moves forward, certain quality management questions must be analyzed in
order to ensure a consistently strong and safe product for consumers. One of the main concerns of
quality control is a consistent interlaminar shear rate that meets industry standard. The transferring of
loads within the fibers that reinforce the structure is directly related to the adherence of the polymer
matrix to the fibers. In order to test such adhesion, a short-beam shear test is adapted from ASTM
D2344-13 (“D2344”) [1]. In testing the material, three different loading rates have been used yielding
different but similar results. In some loading scenarios, the measured interlaminar shear of fiber-
reinforced composites can be affected by the loading rate that is applied during a test such as the short
beam shear test. Our Hypothesis is that different loading rates during a short-beam shear test have a
direct effect on part failure measurements and if so, if it is statistically relevant. Further testing will
determine the effects of strain rate on the interlaminar shear properties of Fibergrate sucker rod due to
loading rates of 0.4, 0.2 and 0.05 inches per minute.

Effect of Loading Rates on Short-Beam Shear Testing of Fiberglass Reinforced Polyester Sucker-Rods C.G. Cruz 9/24/2014
1/13
Literature Review
Prior to testing, further background on the product and testing methods were gathered in order
to adequately analyze the results and understand the material that was being investigated. Research
gathered included: 1) Background on glass fiber production, data and properties in fiberglass reinforced
plastics. 2) Background on the pultrusion manufacturing process, resin impregnation, pulling systems,
finishing methods and reinforcement performance. 3) Characterization of physical and mechanical
properties of fiber glass composites in other tests. 4) Effects of loading rates on ultimate strengths in
other composite testing.
In order to effectively analyze what is happening physically and chemically within our specimen
during testing, a deeper understanding of fiberglass reinforced plastics must obtained. This was done by
reviewing a glass fiber reinforcements section of Fundamentals of Composites Manufacturing [2].
Once a better understanding of the material was achieved, an insight into how the specimen
was manufactured was needed. Prior specs from Fibergrate indicated that the fiberglass-reinforced
composites were produced using a basic pultrusion process. Although a basic understanding of the
pultrusion processes is known, deeper insight into the method was gained in order to ensure that all
variables in the specimen are considered. Information into the process was gathered in the pultrusion
section of Fundamentals of Composites Manufacturing [3].
After reviewing both the basic properties of fiberglass-reinforced composites and the
manufacturing of the specimen, the question arose of whether similar testing has been done into the
loading rates on shear strength in similar material. After reviewing the Tarleton State University
collection of scientific journals, several promising articles were reviewed in order to determine
relevancy. The first of these reports was the Characterization of Physical, Mechanical and Fire properties
of Fiber Glass Composite due to Weight fraction [4]. Although this article did not discuss the short-beam
shear test it was helpful in discussing the effect of material selection and ratio of fiberglass
reinforcements/ polyester composites, as well as, an in-depth look at controlled testing methods of
materials and their reactions.
The second article, Effect of the Loading Rate on Ultimate Strength of Composites [5], analyzed
the breaking loads of a pressurized fiber composite vessel in a slow burst test. This test showed a
positive correlation in loading rates versus specimen failures. Although little data from this test can be
directly applied to our testing, positive background into stress transfers in a matrix between fiberglass
reinforcements is gained. Understanding and insight into the viscoelastic nature of certain fiberglass
reinforced plastics can also be gathered from the article and can be applied as knowledgeable
background to the test as well.

Effect of Loading Rates on Short-Beam Shear Testing of Fiberglass Reinforced Polyester Sucker-Rods C.G. Cruz 9/24/2014
2/13
Although no articles were obtained that encompassed a more direct relevancy to our testing,
strong background into the nature of our material, its manufacturing processes, and similar testing
behaviors, provided us with a healthy understanding of our specimen allowing us to make more credible
observations.
Methodology
Testing Machine- The testing machine used was a Page-Wilson testing machine
calibrated using D2344 standards [6].
Loading Nose and Supports- An exception to the ASTM standards was made in this
aspect. D2344 calls for certain flat or curved supports to match a flat or curved
specimen. However, our specimen is a cylindrical object with a diameter of .995.
Because of this, a loading nose and two supports were fabricated to match the
specimen. Complete dimensional specifications for loading nose and supports where not
gathered for this test but can be obtained from Fibergrate Composite Structures
Company. Set up dimensions and inside loading diameter are shown Figure 1 below:
Figure 1
Measurements- All dimensional measurements were taken using a dial caliper that has
been calibrated by an accredited organization when purchased.
Environment- The environment for testing was maintained at ambient testing laboratory
conditions and constant operating temperature as described in D2344 [6].
Sampling- Five specimens were tested for each of the three loading rates. Each
specimen was loaded the same orientation into the machine, measured for dimensional
consistency, labeled appropriately to ensure data matched specimen and photos of
failure were taken for visual analysis.

Effect of Loading Rates on Short-Beam Shear Testing of Fiberglass Reinforced Polyester Sucker-Rods C.G. Cruz 9/24/2014
3/13
Specimen Geometry- The geometry of the test specimen differed from the ASTM
specification. Instead of testing a small section of flat or curved material, a section of the
sucker-rod being produced was tested for quality management. The geometry of test
specimens is described in Figure 2 below:
Figure 2
Specimen Material- All specimens were produced from the same material, the same
day, same time, and from the same machine. Each was virtually identical and did not
show any visual abnormalities upon prior examination. The material is a fiberglass
reinforced polyester made with 77% glass that was pultruded from the same machine.
Further material properties were documented at Fibergrate but not gathered for this
test.
Configurations- All test specimens contained a marked line on the “top” of the length
side. This line represented the uppermost section of the sucker-rod as it was being
produced at Fibergrate. This line was orientated upward upon being loaded into the
machine to ensure clocking consistency.
Specimen Preparation- All specimens were prepared using the ASTM standard provided
within D2344 [7].
Speed of Testing- The speed of testing was set at a rate of crosshead movement at three
different intervals for five specimens each. The first test was done at a rate of 0.4
in/min, the second at 0.2 in/min and the third at a rate of 0.05 in/min.
Loading- Load was applied to the specimen at each specified rate wile data is recorded
ten times every second and documented using the testing machines program. Load will
be continued on the part until either of the following occurs:
o A load drop-off of 10% (This is a different amount than the specified
30% described in D2344 [8] due to material behavior)
o two-piece specimen failure, or
o the head travel exceeds the specimen nominal thickness.

Effect of Loading Rates on Short-Beam Shear Testing of Fiberglass Reinforced Polyester Sucker-Rods C.G. Cruz 9/24/2014
4/13
Data Recording- Load versus crosshead displacement data was recorded ten times a
second using testing machine software. Maximum load, final load and the load at any
obvious discontinuities in the load-displacement data were recoded per D2344 standard
[8]
Failure Recording- Visual part failures can be seen going laterally along the grain pattern
after testing. In order to record these, parts are loaded into a vise and pictures are taken
with the face of the specimen that has its identification labeled. A backlight source and
high resolution camera were used for this process.
Calculations
All formulas were obtained from D2344 [9] and calculated using an Excel Spreadsheet program
due to all data being loaded to the spreadsheet after test.
Short-Beam Strength- Short-Beam Strength was calculated using the equation that
follows:
𝑭𝒔𝒃𝒔 = 𝟎. 𝟕𝟓 ×𝑷𝒎
𝝅𝒓𝟐
Where:
𝐹𝑠𝑏𝑠 = Short-beam strength, MPa (psi) 𝑃𝑚 = Maximum load observed during the test, N (lbf) 𝑟 = Radius of specimen face *The formula for area (𝜋𝑟2) replaced the standard area equation (𝑏 × ℎ) described in the standard due
to specimen geometry.
Statistics- For each set of test specimens average value, standard deviation, and
coefficient of variation is calculated as follows:
�̅� = (∑ 𝑥𝑖
𝑛
𝑖−1
) /𝑛
𝑠𝑛−1 = √(∑ 𝑥𝑖
2 − 𝑛(�̅�)2𝑛𝑖−1 )
𝑛 − 1
𝐶𝑉 = 100 × 𝑠𝑛−1/�̅�
Where:
�̅� = Sample mean (average) 𝑠𝑛−1 = Sample standard deviation 𝐶𝑉 = Sample coefficient of variation, % 𝑛 = Number of specimens 𝑥𝑖 = Measured or derived property
Effect of Loading Rates on Short-Beam Shear Testing of Fiberglass Reinforced Polyester Sucker-Rods C.G. Cruz 9/24/2014
5/13
Results
The tests were performed on Tuesday, September 16, 2014 in the Tarleton State University
testing lab in the time span of 2:00pm-4:00pm. All coupon configurations were standard and tests were
performed by members of the Industrial Materials class of the university.
Variations to the ASTM standard test where made to accommodate the geometric nature of the
specimens and are documented in the methodology.
The material being tested is a fiberglass reinforced polyester rod that is 77% glass and is
manufactured by a pultrusion processes from Fibergrate Composite Structures in Stephenville, Texas. Its
geometry is listed in the methodology and all other material data can be obtained from the company.
Calibration dates and methods for all measurements and test equipment can be obtained
through Tarleton State University, Engineering Technology Department.
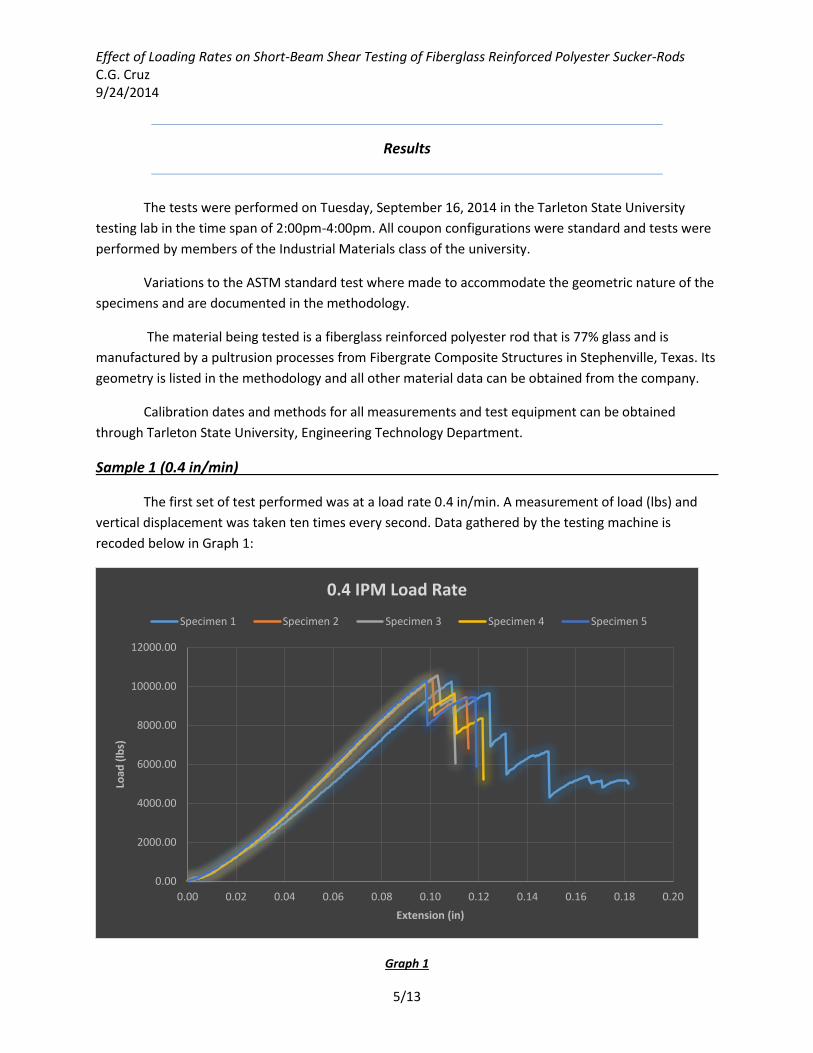
Sample 1 (0.4 in/min)
The first set of test performed was at a load rate 0.4 in/min. A measurement of load (lbs) and
vertical displacement was taken ten times every second. Data gathered by the testing machine is
recoded below in Graph 1:
Graph 1
0.00
2000.00
4000.00
6000.00
8000.00
10000.00
12000.00
0.00 0.02 0.04 0.06 0.08 0.10 0.12 0.14 0.16 0.18 0.20
Load
(lb
s)
Extension (in)
0.4 IPM Load Rate
Specimen 1 Specimen 2 Specimen 3 Specimen 4 Specimen 5

Effect of Loading Rates on Short-Beam Shear Testing of Fiberglass Reinforced Polyester Sucker-Rods C.G. Cruz 9/24/2014
6/13
The maximum loads are recorded in Table 1.1:
Table 1.1
Sample Pounds
1.) 10257
2.) 10338
3.) 10573
4.) 10527
5.) 10299
Other calculations are recorded in Table 1.2:
Table 1.2
Calculation Value
Mean 10398.8 lbs
Std. Deviation 126.9
Coef. Of Variance 1.22%
Sample 2 (0.2 in/min)
The second set of test performed was at a load rate 0.2 in/min. A measurement of load (lbs) and
vertical displacement was taken ten times every second. Data gathered by the testing machine is
recoded below in Graph 2:
Graph 2
0.00
2000.00
4000.00
6000.00
8000.00
10000.00
12000.00
0.00 0.02 0.04 0.06 0.08 0.10 0.12 0.14
Load
(lb
s)
Extension (in)
0.2 IPM Load Rate
Specimen 1 Specimen 2 Specimen 3 Specimen 4 Specimen 5
Breakage is consistent in most specimens; sample
1 from the 0.4 IPM group is shown as the most
prominent:

Effect of Loading Rates on Short-Beam Shear Testing of Fiberglass Reinforced Polyester Sucker-Rods C.G. Cruz 9/24/2014
7/13
The maximum loads are recoded in Table 2.1:
Table 2.1
Sample Pounds
1.) 10166
2.) 10144
3.) 9974
4.) 10083
5.) 9919
Other calculations are recorded in Table 2.2:
Table 2.2
Calculation Value
Mean 10057.2 lbs
Std. Deviation 95.98
Coef. Of Variance .95%
Sample 3 (0.05 in/min)
The final set of tests performed was at a load rate 0.05 in/min. A measurement of load (lbs) and
vertical displacement was taken ten times every second. Data gathered by the testing machine is
recoded below in Graph 3:
Graph 3
0.00
2000.00
4000.00
6000.00
8000.00
10000.00
12000.00
0.00 0.02 0.04 0.06 0.08 0.10 0.12 0.14
Load
(lb
s)
Extension (in)
0.05 IPM Load Rate
Specimen 1 Specimen 2 Specimen 3 Specimen 4 Specimen 5
Breakage is consistent in most specimens, sample
2 from the 0.2 IPM group is shown as the only
outlier with 3 break lines:
Effect of Loading Rates on Short-Beam Shear Testing of Fiberglass Reinforced Polyester Sucker-Rods C.G. Cruz 9/24/2014
8/13
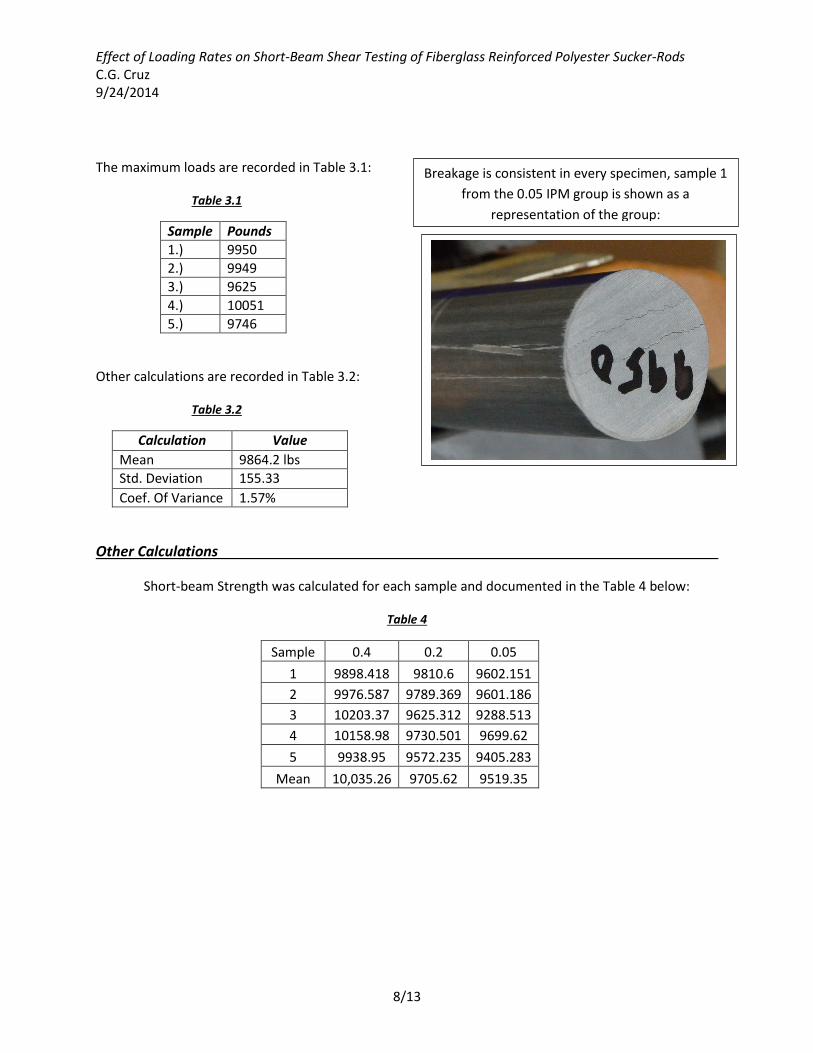
The maximum loads are recorded in Table 3.1:
Table 3.1
Sample Pounds
1.) 9950
2.) 9949
3.) 9625
4.) 10051
5.) 9746
Other calculations are recorded in Table 3.2:
Table 3.2
Calculation Value
Mean 9864.2 lbs
Std. Deviation 155.33
Coef. Of Variance 1.57%
Other Calculations
Short-beam Strength was calculated for each sample and documented in the Table 4 below:
Table 4
Sample 0.4 0.2 0.05
1 9898.418 9810.6 9602.151
2 9976.587 9789.369 9601.186
3 10203.37 9625.312 9288.513
4 10158.98 9730.501 9699.62
5 9938.95 9572.235 9405.283
Mean 10,035.26 9705.62 9519.35
Breakage is consistent in every specimen, sample 1
from the 0.05 IPM group is shown as a
representation of the group:

Effect of Loading Rates on Short-Beam Shear Testing of Fiberglass Reinforced Polyester Sucker-Rods C.G. Cruz 9/24/2014
9/13
An Analysis of Variation was also calculated using the formula provided by the ANOVA: Single
Factor function in excel. Results are as follows in Table 5:
Table 5
Anova: Single Factor
SUMMARY Groups Count Sum Average Variance
Column 1 5 51994 10398.8 20136.2 Column 2 5 50286 10057.2 11514.7 Column 3 5 49321 9864.2 30158.7
ANOVA
Source of Variation SS df MS F P-value F crit
Between Groups 732894.5333 2 366447.2667 17.7859394 0.000257624 3.885293835 Within Groups 247238.4 12 20603.2
Total 980132.9333 14
Discussion
The first testing set involved five specimens to be loaded at a rate of 0.4 in/min. The specimens
where first measured, then labeled with their designated testing set. Diameter and length were
recorded to ensure testing consistency. Each specimen proved to be equal in diameter, length and other
material properties. Visual inspection of each sample was then conducted to ensure that no chipping,
scaring or other physical deformations that would interfere with the end results existed. Upon
verification that there were no deformations of the part visible, specimen 1 was then selected to be
loaded into the machine. A blue stripe was orientated upward into the machine to ensure each part was
loaded in the same region. This stripe derived from the uppermost section of the rod as it was taken
from the pulltrusion processes. Once loaded, a constant increasing load was placed upon the specimen
until first breakage at 10257 lbs. Because the first breakage did not exceed the set 10% load drop off
weight a constant load was again applied for another four breaks. After the load drop of was met, the
machine stopped and finalized the data. The testing machine was then jogged back, to allow the part to
be removed. Once removed, the maximum load was recorded on the face end of the specimen and
loaded into a vise for pictures. This process was then repeated for specimens 2-5 that yielded maximum
loads described in Table 1.1. Specimen failure among the samples indicates a consistent lateral breakage
demonstrating positive interlaminar shear. This visually expresses the correct failure we are looking for
in this test. However, the expanse of breakage varies extensively from specimen to specimen. The
greatest outlier of which involved specimen 1 with five prominent lateral breaks. Compared to the group
average of two break lines, this indicates a great inconsistency in breaking.

Effect of Loading Rates on Short-Beam Shear Testing of Fiberglass Reinforced Polyester Sucker-Rods C.G. Cruz 9/24/2014
10/13
The second testing set again involved five specimens to be loaded at a rate of 0.2 in/min. The
same precautions, set-up, measurements and inspections took place for each specimen. Under a slower
load rate, sample 2 demonstrated similar physical qualities, demonstrating a mean maximum load value
of 10057.2 lbs. When comparing this to sample 1, we see a 341.6 lb. difference in the means. A similar
drop in value due to lower loading rate is seen in short-beam strength when comparing the means. In
this test we see a 329.64 lb. drop in short-beam strength after lowering the loading rate. The coefficient
of variance in the maximum load values also falls .27% demonstrating a more consistent grouping of
data in our test. However, visual failures of each part continue to vary in number of breaks, thickness of
gapping, and area in which failures occur among specimens.
The final testing set involved five specimens to be loaded at a rate of 0.05 in/min. The same
precautions, set-up, measurement, and inspections took place for each specimen. At the slowest loading
rate, sample 3 exhibited a considerable fall in in maximum load when compared to sample 1 (534.6 lbs.),
and sample 2 (193 lbs.). Short-beam strength was similarly lowered when compared to sample 1 (515.91
lbs.), and sample 2 (186.27 lbs.). This correlation in the reduction of final strength with lowering of
loading rates could indicate that other internal forces in the specimen are being affected with a constant
load and not just the bonding of the matrix to which we are trying to test. However, upon reviewing the
breakages in each specimen, we see a more consistent family of breaks at each face. Breaks in sample 3
are all similar in size, gapping, and area of occurrence from a purely observational standpoint.
Conversely, the coefficient of variance of these set of maximum loads are the highest out of all the
sample sets. At 1.57% the variance of maximum loads illustrates an inconsistency in data when
compared to other loading rates.
Short beam strength of each specimen in each sample collected in Table 4 was then entered into
the Anova: Single Factor function in Excel in order to give us an analysis of variance in data gathered. If
variation of each sample set proves to be statistically relevant in this function, we must reject a
hypothesis that they are the same. The threshold for this particular equation is computed as F Crit
(3.88). If F is computed to be above threshold then data is statistically relevant. The F value computed is
to be 17.785, therefore data is statistically different in variance. This supposition is shown in Table 5.
In reviewing our exceptions to the D2344 standard, certain factors changed may account for
variations of the data plot at 0.05 in/min. In D2344 the shear test is conducted on either predominately
flat or mildly curved specimens that are comparatively thin (.25in). The loading nose and supports match
the specimens in surface contact area. In measuring interlaminar shear on the thin specimens the matrix
and fibers are loaded in an even area. In our modified test we used a specimen with a diameter of .995in
and a length of 4.09in. According to D2344, the test method is not limited to dimensions of the
specimens given, but must maintain a length-to-specimen thickness ratio of 4.0 on flat specimens [10].
Further testing is required to determine if the volume of the sucker rod and loading area has a direct
effect of the shear stresses within the specimen.

Effect of Loading Rates on Short-Beam Shear Testing of Fiberglass Reinforced Polyester Sucker-Rods C.G. Cruz 9/24/2014
11/13
Conclusion
Fibergrate Composite Structures Company tests interlaminar shear rates of sections of their
new fiberglass reinforced polyester sucker-rods for quality and data analysis purposes. In testing these
samples, different loading rates have been used, thus yielding different results in the lab. The question
presented to our testing lab enquires as to if loading rates of 0.4 in/min, 0.2 in/min, and 0.05 in/min
have any direct correlation to final strengths. Our hypothesis is that different loading rates during a
short-beam shear test have a direct effect on part failure measurements.
In testing our hypothesis three sample sets were set up having five test specimens each. After
conducting testing we analyzed the data and specimens to determine a correlation and possible
reasoning. In doing so we noticed a steady fall in final strength as loading rates decreased. This fall in
strength was proven to be statistically relevant by analyzing the variance using the Anova: Single factor
function in excel shown in Table 5. Upon reviewing the coefficient of variance in each sample, the
tightest grouping of data comes from out 0.2 in/min sample set at .95%.
After reviewing our exceptions we made to D2344, we see a possible discrepancy to our
method. In the ASTM standard we test flat or curved specimens with a thickness of 0.25in to 0.08in. We
modified our test to fit a .995in diameter rod. When using the 0.05in/min loading rate that is called for
in D2344 we see a large variance in data of 1.57%, the largest of our sample sets. We propose that
further testing must be done to examine the possibility of a ratio to surface area versus loading rate. We
would do this by setting up a ratio of surface area of specimens and loading rates. Since both surface
areas of specimens are known and our ASTM specification gives us a loading rate on the thinner
specimen, we can accurate propose a ratio like the basic function below:
𝑆𝑎1
𝐿𝑟1=
𝑆𝑎2
𝐿𝑟2
Where:
𝑆𝑎1 = Surface Area of specimen 1 (𝑊𝑖𝑑𝑡ℎ × 𝑇ℎ𝑖𝑐𝑘𝑛𝑒𝑠𝑠) 𝑆𝑎2 = Surface Area of specimen 2 (𝜋𝑟2) 𝐿𝑟 = Loading Rate Further research should be done in order to find an equation that better links these two values in order to better account for other variables that are present in the test. Once the ratio is complete, a similar test to the one we performed should be conducted to test if the loading rate that comes from the ratio yields a similar variance to the standard D2344 test on a flat specimen.

Effect of Loading Rates on Short-Beam Shear Testing of Fiberglass Reinforced Polyester Sucker-Rods C.G. Cruz 9/24/2014
12/13
References
[1] ASTM International (2013) Standard Test Method for Short-Beam Strength of Polymer
Matrix Composite Materials and Their Laminates. Designation: D2344/D2344M-13
[2] Strong A. (1989) Fundamentals of Composite Manufacturing: Materials, Methods, and
Applications. Society of Manufacturing Engineers. 2nd Edition, Pp. 203-207. ISBN
0872633586
[3] Strong A. (1989) Fundamentals of Composite Manufacturing: Materials, Methods, and
Applications. Society of Manufacturing Engineers. 2nd Edition, Pp. 453-460. ISBN
0872633586
[4] Hasan E., Helal M., Nour M., Shokry K. (2014) Characterization of Physical, Mechanical and
Fire Properties of Fiber Glass Composite Due To Weight Fraction. Key Engineering
Materials. Vol. 600. Pp. 547-557. Trans Tech Publications. DOI 10.4028
[5] Bunsell A., Chou H., Mair G., Thionnet A. (2013) Effect of The Loading Rate on Ultimate
Strength of Composites. Aplication: Pressure Vessel Slow Burst Test. Composite Structures.
Elsevier BV. Vol. 104, p144. ISSN 0263-8223
[6] ASTM International (2013) Standard Test Method for Short-Beam Strength of Polymer
Matrix Composite Materials and Their Laminates. Pp.2-3 §7. Designation: D2344/D2344M-
13
[7] ASTM International (2013) Standard Test Method for Short-Beam Strength of Polymer
Matrix Composite Materials and Their Laminates. Pp.3 §8.3. Designation: D2344/D2344M-
13
[8] ASTM International (2013) Standard Test Method for Short-Beam Strength of Polymer
Matrix Composite Materials and Their Laminates. Pp.7 §11.6.1. Designation:
D2344/D2344M-13
[9] ASTM International (2013) Standard Test Method for Short-Beam Strength of Polymer
Matrix Composite Materials and Their Laminates. Pp.7 §12 Designation: D2344/D2344M-
13
[10] ASTM International (2013) Standard Test Method for Short-Beam Strength of Polymer
Matrix Composite Materials and Their Laminates. Pp.2 §5.3 Designation: D2344/D2344M-
13