Effect of Laves Phase on High-Temperature …...1 Effect of Laves phase on high-temperature...
33
Instructions for use Title Effect of Laves Phase on High-Temperature Deformation and Microstructure Evolution in an 18Cr-2Mo-0.5Nb Ferritic Stainless Steel Author(s) Ikeda, Ken-ichi; Yamoah, Nana Kwame Gyan; Reynolds, William T., Jr.; Hamada, Jun-Ichi; Murayama, Mitsuhiro Citation Metallurgical and materials transactions A : physical metallurgy and materials science, 46A(8), 3460-3469 https://doi.org/10.1007/s11661-015-2936-y Issue Date 2015-08 Doc URL http://hdl.handle.net/2115/62575 Rights The final publication is available at Springer via http://dx.doi.org/10.1007/s11661-015-2936-y Type article (author version) File Information Ikeda-MMT(46A).pdf Hokkaido University Collection of Scholarly and Academic Papers : HUSCAP
Transcript of Effect of Laves Phase on High-Temperature …...1 Effect of Laves phase on high-temperature...

Instructions for use
Title Effect of Laves Phase on High-Temperature Deformation and Microstructure Evolution in an 18Cr-2Mo-0.5Nb FerriticStainless Steel
Author(s) Ikeda, Ken-ichi; Yamoah, Nana Kwame Gyan; Reynolds, William T., Jr.; Hamada, Jun-Ichi; Murayama, Mitsuhiro
Citation Metallurgical and materials transactions A : physical metallurgy and materials science, 46A(8), 3460-3469https://doi.org/10.1007/s11661-015-2936-y
Issue Date 2015-08
Doc URL http://hdl.handle.net/2115/62575
Rights The final publication is available at Springer via http://dx.doi.org/10.1007/s11661-015-2936-y
Type article (author version)
File Information Ikeda-MMT(46A).pdf
Hokkaido University Collection of Scholarly and Academic Papers : HUSCAP

1
Effect of Laves phase on high-temperature deformation and microstructure evolution in a
18Cr-2Mo-0.5Nb ferritic stainless steel
Ken-ichi Ikeda1, Nana Kwame Gyan Yamoah2, William T. Reynolds Jr.3,
Jun-ichi Hamada4, and Mitsuhiro Murayama3*
1 formerly in the Faculty of Engineering Sciences, Kyushu University, Kasuga, Fukuoka 816-8580, Japan,
is now in the Faculty of Engineering, Hokkaido University, Sapporo, Hokkaido 060-8628, Japan.
2 formerly in Department of Materials Science and Engineering, Virginia Tech, Blacksburg, VA, 24061,
is now in Department of Mechanical Engineering, North Carolina A&T State University, Greensboro, NC,
27411.
3 Department of Materials Science and Engineering, Virginia Tech, Blacksburg, Virginia 24061.
4 Nippon Steel & Sumikin Stainless Steel Corporation, Hikari, Yamaguchi 743-8550, Japan.
* Corresponding Author: [email protected]
Abstract
Niobium-containing ferritic stainless steels are finding new applications in automotive exhaust
components because of their oxidation resistance, thermal fatigue resistance, and high-temperature
strength. The mechanical behavior of Nb-containing ferritic steels at service temperatures of
973K(700°C) and higher results from the convolution of dynamic microstructural changes including
precipitation, precipitate coarsening, strain hardening, recovery, and recrystallization. The relative
contributions of these competing processes have yet to be clarified. In this study, the high-temperature
flow strength of an 18Cr-2Mo-0.5Nb ferritic stainless steel (SUS 444) was correlated with microstructure
under different strain and initial precipitate distributions to clarify the relative role of the strengthening
and softening processes. High-temperature tensile tests at 1023K(750°C) of un-aged (initial

2
microstructure is precipitate-free) and pre-aged (initial microstructure contains precipitates) samples were
carried out and transmission electron microscopy was used to assess dislocation distributions and
precipitate morphology. The difference in the stress-strain curves between un-aged and pre-aged samples
was drastic; the yield strength of the un-aged sample was twice that of the pre-aged sample, and the un-
aged sample exhibits a noticeable yield drop. Transmission electron microscopy revealed a Laves phase
nucleated and grew during the high-temperature tensile test in the un-aged sample and the majority of the
precipitates in the pre-aged sample were the same Laves phase. Furthermore, a strain effect on precipitate
growth was recognized in un-aged and pre-aged conditions by comparing grip (no strain) and gauge
(strained) sections of tensile samples. The dominant strengthening contribution in un-aged samples is
initially the precipitate shearing mechanism and it changes to Orowan strengthening beyond the ultimate
tensile strength, whereas the dominant contribution in the pre-aged samples appears to be Orowan
strengthening throughout the stress-strain curve.
Keywords
Ferritic stainless steel, high-temperature deformation, precipitation hardening, solution hardening, Laves
phase

3
1. Introduction
Reducing weight and increasing engine efficiency are longstanding goals in the automotive
industry. Raising the operating temperature of engine exhaust manifolds and reducing their weight is one
component of this strategy. For example, conventional cast iron exhaust manifolds can be replaced by
lighter structures made of alloys with excellent thermal fatigue resistance and high-temperature strength.
Ferritic stainless steels are candidates for this application. They have good high-temperature oxidation
resistance and thermal fatigue resistance, but they suffer from low strength at elevated temperatures
compared to austenitic steels. Niobium- (Nb) containing ferritic stainless steels were developed to
overcome the lower high-temperature strength [1-3]. Niobium improves high-temperature strength and
thermal fatigue resistance by solid-solution hardening and precipitation hardening [4-9]. Fujita et al. [4]
reported that fine Nb carbo-nitrides and Nb-based Laves phase precipitates formed during high-
temperature deformation improve the strength of the alloy at 1173K(900°C). Nabiran et al. [5] reported
that the contribution due to the rapid coarsening of Laves phase precipitates to the high-temperature
strength was comparatively small. On the other hand, it was reported that Nb forms several different types
of precipitates around 900°C that could degrade high-temperature strength and thermal fatigue resistance
[6]. Morrie et al. [8] noted that rapid coarsening of the Laves phase at high temperatures significantly
reduces strength over 973K(700°C), and Sim et al. [9] reported that coarse, rod-shaped Laves phase
precipitates (Fe2Nb) formed at 973K(700°C) are very detrimental to high-temperature strength of Nb-
containing steels. With regard to practical applications, there are many studies of the thermal and fatigue
behavior [10-13] and the high-temperature deformation behavior [14-17] of high Cr stainless steels.
However, the effect of precipitates on the high-temperature deformation mechanism in high Cr stainless
steels remains unclear. The present investigation was initiated to clarify the role of precipitates on the
high-temperature deformation of high Cr, Nb-containing ferritic stainless steel (18Cr-2Mo-0.5Nb; SUS
444).
4
2. Experimental procedures
2.1 Material and high-temperature tensile test
The material used in the present study was a 18Cr-2Mo-0.5Nb ferritic stainless steel (SUS 444)
which was supplied as 2 mm thick sheet, cold-rolled, solutionized then air-cooled (designated the “un-
aged” condition). Table I shows the chemical composition of the steel. One of the sheets was heat-treated
at 1023K(750°C) for 100 hours to produce coarse, stabilized precipitates. This condition, hereafter termed
“pre-aged,” is assumed to have a near-equilibrium volume fraction of Laves phase precipitates and a
ferritic matrix depleted of Nb supersaturation. The aging treatment is meant to stabilize the microstructure
to changes in matrix supersaturation at high-temperature rather than to increase strength through
precipitation. A comparison of high-temperature deformation in un-aged samples (whose microstructure
changes dynamically) with pre-aged samples (whose microstructure is comparatively stable) provides a
means to investigate contributions to high-temperature strength in the Nb-containing ferritic stainless steel.
The grain size of both un-aged and pre-aged samples was about 50 µm. Tensile specimens with 10 mm
width, 2 mm thickness and 35 mm gauge length were prepared from the two conditions (sheets of pre-
aged and of un-aged material). Uniaxial tensile tests were performed at 750°C in air with a strain rate of 5
× 10-5 / sec to simulate the service conditions of an automotive exhaust system. Each test specimen was
heated to the 1023K(750°C) test temperature at a heating rate of 10K(100°C) / sec. Specimens were held
at 1023K(750°C) for 120 sec before the tensile load was applied. To observe the microstructure at
intermediate stages of strain, tensile tests were interrupted at various strains before failure and the test
pieces were sectioned. The interrupted strains were 0.3%, 0.9%, 3.0% and 14.3%. When a tensile test was
interrupted, the specimen was cooled to 923K(650°C) at a cooling rate of 10K(10°C) / sec, then and to
room temperature by air-cooling. Figure 1 and Table II show the thermo-mechanical history and key for
of all the samples and the sample names.

5
2.2 Microstructure observation
After tensile testing, the tensile specimens were sectioned perpendicular and parallel to the
loading axis in two locations: in the gauge region and in the grip section. The grip section reflects the
effects of the testing time and temperature on microstructure evolution. On the other hand, the gauge
section of the sample undergoes plastic deformation and therefore it reflects the combined effects of the
testing time, temperature, and strain on microstructure evolution. The samples were mechanically ground
and polished to a thickness of about 50 µm and then electro-polished to electron transparency using a
10% perchloric acid, 90% methanol solution at 223K(−50°C), 10 V. The microstructures of these foils
were observed using a Philips EM420 TEM (120 kV) and a FEI Titan 300 S/TEM (300 kV). The crystal
structure of precipitates in each sample were determined from selected area electron diffraction (SAED)
patterns or parallel nano-beam electron diffraction (NBD) patterns. The chemistry of the precipitates was
examined by electron dispersive X-ray spectroscopy (EDS) with the FEI Titan 300.
2.3 Microstructure analysis
Microstructural characteristics including the precipitate volume fraction and the dislocation
density were assessed with imaging software NIH Image J and FEI TIA (Technai Imaging and Analysis).
The dispersion parameters, i.e., the precipitate volume fraction, 𝑉𝑉f, and the average precipitate radius, 𝑟𝑟,
were determined by point counting with a superimposed square grid over TEM micrographs. In each
sample, about thirty fields of view were analyzed to improve statistical significance. To quantify the
dislocation density of each sample, we counted the number of dislocation lines intersecting the foil
surface per unit area. To estimate flow stress of un-aged and pre-aged samples, we converted ellipsoidal
particles into equivalent spheres of the same volume. The precipitate interparticle spacing, 𝜆𝜆 , was
bounded by two estimates, 𝜆𝜆0 and 𝜆𝜆1 , that were calculated from the precipitate radius and volume

6
fractions using the method described in reference [18]. We applied a standard point-counting method,
originally developed for optical microscopy, to TEM micrographs with the square grid adjusted to
accommodate the scale of the microstructure [29]. In general, 𝜆𝜆 is equal to 𝜆𝜆0 when the particles are
strong dislocation obstacles, while 𝜆𝜆0<< 𝜆𝜆 < 𝜆𝜆1, when the particles act as weak obstacles. In this study,
the inter-particle spacing of the strongest obstacles, 𝜆𝜆0, and the spacing of the weakest obstacles, 𝜆𝜆1, were
calculated using the relationships [18]:
𝜆𝜆0 = �2𝜋𝜋3𝑉𝑉f
𝑟𝑟 (1)
𝜆𝜆1 =4𝑟𝑟3𝑉𝑉f
(2)
3. Results
3.1 High-temperature tensile behavior at 750°C
Figure 2 shows typical engineering stress-strain curves of un-aged and pre-aged SUS 444 at
1023K(750°C). The high-temperature deformation behavior of the two kinds of samples is remarkably
different. The yield stress and the ultimate tensile stress of the un-aged condition are approximately a
factor of two greater than those of pre-aged material. In addition, a yield drop occurs in the un-aged
material at 0.9% strain. As will be noted in more detail later, the lower strength, pre-aged material
initially contains a high density of Laves precipitates, whereas the higher-strength un-aged material is
comparatively free of precipitates at the beginning of tensile testing. Generally speaking, a high density of
precipitates is expected to increase tensile strength relative to a precipitate-free microstructure, but the
opposite trend is observed between the un-aged and pre-aged material.

7
3.2 Microstructure of pre-aged and un-aged grip samples; i.e., no plastic strain (PA-GR, UA-GR)
TEM images of PA-GR and UA-GR samples are shown in Figure 3. Many rod-like precipitates
were observed in the PA-GR1 and PA-GR3, whereas only a few fine precipitates were found in UA-GR1,
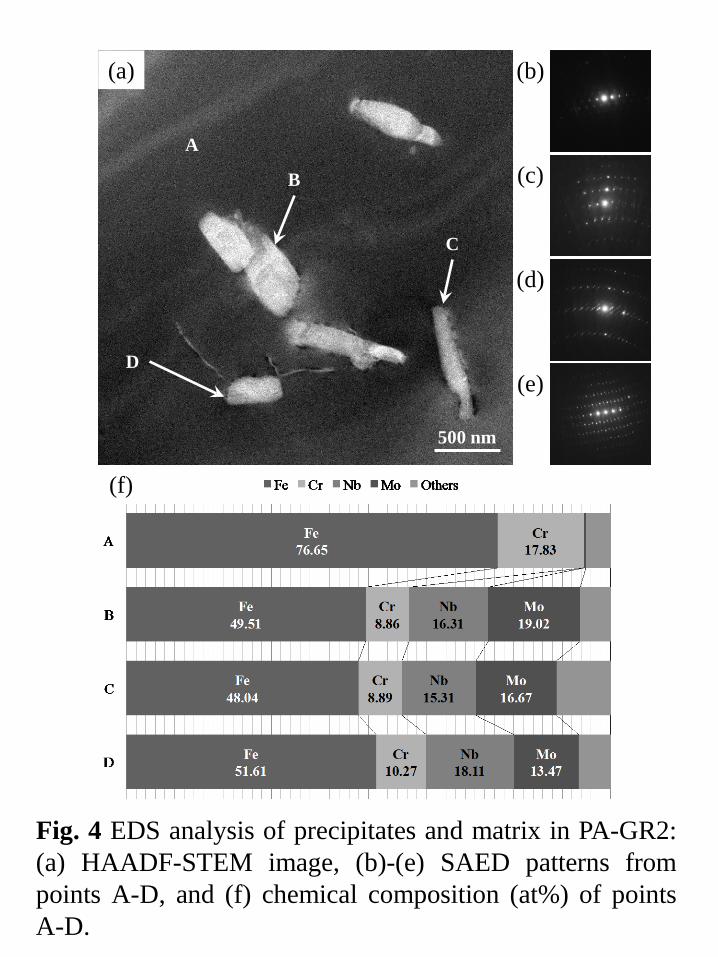
and block-like precipitates were observed in UA-GR2. Figure 4 shows the precipitate characteristics of
PA-GR2. SAED patterns (Figures 4 (b)-(e)) were obtained from points A-D, respectively, in the
HAADF-STEM image of Figure 4 (a). Analyzing the SAED patterns of Figures 4 (c)-(e) revealed all the
precipitates are Fe2Nb type Laves phase. Figure 4 (f) shows the chemical composition (at%) of points A-
D by EDS analysis. Points B-D indicate the presence of Cr and Mo, so we suppose these elements
substitute for Fe and Nb in the Laves structure, that is, (Fe, Cr)2(Nb, Mo). As can be seen by comparing
Figures 3 (a) and (b), the shape of the Laves precipitates change from a fine, block-like appearance to a
more rod-like morphology during annealing at 1023K(750°C). Sawatani et al. [19] observed similar
Laves phase precipitates with block-like and rod-like shapes in an aged Fe-19Cr-2Mo steel.
The precipitate dispersion parameters in the pre-aged and the un-aged grip samples are shown in
Table III. In the pre-aged grip samples (PA-GR1 and PA-GR3), the average diameter and the precipitate
volume fraction were similar (Figure 3 (a) and (b)). Evidently, the brief period of time at temperature
during the tensile test was too short to cause significant precipitate coarsening once the alloying element
supersaturation was removed by the pre-aging treatment. Consequently, the microstructure of PA-GR1
and that of PA-GR3 were qualitatively the same. In the un-aged sample (UA-GR1, Figure 3 (c)), a few
fine precipitates were present on dislocations within the grain interiors after 60 sec at the 1023K(750°C)
testing temperature. As the time at temperature increased to 2860 sec (UA-GR2), the volume fraction of
the Laves precipitates increased drastically, and precipitates formed on grain boundaries and within grain
interiors. A grain boundary heavily decorated by precipitates is apparent in Figure 3 (d).

8
3.3 Microstructure of pre-aged and un-aged gauge samples; i.e., subjected to plastic strain (PA-GA, UA-
GA)
Figure 5 and Figure 6 show TEM images of PA-GA and UA-GA samples, respectively. The
precipitates dispersion parameters of precipitates and the dislocation density in PA-GA and UA-GA
samples are also shown in Table IV.
Numerous dislocation tangles were observed in the pre-aged gauge sample after a plastic strain of
only 0.3% (PA-GA1), Figure 5 (a). As high-temperature deformation increased to a strain of 3% (PA-
GA2), the dislocation density decreased (Figure 5 (b)). The dislocation density remained low with further
deformation up to 14.3 % strain, and serrated boundaries appeared with dislocation walls and many sub-
grain boundaries (PA-GA3, Figure 5 (c)). This sequence of observations can be explained by concurrent
work hardening and recovery/recrystallization during the high-temperature deformation. A decrease in
dislocation density during deformation suggests recovery processes taking place faster than work
hardening processes (from 0.3% to 3% strain). The relatively stable dislocation density that follows from
3% to 14.3% strain implies a steady state is achieved between the competing tendencies of work
hardening and recovery. In addition, the dislocation rearrangement, annihilation, and absorption by grain
boundaries during recovery processes, is often accompanied simultaneously by the formation of serrated
boundaries [20]. From these observations, we conclude the dislocation density increased from work
hardening at the beginning of tensile test, and then it decreased and reached a constant value when high-
temperature steady state deformation and continuous recovery/recrystallization processes were balanced.
In the un-aged gauge sample at 0.3% strain (UA-GA1), very small precipitates about 20 nm in
diameter are seen on dislocations, Figure 6 (a). These were also identified as a Laves phase. Comparing
this microstructure with that in the grip (UA-GR1, Figure 3 (c)), it is evident the number density of the
Laves precipitates in UA-GA1 is much higher than that in UA-GR1. Since plastic strain is the only
difference between samples UA-GA1 and UG-GR1, the nucleation of the precipitates on dislocations in

9
Figure 6 (a) must be a strain-induced phenomenon. The precipitates in UA-GA1 had the smallest
diameter and the smallest inter-particle spacing so they could be most effective at pinning dislocation
motion. Figure 6 (b) shows the Laves precipitates coarsened and their volume fraction increased as the
tensile strain increased to 0.9% (UA-GA2). If dispersion hardening (precipitation hardening) is the
dominant strengthening mechanism, the microstructure of UA-GA1 should have the highest flow stress
because it has the finest Laves phase precipitates uniformly dispersed in the matrix. However, this is not
the case; UA-GA2 has the highest flow stress. It can be inferred from this that other strengthening
mechanisms are responsible for the initial flow strength of un-aged samples. In Figure 6 (c), deformation
to 3.0% (UA-GA3) resulted in further coarsening of Laves precipitates and led to a decrease in flow stress.
The general trend in the precipitate size - flow stress relationship matches that reported by Sim et al. [9],
with the exception of the 0.3% strain. They reported that fine Laves precipitates improved high-
temperature strength of Nb-containing steels but coarse Laves precipitates decreased high-temperature
strength. In the present work, large block-like (coarse) Laves precipitates were observed in the lowest
strength UA-GA3 sample but were not observed in the other un-aged strained samples. Thus, the coarse,
block-like Laves precipitates, when they are present, are associated with lower high-temperature strengths.
4. Discussion
4.1 Relationship between tensile strength and microstructure
For high-temperature deformation in which dispersion hardening (precipitation hardening) plays a
role, moving dislocations are obstructed by the dispersed particles on the slip planes. If the particles are
harder than the matrix, the yield strength can be nearly equal to the Orowan stress. The Orowan stress, σor,
is estimated from the equation [18],
𝜎𝜎or =𝑀𝑀𝑀𝑀𝑀𝑀𝜆𝜆
, (3)

10
where G is the shear modulus, M is the Taylor factor, b is the Burgers vector and 𝜆𝜆 is the inter particle
spacing. The Orowan stress for the microstructures under consideration can be estimated from 𝜆𝜆0 or 𝜆𝜆1
values calculated from particle radius and volume fraction measurements in the pre-aged and the un-aged
samples. The measured flow stresses then can be compared with the calculated Orowan stresses. If a
calculated Orowan stress greatly exceeds the observed flow stress for a particular microstructure, it can be
concluded that Orowan strengthening is not operative. Table V compares measured flow stresses with
the Orowan stresses, 𝜎𝜎or0 and 𝜎𝜎or1, calculated from inter-particle spacings, 𝜆𝜆0 and 𝜆𝜆1 (Eqs. (1) and (2)),
respectively. The Orowan stress estimated from 𝜆𝜆0 was unrealistically large relative to the measured flow
stress indicating the Laves precipitates cannot be acting as ideal hard obstacles. Consequently, we focus
on comparing 𝜎𝜎or1with either the measured flow stress or the yield strength.
In the grip section samples at 0.3% strain (PA-GR1 and UA-GR1), the values of the calculated
or1 are 40.2 and 47.6 MPa, respectively. The yield strength of these samples estimated from the stress-
strain curves (Figure 2) are 45 MPa and 100 MPa, respectively. Thus, agreement between 𝜎𝜎or1 and the
yield strength is reasonable for the pre-aged condition, but not for the un-aged condition.
In the gauge section of the un-aged samples, the values of 𝜎𝜎or1 calculated for UA-GA1 and UA-
GA2 are about 486 MPa and 103 MPa, respectively (Table V). The former is much higher than the
measured flow stress (100 MPa), whereas the latter is in reasonable agreement with the measured flow
stress (112 MPa). From these comparisons, it is evident that the Orowan mechanism is consistent with the
observed high-temperature strength in the pre-aged condition but not in the un-aged condition. This
supposition is supported by Figure 7, which shows numerous dislocation loops around a single Laves
phase precipitate in a pre-aged, 14.3% strained sample.
In the un-aged condition (UA-GA1, Figure 6 (a)), there are many small precipitates within ferrite
grains. At the initial stage of tensile testing un-aged samples, the matrix is supersaturated with solute and
the precipitates are small; we assume the precipitates are partially coherent with the matrix and below the

11
critical size for particle shearing by moving dislocations. If accurate, particle shearing and solid-solution
hardening would be the dominant strengthening mechanisms until the maximum flow stress is achieved
(at 0.9% strain); the Orowan strengthening expression would not be applicable in this situation. Further
study is necessary to confirm whether dislocations do in fact shear the smaller Laves precipitates (20 nm
in diameter), but this scenario is a plausible explanation for why the predicted Orowan stress applies to
pre-aged microstructures but not for the initial high-temperature strength of un-aged microstructures.
4.2 High-temperature yield point phenomenon
A drop in flow stress of nearly 50% occurred at 0.9 % strain in samples in the un-aged condition.
Horiuchi and Yoshinaga reported a similar yield drop in Al-Mg and Al-Cu alloys and associated it with a
solute drag on edge dislocations from solute atmospheres around the dislocations [21]. They attributed the
solute atmospheres to the size difference between solvent (Al) and solute (Mg or Cu) atoms, and it was
reported the flow stress and the yield drop increase considerably with the solute concentration.
Nakashima et al. [22] reported that the high-temperature yield point phenomenon also occurs in alloys in
which solid-solution and dispersion strengthening coexist (e.g. Al-Mg-Mn alloy). Oliver and Nix [23]
studied the high-temperature strength of an Al-Mg alloy containing dispersed particles of Al2O3 and MgO
and reported that the yield drop phenomenon resulted from particle coarsening. In SUS444, it is likely
that similar yield point contributions result from atmospheres of solute (Mo, Nb) atoms in iron and from
Laves precipitate coarsening. At the beginning of high-temperature deformation of un-aged samples in
our study, the solute elements Nb and Mo are dissolved and supersaturated in the ferrite matrix. Since the
volume fraction of precipitates in UA-GA2 is significantly larger than that in UA-GA1 and about the
same as that in UA-GA3, it is inferred that strain-induced solute precipitation is effectively complete by
0.9% strain. At this point, solid solution hardening from matrix supersaturation becomes negligible (a
small amount may remain from equilibrium solute solubility) and the dominant strengthening

12
contributions switch from particle shearing and solid-solution strengthening to Orowan strengthening.
The early drop in flow stress of un-aged samples is consistent with an earlier assessment of a reduction of
high-temperature strength in Nb-containing steels caused by Laves precipitation [9]. As discussed below,
the subsequent decrease in flow stress is largely a consequence of precipitate coarsening.
4.3 Strain effect on precipitate coarsening
Figure 8 plots data from Tables III and IV to show how strain and the time at testing
temperature affect the average diameter of precipitates in the pre-aged and the un-aged samples. The
effect of strain is found by comparing trends of triangle data points (strain-free grip samples) with the
trends of circular data points (plastically strained gauge samples). In both pre-aged and un-aged samples,
the average precipitate diameter is substantially greater in the gauge portion of the tensile specimens than
in the grip section. Thus, strain-induced growth and coarsening of precipitates took place in both pre-aged
and un-aged samples. In particular, the coarsening rate in the un-aged gauge sample is the highest among
the four types of sample. The volume fraction of precipitates in the un-aged gauge sample (0.3 % strain,
60 sec, UA-GA1) is about 8 times higher than that in the un-aged grip sample (no strain, 60 sec, UA-
GR1; see Tables III and IV). In UA-GA1, many dislocations are evident within grains as can be seen in
Figure 6 (a). These dislocations could serve as heterogeneous nucleation sites for Laves phase
precipitates. The dislocation density, which is affected by both strain and the rate of recovery at 750°C,
drops at 0.9% strain (UA-GA2) and remains unchanged until 3.0% strain (UA-GA3), while the volume
fraction of Laves phase is almost constant from UA-GA2 to UA-GA3. From these results, we conclude
the Laves phase nucleates and grows until 0.9% strain after which only coarsening takes place.
The coarsening rate of precipitates can be calculated using Ostwald ripening expressions [24, 25].
𝑟𝑟3 − 𝑟𝑟03 = 𝐾𝐾𝑝𝑝𝑡𝑡, 𝐾𝐾𝑝𝑝 =8𝛾𝛾𝛾𝛾𝐶𝐶𝑒𝑒𝑉𝑉𝑚𝑚2
9𝑅𝑅𝑅𝑅 (4)

13
where r is the average particle radius, r0 is the initial average particle radius, γ is the interfacial energy, D
is the diffusion coefficient, Ce is the equilibrium solute concentration, Vm is the molar volume of the
particle, R is the gas constant and T is the absolute temperature. We assume the controlling diffusivity for
coarsening of the Laves phase precipitates is that of Nb in ferrite because the diffusion coefficient of
carbon and nitrogen (1.04 × 10⁻¹⁰ and 1.28 × 10⁻¹⁰ m2s-1, respectively) are five to seven orders of
magnitude greater than that of Nb (5.40 × 10⁻¹⁶ m2s-1), and the diffusion coefficient of Fe (9.15 × 10⁻¹⁷
m2s-1) is similar to that of Nb [26]. Figure 9 shows the relationship between r3-r03 and time for the un-
aged samples. The slope of the plot is Kp. The value of Kp for the un-aged gauge sample is about 25 times
larger than that of the un-aged grip sample. The interfacial energy, the equilibrium solute concentration
and the molar volume of particles in both samples are identical, so the difference between the coarsening
rates of the two types of samples may be caused by a difference in the effective diffusion coefficient. In
the un-aged gauge sample, many dislocations were observed so they may effectively increase the
diffusivity of Nb through pipe diffusion relative to the un-aged grip sample.
The estimated Orowan stresses of UA-GA2 and UA-GA3 are similar to the measured flow
stresses in Table V. Comparing the microstructure of UA-GA2 with that of UA-GA3, the dislocation
densities are almost same, but the average diameter of precipitates in UA-GA3 is much larger than that in
UA-GA2. Therefore, we conclude precipitate coarsening causes the decrease of flow stress between these
strain states.
In the high-temperature deformation of dispersion / precipitation strengthened alloys, it often has
been reported that the flow stress gradually decreases as the deformation proceeds over a wide range of
strains [22, 23], and precipitate coarsening [27, 28] during deformation is considered to be the main
mechanism responsible for this decrease. The flow stress trends and microstructure evolution in the
samples of the present study are consistent with this view.

14
5. Conclusions
The present study examined high-temperature deformation and microstructures of un-aged and
pre-aged 18Cr-2Mo-0.5Nb (SUS 444) ferritic stainless steel to clarify the effect of precipitates on the
high-temperature strength. The following conclusions were drawn:
(1) The high-temperature tensile deformation behaviors of the pre-aged and the un-aged samples were
very different. In the un-aged sample, the significant drop in flow stress beyond 0.9% strain may have a
contribution from solute drag on dislocations, but the significant reduction of supersaturation at this strain
indicates precipitate coarsening is the predominant cause of the drop.
(2) In the un-aged samples, Laves phase precipitates nucleated and grew during the high-temperature
tensile test, and plastic strain accelerated the precipitation process. Strain-induced coarsening of
precipitates occurred in both pre-aged and un-aged samples.
(3) The high-temperature strength of un-aged samples is initially a combination of solid-solution
strengthening plus particle shearing. Near the peak flow stress (0.9% strain), the strengthening mechanism
switches to Orowan strengthening. In the pre-aged samples, however, the strengthening mechanism is
Orowan strengthening throughout the deformation process.
Acknowledgements
The authors are grateful to the Nanoscale Characterization and Fabrication Laboratory of the
Institute for Critical Technology and Applied Science (NCFL-ICTAS) at Virginia Tech for the use of its
facilities. K.I. thanks Professor Hideharu Nakashima in Kyushu University for fruitful discussions. K.I.
was partly supported by Strategic Young Researcher Overseas Visits Program (JSPS #R2408, Japan).

15
References
[1] S. Nakamura, K. Miyakusu and Y. Uematsu: Current advances in materials and processes - the Iron
and Steel Institute of Japan, 1991, vol. 4, pp. 1788-91.
[2] K. Ohmura, N. Fujita, M. Kikuchi, T. Tsuzaki and I. Hiroshige: Current advances in materials and
processes - the Iron and Steel Institute of Japan, 1991, vol. 4, pp. 1796-99.
[3] N. Fujita, K. Ohmura, M. Kikuchi, T. Suzuki, S. Funaki and I. Hiroshige: Scripta Mater., 1996, vol.
35, pp. 705-10.
[4] N. Fujita, K. Ohmura and A. Yamamoto: Mater. Sci. Eng. A, 2003, vol. 351, pp. 272-81.
[5] N. Nabiran, S. Klein, S. Weber, and W. Theisen: Metall. Mater. Trans. A, 2015, vol. 46A, pp. 102-14.
[6] A. Miyazaki, K. Takao and O. Furukimi: ISIJ International, 2002, vol. 42, pp. 916-20.
[7] N. Fujita and M. Kikuchi: Tetsu-to-Hagané, 2003, vol. 89, pp. 510-17.
[8] D. G. Morris, M. A. Munoz-Morris and C. Baudin: Acta Mater. 2004, vol. 52, pp. 2827-36.
[9] G. M. Sim, J. C. Ahn, S. C. Hong, K. J. Lee and K. S. Lee: Mater. Sci. Eng. A, 2005, vol. 396, pp.
159-65.
[10] Y. Uematsu, M. Akita, M. Nakajima and K. Tokaji: Int. J. Fatigue, 2008, vol. 30, pp. 642-48.
[11] T. Yamagishi, M. Akita, M. Nakajima, Y. Uematsu and K. Tokaji: Procedia Engineering, 2010, vol.
2, pp. 275-81.
[12] S. J. Ko and Y-J. Kim: Mater. Sci. Eng. A, 2012, vol. 534, pp. 7-12.
[13] Y-T. Chiu and C-K. Lin: J. Power Sources, 2012, vol. 219, pp. 112-19.
[14] Z. Y. Liu, F. Gao, L. Z. Jiang and G. D. Wang: Mater. Sci. Eng. A, 2010, vol. 527, pp. 3800-6.

16
[15] Y-T. Chiu, C-K. Lin and J-C. Wu: J. Power Sources, 2011, vol. 196, pp. 2005-12.
[16] Y-T. Chiu and C-K. Lin: J. Power Sources, 2012, vol. 198, pp. 149-57.
[17] S. V. Mehtonen, L. P. Karjalainen and D. A. Porter: Mater. Sci. Eng. A, 2013, vol. 571, pp. 1-12.
[18] M. Kato: Introduction to the theory of dislocations, pp. 139-144, Shokabo, Tokyo, 1999.
[19] T. Sawatani, S. Minamino and H. Morikawa: Trans. ISIJ, 1982, vol. 22, pp. 172-80
[20] F. J. Humphreys and M. Hatherly: RECRYSTALLIZATION and Related Annealing Phenomena
Second Edition, pp. 451-467, ELSEVIER, UK, 2004.
[21] R. Horiuchi and H. Yoshinaga: Trans. JIM, 1965, vol. 6, pp. 131-38.
[22] H. Nakashima, K. Iwasaki, S. Goto and H. Yoshinaga: Marer. Trans. JIM, 1990, vol. 31, pp. 35-45.
[23] W. C. Oliver and W. D. Nix: Acta Metall., 1982, vol. 30, pp. 1335-47.
[24] I. M. Lifshitz and V. V. Slyozov: J. Phys. Chem. Solids, 1961, vol. 19, pp. 35-50.
[25] C. Wagner: Z. Electrochem., 1961, vol. 65, pp. 581-91.
[26] E. A. Brandes and G. B. Brook: Smithells Metals Reference Book Seventh Edition, pp. 13-19 - 13-20,
Butterworth – Heinernann, Read Educational and Professional Publishing, UK, 1998.
[27] R. S. W. Shewfelt and L. M. Brown: Phil. Mag. 1974, vol. 30, pp. 1135-45.
[28] R. S. W. Shewfelt and L. M. Brown: Phil. Mag. 1977, vol. 35, pp. 945-62.
[29] G. F. Vander Voot: Metallography, Principles and Practice, McGraw Hill, NY, 1984.
17
List of Tables:
Table I Chemical composition of SUS444 stainless steel (mass%).
Table II SUS 444 sample key and thermo-mechanical history.
Table III Precipitates dispersion parameters in pre-aged and un-aged grip SUS444 samples.
Table IV Precipitates dispersion parameters in pre-aged and un-aged gauge SUS444 samples.
Table V Orowan stress of SUS444 pre-aged and un-aged samples calculated from inter-particle
spacing.
18
Figure captions:
Figure 1 Thermo-mechanical history of SUS 444 samples.
Figure 2 Stress-strain curves of pre-aged and un-aged SUS444 samples at 750°C.
Figure 3 TEM images of pre-aged and un-aged grip SUS444 samples: (a) PA-GR1, (b) PA-GR3,
(c) UA-GR1 and (d) UA-GR2.
Figure 4 EDS analysis of precipitates and matrix in PA-GR2: (a) HAADF-STEM image, (b)-(e)
SAED patterns from points A-D, and (f) chemical composition (at%) of points A-D.
Figure 5 TEM images of pre-aged gauge SUS444 samples: (a) PA-GA1 (0.3%), (b) PA-GA2
(3.0%) and (c) PA-GA3 (14.3%).
Figure 6 TEM images of un-aged gauge SUS444 samples: (a) UA-GA1 (0.3%), (b) UA-GA2
(0.9%) and (c) UA-GA3 (3.0%).
Figure 7 TEM image of dislocation loops around Laves precipitate in PA-GA3.
Figure 8 Time and strain effects on average diameter of precipitates in pre-aged and un-aged
samples.
Figure 9 Relationship between the cube of average size of precipitates and time in un-aged grip
and gauge samples.

1
Table I Chemical composition of SUS444 stainless steel (mass%).
C Si Mn P S Cr Mo Nb Ti N Fe 0.005 0.35 0.99 0.03 0.001 18.4 1.8 0.48 0.10 0.012 Bal.

2
Table II SUS 444 sample key and thermo-mechanical history.
Sample name
Strain (%)
Testing time (sec)
Aging time (sec)
Total holding time at 750ºC
(sec)
pre-aged grip
(un-strained)
PA-GR 1 - 60 360000 360180
PA-GR 2 - 600 360000 360600
PA-GR 3 - 2860 360000 362980
gage
(strained)
PA-GA 1 0.3 60 360000 360180
PA-GA 2 3.0 600 360000 360720
PA-GA 3 14.3 2860 360000 362980
un-aged grip
(un-strained)
UA-GR 1 - 60 0 180
UA-GR 2 - 2860 0 2980
gage
(strained)
UA-GA 1 0.3 60 0 180
UA-GA 2 0.9 180 0 300
UA-GA 3 3.0 600 0 720

3
Table III Precipitates dispersion parameters in pre-aged and un-aged grip SUS444 samples.
Time, t (sec) Volume fraction of precipitates,
Vf (%)
Average diameter of precipitates,
2r (nm) PA-GR1 60
4.92 268
PA-GR3 2860
5.35 313
UA-GR1 60
0.63 29
UA-GR2 2860
4.61 92

4
Table IV Precipitates dispersion parameters in pre-aged and un-aged gage SUS444 samples.
Strain,
ε (%)
Volume fraction of precipitates,
Vf (%)
Average diameter of precipitates,
2r (nm)
Dislocation density,
ρ (m-2)
PA-GA1 0.3
4.58 412
2.02×10¹³ PA-GA2 3.0
4.43 402
2.31×10¹²
PA-GA3 14.3
4.74 393
3.62×10¹²
UA-GA1 0.3
4.88 22
1.77×10¹³ UA-GA2 0.9
6.12 130
5.02×10¹²
UA-GA3 3.0
5.83 155
6.29×10¹²

5
Table V Orowan stress of SUS444 pre-aged and un-aged samples calculated from inter-particle spacing.
Eq. (1) Eq. (2) Measured flow stress
(MPa) Strongest inter-
particle spacing,
λ0 (μm)
Orowan stress,
σor0 (MPa)
Weakest inter-particle spacing,
λ1 (μm)
Orowan stress,
σor1 (MPa)
PA-GR1 0.87
166.9
3.63
40.2
N/A
PA-GR2 0.98
149.0
3.90
37.4
N/A
PA-GA1 1.39
104.8
6.00
24.3
45
PA-GA2 1.38
105.6
6.05
24.1
45
PA-GA3 1.31
111.7
5.53
26.4
42
UA-GR1 0.26
551.9
3.07
47.6
N/A
UA-GR2 0.31
470.6
1.33
109.7
N/A
UA-GA1 0.07
2024.9
0.30
485.5
100
UA-GA2 0.38
383.8
1.42
103.0
112
UA-GA3 0.46
314.1
1.77
82.3
65
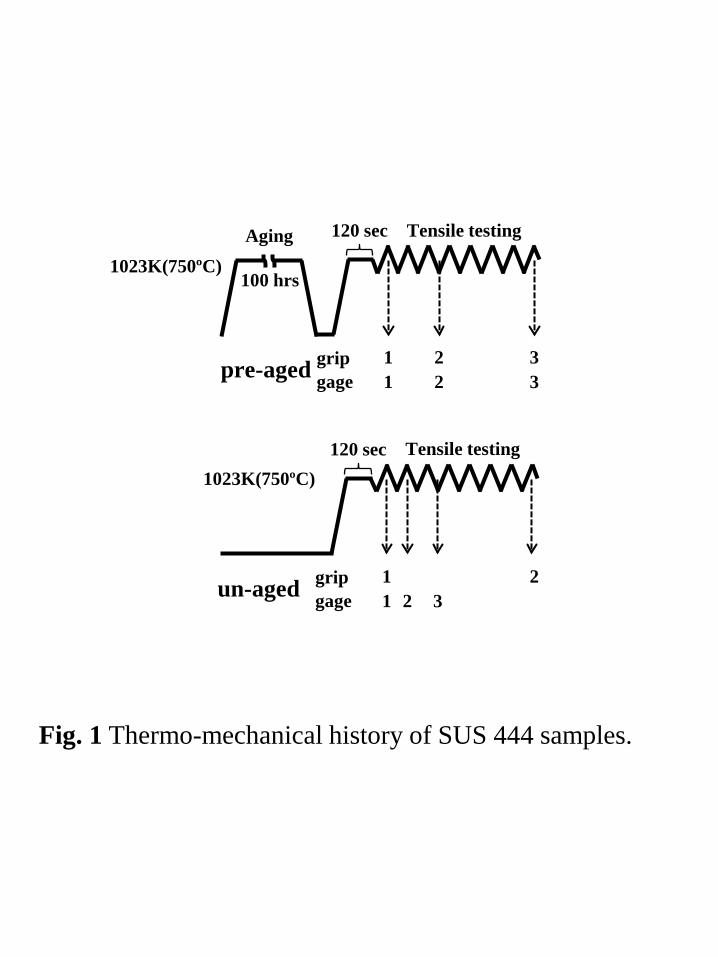
Fig. 1 Thermo-mechanical history of SUS 444 samples.
1023K(750ºC) Tensile testing
un-aged grip gage
120 sec
1 2 3 1 2
1023K(750ºC)
Tensile testing
pre-aged grip gage
120 sec
1 3 3 1 2
2
100 hrs
Aging

Fig. 2 Stress-strain curves of pre-aged and un-aged SUS444 samples at 750℃.
1023K(750°C) Strain rate: 5×10⁻⁵/sec
un-aged pre-aged

Fig. 3 TEM images of pre-aged and un-aged grip SUS444 samples: (a) PA-GR1, (b) PA-GR3, (c) UA-GR1 and (d) UA-GR2.
(a)
(c) (d)
2 μm
(b)
Grain Boundary
500 nm
A
B
C
D
Fig. 4 EDS analysis of precipitates and matrix in PA-GR2: (a) HAADF-STEM image, (b)-(e) SAED patterns from points A-D, and (f) chemical composition (at%) of points A-D.
(a) (b)
(c)
(d)
(e)
(f)

1 μm
(a)
(c)
(b)
Fig. 5 TEM images of pre-aged gauge SUS444 samples: (a) PA-GA1 (0.3%), (b) PA-GA2 (3.0%) and (c) PA-GA3 (14.3%).

1 μm
(a)
(c)
(b)
Fig. 6 TEM images of un-aged gauge SUS444 samples: (a) UA-GA1 (0.3%), (b) UA-GA2 (0.9%) and (c) UA-GA3 (3.0%).

200 nm
Fig. 7 TEM image of dislocation loops around Laves precipitate in PA-GA3.

0
50
100
150
200
250
300
350
400
450
500
0 500 1000 1500 2000 2500 3000
Aver
age
diam
eter
of p
reci
pita
tes,
2r /
nm
Time, t / sec
Fig. 8 Time and strain effects on average diameter of precipitates in pre-aged and un-aged samples.
pre-aged gage pre-aged grip un-aged gage un-aged grip

Fig. 9 Relationship between the cube of average size of precipitates and time in un-aged grip and gauge samples.
0
1
2
3
4
5
0 1000 2000 3000 4000
The
cub
e of
ave
rage
size
of L
aves
Ph
ase,
r3
-r03 /
105
nm3
Time, t / sec
un-aged gage un-aged grip