Effect of Cyclone Assisted Milling on Legume Flour
138
Effect of Cyclone Assisted Milling on Legume Flour Characteristics and Functionality in Selected Food Products by Mark Jarrard Jr. (Under the direction of Yen-Con Hung) Abstract Legumes (cowpea and soybean) were milled using a cyclone-assisted attrition mill to produce fine legume flour. Milling variations consisted of alterations in mill design and operating parameters in addition to preconditioning treatments of the seed. Legume flour from cowpea seed was used to prepare moin-moin (steamed cowpea paste) with variations in particle size, water, solids concentration, and cooking time. Legume flour from soybean was incorporated into an “instant beverage mix” with other common ingredients found in soy milk. Milling parameters were found to have a greater effect on legume flour particle size and yield, whereas seed conditioning showed little to no affect. Moin-moin prepared from attrition milled flour was found to be denser than a traditional product; additionally it was found that longer cooking times of attrition milled cowpea flour produced sticky products. Soy mix prepared from attrition milled flour was shown to have slightly greater suspension stability than non-attrition milled soy flour; however, the presence of adjunct ingredients did not allow for a clear delineation. INDEX WORDS: Cyclone, attrition mill, cowpea, soybean, cowpea flour, soy flour, moin-moin, soy beverage, soy milk
Transcript of Effect of Cyclone Assisted Milling on Legume Flour
Effect of Cyclone Assisted Milling on Legume Flour Characteristics and
Functionality in Selected Food Products
by
Mark Jarrard Jr.
(Under the direction of Yen-Con Hung)
Abstract
Legumes (cowpea and soybean) were milled using a cyclone-assisted attrition mill to
produce fine legume flour. Milling variations consisted of alterations in mill design
and operating parameters in addition to preconditioning treatments of the seed.
Legume flour from cowpea seed was used to prepare moin-moin (steamed cowpea
paste) with variations in particle size, water, solids concentration, and cooking time.
Legume flour from soybean was incorporated into an “instant beverage mix” with
other common ingredients found in soy milk. Milling parameters were found to have
a greater effect on legume flour particle size and yield, whereas seed conditioning
showed little to no affect. Moin-moin prepared from attrition milled flour was found to
be denser than a traditional product; additionally it was found that longer cooking
times of attrition milled cowpea flour produced sticky products. Soy mix prepared
from attrition milled flour was shown to have slightly greater suspension stability than
non-attrition milled soy flour; however, the presence of adjunct ingredients did not
allow for a clear delineation.
INDEX WORDS: Cyclone, attrition mill, cowpea, soybean, cowpea flour, soy flour,
moin-moin, soy beverage, soy milk
Effect of Cyclone Assisted Milling on Legume Flour Characteristics and
Functionality in Selected Food Products
by
Mark Jarrard Jr.
B.S., University of Tennessee, Knoxville, TN 2004
Thesis Submitted to the Graduate Faculty of the University of Georgia in Partial
Fulfillment of the Requirements for the Degree
Master of Science
Athens, Georgia
2006

© 2006
Mark Jarrard Jr.
All Rights Reserved
Effect of Cyclone Assisted Milling on Legume Flour Characteristics and
Functionality in Selected Food Products
by
Mark Jarrard Jr.
Major Professor: Yen-Con Hung Committee: Robert D. Phillips Manjeet S. Chinnan Susan K. McWatters Electronic Version Approved: Maureen Graso Dean of the Graduate School The University of Georgia August 2006

v
Dedication
This thesis is dedicated to my parents, Mark and Christine Jarrard, who have
always supported me in any decision that I have made. Secondly, to my close
friends who have always been my sanity that has allowed me to keep the course.
vi
Acknowledgments
I would like to thank Dr. Hung for always being the ever patient mentor with
me. During my time with Dr. Hung, he has always shown me the guidance
necessary to allow me to complete my tasks while leaving enough unanswered
questions for me to figure things out on my own. Thank you for all that you have
shown me and for playing “Devil’s Advocate” when necessary.
Thank you to Ms. K. McWatters for allowing me the extended privilege to
formulate various peanut products in your kitchen in addition to baking cowpea
crackers which I have grown to love. Dr. Phillips, your personal blueberry hobby was
quite a treat from time to time, yet those times always seem to find me at the end of
a long day. Dr. Chinnan, thank you for allowing me to understand one of the more
crucial aspects of my research and without this fundamental understanding I would
not have completed my research in the time frame that I had planned.
I would like to give special thanks to Mr. Glen Farrell and Ms. Sandra Walker
who assisted me when needed and tolerated me when I had moments of free time.
This study was supported by the Bean/Cowpea Collaborative Research
Support Program (Grant no. DAN-1310-G-SS-6008-00), U.S. Agency for
International Development, and by state and Hatch funds allocated to the University
of Georgia Agricultural Experiment Station-Griffin Campus.

vi
Table of Contents
Page
ACKNOWLEDGMENTS .................................................................................................. vi
LIST OF TABLES ............................................................................................................ ix
LIST OF FIGURES........................................................................................................... xi
CHAPTER
1 INTRODUCTION .......................................................................................1
2 LITERATURE REVIEW .............................................................................4
Soybean..................................................................................................5
Soy Products ..........................................................................................7
Soymilk ...................................................................................................8
Cowpea.................................................................................................11
Akara ....................................................................................................12
Moin-moin .............................................................................................13
Milling....................................................................................................16
Dry Milling Equipment ...........................................................................18
Cyclone Air Classifiers ..........................................................................20
Particle Size Measurement ...................................................................24
Particle Size Analysis ...........................................................................29
Particle Size in Food Systems ..............................................................30
References ...........................................................................................34
3 MILLING OF COWPEA FLOUR USING CYCLONE ASSISTED
ATTRITION MILLING ..............................................................................46
Abstract.................................................................................................47
vii
Introduction ...........................................................................................48
Materials and Methods .........................................................................51
Results and Discussion.........................................................................57
Conclusions ..........................................................................................62
Acknowledgements...............................................................................63
References ...........................................................................................64
4 APPLICATION OF ATTRITION MILLED SOY FLOUR IN A
BEVERAGE APPLICATION ....................................................................75
Abstract.................................................................................................76
Introduction ...........................................................................................77
Materials and Methods .........................................................................79
Results and Discussion.........................................................................86
Conclusions ..........................................................................................90
Outlook .................................................................................................91
Acknowledgements...............................................................................91
References ...........................................................................................92
5 EFFECT OF MILLING METHOD N THE PHYSICAL PROPERTIES
OF COWPEA FLOUR AS AN INGREDIENT IN MOIN-MOIN
(STEAMED PASTE) ................................................................................98
Abstract.................................................................................................99
Introduction .........................................................................................100
Materials and Methods .......................................................................102
Results and Discussion.......................................................................106
Conclusions ........................................................................................113
Outlook ...............................................................................................114
Acknowledgments...............................................................................114

viii
References .........................................................................................115
6 SUMMARY AND CONCLUSIONS ........................................................124
ix
List of Tables
Page
Table 2.1: Names, general descriptions, and utilization of traditional non-fermented
oriental foods .................................................................................................39
Table 2.2: Names, general descriptions, and utilization of fermented oriental foods ......40
Table 2.3: Nutrient content of soymilk, cow’s milk, and human breast milk ....................41
Table 2.4: Particle size classification by number and mass ............................................42
Table 3.1: Particle diameters at selected percentiles of “wet” and “dry” cowpea flour ....67
Table 3.2: Coefficient of variance of wet cowpea flour particle size measurements a
specific percentiles ........................................................................................70
Table 3.3: Averaged data of factorial design for cyclone assisted attrition milling of
cowpea flour as affected by milling parameters.............................................71
Table 3.4: Effect of milling parameters on cowpea flour .................................................72
Table 3.5: Averaged data of factorial design for cyclone assisted attrition milling of
cowpea flour as affected by seed conditioning..............................................73
Table 3.6: Effect of seed conditioning on cowpea flour...................................................74
Table 4.1: Trypsin inhibitor content of thermally treated defatted soy flake ....................94
Table 4.2: Averaged responses of processing regimens on soy flour.............................95
Table 4.3: Effect of suspension temperature and anti-caking level on soy beverage .....96
Table 4.4: Averaged responses for separation rate, viscosity, and water holding
capacity of soy flour .......................................................................................97
Table 5.1: Moin-moin formulations ................................................................................117
Table 5.2: Sensory evaluation descriptors ....................................................................118
x
Table 5.3: Calculated and measured proximate composition of moin-moin and akara.119
Table 5.4: Texture profile analysis of moin-moin...........................................................120
Table 5.5: Averaged texture profile analysis of moin-moin ...........................................121
Table 5.6: Objective measurements of moin-moin........................................................122
Table 5.7: Sensory ratings for moin-moin .....................................................................123
xi
Figure List
Page
Figure 2.1: Example of a cumulative percentile particle size distribution by mass..........43
Figure 2.2: Particle size distribution on a non-logarithmic scale .....................................44
Figure 2.3: Logarithmic probability graph ........................................................................45
Figure 3.1: Original and modified configuration of a Super Wing Mill DM-200................66
Figure 3.2: Cluster plot of “wet” vs. “dry” cowpea flour particle size distribution
measurements to demonstrate a relationship................................................68
Figure 3.3: Cumulative undersize distribution by mass of cowpea flour (wet and dry) ...69

1
Chapter 1
INTRODUCTION

2
Cowpea (Vigna unguiculata ) and soybean (Glycine max) are both highly
nutritious food sources that provide the staple parts of diets for many nations across
the world, mainly in locations that cannot find sufficient sources of animal protein.
Traditional processes that are used to prepare popular consumer products from
either of these raw legumes often require relatively large amounts of consumable
resources (e.g. water) and energy that may not be readily available to many of these
populations. Some of the processing technologies that are used to produce
consumer products from these legumes do so at the cost of sacrificing the nutritional
quality of the products, mainly through the loss of water soluble compounds.
Development of convenient starting materials (cowpea or soy flour) can significantly
reduce consumable resource dependency while reducing the overall energy needed
to produce many traditional products.
Moin-moin is a popular Nigerian dish prepared from a steamed, un-aerated
cowpea paste. Generally this product is mixed with oil, salt, onions, peppers, and
other seasoning agents before it is steamed in either a metal/glass mold or banana
leaves. The product is served either as a cool gel or as a warm pudding with either a
grain or cereal. Soymilk is traditionally the filtered, aqueous extract of soaked and
ground soybean. The okara that is filtered from this process contains relatively large
amounts of fiber and some proteins. Instant beverages created from nutritious food
sources (e.g. powdered milk) provide a nutrient dense beverage to populations that
are located in areas that cannot support refrigeration or ultra high temperature
processing.
Particle size of food ingredients has been shown to play significant roles in
ingredient functionality as well as in the sensory perception of food. Generally
speaking, these differences are noticed to a greater extent as the particle size of the
3
food ingredient approaches the micron and submicron levels whereas at larger sizes
the differences in functional properties tend to be comparatively minimal. Legume
proximate composition in conjunction with current milling technologies creates a
dynamic difficulty for producing legume flours with extremely small particle sizes.
However, modifications in legume crop or milling technologies can be implemented
to efficiently achieve these fine particle sizes.
The main objective of this study was to produce legume flour using a cyclone
assisted attrition mill with a final geometric particle mean diameter less than 20 μm.
By creating a relatively small particle size with the intended purpose of a
convenience food product, the functional properties of the legume flour would be
greatly altered and potentially exemplify certain aspects of traditional products
created from the respective legumes.
In the latter two objectives, moin-moin and an “instant beverage mix” were
prepared from either cowpea or soybean, respectively. These products were
compared to traditional products by using objective measurements to identify how a
reduction of particle size would alter the functional properties of the convenience
starting material.

4
Chapter 2
LITERATURE REVIEW

5
Soybean
The soybean (Glycine max) has been cultivated and consumed by the human
species for centuries with the popularity of the crop rapidly increasing in Western
countries in recent years, primarily due to recently identified health benefits. Detailed
information about the soybean, component functionality in food systems, health
benefits, health concerns, as well as soybean uses other than as a food source can
be found in the extensive and detailed literature presented by Liu (1997) and
Friedman and Brandon (2001). The general proximate composition of soybean (wet
basis) under general storage conditions is 13% water, 35% protein, 17% oil, 4.4%
ash, and 31% carbohydrates.
Soy proteins are perhaps the most valuable component of the soybean and
have received much attention in recent decades; however, soy proteins are mainly
utilized for animal feed with the refined soy oil dominantly consumed by humans (Liu
1997). Protein composition is mainly comprised (80%) of conglycinin (11S globulin)
and β-conglycinin (7S globulins) which are the storage proteins of the soybean.
Through genetic manipulation of soybeans, the content of these two storage proteins
varies greatly in transgenic soybean lines with each protein having different
functional, nutrient, and biological properties (Kinney 2003). Soybeans contain all of
the essential amino acids required for human growth, but are limited in methionine
and tryptophan. Chymotrypsin and trypsin inhibitors along with lectins limit the
consumption of the protein source unless properly heat treated to eliminate these
components. The common processes of necessary thermal treatments to eliminate
these anti-nutritional factors can improve protein quality to a point (Friedman and
Brandon 2001).

6
The carbohydrate fraction (second largest component on a dry weight basis)
is of little economic value to the soybean processing industry other than for caloric
value in ruminant animal feed; additionally the bulk of the carbohydrate fraction is
comprised of fiber. The main reason why the carbohydrate fraction of soybeans
receives attention is for the elimination or degradation of oligosaccharides raffinose
and stachyose. These two saccharides cannot be digested by humans due to the
lack of α-galactosidase, which is the enzyme needed to hydrolyze the α-galactosidic
bond of the oligosaccharides structure. The undigested form of the carbohydrate
proceeds to the lower intestine of the human gastrointestinal tract where microflora
that do contain the enzyme digest the oligosaccharides producing byproducts of
carbon dioxide, hydrogen, nitrogen, and methane resulting in flatulence and other
undesirable side effects to the host (Cristofaro and others 1974; Liener 1994).
Genotype variations of soybean differ greatly in fatty acid composition.
However, nearly 75% of the lipid content of most soybean varieties is comprised of
linolenic and oleic fatty acids making soybean oil ideal for the food processing
industry (Liu 1997; McGee 2004). Oil extraction from soybeans is primarily done
using solvent-based extraction yielding crude soybean oil. Crude soy oil is then
further refined to remove impurities such as lecithin, free fatty acids, and pigments.
After the impurities are removed, the oil is then subjected to additional processing
depending on the final product usage (Liu 1997).
In summary, the soybean has many limiting factors as a food source for
humans: oligosaccharides and protein-related limitations. Despite these limitations,
the soybean is a vital food source to many populations throughout the world as it
does provide key nutrients that would otherwise be unattainable (mainly as a protein
source). Continued soybean research in the industrialized nations of the world
contributes to the increased demand for soy-based foods as well as to the nutritional
7
improvements of the populations that are dependent on the soybean as a staple of
the diet.
Soy Products
The soybean is presently utilized on every continent of the world with China
leading the world production for human consumption of nearly 5 million metric tons of
soybean grown on an annual basis (FAOSTAT 2005). Soybeans are a nutritious
food source that provides vital nutrients to populations that would be pressed to find
other sources of such nutrients, primarily proteins. Development and manipulation of
Glycine max cultivars can produce significant variations in the nutrient composition of
the bean; however, the greatest variation comes from the processing of the raw bean
into a consumable human food source. In addition to the macronutrients provided by
the soybean, emerging research on isoflavone content and benefits provided to
humans has lead to the significant increase in consumer demand for soy based
products in many developed countries within the past decade (Liu 1997).
Tables 2.1 and 2.2 summarize traditional non-fermented and fermented soy
foods, their native oriental names, generalized production methods, and common
uses as a food source (Liu 1997). Development of soy processing technologies for
the transformation of the raw soybean to a usable consumer food source has lead to
the development of new soy food items; however, these new items are often variants
of the production methods used for the traditional foods. Many of the production
methodologies are designed to optimize protein content while reducing or eliminating
anti-nutritional factors associated with soybean.

8
Soymilk Soymilk is a thermally processed beverage that is produced from either the
aqueous extract of soybean slurry or a fine emulsion of soy flour. A crude version of
soymilk was first thought to have been made in China around the second century
B.C. and since then has developed to a wide variety of industrialized processes
across the world (Liu 1997). Soymilk has a nutrient profile (table 2.3) that is
analogous to cow’s milk with specific benefits of no lactose or cholesterol, greater
content of unsaturated fatty acids and proteins, and able to be produced in areas
where cow’s milk cannot be produced due to economic or geographic constraints.
Advances in soymilk processing technology, transgenic lines of soybean, and
consumer awareness have lead to the recent popularity and demand for soymilk and
product derivatives (e.g. tofu) throughout the world. Major advances in soymilk
include the identification of beany flavor compounds and anti-nutritional factors along
with the associated processing and genetic technologies to yield a nutritionally and
organoleptically acceptable product for consumers.
Beany Flavors The characteristic beany flavor associated with soymilk is caused by the
activation of lipoxygenases (LOX) during the grinding phases of soymilk production.
These off-flavors are commonly caused by n-hexanal and n-hexanol with the latter
considered to be one of the major factors in off-flavors (Mizutani and Hashimoto
2004). In order for enzymatic action to occur, two conditions must be satisfied 1) the
enzyme and substrate must be released from the cotyledon (i.e. the cotyledon must
be damaged), and 2) there must be excess moisture content in the system ( > 13%)
(Liu 1997). Presently, there are a handful of transgenic varieties of soybeans lacking

9
some of the LOX, but most still contain one or two LOX complexes. The American
Soy and Tofu Corporation (Macon, GA) has recently marketed a specific variety of
soybean (L-Star®) that lacks all three LOX complexes in addition to having
exceptionally high levels of tocopherol. Several products have been created from
the defatted soy products of the L-Star® soybean variety and are presently being
tested on American consumers for acceptability.
Processing temperatures have been shown to play a vital role in both the
formation as well as the retention of the volatiles generated through the lipid
oxidation process. Research shows that grinding soybeans at low and high
temperatures (3o and 80oC, respectively) can control the off-flavor content during the
soymilk manufacturing process (Mizutani and Hashimoto 2004). Mizutani and
Hashimoto (2004) suggest that grinding soybeans at lower temperatures (i.e. 3oC) to
be used for soymilk manufacturing requires less energy, causes less protein
degradation, provides a beneficial system for further processed soy products (e.g.
tofu), and an overall reduction in oxidized byproducts.
Anti-nutritional factors Trypsin and chymotrypsin inhibitors (TI), Kunitz (KST) and Bowman-Birk
(BBI), are the primary anti-nutritional factors of concern in soybean culitvars. Other
anti-nutritional factors, such as lectins, are present in soybean; however, criteria for
thermal treatments to sufficiently reduce KST and BBI inhibitory activity (TIA < 20%
activity) exceed the criteria for reduction of other anti-nutritional factors. Extensive
empirical research has been conducted on the thermal inactivation kinetics of KST
and BBI in soymilk and defatted soy flour, as well as analytical enzymatic studies to
identify how these TI are eliminated from the soy system. It is generally agreed that
the degradation of TI exhibits two separate first-order reactions with different reaction
constants for each TI over various ranges of moisture and temperature treatment
10
regimens (Kwok and others 1993; Rouhana and others 1996; Liu 1997; Kwok and
Liang 1998; van den Hout and others 1999; Kwok and others 2002). In addition to
reducing TIA to safe levels for human consumption, the necessary thermal treatment
processes parallel improvement of soy protein quality until a TIA value of 90% or
greater is achieved at which point the protein quality is adversely affected. Rouhana
and others (1996) identified that a continuous HTST pasteurization process for
soymilk to reduce TIA to 20% of native soybean should consist of a 77s residence
time at 140oC with a thermal conductivity value of 500 ( )KmW
o throughout the
heated sections of the HTST unit. This thermal treatment exceeds processing
criterion for dairy milk to the point of producing a sterile soymilk beverage without
adversely affecting the protein quality of soymilk. Kwok and Liang (1998) determined
that 30-40% of cystine is contained within the TI enzymes, thus explaining why the
inhibition levels to 10-20% activity improve protein quality as they liberate the
disulfide linkages of the TI enzymes making them available to the host for nutrient
adsorption. Kwok and Liang (1998) also identified that a holding time and
temperature relationship of 143 and 154oC for 62 and 29s, respectively, will reduce
TIA to 10% of native soybean activity.
Liu (1997) reviewed methods of using defatted soy flour to produce soymilk
with preferable flavor when compared to soymilk produced from fresh soybean. The
primary reason for consumer preference is due to the low levels of fatty acids in the
soy product used to create the soymilk. The primary problem with this method is
processing the defatted soy flake/flour so that the TIA is 10-20% of native soybean in
the final soymilk product. Inhibition of KST and BBI must occur in the presence of
moisture, otherwise sufficient dry thermal treatments would completely denature soy
protein making proteins unavailable for nutrient adsorption (DiPietro and Liener
11
1989; Liu 1997). Van den Hout and others (1999) examined the enzyme kinetics of
KST and BBI in defatted soy flour at various moisture contents. It was concluded
that from a kinetics standpoint, 30% moisture content of the defatted soy product
was sufficient to reduce TIA to an acceptable level and that moisture contents
greater than 30% showed negligible benefits. Based on the kinetics model for two TI
groups with different reaction rates (eqn 1) a 5 min processing time at 110oC with a
30% moisture content would be needed to reduce TIA to 10% of native soybean (van
den Hout and others 1999).
( ) tktkt eAAeCC
21 10
−− −+= (1)
Where Cx is the measured trypsin inhibitor activity (mg (gds)-1), A is the activity
fraction of one of the two TI groups at t = 0, k is the reaction rate constant ((mg (gds)-
1)1-n s-1), and t is time in seconds.
Cowpea (Black-eyed pea, Crowder pea, Southern pea)
Cowpea (Vigna unguiculata L. Walp.) has been extensively reviewed and
reported upon for nearly three decades (Phillips and others 2003; Plahar 2004). The
cowpea is a grain legume that is nutrient dense, stress tolerant, and an adaptable
crop that is grown on every continent of the world with Africa leading in production of
nearly 35 million metric tons per year (Phillips and others 2003; FAOSTAT 2005).
Research groups such as The International Institute of Tropical Agriculture and
collaborative research support programs between host universities in Africa and The
United States of America have lead to significant advances in breeding lines,
growing methodology, improvement of nutrient composition, and improvements in
consumer products made from cowpea (Singh and Rachie 1985; Ehlers and Hall
1997). The research group at The University of Georgia-Griffin Campus (Griffin, GA)
12
has specifically focused upon the improvement of cowpea starting materials used by
West African populations for preparation of staple food items with the intent of
reducing energy, manual labor, and consumption of resources (i.e. water) needed for
food preparation; in addition, an overall improvement in consumer acceptability of
traditional cowpea-based foods has been identified for several products (e.g. Akara)
(Phillips and others 2003; Singh 2003; Plahar 2004).
Benefits of cowpea when compared to other legumes of similar nutrient
composition include a lower content of anti-nutritional factors (including flatulence-
producing oligosaccharides), similar health benefits with respect to the
cardiovascular system, a valuable source of dietary fiber, and exhibit tolerance to
harsh growing conditions (i.e. low moisture climates) making this an ideal staple food
for developing countries in dry climates (Phillips and others 2003). The dry bean
(common form for West African consumers) contains on average 11% moisture,
23.85% protein, 2% lipids, 3.39% ash, 10.7% dietary fiber, and 48.94%
carbohydrates (HealtheTech 2005). General processing of dry cowpea seed by
traditional means involves the removal of the seed coat which reduces the fiber
content considerably. The removal of the seed coat allows for consumers to produce
more acceptable products from this legume; however, production of cowpea meal
and flours that retain the seed coat during processing yields a higher fiber content for
consumer products (Phillips 1982; Phillips and others 2003).
Akara Akara is popular in many West African countries and is made by whipping
cowpea paste mixed with bell /hot pepper, onion and salt then deep fried in either
peanut or vegetable oil in a ball shape form (Dovlo and others 1976). Sensory
studies conducted by McWatters (1990) and McWatters and others (1997) focused
on U.S. consumer acceptance of Akara and found that there is potential for such
13
West African products. Interestingly, U.S. populations that indicated acceptance of
Akara are also populations that tend to be familiar with indigenous U.S. foods that
have similar textural characteristics to Akara, such as the hushpuppy (fried corn meal
fritter).
Development of a starting material (cowpea meal) was shown to produce
consumer acceptable Akara when compared to a traditionally prepared product;
additionally, use of this starting material eliminates the excessive use of water and
manual labor for preparation of Akara (Singh 2003; Patterson and others 2004;
Plahar 2004; Singh and others 2004). Singh and others (2005) found that the
hydration properties of milled cowpea meal and flours played an important role in the
formation of a paste that has ideal characteristics for akara preparation. It was found
that the foaming capacity is related to the degree of water holding capacity and
swelling capacity of the paste; therefore, these two hydration properties can be used
as a control measure for production of cowpea paste that requires formation of foam
structures for ideal product qualities.
Moin-moin
Moin-moin is a popular Nigerian food product made from cowpea paste; small
amounts of oil, salt, tomato, egg, chili peppers, onion, or cooked meats can be added
after formation and dilution of the paste. The mixture is homogenized with minimal
incorporation of air and then steamed to form a gel or gel-like structure. The cooked
product can be served as a snack or an entrée with rice or cereals (Dovlo and others
1976). Moin-moin originated in West Africa, but it is strongly based on the Nigerian
culture with little documentation on the proper form of the product. Many of the
traditional recipes referenced for moin-moin and summarized by Dovlo and others
(1976) state that the cowpea paste, “…be of good consistency with no air

14
incorporated into the paste.” Traditional cowpea paste prepared for moin-moin is
done using decorticated, soaked cowpea seeds which are then manually pulverized
into a paste using a mortar and pestle or in modern times a food processor. The
removal of the seed coat alters the resulting paste in three ways 1) before genetic
variations in the seed color this eliminated the grey color of the paste, 2) the fibrous
seed coats disrupt the protein and starch matrices, and 3) significantly reduces the
dietary fiber of the resulting product. Subsequent studies on moin-moin, discussed
below, consider moin-moin to be a protein-starch gel that is semi-solid when warmed
and solidifies upon cooling. As such, factors that can affect these types of gels were
varied to study the effects on moin-moin.
Early research into moin-moin formulation optimization indicated that the form
and size of cowpea particles can play a significant role in the final form of the
product. Ngoddy and others (1986) evaluated moin-moin with a 1:3 ratio of cowpea
solids to water using cowpea meal/flour that had geometric particle mean diameters
(dgw) of 69.34, 86.66, 111.48, 128.47, and 184.44 μm. They concluded that an
optimum moin-moin formulation, based on an expert sensory panel, should produce
a product that has optimum surface sogginess, is moderately homogeneous with
respect to surface structure, and has an optimum texture. This sensory data does
little to identify what an ideal moin-moin product is, but the apparent viscosity of the
moin-moin paste for the “ideal” samples was between 110 and 113.3 cP with the
control sample (made from traditionally prepared cowpea paste) having an apparent
viscosity of 119.2 cP, and cowpea flour used to make the “ideal” moin-moin had dgw
ranging from 111 to 129 μm.
Additional ingredients in the moin-moin formulation can have a significant
affect on the organoleptic properties of moin-moin, but it is unclear as to the affects
15
on the texture of the final product. Moin-moin can be comprised of many different
ingredients, but oil, egg, and salt commonly appear in many traditional recipes and
all three can have an effect on the functional properties of cowpea as they relate to a
protein/starch gel. Ossai and others (1987) evaluated the effects of oil, egg, and salt
on moin-moin using dry decorticated cowpea seeds at a 1:5 ratio of cowpea solids to
water in addition to low, medium, and high contents of the evaluated ingredients.
They concluded that the rupture force of the moin-moin sample can vary from 2.8 to
3.5 N with vegetable oil fractions ranging from 5.5 to 8.5% of the total formulation.
Secondly, rupture force of the moin-moin sample can vary from 2.9 to 4.88 N with
egg fractions ranging from 3 to 4.5% of the total formulation. Salt was shown to have
no effect on the rupture force or deformation of rupture in this study. This result
suggests that moin-moin is more like a starch gel due to the salt having no significant
affect on the protein in the cowpea significantly.
A considerable amount of attention towards the modeling and development of
thermal process (canning) to prolong the shelf life of moin-moin has been conducted
since the shelf life of traditional moin-moin is short (24 hr under tropical conditions)
(Okechukwu and others 1991a; 1991b; 1991c; 1992). The thermal processing
research summarized that particle size of cowpea flour did not affect the thermal
heating and cooling curves. However, the rheology studies did show that
gelatinization onset temperature and peak rigidity both increased with decreases in
the water to solids ratio of cowpea slurries (Okechukwu and others 1991b).
Kerr and others (2000; 2001) observed similar physicochemical and
functional properties of cowpea flour with decreasing particle size in both cowpea
pastes and when used in a snack chip formulation. Snack chips prepared from
cowpea flour showed an increase in snapping peak force from 2.68 to 59.2 N/cm3 as
the dgw decreased from 385 to 90 μm. It was also observed that with increasing
16
starch concentrations, a lighter and less brown color was measured in the snack
chip. Lastly, a decrease in particle size produced cowpea flour with higher
measurable starch content and an increase in protein solubility. This was attributed
to the methodology of starch measurement which required that the starch be
extracted using water, thus smaller particle size yielded a greater amount of
extractable starch.
The paradigm for cowpea paste functionality for akara and moin-moin
production thus far is that foaming has the most significant effect on the texture of
the end product. Secondly, most cowpea studies involve removal of the seed coat
prior to milling or pulverization of the dry seed. Kethireddipalli and others (2002a;
2002b) examined the role of cell wall material on cowpea paste functional properties.
Cell wall material (CWM) included in the wet milling of cowpeas produced a highly
functional paste with improved hydration values and protein solubility. These two
improvements gave way to increased foaming capacity allowing for a deep fried
product (akara) to have a lighter and fluffier texture. Production of cowpea meal
through dry milling produced a poor quality end product which was attributed to low
protein solubility and the presence of a high proportion of heavy, gritty tissue
particles. Intense dry milling of dry cowpea for the production of cowpea flour greatly
enhanced protein solubility but adversely affected the hydration properties due to the
complete destruction of the cell wall material.
Milling
The earliest notion of milling dates back to the prehistoric era when grains were
processed by removing the tough protective layers in a crude manner and the inner
portions of the grain were consumed (McGee 2004). Since this prehistoric
development, the basic concept of milling is the same; however, current milling
17
processes have become relatively complex. Current grain milling technologies
consist of breaking grain kernels into pieces of various sizes so that a consumable
product can be easily utilized. The resulting products of a milling operation are often
referred to as flour or meal with the physical and nutritional compositions varying
greatly depending on the crop, growing conditions, milling procedure used, and
refining processes that may be implemented after milling (Potter and Hotchkiss 1995;
Chiang and Yeh 2002; Dijkink and Langelaan 2002; Kethireddipalli and others
2002b; Haros and others 2003; Miralbes 2004; Salmenkallio-Marttila and others
2004; Singh and others 2005; Velu and others 2006). In the general milling process,
the germ and bran are often removed in the first steps of the operation. These
portions of the germ generally account for most of the fiber, a significant portion of
oil, B-vitamins, and in some cases as much as 25% of the grain protein. Removal of
the germ and bran is desirable because the consumer generally prefers the refined
form of a cereal or legume (endosperm) as it is easier to work with in home kitchens
along with producing consumable goods with a more appealing color. Additionally,
removal of the bran allows for a significant reduction in oil content which if otherwise
present in the flour can lead to lipid degradation effects in the final product (Potter
and Hotchkiss 1995; McGee 2004).
Wet and Dry Milling
There are many types of milling devices and tools used for size reduction of
the grain kernel. Two common methods of milling used alone or in combination with
these devices are the wet and dry methods. The primary difference in the two
processes is a wet milling process involves either soaking or moistening the product
in a particular form at a specific time and temperature which are dependent upon the
characteristic of the desired end product (Dupont and Osman 1987). Wet-milling of

18
grains can be done in several ways but generally involves either soaking the whole
grain kernel or a milled portion of the grain. In the case of corn, the kernels are
soaked in dilute sulfurous acid for 10 - 58 hr at temperatures ranging from 45 - 55oC.
After this phase, the soaked kernels are processed through a series of grinding and
filtration steps while in a slurry state. Wet milling of wheat is typically done on milled
flour fractions creating a dough-like product and filtering off specific fractions that are
water soluble (Sayaslan 2004). In either form of wet milling, the primary benefit is
the specific separation of grain components for specific functional purposes such as,
corn starch, vital wheat gluten, and wheat starch (Dupont and Osman 1987;
Sayaslan 2004).
However, some disadvantages that exist with wet milling when compared to
dry milling are the costs associated with processing equipment, the drying process,
waste water, and a greater potential for microbial contamination (Phillips 1982).
Overall improvement of wet milling technology has lead to a reduction in these
problems; however, they are still present and of great concern if the process is not
controlled properly (Dupont and Osman 1987; Sayaslan 2004).
Dry milling is simply the pulverization and/or grinding of a grain or legume to
a particular particle size without the use of water and is often the preferred milling
methodology as energy consumption and water usage is considerably less (Phillips
1982; Potter and Hotchkiss 1995) when compared to wet milling.
Dry Milling Equipment
Milling equipment commonly used in both grain and legume processing
include roller (conventional), hammer, stone, disc, and jet milling. Each of these
processes relies on a different form of processing methodology for size reduction
and separation of grain particles into flour or meal.
19
Roller (Conventional) Milling
Roller milling involves the evolution of particle disintegrations combined with
sieving steps. As the milling process continues, the rollers move progressively
closer so as to reduce the particle size of the milled grain with sieves located in
between the vertically stationed rollers. This sieving action removes particulates,
such as bran, from the milled product allowing for the desired end product to vary in
composition from whole grain flour to refined flour free of bran. As the product is
milled finer and finer it becomes characteristic of the preferred consumer flour in that
it is light in color and fine in texture (Potter and Hotchkiss 1995; Culinary Institute of
America. 2002).
Hammer Milling
Hammer milling uses a series of rotating hammers to both impact and throw the
material to the exterior of the mill housing. Impacting forces on the grain caused by
either surface result in the gradual reduction in particle size of the product. Control
of particle size can be achieved by changing the rotation speed of the hammers,
changing the pore size of the screen used to retain the particulates in the milling
region, or multiple passes of the milled product through the mill (Kethireddipalli and
others 2002a; Singh 2003).
Stone and Disc Milling
Stone and disc milling operations are essentially the same in that mechanical
shearing and compression on the material are the main grinding forces. In each
case, the grinding surface exposed to the material is varied with the disc mills having
more geometric versatility than stone mills. Counter rotational speeds of the two
milling surfaces, distance between surfaces, and surface textures all impact the

20
performance of the mill and functional properties of the milled product. Yield is
generally low in comparison to other milling operations, yet these are often the mills
of choice for many developing areas because of low costs and high durability (Singh
and others 2004; Bayram and Oner 2005; Singh and others 2005; Mohapatra and
Bal 2006; Velu and others 2006).
Jet Milling
Jet milling is a relatively novel idea for the milling of fine particles, yet it is an
overall highly inefficient method as energy consumption is relatively high. Jet milling
occurs within a circular milling chamber that has air nozzles (jets) around the
perimeter. Compressed air is supplied to the milling chamber in a single direction at
a specific pressure (velocity) which creates a cyclone or vortex within the milling
chamber. Material is fed into the milling chamber at a specific location and is thrown
against the walls of the chamber causing pulverization (impact forces) of the
material. This continual impact milling eventually reduces the particle size/mass to a
range which then becomes characteristic of attrition (particle to particle collisions)
milling. This specific particle size range is dependent on the population balance
function of the milling system as described by Gommeren and others (2000). The
continual microparticulation of particles from these two forces makes this style of
milling ideal for situations where extremely small particle size is desirable, such as
pharmaceutical products, fat substitutes or beverage applications (Hayakawa and
others 1993; Guinard and Mazzucchelli 1996).
Cyclone Air Classifiers
In the simplest of terms, cyclones are devices that remove particles of various
sizes from a gas or fluid stream. They are simple in design, cost efficient, and can
21
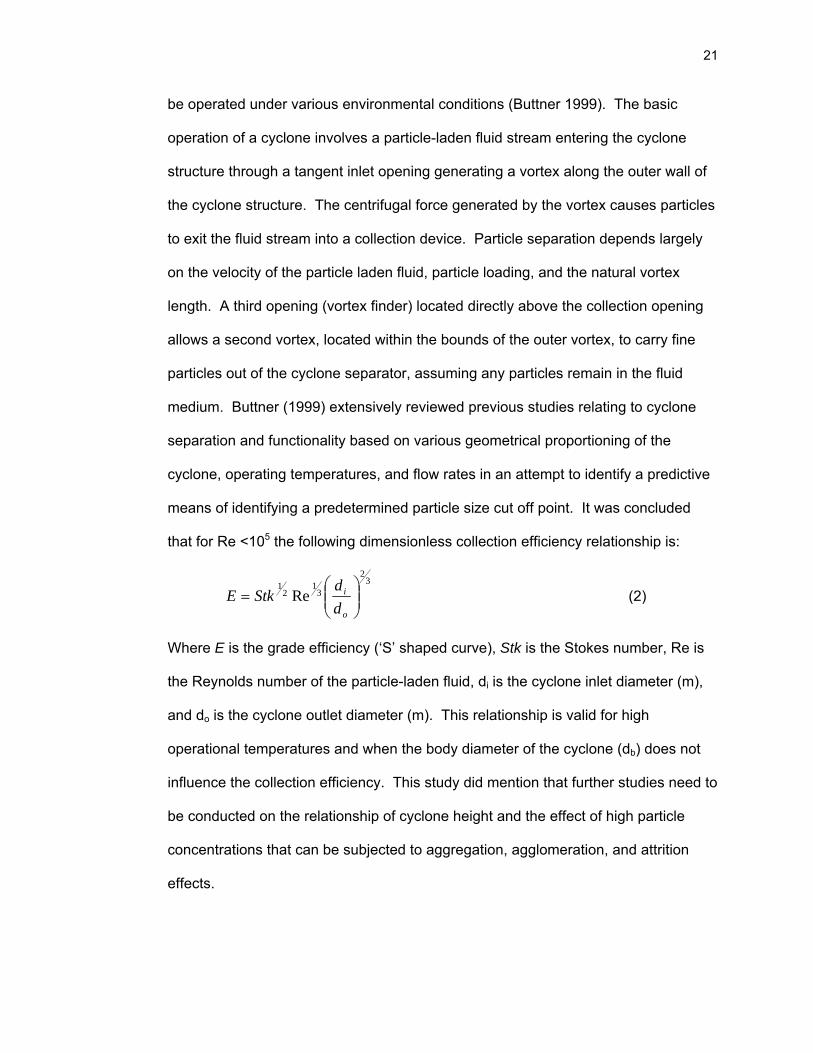
be operated under various environmental conditions (Buttner 1999). The basic
operation of a cyclone involves a particle-laden fluid stream entering the cyclone
structure through a tangent inlet opening generating a vortex along the outer wall of
the cyclone structure. The centrifugal force generated by the vortex causes particles
to exit the fluid stream into a collection device. Particle separation depends largely
on the velocity of the particle laden fluid, particle loading, and the natural vortex
length. A third opening (vortex finder) located directly above the collection opening
allows a second vortex, located within the bounds of the outer vortex, to carry fine
particles out of the cyclone separator, assuming any particles remain in the fluid
medium. Buttner (1999) extensively reviewed previous studies relating to cyclone
separation and functionality based on various geometrical proportioning of the
cyclone, operating temperatures, and flow rates in an attempt to identify a predictive
means of identifying a predetermined particle size cut off point. It was concluded
that for Re <105 the following dimensionless collection efficiency relationship is:
3
2
31
21
Re ⎟⎟⎠
⎞⎜⎜⎝
⎛=
o
i
dd
StkE (2)
Where E is the grade efficiency (‘S’ shaped curve), Stk is the Stokes number, Re is
the Reynolds number of the particle-laden fluid, di is the cyclone inlet diameter (m),
and do is the cyclone outlet diameter (m). This relationship is valid for high
operational temperatures and when the body diameter of the cyclone (db) does not
influence the collection efficiency. This study did mention that further studies need to
be conducted on the relationship of cyclone height and the effect of high particle
concentrations that can be subjected to aggregation, agglomeration, and attrition
effects.
22
Xiang and others (2001) examined the affects of cone bottom diameter on
cyclone efficiency and noted that as the cone base opening changes other various
geometric proportions change, such as cone area and vortex turn diameter, thus
altering the collection properties. Zhu and Lee (1999) demonstrated that as the cone
became more narrow, the tangential velocities at the base of the cyclone increased
proportionally. Their experiment focused on three cyclones with bottom diameters of
19.4, 15.5, and 11.6 mm and gas flow rates ranging from 30 to 60 L/min. The
experiment demonstrated that the smaller the do the greater the collection efficiency,
yet the overall shape of the efficiency curve did not change with changes in cone
geometry. The structural modification allows for the removal of smaller particles due
to greater centrifugal forces, but if the environment within the cyclone became
unbalanced, (i.e. if the vortex touches the cyclone wall) this would allow for particle
re-entrapment and a decrease in overall collection efficiency. The experiment did
show that under the operational conditions of this particular cyclone, the reduced
volume of the cyclone structure allowed for the generation of greater centrifugal
forces near the do thus increasing particle collection efficiency.
Presently, a prediction model that can encompass various cyclone sizes, flow
rates, and particle loading has yet to be agreed upon due to the innate complexities
of the dynamic nature within the cyclone structure. A new insight to this problem is
the observation by Avci and Karagoz (2003) that identifies three types of fluid flow
regimes (laminar, turbulent, or transitional) can exist within a cyclone at the same
time. This observation renewed ideas about cyclone behavior/performance as these
flow regimens have never been accurately identified. The aim of their study was to
adapt a prediction model for particle cut-off size and collection efficiency to account
for the various flow regimens in both large and small cyclones while accounting for
friction coefficients of particles. General assumptions about particle homogeneity

23
were taken into account along with an assumed homogeneous tangential inlet fluid
velocity. The conclusion of the study did state that a model was identified and
validated experimentally; however, specifics to cyclone operation, geometry, and
performance as identified in earlier research were general and vague. It was noted
that particle friction coefficients were assumed in this experiment and when applied
to theoretical models a negative response in cyclone performance was generated;
that is, the rougher the surface the more negative the performance of the cyclone.
The general understanding of the vortex end (natural vortex end) has been a
relatively large hindrance in previous attempts at understanding the behavior of the
cyclone. Common thought dictated that if the vortex end significantly touches the
cyclone wall at any point this will cause previously separated particles to re-enter the
inner vortex thus decreasing collection efficiency or even destabilizing the entire
cyclone flow (Xiang and others 2001; Avci and Karagoz 2003). Peng and others
(2005) expanded on the studies by examining the nature of a vortex end via
measurement of the vortex core frequency through the use of a stroboscopic and
high-time-resolution pressure sensing. The natural phenomenon of the vortex end
was shown to bend towards the wall of the cyclone; traditionally, this was assumed
to be a break down of the vortex, but in reality it is the natural behavior of the system.
Data from the pressure transducers in the cyclone-based experiments confirmed the
notion that the known inlet velocity is either close to or the same as the wall velocity
of the cyclone body (Peng and others 2005) if the inlet is rectanglular in shape. Early
on, Buttner (1999) noted the need to alter the shape of the inlet as this will cause for
variations in particle distribution across the inlet opening and in turn to the centrifugal
force generated by the particles within the cyclone body section. Qian and Zhang
(2005) identified a polynomial quadratic model (second-order response surface
model) for the prediction of the natural vortex length utilizing response surface
24
methodology and computational fluid dynamic techniques. Similar to previous
prediction model experiments, the model was created with certain variables
unaccounted for; namely wall roughness, particle load, and shape of the inlet. It was
noted that inlet shape was evaluated in this study, but only variations in the
dimensions of a rectangular inlet were examined. The recent advancements in
understanding the inner vortex behavior has lead to the design and utilization of
more efficient cyclone collectors for the removal of various particle sizes (Peng and
others 2005; Qian and Zhang 2005). However, practical application still yields the
most reliable and cost effective results for identification of cyclone operation,
performance, and functionality.
Particle Size Measurement
Mesh Sieving
Mesh sieve analysis is the process of taking a known weight of material and
sifting the material using a series of sieves with known mesh pore diameters for the
establishment of a particle size distribution (PSD) by mass. Sieve size standards,
established by the American Society of Testing Materials (ASTM 2004), have a
range of mesh sizes from 38 μm – 4.75 mm in pore diameter with smaller, non-
standard mesh sizes as low as 20 μm in pore diameter. The sieves are stacked
starting with a collection pan and then a series of sieves in ascending order of pore
diameter. The meal/flour sample to be measured is sifted for a designated amount
of time with the weights of each sieve recorded before and after sieving. Applying
the mass distribution of the sieves to equations 3-5 (ASABE 2003) produces the
geometric mean particle diameter by mass (dgw) and standard deviation of mean
particle diameter by mass (sgw). Additional percentile values, particle surface area,
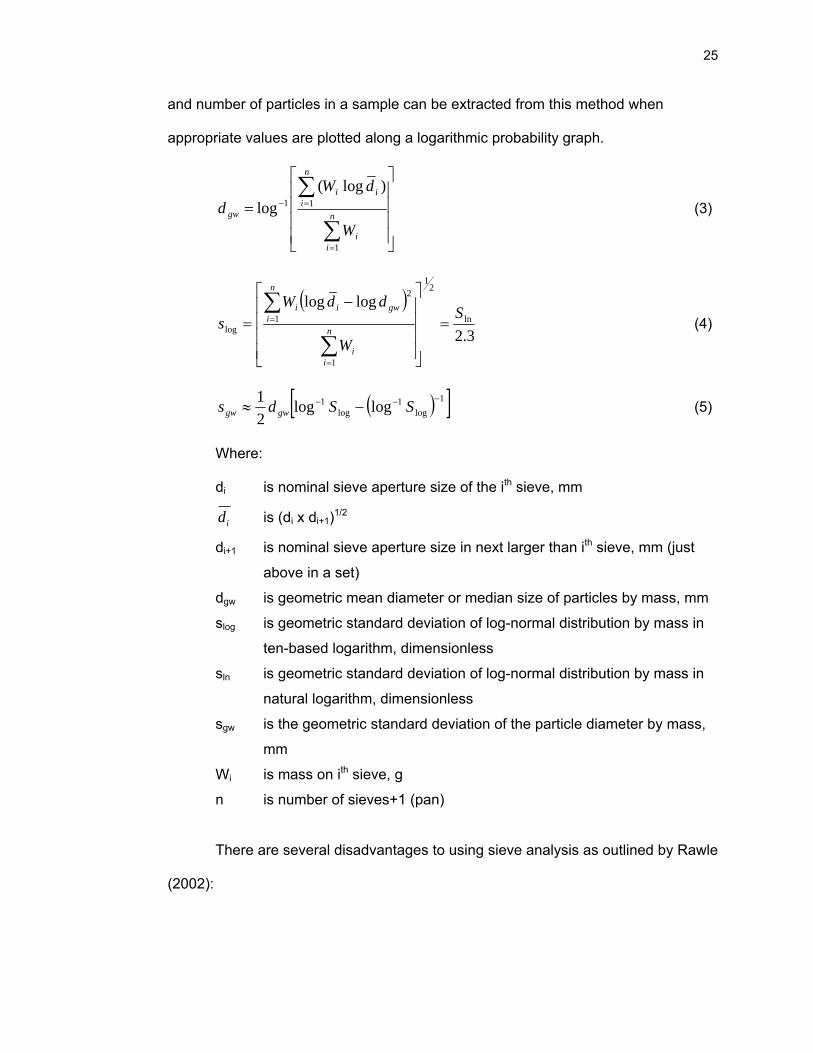
25
and number of particles in a sample can be extracted from this method when
appropriate values are plotted along a logarithmic probability graph.
⎥⎥⎥⎥
⎦
⎤
⎢⎢⎢⎢
⎣
⎡
=
∑
∑
=
=−n
ii
n
iii
gw
W
dWd
1
11)log(
log (3)
( )3.2
loglogln
21
1
1
2
logS
W
ddWs n
ii
n
igwii
=
⎥⎥⎥⎥
⎦
⎤
⎢⎢⎢⎢
⎣
⎡−
=
∑
∑
=
= (4)
( )[ ]1log
1log
1 loglog21 −−− −≈ SSds gwgw (5)
Where:
di is nominal sieve aperture size of the ith sieve, mm
id is (di x di+1)1/2
di+1 is nominal sieve aperture size in next larger than ith sieve, mm (just
above in a set)
dgw is geometric mean diameter or median size of particles by mass, mm
slog is geometric standard deviation of log-normal distribution by mass in
ten-based logarithm, dimensionless
sln is geometric standard deviation of log-normal distribution by mass in
natural logarithm, dimensionless
sgw is the geometric standard deviation of the particle diameter by mass,
mm
Wi is mass on ith sieve, g
n is number of sieves+1 (pan)
There are several disadvantages to using sieve analysis as outlined by Rawle
(2002):

26
• Measurement of dry particles smaller than the 400 mesh (38 μm) threshold is
difficult and results tend to misrepresent the true particle size below 400
mesh.
• Dry particles can create a static charge thus effecting the particle weight
distribution.
• Resolution of the analysis is strongly based upon the composition of the
material being measured.
• Particles that agglomerate, exhibit a cohesive property, or are non-spherical
in geometry cannot be accurately measured by sieve analysis. Sieve
analysis relies on particles to freely pass through the mesh openings and
assume that the particles are separate from one another.
• Often standardized methodology requires a mechanical action in addition to
shaking for particles to pass through the sieve mesh openings, such as
tapping, ultra sonic sieving, or sieving aids that break apart agglomerated
particles.
As mentioned in the summary, methods such as tapping, ultra sonic sieving, or
addition of a sieving aid are often employed to aid in the dispersion of particles so
that they can freely fall through the mesh openings. These additional methods can
be costly and require specific procedures that would result in the misrepresentation
of the mass distribution. The primary reason why sieving is not an acceptable
means for measuring fine, dry particles is due to the general agglomeration and
aggregation effects that occur due to moisture accumulation or electrostatic charge
during the sieving process. It is recommended that for particles that are speculated
to have a dgw < 38 μm other measurement techniques, such as laser or optical
27
analysis, be utilized for an accurate PSD measurement of the sample (ASABE
2003).
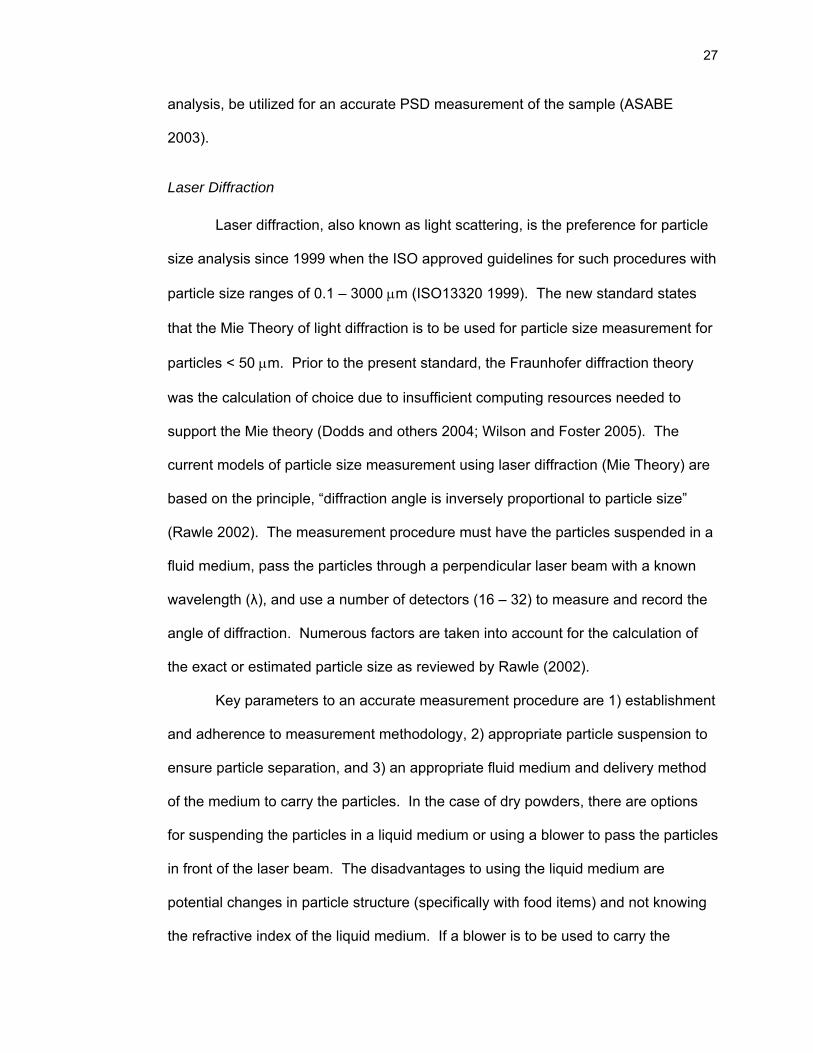
Laser Diffraction
Laser diffraction, also known as light scattering, is the preference for particle
size analysis since 1999 when the ISO approved guidelines for such procedures with
particle size ranges of 0.1 – 3000 μm (ISO13320 1999). The new standard states
that the Mie Theory of light diffraction is to be used for particle size measurement for
particles < 50 μm. Prior to the present standard, the Fraunhofer diffraction theory
was the calculation of choice due to insufficient computing resources needed to
support the Mie theory (Dodds and others 2004; Wilson and Foster 2005). The
current models of particle size measurement using laser diffraction (Mie Theory) are
based on the principle, “diffraction angle is inversely proportional to particle size”
(Rawle 2002). The measurement procedure must have the particles suspended in a
fluid medium, pass the particles through a perpendicular laser beam with a known
wavelength (λ), and use a number of detectors (16 – 32) to measure and record the
angle of diffraction. Numerous factors are taken into account for the calculation of
the exact or estimated particle size as reviewed by Rawle (2002).
Key parameters to an accurate measurement procedure are 1) establishment
and adherence to measurement methodology, 2) appropriate particle suspension to
ensure particle separation, and 3) an appropriate fluid medium and delivery method
of the medium to carry the particles. In the case of dry powders, there are options
for suspending the particles in a liquid medium or using a blower to pass the particles
in front of the laser beam. The disadvantages to using the liquid medium are
potential changes in particle structure (specifically with food items) and not knowing
the refractive index of the liquid medium. If a blower is to be used to carry the

28
particles, the particles often pass through the laser path in a shorter period of time
and are seldom recirculated through the laser beam. This delivery method can skew
the measurement of the true PSD of the sample, whereas a liquid medium can be
recirculated for a given amount of time and speed thus increasing the accuracy of
the PSD measurement (Ward-Smith and others 2002).
Lastly, when dealing with particles that are predominantly < 7 μm the problem
of particle aggregation has to be considered. It may become necessary to use
chemical dispersion agents to effectively separate the particles in this range so that
an accurate representation of the PSD can be viewed by the laser detectors (Rawle
2002).
The establishment of a representative PSD measurement procedure for a
sample using laser diffraction is no different than other scientific-based
measurements. Questions such as appropriate sample size, sampling rate, or
delivery method should all be established on a sound scientific justification (Ward-
Smith and others 2002). The statistical results produced from a PSD measurement
data set will indicate the precision and reproducibility of a measurement method.
These results will be dependent upon the measurement methodology but can be
similar when compared to other measurement protocols (i.e. different dispersion
agent or medium to suspend the particles) depending on the material to be
measured. As such, conducting a verification procedure for any new sample
material is a requirement of laser particle size measurement. Most software
packages offer the statistical analysis functions to verify a procedure, provided that
appropriate parameters about the material and fluid medium are inputted (i.e. particle
density and refractive index) (Ward-Smith and others 2002).

29
Particle Size Analysis
Particle size analysis is of importance to the cereal and legume processing
industries as both a quality control standard and as an identifier of physicochemical
and functional properties. Various methods are employed to measure the particle
size with laser diffraction measurement and mesh sieve analysis being the most
utilized methodologies. Each of the measurement methods offers various benefits
as well as drawbacks depending on the composition of the product, particle size
range, and intended use of the product. Regardless of the method used to measure
particle size the ultimate question is how to represent the particles measured in a
measurement method. Table 2.4 demonstrates the difference between counting the
number of particles in a size range versus quantifying the particles by mass.
Rawle (2002) illustrates that 99.3% of the total particles have an estimated
diameter below 1.0 cm; however, as depicted in the final column, 99.96% of the
particles have a diameter less than 1000 cm when they are quantified on a mass
distribution basis. Neither of the two quantification methodologies is inadequate, but
this example does illustrate that the same particle size data can be represented in
two very different ways with two equally different conclusions.
Generally particle size distributions are represented by either histograms or
using logarithmic scales with a cumulative percentage of particles by mass or volume
(Rawle 2002). Figure 2.1 illustrates how a logarithmic particle size distribution (PSD)
curve compares to a non-logarithmic PSD curve (fig 2.2). In a graphical
representation, it is easier to analyze the logarithmic scale due to the entire PSD
being viewable, whereas in the non-logarithmic scale the majority of the curve is too
condensed to make any use of the data. The percentiles of the curve demonstrate

30
how the majority of the particles by mass occur below the respective micron value
(e.g. 60% of the particles have a diameter of 23.464 μm or less).
On a visual representation basis, it can be seen that the logarithmic scale is
easer to view; however, drawing mathematical conclusions from the logarithmic
curve is quite difficult when compared to the latter graphical representation. In the
latter PSD curve, a simple linear slope can be derived in an attempt to predict the
probability of a particle’s size at a given point on the curve. However, such a slope
would not be appropriate as a significant portion of the curve extends past 700 μm
and would give a false probability of a particle’s size. Identification of the probability
of particle sizes that occur below or at certain percentiles requires the use of either a
logarithmic probability graph (fig 2.3) for probability estimation or a log-log probability
function (eqn 6) to obtain an exact value.
( ) ( )( )50loglog1 ixbecdcy −+
−+= (6)
Where:
y is the percentile probability of a specific particle size
c & d are the upper and lower asymptotes of a logarithmic PSD
curve (fig x)
x is the particle size at a specific probability
i50 is the particle size at the 50th percentile probability value
Particle Size in Food Systems
Sensory Perception Texture, as defined by Szczesniak (2002), “is the sensory and functional
manifestation of the structural, mechanical and surface properties of foods detected

31
through the sense of vision, hearing, touch and kinesthetics.” In earlier work,
Szczesniak (1963) classified particle size, shape, and orientation as a geometric
characteristic with potential descriptors listed as gritty, grainy, and coarse. A later
classification (Tyle 1993) mentions that the minimum particle size range that humans
can perceive these texture-based sensations is between 10 - 20 μm depending on
the food composition. The study tested three materials (garnet, micronized
polyethylene, and mica particles coated with titanium dioxide) differing in shape,
hardness, and particle size. Four particle sizes of each material were suspended in
flavored syrup solutions and evaluated by 25 panelists in a single-blind taste trial.
The study showed that particles that are soft and rounded can be as big as 80 μm
before the suspension is perceived as gritty; however, particles that are hard and
angular are perceived as gritty if the particle size range is above 11-22 μm. Relating
the descriptions of the materials used in the study to food applications, seed coats of
legumes and grains can be viewed as relatively hard angular shapes whereas starch
granules can be classified as a soft, rounded material (Tyle 1993). Guinard and
Mazzucchelli (1996) state that oral mechanoreceptors can detect globules ranging
from 5 - 25 μm in particle diameter as well as discriminate between various sizes
when the distances between globules is between 0.5 – 3.0 μm, depending on the
food and/or beverage composition. The summation of these earlier studies on the
texture sensory perception of liquid-based food systems indicates that particles of
hard angular shapes need to have a dgw < 11 – 22 μm and soft rounded particles
should have a dgw < 80 μm in order for the beverage system to be perceived as
smooth and free of negative textural attributes. Additionally, distance between
particles can impact the sensory perception relating to particle size; therefore, the

32
concentration of the particles in the food composition needs to be accounted for to
ensure an appropriate distance between particles.
Ingredient Functionality
Sensory perception due to particle size is just one component of food
formulations that is taken into consideration during the formulation process, but
ingredient functionality is altered depending on particle size and the means by which
the particle size is created. A series of studies on the milling of cowpea and
production of snack chips revealed that the finer milled product with a mean particle
size ranging from 40 – 70 μm did have different functionality when compared to
larger counterparts with a mean particle size greater than 300 μm (Kerr and others
2000; Kerr and others 2001). It was concluded that the finer milled product yielded a
higher extractable starch value and a lighter color snack chip; in addition, the peak
force necessary to snap the crackers was correlated with increasing levels of starch
in the formulation. Decreases in gelatinization temperatures and generally hydration
properties along with increases in protein solubility were observed with decreasing
particle size (Kerr and others 2000). These changes in ingredient functionality can
be negative in products where a spongy texture is preferred because they will not
create the necessary particle structure (foam) resulting in a dense and somewhat dry
structure (McWatters 1983; Ngoddy and others 1986; McWatters 1990; Singh and
others 2004; Singh and others 2005).
Food particles milled using common methods (e.g. roller, stone, or hammer
mills) produce particle size ranges that are comparatively larger when compared to
particles created via microparticulation, also known as attrition milling.
Microparticulation offers various benefits for certain food systems as the reduced
particle size can improve dispersibility, nutrient bioavaibility, sensory perception, and
33
in some cases mimic tactile sensations of food components (Hayakawa and others
1993; Park and others 2001). Hayakawa and others (1993) found that the
microparticulation of casein and egg white increased the hydrophobic nature of the
particles which was related to the significant increase in particle surface area; the
intent of the research was to create a food additive with a lipid-like mouth feel without
the nutrient content of a lipid. A study on the development of green tea powder
processed via microparticulation concluded that as the particle size decreased due to
increasing the microparticulation process (time and rpm) the dispersibility of the
powder mix increased, overall solution stability increased, sedimentation rates
decreased, and higher concentrations of the powder could be incorporated into
solution at lower temperatures without adverse effects on solution stability (Park and
others 2001).
34
References ASABE. 2003. Method of Determining and Expressing Fineness of Feed Materials by
Sieving (S319.3). ASABE Standards. p 589. ASTM. 2004. Standard Specification for Wire Cloth and Sieves for Testing Purposes.
Manual on Testing Sieving Methods. S. E29.01. Philadelphia, PA, ASTM International. 32: 1-5.
Avci A, Karagoz I. 2003. Effects of flow and geometrical parameters on the collection
efficiency in cyclone separators. Journal of Aerosol Science 34(7):937-55. Bayram M, Oner MD. 2005. Stone, disc and hammer milling of bulgur. Journal of
Cereal Science 41(3):291-6. Buttner H. 1999. Dimensionless representation of particle separation characteristic of
cyclones. Journal of Aerosol Science 30(10):1291-302. Chiang PY, Yeh AI. 2002. Effect of soaking on wet-milling of rice. Journal of Cereal
Science 35(1):85-94. Cristofaro E, Mottu F, Wuhrmann JJ. 1974. Involvement of the raffinose family of
oligosaccharides in flatulence. In: Sipple HL, McNutt KW, editors. Sugar in Nutrition. New York: Academic Press. Ch 20.
Culinary Institute of America. 2002. The Professional Chef. 7th ed. New York: Wiley.
xix, 1036 p. Dijkink BH, Langelaan HC. 2002. Milling properties of peas in relation to texture
analysis. Part 1. Effect of moisture content. Journal of Food Engineering 51(2):99-104.
DiPietro CM, Liener IE. 1989. Heat Inactivation of the Kunitz and Bowman-Birk
soybean protease inhibitors. Journal of Agricultural and Food Chemistry 37:39-44.
Dodds J, Rasteiro G, Scarlett B, Weichert R, Williams R. 2004. From particle size
analysis (PSA 1970) to particulate systems analysis (PSA 2003). Chemical Engineering and Research Design 82(A12):1533-40.
Dovlo FE, Williams CE, Zoaka L. 1976. Cowpeas: Home Preparation and Use in
West Africa. Ottawa: International Development Research Centre. 96 p. Dupont J, Osman EM. 1987. Cereals and legumes in the food supply. 1st ed. Ames:
Iowa State University Press. xxii, 360 p. Ehlers JD, Hall AE. 1997. Cowpea (Vigna unguiculata L Walp). Field Crops
Research 53(1-3):187-204. FAOSTAT. 2005. FAOSTAT.
35
Friedman M, Brandon DL. 2001. Nutritional and health benefits of soy proteins.
Journal of Agricultural and Food Chemistry 49(3):1069-86. Gommeren HJC, Heitzmann DA, Moolenaar JAC, Scarlett B. 2000. Modeling and
control of a jet mill plant. Powder Technology 108(2-3):147-54. Guinard JX, Mazzucchelli R. 1996. The sensory perception of texture and mouthfeel.
Trends in Food Science & Technology 7(7):213-9. Haros M, Tolaba MP, Suarez C. 2003. Influence of corn drying on its quality for the
wet-milling process. Journal of Food Engineering 60(2):177-84. Hayakawa I, Yamada Y, Fujio Y. 1993. Microparticulation by jet mill grinding of
protein powders and effects on hydrophobicity. Journal of Food Science 58(5):1026-9.
HealtheTech I. 2005. USDA National Nutrient Database for Standard Reference.
Version SR18. ISO13320. 1999. Particle Size Analysis - Laser Diffraction Methods Part 1: General
Principles. ISO Standards Authority. Kerr WK, Ward CDW, McWatters KH, Resurreccion AVA. 2001. Milling and particle
size of cowpea flour and snack chip quality. Food Research International 34(1):39-45.
Kerr WL, Ward CDW, McWatters KH, Resurreccion AVA. 2000. Effect of milling and
particle size on functionality and physicochemical properties of cowpea flour. Cereal Chemistry 77(2):213-9.
Kethireddipalli P, Hung YC, McWatters KH, Phillips RD. 2002a. Effect of milling
method (wet and dry) on the functional properties of cowpea (Vigna unguiculata) pastes and end product (akara) quality. Journal of Food Science 67(1):48-52.
Kethireddipalli P, Hung YC, Phillips RD, McWatters KH. 2002b. Evaluating the role of
cell wall material and soluble protein in the functionality of cowpea (Vigna unguiculata) pastes. Journal of Food Science 67(1):53-9.
Kinney AJ. 2003. Engineering Soybeans for Food and Health. AgBioForum 1&2:18-
22. Kwok KC, Liang HH. 1998. Modeling the heat inactivation of trypsin inhibitors in
soymilk by response surface methodology. Abstracts of Papers of the American Chemical Society 216:U43-U4.
Kwok KC, Liang HH, Niranjan K. 2002. Mathematical modeling of the heat
inactivation of trypsin inhibitors in soymilk at 121-154 degrees C. Journal of the Science of Food and Agriculture 82(3):243-7.

36
Kwok KC, Qin WH, Tsang JC. 1993. Heat inactivation of trypsin-inhibitors in soymilk at ultra-high temperatures. Journal of Food Science 58(4):859-62.
Liener IE. 1994. Implications of anti-nutritional components in soybean foods. CRC
Critical Reviews in Food Science Nutrition 34(1):31-67. Liu K. 1997. Soybeans: Chemistry, Technology, and Utilization. New York: Chapman
& Hall. xxvi, 532 p. McGee H. 2004. On Food and Cooking: The Science and Lore of the Kitchen.
Completely rev. and updated ed. New York: Scribner. x, 884 p. McWatters KH. 1983. Compositional, physical, and sensory characteristics of akara
processed from cowpea paste and Nigerian cowpea flour. Cereal Chemistry 60(5):333-6.
McWatters KH. 1990. Functional characteristics of cowpea flours in foods. Journal of
the American Oil Chemists Society 67(5):272-5. McWatters KH, Fletcher SM, Resurreccion AVA, Andress EL, Peisher AV. 1997.
Evaluation of the sensory quality of akara (fried cowpea paste) by teenage consumers. Journal of Food Quality 20(2):117-25.
Miralbes C. 2004. Quality control in the milling industry using near infrared
transmittance spectroscopy. Food Chemistry 88(4):621-8. Mizutani T, Hashimoto H. 2004. Effect of grinding temperature on hydroperoxide and
off-flavor contents during soymilk manufacturing process. Journal of Food Science 69(3):S112-S6.
Mohapatra D, Bal S. 2006. Cooking quality and instrumental textural attributes of
cooked rice for different milling fractions. Journal of Food Engineering 73(3):253-9.
Ngoddy PO, Enwere NJ, Onuorah VI. 1986. Cowpea flour performance in akara and
moin-moin preparations. Tropical Science 26:101-19. Okechukwu PE, Rao MA, Ngoddy PO, McWatters KH. 1991a. Flow behavior and
gelatinization of cowpea flour and starch dispersions. Journal of Food Science 56(5):1311-5.
Okechukwu PE, Rao MA, Ngoddy PO, McWatters KH. 1991b. Rheology of sol-gel
thermal transition in cowpea flour and starch slurry. Journal of Food Science 56(6):1744-8.
Okechukwu PE, Rao MA, Ngoddy PO, McWatters KH. 1991c. Thermal processing of
cowpea slurries. Journal of Food Science 56(5):1302-7. Okechukwu PE, Rao MA, Ngoddy PO, McWatters KH. 1992. Firmness of cowpea
gels as a function of moisture and oil content, and storage. Journal of Food Science 57(1):91-5.
37
Ossai GEA, Jowitt R, Brennan JG. 1987. The effects of oil, egg and salt content on
some physical properties of canned moin-moin. Journal of Food Engineering 6(3):231-9.
Park DJ, Imm JY, Ku KH. 2001. Improved dispersibility of green tea powder by
microparticulation and formulation. Journal of Food Science 66(6):793-8. Patterson SP, Phillips RD, McWatters KH, Hung YC, Chinnan MS. 2004. Fat
reduction affects quality of akara (fried cowpea paste). International Journal of Food Science and Technology 39(6):681-9.
Peng W, Hoffmann AC, Dries HWA, Regelink MA, Stein LE. 2005. Experimental
study of the vortex end in centrifugal separators: The nature of the vortex end. Chemical Engineering Science 60(24):6919-28.
Phillips RD. 1982. Preparation and composition of a dry-milled flour from cowpeas.
Journal of the American Oil Chemists Society 59(8):351-3. Phillips RD, McWatters KH, Chinnan MS, Hung YC, Beuchat LR, Sefa-Dedeh S,
Sakyi-Dawson E, Ngoddy P, Nnanyelugo D, Enwere J, Komey NS, Liu KS, Mensa-Wilmot Y, Nnanna IA, Okeke C, Prinyawiwatkul W, Saalia FK. 2003. Utilization of cowpeas for human food. Field Crops Research 82(2-3):193-213.
Plahar MA. 2004. Modification of the textural characteristics, oil absorption, and
protein content of fried cowpea paste (akara) during production [Electronic]. Athens, GA: University of Georgia. 119 p.
Potter NN, Hotchkiss JH. 1995. Food Science. 5th ed. New York: Chapman & Hall.
xiii, 608 p. Qian F, Zhang M. 2005. Study of the natural vortex length of a cyclone with response
surface methodology. Computers & Chemical Engineering 29(10):2155-62. Rawle A. 2002. The importance of particle sizing to the coatings industry Part 1:
particle size measurement. Advances in Colour Science and Technology 5(1):1-12.
Rouhana A, Adler-Nissen J, Cogan U, Forokiaer H. 1996. Heat inactivation kinetics
of trypsin inhibitors during high temperature-short time processing of soymilk. Journal of Food Science 61(2):265-9.
Salmenkallio-Marttila M, Heinio RL, Myllymaki O, Lille M, Autio K, Poutanen K. 2004.
Relating microstructure, sensory and instrumental texture of processed oat. Agricultural and Food Science 13(1-2):124-37.
Sayaslan A. 2004. Wet-milling of wheat flour: industrial processes and small-scale
test methods. Lebensmittel-Wissenschaft und-Technologie-Food Science and Technology 37(5):499-515.

38
Singh A. 2003. Enhancing the physical and functional properties of cowpea paste used in akara production through modification of milling and paste preparation methods [Masters]. Athens, GA: University of Georgia. 159 p.
Singh A, Hung YC, Corredig M, Phillips RD, Chinnan MS, McWatters KH. 2005.
Effect of milling method on selected physical and functional properties of cowpea (Vigna unguiculata) paste. International Journal of Food Science and Technology 40(5):525-36.
Singh A, Hung YC, Phillips RD, Chinnan MS, McWatters KH. 2004. Particle-size
distribution of cowpea flours affects quality of akara (fried cowpea paste). Journal of Food Science 69(7):S243-S9.
Singh SR, Rachie KO. 1985. Cowpea Research, Production and Utilization.
Chichester, England: John Wiley & Sons. xxviii, 460 p. Szczesniak AS. 1963. Classification of textural characteristics. Journal of Food
Science 28(4):385-389. Szczesniak AS. 2002. Texture is a sensory property. Food Quality and Preference
13(4):215-25. Tyle P. 1993. Effect of size, shape and hardness of particles in suspension on oral
texture and palatability. Acta Psychologica 84(1):111-8. van den Hout R, Meerdink G, Van't Riet K. 1999. Modelling of the inactivation
kinetics of the trypsin inhibitors in soy flour. Journal of the Science of Food and Agriculture 79(1):63-70.
Velu V, Nagender A, Rao PGP, Rao DG. 2006. Dry milling characteristics of
microwave dried maize grains (Zea mays L.). Journal of Food Engineering 74(1):30-6.
Ward-Smith RS, Gummery N, Rawle AF. 2002. Validation of wet and dry laser
diffraction particle characterization methods. 4th World Congress on Particle Technology Sydney, Australia: Malvern Instruments.
Wilson JD, Foster TH. 2005. Mie theory interpretations of light scattering from intact
cells. Optics Letters 30(18):2442-4. Xiang RB, Park SH, Lee KW. 2001. Effects of cone dimension on cyclone
performance. Journal of Aerosol Science 32(4):549-61. Zhu YF, Lee KW. 1999. Experimental study on small cyclones operating at high flow
rates. Journal of Aerosol Science 30(10):1303-15.

39
Table 2.1: Names, general description, and utilization of non-fermented traditional oriental foods. Native names
Soy foods Chinesea Japanese Korean Othersb General Description Uses Soymilk Doujiang Tonyu Kong kook Heated water extract of
soybeans after grinding and filtration. Resembles dairy milk.
Served hot or cold, as breakfast, beverage, or with other foods.
Dou nai Doo goo Dou ru Soybean curd Doufu Tofu Doo bu Tahu (In.) White protein curd precipitated
from soymilk with a salt or acid. Bland taste. Can be dried, frozen, or fried.
Cooked with or without meat, vegetable, and seasonings, and served as a main dish or soup.
Tofu (Toufu) Tau foo (Ma.) Tokua (Ph.) Soy sprouts Huang dou
ya Daizu no moyashi Kong na
mool Germinated soybeans in dark,
yellow cotyledons with white sprouts.
Cooked as vegetable or in soup.
Dao dou ya Soy pulp Dou zha Okara Bejee Tempeh gembus (In.) Insoluble residue after filtration
of soymilk. Rich in dietary fiber. Made into dish, salted as pickle, or fermented into a temphe (In.)
Okara Soy film, Yuba Do fu pi Yuba Kong kook Fu chok (Ph.) Creamy, yellowish protein-lipid
film formed from surface of boiling soymilk. Sheets, sticks, or flakes.
As delicacy, cooked with meat or vegetables, or in soups.
Fu zhu Immature soybeans Qing dou Edamame Put kong Green immature soybeans.
Prefer large seeded cultivar. Cooked in pod or pod removed. Served as snack or vegetable.
Sweet beans Mao dou Roasted soybeans Chao da dou Iri-mame Dry roasted soybeans,
seasoned or non-seasoned. As snack or made into powder.
Toasted soy powder Chao dou fen Kinako Kong ka au Bubuk kedelai (In.)
Dou fen
Dry roasted then ground soybeans, Yellow powder, and nutty flavor.
Coating for rice cakes or sprinkled over cooked rice.
a Mandarin Chinese (or Cantonese) b In.= Indonesian, Ma. = Malaysian, and Ph. = Philippine Table adapted from Liu (1997)
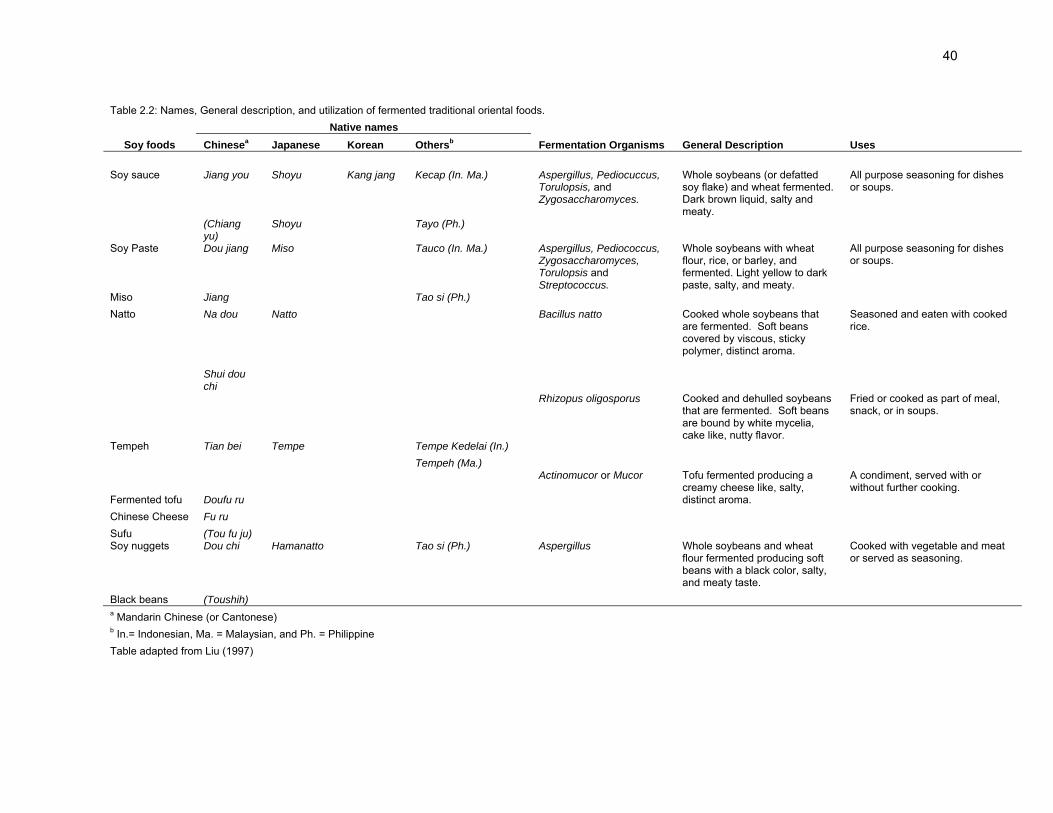
40
Table 2.2: Names, General description, and utilization of fermented traditional oriental foods. Native names
Soy foods Chinesea Japanese Korean Othersb Fermentation Organisms General Description Uses Soy sauce Jiang you Shoyu Kang jang Kecap (In. Ma.) Aspergillus, Pediocuccus,
Torulopsis, and Zygosaccharomyces.
Whole soybeans (or defatted soy flake) and wheat fermented. Dark brown liquid, salty and meaty.
All purpose seasoning for dishes or soups.
(Chiang yu)
Shoyu Tayo (Ph.)
Soy Paste Dou jiang Miso Tauco (In. Ma.) Aspergillus, Pediococcus, Zygosaccharomyces, Torulopsis and Streptococcus.
Whole soybeans with wheat flour, rice, or barley, and fermented. Light yellow to dark paste, salty, and meaty.
All purpose seasoning for dishes or soups.
Miso Jiang Tao si (Ph.) Natto Na dou Natto Bacillus natto Cooked whole soybeans that
are fermented. Soft beans covered by viscous, sticky polymer, distinct aroma.
Seasoned and eaten with cooked rice.
Shui dou chi
Tempeh Tian bei Tempe Tempe Kedelai (In.)
Rhizopus oligosporus Cooked and dehulled soybeans that are fermented. Soft beans are bound by white mycelia, cake like, nutty flavor.
Fried or cooked as part of meal, snack, or in soups.
Tempeh (Ma.)
Fermented tofu Doufu ru
Actinomucor or Mucor Tofu fermented producing a creamy cheese like, salty, distinct aroma.
A condiment, served with or without further cooking.
Chinese Cheese Fu ru
Sufu (Tou fu ju) Soy nuggets Dou chi Hamanatto Tao si (Ph.) Aspergillus Whole soybeans and wheat
flour fermented producing soft beans with a black color, salty, and meaty taste.
Cooked with vegetable and meat or served as seasoning.
Black beans (Toushih) a Mandarin Chinese (or Cantonese) b In.= Indonesian, Ma. = Malaysian, and Ph. = Philippine
Table adapted from Liu (1997)
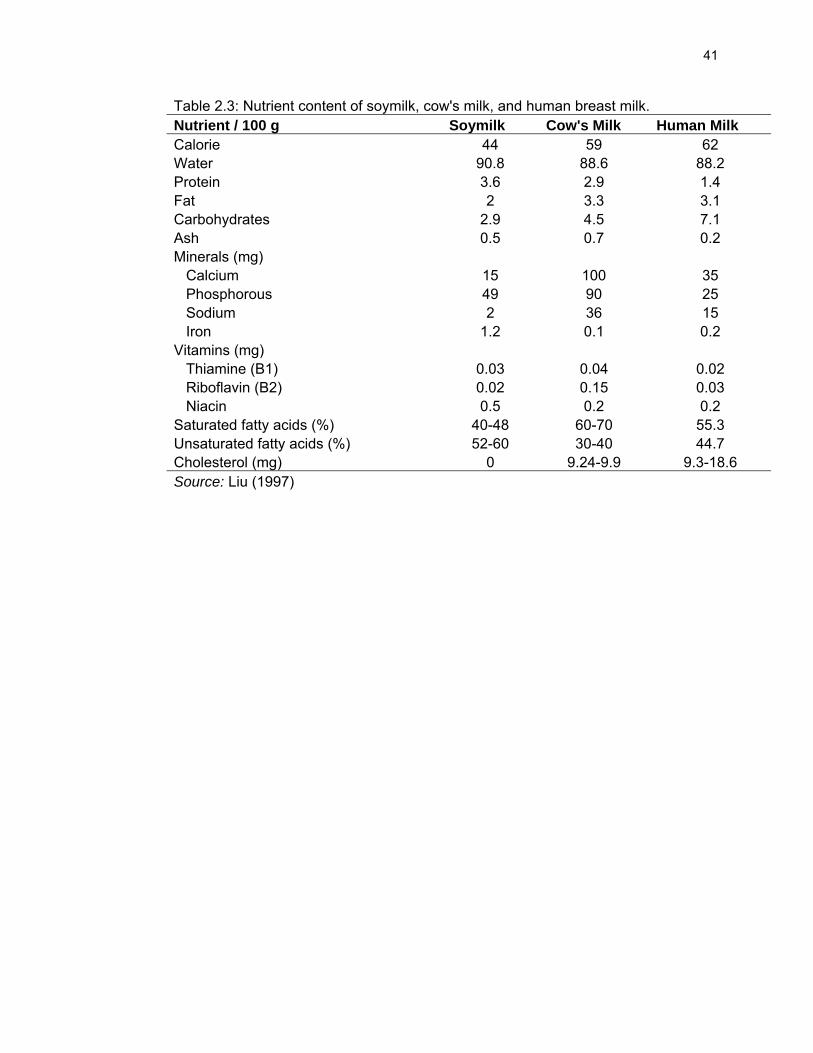
41
Table 2.3: Nutrient content of soymilk, cow's milk, and human breast milk. Nutrient / 100 g Soymilk Cow's Milk Human Milk Calorie 44 59 62 Water 90.8 88.6 88.2 Protein 3.6 2.9 1.4 Fat 2 3.3 3.1 Carbohydrates 2.9 4.5 7.1 Ash 0.5 0.7 0.2 Minerals (mg) Calcium 15 100 35 Phosphorous 49 90 25 Sodium 2 36 15 Iron 1.2 0.1 0.2 Vitamins (mg) Thiamine (B1) 0.03 0.04 0.02 Riboflavin (B2) 0.02 0.15 0.03 Niacin 0.5 0.2 0.2 Saturated fatty acids (%) 40-48 60-70 55.3 Unsaturated fatty acids (%) 52-60 30-40 44.7 Cholesterol (mg) 0 9.24-9.9 9.3-18.6 Source: Liu (1997)
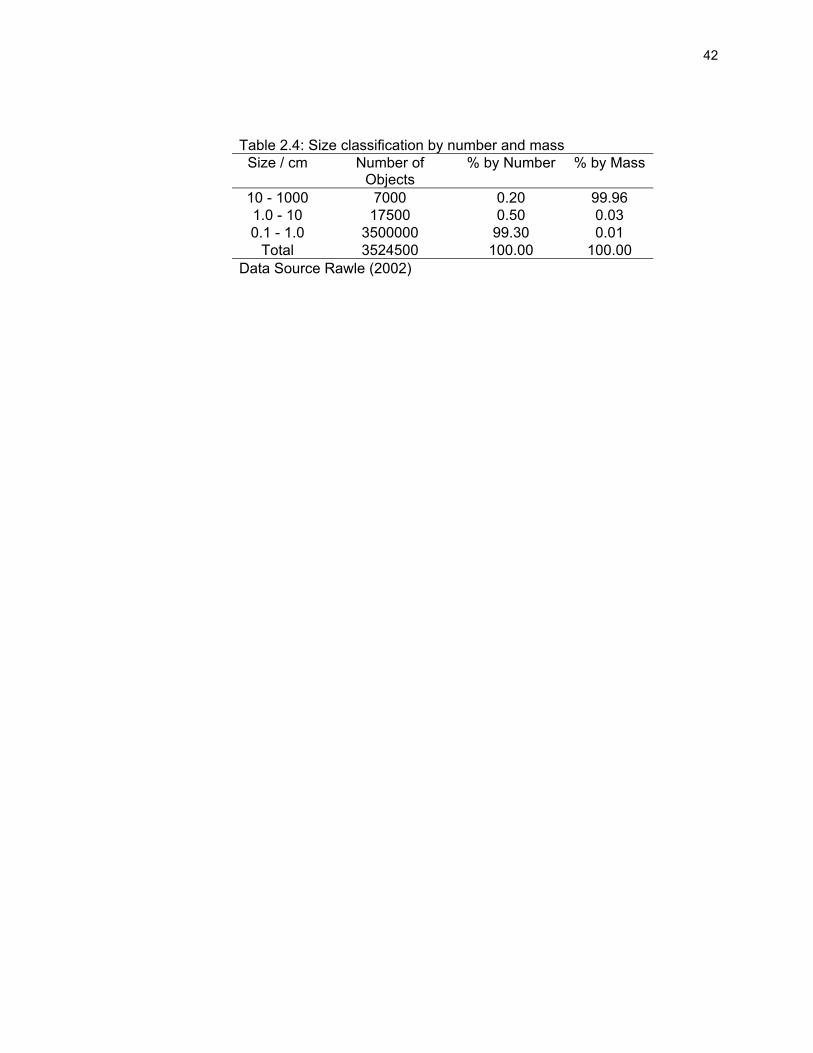
42
Table 2.4: Size classification by number and mass
Size / cm Number of Objects
% by Number % by Mass
10 - 1000 7000 0.20 99.96 1.0 - 10 17500 0.50 0.03 0.1 - 1.0 3500000 99.30 0.01
Total 3524500 100.00 100.00 Data Source Rawle (2002)

43
Figure 2.1: Example of a cumulative percentile particle size distribution by mass
Cumulative Percentile PSD
20%, 7.992
80%, 35.995
40%, 15.254
60%, 23.454
0.00%
10.00%
20.00%
30.00%
40.00%
50.00%
60.00%
70.00%
80.00%
90.00%
100.00%
0.1 1 10 100 1000
di (μm)
Cum
ulat
ive
Perc
enta
ge
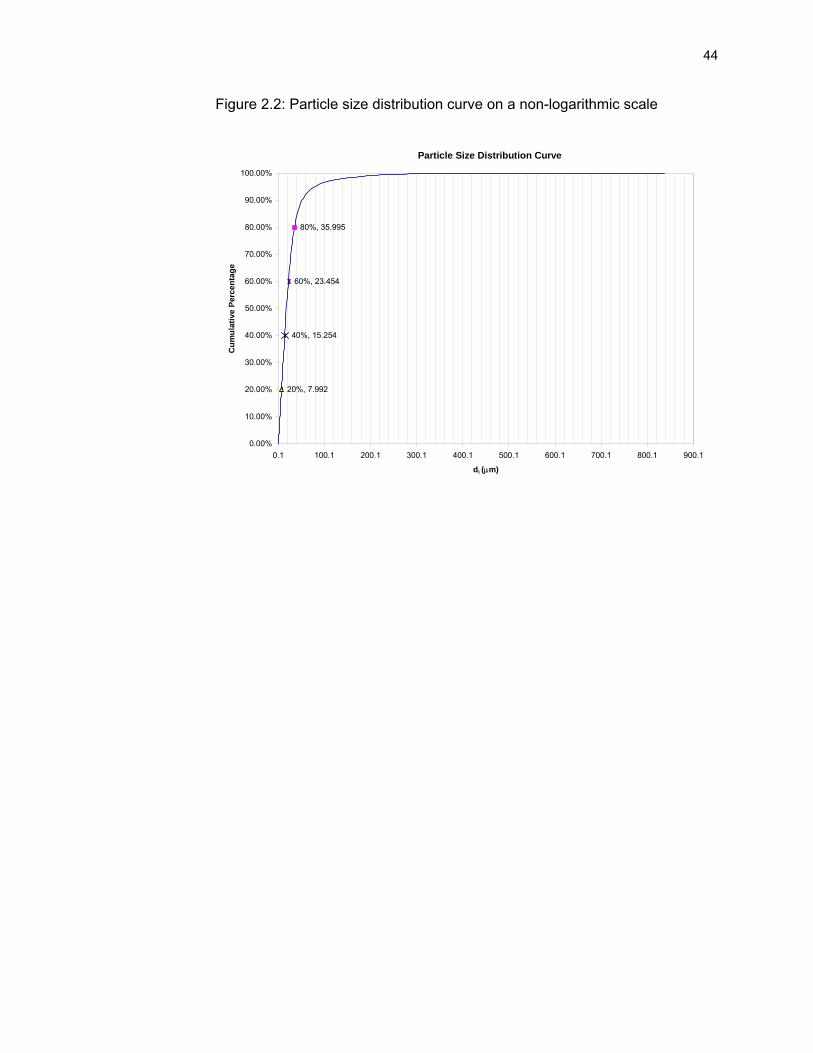
44
Figure 2.2: Particle size distribution curve on a non-logarithmic scale
Particle Size Distribution Curve
20%, 7.992
80%, 35.995
40%, 15.254
60%, 23.454
0.00%
10.00%
20.00%
30.00%
40.00%
50.00%
60.00%
70.00%
80.00%
90.00%
100.00%
0.1 100.1 200.1 300.1 400.1 500.1 600.1 700.1 800.1 900.1
di (μm)
Cum
ulat
ive
Perc
enta
ge

45
Figure 2.3: Logarithmic probability graph of two PSD curves demonstrating establishment of particles size probability and identification of PSD curve slopes.

46
Chapter 3
MILLING OF COWPEA FLOUR USING CYCLONE ASSISTED MILLING
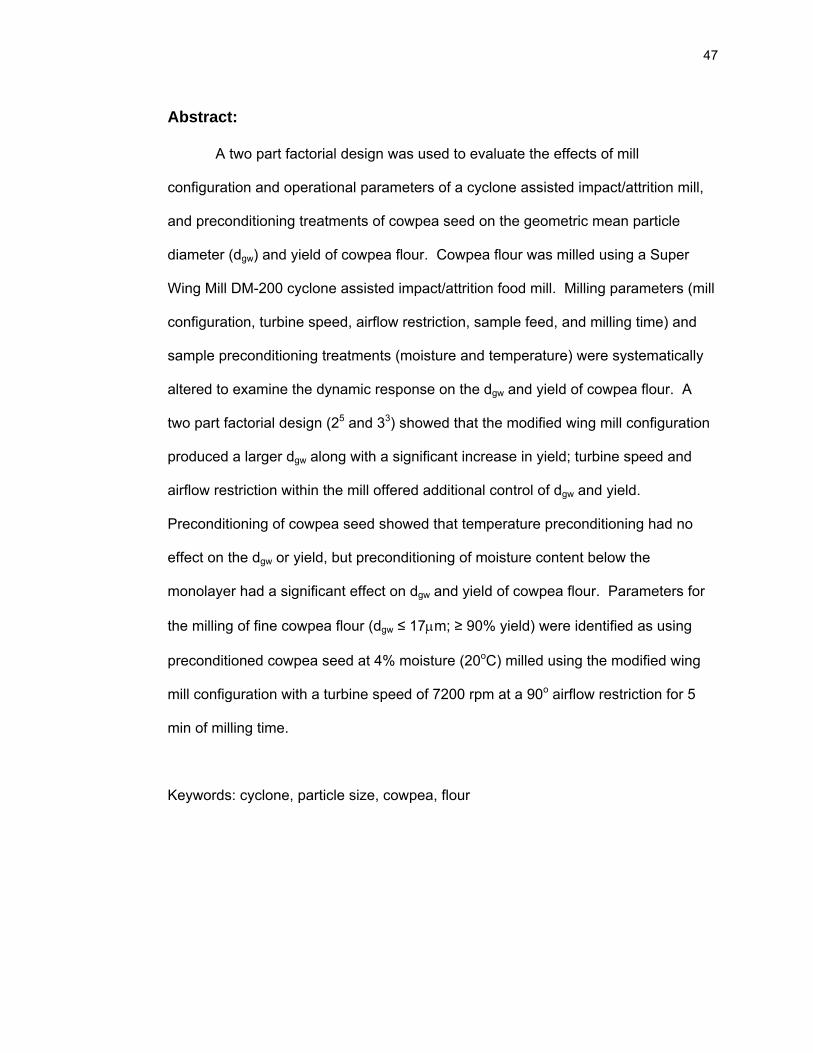
47
Abstract: A two part factorial design was used to evaluate the effects of mill
configuration and operational parameters of a cyclone assisted impact/attrition mill,
and preconditioning treatments of cowpea seed on the geometric mean particle
diameter (dgw) and yield of cowpea flour. Cowpea flour was milled using a Super
Wing Mill DM-200 cyclone assisted impact/attrition food mill. Milling parameters (mill
configuration, turbine speed, airflow restriction, sample feed, and milling time) and
sample preconditioning treatments (moisture and temperature) were systematically
altered to examine the dynamic response on the dgw and yield of cowpea flour. A
two part factorial design (25 and 33) showed that the modified wing mill configuration
produced a larger dgw along with a significant increase in yield; turbine speed and
airflow restriction within the mill offered additional control of dgw and yield.
Preconditioning of cowpea seed showed that temperature preconditioning had no
effect on the dgw or yield, but preconditioning of moisture content below the
monolayer had a significant effect on dgw and yield of cowpea flour. Parameters for
the milling of fine cowpea flour (dgw ≤ 17μm; ≥ 90% yield) were identified as using
preconditioned cowpea seed at 4% moisture (20oC) milled using the modified wing
mill configuration with a turbine speed of 7200 rpm at a 90o airflow restriction for 5
min of milling time.
Keywords: cyclone, particle size, cowpea, flour
48
Introduction:
Cowpea (Vigna unguiculata) is grown on every continent in the world with
Africa leading production at an average of 35 million metric tons per year (FAOSTAT
2005). Like most legumes, the main drawbacks to preparing cowpea for
consumption are the intensive labor processes and utilization of consumable
resources (i.e. water) that accompany these nutrient dense food sources (Dovlo and
others 1976). In recent years, the research group at the University of Georgia, Griffin
Campus, funded through USAID, has improved on ease of use of cowpea by
developing cowpea meal for use as a starting material for consumer applications
which require less water and processing time when compared to whole dry seeds
(Phillips and others 2003). Current milling research related to legumes primarily
focuses on stone, hammer, jet/turbo, and disc milling methods or combinations
thereof (Phillips and others 2003). Under normal circumstances, the geometric
mean particle diameter by mass (dgw) of legume meal or flour is often 60 to 150 μm
or greater (Kethireddipalli and others 2002; Phillips and others 2003; Singh 2003;
Singh and others 2004). It has been shown that acceptable consumer products, like
akara, can be produced from cowpea flour/meal at these dgw ranges; however, a
smaller dgw could result in greater consumer acceptability for foods like gels,
couscous, beverage mixes, and fry batter applications (Labensky and Hause 1995;
McGee 2004).
Particle-to-particle interactions (attrition milling) at the micron level have been
shown to exert abrasion/erosion forces contributing to the continued reduction in
particle size after primary milling (Gerhards and others 2004). Milling of food items
or biological materials at cryogenic or cryogenic-like temperatures has been shown
to decrease particle size in addition to retaining compositional components that may
49
be lost due to heat generated by the milling operation (i.e. volatile oils or moisture)
(Singh and Goswami 1999; Goswami and Singh 2003). In a standard cryogenic
milling operation, a sub-freezing temperature is maintained throughout the milling
operation. The cryogenic temperatures needed for successful milling of spices have
to be below the brittle point of the lipid molecules of the spice so that maximum
particle fracture can be achieved (Singh and Goswami 1999; Manohar and Sridhar
2001; Goswami and Singh 2003). Control of attrition milling parameters (i.e.
residence milling time or sample temperature) can lead to a certain degree of control
on the particle size of milled legume flour in an appropriate milling operation.
Presently, a milling operation to produce legume flour with a small dgw would require
longer or additional milling and sieving steps than the traditional milling process
currently utilizes.
The Super Wing Mill DM-200 (wing mill) can be related to a jet milling
operation in that the primary milling zone is similar in operational principle. The
milling operation consists of two types of milling forces: impact and attrition. Impact
milling occurs in the turbine housing immediately after the sample is introduced to
the wing mill. When the particle size/mass within the turbine milling chamber
becomes too small for impact milling, the particles are then subjected to attrition
milling throughout the remainder of the wing mill system. The wing mill differs from
the common jet milling operation in that it is a closed loop system that exposes food
particles to a greater frequency of particle collisions until either a particle size range
is achieved or the fluid stream alters velocity causing particles to exit out of the
system via the cyclone exit point (Gommeren and others 2000).
50
Cyclone Theory
Cyclone or gravity separators are currently used in the heating ventilation and
air conditioning (HVAC), pharmaceutical, and mineral processing industries as a
means of semi-selective particle separation/filtration (Buttner 1999; Funk and others
2003; Zhao 2005). Cyclones are easily manufactured, economically preferable for
particle filtration when compared to other methods, and have been shown to operate
over a wide range of processing and environmental conditions (Zhu and Lee 1999;
Avci and Karagoz 2003; Funk and others 2003; Zhao 2005). Cyclone applications
have been shown to be an overall efficient means of particle separation; specifically
cyclones with body diameters less than 120 mm allow for relatively efficient micron
and sub-micron particle separation without excessive modifications to current
manufacturing systems (Buttner 1999).
Operational principles of cyclones have been effectively reviewed and
elaborated upon in recent literature (Barletta and Barbosacanovas 1993; Buttner
1999; Avci and Karagoz 2003; Zhao 2005). However, a sound explanation for the
exact behavior of a cyclone has yet to be agreed upon due to the dynamic nature of
the system. In general, the inlet-tangential velocities of the particles cause
acceleration towards the wall of the cyclone body generating a centrifugal force
which forms an outer vortex along the cyclone structure wall. As the velocities of the
particles decrease from various forces, they begin to flow downward towards the
base of the cyclone where particles of a specific mass exit the system into a
collection vessel. With the application of a vortex finder located at the top of the
cyclone structure, a second internal vortex is created in which the particles that
remain in suspension escape out the top of the structure. Since the wing mill is a
51
closed system, the inner vortex causes the returning particles to reenter the central
column of the wing mill where they are exposed to additional attrition and/or
agglomeration effects (Barletta and Barbosacanovas 1993).
The aim of this study was to utilize a cyclone assisted milling operation
similar in principle to a jet mill for the production of cowpea flour with a dgw ≤ 20 μm.
Specific objectives were 1) to identify the effect of mill configuration and operational
parameters on the geometric particle mean diameter and yield of cowpea flour, and
2) identify the effects of preconditioning treatments of cowpea seed on the geometric
particle mean diameter and yield of milled cowpea flour.
Materials and Methods Cowpea (Inland Empire Foods, Riverside, CA) of the California Cream variety
(breeding line UCR 97-15-33) was used as the model crop for the milling of cowpea
flour. Cowpeas were received as dry (9.6% moisture) whole seeds with a cream
seed coat and cotyledon color and sporadic darker colored beans. The dry seeds
were manually graded to remove any stones or foreign matter. After grading, the
seeds were further dried in a forced air oven (model no. 8107; The Electric Hotpack
Co., Inc., Philadelphia, Pa., U.S.A) at 55oC to a final moisture content of 4 ±0.1%.
Calculated proximate composition of the raw product prior to milling was
approximately: 4% water, 22.9% protein, 1.99% total lipid, 3.25% ash, 10.27% total
dietary fiber, and 57.59% carbohydrate (HealtheTech 2005). The cowpea seeds
were then stored in a seed cooler (5 ± 1oC) until further processing.
A Super Wing Mill DM-200 (Sanwa Engineering Co., LTD., Japan) was used
for all milling operations in this study (fig 3.1a) with design modifications (fig 3.1b)
based on preliminary experiments (data not shown). Wing mill design modifications
consisted of repositioning of the airflow restriction valve downstream of the vortex

52
finder. The cyclone utilized in this experiment had a body diameter of 98 mm and a
cyclone height of 245 mm. A sample size of 180g of cowpea seeds was used for
each milling run; cowpea flour collected was coded and stored in Ziploc® bags at
ambient conditions.
During the experiment, the wing mill was cleaned in between millings using a
4 gal, 5.0 hp, wet/dry vacuum (model SG400; RIDGID, St. Louis, MO) which in turn
was cleaned after every 4 millings. Complete disassembly of the wing mill was
conducted after every 12 millings and the components were thoroughly cleaned
according to manufacturer’s recommendations.
Particle Size Analysis Particle size analysis was conducted using a Malvern Mastersizer S laser
diffraction system with a QSpec small volume sample dispersion unit operating at
3000 rpm (Malvern Instruments, Worcestershire, U.K.). The Mastersizer S uses the
Mie theory of light diffraction for particle size measurement which assumes an
equivalent sphere size of particles and performs particle size calculations based on
the fact that the angle of light diffraction is inversely proportional to particle size
(Rawle 2002).
To establish a standard operating procedure (SOP) for particle size
measurement of cowpea flour, 10 replicate measurements each of a dry flour and
wet flour preparation methods were conducted using a cowpea flour sample. Dry
cowpea flour sample measurements involved applying the dry flour to the sample
dispersion unit of the Mastersizer and conducting the measurement procedure per
manufacturer protocol. Wet cowpea flour sample measurement consisted of creating
three 10% suspensions (w/w) of cowpea flour and deionized water. Cowpea flour
was dispersed into deionized water using a magnetic stir plate and bar, and then
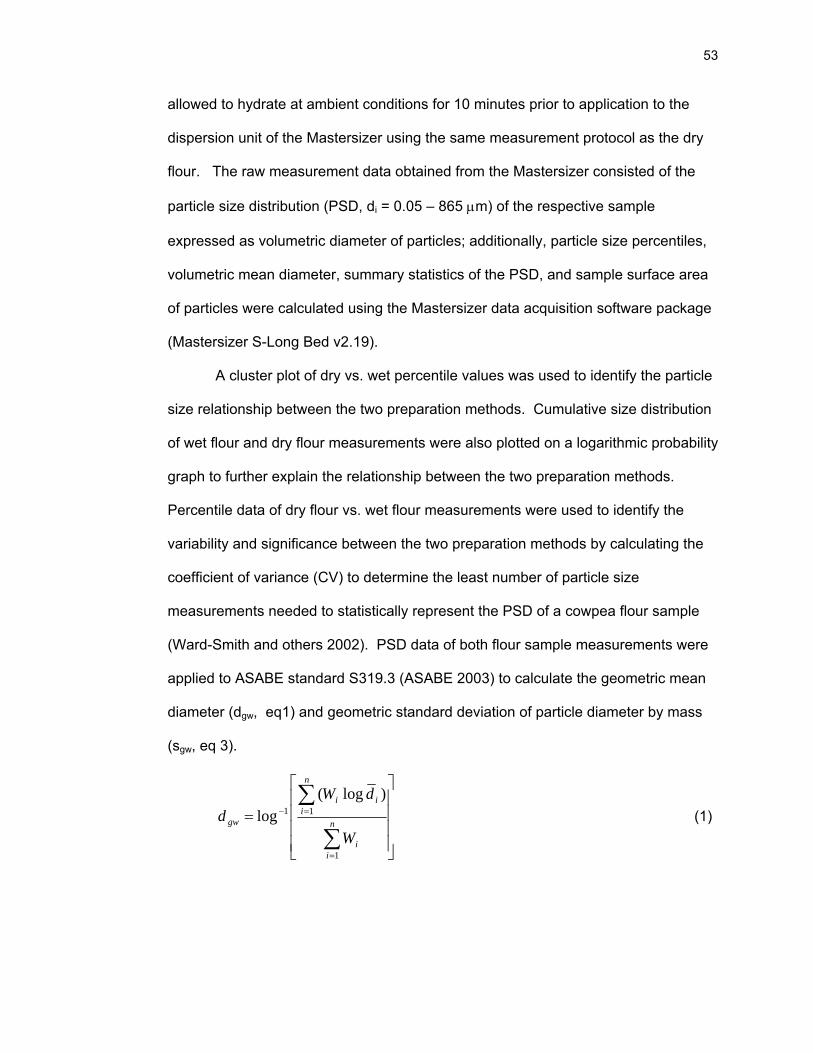
53
allowed to hydrate at ambient conditions for 10 minutes prior to application to the
dispersion unit of the Mastersizer using the same measurement protocol as the dry
flour. The raw measurement data obtained from the Mastersizer consisted of the
particle size distribution (PSD, di = 0.05 – 865 μm) of the respective sample
expressed as volumetric diameter of particles; additionally, particle size percentiles,
volumetric mean diameter, summary statistics of the PSD, and sample surface area
of particles were calculated using the Mastersizer data acquisition software package
(Mastersizer S-Long Bed v2.19).
A cluster plot of dry vs. wet percentile values was used to identify the particle
size relationship between the two preparation methods. Cumulative size distribution
of wet flour and dry flour measurements were also plotted on a logarithmic probability
graph to further explain the relationship between the two preparation methods.
Percentile data of dry flour vs. wet flour measurements were used to identify the
variability and significance between the two preparation methods by calculating the
coefficient of variance (CV) to determine the least number of particle size
measurements needed to statistically represent the PSD of a cowpea flour sample
(Ward-Smith and others 2002). PSD data of both flour sample measurements were
applied to ASABE standard S319.3 (ASABE 2003) to calculate the geometric mean
diameter (dgw, eq1) and geometric standard deviation of particle diameter by mass
(sgw, eq 3).
⎥⎥⎥⎥
⎦
⎤
⎢⎢⎢⎢
⎣
⎡
=
∑
∑
=
=−n
ii
n
iii
gw
W
dWd
1
11)log(
log (1)
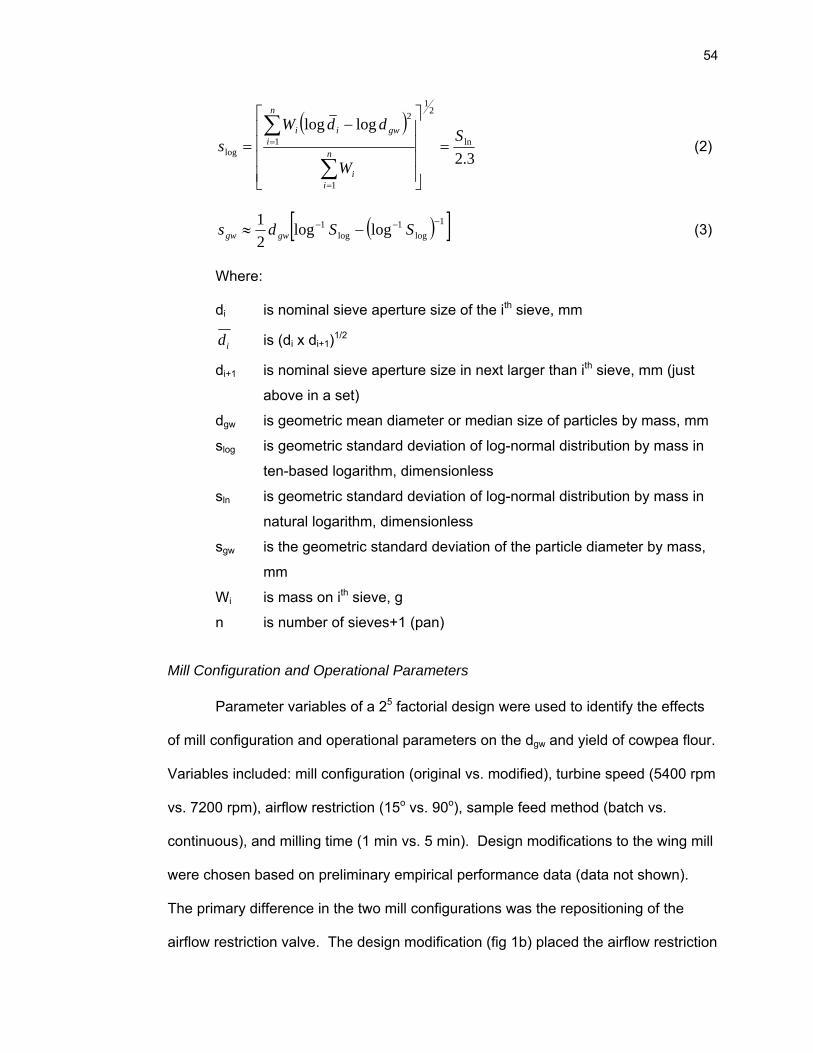
54
( )3.2
loglogln
21
1
1
2
logS
W
ddWs n
ii
n
igwii
=
⎥⎥⎥⎥
⎦
⎤
⎢⎢⎢⎢
⎣
⎡−
=
∑
∑
=
= (2)
( )[ ]1log
1log
1 loglog21 −−− −≈ SSds gwgw (3)
Where:
di is nominal sieve aperture size of the ith sieve, mm
id is (di x di+1)1/2
di+1 is nominal sieve aperture size in next larger than ith sieve, mm (just
above in a set)
dgw is geometric mean diameter or median size of particles by mass, mm
slog is geometric standard deviation of log-normal distribution by mass in
ten-based logarithm, dimensionless
sln is geometric standard deviation of log-normal distribution by mass in
natural logarithm, dimensionless
sgw is the geometric standard deviation of the particle diameter by mass,
mm
Wi is mass on ith sieve, g
n is number of sieves+1 (pan)
Mill Configuration and Operational Parameters Parameter variables of a 25 factorial design were used to identify the effects
of mill configuration and operational parameters on the dgw and yield of cowpea flour.
Variables included: mill configuration (original vs. modified), turbine speed (5400 rpm
vs. 7200 rpm), airflow restriction (15o vs. 90o), sample feed method (batch vs.
continuous), and milling time (1 min vs. 5 min). Design modifications to the wing mill
were chosen based on preliminary empirical performance data (data not shown).
The primary difference in the two mill configurations was the repositioning of the
airflow restriction valve. The design modification (fig 1b) placed the airflow restriction
55
valve downstream from the vortex finder of the cyclone; in the original design (fig 1a),
the airflow restriction valve was located immediately after the turbine housing.
Repositioning the valve impacted the mill by 1) eliminating clogging of the piping
system immediately exiting the turbine housing, and 2) in theory, allowed for indirect
control of airflow into the cyclone thus controlling the amount/size of particles drafted
into the cyclone.
The factory default turbine speed was 3600 rpm and maximum safe operating
turbine speed was 7200 rpm. Turbine speeds of 7200 rpm and 5400 rpm (midpoint
between base line and maximum speed) were selected for the experiment. Airflow
restriction (valve positioning) was in reference to the orientation of a directional valve
contained within the piping system where 90o positioning allowed for maximum
airflow, 15o positioning allowed for minimum allowable airflow, and 0o positioning
eliminated airflow in the local piping system of the valve. Batch sample feed method
consisted of loading the cowpea seed sample (180g) in 3-4 batches at 5400 rpm and
5-6 batches at 7200 rpm. Continuous feeding consisted of a constant feed of
cowpea seed into the wing mill so that the seed was consistently introduced to the
mill. Milling time values were chosen based upon preliminary work with the 5 min
milling time exhibiting no perceivable milling after the 180g of sample was fed into
the wing mill. Milling time was started after the last of the cowpea seed sample was
completely fed into the wing mill. The mill ran for the predetermined time and at the
end of the milling time the shutdown procedure began; this took 0.5 min to 2 min
depending upon the rpm setting of the wing mill.
Preconditioning Treatments of Cowpea Seed A milling procedure based on results from the milling parameter study was
identified and used for the seed preconditioning treatment study in addition to further
56
examination of airflow restriction effects on the end product. Cowpea seeds were
preconditioned to different temperatures (-80 oC, -20 oC, and 20oC) and moisture
contents (0.5%, 1.5%, and 4%) in addition to airflow restriction variation of the wing
mill (30o, 60o, and 90o). Moisture content of the cowpea seed was initially
conditioned to 4% using a forced air oven at 55oC. Saturated salt solutions of
potassium hydroxide (KOH; aw = 0.1234), potassium acetate (CH3COOK; aw
=0.2338), and potassium carbonate (K2CO3; aw =0.4314) were used to control the
relative humidity of an enclosed plastic container at room temperature to further
reduce seed moisture content and/or maintain equilibrium moisture content (EMC) at
0.5, 1.5, and 4%, respectively (Hung 1989; Ayranci and Duman 2005). EMC is “the
moisture content that a material would reach if exposed to air at a given relative
humidity and temperature” (Hung 1989). In preliminary experiments with the wing
mill (data not shown), it was observed that at seed moisture levels ≥6% the cowpea
flour would coat the interior of the mill, clog the milling operation, and/or cause a
pasting in the turbine housing to occur. A moisture content of 4% prevented the
clogging and pasting problems. Airflow restriction variations were chosen based on
the results from the study described in the previous section; these suggested that
control of the airflow exiting the cyclone could allow for a certain degree of control on
the particle-to-particle interactions. Controlling the airflow could provide a means of
controlling the yield and particle size of the cowpea flour based on the
preconditioning treatments utilized in this study.
Statistical Analysis
Data were analyzed using the general linear model (GLM) procedure; mean
separation tests were performed using Duncan’s multiple range test (SAS 2003).

57
Prediction models were generated for the prediction of dgw and yield of cowpea flour
under the various conditions evaluated in these studies.
Results and Discussion
Particle Size Measurement
Percentile data generated from the Mastersizer software were used to identify
a relationship, if any, between dry flour and wet flour measurements and secondly to
identify the least number of measurements needed to statistically represent the PSD
of a cowpea flour sample. Table 3.1 shows the averaged percentiles (20th, 40th, 60th,
and 80th) of 10 replicated PSD measurements of the wet and dry flour preparation
methods along with the calculated dgw. The only significant difference (α = 0.05)
between the two flour preparation methods was at the 40th percentile where wet
sample particles have a mean particle diameter less than 14.76 μm verses dry
sample particles having a mean particle diameter less than 15.25 μm. This particle
size difference was not observed at other percentiles, and there was also no
difference in calculated dgw.
A cluster plot of the 20th, 40th, 60th, and 80th percentiles of dry flour vs. wet
flour particle size measurements was used to identify a relationship between the two
preparation methods. Linear regression (R2=0.9869) of the cluster plot (fig 3.2)
illustrates the relationship that the dry flour particles were 93.26% the size of the wet
flour particles. Figure 3.3 shows the cumulative distribution by mass for wet flour
and dry flour preparation methods on a logarithmic probability graph. The key
element in the logarithmic probability plot is that the slope of the dry flour sample is
steeper than the wet flour sample (12.401 vs. 13.647, respectively) supporting the
linear regression of the cluster plot that the dry flour particle size was smaller
(6.74%) than the wet flour particle size (α = 0.05). Based on the linear regression

58
model (fig 3.2), overall percentile means and dgw (table 3.1), and that cowpea flour
consumer utilization would be in a hydrated state, the wet flour preparation method
was chosen for particle size analysis of cowpea flours milled in this experiment.
The CV of the mean percentile diameters from Mastersizer particle size
measurements of the wet sample preparation method were used to identify the
minimal number of replicated measurements needed to statistically represent the
PSD of a cowpea flour sample (table 3.2). In general measurement of biological
materials, a CV < 15% is an acceptable degree of precision. Overall the smallest CV
for all percentiles occurred at 10 measurement replications for the 60th percentile
(3.25) and the largest CV values occurred at three measurement replications with the
20th percentile (12.09). Gommeren and others (2000) explain that the population
balance of particles within a jet mill exhibit increasing levels of stochastic behavior as
the particle size is reduced. The wing mill relies on the same principles of particle
population balance in the attrition milling operation; as such, the CV of particle
diameter increases with decreasing particle size and reduction of measurement
repetition (table 3.2). CV values were smallest at the 60th percentile and increased
from 3.25% at 10 replicated measurements to 5.6% at 3 replicated measurements.
CV values were highest at the 20th percentile and increased from 7.86% at 10
replicated measurements to 12.09% at 3 replicated measurements. Even at 3
replicated measurements, CV values from all percentiles were still less than 15%.
Hence, 3 replicated particle size measurements of a 10% (w/w) cowpea flour
suspension was selected to accurately represent the PSD of a cowpea flour sample.
Mill Configuration and Processing Parameters
Table 3.3 shows the treatment regimens created in the factorial design and
the effects on the dgw and yield of cowpea flour. Note that feed method is not shown

59
due to this treatment level showing no significance (α = 0.05, table 3.4). Identifying
how a particular treatment regimen affects the dgw of the cowpea flour is not obvious
from this table, but table 3.3 can aid in the identification of sample yield trends based
on various regimens. The general trend for milling time shows that 1 min of milling
produced a smaller sample yield than a 5 min milling. The only exception was for the
treatment regimen of the modified configuration operating at 7200 rpm with a 15o
airflow restriction which showed a higher collection yield for 1 min than for 5 min.
However, the overall difference in milling time was significant for a 5 min milling time
to produce a higher yield of cowpea flour (table 3.4). All airflow restriction treatments
showed that the 15o restriction consistently produced a smaller yield when compared
to the counterpart of the treatment with a 90o restriction. In principle, reducing the
airflow/volume at any point in the system reduces the amount of particles that can be
retained within the fluid medium, thus contributing to a lower yield when the
airflow/volume is restricted at the 15o positioning of the airflow restriction valve
(Gommeren and others 1996; Buttner 1999). Operating the wing mill at 7200 rpm
with the restriction valve open at 90o for a 5 min milling time produced the highest
yield (94.3% to 95.5%, table 3.3).
Statistical analysis demonstrated that mill design, turbine speed, and airflow
restriction all had a significant effect on the dgw of cowpea flour; all three parameters
in addition to milling time had a significant effect on yield (table 3.4; α=0.05). The
modified wing mill configuration produced cowpea flour with a larger dgw and yield
(17.13 μm, 69.05%) than the original wing mill configuration (16.84 μm, 59.88%).
Turbine speed at 7200 rpm produced cowpea flour with a smaller dgw and greater
yield (16.80 μm, 74.45%) than a speed of 5400 rpm (17.18 μm, 54.44%). Restriction
of the airflow to 15o produced cowpea flour with a smaller dgw and yield (16.67 μm,
60
49.98%) whereas the 90o restriction produced cowpea flour with a larger dgw and
greater yield (17.30 μm, 78.95%). The only significant difference (α=0.05) in feed
method and milling time was that yield was higher at 5 min (69.55%) than for 1 min
(59.38%). Identifying a parameter that has the greatest effect on the end product is
not practical due to the dynamic nature of the system. Overall, the dgw for cowpea
flour produced in this portion of the experiment was less than 18 μm for the various
treatment regimens (table 3.3) with the exception of a modified configuration
operating at 5400 rpm using a 90o restriction for 5 min of milling producing the
largest dgw of 17.92 μm. Milling yield was significantly affected by mill configuration
and processing parameters. Table 3.4 shows that using the modified configuration
at a turbine speed of 7200 rpm with the restriction valve opening at 90o for a 5 min
milling time had a higher yield than the other corresponding conditions. Hence, the
modified configuration at a turbine speed of 7200 rpm for a 5 min milling time using
the continuous feed method was selected for the milling condition used for the seed
preconditioning study.
Preconditioning Treatments of Cowpea Seed
Table 3.5 outlines the preconditioning treatment levels of temperature (T0),
moisture, and airflow restriction along with the dgw, yield, and temperature of the
collected cowpea flour (Ti) milled in this portion of the experiment. The only apparent
trend in the various treatment regimens is that as the airflow restriction increased
(less airflow), sample yield decreased slightly. Interestingly, preconditioning the
seeds to 1.5% moisture produced a higher yield range (92.11% - 95.13%) when
compared to the yield ranges for 0.5% and 4% treatment regimens (85.82% -
95.69% and 85.15% - 90.84% respectively). Regardless of initial temperature of
61
cowpea (T0), final cowpea flour temperature (Ti) did not differ significantly (25.2 to
28.5oC).
Significant affects (α = 0.05) on the dgw and yield of cowpea flour due to the
preconditioning treatments and airflow restriction are shown in table 3.6. As
identified from findings reported in table 3.5, no cryogenic milling temperature effect
was observed in this experiment as shown by the dgw or yield of cowpea flour. Two
possible explanations for this lack of cryogenic temperature effect could be 1) the
total cowpea sample used for each milling (180 g) and its heat capacity were
relatively small compared to the thermal energy generated by the milling operation,
and/or 2) heat transfer rates to small particles are high when compared with other
operation using whole seeds.
Conditioning cowpea seed to 0.5% moisture caused the cowpea flour to have
a larger dgw (17.7 μm ±0.02) than that of the 4% moisture samples (17.4 μm ±0.02)
with 1.5% moisture samples being intermediate (17.48 μm±0.02). Preconditioning
cowpea seed to 1.5% moisture produced cowpea flour with the highest yield of
93.68%, whereas 4% moisture produced cowpea flour with the lowest yield of
89.51%. The 30o airflow restriction produced a lower cowpea flour yield of 89.63%
than the 60o and 90o openings which produced higher cowpea flour yields at 92.48
and 93.12%, respectively. Fennema (1996) stated that when moisture content is
below or at the BET monolayer, water is tightly bound and incapable of being
involved in most reactions. In this experiment, the moisture content was below the
monolayer of cowpea (4.23% at 200C) (Ayranci and Duman 2005) and this helped
minimize the potential impact of thermal energy and agglomeration associated with
milling operations of flour.

62
Conclusions
The particle size analysis of cowpea flour produced in this study can be
completed using either of the two sample preparation methods (dry flour or wet
flour). The main advantage of using the wet preparation method is based on the
intended use by the consumer in which cowpea flour would be in the hydrated form;
thus a hydrated sample measurement would be an appropriate means of particle
size measurement.
The results from this study demonstrated a reasonable degree of control, with
respect to dgw and yield, using the Super Wing Mill DM-200 for milling cowpea flour.
The modified wing mill configuration resulted in a substantial increase in cowpea
flour yield with minimal effect on the dgw. Turbine speed, airflow restriction, and
preconditioning cowpea seed moisture content exerted influential forces on the dgw
and yield of cowpea flour. Preconditioning of cowpea seeds at the selected
temperatures in this study showed no affect on the dgw or yield of cowpea flour.
Results from this study demonstrated that efficient milling of cowpea flour produced
under minimal sample treatment conditions (i.e. 4% moisture at 20oC) was
comparable to cowpea flour produced under extensive sample treatment conditions
(i.e. 0.5% moisture at -80oC).
Additional study of moisture content effects on the dgw of cowpea flour should
be conducted to explain why moisture content different than that of the monolayer
contributes significantly to particle size and yield. Moisture levels above the BET
monolayer of cowpea, in addition to a true cryogenic milling operation, could lead to
further control of the dgw and yield of cowpea flour.

63
Acknowledgements This study was supported by the Bean/Cowpea Collaborative Research
Support Program (Grant No. DAN-1310-G-SS-6008-00), U.S. Agency for
International Development and by State and Hatch funds allocated to the University
of Georgia Agricultural Experiment Station, Griffin Campus. The authors of this
paper would like to thank Mr. Glenn Farrell for his generous assistance in the design
modifications of the wing mill, Dr. Manjeet Chinnan for assistance in understanding
cyclone theory, and Dr. Nepal Singh for assistance in laser particle size analysis.

64
References ASABE. 2003. Method of Determining and Expressing Fineness of Feed Materials by
Sieving (S319.3). ASABE Standards. p 589. Avci A, Karagoz I. 2003. Effects of flow and geometrical parameters on the collection
efficiency in cyclone separators. Journal of Aerosol Science 34(7):937-55. Ayranci E, Duman O. 2005. Moisture sorption isotherms of cowpea (Vigna
unguiculata L. Walp) and its protein isolate at 10, 20 and 30 degrees C. Journal of Food Engineering 70(1):83-91.
Barletta BJ, Barbosacanovas GV. 1993. An attrition index to assess fines formation
and particle-size reduction in tapped agglomerated food powders. Powder Technology 77(1):89-93.
Buttner H. 1999. Dimensionless representation of particle separation characteristic of
cyclones. Journal of Aerosol Science 30(10):1291-302. Dovlo FE, Williams CE, Zoaka L. 1976. Cowpeas: Home Preparation and Use in
West Africa. Ottawa: International Development Research Centre. 96 p. FAOSTAT. 2005. FAOSTAT. Fennema OR. 1996. Food Chemistry. 3rd ed. New York: M. Dekker. xii, 1069 p. Funk PA, Baker KD, Hughs SE, Holt GA. 2003. Evaluating an on-line dust cyclone
performance monitor. In: Keener H, editor; Research Triangle Park, NC USA. ASABE. p 4.
Gerhards C, Kaell C, Schubert H. 2004. Measurement of attrition of agglomerated
cocoa beverage powders: a comparison of friabilator and vibration tests. Journal of Food Engineering 65(1):101-8.
Gommeren HJC, Heitzmann DA, Kramer HJM, Heiskanen K, Scarlett B. 1996.
Dynamic modeling of a closed loop jet mill. International Journal of Mineral Processing 44-5:497-506.
Gommeren HJC, Heitzmann DA, Moolenaar JAC, Scarlett B. 2000. Modeling and
control of a jet mill plant. Powder Technology 108(2-3):147-54. Goswami TK, Singh M. 2003. Role of feed rate and temperature in attrition grinding
of cumin. Journal of Food Engineering 59(2-3):285-90. HealtheTech I. 2005. USDA National Nutrient Database for Standard Reference.
Version SR18. Hung YC. 1989. Predicting the effect of drying conditions on the textural properties of
roasted peanuts. Transactions of the ASABE 32(3):968-72.
65
Kethireddipalli P, Hung YC, McWatters KH, Phillips RD. 2002. Effect of milling method (wet and dry) on the functional properties of cowpea (Vigna unguiculata) pastes and end product (akara) quality. Journal of Food Science 67(1):48-52.
Labensky SR, Hause AM. 1995. On Cooking: Techniques from Expert Chefs.
Englewood Cliffs, N.J.: Prentice Hall. viii, 1080 p. Manohar B, Sridhar BS. 2001. Size and shape characterization of conventionally and
cryogenically ground turmeric (Curcuma domestica) particles. Powder Technology 120(3):292-7.
McGee H. 2004. On Food and Cooking: The Science and Lore of the Kitchen.
Completely rev. and updated ed. New York: Scribner. x, 884 p. Phillips RD, McWatters KH, Chinnan MS, Hung YC, Beuchat LR, Sefa-Dedeh S,
Sakyi-Dawson E, Ngoddy P, Nnanyelugo D, Enwere J, Komey NS, Liu KS, Mensa-Wilmot Y, Nnanna IA, Okeke C, Prinyawiwatkul W, Saalia FK. 2003. Utilization of cowpeas for human food. Field Crops Research 82(2-3):193-213.
Rawle A. 2002. The importance of particle sizing to the coatings industry Part 1:
particle size measurement. Advances in Colour Science and Technology 5(1):1-12.
SAS. 2003. SAS. Version 9.1. Cary, NC: SAS Institute. Singh A. 2003. Enhancing the physical and functional properties of cowpea paste
used in akara production through modification of milling and paste preparation methods [Masters]. Athens, GA: University of Georgia. 159 p.
Singh A, Hung YC, Phillips RD, Chinnan MS, McWatters KH. 2004. Particle-size
distribution of cowpea flours affects quality of akara (fried cowpea paste). Journal of Food Science 69(7):S243-S9.
Singh KK, Goswami TK. 1999. Design of a cryogenic grinding system for spices.
Journal of Food Engineering 39(4):359-68. Ward-Smith RS, Gummery N, Rawle AF. 2002. Validation of wet and dry laser
diffraction particle characterization methods. 4th World Congress on Particle Technology Sydney, Australia: Malvern Instruments.
Zhao B. 2005. Development of a new method for evaluating cyclone efficiency.
Chemical Engineering and Processing 44(4):447-51. Zhu YF, Lee KW. 1999. Experimental study on small cyclones operating at high flow
rates. Journal of Aerosol Science 30(10):1303-15.

66
Figure 3.1: (a) Original configuration of a Super Wing Mill DM-200 (b) Modified configuration of the Super Wing Mill DM-200 (a) (b)
1) Hopper (sample inlet) 2) Turbine housing 3) Control Panel 4) Airflow restriction valve (0, 15, 30, 45, 60, 75, and 90o positioning) 5) Cyclone particle separator 6) Sample collection vessel 7) Vortex Finder (airflow exit point from cyclone)

67
Table 3.1: Particle volumetric diameters (μm) at selected percentiles and calculated geometric mean diameter (dgw).1 Dry2 Wet3 20% 7.99 ± 0.36 a 7.54 ± 0.59 a
40% 15.25 ± 0.28 a 14.76 ± 0.66 b
60% 23.45 ± 0.47 a 23.26 ± 0.76 a
80% 36.00 ± 1.49 a 37.29 ± 1.57 a
dgw 15.91 ± 0.3 a 16.06 ± 0.78 a
a,b Mean values in a row not followed by the same superscript letter are significantly different (α = 0.05) 1 Values represent the average of 10 replicated particle size measurements 2 Dry cowpea flour PSD measurement is the application of the dry flour directly to the QSpec dispersion unit of the Mastersizer S 3 Wet cowpea flour PSD measurement is the application of a hydrated 10% cowpea flour solution (w/w) to the QSpec dispersion unit of the Mastersizer S.
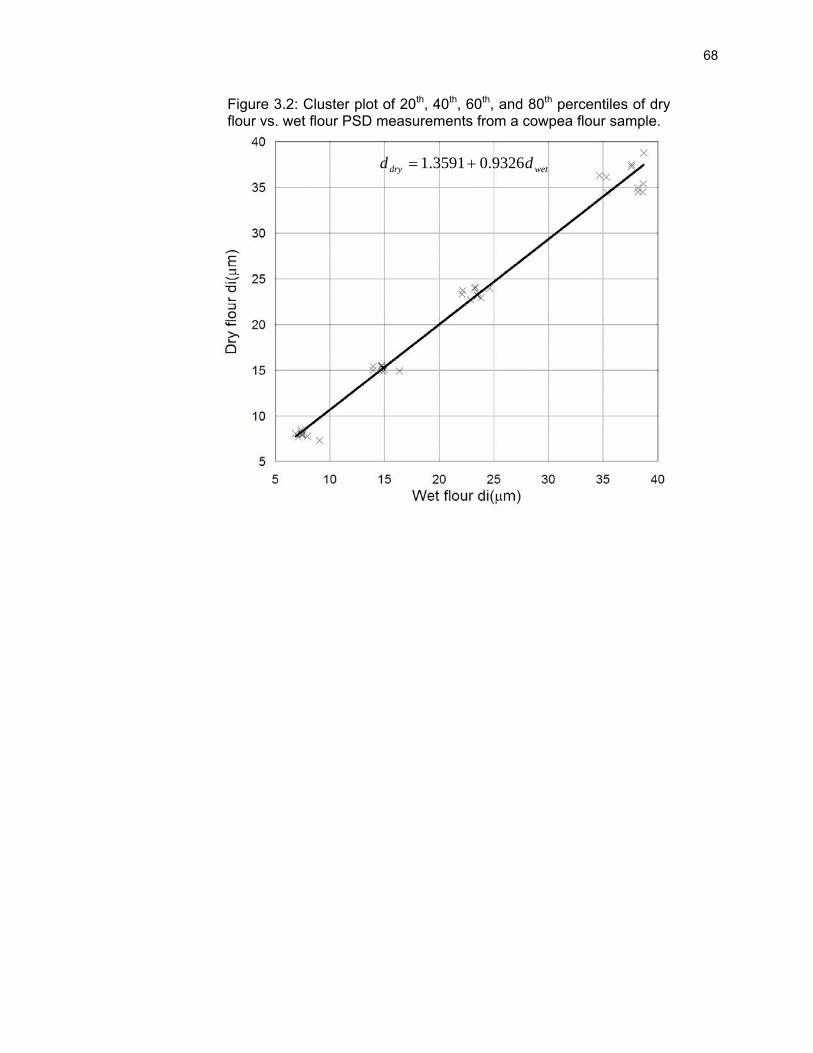
68
Figure 3.2: Cluster plot of 20th, 40th, 60th, and 80th percentiles of dry flour vs. wet flour PSD measurements from a cowpea flour sample.
wetdry dd 9326.03591.1 +=

69
Figure 3.3: Cumulative undersize distribution by mass for wet flour and dry flour preparation methods. The steeper slope of the dry flour indicates smaller particle size.
( )( )xwet eP ln1462.1*647.13=
( )( )xdry eP ln1099.1*401.12=
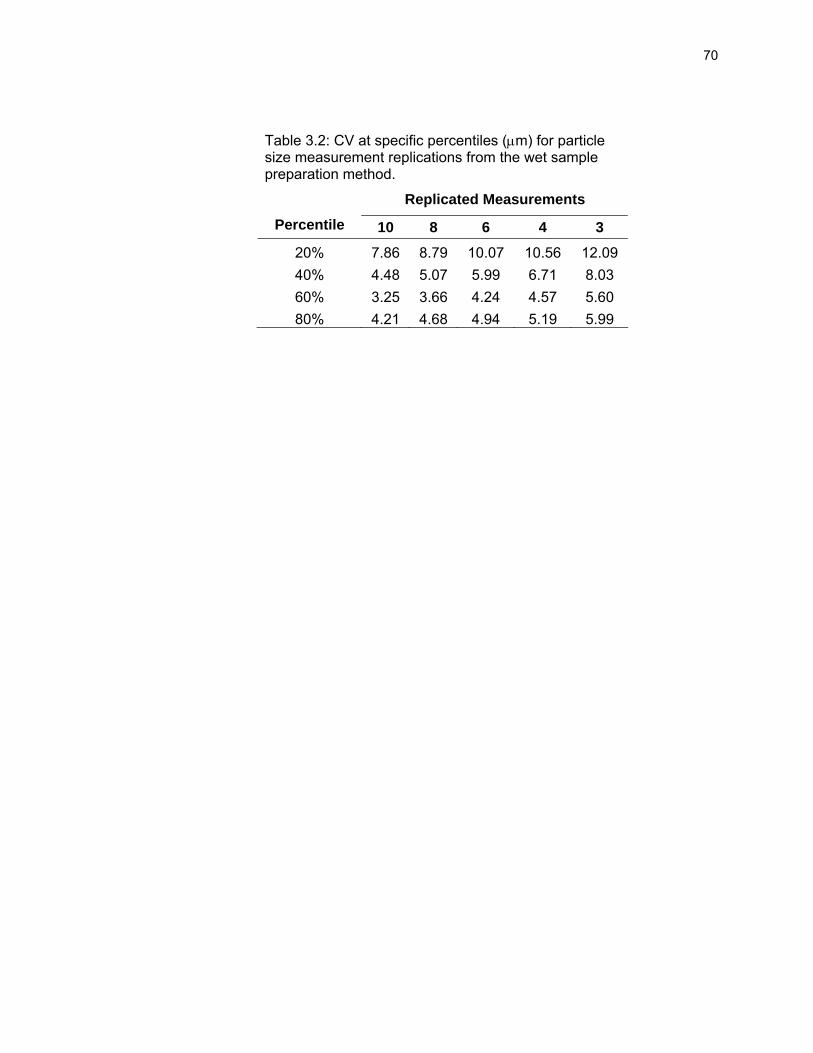
70
Table 3.2: CV at specific percentiles (μm) for particle size measurement replications from the wet sample preparation method. Replicated Measurements
Percentile 10 8 6 4 3
20% 7.86 8.79 10.07 10.56 12.09 40% 4.48 5.07 5.99 6.71 8.03 60% 3.25 3.66 4.24 4.57 5.60 80% 4.21 4.68 4.94 5.19 5.99

71
Table 3.3: Averaged results1 of mill configuration, turbine speed, valve positioning, and milling time effects on geometric mean (dgw) and yield.
Config RPM Valve Time dgw (μm) Yield
1 16.92 37.17% 15o 5 16.69 58.26% 1 16.86 49.87%
540090o
5 17.92 80.79% 1 17.21 74.40% 15o 5 16.92 69.89% 1 17.29 87.62%
Modified
720090o
5 17.26 94.39% 1 17.24 37.84% 15o 5 16.90 39.19% 1 17.07 60.14%
540090o
5 17.82 72.26% 1 15.69 37.03% 15o 5 15.78 46.07% 1 17.13 91.00%
Original
720090o
5 17.08 95.55% 1Sample feed method was not included as no significant difference was observed for geometric mean or yield (table 3.4). Results from feed method were averaged under the respective milling time treatment levels.
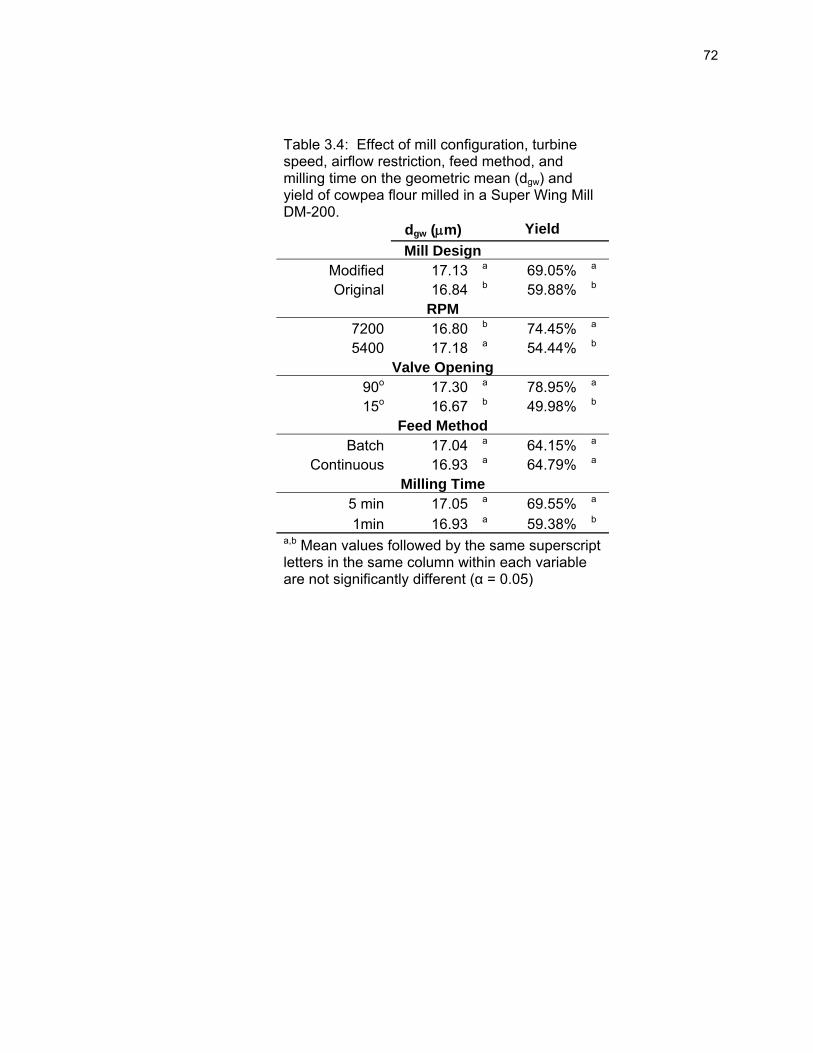
72
Table 3.4: Effect of mill configuration, turbine speed, airflow restriction, feed method, and milling time on the geometric mean (dgw) and yield of cowpea flour milled in a Super Wing Mill DM-200. dgw (μm) Yield
Mill Design Modified 17.13 a 69.05% a Original 16.84 b 59.88% b
RPM 7200 16.80 b 74.45% a 5400 17.18 a 54.44% b
Valve Opening 90o 17.30 a 78.95% a 15o 16.67 b 49.98% b
Feed Method Batch 17.04 a 64.15% a
Continuous 16.93 a 64.79% a Milling Time
5 min 17.05 a 69.55% a 1min 16.93 a 59.38% b
a,b Mean values followed by the same superscript letters in the same column within each variable are not significantly different (α = 0.05)
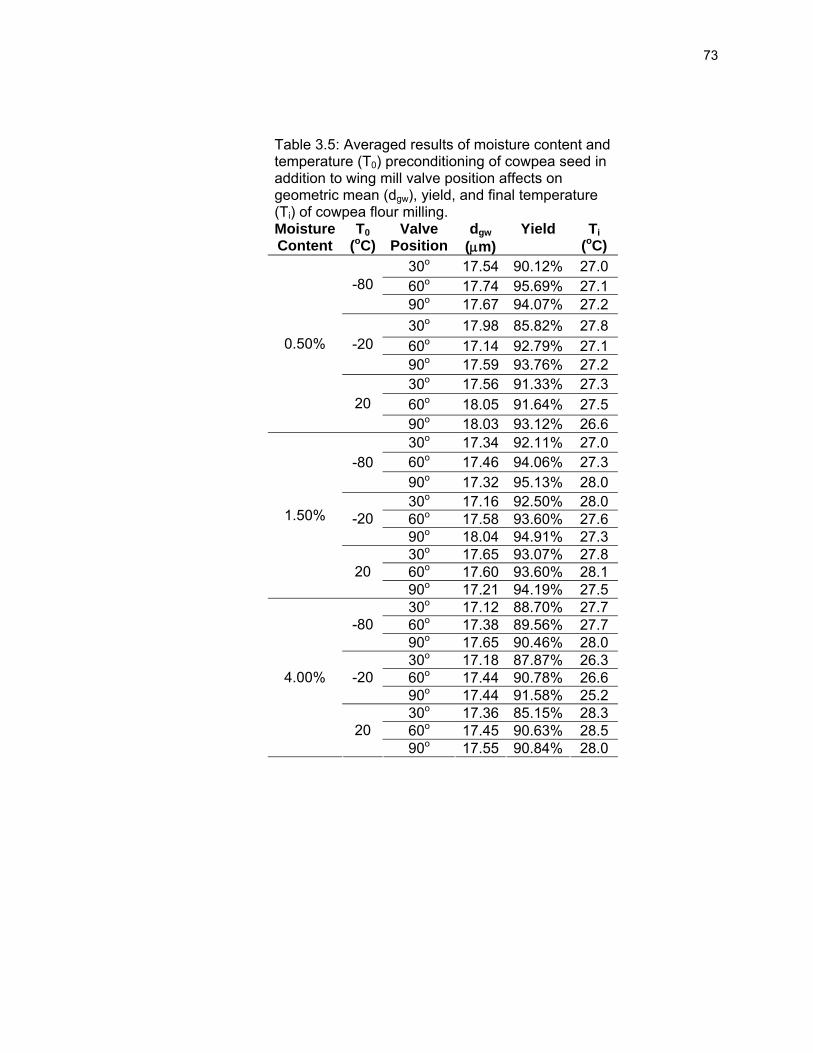
73
Table 3.5: Averaged results of moisture content and temperature (T0) preconditioning of cowpea seed in addition to wing mill valve position affects on geometric mean (dgw), yield, and final temperature (Ti) of cowpea flour milling. Moisture Content
T0 (oC)
Valve Position
dgw (μm)
Yield Ti (oC)
30o 17.54 90.12% 27.0 60o 17.74 95.69% 27.1 -80 90o 17.67 94.07% 27.2 30o 17.98 85.82% 27.8 60o 17.14 92.79% 27.1 -20 90o 17.59 93.76% 27.2 30o 17.56 91.33% 27.3 60o 18.05 91.64% 27.5
0.50%
20 90o 18.03 93.12% 26.6 30o 17.34 92.11% 27.0 60o 17.46 94.06% 27.3 -80 90o 17.32 95.13% 28.0 30o 17.16 92.50% 28.0 60o 17.58 93.60% 27.6 -20 90o 18.04 94.91% 27.3 30o 17.65 93.07% 27.8 60o 17.60 93.60% 28.1
1.50%
20 90o 17.21 94.19% 27.5 30o 17.12 88.70% 27.7 60o 17.38 89.56% 27.7 -80 90o 17.65 90.46% 28.0 30o 17.18 87.87% 26.3 60o 17.44 90.78% 26.6 -20 90o 17.44 91.58% 25.2 30o 17.36 85.15% 28.3 60o 17.45 90.63% 28.5
4.00%
20 90o 17.55 90.84% 28.0

74
Table 3.6: Geometric mean (dgw) and yield of cowpea flour produced in a Super Wing Mill DM-200 as affected by preconditioning treatments of temperature and moisture along with airflow restriction variations.
dgw (μm) Yield Sample Temp (oC)
-80 17.47 ± 0.02 a 92.21% a -20 17.51 ± 0.02 a 91.51% a 20 17.61 ± 0.02 a 91.51% a
Moisture 0.50% 17.70 ± 0.02 a 92.04% b 1.50% 17.48 ± 0.02 ab 93.68% a 4.00% 17.40 ± 0.02 b 89.51% c
Valve Position 90o 17.61 ± 0.02 A 93.12% a 60o 17.54 ± 0.02 A 92.48% a 30o 17.43 ± 0.02 A 89.63% b
a,b,c Mean values in a row not followed by the same superscript letter are significantly different (α = 0.05)

75
Chapter 4
APPLICATION OF ATTRITION MILLED SOY FLOUR IN A BEVERAGE
APPLICATION

76
Abstract
A soy beverage mix was created using thermally treated, attrition milled soy
powder, anti-caking agent (1, 1.5, and 2%), and adjunct ingredients (salt, sugar,
carrageenan, calcium phosphate) commonly found in a soy beverage. Thermal
processing of defatted soy flake at elevated moisture levels (30, 35, and 40%) from
two different sources was evaluated for effective denaturation of the soy trypsin
inhibitor complexes. The best thermal treatment condition was then used to treat soy
flakes before milling in a cyclone assisted attrition mill. Soy beverage mixes were
homogenized with a handheld blender at solution temperatures of 4, 30, and 70oC.
Separation rates were highest at all treatment levels consisting of the 70oC solution
temperature (1.67 mL/min) and lowest for all treatment levels at 4oC (0.55 mL/min).
Thermal treatment of defatted soy flake resulted in solutions with lower viscosities
(87.32 and 151.90 cPoise) and faster separation rates (0.47 and 10.33 mL/min)
within respective treatment regimens. Results from this study demonstrated that
milling of defatted soy flake resulted in reducing particle size and hence lowering
viscosities as well as slowing the suspension separation of the soy beverage.
77
Introduction
Soymilk is a traditional Asian food produced from either the filtered aqueous
extract of ground, soaked soybeans or from a fine emulsion of defatted soybean
product (soy flour or protein concentrate) and water (Liu 1997). The most common
method of manufacturing soymilk involves the soaking of soybeans for specific times
and temperatures to optimize flavor and texture attributes of the final product,
grinding the soaked beans with an appropriate amount of water to give a specific
water:bean ratio, and then filtering insoluble material (okara) so that the aqueous
extract can be further processed and packaged. Consumer preference for soymilk
varies greatly for various reasons such as flavor, texture, viscosity, and cultural
background.
Thermal processing of soymilk to reduce trypsin inhibitor (TI) content (Kunitz
and Bowman-Birk) to 10% of native soybean has been shown to produce parallel
nutritional improvement of soy protein (Hackler and others 1965). Animal feeding
studies have shown adverse effects resulting in pancreatic hypertrophy and growth
suppression (Grant 1989; Gumbmann and others 1989; Friedman and Brandon
2001) which have caused soy food processors to continue the thermal processes
that reduce TI content. Reseland and others (1996) conducted a study using 6
human participants to identify the so-called anti-nutritional effects of TI and observed
that in humans, the trypsin and chymotrypsin secretion systems have a different
feedback mechanism than in rats or chicks commonly used in previous studies.
Their observation suggests that the anti-nutritional effects of soy may not be as
detrimental to human growth and health as previously thought. Additionally, a review
on the health benefits of soy foods identified recent studies and suggests that the
Bowman-Birk inhibitor has anticarcinogenic effects (Friedman and Brandon 2001).

78
Soymilk production using the traditional process involves the removal of
insoluble particulates from the beverage before further processing. On a household
level, this is achieved by using a cloth sack whereas in industry, the filter is generally
the equivalent of a 400 mesh screen (38 μm) (Liu 1997). The relatively large (25 –
37 μm) residual particulates left in the extract can cause problems with
sedimentation or, depending on the size and quantity of the particulates, either a
gritty or grainy mouth feel (Tyle 1993). Another drawback to the traditional method is
that macronutrients, mainly fiber and some protein, are removed with the okara
which could be otherwise utilized if they were incorporated in the extract. Despite
these potential negative factors, the popularity of soymilk in the United States has
increased greatly in recent years with the approval of the FDA health claim that
consumption of 25 g of soy protein a day as part of a diet low in saturated fat and
cholesterol may reduce the risk of heart disease (USFDA 2001).
The use of soy in U.S. consumer markets is mainly limited to soy oil with the
resulting defatted soy product going into livestock feed as the primary protein source
(Liu 1997). Many consumer products utilize soy flours such as soy protein isolates
or soy flour in the health food consumer market or in the meat processing industry as
a means of improving water and fat retention (Riganakos and others 1994; Reema
and others 2004; Tripathi and Misra 2005). Soy beverage processing methods using
these defatted products have been developed; however, due to insufficient
manufacturing processes, the success was limited (Steinkraus 1973). There are
currently several products on the market aimed at creating a powder-based soy
beverage, but these products are primarily the “protein shake” style of beverage.
Microparticulation, also known as attrition milling, is often utilized in
combination with air classifiers when a small and controlled particle size of the final

79
product is desired. Microparticulation of food particles has been shown to offer
various benefits in food systems and in some cases altering the functional properties
of ingredients that would otherwise be unobtainable with the larger particle sizes
(Hayakawa and others 1993). Alteration of particle size can have a number of
effects upon a food system with the primary effects being the physicochemical
changes due to the increase of a particle’s surface area (Schubert 1987). In
beverage systems, reducing the particle size of an ingredient can improve
dispersibility, improve the overall stability of a solution, alter viscosity, and reduce
gritty/grainy tactile sensations when compared to a larger particle size (Park and
others 2001).
The aim of this study was to identify the effects of attrition milling of defatted
soy flake and incorporate attrition milled soy flour into a soy beverage-like system
that would resemble “instant soy milk”. A simulated thermal treatment of defatted
soy flake for eliminating or reducing anti-nutritional factors of soybean was also
evaluated.
Materials and Methods
Materials
Two types of defatted soy flake were used to produce the soy flours used in
this study. The first defatted soy flake was derived from L-Star® soybean (American
Soy & Tofu Corporation of America, Macon, GA) which is free of all three
lipoxygenase enzymes and has a higher content of tocopherols (5.4% vs. 1.8%)
when compared to standard soybean (America 2006). The L-Star® defatting
process involves using propane as an extraction solvent under a mild pressurized
environment resulting in less thermal energy generated during the solvent removal
process. The second defatted soy flake sample was obtained from USDA #2 soy

80
beans (Archer Daniels Midland, Decatur, IL) which was created using a flash solvent
extraction process for the removal of hexane-based solvents; this resulted in
comparatively higher thermal energy when compared to the oil extraction process of
the first soy flake sample. Moisture content of both soy flours was determined using
a vacuum oven (25mmHg) at 80oC for 18 hrs.
Thermal Treatment of Soy Flake
Van den Hout and others (1999) identified kinetics parameters at different
moisture contents of soy flour to reduce or eliminate Kunitz and Bowman-Birk TI. A
model was proposed (eqn 1) that accounts for two different first-order reaction rate
constants of the two TI complexes in order to predict the thermal treatment reduction
of soy TI.
( ) tktki eAAeCC
21 10
−− −+= (1)
Where Cx is the measured or estimated TI activity at time t (mg (g ds)-1), A is the
activity fraction (%) of the Kunitz TI at t=0, k1 is the reaction rate constant for the
Kunitz TI ((mg (g ds)-1)1-n s-1),, and k2 is the reaction rate constant for the Bowman-
Birk TI ((mg (g ds)-1)1-n s-1), and t is time in seconds. Establishment and
determination of reaction rate constants as well as activity fractions (A) for each of
the TI groups are discussed in detail by van den Hout and others (1999). In this
experiment the reference temperature used for thermal modeling was 110oC.
Soy flakes from each source were conditioned to moisture levels of 30, 35,
and 40% using a food processor (GE® 4-speed food processor, Model 106622F,
General Electric, Fairfield, CT) by addition of appropriate amounts of water and soy
flake and blending briefly without the generation of heat. The conditioned samples
were equilibrated in sealed plastic bags at 10oC for 48 hrs before thermal
81
processing. Thermal processing consisted of placing partially hydrated soy flake in
an aluminum pan with an average thickness of 5-8 mm, heating the product to 110oC
(verified with a digital thermometer equipped with thermal couples) for 5 min, then
rapidly cooling the product in a walk-in cooler (4oC). After the product was
completely cooled, thermally treated soy flake was then dried to 4% moisture in a
vacuum oven (25 mmHg, 50oC, 18 hrs).
Milling of Soy Flour
Milling of non-thermally and thermally treated soy flake (40% moisture,
110oC, 5 min) was done using a Super Wing Mill DM-200 (Sanwa Engineering Co.,
LTD., Japan) with modifications as described in Jarrard and Hung (2006).
Operational parameters for the milling of soy flour consisted of a modified mill
configuration with a turbine speed of 7200 rpm, a 90o airflow restriction valve
position, and a milling time of approximately 6 min. The predicted geometric particle
mean diameter (dgw) of milled soy flour under these parameters is less than 20 μm
(Jarrard Jr. and Hung 2006). Particle size distribution of the milled soy flour was also
measured using a Mastersizer S laser diffraction measurement system with a QSpec
small volume sample dispersion unit operating at 3000 rpm (Malvern Instruments,
Worcestershire, U.K.) as described in Jarrard and Hung (2006). Geometric mean
particle diameter (dgw) was calculated according to ASABE standard S319.3 (ASABE
2003).
Trypsin Inhibitory Assay
Thermally treated soy samples were assayed for residual TI based upon the
hydrolysis of Nα-benzoyl-DL-arginine 4-nitroanilide hydrochloride (BAPNA) by trypsin
adjusted for use in a multi-plate spectrophotometer as described in van der Ven and
82
others (2005). Trypsin (2x crystalline, salt free, 1610 BAEE units/mg) and Nα-
benzoyl-DL-arginine 4-nitroanilide hydrochloride (BAPNA) were purchased from
Sigma-Aldrich (St. Louis, MO). A SpectraMax Plus384 multi-plate reader (Molecular
Devices, Sunnyvale, CA) with data acquisition and preliminary kinetic analysis
performed by operating software SoftMax® Pro (Molecular Devices, Sunnyvale, CA)
was used to measure the trypsin hydrolysis of BAPNA. An increase of TI content in
soy flake sample will result in a reduction of hydrolysis as indicated by a lower
millioptical density (mOD) reading. A high mOD reading indicates lower contents of
TI.
TI complex was extracted from milled soy samples as described by AACC
method 22-40 (AACC 2000) by mixing 0.95 to 1 g of defatted, ground soy sample in
50 mL of 0.01N NaOH and slowly stirring with a magnetic stir bar for 3 hours. Soy
extracts were subsequently centrifuged (5 min at 18,000 g) and the supernatant was
used for the assay. Reference and calibration of the assay was measured using
purified Kunitz soybean trypsin inhibitor (KSTI) suspended in Tris buffer (0.05M
containing 20 mM CaCl2, pH 8.2) at a concentration of 1mg/mL; trypsin was
suspended in 0.001N HCl at a concentration of 0.4mg/mL. A total of 150 μL
consisting of 50 μL buffer and 100 μL trypsin was added to the first well as the blank.
Subsequent wells contained 150 μL of buffer, trypsin, and TI (soy extract or KSTI) in
a 1:3 dilution scheme. The microtiter plate was incubated for 10 min at 37oC to allow
for binding of TI and trypsin. Fifty μL of BAPNA (4 mM dissolved in 50:50 dimethyl
sulfioxide: Tris buffer [v:v] room temperature) was immediately added to each well.
The plate was immediately scanned for BAPNA hydrolysis using a multi-plate
spectrophotometer at 405 nm for 5 min with a temperature chamber set at 37oC and

83
scanning every 15 sec (3 sec plate shake prior to scan). Reaction kinetics were
measured and then reported as an arbitrary endpoint in mOD.
The IC50 for KSTI was calculated by obtaining the linear regression (mOD vs.
μg of inhibitor) over the linear portion of the reaction curve to obtain vmax (y-intercept).
Concentration of KSTI at half of vmax (vmax/2) was used as the IC50 for KSTI; IC50
values for soy samples were calculated in a similar manner. The IC50 was used to
represent the concentration of TI needed to inhibit 50% of the trypsin used under the
experimental conditions of the assay. The TI content per gram of soy sample was
then calculated and expressed as mgTI/gsample.
Water Holding Capacity
Water holding capacity (WHC) for ADM and L-Star® soy flake and powders
was determined before incorporation of adjunct ingredients as described by
Kethireddipalli and others (2002) with modifications. Soy sample in triplicate (0.2 to
0.25 g) was combined with 20 mL of deionized water (25oC) in 20 x 125 mm screw-
cap test tube and vortexed (Vortex-Genie™, model K-550-G; Scientific Industries,
Inc., Bohemia, NY, USA) for 1 min at a speed setting of 10. The samples were
allowed to hydrate at room temperature for 10 min and then vacuum filtered through
Whatman No. 50 filter paper until all residual water was filtered off. The wetted filter
paper and hydrated sample were weighed together as is. WHC was calculated as
defined in eqn 2 and reported as grams of water held per gram of dry sample.

84
(2)
Soy Flour Mixtures
Five soy flour mixture variables were used in this study and consisted of
starting material (ADM soy flake vs. L-Star® soy flake), with or without additional
milling of the soy flake, thermal (40% moisture, 110oC, 5 min) and non-thermal
treatment of soy flake, level of anti-caking agent (1, 1.5, and 2%), and temperature of
deionized water (4, 30, or 70oC for soy drink preparation. Calcium phosphate was
purchased from Fischer Chemical (Fairlawn, NJ), a carrageenan/maltodextrin mix
ideal for cold water solubility was purchased from TIC Gums (TIC Pretested® Colloid
775 Flour, TIC Gums, Inc., Belcamp, MD), anti-caking agent was purchased from
Degussa (Sipernat 500ls, 4.5 μm, Degussa, Akaron, OH), and salt and
confectioner’s sugar were purchased from a local retailer (Griffin, GA). Commercial
instant soy beverage powder “Fat Not! Crème it!” was obtained from Dixie USA, Inc.
(Tomball, TX). Pre-weighed amounts of each ingredient were mixed together and
then hand sifted 3 times using a mesh flour sifter and stored in sealed glass jars at
room temperature.
Soy Drink Preparation
Soy suspensions were created using 15.75 g of soy flour mixtures and
132.25 g of deionized water at the temperatures previously listed. The level of the
soy flour added to the suspension was calculated as having 6.25 g of soy protein per
serving (based on 240 mL serving) to comply with the FDA health claim for soy
protein and the reduced risk of cardiovascular disease (USFDA 2001). The soy flour
mix was placed into a 400 mL beaker and then water (at a specified temperature)
(Filtered Sample with paperg) – (wet paperg)
dry sampleg WHC =
85
was added to the beaker. The two components were mixed with a handheld blender
(Bamix® Mono, Mettlen, Switzerland) and then homogenized on low speed while
minimizing foaming of the suspension.
Separation Rates One hundred mL of soy suspension was transferred into a 100 mL graduated
cylinder. At predetermined time increments the level of suspension separation was
recorded and reported as milliliters of separation. After 30 minutes, the suspensions
were shaken by hand for 10 seconds and then observed for suspension separation
for an additional 10 min. Slopes of the initial separation phase (t=10 min) and
separation time after shaking (t=10 min) were calculated and reported as rate of
separation (mL/min).
Viscosity Measurement
Apparent viscosity of soy suspensions (10 mL) was measured in triplicate, at
room temperature with a Brookfield Viscometer (Model LVDV –II+, Brookfield
Engineering Laboratories, Inc., Stoughton, MA) using a small sample adapter and a
number 31 cylinder spindle at 60 rpm. Results of triplicate measurements were
averaged and reported in centipoises (cP).
Statistical Analysis
Data were analyzed using the general linear model (GLM) procedure, and
mean separation tests were performed using Duncan’s multiple range test (SAS
2003).
86
Results and Discussion
Trypsin Inhibitor Assay
The addition of BAPNA in the TI assay is a time-sensitive step such that a
difference of a few seconds can cause a difference in mOD readings within the same
sample set. As such, the values obtained for TI (mg/g) were not analyzed for
statistical significance but taken as is (table 4.1). Kwok and others (1993) state that
TI content of foods intended for human consumption should have 10 – 20% residual
TI when compared to native soybean. This paradigm of TI was originally intended to
create safe food for consumers; however, it has also been observed that
improvement of the nutritional quality of soy proteins parallels TI inhibition up to 90%
(Hackler and others 1965). The thermal treatment process used in this study
showed little to no reduction of TI content when processed samples were compared
to the respective unprocessed samples (e.g. ADM soy flake with no thermal
treatment had 49.91 mgTI/g vs. ADM soy flake at 40% moisture thermal treatment
had 52.17 mgTI/g) with the exception of the 40% moisture treatment of L-Star® soy
flour showing a reduction of 66.73 mgTI/g from the non-thermally processed L-Star®
soy flour. TI content of ADM soy flake and flours compared to native soybean
showed virtually no change due to thermal processing with the overall residual TI
content being approximately 30% of native soybean. The relatively low initial TI
content of ADM soy flake could be attributed to either the solvent removal process or
changes in USDA #2 soybean growing practices causing this initial reduction. L-
Star® soybean is a specific strain of soybean developed to contain no lipoxygenase
enzymes along with higher levels of tocopherols. A comparison of L-Star® to raw
soybean (Liu 1997) shows that the TI content is relatively similar to the common
soybean but appears to be more susceptible to thermal treatment when compared to
87
ADM soy flake at 40% moisture content vs. the 30 or 35% moisture levels in terms of
TI reduction. However, additional study should be conducted to accurately validate
this observation.
Milling of Soy Flour
The dgw of soy flour milled under the conditions in this study are reported in
table 4.2. Statistically there was no difference in dgw or sgw (α = 0.05, data not
shown) based on the type of soy flake or if the soy flake was thermally treated at
40% moisture. In a study using the Super Wingmill DM-200 for the milling of cowpea
flour, similar dgw’s (16 – 19 μm) were produced using similar processing parameters
(Jarrard Jr. and Hung 2006). Overall, the L-Star® powders had a smaller dgw under
the same treatment conditions when compared to the ADM powders; for example,
milled (“yes”) and thermally treated (“yes”) L-Star® flour had a dgw of 18.70 μm
whereas ADM had a dgw of 21.40 μm. Results of particle size analysis indicate that
the thermal treatment of soy flake at 40% moisture did not affect the final dgw of
attrition milled soy flour.
Soy Suspensions
Soy suspension studies were conducted under the premise of an “instant
beverage” use. Suspension separation measurements (mL) are reported for 1, 5,
and 10 min intervals as well as the rate of separation for the initial 10 min and the
rate of separation after suspensions were remixed for 10 seconds for a 10 min time
period (table 4.3) for suspension temperature and anti-caking treatment levels.
The level of anti-caking agent used showed no significance (α=0.05) for level
of separation at selected time intervals or for separation rates before and after
suspension remixing. Anti-caking usage at 1.5% yielded the most viscous

88
suspensions (144.94 cP) with 1% being the least viscous (111.79 cP). In an
unrelated study (data not shown) the apparent viscosity of Silk® brand soy milk (5.1
cP, WhiteWave Foods Co., Boulder, CO) was measured using the same viscometer
but with a #16 cylinder spindle operating at 60 rpm. Generally speaking, the
apparent viscosity for a representative commercial brand of soy milk has a lower
viscosity than the suspensions prepared in this study. Measurement of the
commercial beverage under the same conditions used in this study could not be
accomplished due to the reading being outside the measurement scale.
Initial suspension temperatures of 4o and 30oC at the time of homogenization
(t=0) showed no significant difference (α=0.05) for level of separation or separation
rates. The initial suspension temperature of 70oC was significantly different
(α=0.05) from 4 and 30oC for all levels of separation at 1, 5, and 10 min in addition
to both separation rates before (1.67 mL/min) and after (1.05 mL/min) remixing the
suspension. Under the conditions of this experiment, it is apparent that the 70oC
suspension temperature caused rapid separation of the suspension. Additionally,
the separated solid mass appeared to resemble a gel-like structure. This could be
attributed to either soy proteins aiding in this formation or the carrageenan forming
this network. Viscosity of the soy suspensions was highest for 30oC at 193.93 cP
with 70oC showing the lowest viscosity at 80.46 cP. However, this data is unreliable
based upon visual appearance of the suspension at the time of measurement. If a
gel structure formed upon cooling to room temperature, the remixing of the
suspension would create smaller gel-like structures giving the appearance of
uniformity but allowing for greater slippage at the surface of the cylinder surface; thus
a false reading would be obtained.
These results indicate that the soy suspensions prepared in this study would
be ideally suited for cold suspensions. Due to the rapid separation observed with the
89
70oC suspension temperature and the unusually low viscosity measurements, further
data analysis did not include the 70oC treatment.
Table 4.4 illustrates the averaged treatment level effect upon the suspension
separation at specific time intervals (1, 5, and 10 min), the rate of suspension
separation before and after remixing (mL/min), viscosity (cP), and WHC (gwater/gsolid)
of soy flake or soy powder. WHC was measured at room temperature in triplicate
and reported as grams of water held per gram of dry solid (gwater/gsolid). The origin of
soy flake, milling of soy flake, and thermal treatment process had no significant affect
(α=0.05) upon the WHC. Although no significant difference in WHC was shown, a
general trend of thermal treatment and milling of soy flake yielded a lower WHC than
a soy flake that was non-thermally treated. The WHC of soy material was
considerably lower than that of cowpea cellular material (5.33 – 19.18 gwater/gsolid), but
similar to that of cowpea pastes(1.42 – 3.80 gwater/gsolid) as reported by Kethireddipalli
and others (2002). Kerr and others (2000) observed a similar trend in cowpea flour
intended for use in snack chips where decreasing the particle size of cowpea solids
was shown to have lower water holding capacity values. The dgw of the soy flour
from this experiment had an average size of 18 μm indicating that low WHC values
were related to reduced particle sizes.
The separation trends as affected by treatment were relatively similar with the
exception of the thermally treated L-Star® soy flake that had been milled. A possible
explanation for this would be that the protein structures had a greater extent of
denaturation due to the thermal treatment process at 40% moisture. The TI assay
showed that this particular treatment had the only notable reduction in TI content; TI
reduction has also been associated with protein nutritive quality improvement which
translates to a mild degree of protein coagulation (Hackler and others 1965). The
possible protein denaturation associated with this treatment level would limit or
90
completely inhibit the functionality of the soy flour in suspension (i.e. remain in
suspension). Separation rates were notably higher for the thermally treated L-Star®
and commercial samples compared to other treatment levels. The ADM non-
thermally treated and milled sample was not significantly different in separation rate
(initial slope) from the other treatments, but this could be attributed to a small
experimental error as the value is close to that of other treatment levels.
Conclusions
The sensitivity of the TI assay is strongly dependent upon concentration of all
reagents used, specifically the time that the BAPNA reagent is in contact with the
enzyme system. TI content of thermally treated soy flake at 30, 35, and 40%
moisture content showed minimal to no reduction of TI when compared to the
respective untreated samples. Initial TI content of ADM soy flake showed an
average of 30% residual TI for all samples analyzed when compared to common raw
soybean as reported by Liu (1997). Cyclone assisted attrition milling of soy flake
using a Super Wingmill DM-200 produced a final product with an average dgw of 18
μm, which is consistent with the dgw for similar operational parameters used for
production of cowpea flour in earlier studies. Hydration properties (WHC) for this
range of dgw are in agreement with the paradigm that smaller particle sizes reduce
WHC. Creating suspensions from soy flour that had been subjected to thermal
treatment (40% moisture, 110oC, 5 min) and attrition milling produced suspensions
with an overall low viscosity. The temperature of the water used for homogenizing
the suspensions showed that relatively high temperatures produced unstable
suspensions whereas lower temperatures produced stable suspensions. In most
cases, the separation rates of the soy flour suspensions after remixing for 10 sec
were generally lower than the initial separation rates prior to remixing. The levels of

91
anti-caking agent used in this study showed no effect on the rate of suspension
separation, but did show differences in viscosity with the highest viscosity value
associated with 1.5% concentration of anti-caking agent.
Results from this study establish the basis for an instant soy beverage
system. Low temperature suspensions, using the reduced dgw soy flour and either
form (ADM or L-Star®) of soy flake, can produce a stable suspension within a 10 min
period without suspension agitation; however, optimization of the formulation should
be further explored.
Outlook
Future study should be conducted on the thermal treatment of soy flake prior
to attrition milling with the intent of reducing TI content to less than 15% of native
soybean. Health-related issues are debatable for the reduction of TI, but protein
nutritive values do increase in a parallel manner with the inhibition of TI due to
thermal treatment. As such, the protein nutritive value as affected by these thermal
studies should be measured to confirm previous findings. Additional suspension
studies should further be explored so as to identify how and why the observed gel-
like structures formed over the course of this experiment with specific focus on the
hydrocolloid interactions that appear to be the primary contributor to this effect.
Acknowledgements
The researchers of this paper would like to acknowledge Ky-anh The Nguyen
for his generous assistance with calibrating and conducting the TI assay.
92
References
America ASaTCo. 2006. www.l-starsoy.com. American Association of Cereal Chemists. Approved Methods Committee. 2000.
Approved Methods of the American Association of Cereal Chemists. 10th ed. St. Paul, Minn.: AACC. 2 v.
ASABE. 2003. Method of Determining and Expressing Fineness of Feed Materials by
Sieving (S319.3). ASAE Standards. p 589. Friedman M, Brandon DL. 2001. Nutritional and health benefits of soy proteins.
Journal of Agricultural and Food Chemistry 49(3):1069-86. Grant G. 1989. Anti-nutritional effects of soybean - a review. Progress in Food and
Nutrition Science 13(3-4):317-48. Gumbmann MR, Dugan GM, Spangler WL, Baker EC, Rackis JJ. 1989. Pancreatic
response in rats and mice to trypsin-inhibitors from soy and potato after short-term and long-term dietary exposure. Journal of Nutrition 119(11):1598-609.
Hackler LR, Vanburen JP, Steinkra.Kh, Rawi IE, Hand DB. 1965. Effect of heat
treatment on nutritive value of soymilk protein fed to weanling rats. Journal of Food Science 30(4):723-728.
Hayakawa I, Yamada Y, Fujio Y. 1993. Microparticulation by jet mill grinding of
protein powders and effects on hydrophobicity. Journal of Food Science 58(5):1026-9.
Jarrard Jr. M, Hung Y-C. 2006. Milling of cowpea flour using cyclone assisted milling.
Applied Engineering in Agriculture (Submitted). Kerr WL, Ward CDW, McWatters KH, Resurreccion AVA. 2000. Effect of milling and
particle size on functionality and physicochemical properties of cowpea flour. Cereal Chemistry 77(2):213-9.
Kethireddipalli P, Hung YC, Phillips RD, McWatters KH. 2002. Evaluating the role of
cell wall material and soluble protein in the functionality of cowpea (Vigna unguiculata) pastes. Journal of Food Science 67(1):53-9.
Kwok KC, Qin WH, Tsang JC. 1993. Heat inactivation of trypsin-inhibitors in soymilk
at ultra-high temperatures. Journal of Food Science 58(4):859-62. Liu K. 1997. Soybeans: Chemistry, Technology, and Utilization. New York: Chapman
& Hall. xxvi, 532 p. Park DJ, Imm JY, Ku KH. 2001. Improved dispersibility of green tea powder by
microparticulation and formulation. Journal of Food Science 66(6):793-8.

93
Reema, Hira CK, Sadana B. 2004. Nutritional evaluation of supplementary foods prepared from germinated cereals and legumes. Journal of Food Science and Technology-Mysore 41(6):627-9.
Reseland JE, Holm H, Jacobsen MB, Jenssen TG, Hanssen LE. 1996. Protease
inhibitors induce selective stimulation of human trypsin and chymotrypsin secretion. Journal of Nutrition 126(3):634-42.
Riganakos KA, Demertzis PG, Kontominas MG. 1994. Water sorption by wheat and
soy flour - comparison of 3 methods. Journal of Cereal Science 20(1):101-6. SAS. 2003. SAS. Version 9.1. Cary, NC: SAS Institute. Schubert H. 1987. Food particle technology. part I: properties of particles and
particulate food systems. Journal of Food Engineering 6(1):1-32. Steinkraus KH, inventor, Cornell Research Foundation, Inc., assignee. 1973. Method
for Defatting Soybean Meal. United States of America patent 3,721,569. Tripathi AK, Misra AK. 2005. Soybean - a consummate functional food: a review.
Journal of Food Science and Technology-Mysore 42(2):111-9. Tyle P. 1993. Effect of size, shape and hardness of particles in suspension on oral
texture and palatability. Acta Psychologica 84(1):111-8. USFDA. 2001. 21CFR101.82 van den Hout R, Meerdink G, Van't Riet K. 1999. Modelling of the inactivation
kinetics of the trypsin inhibitors in soy flour. Journal of the Science of Food and Agriculture 79(1):63-70.
van der Ven C, Matser AM, van den Berg RW. 2005. Inactivation of soybean trypsin
inhibitors and lipoxygenase by high-pressure processing. Journal of Agricultural and Food Chemistry 53(4):1087-92.

94
Table 4.1: Trypsin inhibitor content of soy samples (mg/g) at respective moisture levels1 and percent residual inhibitor when compared to a standard raw soybean.
TI (mg/g) %Residual Raw Soy2 171.00 -
L-Star No Treatment 123.54 72.24%
30% 122.44 71.60% 35% 130.75 76.46% 40% 56.81 33.22%
ADM No Treatment 49.91 29.19%
30% 54.86 32.08% 35% 54.47 31.85% 40% 52.17 30.51%
1 Moisture levels are in reference to moisture content at time of thermal processing (110oC for 5 min.) 2 Data obtained from Liu (1997)

95
Table 4.2: Experimental regimen effects on geometric particle mean diameter (dgw) and standard geometric deviation (sgw) of soy powder milled using a Super Wingmill DM-200.
Soybean Thermal Milleddgw
(μm) sgw
(μm) yes yes 21.40 0.03 ADM no yes 16.66 0.01 no no 58.86 0.10 yes yes 18.70 0.02 L-star no yes 15.66 0.02
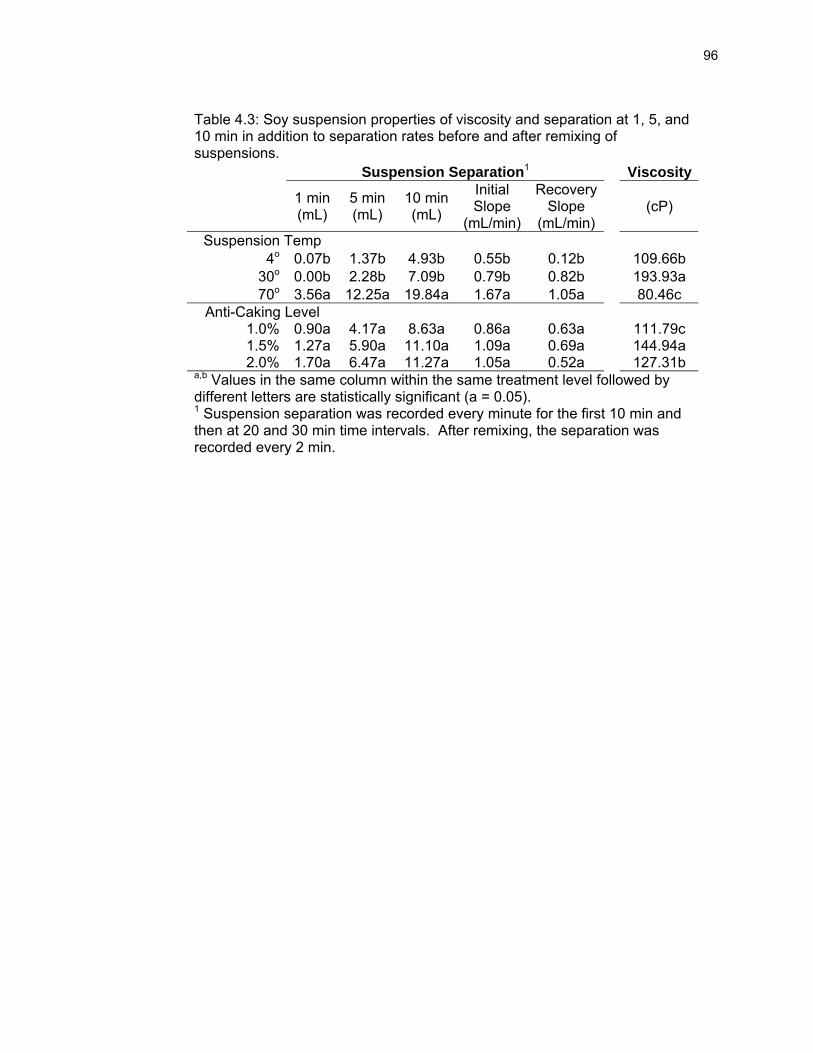
96
Table 4.3: Soy suspension properties of viscosity and separation at 1, 5, and 10 min in addition to separation rates before and after remixing of suspensions. Suspension Separation1 Viscosity
1 min (mL)
5 min (mL)
10 min (mL)
Initial Slope
(mL/min)
Recovery Slope
(mL/min) (cP)
Suspension Temp 4o 0.07b 1.37b 4.93b 0.55b 0.12b 109.66b
30o 0.00b 2.28b 7.09b 0.79b 0.82b 193.93a 70o 3.56a 12.25a 19.84a 1.67a 1.05a 80.46c
Anti-Caking Level 1.0% 0.90a 4.17a 8.63a 0.86a 0.63a 111.79c 1.5% 1.27a 5.90a 11.10a 1.09a 0.69a 144.94a 2.0% 1.70a 6.47a 11.27a 1.05a 0.52a 127.31b
a,b Values in the same column within the same treatment level followed by different letters are statistically significant (a = 0.05). 1 Suspension separation was recorded every minute for the first 10 min and then at 20 and 30 min time intervals. After remixing, the separation was recorded every 2 min.

97
Table 4.4: Averaged data for soy suspension separation, viscosity, and WHC as affected by treatment. Suspension Separation1 Viscosity WHC
Starting Material
Thermal Treatment Milled 1 min
(mL) 5 min (mL)
10 min (mL)
Initial Slope
(mL/min)
Recovery Slope
(mL/min) cP (gwater/gsolid)
No yes 0.00 1.08b 5.50abc 0.58ab 0.58a 181.00a 2.75a ADM
Yes yes 0.00 0.33b 5.08bc 0.47b 0.31a 87.32c 2.05a no 0.00 1.50b 4.08c 0.41b 0.45a 173.68ab 2.82a
No yes 0.00 0.00b 4.50c 0.42b 0.58a 165.08ab 1.91a L-Star
Yes yes 0.17 5.75a 10.33ab 1.13a 0.54a 151.90b 1.97a Crème No no 0.00 5.00a 10.50a 1.07a 0.28a - -
1 Suspension separation was recorded every minute for the first 10 min and then at the 20 and 30 min time intervals. After remixing, the separation was recorded every 2 min. a,b,c Values followed by different letters within the same column are significantly different (α=0.05)

98
Chapter 5
EFFECT OF MILLING METHOD ON THE PHYSICAL PROPERTIES OF
COWPEA FLOUR AS AN INGREDIENT IN MOIN-MOIN (STEAMED
PASTE)

99
Abstract
Moin-moin is steamed cowpea paste native to Nigeria. This product is
classified as a protein/starch gel with the dominate portion of the gel network
consisting of cowpea starch. Moin-moin was prepared from starting materials
(cowpea meal and cowpea flour) and compared to traditional moin-moin prepared
from dry, whole, undecorticated cowpea seeds. Texture profile measurements
showed that moin-moin made from cowpea flour (small particle size) formed a firmer
structure when compared to moin-moin made from either cowpea meal or whole, dry
cowpea seeds. Starting materials with smaller particle sizes and longer cooking
times produced stickier moin-moin. Generally, color was unaffected across
treatment regimens as identified by an expert sensory panel, although instrumental
color measurements showed significant differences for hue angle and chroma. This
study demonstrated that the particle size of a food ingredient contributes significantly
to its functionality in food formulations.
100
Introduction
Cowpea (Vigna unguiculata), more commonly known in the United States as
the black-eyed pea, is a staple food source for many populations throughout the
world, primarily in East and West African countries (Ehlers and Hall 1997;
Kethireddipalli and others 2002a). Fresh cowpea that is processed into a paste,
provides the basis for many traditional West African dishes; however, the traditional
process by which the paste is produced often involves large quantities of water and
manual labor (Dovlo and others 1976). Several studies have evaluated the use of
milled cowpea for production of a traditional West African product that is essentially
deep fried balls made from aerated cowpea paste (Akara); this product is consumed
in a similar manner as a hushpuppy, a fried cornmeal fritter popular in the
Southeastern United States (Davidson 1999; Singh and others 2004; Singh and
others 2005; Plahar and others 2006). The successful production of an aerated
paste from cowpea meal or flour signifies that convenience food products can be
used in place of traditional methodologies for preparation of popular foods without
sacrificing consumer quality attributes.
Moin-moin is a popular Nigerian dish prepared from steamed cowpea paste
as described by Dovlo and others (1976). The exact form of this product can be
highly variable as paste consistency, mixing temperature, cooking (steaming) time,
and cooking container or mold shape can all affect the properties of the final
structure. The general formulation of the product consists of cowpea, water, oil, and
salt with optional ingredients consisting of egg, chopped shell fish, chili peppers,
tomato puree, onion, and green pepper (Dovlo and others 1976). It is often served
with either cereals or over grains (e.g. rice) in a pudding-like fashion in either hot or
cold form.
101
Previous research on West African consumer acceptability of moin-moin
found that cowpea particle size played a significant role and that the ideal form of dry
milled cowpea starting materials should have 70-80% of the particles distributed
between 45 – 150 μm (Ngoddy and others 1986). Okechukwu and others (1991b)
found that cowpea slurries (1.8 – 3.4 water:solids ratio) had a starch rigidity onset
occurring slightly above 70oC with final gelatinization temperature of the slurry
system (8% oil, 1% salt, and cowpea solids) generally around 86oC. Ossai and
others (1987) found that deformation force curves of cowpea gels decreased with
increasing oil content but did not observe any significant response from salt
concentrations as noted in a later study by Okechukwu and others (1992).
Each of these studies on moin-moin focused on a particle size range as
identified by Ngoddy and others (1986). Kerr and others (2001) found that in the
production of cowpea snack chips, cowpea flour with reduced particle size
distributions (PSD) decreased the onset temperature of starch gelatinization (To).
Okechukwu and others (1991b) reported that textural variations of cowpea gels are
expected to reflect the distribution of maximum temperature attained in the course of
gelation. The general consensus of the previously described studies was that a
greater content of damaged starch granules occur in finer milled cowpea flour which
allows for greater extraction and unfolding of starch molecules which can then
contribute to a more extensive gel network. This gel network has also been shown
to have peak force values that will diminish at prolonged exposures to moist heat at
temperatures in excess of pasting temperature, which is typical of starch-based gels
(Okechukwu and others 1991b; Fennema 1996).
In this study, moin-moin based on the formulation of Ngoddy and others
(1986) was used to evaluate how the form of cowpea, particle size of a convenient-
to-use milled starting material, and concentration of cowpea solids affect the final

102
product properties using a combination of objective measurements and sensory
analysis.
Materials and Methods
Materials
Cowpea of the California Cream variety (breeding line UCR 97-15-33, Inland
Empire Foods, Riverside, CA) was used in this study. Whole, dry cowpeas to be
used as imbibed seeds were immersed in tap water for 18 hrs in a sealed container
at room temperature. Cowpea to be milled into flour or meal was conditioned to 4
±0.1% moisture in a forced air oven (model no. 8107; The Electric Hotpack Co., Inc.,
Philadelphia, Pa., U.S.A) at 55oC based on results from a previous study on cyclone
assisted attrition milling of cowpea (Jarrard Jr. and Hung 2006). Cowpea flour was
milled using a Super Wing Mill DM-200 (Sanwa Engineering Co., LTD., Japan) as
described by Jarrard Jr. and Hung (2006). Cowpea meal was produced using a
Hammer mill with a 2.30 mm screen (Champion, Model no. 6X14, Champion
Products, Inc., Eden Prairie, MN, USA) as described by Singh and others (2005).
Measurement of dry milled cowpea (meal and flour) particle size was done using a
Mastersizer S laser diffraction measurement system with a QSpec small volume
sample dispersion unit operating at 3000 rpm (Malvern Instruments, Worcestershire,
U.K.) in the wet sample preparation method described by Jarrard Jr. and Hung
(2006). Geometric particle mean diameter was calculated as described in previous
studies with cowpea attrition milling (Jarrard Jr. and Hung 2006). It should be noted
that all cowpea used for the preparation of moin-moin was undecorticated (seed coat
remained intact). Salt, vegetable oil, tomato puree, liquid smoke, and onion were
purchased from a local grocery store (Kroger, Griffin, GA).
103
Moin-moin Preparation
Moin-moin was prepared as previously described by Ngoddy and others
(1986) using a handheld blender (Bamix® of Switzerland, Model “Mono” 122/133,
Mettlen, Switzerland) to properly mix ingredients (table 5.1).
Moin-moin prepared from either cowpea meal or flour was partially hydrated
with 37% of the total formulation water at 70oC for 2 min before addition of the
remaining water; all water added to the moin-moin batter was heated to 70oC as
suggested by Ngoddy and others (1986). Moin-moin prepared from dry, whole
seeds used a hand held blender to puree the imbibed seeds along with all other
ingredients prior to the addition of 70oC water. Moin-moin batter (75g) was portioned
into glass ramekins (9 cmid x 3.5 cmh) coated with non-stick spray, loosely covered
with a lid, and then steamed in a household stovetop steamer (headspace
temperature was approximately 80oC) for either 20 or 40 min at ambient pressure.
Moin-moin samples to be evaluated by an expert sensory panel were removed from
the steamer and allowed to rest for 5 min uncovered and then removed from the
ramekin and allowed to rest uncovered for an additional 2 min to ensure handling
safety by the panelists. Moin-moin samples to be evaluated by objective
measurements were allowed to cool to room temperature uncovered (approximately
40 min) and then removed from the ramekin for measurement. Nutrient composition
of moin-moin samples was calculated using Master Cook v.8.0 (ValueSoft 2005).
Objective Measurements
Texture measurement
Texture Profile Analysis (TPA) and puncture tests were conducted using an
Instron Universal Testing Machine (Model 5544, Instron, Inc., Canton, MA) fitted with
a 2000 N load cell. TPA tests were conducted on duplicated cored samples (18 mmd

104
x 12 mmh) of moin-moin (total of 6 measurements per treatment regimen) using a
stainless steel plunger with a 58 mm diameter to compress the cored sample twice in
reciprocating motion each time to 25% of the original height at a cross head speed of
50 mm/min (Ossai and others 1987). Peak heights (mm), firmness (N), and energy
required for each compression (mJ) were measured from the force-deformation
curve. Firmness and energy required for compression were calculated up to the
maximum force measured during the first compression cycle. Cohesiveness,
gumminess (N), springiness (mm), adhesiveness (mJ), and chewiness (N*mm)
values of the moin-moin sample were calculated as described by Bourne (1978).
Puncture tests were performed in triplicate per moin-moin sample (total of 9
measurements per treatment regimen) in sequence across the equator of the sample
using a Magness-Taylor probe with a diameter of 8 mm at a crosshead speed of 60
mm/min to an extension of 8 mm into the sample. Probe extension (mm) at peak
force (N) and energy of the force curve (mJ) were obtained from the puncture test
curves.
Viscosity
Apparent viscosity of the moin-moin batter prior to cooking was measured
using a Brookfield Viscometer (Model HATD, Brookfield Engineering Laboratories,
Inc., Stoughton, MA) with a #3 disc spindle operating at 100 rpm after the sample
had been equilibrated to room temperature. Results are an average of triplicate
measurements and are reported in centipoise (cP).
Color measurement
Color measurements of moin-moin samples were made using a Minolta
colorimeter (Model CR-200, Osaka, Japan) calibrated with a white reference tile (L*=
94.50, x = 0.3144, y =0.3206). Three color measurements for each moin-moin
105
sample in a set of three samples (total of 9 measurements) were averaged to obtain
Hunter color vector coordinates of L*, hue angle ( ( )ab1tan−=θ ), and chroma
( ( ) ( )22 ** baC += ).
Water Holding Capacity
Water holding capacity (WHC) was measured on cowpea flour and cowpea
meal as described by Kethireddipalli and others (2002b) with modifications. A “wet
filter paper” constant to be used in the calculation of WHC was established by
averaging the weights of 10 filter paper discs that were vacuum filtered with 20 mL of
deionized water for 2 min. WHC sample measurement was conducted in triplicate by
weighing 0.2 to 0.25 g of sample combined with 20 mL of deionized water (25oC) into
a 20 x 125 mm screw-cap test tube and mixed (Vortex-Genie™, model K-550-G;
Scientific Industries, Inc., Bohemia, NY, USA) for 1 min at a speed setting of 10. The
samples were allowed to hydrate at room temperature for 10 min and then vacuum
filtered through Whatman No. 50 filter paper until all residual water was filtered off.
The filtered, hydrated sample and filter paper were weighed as is. WHC was
calculated as defined in eqn 1 and reported as grams of water held per gram of dry
sample.
(1)
Sensory Analysis: Expert Panel
Sensory analysis of moin-moin samples was conducted using an expert
sensory panel as described by Stone and Sidel (1985). Four panelists were selected
based upon either their professional knowledge of cowpea-based products or cultural
dietary choices consisting primarily of legume-based products that are similar to
(Filtered Sample with paperg) – (wet paperg)
dry sampleg WHC =

106
moin-moin. During the evaluation session, panelists were instructed to sample the
product and evaluate the sample in reference to the control (dry, whole, imbibed
seeds) which was available to all panelists during the evaluation session. Hedonic
ratings (5 or 9-point scales) or intensity ratings (150 mm line scales) were used to
evaluate the product as outlined in table 5.2.
Nine-point hedonic scales were labeled 1 as “dislike extremely” and 9 as “like
extremely” with the midpoint being “neither like nor dislike”. The evaluation
parameter of size used a 5-point hedonic scale to compare the size of a moin-moin
sample in reference to the size of the control and labeled 1 as “very small” and 5 as
“very large” with the midpoint being “same size”. Intensity scales consisted of a 150
mm line with anchor points at either end of the line. The panelists were instructed to
mark an “x” on the line proportional to the intensity of a particular evaluation
parameter as it applied to the sample being evaluated; the left portion of the line
indicated “low intensity” and the right indicated “high intensity”.
Results and Discussion
Moin-moin Composition
Nutrient composition of moin-moin with 3.25:1 water to cowpea solids ratio
was calculated using MasterCook v8.0 (ValueSoft 2005) and then compared to akara
nutrient composition (Plahar 2004). Akara was chosen to compare nutrient profiles
due to formulation similarities, and consumption of akara in West African countries is
similar to that of moin-moin. Table 5.3 lists the proximate composition of the two
products with total fat, total carbohydrates, protein and ash reported on a dry weight
basis. Overall, akara has a greater fat content compared to moin-moin (19.23% vs.
9.12%, respectively) which is expected as akara is a deep-fat fried product whereas
107
moin-moin is a steamed product. On a dry weight basis, moin-moin has a higher
concentration of carbohydrates (63.85%) and protein (24.32%) compared to akara.
Although the nutrient profiles of akara and moin-moin are fairly similar as
reported in this study, empirical verification should be conducted under the
justification that alterations of cowpea material particle size may not be properly
factored into computer database calculations. Additionally, the moin-moin prepared
in this study focused upon texture of the product and not upon the organoleptic
properties. Formulation optimization of moin-moin to improve consumer preference
could significantly alter the present nutrient profile.
Objective Measurement: Results
Texture Profile Analysis
Geometric particle mean diameters (dgw) of cowpea flour (dgw = 17 μm) and
cowpea meal (dgw = 376.7 μm) were shown to significantly alter the textural structure
of moin-moin prepared in this experiment. Table 5.4 shows the significant
differences (α=0.05) for the TPA of moin-moin samples at room temperature based
upon starting material used, water:cowpea solids ratio, and cooking time. The
overall treatment effect of using cowpea flour produced a firmer product as indicated
by the firmness and energy of the first compression (27.93 N, 69.59 mJ).
Additionally, the cohesiveness (0.28), gumminess (7.39 N), springiness (2.47 mm),
and chewiness (19.26 N*mm) of moin-moin prepared from cowpea flour were
significantly higher (α=0.05) than moin-moin prepared from imbibed cowpea seed or
cowpea meal. The adhesiveness of moin-moin prepared from cowpea flour was the
lowest (0.65 mJ) suggesting that the significantly smaller particle size of cowpea flour
108
had a greater degree of amylose-lipid complex formation as observed in earlier
studies with moin-moin (Ossai and others 1987; Okechukwu and others 1992).
The significant differences (α=0.05) of water:cowpea solids ratio are better
observed in table 5.5, but table 5.4 shows that a 3.75:1 ratio (mid range) produced
higher values for gumminess (5.95 N), springiness (2.10 mm), and chewiness (15.73
N*mm) with the dilute system (4.25:1) having the lowest values (2.58 N, 1.53 mm,
and 4.68 N*mm, respectively). Cooking the moin-moin samples for a shorter period
of time (20 min vs. 40 min) produced an overall firmer product (24.99 N, 64.45 mJ).
However, 40 min cooking times yielded products that were “stickier” as indicated by
cohesiveness (0.22) and adhesiveness (1.27 mJ) values.
Table 5.5 identifies the specific measurement values for TPA measurements
as affected by treatment levels. The general trends are the same as observed in
table 5.4, but specific trends are better represented in this format. Cowpea material
with smaller particle sizes (cowpea flour) had overall higher force values (e.g.
firmness and gumminess) when compared to either the cowpea meal or imbibed
cowpea seeds under similar treatment regimens. Overall, the lower concentrations
of water:cowpea solids (3.25:1 and 3.75:1) had similar and higher force values than
the dilute system (4.25:1) indicating that firmer gel structures were obtained at these
lower concentrations.
Cohesiveness values for cowpea flour moin-moin with a cooking time of 40
min had a higher range (0.30 – 0.42) than the 20 min cooking time samples (0.20 –
0.24) for the same treatment regimens; a similar response was also observed for
adhesiveness. The same trends observed for cowpea flour were not observed for
cowpea meal. This difference can be explained due to the larger particle size of the
meal which retained more intact starch granules vs. damaged starch granules; this
109
would require greater amounts of time, temperature, and moisture to achieve similar
responses as observed for cowpea flour.
WHC, Color, Viscosity, and Puncture Test The WHC of cowpea meal (2.14 g/g) and cowpea flour (1.66 g/g) prepared
under the conditions of this experiment were significantly different (α = 0.05). These
values are similar to WHC found in similar studies for the preparation of cowpea
starting materials intended for production of cowpea snack chips and paste (Kerr and
others 2000; Kethireddipalli and others 2002b).
Table 5.6 lists color vector values, viscosity, and puncture tests for moin-moin
samples that had been cooled to room temperature. The most significant (α=0.05)
color finding showed that chroma values for moin-moin sample prepared from
cowpea flour at a 3.25:1 concentration yielded a product with a more intense,
saturated color than a product made from cowpea meal at a 4.25:1 concentration.
Even though hue angles were significant for the various treatment levels, the
differences (at best) were only 0.03o.
The significantly (α=0.05) higher apparent viscosity of moin-moin prepared
from imbibed cowpea seeds (733.33 cP) could be the result of interference of pieces
of intact seed coat material at the interface between sample and spindle.
Kethireddipalli and others (2002b) state that reducing particle size reduces the
viscosity of cowpea pastes, which is supported in the present study by cowpea flour
samples having a lower viscosity than cowpea meal systems (404.78 vs. 522 cP).
As moin-moin batter became more dilute the viscosity decreased (631.33 to 356.50
cP).
Puncture tests showed that increasing the particle size of starting material
significantly (α=0.05) decreased peak force of moin-moin samples (2.26 N to 1.67
110
N). Increasing the ratio of water:cowpea solids significantly (α=0.05) decreased
peak force values (2.21 N to 1.28 N). Water:cowpea solids ratios of 3.25 and 3.75
had similar puncture energies (7.98 and 8.30 mJ, respectively) whereas the dilute
system of 4.25 required the least amount of energy to puncture (4.62 mJ). Peak
force extension values were highest for cowpea flour (7.26 mm) and at a 3.75:1 ratio
(6.92 mm) suggesting that this particle size range and concentration produced the
firmest gel structure. Lastly, cooking time showed that a firmer product was
produced from moin-moin cooked at 20 min than 40 min (2.21 N, 7.42 mJ vs. 1.67 N,
6.72 mJ, respectively).
Objective Measurements: Discussion
Kerr and others (2000) reported that as particle size of cowpea flour/meal
mixtures decreased, a reduced WHC was observed. In the same study, they also
reported higher values of extractable starch as the particle size of the cowpea
mixtures decreased. Based upon this observation, the dgw of cowpea flour produced
from attrition milling would have a significantly greater amount of damaged or free
starch when compared to the cowpea meal milled using the Hammer mill. In
general, at the temperatures used to measure the WHC of the cowpea starting
materials starch is relatively insoluble, thus lower WHC values were measured due
to the dgw of the starting material decreasing.
Okechukwu and others (1991a; 1991b) reported that the gelatinization onset
temperatures (To) for cowpea slurries decreased with increasing water:solids ratios
and with decreasing particle size. Kerr and others (2000) reported To of 74oC for a
61% moisture cowpea slurry with the cowpea flour particles less than 148 μm. A
typical Brabender Visco/amylo/graph curve (Fennema 1996) for starch shows that
shortly after To the viscosity of the starch solution rapidly increases with increasing
111
temperature due to the swelling of the starch granules. Continuation of heating,
either due to time or increasing temperature will result in rupture of swollen starch
granules causing the release of amylose and decreasing the strength of typical
effects observed upon cooling of a cooked starch paste.
Higher peak force values (TPA and puncture tests) were observed for moin-
moin samples prepared from cowpea flour (smaller particle size), 3.75:1 water to
cowpea solids ratio, and shorter cooking time. These three trends suggest that the
cooking treatment produced maximum starch swelling at these conditions and upon
cooling maximum binding of amylose chains. The transition from a firm to a sticky
gel between the 20 and 40 min samples suggests that starch is fully gelatinized near
the 20 min cooking time, but relatively prolonged cooking times causes deformation
of starch granules resulting in a reduction of junction zone formation (Okechukwu
and others 1992; Fennema 1996; Kerr and others 2000). The cowpea flour used in
the present experiment had a dgw of 17 μm and moin-moin samples were cooked in a
stovetop steamer with a headspace temperature range of 75 – 80oC. Under the
experimental conditions used for the preparation of moin-moin from cowpea flour, it
is suggested that the To was achieved slightly before or at 20 min of cooking time
with maximum starch swelling occurring near 20 min of cooking (depending on
product formulation); rupture of starch granules probably occurred after this point,
based upon the observations from TPA and puncture tests and previous
observations of moin-moin and cowpea particle size (Okechukwu and others 1991b;
1992; Kerr and others 2000; Kethireddipalli and others 2002b).
Expert Sensory Panel
The results from the expert sensory panel (table 5.7) are subjective ratings
from panelists who were familiar with legume-based products from either a research

112
or cultural dietary standpoint. Overall, there was no significance (α=0.05) for the
visual appeal, surface sogginess, surface moisture, size, chewiness, starchy mouth
feel, beany flavor, and overall liking of the moin-moin samples prepared under the
conditions of this study (data not shown). The individual ratings recorded for many
of these attributes had highly variable responses; however, upon averaging the data
these differences became much less with many of the averaged results occurring in
the midrange of respective scales.
The cohesiveness intensity ratings from the sensory analysis show that upon
mastication moin-moin samples prepared from cowpea flour had a greater intensity
(more cohesive structure) than moin-moin prepared from either imbibed cowpea
seeds or cowpea meal (92.08 vs. 66.63 or 70.30). A similar trend was shown in the
TPA of moin-moin made from cowpea flour having the greatest cohesiveness ratio
(0.24) vs. imbibed cowpea seeds (0.12) or cowpea meal (0.14) samples.
Springiness intensity ratings of moin-moin were greatest for samples prepared from
cowpea flour (83.82) whereas the lowest values were recorded for imbibed cowpea
seed samples (47.37); the same trend was observed in the TPA of moin-moin made
from cowpea flour (2.47 mm) having the greatest value and that from imbibed
cowpea seeds (0.88 mm) the lowest. Lastly, color intensity of moin-moin was shown
to be the greatest for samples prepared from cowpea flour (58.56); chroma values
also reflected greater color intensity (24.25) for cowpea flour moin-moin.
The surface smoothness of moin-moin prepared from imbibed cowpea seeds
received a significantly lower intensity rating (28.75) than moin-moin prepared from
either of the other two starting materials. This can be attributed to inefficient
homogenization of the cowpea seed coats from the imbibed seeds during the
blending phase of moin-moin preparation; in the case of either of the other starting
materials, this was not a problem as the size of the seed coat was reduced during

113
the milling operations. Similarly, the texture rating was lower for the imbibed cowpea
seed moin-moin (3.75) when compared to moin-moin prepared from either of the
other two starting materials. Although chewiness showed no significant difference, it
is interesting to note that moin-moin prepared from imbibed cowpea seeds had a
higher value (16.00) than either of the other two starting materials which had similar
values (10.18, 10.94). Furthermore, cooking times were shown to produce a stickier
product at longer cooking times based on objective measurements, yet the panelists
found that the firmer produces required fewer chews before comfortably swallowing
the sample. The general handling ratings showed significant difference (α=0.05) for
starting material and cooking times, yet all values were within the “neither dislike nor
like” range suggesting that improvement at all levels is necessary.
Conclusions
The conclusions from this study support the paradigm that reducing particle
size alters the functional properties of a food ingredient. Moin-moin prepared from
cowpea flour was shown to produce an overall firmer product than that prepared
from imbibed seeds or meal. The ratio of water to cowpea solids show that the mid
range used in this study (3.75:1) created firmer products than either of the other two
ratios (3.25:1 or 4.25:1) suggesting that the amount of water in the 3.75:1 system is
the ideal amount necessary to maximize gelatinization of cowpea starch. A 20 min
cooking time produced a firmer product than at 40 min whereas the 40 min cooking
time produced a stickier product. Moin-moin prepared from cowpea flour with dgw of
17μm showed significantly smaller adhesiveness values (TPA) than that made from
either the imbibed cowpea seeds or cowpea meal suggesting that amylose-lipid
complexes were easily formed due to the smaller particles sizes (increased surface
area). The objective measurements from this study accurately identified how

114
cowpea starting material, the water:solids ratio, and cooking time affected the texture
of the final product. Subjective sensory evaluations from this study vaguely identified
preference based upon various treatment conditions; however, conclusive results
would require a larger sensory panel.
Outlook
It is suggested that future research focus upon consumer preference as it
relates to firmness and stickiness-related attributes of moin-moin or similar products.
Objective measurements can provide a means of initial indicators of consumer
preference as it relates to firmness and stickiness-related attributes during
formulation trials once an ideal consumer texture has been identified. Flavor of
moin-moin should be evaluated as this study focused only on the textural aspects of
the product.
Acknowledgements
This study was supported by the Bean/Cowpea Collaborative Research
Support Program (Grant No. DAN-1310-G-SS-6008-00), U.S. Agency for
International Development and by State and Hatch funds allocated to the University
of Georgia Agricultural Experiment Station, Griffin Campus. The authors would also
like to thank Mr. Glenn Farrell for his assistance with procedural development of
texture measurements for moin-moin samples.
115
References
Bourne MC. 1978. Texture profile analysis. Food Technology 32(7):62-67. Davidson A. 1999. The Oxford Companion to Food. Oxford: Oxford University Press.
xviii, 892 p. Dovlo FE, Williams CE, Zoaka L. 1976. Cowpeas: Home Preparation and Use in
West Africa. Ottawa: International Development Research Centre. 96 p. Ehlers JD, Hall AE. 1997. Cowpea (Vigna unguiculata L Walp). Field Crops
Research 53(1-3):187-204. Fennema OR. 1996. Food Chemistry. 3rd ed. New York: M. Dekker. xii, 1069 p. Jarrard Jr. M, Hung Y-C. 2006. Milling of cowpea flour using cyclone assisted milling.
Applied Engineering in Agriculture (Submitted). Kerr WK, Ward CDW, McWatters KH, Resurreccion AVA. 2001. Milling and particle
size of cowpea flour and snack chip quality. Food Research International 34(1):39-45.
Kerr WL, Ward CDW, McWatters KH, Resurreccion AVA. 2000. Effect of milling and
particle size on functionality and physicochemical properties of cowpea flour. Cereal Chemistry 77(2):213-9.
Kethireddipalli P, Hung YC, McWatters KH, Phillips RD. 2002a. Effect of milling
method (wet and dry) on the functional properties of cowpea (Vigna unguiculata) pastes and end product (akara) quality. Journal of Food Science 67(1):48-52.
Kethireddipalli P, Hung YC, Phillips RD, McWatters KH. 2002b. Evaluating the role of
cell wall material and soluble protein in the functionality of cowpea (Vigna unguiculata) pastes. Journal of Food Science 67(1):53-9.
Ngoddy PO, Enwere NJ, Onuorah VI. 1986. Cowpea flour performance in akara and
moin-moin preparations. Trop Sci 26:101-19. Okechukwu PE, Rao MA, Ngoddy PO, McWatters KH. 1991a. Flow behavior and
gelatinization of cowpea flour and starch dispersions. Journal of Food Science 56(5):1311-5.
Okechukwu PE, Rao MA, Ngoddy PO, McWatters KH. 1991b. Rheology of sol-gel
thermal transition in cowpea flour and starch slurry. Journal of Food Science 56(6):1744-8.
Okechukwu PE, Rao MA, Ngoddy PO, McWatters KH. 1992. Firmness of cowpea
gels as a function of moisture and oil content, and storage. Journal of Food Science 57(1):91-5.
116
Ossai GEA, Jowitt R, Brennan JG. 1987. The effects of oil, egg and salt content on some physical properties of canned moinmoin. Journal of Food Engineering 6(3):231-9.
Plahar MA. 2004. Modification of the textural characteristics, oil absorption, and
protein content of fried cowpea paste (akara) during production [Electronic]. Athens, GA: University of Georgia. 119 p.
Plahar MA, Hung YC, McWatters KH, Phillips RD, Chinnan MS. 2006. Effect of
saponins on the physical characteristics, composition and quality of akara (fried cowpea paste) made from non-decorticated cream cowpeas. Lwt-Food Science and Technology 39(3):275-84.
Singh A, Hung YC, Corredig M, Phillips RD, Chinnan MS, McWatters KH. 2005.
Effect of milling method on selected physical and functional properties of cowpea (Vigna unguiculata) paste. International Journal of Food Science and Technology 40(5):525-36.
Singh A, Hung YC, Phillips RD, Chinnan MS, McWatters KH. 2004. Particle-size
distribution of cowpea flours affects quality of akara (fried cowpea paste). Journal of Food Science 69(7):S243-S9.
Stone H, Sidel JL. 1985. Sensory Evaluation Practices. Orlando: Academic Press. xi,
311 p. ValueSoft. 2005. MasterCook. Version 8.0.03.01. Chaska, MN.

117
Table 5.1: Moin-moin formulations used for objective and sensory analysis. Water:Cowpea ratio
Ingredient 3.25:1 3.75:1 4.25:1 Cowpea1 21.32% 19.06% 17.24% Water2 69.31% 71.47% 73.28% Tomato paste 2.06% 2.06% 2.06% Onion puree 2.06% 2.06% 2.06% Salt 1.44% 1.44% 1.44% Oil 3.71% 3.71% 3.71% Liquid smoke 0.21% 0.21% 0.21% 1 Calculated as cowpea solids, moisture free 2 Calculated as total water (added water and water in the cowpea fraction)
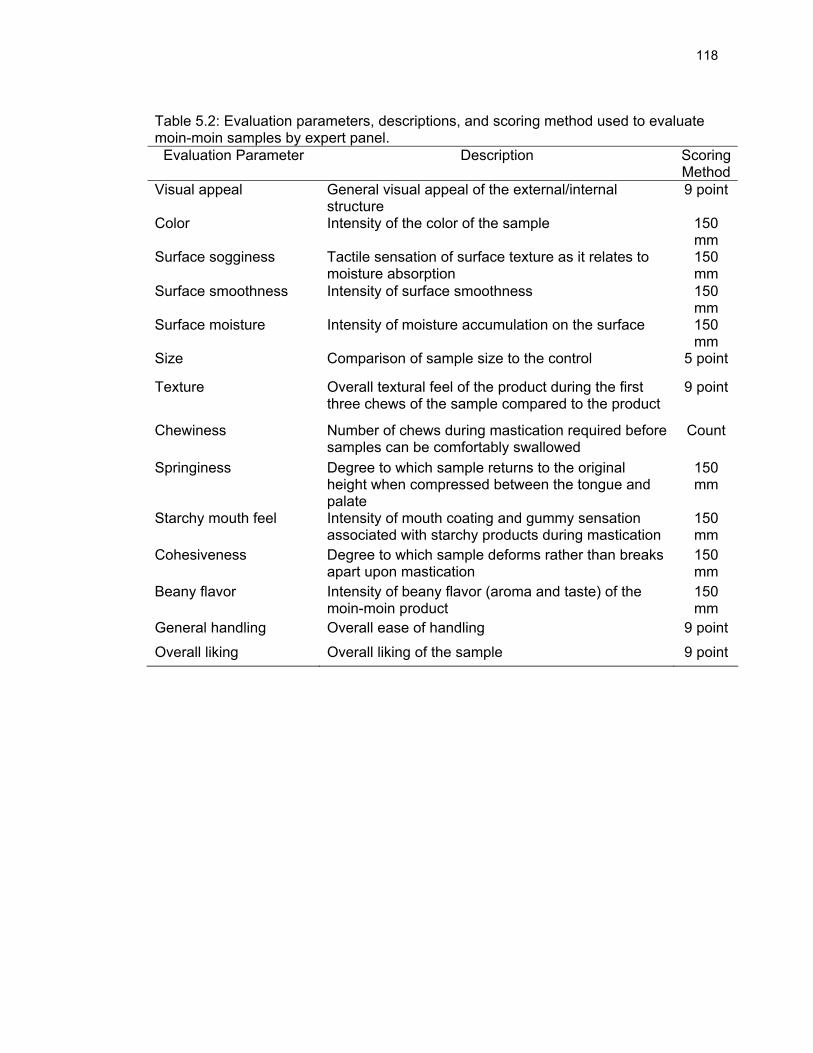
118
Table 5.2: Evaluation parameters, descriptions, and scoring method used to evaluate moin-moin samples by expert panel.
Evaluation Parameter Description Scoring Method
Visual appeal General visual appeal of the external/internal structure
9 point
Color Intensity of the color of the sample 150 mm
Surface sogginess Tactile sensation of surface texture as it relates to moisture absorption
150 mm
Surface smoothness Intensity of surface smoothness 150 mm
Surface moisture Intensity of moisture accumulation on the surface 150 mm
Size Comparison of sample size to the control 5 point
Texture Overall textural feel of the product during the first three chews of the sample compared to the product
9 point
Chewiness Number of chews during mastication required before samples can be comfortably swallowed
Count
Springiness Degree to which sample returns to the original height when compressed between the tongue and palate
150 mm
Starchy mouth feel Intensity of mouth coating and gummy sensation associated with starchy products during mastication
150 mm
Cohesiveness Degree to which sample deforms rather than breaks apart upon mastication
150 mm
Beany flavor Intensity of beany flavor (aroma and taste) of the moin-moin product
150 mm
General handling Overall ease of handling 9 point
Overall liking Overall liking of the sample 9 point

119
Table 5.3: Calculated proximate composition of Moin-moin1(3.25:1 water to cowpea solids ratio), and reported composition of Akara2. Moin-moin Akara
Moisture 56.15% 48.75% Total Fat3 9.12% 19.23%
Total Carbohydrates3 63.85% 55.84% Protein3 24.32% 19.25%
Ash3 2.69% 5.67% 1 Proximate compositions calculated using MasterCook v8.0.03.01 (ValueSoft, Chaska, MN) 2 Akara data obtained from Plahar (2004) 3 Values are on a dry weight basis

120
Table 5.4: Texture profile analysis results of moin-moin samples at room temperature as affected by starting material, water:cowpea solids ratio, and cooking time.
Firmness (N)
Energy (mJ)
Cohesiveness (A2/A1)
Gumminess (N)
Springiness (mm)
Adhesiveness (mJ)
Chewiness (N*mm)
Starting Material Cowpea Flour 27.93a 69.59a 0.28a 7.39a 2.47a 0.65c 19.26a
Imbibed Cowpea 18.31b 50.96b 0.12b 2.17b 0.88c 1.21b 1.92b
Cowpea Meal 13.69c 47.78b 0.14b 1.99b 1.23b 1.60a 2.50b
Water:Cowpea 3.25 24.90a 72.21a 0.19b 4.87b 1.71b 1.15a 10.18b
3.75 23.80a 64.24b 0.23a 5.95a 2.10a 1.00a 15.73a
4.25 12.08b 34.29c 0.20b 2.58c 1.53c 1.23a 4.68c
Cooking Time 20 24.99a 64.45a 0.19b 5.03a 1.56b 0.96b 9.52a
40 16.87b 52.64b 0.22a 4.04b 1.96a 1.27a 10.77a a,b,c Values in a column for each treatment variable not followed by the same letters are significantly different (α=0.05).
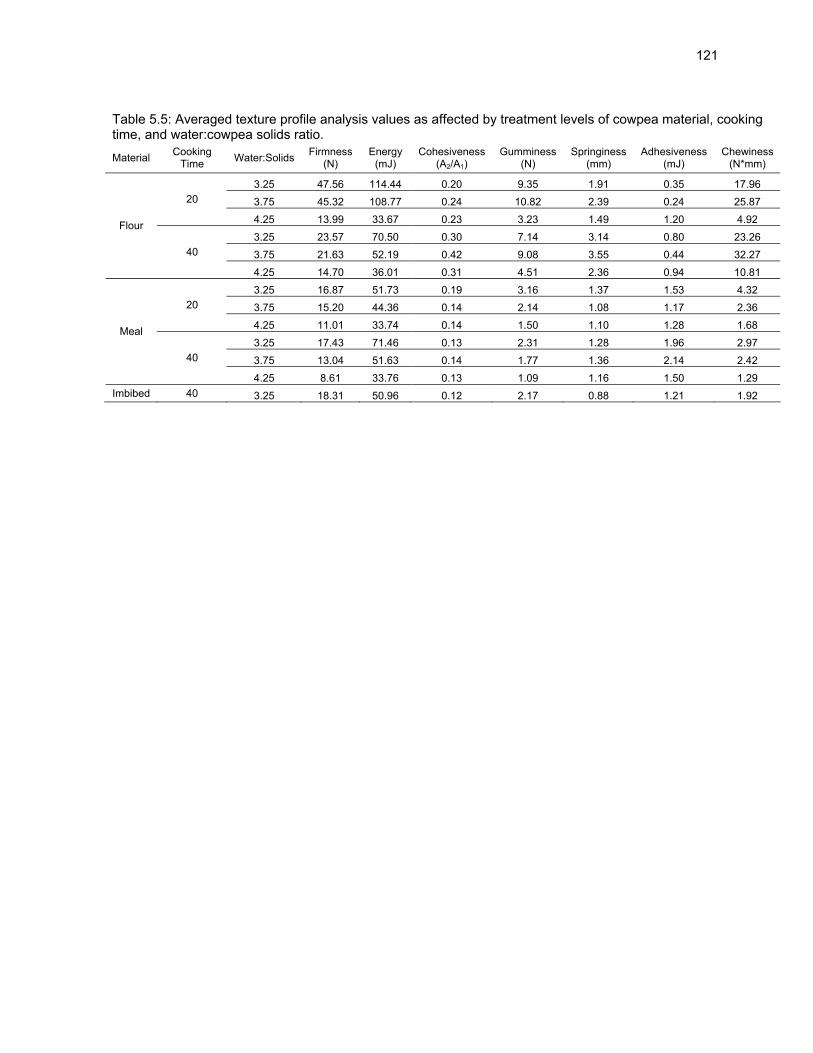
121
Table 5.5: Averaged texture profile analysis values as affected by treatment levels of cowpea material, cooking time, and water:cowpea solids ratio.
Material Cooking Time Water:Solids Firmness
(N) Energy
(mJ) Cohesiveness
(A2/A1) Gumminess
(N) Springiness
(mm) Adhesiveness
(mJ) Chewiness
(N*mm)
3.25 47.56 114.44 0.20 9.35 1.91 0.35 17.96 3.75 45.32 108.77 0.24 10.82 2.39 0.24 25.87 20
4.25 13.99 33.67 0.23 3.23 1.49 1.20 4.92 3.25 23.57 70.50 0.30 7.14 3.14 0.80 23.26 3.75 21.63 52.19 0.42 9.08 3.55 0.44 32.27
Flour
40
4.25 14.70 36.01 0.31 4.51 2.36 0.94 10.81 3.25 16.87 51.73 0.19 3.16 1.37 1.53 4.32 3.75 15.20 44.36 0.14 2.14 1.08 1.17 2.36 20
4.25 11.01 33.74 0.14 1.50 1.10 1.28 1.68 3.25 17.43 71.46 0.13 2.31 1.28 1.96 2.97 3.75 13.04 51.63 0.14 1.77 1.36 2.14 2.42
Meal
40
4.25 8.61 33.76 0.13 1.09 1.16 1.50 1.29 Imbibed 40 3.25 18.31 50.96 0.12 2.17 0.88 1.21 1.92
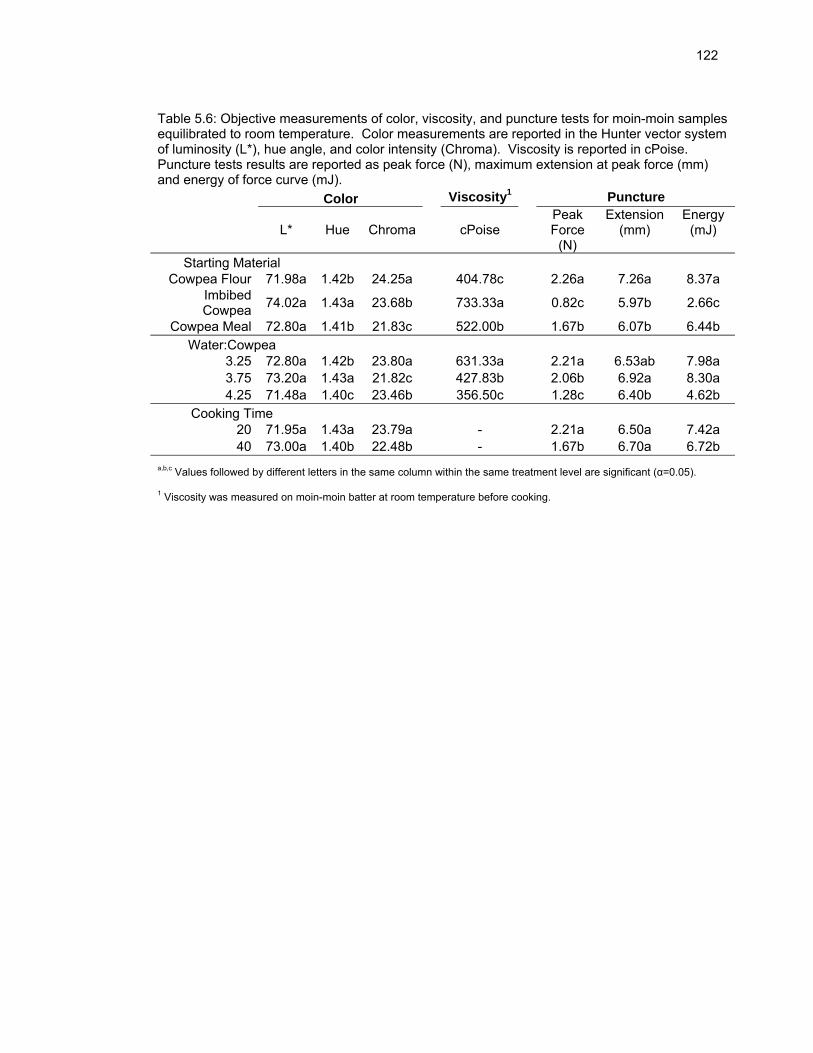
122
Table 5.6: Objective measurements of color, viscosity, and puncture tests for moin-moin samples equilibrated to room temperature. Color measurements are reported in the Hunter vector system of luminosity (L*), hue angle, and color intensity (Chroma). Viscosity is reported in cPoise. Puncture tests results are reported as peak force (N), maximum extension at peak force (mm) and energy of force curve (mJ). Color Viscosity1 Puncture
L* Hue Chroma
cPoise
Peak Force
(N)
Extension (mm)
Energy (mJ)
Starting Material Cowpea Flour 71.98a 1.42b 24.25a 404.78c 2.26a 7.26a 8.37a
Imbibed Cowpea 74.02a 1.43a 23.68b 733.33a 0.82c 5.97b 2.66c
Cowpea Meal 72.80a 1.41b 21.83c 522.00b 1.67b 6.07b 6.44b Water:Cowpea
3.25 72.80a 1.42b 23.80a 631.33a 2.21a 6.53ab 7.98a 3.75 73.20a 1.43a 21.82c 427.83b 2.06b 6.92a 8.30a 4.25 71.48a 1.40c 23.46b 356.50c 1.28c 6.40b 4.62b
Cooking Time 20 71.95a 1.43a 23.79a - 2.21a 6.50a 7.42a 40 73.00a 1.40b 22.48b - 1.67b 6.70a 6.72b
a,b,c Values followed by different letters in the same column within the same treatment level are significant (α=0.05).
1 Viscosity was measured on moin-moin batter at room temperature before cooking.

123
Table 5.7: Sensory hedonic and intensity ratings from an expert sensory panel (4 panelists) comprised of panelists who were familiar with cowpea/legume products either on a cultural or research basis.
Color Surface Smoothness Texture Chewiness Springiness Cohesiveness General
Handling
Starting Material Cowpea Flour 58.56a 98.16a 5.27ab 10.18a 83.82a 92.08a 5.52ab
Imbibed Cowpea 52.00a 28.75b 3.75b 16.00a 47.37b 66.63b 5.90a Cowpea Meal 57.47a 79.79a 5.56a 10.94a 58.13ab 70.30ab 4.25b
Water: Solids 3.25 55.58a 81.50b 5.39a 12.08a 69.56a 79.69a 5.83a 3.75 55.30a 99.17a 5.28a 9.31a 74.66a 83.89a 5.63a 4.25 62.72a 79.66b 5.38a 10.78a 65.94a 78.36a 5.47a
Cooking Time 20 50.47b 93.39a 5.02a 9.85a 71.54a 82.51a 5.27b 40 64.52a 80.27b 5.65a 11.64a 68.64a 78.86a 6.00a
a,b Values followed by different letters in the same column in the same treatment level are significant (α=0.05)

124
Chapter 6
SUMMARY AND CONCLUSIONS

125
Milling cowpea flour in a cyclone assisted attrition mill demonstrated a
reasonable degree of control for end product uniformity, with respect to geometric
particle mean diameter (dgw) and yield. It was shown that positioning of the airflow
restriction valve played a significant role in the final dgw of cowpea flour. Turbine
speed, airflow restriction, and preconditioning cowpea seed moisture content exerted
influential forces on the dgw and yield of cowpea flour. Preconditioning of cowpea
seeds at the selected temperatures showed no affect on the dgw or yield of cowpea
flour. Milling of cowpea flour under minimal sample treatment conditions (i.e. 4%
moisture at 20oC) was comparable to cowpea flour produced under extensive
sample treatment conditions (i.e. 0.5% moisture at -80oC).
Trypsin inhibitor (TI) content of thermally treated soy flake at 30, 35, and 40%
moisture content showed minimal to no reduction of TI when compared to the
respective untreated samples. Initial TI content of ADM soy flake showed an
average of 30% residual TI for all samples analyzed when compared to common raw
soybean as reported by Liu (1997).
Cyclone assisted attrition milling of soy flake using a Super Wingmill DM-200
produced soy flour with an average dgw of 18 μm, which is consistent with the dgw for
similar operational parameters used for production of cowpea flour. Suspensions
created using soy flour that had been subjected to thermal treatment (40% moisture,
110oC, 5 min) and attrition milling had an overall lower viscosity than those from
other treatments. With regard to the temperature of the water used for
homogenizing the suspensions, relatively high temperatures created unstable
suspensions whereas lower temperatures produced stable suspensions. The levels
of anti-caking agent used in this study showed no effect on the rate of suspension
separation.
126
Moin-moin prepared from cowpea flour was shown to produce an overall
firmer product when compared to that made from imbibed cowpea seed. The ratio of
water to cowpea solids was shown to affect the end product texture indicating that
cowpea starch was the dominate component in moin-moin structure attributes.
Cooking moin-moin for longer time periods produced a sticker and less firm product
than a shorter cooking time. Moin-moin prepared from cowpea flour with dgw of
17μm showed significantly lower adhesiveness values (TPA) than that prepared from
either the imbibed cowpea seed or from cowpea meal suggesting that amylose-lipid
complexes were easily formed due to the smaller particles sizes (increased surface
area). Sensory analysis of moin-moin identified a preference based upon various
treatment conditions; however, conclusive results would require a larger sensory
panel.
Overall, it was shown that a significant reduction in particle size of a legume
alters its functional properties when used in the respective food systems employed in
this study. These alterations in legume flour functional properties can be either a
positive or negative influence on consumer products depending on the consumer’s
preference. The objective measurements selected in this experiment can be used as
an indicator of consumer preference once a preference has been identified.