EFFECT OF BARK STRIPPING ON T HE ELECTRICAL IMPEDANCE OF QUERCUS SUBER … · 2012-08-09 · EFFECT...
14
195 DOI 10.4067/S0718-221X2012000200007 ISSN impresa 0717-3644 ISSN online 0718-221X EFFECT OF BARK STRIPPING ON THE ELECTRICAL IMPEDANCE OF QUERCUS SUBER LEAVES Abdelillah Hakam 1♠ , Mariange Magne Takam 1 , Mustapha Chokairi 2 , Noureddine Alami Chantoufi 1 , Zeinedine Hamoutahra 1 , Abdelaziz El Alami 3 , Abderrahim Famiri 3 , Mohsine Ziani 1 , Joseph Gril 4 ABSTRACT is study examined the effect of bark stripping on the electrical impedance parameters of cork oak young leaves between 40Hz and 100 kHz. is was a new application of the electrical impedances spectroscopy (EIS) in plant science. Various stripping coefficients (CD) were applied on the trees. Bark stripping is expected to affect water metabolism of leaves and therefore changes in the EIS parameters are expected as well. Single-DCE (ZARC) model was used as equivalent circuit for leaves. Several electrophysiological parameters of this model were compared with moisture content (MC) of the leaves. Intracellular resistance (R i ), extracellular resistance (R e ) and relaxation time (τ) of the leaves increased during 14 days aſter stripping while the distributed coefficient (Ψ) and MC decreased. Significant correlation between EIS parameters, MC and trees treatments were found. Keywords: Quercus suber, Electrical impedance, Equivalent circuit, Single DCE, Leaves, Bark- stripping, Bark-stripping coefficient. INTRODUCTION It is predicted that the cork extraction is extremely traumatic for cork oak trees; it exposes a considerably part of living tissues and causes an extensive wound (Natividade 1950). e effect of bark stripping is very complex; the large amount of water lost from the stripped surface is most likely to influence the water balance and, directly or indirectly, limits the physiological processes (Correia et al. 1992). Several methods are used to assess the effect of stripping intensity on Quercus suber trees e.g. chlorophyll fluorescence emission and the stomatal conductance of leaves (Correia 1992, Werner and Correia 1996), tree diameter growth and its seasonal pattern either in very young cork oak trees (Fialho et al. 2001) or in mature trees under bark production (Costa et al. 2004). Despite numerous studies on Quercus suber trees, aſter stripping, there has been made no (or little) attempt to relate the effect of bark stripping on the dehydratation stress of the leaves. EIS has been used to study stress reaction in plants (Repo et al. 1994, 2000; Väinölä and Repo 2000; Laarabi et al. 2005a, 2005b). e method provides information about the physicochemical properties of cellular structure. For EIS studies the sample is set in an alternating electric field with small amplitude of current passing through the sample. When changes in the amplitude and phase of the alternating current are transformed into the complex plane, they induce an impedance spectrum, with frequency as an intrinsic variable. In biological samples, the proportion of current passing through the extracellular 1 Equipe Sciences du bois, Faculté des Sciences de Rabat, Université Mohammed V – Agdal. 4, Avenue Ibn Battouta B.P. 1014 Rabat, Morocco. 2 Laboratoire de Physiologie et des biotechnologies végétales, Faculté des Sciences de Rabat, Université Mohammed V – Agdal. 4, Avenue Ibn Battouta B.P. 1014 Rabat, Morocco. [email protected] 3 Centre de Recherche Forestière. BP 763, Agdal-Rabat, Morocco. [email protected] 4 Laboratoire de Mécanique et Génie Civil, Université Montpellier 2, CNRS UMR 5508, CC 048 Place Eugène Bataillon, 34095 Montpellier, France. [email protected] Corresponding author: ♠ [email protected] Received: 20.10.2011 Accepted: 23.03.2012 Ciencia y tecnología, 14(2): 195-208, 2012 Maderas.
Transcript of EFFECT OF BARK STRIPPING ON T HE ELECTRICAL IMPEDANCE OF QUERCUS SUBER … · 2012-08-09 · EFFECT...

195
DOI 10.4067/S0718-221X2012000200007
ISSN impresa 0717-3644ISSN online 0718-221X
EFFECT OF BARK STRIPPING ON T HE ELECTRICAL IMPEDANCE OF QUERCUS SUBER LEAVES
Abdelillah Hakam1♠, Mariange Magne Takam1, Mustapha Chokairi2, Noureddine Alami Chantou� 1, Zeinedine Hamoutahra1, Abdelaziz El Alami3, Abderrahim Famiri3, Mohsine Ziani1, Joseph Gril4
ABSTRACT
� is study examined the e� ect of bark stripping on the electrical impedance parameters of cork oak young leaves between 40Hz and 100 kHz. � is was a new application of the electrical impedances spectroscopy (EIS) in plant science. Various stripping coe� cients (CD) were applied on the trees. Bark stripping is expected to a� ect water metabolism of leaves and therefore changes in the EIS parameters are expected as well. Single-DCE (ZARC) model was used as equivalent circuit for leaves. Several electrophysiological parameters of this model were compared with moisture content (MC) of the leaves. Intracellular resistance (Ri), extracellular resistance (Re) and relaxation time (τ) of the leaves increased during 14 days a� er stripping while the distributed coe� cient (Ψ) and MC decreased. Signi� cant correlation between EIS parameters, MC and trees treatments were found.
Keywords: Quercus suber, Electrical impedance, Equivalent circuit, Single DCE, Leaves, Bark-stripping, Bark-stripping coe� cient.
INTRODUCTION
It is predicted that the cork extraction is extremely traumatic for cork oak trees; it exposes a considerably part of living tissues and causes an extensive wound (Natividade 1950). � e e� ect of bark stripping is very complex; the large amount of water lost from the stripped surface is most likely to in� uence the water balance and, directly or indirectly, limits the physiological processes (Correia et al. 1992). Several methods are used to assess the e� ect of stripping intensity on Quercus suber trees e.g. chlorophyll � uorescence emission and the stomatal conductance of leaves (Correia 1992, Werner and Correia 1996), tree diameter growth and its seasonal pattern either in very young cork oak trees (Fialho et al. 2001) or in mature trees under bark production (Costa et al. 2004). Despite numerous studies on Quercus suber trees, a� er stripping, there has been made no (or little) attempt to relate the e� ect of bark stripping on the dehydratation stress of the leaves.
EIS has been used to study stress reaction in plants (Repo et al. 1994, 2000; Väinölä and Repo 2000; Laarabi et al. 2005a, 2005b). � e method provides information about the physicochemical properties of cellular structure.
For EIS studies the sample is set in an alternating electric � eld with small amplitude of current passing through the sample. When changes in the amplitude and phase of the alternating current are transformed into the complex plane, they induce an impedance spectrum, with frequency as an intrinsic variable. In biological samples, the proportion of current passing through the extracellular
1 Equipe Sciences du bois, Faculté des Sciences de Rabat, Université Mohammed V – Agdal. 4, Avenue Ibn Battouta B.P. 1014 Rabat, Morocco. 2 Laboratoire de Physiologie et des biotechnologies végétales, Faculté des Sciences de Rabat, Université Mohammed V – Agdal. 4, Avenue Ibn Battouta B.P. 1014 Rabat, Morocco. [email protected] Centre de Recherche Forestière. BP 763, Agdal-Rabat, Morocco. [email protected] Laboratoire de Mécanique et Génie Civil, Université Montpellier 2, CNRS UMR 5508, CC 048 Place Eugène Bataillon, 34095 Montpellier, France. [email protected] author: ♠ahakam @fsr.ac.maReceived: 20.10.2011 Accepted: 23.03.2012
Ciencia y tecnología, 14(2): 195-208, 2012Maderas.

U n i v e r s i d a d d e l B í o - B í o
196
spaces (intercellular spaces between the cells) and intracellular spaces in tissues depends on the alternating current (AC) frequency. At low frequency, AC passes through the extracellular space. � e cell membranes become more conductive as current frequency increases (Repo et al. 2004) and accordingly, the amount of intracellular current increases. � erefore, information about di� erent tissues features, i.e., intra and extracellular � uids may be revealed by EIS (Väinölä and Repo 2000). Several stressors a� ect the EIS parameters of plants organs. � e τ and the Ri correlate with cold hardening in Scots pine, Re and τ decreases with increases in cellular injuries caused by frost (Repo et al. 1994), the Re correlates with frost-expose in rhododendron leaves (Väinölä and Repo 2000). � e stripping, with all its implications in physiological processes (Pinto et al. 2006) may lead to considerable water losses (Correia et al.1992).
Because EIS is sensitive to changes in the physicochemical properties of cells we hypothesized that cellular deterioration in cork oak leaves caused by water balance disturbance a� er stripping will alter some EIS parameters as has been observed for other stressors (e.g., Repo et al. 1994, 2000).
MATERIAL AND METHOD
Plant material� e study was carried out on young leaves of mature Quercus suber L. trees at site A VII-5 (Canton
A, Perimeter VII and Plot 5) of western Mamora forest (6°45’O, 34°2’N, 30m of altitude), Rabat, Morocco. Mamora soil is made of a clay layer on which we have red or pink colour sand layer. � e average annual precipitations is 500 mm and the average temperature in summer (June, July, August and September) oscillate around 23°C. Six mature and productive cork oak trees representative of the dominant and typical tree in that � eld were selected and numbered T1 to T6. 2 non stripped trees were served as controls (T1 and T2); two trees (T3 and T4) stripped for the � rst time with CD respectively 1.1 and 1.22, the two other trees (T5 and T6) bark-stripped one time with CD respectively 1.64 and 1.74. All these trees were regenerated by reject of stump a� er ablation of the trunk. Bark stripping characteristics of these trees are outlined in table 1.
Table 1. Stripping Characteristics of the trees under study. ND: number of bark-stripping, it is the number of time that the tree was stripped, CD: Bark stripping coe� cient calculated as the ratio of
the maximum length by over the trunk perimeter at breast height (Natividade 1950).
Tree Age (Year) ND CD RemarksT1 35 0 0 Non-strippedT2 45 0 0 Non-stripped same stump as T5T3 45 1 1.11 same stump as T4 and T6T4 45 1 1.22 same stump as T3 and T6T5 45 2 1.64 same stump as T2T6 45 2 1.74 same stump as T3 and T4
Impedance measurementsEIS of leaves was performed in summer 2009 (before and a� er bark-stripping period). � ere were
� ve sampling dates, i.e., on July 7, (few hours before stripping), July 14, (seven days a� er stripping), July 22, (fourteen days a� er stripping), 7 august (thirty days a� er stripping), August 27, (� � y days a� er stripping). From each tree and at each sampling date, one short shoot was sampled each time from branches located in the central crows of the tree. � e leaves were placed in the plastic bags immediately a� er sampling and transported to the laboratory. � e leaves were oriented vertically
Ciencia y tecnología, 14(2): 195-208, 2012Maderas.

197
when running the impedance measurements. Impedance spectra were measured with an Ag/AgCl-cell connected to a Hewlett-Packard 3330 LCZ meter. � e Ag/AgCl electrodes were kept in contact with the samples using a conductive paste (3M red Dot Foam Monitoring Electrode 2237-3, of the type commonly used for electrocardiograms) to maintain minimum electrode tissue interface polarization. Further, the device was calibrated by using OPEN/SHORT circuit correction to eliminate the e� ect of electrodes- paste interface. � e real (Zr) and imaginary (Zi) values of impedance were then measured within a frequency range of 40 Hz to 100 kHz. � e input voltage of the signal was 30 mV (rms). � e section of the conductive part of electrodes was 0.78 cm2 corresponding to a disk of 1cm of as diameter. From each short shoot, 3 young leaves were selected and numbered L1 to L3. L1, L2 and L3 were respectively the � rst, the second and the third leaf formed on the short shoot. � e three leaves were tested and a leaf thickness was measured with a digital Mitutoyo Calipers 0.01 mm. All the tested leaves had an area of more than 0.78 cm2 and with naked eye; they presented no sign of aging.
Determination of MC of leaves A� er the impedance measurements, the specimen were weighed and dried at 100°C ±3 for 24h.
� e scale of 1mg accuracy was used in weighing. � e MC of leaves was calculated as:
(1)
Where MH is weight of leaves and M0 is the oven dry weight a� er drying at 100°C for 24h.
Modelling of leaves impedance
Impedance analysis in plants is performed using mainly two types of equivalent circuits i.e., lumped (Harker and Maindonald 1994) and distributed models (Repo et al. 1994, 2000, Stout 1988, Mancuso 1999, Mizukami 2007). In this study, the mathematical model ZARC illustrated by the circuit diagram in � gure 1 was � tted to the data. � e ZARC comprises includes a distributed circuit element (DCE) in series with a resistor (R∞). � e DCE element comprises includes a Constant Phase Element (CPE) in parallel with a resistor (R).
Figure 1. Single-DCE (ZARC) model for leaves.
� e CPE impedance is de� ned as:
1
( )CPEZi C
(2)
Effect of bark stripping on t he electrical... Hakam et al. Ciencia y tecnología, 14(2): 195-208, 2012Maderas.

U n i v e r s i d a d d e l B í o - B í o
198
� e impedance of single DCE is de� ned as follows:
1 ( )ZARC
RZ
i ψτω=
+ + R∞
(3)
� e real and imaginary parts of impedance obtained from equation (3) are expressed respectively as (see appendix 2 for more explanations):
(4)
(5)
Parameter Ψ is de� ning if the center of the arc is below x-axis or not.
� e angle between x axis and the line passing by the center and the origin of the axes was as and α and Ψ is de� ned as:
(6)
� e total complex impedance (Z) of the model of � gure 1 is as shown (for derivation of this equation see Appendix 1):
(7)
By increasing the Ψ value, the impedance spectrum approaches a symmetric arc (attained when Ψ =1).
Re was calculated as:
eR R R (8)
R∞ represents the resistance at high frequency
Ciencia y tecnología, 14(2): 195-208, 2012Maderas.

199
� e Ri was calculated as:
(9)
And the relaxation time as:
(10)
� e speci� c resistances: intracellular speci� c resistance ri (unit Ωm) and extracellular speci� c resistance re (unit Ωm) were obtained by normalization of the measured resistance (Ri and Re in respect of the cross-sectional area (As) and the thickness of the leaf (e)).
iS
i Re
Ar =
(11)
and
e
Se R
e
Ar =
(12)
In the text, capital letters refer to non normalized parameters and lower case letters to normalized values. τ and its Ψ did not need normalization.
As = 0.76 cm2 and e approximately 0.3 mm, which gives ri ≈ 0.26 Ri and re ≈ 0.26 Re.
� e non normalized and normalized parameters are of similar magnitude. We will continue to use Ri and Re for the rest of the work.
Equivalent circuit parameters of the distributed circuit model (single-DCE, � gure 1) were estimated by using the method of non-linear least squares curve-� tting program using Microso� Excel.
Statistical analysisRelations between the leaves properties and electrical parameters were studied. � e Pearson
correlation coe� cient (r) was calculated and the t-test was used to estimate the signi� cance of correlation. Statistical analyses were carried out with SPSS so� ware.
RESULTS
� e graph representing ( )i rZ f Z= in complex plane between 40 Hz to 100 kHz for three young leaves from the same branch of the tree number 4 are presented (Figure 2). � e impedance spectrum of every leaf had a single arc in the form of parabola where the top corresponds to the frequency value characteristic of material fc and the intersection of the parabola with the x axis gives R∞ and the Re. � e radius of the arc increased with increase in leaf maturity.
Ciencia y tecnología, 14(2): 195-208, 2012Maderas.Effect of bark stripping on t he electrical... Hakam et al.
U n i v e r s i d a d d e l B í o - B í o
200
Figure 2. Typical impedance spectra of cork oak young leaves at di� erent stages of maturity.; L1, L2 and L3 were respectively the � rst, the second and the third leaf formed on the short shoot
of the tree number 4. � e spectra are composed of 35 di� erent frequencies ranging from 40Hz to 100kHz (from right to le� , respectively).
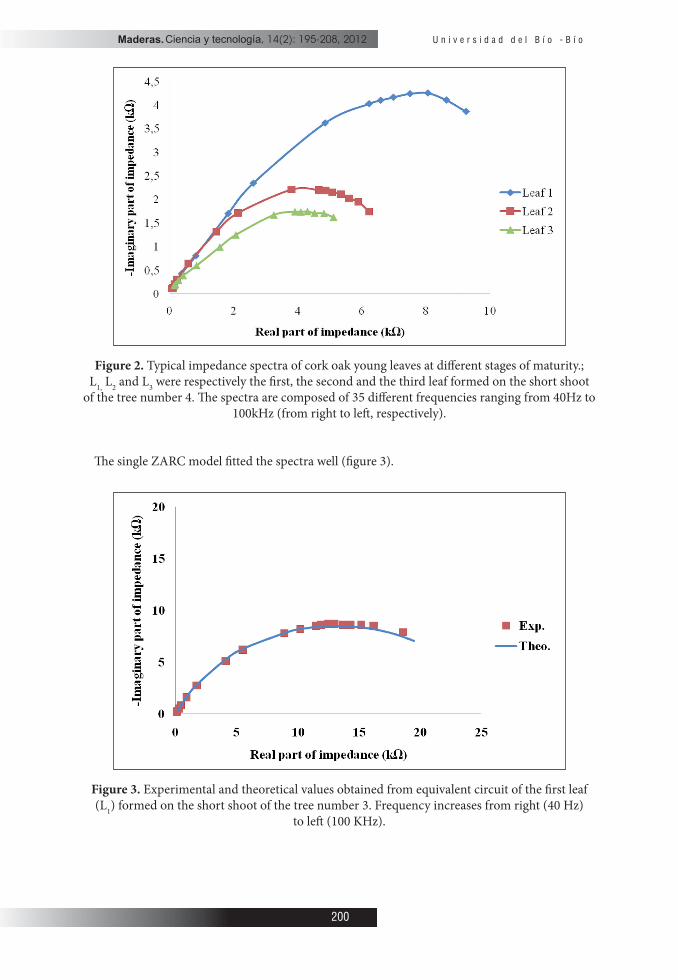
� e single ZARC model � tted the spectra well (� gure 3).
Figure 3. Experimental and theoretical values obtained from equivalent circuit of the � rst leaf (L1) formed on the short shoot of the tree number 3. Frequency increases from right (40 Hz)
to le� (100 KHz).
Ciencia y tecnología, 14(2): 195-208, 2012Maderas.

201
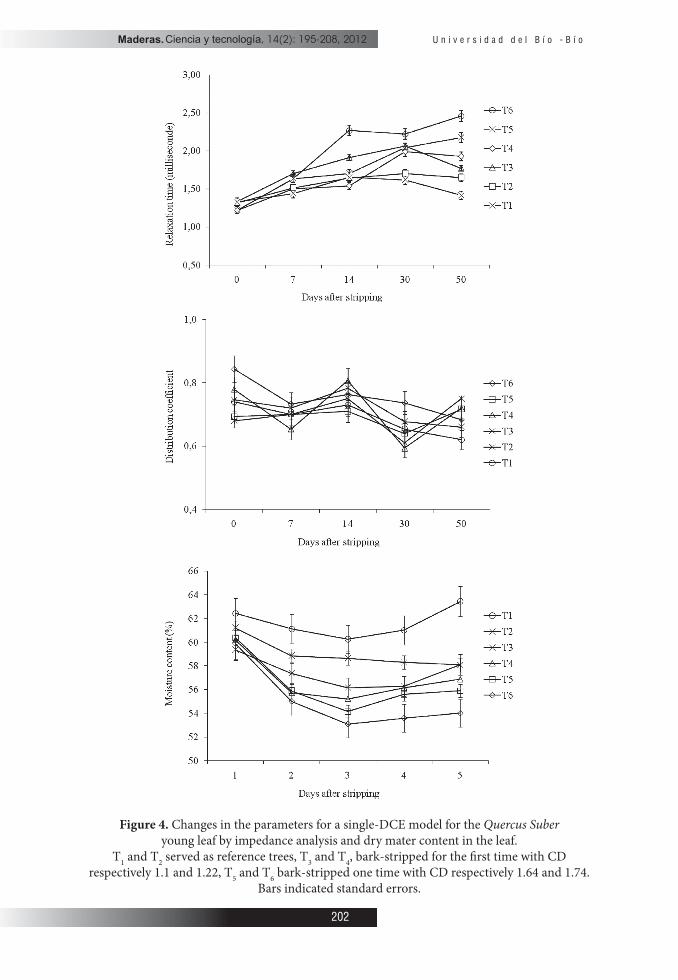
All resistance and τ parameters increased during the study (� gure 4).� e Ri was 60Ω at the beginning of July (before bark stripping) and rose up to 105Ω in August (� gure 4a). � e extracellular resistances typically were the lowest (35kΩ) at the bark stripping date and then increased (� gure 4b), τ inreased slightly from 1.33ms to 1.81ms a� er bark-stripping (� gure 4c); i.e. the characteristic frequency fc decreased from 120 to 88Hz. Comparatively to intracellular resistance we noticed a slight increase Re already seven days a� er bark-stripping, however, 14 days a� er stripping, there was a strongly di� erence between the variations of intra and extracellular resistance (98% and 75% respectively) (� gure 4a and 4b). � e exponent Ψ increased during experiments (from 0.63 to 0.78) (� gure 4d). Leaves MC was the highest for all treatements at beginning of the study and then tapered o� (� gure 4e).
CD had a signi� cant e� ect on all EIS parameters and MC (P<0.01). � ere was good correlation between MC and all EIS parameters except for Ψ (Table 2). Our results also demonstrated the importance of sampling date on EIS parameters (Table 2) and (� gure 5), espacially on the intracellular resistance � gure 5a.
Effect of bark stripping on t he electrical... Hakam et al. Ciencia y tecnología, 14(2): 195-208, 2012Maderas.
U n i v e r s i d a d d e l B í o - B í o
202
Figure 4. Changes in the parameters for a single-DCE model for the Quercus Suber young leaf by impedance analysis and dry mater content in the leaf.
T1 and T2 served as reference trees, T3 and T4, bark-stripped for the � rst time with CD respectively 1.1 and 1.22, T5 and T6 bark-stripped one time with CD respectively 1.64 and 1.74.
Bars indicated standard errors.
Ciencia y tecnología, 14(2): 195-208, 2012Maderas.

203
DISCUSSION
It is shown that the theoretical values are in good agreement with the experimental ones. � e occurrence of one arc in a typical impedance spectrum for the leaves and the satisfactory � t of the single DCE model strongly indicate the suitability of the model in the study of leaves. � is result is in agreement with the previous studies of olives leaves (Mancuso 1999), Rhododendron leaves (Väinölä and Repo 2000) or of silver birch leaves (Repo et al. 2004).
Cellular responses of cork oak young leaves to stress caused by bark stripping were detected by EIS, and the di� erent EIS parameters were sensitive to di� erent factors. � e e� ects of bark stripping were more evident 21 days a� er bark stripping.
� e increase of intra and extracellular resistances could be in relation with water losses a� er stripping, actually as demonstrated by Repo et al. (2007) the drying of the cells may be enhanced by a reduction in the transpiration stream a� er leaf abscission, subsequently leading to an increase in both resistances parameters.
� e increase of intracellular resistance during the summer additionally with the stripping e� ect could indicate a decrease in electrolytic content and the increase in cell sugar. In fact, as mentioned by Mancuso (1999), the decrease of intracellular resistance in olives leaves during winter was a result of an increase in electrolytic content and a decrease in cell sugar concentration.
� e di� erence between intra- and extracellular increases (98% and 75% respectively) 14 days a� er sttripping can partly be explained by forces binding water molecules in the cell. In fact, extracellular water (water in intercellular spaces between the cells) is strongly bound by imbibition force whereas intracellular water is retained by osmotic type force. � e decrease in all resistances 21 day a� er bark stripping can be explained by plant reaction to balance water de� cit by stomatal regulation (openning and closing the stomates); water losses are reduced and the plant tends to � nd its moisture.
� e increase of relaxation time ( ) with higher stripping coe� cient meant that the characteristique frequency value (fc) moved toward lower frequencies.
Changes in relaxation time suggest a change in cell membrane (cf. Repo et al. 2004). Accordingly, we concluded that excessive stripping may a� ect the frequency response of cell membranes.� e distribution coe� cient has the mean for about 0.71 in cork oak leaves versus 0.66 in silver birch leaves (Repo et al. 2004) and 0.61 in tea leaves (Mizukami 2007). In the dielectric materials which consists of di� erent types of molecules, e.g. biological samples, multiples sources may contribute to this parameter, including biological variability, cell orientation anisotropy, intracellular heterogeneity, multiple component structures and the existence of a range of di� erent relaxation processes (Repo et al. 2004). In isotropic samples with even sizes, e.g. water molecules, the impedance arc is almost a semicircle and the distributed coe� cient is close to 1 (Torgovnikov 1993). � e value of ψ in cork oak leaves suggest that several interfaces exist that fact also a� ect the relaxation time.
Moisture content and all electrical parameter curves aim to an asymptote 21 days a� er bark stripping. � ey are two explanations for this phenomenon: either the reaction of the tree to balance its hydric gap by progressive decrease of transpiration at the level of the leaves (Correia et al.1992), or as referred to Natividade (1950), by the formation of a new phellogen layer with immediate cork regeneration function which, due to cork’s impermeability, limits the water losses by evaporation.
� e time of sampling was important for EIS parameters of cork oak leaves especially on the 7th of August i.e. 30 days a� er bark stripping (table 2). Ri is the electrical parameter which had higher Pearson coe� cient with MC, CD and ND.
Effect of bark stripping on t he electrical... Hakam et al. Ciencia y tecnología, 14(2): 195-208, 2012Maderas.

U n i v e r s i d a d d e l B í o - B í o
204
Figure 5. EIS parameters as function moisture content.
Table 2. � e Pearson correlation coe� cient (r) of the linear regression model for the comparison of the EIS and the (MC) with di� erent treatments at dates when the correlation was signi� ant. � e EIS parameters were obtained by simple-DCE model. (). � e correlation coe� cient was calculated
using the pooled data of all trees and test dates (n=75) and at di� erent date separately (n=18) (Asterisks indicate statistically signi� cant di� erences (*P<0.05, **P<0.01)
Ciencia y tecnología, 14(2): 195-208, 2012Maderas.

205
CONCLUSION
In conclusion, this was the � rst time that EIS was applied to study the e� ect of bark stripping on the dehydration stress of the Quercus suber L. leaves. Impedance parameters were signi� cantly sensible to physiological variations in the leaves that were associated with stresses caused by bark stripping. Intra and extracellular resistance increase as moisture content decreases and increase as bark stripping coe� cient increase. According to this technique, the trees seemed to balance their hydric gap 21 days a� er stripping. However, bark stripping occurred during the summer when trees were already subjected to other environmental stresses; consequently, there were a great number of variables over which we had no control. Further research is needed to evaluate the so called speed of balance hydric gap with an aim to de� ne speci� c bark stripping coe� cient for each tree depending on the tree characteristics.
ACKNOWLEDGEMENT
� e authors would like to express sincere gratitude to TWOWS (� ird World Organization for Women in Science) and AIDS (Swedish International Development Cooperation Agency) for their materiel and intellectual contributions and thank Mr. Abdelhak El Abid for his idea and the fruitful discussions.
REFERENCES
Correia, O. A.; Oliveira, G.; Martins-Loucão, M. A; Catarino, F. M. 1992. E� ects of bark-stripping on the water relations of Quercus suber L. Scientia Gerundensis 18:195-204.
Costa, A.; Pereira, H,; Oliveira, A. 2004. � e e� ect of cork-stripping damage on diameter growth of Quercus suber L. Forestry 77(1):1-8.
Fialho, C.; Lopes, F.; Pereira, H. 2001. � e e� ect of cork removal on the radial growth and phenology of young cork oak trees. Forest Ecology and Management 141:251-258.
Harker, F. R.; Maindonald, J. H. 1994. Ripening of nectarine fruit, changes in the cell wall, Vacuole, and membranes detected using electrical impedance measurements. Plant Physiol. 106:165-171.
Effect of bark stripping on t he electrical... Hakam et al. Ciencia y tecnología, 14(2): 195-208, 2012Maderas.

U n i v e r s i d a d d e l B í o - B í o
206
Laarabi, S.; EL Kinani, K.; Ettouhami, A.; Limouri, M. 2005a. Impédance in vivo des organes aériens de certaines plantes mono- et dicotylédones. C. R. Biologies 328:253-262.
Laarabi, S.; EL Kinani, K.; Ettouhami, A.; Limouri, M. 2005b. Analyse spectrométrique, in vivo, de l’impédance électrique de la première feuille de maïs (Zea mays L.) en fonction des conditions hydriques du sol et de l’atmosphère. C. R. Biologies 328:493-503.
Macdonald, J. R. 1987. Impedance spectroscopy: emphasizing solid materials and systems. New York: John Wiley & Sons, Inc 368 p.
Macdonald, J. R. 1990. Impedance spectroscopy: old problems and new developments. Electrochim. Acta 35(10):1483-1492.
Macdonald, J. R. 1995. Exact and Approximate Nonlinear Least Squares Inversion of Dielectric Relaxation Spectra. J. Chem. Phys. 102:6241-6250.
Mancuso, S. 1999. Seasonal dynamics of electrical impedance parameters in shoots and leaves relate to rooting ability of olive (Olea europaea) cuttings. Tree physiology 19:95-101.
Mizukami, Y.; Yamada, K.; Sawai, Y.; Yamaguchi, Y. 2007. Measurement of fresh tea leaf growth using electrical impedance spectroscopy. Agricultural journal 2(1):134-139.
Natividade, J. V. 1950. Subericultura. Ministerio de Economia, Direcção General dos Serviços
Florestais e Aquicolas. Lisboa, 387 p.
Pinto, Teresa M.; Torres-Pereira, José M. G. 2006. Bark stripping in cork oak (Quercus suber L.): e� ect of an antitranspirant application on gas exchange and water relations of the stripped surface. Trees 20:247-252.
Repo, T.; Zhang, M. I. N.; Ryyppö, A.; Vapaavuori, E.; Sutinen, S. 1994. E� ects of freeze-thaw
injury on parameters of distributed electrical circuits of stems and needles of Scots pine seedlings at di� erent stages of acclimation. J. of Exp. Bot. 45:823-833.
Repo, T.; Zhang, G.; Ryyppö, A.; Rikala, R. 2000. � e electrical impedance spectroscopy of Scots pine (Pinus sylvestris L) shoots in relation to cold acclimation. J. of Exp. Bot. 51(353):2095-2107.
Repo, T.; Oksanen, E.; Vapaavuori, E. 2004. E� ects of elevated concentrations of ozone and carbon dioxide on the electrical impedance of leaves of silver birch (Betula pendula) clones. Tree physiology 24:833-843.
Repo, T.; Sutinen, S.; Nöjd, P.; Mäkinen, H. 2007. Implications of delayed soil frost thawing on the physiology and growth of Norway spruce. Scandinavian Journal of Forest Research 22:118-127.
Torgovnikov, G. I. 1993. Dielectric properties of wood and wood-based materials. Springer-Verlag,
New York 196 p.
Stout, D. G. 1988. E� ect of cold acclimation on bulk tissue electrical impedance: I Measurements with birdsfoot trefoil at subfreezing temperatures, Plant Physiol. 86(1): 275-282.
Väinölä, A.; Repo, T. 2000. Impedance spectroscopy in frost hardiness evaluation of Rhododendron leaves. Annals of Botany 86:799-805.
Werner, C.; Correia, O. 1996. Photoinhibition in cork-oak leaves under stress: In� uence of the
bark-stripping on the chlorophyll � uorescence emission in Quercus suber L. Trees 10:288-292
Ciencia y tecnología, 14(2): 195-208, 2012Maderas.

207
APPENDIX 1
� e single DCE is composed of one distributed element (DCE) in series witk a resistor (R∞). � e DCE is composed of a parallel arrangement of a resistor R and a constant phase element (CPE) (� gure 1). � e impedance of the constant phase element is (Macdonald 1987, 1990, 1995):
APPENDIX 2
Working expression for equivalent circuit modeling according to the expressions 7 and 8
Effect of bark stripping on t he electrical... Hakam et al. Ciencia y tecnología, 14(2): 195-208, 2012Maderas.

U n i v e r s i d a d d e l B í o - B í o
208
LISTE OF ABBREVIATIONS
CD : bark-stripping coe� cient, is calculated as the ratio of the maximum length by the trunk perimeter at breast heightND : number of bark-stripping, is the number of time that the tree was strippedMC : moisture content, %Ri : intracellular resistance, ΩmRe : extracellular resistance, Ωmri : intracellular speci� c resistance, Ωm (obtained by normalization of Ri )re : extracellular speci� c resistance, Ωm (obtained by normalization of Re )e : thickness of the leaf, mAs : cross-sectional area, m2α : angle between x axis and the line passing by the origin of the axes and the center of the arc in the form of parabola, degfc : characteristic frequency value, Hzω : the angular frequency, radians per secondτ : relaxation time, sψ : the distributed coe� cient of relaxation timei : the imaginary unitEIS : electrical impedance spectroscopyDCE : distributed circuit elementCPE : Constant Phase ElementR∞ : represents the resistance at height frequency
Ciencia y tecnología, 14(2): 195-208, 2012Maderas.