
Quercus suber habitats in Sardinia: a I.N.Vogiatzakis & M ...

188
AbstractUrban forestry is an important green infrastructure strategy because healthy trees can intercept rainfall, reducing stormwater runoff and pollutant loading. Surface saturation storage capacity, defined as the thin film of water that must wet tree surfaces before flow begins, is the most important variable influencing rainfall interception processes. Surface storage capacity is known to vary widely among tree species, but it is little studied. This research measured surface storage capacities of 20 urban tree species in a rainfall simulator. The measurement system included a rainfall simulator, digital balance, digital camera, and computer. Eight samples were randomly collected from each tree species. Twelve rainfall intensities (3.5–139.5 mm h−1) were simulated. Leaf-on and leaf-off simulations were conducted for deciduous species. Stem and foliar surface areas were estimated using an image analysis method. Results indicated that surface storage capacities varied threefold among tree species, 0.59 mm for crape myrtle (Lagerstroemia indica L.) and 1.81 mm for blue spruce (Picea pungens Engelm.). The mean value across all species was 0.86 mm (0.11 mm SD). To illustrate application of the storage values, interception was simulated and compared across species for a 40-yr period with different rainfall intensities and durations. By quantifying the potential for different tree species to intercept rainfall under a variety of meteorological conditions, this study provides new knowledge that is fundamental to validating the cost-effectiveness of urban forestry as a green infrastructure strategy and designing functional plantings.
Surface Water Storage Capacity of Twenty Tree Species in Davis, California
Qingfu Xiao* and E. Gregory McPherson
Urban forestry and tree planting are widely rec-ognized as cost-effective strategies to manage runoff. The potential for trees to intercept rainfall and reduce
runoff varies among tree species because of differences in their leaf area, gap fraction, surface storage capacity, and other char-acteristics. Little information exists on these traits, limiting the ability of managers to identify how different species will per-form over the long term. This study addresses one of these criti-cal knowledge gaps. Leaf-on and leaf-off surface water storage capacities are measured in a rainfall simulator for 20 tree species. This new knowledge is applied to illustrate how interception varies over 40 years for three species with different surface water storage capacities.
Green infrastructure is an approach to stormwater manage-ment that uses natural or engineered systems that mimic natural processes (Foster et al., 2011). Trees, like green roofs, rain gar-dens, and permeable paving, can intercept and promote infil-tration of rain where it falls, reducing stormwater runoff and pollutant loading of receiving water bodies. These strategies can be cost-effective because of lower capital costs and operational costs relative to “grey” infrastructure (Odefey et al., 2012; Stovin et al., 2008). Also, trees can reduce economic and public health impacts associated with flooding damage and waterborne ill-nesses (Gaffield et al., 2003). Trees can provide other benefits such as urban heat island reduction, energy savings, carbon stor-age, and air pollutant removal ( Ju and Yoon, 2011; King et al., 2014; Simpson, 1998; Zhao et al., 2010).
During a rainfall event, precipitation is either intercepted by foliage, branches, and trunk or it falls directly through gaps in the crown to the ground. The tree’s total stem and leaf sur-face areas and its gap fraction (i.e., percentage of the crown that allows rain to fall unimpeded to the ground) directly influence the amount of rainfall intercepted and throughfall. Intercepted water is temporarily stored on leaf and bark surfaces. There are two types of surface water storage (Hewlett, 1982; Xiao et al., 2000a). Saturation storage, or minimum storage, is the thin film of water that must wet the tree surface before flow begins. Saturation storage never reaches the ground and can only be removed through evaporation. Detention storage, or maximum
Q. Xiao, Dep. of Land, Air, and Water Resources, Univ. of California–Davis, 1731 Research Park Dr., Davis, CA 95618; E.G. McPherson, USDA Forest Service, Urban Ecosystems and Social Dynamics Program, PSW Research Station, Davis, CA 95618. Mention of trade names or commercial products in this article is solely for providing specific information and does not imply recommendation or endorsement by the authors, their respective institutions, or the USDA. Assigned to Associate Editor Stephen Livesley.
Copyright © 2015 American Society of Agronomy, Crop Science Society of America, and Soil Science Society of America. 5585 Guilford Rd., Madison, WI 53711 USA. All rights reserved. J. Environ. Qual. 45:188–198 (2016) doi:10.2134/jeq2015.02.0092 Received 11 Feb. 2015. Accepted 15 June 2015. *Corresponding author ([email protected]).
Journal of Environmental QualityTHE URBAN FOREST AND ECOSYSTEM SERVICES
SPECIAL SECTION
Core Ideas
• Quantitative analysis of surface water storage capacities for 20 urban tree species.• Surface water storage capacities varied threefold among tree species.• Conifers had the highest storage capacities and simulated in-terception rates.
Published January 11, 2016

Journal of Environmental Quality 189
storage, is rainwater detained temporarily on the tree surface. Part of this detention storage drips to the ground surface, flows down the tree trunk to the ground, or evaporates into the atmosphere.
Tree rainfall interception is strongly influenced by the rain-fall event, tree species, and meteorological factors (Xiao et al., 2000a). The intensity and duration of rainfall events influence interception, as do meteorological variables such as temperature, relative humidity, net radiation, and wind speed. A tree crown will intercept a smaller percentage of precipitation from a short, intense event that quickly saturates its storage capacity than from a longer, less-intense event. Temporal variations in rainfall intensity influence stem flow by modifying the development of trickle pathways along branches and dislodgement of water drops (Dunkerley, 2014a,b) High air temperatures and wind speeds hasten evaporation of water stored in the crown, thereby enhancing interception potential.
Differences in surface morphogenesis among tree species can strongly influence surface water storage capacity. Leaf and bark surfaces range from highly water repellent to actively absorb-ing of liquid water or water vapor ( Juniper and Jeffree, 1983). Species with the highest leaf surface storage tend to be those with the lowest leaf hydrophobicity and water droplet retention (Holder, 2013). Leaf surface morphogenesis also influences the amount of throughfall and its drop-size distribution. Causal fac-tors that vary among species include leaf hydrophobicity, rough-ness, geometry, and inclination (Nanko et al., 2006, 2013). Bark morphology and branching architecture influence differences in water storage among species. The bark water storage capacity of northern red oak (Quercus rubra L.) was 2.5 times higher than sweet birch (Betula lenta L.) (Levia and Herwitz, 2005).
Interception has been measured in the field with natural rainfall using the volume control method (Xiao et al., 2000b). Full-scale catchments were constructed under individual trees to measure throughfall, stem flow, and precipitation during a vari-ety of rainfall events. In the laboratory, researchers used rainfall simulators to monitor weight change of individual trees (Keim et al., 2006). The loading-cell method was used to measure the weight change of single trees (Lundberg, 1993; Storck et al., 2002). In other studies, tree samples were submerged into water and their weight change recorded (Aston, 1979; Wood et al., 1998).
The complex and dynamic interactions between rainfall, meteorology, and tree crown architecture are described in a three-dimensional stochastic model of single-tree rainfall inter-ception processes (Xiao et al., 2000a). Model predictions were calibrated with actual interception data from two mature open-grown trees. A model sensitivity analysis indicated that surface saturation storage capacity had the greatest influence on inter-ception. Given the importance of this variable, it is surprising that relatively few studies have measured and reported it, espe-cially for urban tree species.
Studies of rainfall interception indicate that saturation and detention storage values vary widely among tree species and geo-graphic locations (Keim et al., 2006; Liu, 1998; Putuhena and Cordery, 1996; Wood et al., 1998). Surface water storage was reported as low as 0.1 mm for a thimbleberry (Rubus parviflorus Nutt.) tree (Keim et al., 2006), but as high as 2.0 mm for a cork oak (Quercus suber L.) tree (Xiao et al., 2000b). In climate regions where most annual precipitation occurs in the winter
season, such as in California, surface saturation storage accounts for the greatest portion of interception because evaporation is limited during rain events because of high relative humidity and low air temperature (Xiao et al., 2000b).
Although surface water storage capacity values are widely used in hydrological, ecological, and environmental model-ing (Hilde and Paterson, 2014; Wang et al., 2008; Xiao and McPherson, 2002; Xiao et al., 2000a), they are difficult to accu-rately quantify in the field. Surface storage capacities have been typically estimated based on regression relationships of through-fall and rainfall, scaling up surface water absorption measured on small samples, and weight change of tree samples in rainfall simulators. The regression method has a straight forward math-ematical form and simplifying assumptions (e.g., evaporation is negligible during rainfall events and crown surfaces are fully saturated when rainfall exceeds saturation storage). This method is widely used to predict interception (Gash, 1979; Lankreijer et al., 1993; Rutter et al., 1971; Xiao and McPherson, 2011; Xiao et al., 2000b). The scaling-up method is based on crown surface area (Herwitz, 1985; Keim et al., 2006) and biomass indices (Crockford and Richardson, 1990; Teklehaimanot et al., 1991). Laboratory rainfall simulators were used to measure vegetation surface water storages (Keim et al., 2006) to overcome the field surface-water-storage-measurement problems associated with cost and field conditions. Advantages of using simulated rainfall to measure surface water storages are that meteorological condi-tions can be controlled and measurements can be repeated.
Applying surface storage values from forests to urban trees is problematic because of differences in the species mix and tree architecture (McPherson and Peper, 2012). Open-grown trees usually have larger crown projection areas (i.e., area under tree drip line) and total leaf and stem surface areas but smaller leaf and stem area indices than trees in rural forests (Peper and McPherson, 2003; Xiao et al., 2000b).
Most studies that report throughfall, stem flow, and intercep-tion loss have relied on surface water storage capacity values from rural forests (Asadian and Weiler, 2009; Xiao and McPherson, 2011; Xiao et al., 2000a). Although tree crown architecture, leaf and stem roughness, and their geometric shapes are known to influence surface storage capacities, species-specific storage capacity values for different urban tree species are lacking (Xiao et al., 2000a). For example, interception values used in popular green infrastructure accounting tools such as the Green Values Calculator (Center for Neighborhood Technology, 2010) and i-Tree Streets (formerly STRATUM) (Maco and McPherson, 2002) assume surface water storage capacities of 1.0 mm across all tree species (Berland and Hopton, 2014). Urban water managers lack information on this key variable that is critical to selecting tree species to optimize interception and runoff reduction (Day and Dickinson, 2008; Mitchell et al., 2008).
The objective of this study is to quantify the surface water storage capacity of 20 common urban tree species in Davis, CA, using direct laboratory measurements with simulated precipitation. The responses of tree leaves and stem surface storage capacities to different rainfall intensities and seasonal changes in leaf surface area are described. To illustrate their effects on interception, surface storage capacity values are applied in a 40-yr simulation for three different tree species.

Materials and Methods The volume-control method was used to measure the change
in surface water storage of tree samples under the rainfall simu-lator for different rainfall intensities. Leaf-on samples measured surface water storage of the foliar and stem surfaces. Leaf-off samples measured water storage capacities of the stem surfaces only. The measured data sets were examined using standard regression analysis.
The effects of different water storage capacities on intercep-tion were illustrated using urban tree growth equations for a deciduous, broadleaf evergreen, and coniferous species with meteorological data for Davis, CA (McPherson and Peper, 2012). Rainfall interception was simulated and compared across species for a 40-yr period using the interception model devel-oped by Xiao (2008).
Experimental System Setup The experimental measurement system consisted of two
parts: a rainfall simulator and a weighing measurement system (Fig. 1). The rainfall simulator delivered water at rates from 10.2 to 139.7 mm h−1. An electronic weighing unit and a com-puter data collection system continuously recorded weights of the samples at 5-s intervals. Tree samples were suspended from the electronic weighing unit using clear fishing line (South Bend 30 lbs.).
Tree Samples The tree species selected in this study represented 77% of
all street trees surveyed in the Davis, CA, municipal forest inventory (Maco and McPherson, 2003). These 20 tree spe-cies included 11 broadleaf deciduous species, five broadleaf evergreen species, and four conifers (Table 1). The sample con-sisted of two trees of each species that were randomly selected from the City of Davis and the campus of the University of
Table 1. Surface water storage capacity measurement tree species list.
Fig. 1. Diagram of the experimental setup.
California–Davis. Sample trees were greater than 7.5 cm in diameter at breast height. Four branch samples were collected from each selected tree at each of four compass bearings (i.e., east, south, west, and north) approximately 0.6 m inside the tree crown drip line. Branch samples were no shorter than 0.9 m or longer than 1.7 m. The sample branch’s cut end was sealed with paraffin wax. The branches were placed in a plastic container with dry ice in the bottom and a cloth overlay for transporting from the field to the rainfall simulator. To reduce measurement errors from wilted leaves, measurements in the simulator began within 30 min of sample collection. Branches of the deciduous tree species were sampled during the leaf-off season to measure stem surface water storage capacities.
Physiognomic type Botanical name Common name Species code BD† Celtis sinensis Pers. Chinese hackberry CESI BD Fraxinus angustifolia Vahl ‘Raywood’ Raywood ash FRAN_R BD Ginkgo biloba L. Ginkgo GIBI BD Gleditsia triacanthos L. Honey locust GLTR BD Lagerstroemia indica L. Crape myrtle LAIN BD Liquidambar styraciflua L. Sweetgum LIST BD Pistacia chinensis Bunge Chinese pistache PICH BD Platanus ´hispanica Mill. ex Munchh. London plane PLAC BD Pyrus calleryana Decne. Bradford pear PYCA_B BD Quercus lobata Nee Valley oak QULO BD Zelkova serrata (Thunb.) Makino Japanese zelkova ZESE BE Cinnamomum camphora (L.) J. Presl Camphor CICA BE Eucalyptus globulus Labill. Blue gum EUGL BE Fraxinus uhdei (Wenz.) Lingelsh. Shamel ash FRUH BE Magnolia grandiflora L. Southern magnolia MAGR BE Quercus ilex L. Holly oak QUIL CE Picea pungens Engelm. Blue spruce PIPU CE Pinus canariensis C. Sm. Canary island pine PICA CE Pinus pinea L. Italian stone pine PIPI CE Sequoia sempervirens (D. Don) Endl. Redwood SESE
† BD, broadleaf deciduous; BE, broadleaf evergreen; CE, coniferous evergreen.
Journal of Environmental Quality 190
Rainfall Simulator The rainfall simulator was built at the University of
California–Davis Hydrology Drainage Laboratory. The 1.22 by 1.22 m square-shaped simulator included a water supply, water spring nozzle, rainfall intensity controller, and rainwa-ter collection system. Municipal water was directed through a water filter and a pressure regulator to feed the rainfall simulator that consisted of 38 individual water spray nozzles (Cloudburst Misting Systems). These 38 nozzles consisted of six different sizes. By combining different nozzles with inline water shutoff valves, 12 different rainfall intensities were simu-lated. These intensities ranged from 3.6 to 139.7 mm h−1 (Table 2). The precipitation rates were determined using the precipi-tation rate catch-can test method. The rainfall simulator was mounted to the ceiling at 5.5 m above the ground surface. A water collection basin (L × W × D = 1.83 × 1.83 × 0.15 m) sat below the simulator and sent excess water to the laboratory’s drainage system.
Weighing and Data Collection System The data collection system included an electronic weigh-
ing unit (GX10K, A&D Company, Ltd. 3–23–14 Higashi Ikebukuro) and a computer that recorded the dynamic weight change of the tree sample at different rainfall intensities. The weighing unit measured up to 10.0 kg with a 0.01-g resolution. The computer was connected to the weighing unit via a RS-232C serial interface and recorded weights at 20 Hz frequency. Branch weight was continuously displayed digitally and graphically dis-played on the computer.
The simulation sequence began with the lightest rainfall intensity (i.e., 3.56 mm h−1) and ended with the highest (i.e., 139.70 mm h−1). Once the weight of the sample reached a pla-teau with quasi-equilibrium status for 300 s the water supply was turned off for 10 min before next simulation commenced. After completing the simulation for the highest rainfall intensity, the water supply was turned off and the branch’s weight change was recorded during the drying phase.
Table 2. Physical properties of the rainfall simulator.
Rainfall Nozzle part no.† Flow rate Drop size Terminal
velocity mm h−1 L h−1 mm m s−1
3.56 CB103 1.89 1.29 4.88 5.08 CB106 2.15 1.32 4.97 6.35 CB108 2.45 1.36 5.06 12.70 CB112 3.00 1.41 5.20 19.05 CB115 3.60 1.45 5.33 25.40 CB120 3.70 1.46 5.35 31.75 CB128‡ 38.10 50.80 63.50 76.20 139.70
† Nozzle part number from Cloudburst Misting Systems, Inc.
‡ CB128 is a five-set cluster nozzle in which flow rate varied with nozzle combinations.
Branch and Leaf Surface Area Leaf and stem surface areas were measured using a digital image
processing method. Upon completion of the rainfall simulations each sample was disassembled into leaves and stems. The leaves or stems were arranged on a 1.22 by 1.22 m whiteboard along with four 76 by 127 mm reference cards. Branches were cut into short segments so that each stem segment was straight. A high-resolution digital infrared camera (Fujifilm IS Pro, FUJIFILM North America Corp.) was installed 4.6 m above the white-board. Branches, leaves, stems, and reference cards were carefully laid on the whiteboard without overlap. The vertical-view image was electronically processed to calculate each branch’s leaf and stem surface area. The image processing included image isolation and estimating reference and leaf or stem surface areas. Image iso-lation was conducted using Adobe Photoshop software (Adobe Systems Inc.) following the method developed by USDA Forest Service (Peper and McPherson, 2003). Surface area estimation was conducted using ArcGIS software (ESRI International). The leaf surface area for broadleaf trees was estimated based on one side of each leaf. To account for the more cylindrical shape of conifer needles and stems, the two-dimensional surface area was multiplied by the factor of p.
Data Analysis The surface water storage of each sample branch was expressed
by Eq. [1] and assumed that water lost via transpiration during the rainfall simulation was negligible.
dC p e -d [1]= -dt
dW =W -W [2]wet fresh dt
where C is the sample’s surface water storage depth, t is time, p is rainfall rate, e is surface water evaporation rate of the sample, d is water drip rate of the sample, W is the sample’s weight, Wwet is the weight of the sample during rainfall simulation and Wfresh is the sample’s weight before the simulation. The calculations assumed that 1.0 g water had a volume of 1.0 cm3 and changes in water density due to temperature, pollutants, and minerals in the rainfall simulator’s water were negligible. Equation [1] and [2] were linked by the following equations:
W =CS r [3]A w
W =W +CS r [4]wet fresh A w
CS =C S +C S [5]A leaf leaf stem stem
where SA is the sample’s surface area, and r w is the density of water. For deciduous tree species, surface water storage capacity and surface area were separated into leaf and stem components.
For each tree species, the surface water storage depth was aver-aged from measurements recorded for the eight branch samples. Standard descriptive statistics were applied to analyze the data. Mean values, as well as maximum, minimum, and standard devi-ations are presented for each species.
The sample’s recorded weight was adjusted to account for the force of raindrops impinging on tree sample surfaces. This
Journal of Environmental Quality 191

192 Journal of Environmental Quality
adjustment was based on the relationship of force and momen-tum by the following:
F t -mvD =mvf i [6]
where F is force of a raindrop hitting the canopy surface, Dt is the contact time of the raindrop and the sample’s surface, m is the mass of the raindrop, vf is the raindrop’s final velocity after strik-ing the sample’s surface, and vi is the raindrop’s terminal velocity. It is assumed that the raindrop loses all momentum once it hits the sample’s surface (i.e., vf = 0).
The rainfall’s drop size and terminal velocity were calculated based on rainfall density. The median-volume diameter Dp of the rainfall drops is related to rainfall intensity p by the following (Laws and Parsons, 1943):
0.182Dp =1.238 p [7]
The raindrop’s terminal velocity vi is determined from basic mechanics. Assuming that a raindrop is released from rest, it will accelerate until it reaches terminal velocity (Chow et al., 1988):
4 gDp ær ö ç w ÷vi = ç -1÷÷ [8]3Cd
ççè ra ø÷
where g is the acceleration of gravity, Cd is the dimensionless drag coefficient, and r a is the density of air.
Application of Canopy Surface Water Storage Data A broadleaf deciduous tree, Japanese zelkova [Zelkova serrate
(Thunb.) Makino]; broadleaf evergreen, holly oak (Quercus ilex L.); and conifer, Italian stone pine (Pinus pinea L.) were selected to illustrate the effects of surface water storage values on rain-fall interception. These trees are popular street trees in the study area. Tree growth data for each species were obtained from the national urban tree database (McPherson and Peper, 2012). Figure 2 shows relationships among age, crown diameter, and leaf surface area for these three trees. The precipitation data for Davis, CA, were obtained from the National Weather Service of the National Oceanic and Atmospheric Administration (Perica
et al., 2011). The rainfall intensity–duration–frequency relation-ship is shown in Table 3. The rainfall interception model was pro-grammed to calculate total water storage on canopy surfaces for different design storm events (Xiao, 2008) over a 40-yr period.
Results and Discussion Surface Water Storage Capacities
Surface water storage capacities varied threefold across spe-cies. Values ranged from a mean of 0.59 mm for crape myrtle (Lagerstroemia indica L.) to 1.81 mm for blue spruce (Picea pun-gens Engelm.) for all surfaces (Table 4). The mean value across all species was 0.86 mm (0.11 mm SD). Storage capacities for leaf surfaces only of deciduous species ranged from 0.57 mm for Bradford pear (Pyrus calleryana Decnne. ‘Bradford’) to 1.20 mm for valley oak (Quercus lobata Nee). The mean value for leaf surfaces only was 0.97 mm (0.16 mm SD). Storage capaci-ties for stem surfaces only ranged from 0.17 for Chinese hack-berry (Celtis sinensis Pers.) to 0.37 for sweetgum (Liquidamber styraciflua L.). The mean storage capacity for stem surfaces only was 0.25 mm (0.06 mm SD). Leaf surface storage capacities were two to seven times greater than stem storage capacities for these deciduous species.
In general, conifer species had highest minimum and maxi-mum surface water storage capacities and broadleaf species had the lowest storage values (Table 4). The mean storage capacities were 0.77 mm (SD 0.19), 0.78 mm (SD 0.05), and 1.25 mm (SD 0.38) for broadleaf deciduous, broadleaf evergreen, and conifer-ous trees, respectively. The mean storage capacities for broadleaf deciduous and evergreen species were similar, but the standard deviation of the deciduous trees was three times larger than for the broadleaf evergreens.
The minimum surface water storage values for all surfaces of deciduous species ranged from 0.28 mm for Raywood ash (Fraxinus angustifolia Vahl ‘Raywood’) to 0.80 mm for valley oak. Differences in these storage values reflected differences in the morphology of leaf and stem surfaces. Raywood ash has dense, compound leaves, the leaflets are flexible, and the sur-faces are smooth. In contrast, valley oak has a rigid leaf with a
relatively rough surface. Maximum water stor-age ranged from 0.63 mm for Bradford pear to 1.61 mm for Chinese pistache (Pistacia chinensis Bunge). The pear’s simple leaves are very smooth, as are the stem surfaces. The Chinese pistache leaves are pinnately compound with rough stem surfaces. The smaller, more rigid leaflets and rougher stems of the pistache slow down water flow across tree surfaces compared with the pear. The Bradford pear tree had the smallest differ-ence between its minimum and maximum stor-age capacities (0.20 mm) while Chinese pistache had the largest difference (0.89 mm), indicating that the pistache’s rigid, rough surfaces have rela-tively high water storage capacities.
Among the broadleaf evergreen trees, blue gum (Eucalyptus globulous Labill.) had the smallest minimum and maximum water storage capacities because of its smooth surface struc-ture. The holly oak had the largest minimum andFig. 2. Relationships among tree age, crown diameter (CD), and leaf area (LA).

Table 3. Rainfall depth–duration–frequency relationships (mm).
Frequency Duration
1 yr 2 yr 5 yr 10 yr 25 yr 50 yr 100 yr
———————————————————————— mm ————————————————————————
5 min 2.79 3.56 4.57 5.33 6.60 7.87 8.89 10 min 4.06 5.08 6.35 7.62 9.65 11.18 12.95 15 min 5.08 6.10 7.87 9.40 11.43 13.46 15.49 30 min 7.62 9.40 11.94 14.22 17.78 20.83 23.88 60 min 9.91 12.19 15.49 18.54 23.11 26.67 30.99 2 h 14.48 18.03 22.86 26.92 33.02 38.10 43.69 3 h 18.03 22.35 28.19 33.27 40.64 46.48 52.83 6 h 25.91 32.00 40.64 47.75 57.66 65.79 74.17 12 h 34.80 43.43 54.86 64.26 77.47 87.88 98.55 24 h 45.72 57.40 72.64 85.34 102.62 116.08 129.79
maximum surface water storage values because of its rough leaf and stem surfaces. Interstitial spaces between the rigid leaves, lat-eral buds, and stems of holly oak store water and rough surfaces reduce water flow.
Canary island pine (Pinus canariensis C. Sm.) had smallest minimum and maximum water storage capacity values for coni-fers because of its dense clusters of long needles that facilitated water flow and leaf drip. Blue spruce had the largest minimum and maximum water storage values. Its needles are very rigid and the many interstitial spaces formed by the needles, buds, and stems function like small water cups.
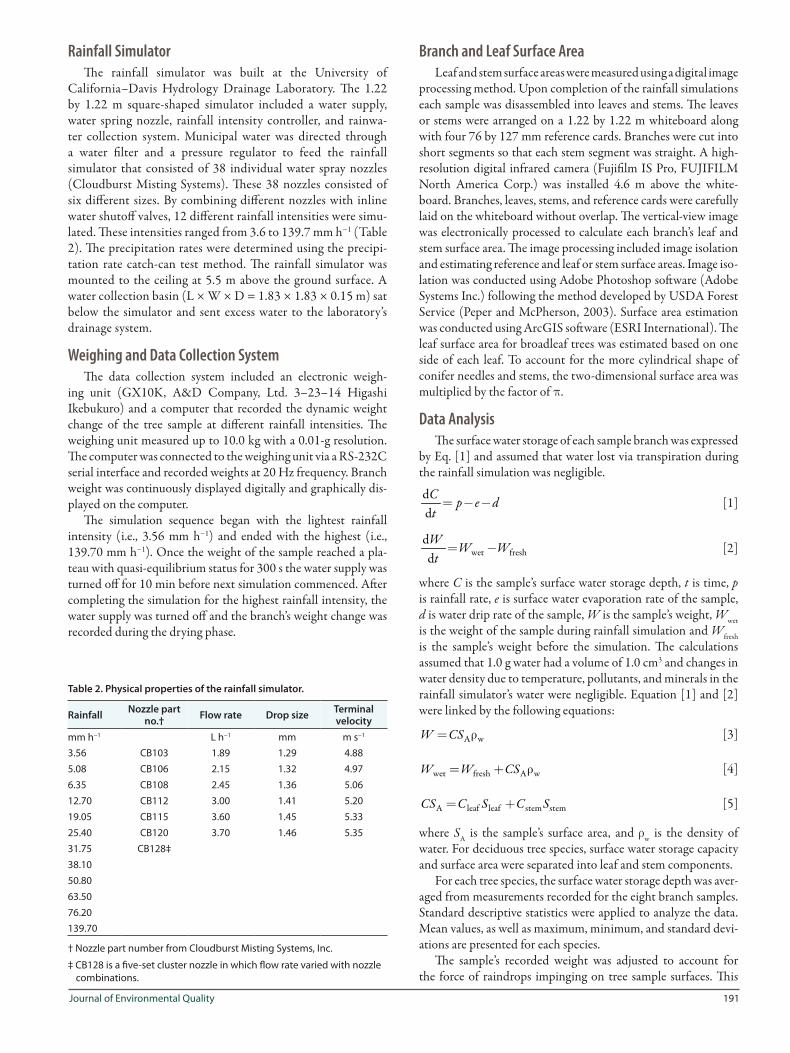
Maximum surface water storage increased with rainfall inten-sity to approximately 80 mm h−1, after which it plateaued (Fig.
3). At very low rainfall intensities (<13 mm h−1), surface water storage increased rapidly. Thereafter, the rate of increase dimin-ished as storage capacity was gradually filled. When rainfall intensity increased from 76.2 to 139.7 mm h−1 (83%), surface water storage increased by 2.9, 3.0, and 6.0% for the Chinese pis-tache, blue spruce, and holly oak, respectively. Chinese pistache had a higher surface water storage capacity than holly oak (Fig. 3). However, during the leaf-off season, the surface water stor-age of the Chinese pistache tree was limited to its stem surfaces (Table 4).
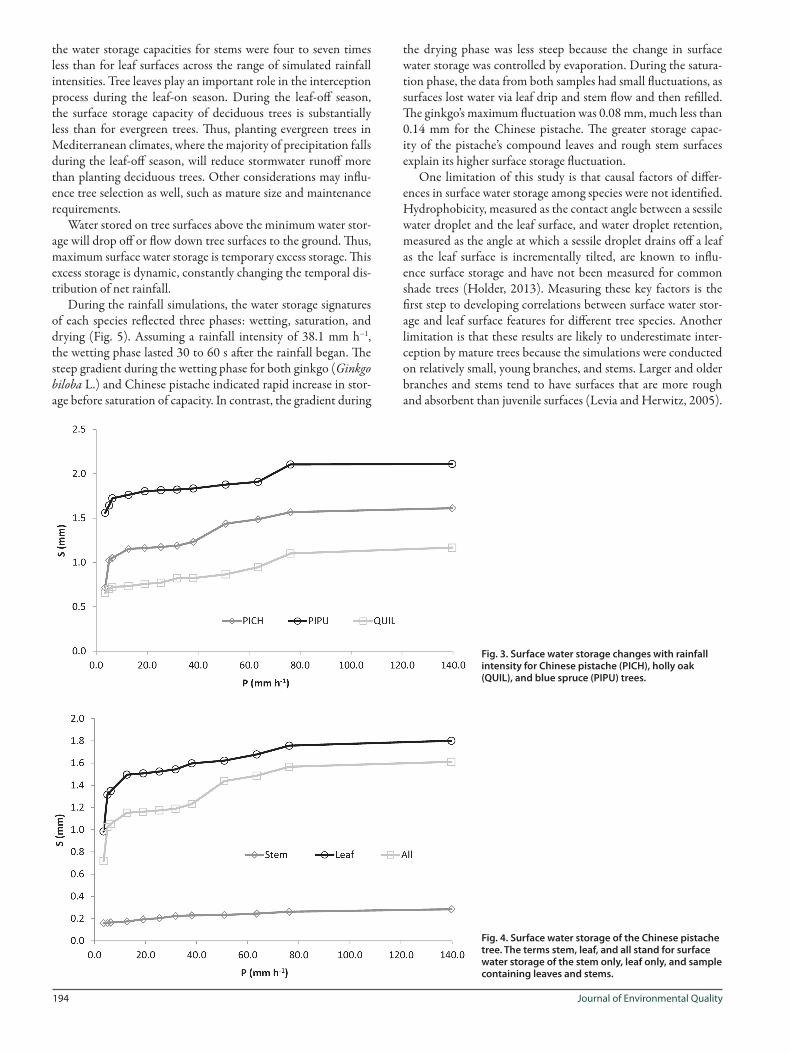
Figure 4 illustrates how the surface water storage capacity of the Chinese pistache tree changed with rainfall intensities across the in-leaf and leaf-off seasons. During the leaf-off season,
Table 4. Surface water storage capacities of 20 tree species measured for 12 rainfall intensities.
Physiognomic Species All surfaces Leaf surface Stem surface type code Mean Min. Max. SD Mean Min. Max. SD Mean Min. Max. SD
——————————————— mm ———————————————
BD CESI 0.71 0.56 0.81 0.08 0.94 0.71 1.10 0.13 0.17 0.11 0.29 0.05 BD FRAN_R 0.60 0.28 0.84 0.13 0.75 0.29 1.06 0.17 0.25 0.16 0.42 0.07 BD GIBI 0.64 0.52 0.74 0.06 0.73 0.59 0.85 0.08 0.18 0.13 0.25 0.04 BD GLTR 0.67 0.54 0.81 0.08 0.70 0.58 0.86 0.08 0.33 0.16 0.47 0.08 BD LAIN† 0.59 0.45 0.72 0.09 BD LIST 0.95 0.62 1.17 0.15 1.16 0.66 1.54 0.23 0.37 0.15 0.57 0.09 BD PICH 1.17 0.72 1.61 0.24 1.51 0.94 2.24 0.42 0.21 0.14 0.31 0.05 BD PLAC 0.87 0.68 1.06 0.10 1.10 0.80 1.43 0.18 0.28 0.13 0.40 0.08 BD PYCA_B 0.51 0.43 0.63 0.06 0.57 0.49 0.70 0.06 0.23 0.12 0.32 0.05 BD QULO 0.91 0.80 1.02 0.06 1.20 0.90 1.50 0.20 0.25 0.16 0.35 0.05 BD ZESE 0.84 0.70 0.95 0.07 1.05 0.90 1.24 0.08 0.18 0.11 0.27 0.05 BE CICA 0.79 0.59 0.90 0.07 BE EUGL 0.70 0.49 0.84 0.10 BE FRUH 0.78 0.61 1.04 0.11 BE MAGR 0.81 0.62 1.01 0.10 BE QUIL 0.82 0.66 1.17 0.13 CE PICA 0.99 0.74 1.34 0.17 CE PIPI 1.04 0.82 1.24 0.11 CE PIPU 1.81 1.56 2.11 0.14 CE SESE 1.16 0.84 1.51 0.25
BD 0.77 0.58 0.94 0.10 0.97 0.68 1.25 0.16 0.25 0.14 0.36 0.06 Average BE 0.78 0.59 0.99 0.10
CE 1.25 0.99 1.55 0.17 All‡ 0.86 0.66 1.07 0.11
† Measurements made for leaf-on season only.
‡ For all 20 tree species.
Journal of Environmental Quality 193
194 Journal of Environmental Quality
the water storage capacities for stems were four to seven times less than for leaf surfaces across the range of simulated rainfall intensities. Tree leaves play an important role in the interception process during the leaf-on season. During the leaf-off season, the surface storage capacity of deciduous trees is substantially less than for evergreen trees. Thus, planting evergreen trees in Mediterranean climates, where the majority of precipitation falls during the leaf-off season, will reduce stormwater runoff more than planting deciduous trees. Other considerations may influ-ence tree selection as well, such as mature size and maintenance requirements.
Water stored on tree surfaces above the minimum water stor-age will drop off or flow down tree surfaces to the ground. Thus, maximum surface water storage is temporary excess storage. This excess storage is dynamic, constantly changing the temporal dis-tribution of net rainfall.
During the rainfall simulations, the water storage signatures of each species reflected three phases: wetting, saturation, and drying (Fig. 5). Assuming a rainfall intensity of 38.1 mm h−1, the wetting phase lasted 30 to 60 s after the rainfall began. The steep gradient during the wetting phase for both ginkgo (Ginkgo biloba L.) and Chinese pistache indicated rapid increase in stor-age before saturation of capacity. In contrast, the gradient during
the drying phase was less steep because the change in surface water storage was controlled by evaporation. During the satura-tion phase, the data from both samples had small fluctuations, as surfaces lost water via leaf drip and stem flow and then refilled. The ginkgo’s maximum fluctuation was 0.08 mm, much less than 0.14 mm for the Chinese pistache. The greater storage capac-ity of the pistache’s compound leaves and rough stem surfaces explain its higher surface storage fluctuation.
One limitation of this study is that causal factors of differ-ences in surface water storage among species were not identified. Hydrophobicity, measured as the contact angle between a sessile water droplet and the leaf surface, and water droplet retention, measured as the angle at which a sessile droplet drains off a leaf as the leaf surface is incrementally tilted, are known to influ-ence surface storage and have not been measured for common shade trees (Holder, 2013). Measuring these key factors is the first step to developing correlations between surface water stor-age and leaf surface features for different tree species. Another limitation is that these results are likely to underestimate inter-ception by mature trees because the simulations were conducted on relatively small, young branches, and stems. Larger and older branches and stems tend to have surfaces that are more rough and absorbent than juvenile surfaces (Levia and Herwitz, 2005).
Fig. 3. Surface water storage changes with rainfall intensity for Chinese pistache (PICH), holly oak (QUIL), and blue spruce (PIPU) trees.
Fig. 4. Surface water storage of the Chinese pistache tree. The terms stem, leaf, and all stand for surface water storage of the stem only, leaf only, and sample containing leaves and stems.

Journal of Environmental Quality 195
Fig. 5. Example data from surface water storage measurement experiments of the ginkgo (GIBI) and Chinese pistache (PICH) trees. For each graphic, the first section is the surface wetting phase. The saturation phase of the middle section is highlighted with gray-colored box. The third section is the drying phase. The simulated rainfall intensity was 38.1 mm h−1.
Fig. 6. Rainfall interception of (a) holly oak (QUIL) and Italian stone pine (PIPI) trees and (b) Japanese zelkova (ZESE) tree for a 5-min storm of 2-, 5-, and 25-yr return frequencies. The number 2, 5, and 25 in the legend stands for storm return frequency. The Off in the legend indicates the storm occurred during leaf-off season.

196 Journal of Environmental Quality
Fig. 7. (a) Italian stone pine (PIPI), (b) holly oak (QUIL), and (c) Japanese zelkova (ZESE) trees response to a 2-yr return frequency of a 5-, 15-, 30-, and 60-min-duration storm events.
New knowledge concerning changes in stem and leaf area indi-ces, as well as surface properties across species and age, is critical to more accurate modeling of rainfall interception. Expanded research on whole-tree interception is needed as a basis for scal-ing up laboratory and field experiments that are conducted on components of trees.
Application of Canopy Surface Water Storage Data Surface water storage data were applied to three physiog-
nomic types of trees to demonstrate effects on modeled intercep-tion for Japanese zelkova, a broadleaf deciduous tree; holly oak, a broadleaf evergreen; and Italian stone pine, a conifer. For a 5-min storm event, rainfall interception increased with tree age with 2-, 5-, and 25-yr rainfall return frequencies (Fig. 6). The young stone pine intercepted more rainfall than the young holly oak because of its higher surface water storage capacity. After 10 yr, the holly oak intercepted more rainfall because of increasing crown spread and total leaf and stem surface areas (Fig. 2, 6a).
A tree’s total leaf and stem surface areas plays an important role in rainfall interception during the leaf-on and leaf-off sea-sons, During the leaf-on season, a 40-yr Japanese zelkova tree can intercept 85, 85, and 62% of rainfall for a 2-, 5-, and 25-yr storm event, respectively. However, during the leaf-off season,
interception drops to 16, 26, and 25% for the same storm events (Fig. 6b).
For a 2-yr return-frequency storm, rainfall interception of the Italian stone pine tree increased with tree age and storm duration (Fig. 7a). At age 40, the rainfall interception was 0.3 m3 for a 5-min storm event and 0.8 m3 for a 60-min storm event (Fig. 7a). A similar rainfall interception pattern was observed for the holly oak (Fig. 7b). However, interception increased little for storms longer than 30 min because storage capacity was fully saturated. Rainfall interception of the Japanese zelkova tree (Fig. 7c) illus-trated a different surface water storage and rainfall relationship. Surface storage capacities were greater than the amount of rain-fall for a 5-min storm, thus rainfall interception was controlled by the amount of rainfall. However, for storms with 15-, 30-, and 60-min durations, the amount of rainwater was greater than the surface water storage capacity and rainfall interception was con-trolled by the surface storage capacities.
It is axiomatic that large trees can store more rain water on their surfaces than small trees. However, the relations between surface water storage–duration–frequency for mature trees are complex (Table 5). The percentage of rainfall intercepted decreased as the duration and frequency of events increased. Thus, rainfall interception has a greater influence on the distri-bution of rainfall during small storm events than during large events.
The maximum surface water storage of each species (72% for stone pine, 81% for holly oak, 85% for zelkova) was limited by its maximum surface water storage area. Although the percentage interception was least for stone pine, it functioned at this level for the greatest number of events. In contrast, zelkova had the highest storage percentage, but this was for the fewest number of events.
Conclusions This study measured crown surface water storage capacities
of 20 urban tree species in a rainfall simulator. There are four key findings. Surface water storage capacities varied threefold across species, confirming the importance of applying this type of research to other urban tree species. Because of differences in leaf and stem morphologies and surface roughness, conifer species had highest surface water storage capacities and broadleaf species had the lowest values. Maximum crown surface storage increased with rainfall intensity, and this capacity varied with tree spe-cies and age. Rainfall interception was controlled by precipita-tion for small rainfall events and by surface storage capacities for larger rainfall events. The dearth of whole-tree interception studies limits our ability to scale up studies on tree components. Quantifying the potential for different tree species to intercept rainfall under a variety of meteorological conditions is funda-mental to validating the cost-effectiveness of tree planting as a green infrastructure strategy and designing the most functional plantings.
Acknowledgments This research was supported in part by funds from a Cooperative Agreement with the USDA Forest Service, Pacific Southwest Research Station. The authors express their appreciation to Cindy Yu Yeung, Connie Jew, Jennifer Lee, and Sandy Tran of the University of California–Davis for their help running the rainfall simulation experiments and performing the image analysis. Also, thanks to the

Table 5. Surface water storage–duration–frequency relationship of three 40-year-old trees.
Frequency Tree Time 1 yr 2 yr 5 yr 10 yr 25 yr 50 yr 100 yr 1 yr 2 yr 5 yr 10 yr 25 yr 50 yr 100 yr
Interception h ———————————— m3 ———————————— ———————————— % ————————————
PIPI 0.08 0.23 0.29 0.38 0.44 0.54 0.65 0.73 72.00 72.00 72.00 72.00 72.00 72.00 72.00 0.17 0.33 0.42 0.52 0.63 0.79 0.80 0.80 72.00 72.00 72.00 72.00 72.00 62.91 54.28 0.25 0.42 0.50 0.65 0.77 0.80 0.80 0.80 72.00 72.00 72.00 72.00 61.52 52.23 45.38 0.50 0.63 0.77 0.80 0.80 0.80 0.80 0.80 72.00 72.00 58.90 49.43 39.55 33.76 29.45 1.00 0.80 0.80 0.80 0.80 0.80 0.80 0.80 70.98 57.67 45.38 37.92 30.42 26.36 22.69 2.00 0.80 0.80 0.80 0.80 0.80 0.80 0.80 48.57 38.99 30.76 26.12 21.29 18.46 16.09 3.00 0.80 0.80 0.80 0.80 0.80 0.80 0.80 38.99 31.46 24.94 21.13 17.30 15.13 13.31 6.00 0.80 0.80 0.80 0.80 0.80 0.80 0.80 27.14 21.97 17.30 14.72 12.19 10.69 9.48 12.00 0.80 0.80 0.80 0.80 0.80 0.80 0.80 20.21 16.19 12.82 10.94 9.08 8.00 7.13 24.00 0.80 0.80 0.80 0.80 0.80 0.80 0.80 15.38 12.25 9.68 8.24 6.85 6.06 5.42
QUIL 0.08 0.31 0.39 0.50 0.59 0.72 0.75 0.75 81.00 81.00 81.00 81.00 81.00 70.59 62.53 0.17 0.45 0.56 0.70 0.75 0.75 0.75 0.75 81.00 81.00 81.00 72.95 57.59 49.74 42.91 0.25 0.56 0.67 0.75 0.75 0.75 0.75 0.75 81.00 81.00 70.59 59.15 48.63 41.29 35.88 0.50 0.75 0.75 0.75 0.75 0.75 0.75 0.75 72.95 59.15 46.56 39.08 31.26 26.69 23.28 1.00 0.75 0.75 0.75 0.75 0.75 0.75 0.75 56.11 45.59 35.88 29.98 24.05 20.84 17.94 2.00 0.75 0.75 0.75 0.75 0.75 0.75 0.75 38.39 30.82 24.32 20.65 16.83 14.59 12.72 3.00 0.75 0.75 0.75 0.75 0.75 0.75 0.75 30.82 24.87 19.72 16.71 13.68 11.96 10.52 6.00 0.75 0.75 0.75 0.75 0.75 0.75 0.75 21.46 17.37 13.68 11.64 9.64 8.45 7.49 12.00 0.75 0.75 0.75 0.75 0.75 0.75 0.75 15.97 12.80 10.13 8.65 7.18 6.32 5.64 24.00 0.75 0.75 0.75 0.75 0.75 0.75 0.75 12.16 9.68 7.65 6.51 5.42 4.79 4.28
ZESE 0.08 0.44 0.56 0.72 0.76 0.76 0.76 0.76 85.00 85.00 85.00 77.26 62.41 52.34 46.36 0.17 0.64 0.76 0.76 0.76 0.76 0.76 0.76 85.00 81.13 64.90 54.09 42.70 36.88 31.81 0.25 0.76 0.76 0.76 0.76 0.76 0.76 0.76 81.13 67.61 52.34 43.85 36.06 30.61 26.60 0.50 0.76 0.76 0.76 0.76 0.76 0.76 0.76 54.09 43.85 34.52 28.97 23.18 19.79 17.26 1.00 0.76 0.76 0.76 0.76 0.76 0.76 0.76 41.60 33.80 26.60 22.23 17.83 15.45 13.30 2.00 0.76 0.76 0.76 0.76 0.76 0.76 0.76 28.47 22.85 18.03 15.31 12.48 10.82 9.43 3.00 0.76 0.76 0.76 0.76 0.76 0.76 0.76 22.85 18.44 14.62 12.39 10.14 8.87 7.80 6.00 0.76 0.76 0.76 0.76 0.76 0.76 0.76 15.91 12.88 10.14 8.63 7.15 6.26 5.56 12.00 0.76 0.76 0.76 0.76 0.76 0.76 0.76 11.84 9.49 7.51 6.41 5.32 4.69 4.18 24.00 0.76 0.76 0.76 0.76 0.76 0.76 0.76 9.01 7.18 5.67 4.83 4.02 3.55 3.18
City of Davis and University of California–Davis Grounds Services for permission to sample trees.
References Asadian, Y., and M. Weiler. 2009. A new approach in measuring rainfall intercep-
tion by urban trees in coastal British Columbia. Water Qual. Res. J. Canada 44:16–25.
Aston, A.R. 1979. Rainfall interception by 8 small trees. J. Hydrol. (Amst.) 42:383–396. doi:10.1016/0022-1694(79)90057-X
Berland, A., and M.E. Hopton. 2014. Comparing street tree assemblages and as-sociated stormwater benefits among communities in metropolitan Cincin-nati, Ohio, USA. Urban For. Urban Green. 13:734–741. doi:10.1016/j. ufug.2014.06.004
Center for Neighborhood Technology. 2010. The value of green infrastructure: A guide to recognizing its economic, environmental and social benefits. Center for Neighborhood Technology, American Rivers, Chicago, IL.
Chow, V.T. D.R. Maidment, and L.W. Mays. 1988. Applied hydrology. McGraw-Hill, New York.
Crockford, R.H., and D.P. Richardson. 1990. Partitioning of rainfall in a euca-lypt forest and pine plantation in southeastern Australia. 1. throughfall measurement in a eucalypt forest: Effect of method and species composi-tion. Hydrol. Processes 4:131–144. doi:10.1002/hyp.3360040204
Day, S.D., and S.B. Dickinson. 2008. Managing stormwater for urban sustain-ability using trees and structural soils. Virginia Polytechnic Institute and State University, Blacksburg.
Dunkerley, D. 2014a. Stemflow on the woody parts of plants: Dependence on rainfall intensity and event profile from laboratory simulations. Hydrol. Processes 28:5469–5482. doi:10.1002/hyp.10050
Dunkerley, D. 2014b. Stemflow production and intrastorm rainfall intensity variation: An experimental analysis using laboratory rainfall simulation. Earth Surf. Process. Landf. 39:1741–1752. doi:10.1002/esp.3555
Foster, J., A. Lowe, and S. Winkelman. 2011. The value of green infrastructure for urban climate adaptation. Center for Clean Air Policy, Washington, DC.
Gaffield, S.J., R.L. Goo, L.A. Richards, and R.J. Jackson. 2003. Public health ef-fects of inadequately managed stormwater runoff. Am. J. Public Health 93:1527–1533. doi:10.2105/AJPH.93.9.1527
Gash, J.H.C. 1979. Analytical model of rainfall interception by forests. Q. J. R. Meteorol. Soc. 105:43–55. doi:10.1002/qj.49710544304
Herwitz, S.R. 1985. Interception storage capacities of tropical rainforest canopy trees. J. Hydrol. 77:237–252. doi:10.1016/0022-1694(85)90209-4
Hewlett, J.D. 1982. Principles of forest hydrology. Univ. of Georgia Press, Athens. Hilde, T., and R. Paterson. 2014. Integrating ecosystem services analysis into sce-
nario planning practice: Accounting for street tree benefits with i-Tree val-uation in Central Texas. J. Environ. Manage. 146:524–534. doi:10.1016/j. jenvman.2014.05.039
Holder, C.D. 2013. Effects of leaf hydrophobicity and water droplet retention on canopy storage capacity. Ecohydrology 6:483–490. doi:10.1002/eco.1278
Ju, J., and Y. Yoon. 2011. An analysis on utilization of urban forest and aware-ness of forest effect for urban heat island (UHI) reduction: A case study of Chung-ju City. J, Urban Design Inst. Korea 12:39–50.
Juniper, B.E., and C.E. Jeffree. 1983. Plant surfaces. Edward Arnold, London. Keim, R.F., A.E. Skaugset, and M. Weiler. 2006. Storage of water on vegetation
under simulated rainfall of varying intensity. Adv. Water Resour. 29:974– 986. doi:10.1016/j.advwatres.2005.07.017
King, K.L., S. Johnson, I. Kheirbek, J.W.T. Lu, and T. Matte. 2014. Differences in magnitude and spatial distribution of urban forest pollution deposi-tion rates, air pollution emissions, and ambient neighborhood air qual-
Journal of Environmental Quality 197

198 Journal of Environmental Quality
ity in New York City. Landsc. Urban Plan. 128:14–22. doi:10.1016/j. landurbplan.2014.04.009
Lankreijer, H.J.M., M.J. Hendriks, and W. Klaassen. 1993. A comparison of models simulating rainfall interception of forests. Agric. For. Meteorol. 64:187–199. doi:10.1016/0168-1923(93)90028-G
Laws, J.O., and D.A. Parsons. 1943. The relation of raindrop-size to in-tensity. Trans. Am. Geophys. Union 24:452–460. doi:10.1029/ TR024i002p00452
Levia, D.F., and S.R. Herwitz. 2005. Interspecific variation of bark water stor-age capacity of three deciduous tree species in relation to stemflow yield and solute flux to forest soils. Catena 64:117–137. doi:10.1016/j. catena.2005.08.001
Liu, S.G. 1998. Estimation of rainfall storage capacity in the canopies of cypress wetlands and slash pine uplands in North-Central Florida. J. Hydrol. 207:32–41. doi:10.1016/S0022-1694(98)00115-2
Lundberg, A. 1993. Evaporation of intercepted snow: Review of exist-ing and new measurement methods. J. Hydrol. 151:267–290. doi:10.1016/0022-1694(93)90239-6
Maco, S.E., and E.G. McPherson. 2002. Assessing canopy cover over streets and sidewalks in street tree populations. J. Arboric. 28:270–276.
Maco, S.E., and E.G. McPherson. 2003. A practical approach to assessing struc-ture, function, and value of street tree populations in small communities. J. Arboric. 29:84–97.
McPherson, E.G., and P.J. Peper. 2012. Urban Tree Growth Modeling. Arboric. Urban For. 38:172–180.
Mitchell, V.G., H.A. Cleugh, C.S.B. Grimmond, and J. Xu. 2008. Linking urban water balance and energy balance models to analyse urban design options. Hydrol. Processes 22:2891–2900. doi:10.1002/hyp.6868
Nanko, K., N. Hotta, and M. Suzuki. 2006. Evaluating the influence of canopy species and meteorological factors on throughfall drop size distribution. J. Hydrol. 329:422–431. doi:10.1016/j.jhydrol.2006.02.036
Nanko, K., A. Watanabe, N. Hotta, and M. Suzuki. 2013. Physical interpretation of the difference in drop size distributions of leaf drips among tree species. Agric. For. Meteorol. 169:74–84. doi:10.1016/j.agrformet.2012.09.018
Odefey, J., S. Detwiler, K. Rousseau, A. Trice, R. Blackwell, K. O’Hera, M. Buck-ley, T. Souhlas, S. Brown, and P. Raviprakash. 2012. Banking on green: A look at how green infrastructure can save municipalities money and pro-vide economic benefits community-wide. American Rivers, the Water En-vironment Federation, the American Society of Landscape Architects and ECONorthwest, Portland, OR.
Peper, P.J., and E.G. McPherson. 2003. Evaluation of four methods for estimating leaf area of isolated trees. Urban Forestry & Urban Greening 2:019–029.
Perica, S., S. Dietz, S. Heim, L. Hiner, K. Maitaria, D. Martin, et al. 2011. Pre-cipitation-frequency atlas of the United States. NOAA atlas 14, Vol. 6. Ver. 2.3 California. US Dep. of Commerce, National Oceanic and Atmospheric Administration, National Weather Service, Silver Spring, MD.
Putuhena, W.M., and I. Cordery. 1996. Estimation of interception capacity of the forest floor. J. Hydrol. 180:283–299. doi:10.1016/0022-1694(95)02883-8
Rutter, A.J., K.A. Kershaw, P.C. Robins, and A.J. Morton. 1971. A predictive model of rainfall interception in forests Part 1 Derivation of the model from observations in a plantation of Corsican Pine. Agric. Meteorol. 9:367–384. doi:10.1016/0002-1571(71)90034-3
Simpson, J.R. 1998. Urban forest impacts on regional cooling and heating energy use: Sacramento County case study. J. Arboric. 24:201–214.
Storck, P., D.P. Lettenmaier, and S.M. Bolton. 2002. Measurement of snow in-terception and canopy effects on snow accumulation and melt in a moun-tainous maritime climate, Oregon, United States. Water Resour. Res. 38:. doi:10.1029/2002WR001281
Stovin, V.R., A. Jorgensen, and A. Clayden. 2008. Street trees and stormwater management. Arboric. J. 30:297–310. doi:10.1080/03071375.2008.974 7509
Teklehaimanot, Z., P.G. Jarvis, and D.C. Ledger. 1991. Rainfall interception and boundary-layer conductance in relation to tree spacing. J. Hydrol. 123:261–278. doi:10.1016/0022-1694(91)90094-X
Wang, J., T.A. Endreny, and D.J. Nowak. 2008. Mechanistic simulation of tree effects in an urban water balance model. J. Am. Water Resour. Assoc. 44:75–85. doi:10.1111/j.1752-1688.2007.00139.x
Wood, M.K., T.L. Jones, and M.T. Vera-Cruz. 1998. Rainfall interception by selected plants in the Chihuahuan desert. J. Range Manage. 51:91–96. doi:10.2307/4003570
Xiao, Q. 2008. What is a park worth? A storm runoff reduction model for Wilm-ington, Delaware. Department of Land, Air, and Water Resources, Univer-sity of California–Davis.
Xiao, Q., and E.G. McPherson. 2002. Rainfall interception by San-ta Monica’s municipal urban forest. Urban Ecosyst. 6:291–302. doi:10.1023/B:UECO.0000004828.05143.67
Xiao, Q.F., and E.G. McPherson. 2011. Rainfall interception of three trees in Oakland, California. Urban Ecosyst. 14:755–769. doi:10.1007/ s11252-011-0192-5
Xiao, Q.F., E.G. McPherson, S.L. Ustin, and M.E. Grismer. 2000a. A new ap-proach to modeling tree rainfall interception. J. Geophys. Res. D Atmo-spheres 105:29173–29188. doi:10.1029/2000JD900343
Xiao, Q.F., E.G. McPherson, S.L. Ustin, M.E. Grismer, and J.R. Simpson. 2000b. Winter rainfall interception by two mature open-grown trees in Davis, California. Hydrol. Processes 14:763–784. doi:10.1002/ (SICI)1099-1085(200003)14:4<763::AID-HYP971>3.0.CO;2-7
Zhao, M., Z.H. Kong, F.J. Escobedo, and J. Gao. 2010. Impacts of urban forests on offsetting carbon emissions from industrial energy use in Hangzhou, Chi-na. J. Environ. Manage. 91:807–813. doi:10.1016/j.jenvman.2009.10.010