Effect of Arm Motion on Standing Lateral Jump Performance
76
Grand Valley State University ScholarWorks@GVSU Masters eses Graduate Research and Creative Practice 12-2017 Effect of Arm Motion on Standing Lateral Jump Performance Arif Ahmed Sohel Grand Valley State University Follow this and additional works at: hps://scholarworks.gvsu.edu/theses Part of the Engineering Commons is esis is brought to you for free and open access by the Graduate Research and Creative Practice at ScholarWorks@GVSU. It has been accepted for inclusion in Masters eses by an authorized administrator of ScholarWorks@GVSU. For more information, please contact [email protected]. Recommended Citation Sohel, Arif Ahmed, "Effect of Arm Motion on Standing Lateral Jump Performance" (2017). Masters eses. 869. hps://scholarworks.gvsu.edu/theses/869
Transcript of Effect of Arm Motion on Standing Lateral Jump Performance

Grand Valley State UniversityScholarWorks@GVSU
Masters Theses Graduate Research and Creative Practice
12-2017
Effect of Arm Motion on Standing Lateral JumpPerformanceArif Ahmed SohelGrand Valley State University
Follow this and additional works at: https://scholarworks.gvsu.edu/theses
Part of the Engineering Commons
This Thesis is brought to you for free and open access by the Graduate Research and Creative Practice at ScholarWorks@GVSU. It has been acceptedfor inclusion in Masters Theses by an authorized administrator of ScholarWorks@GVSU. For more information, please [email protected].
Recommended CitationSohel, Arif Ahmed, "Effect of Arm Motion on Standing Lateral Jump Performance" (2017). Masters Theses. 869.https://scholarworks.gvsu.edu/theses/869

Effect of Arm Motion on Standing Lateral Jump Performance
Arif Ahmed Sohel
A Thesis Submitted to the Graduate Faculty of
GRAND VALLEY STATE UNIVERSITY
In
Partial Fulfillment of the Requirements
For the Degree of
Master of Science in Engineering
School of Engineering
December 2017

3
Dedication
To my parents, MD. Salim Mia and Mrs. Khorsheda Akter, and my wife Afsana Alam, for
their selfless and relentless support to my pursuit of higher studies.
4
Acknowledgments
I would like to thank my committee members for all their support and assistance in
completing this project. Special thanks to my advisor, Dr. Blake Ashby for guiding me throughout
the investigation process and the writing of my thesis. Also, special thanks to Dr. Gordon Alderink
for educating me about the motion capture lab and helping me in data collection. I would also like
to thank the Statistical Consulting Center at Grand Valley State University for helping me in
developing a statistical model of this project.
5
Abstract
Previous jumping studies have examined the role of arm swing in vertical and horizontal
long jump performance, but none have been found which studied the role of arm swing in standing
lateral jumps. The purpose of this study was to investigate the effect of arm motion on standing
lateral jump performance and to examine the biomechanical mechanisms that may explain
differences in jump distance.
A series of lateral jump experiments was performed for two jump cases (free and restricted
arms) in which six participants jumped laterally for maximum distance from two in-ground force
platforms. A motion capture system collected 3D position data for lateral jumps with free and
restricted arms. Inverse dynamics analyses were performed on three-dimensional (3D) models for
free and restricted arm jumps and the joint angular velocities, moments, powers, and work values
were compared. The mechanisms enabling any performance improvement of lateral jump
performance due to free arm motion were also investigated.
Results showed that free arm motion improved standing lateral jump performance by 29%.
This improvement was due to the increase in take-off velocity and increase in the lateral and
vertical displacement of the center of gravity at take-off and touchdown. The improved take-off
velocity and position of the center of gravity at take-off was due to a 33% increase in the work
done by the body in jumps with free arm movement. This increase in work in free arm jumps
compared to restricted arm jumps was found in both upper and lower body joints with the largest
improvements (> 30 J) occurring at the lower back, right hip, and right shoulder.
The increase in work performed at the lower back and right hip could not be explained by
joint torque augmentation resulting from the slowing of joint angular velocities due to arm

6
movement. Other mechanisms involved in enabling this work improvement can be discovered
from further investigations of this movement. For example, computer simulation studies could
provide additional insight into the motor control strategies employed in lateral jumps with free and
restricted arm movement.

7
Table of Contents Abstract ........................................................................................................................................... 5
Table of Contents ............................................................................................................................ 7
List of Figures ................................................................................................................................. 9
List of Tables ................................................................................................................................ 10
1 Introduction ........................................................................................................................... 11
2 Background ............................................................................................................................ 14
2.1 Arm Swing Effect on Jump performance.................................................................................... 14
2.1.1 Vertical Jump Studies ......................................................................................................... 17
2.1.2 Standing Long Jump Studies ............................................................................................... 20
2.2 Lateral Jump Studies ................................................................................................................... 23
3 Method ................................................................................................................................... 28
3.1 Experimental Design ................................................................................................................... 28
3.1.1 Participant Selection ........................................................................................................... 28
3.1.2 Equipment ........................................................................................................................... 29
3.1.3 Model Selection .................................................................................................................. 29
3.1.4 Marker Selection ................................................................................................................. 30
3.1.5 Data Collection ................................................................................................................... 31
3.2 Data Analysis .............................................................................................................................. 32
3.2.1 Joint Center Estimation ....................................................................................................... 33
3.2.2 Kinematic Analysis ............................................................................................................. 33
3.2.3 Inverse Dynamics ................................................................................................................ 37
3.2.4 Joint Power and Work ......................................................................................................... 40
3.2.5 Effect of center of gravity (CG) position differences on jump distance ............................. 42
3.2.6 Statistical modeling ............................................................................................................. 43
4 Results ................................................................................................................................... 44
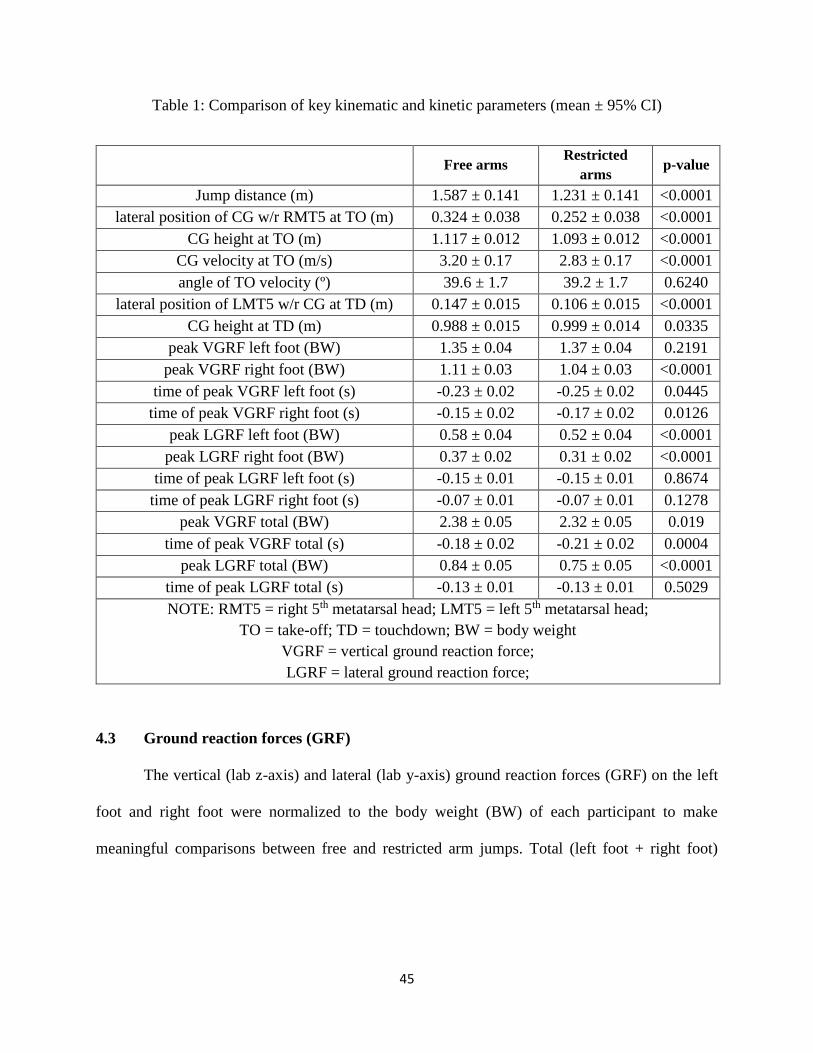
4.1 Jump distance .............................................................................................................................. 44
4.2 Center of Gravity (CG) kinematics ............................................................................................. 44
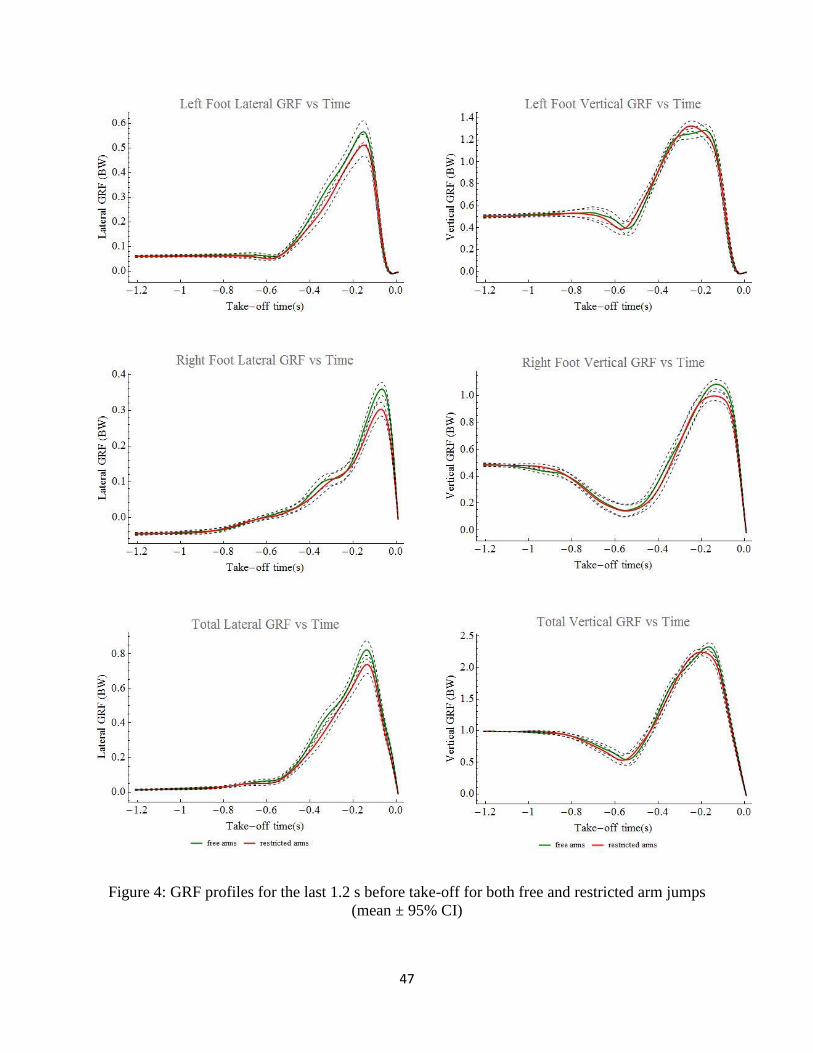
4.3 Ground reaction forces (GRF) .................................................................................................... 45
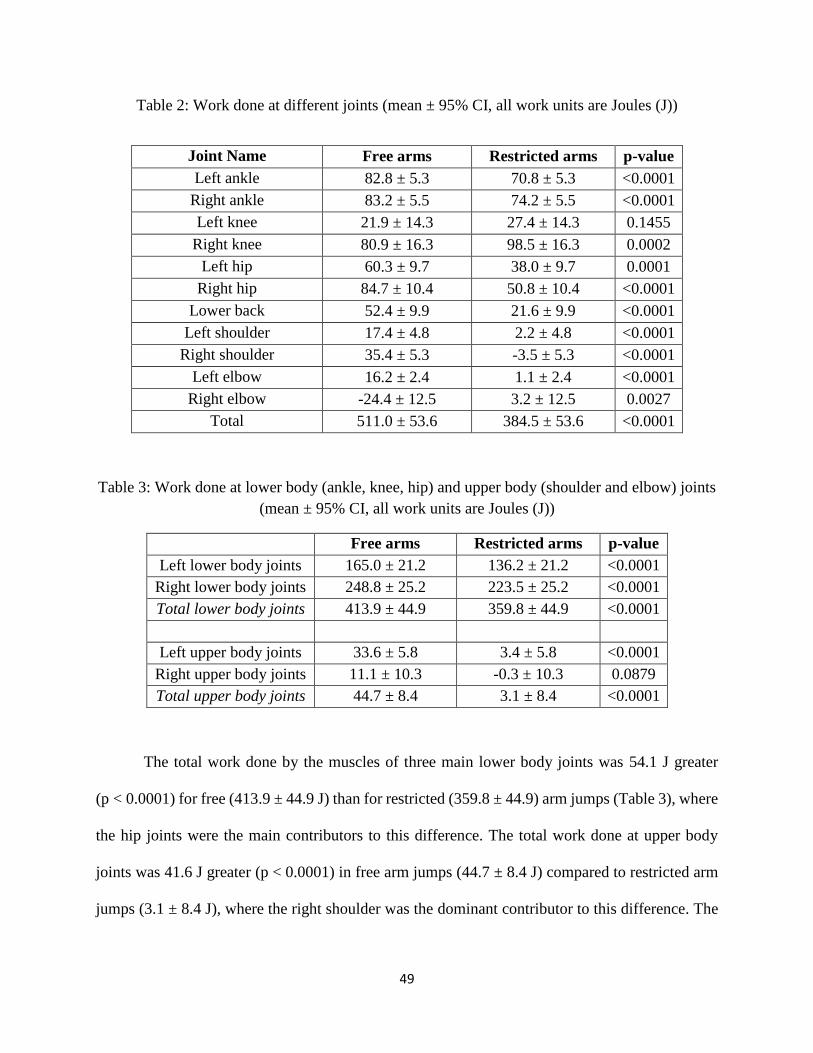
4.4. Work analysis ................................................................................................................................... 48
4.5 Power analysis of lower back and right hip ................................................................................ 50
4.5.1 Power analysis of lower back .............................................................................................. 50
4.5.2 Power analysis of right hip .................................................................................................. 55

8
5 Discussion .............................................................................................................................. 59
6 Conclusion ............................................................................................................................. 65
Appendices .................................................................................................................................... 66
Appendix A ............................................................................................................................................. 66
Appendix B ............................................................................................................................................. 68
Appendix C ............................................................................................................................................. 70
Appendix D ............................................................................................................................................. 71
References ..................................................................................................................................... 72

9
List of Figures
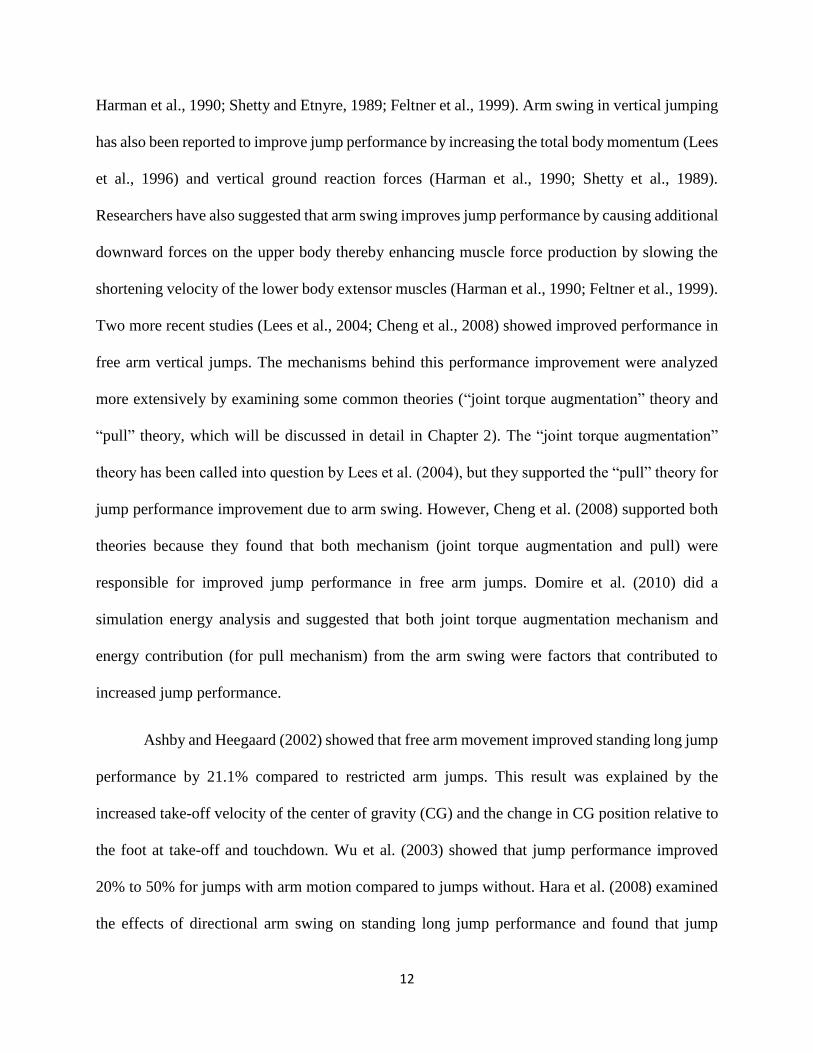
Figure 1: Twelve segments of 3D jumping model........................................................................ 30
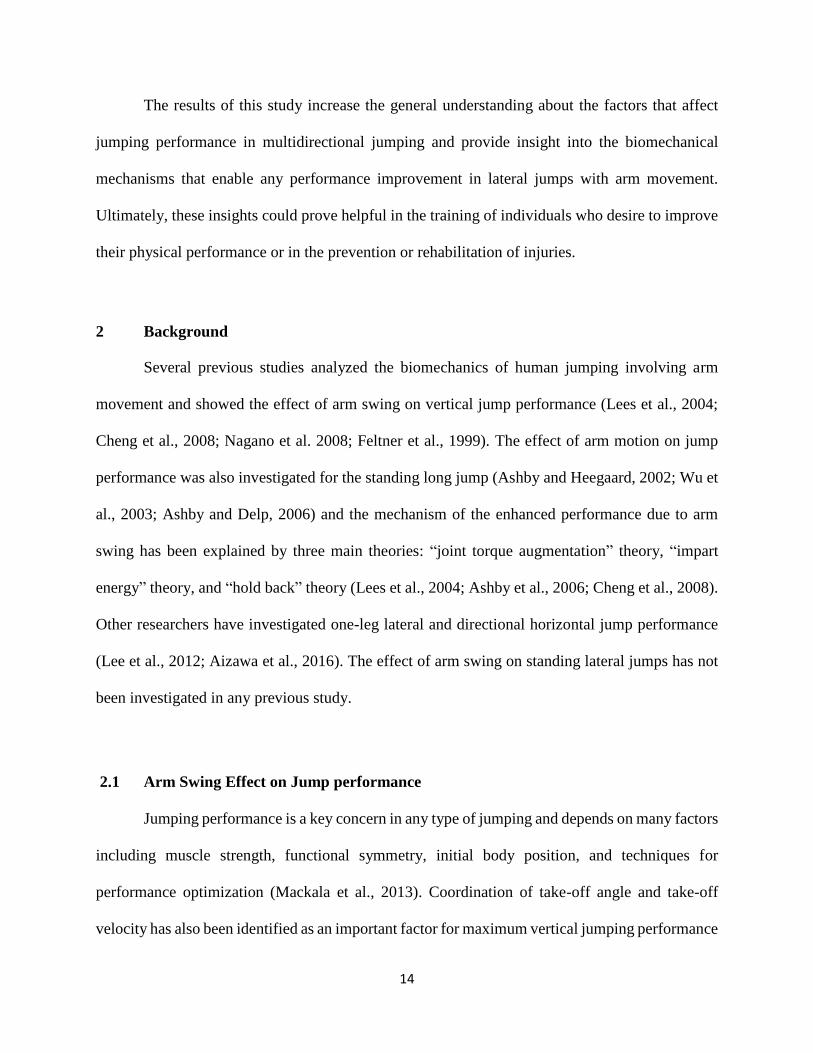
Figure 2: Full body marker set of 3D jump model ....................................................................... 31
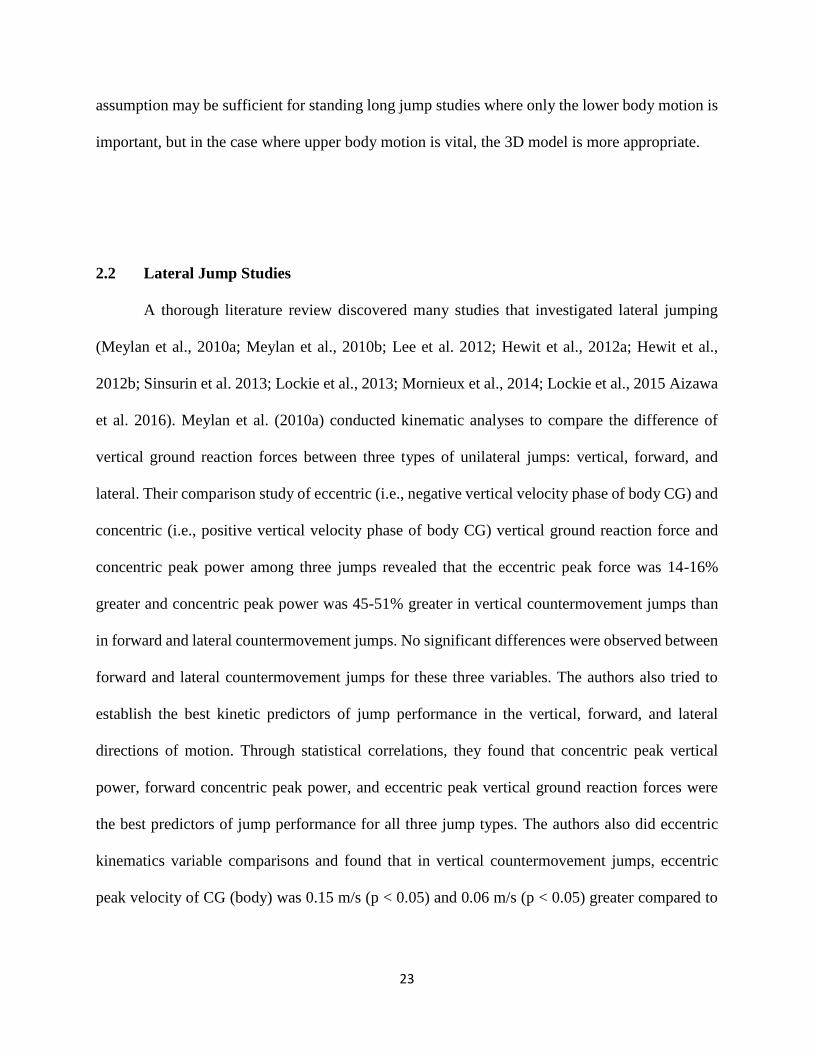
Figure 3: Segmental force and moment diagram for 3D model (Winter, 2009) ........................... 37
Figure 4: GRF profiles for the last 1.2 s before take-off for both free and restricted arm jumps
(mean ± 95% CI) ........................................................................................................................... 47
Figure 5: Total power at lower back joint for the last 1.2 s before take-off for free and restricted
arm jumps (mean ± 95% CI) ......................................................................................................... 51
Figure 6: Powers due to moment about z-axis (pelvis anatomical reference frame) at lower back
joint for the last 1.2 s before take-off for free and restricted arm jumps (mean ± 95% CI) ......... 52
Figure 7: Angular velocity, moment and power about z-axis (pelvis anatomical reference frame)
at lower back for the last 1.2 s before take-off for free and restricted arm jumps (mean ± 95% CI)
....................................................................................................................................................... 54
Figure 8: Total power at right hip joint for the last 1.2 s before take-off for free and restricted
arm jumps (mean ± 95% CI) ......................................................................................................... 55
Figure 9: Powers due to moment about z-axis (thigh anatomical reference frame) at right hip
joint for the last 1.2 s before take-off for free and restricted arm jumps (mean ± 95% CI) ......... 57
Figure 10: Angular velocity, moment and power about z-axis (thigh anatomical reference frame)
at right hip for the last 1.2 s before take-off for free and restricted arm jumps (mean ± 95% CI) 58

10
List of Tables
Table 1: Comparison of key kinematic and kinetic parameters (mean ± 95% CI) ....................... 45
Table 2: Work done at different joints (mean ± 95% CI, all work units are Joules (J)) ............... 49
Table 3: Work done at lower body (ankle, knee, hip) and upper body (shoulder and elbow) joints
(mean ± 95% CI, all work units are Joules (J)) ............................................................................. 49
Table 4: Work comparison at different joints for present lateral jump study with previous
standing long jump studies (Hara et al., 2008; Filush, 2012), all work units are Joules (J). ........ 60

11
1 Introduction
Jumping in multiple directions is a common human movement required in many sports like
basketball, volleyball, football, baseball, and soccer. Jump performance depends on strength,
power, and coordination of the entire body. Many researchers have analyzed jumping to reveal
important factors related to jumping performance. Jumping requires more extensive coordination
of upper body and lower body movements than many other fundamental human movements. The
objectives of this study were to study the effect of arm swing on standing lateral jumps and reveal
motor coordination principles that enable any performance enhancement due to the free arm
movement.
The role of arm movement in vertical and forward jump performance has been investigated
in many previous studies. Several studies showed that the free arm movement has a positive effect
on standing vertical jump performance (Luhtanen and Komi, 1978; Shetty and Etnyre, 1989;
Harman et al., 1990; Feltner et al., 1999; Lees and Barton, 1996). Investigators also studied
standing jumps for distance to demonstrate the benefit of the arm movement on jump distance and
explore the mechanism underlying the improved performance (Ashby and Heegaard, 2002; Wu et
al., 2003; Ashby and Delp, 2006; Hara et al., 2008). In addition, researchers have analyzed the
motor coordination of lower extremity movement in lateral jumping in a few studies (Lee et al.,
2012; Sinsurin et al., 2013; Aizawa et al., 2016). However, all the lateral jumping studies involved
either one-leg jumping or one-leg landing. No studies have examined standing two-leg lateral
jumps with two leg landing or the role of arm movement on lateral jump performance.
Arm swing has been shown to improve vertical jump performance in many experimental
and simulation studies. Arm swing has been shown to improve vertical jump height by raising the
center of gravity height and increasing take-off velocity by 9% to 12.7% (Luhtanen et al., 1978;
12
Harman et al., 1990; Shetty and Etnyre, 1989; Feltner et al., 1999). Arm swing in vertical jumping
has also been reported to improve jump performance by increasing the total body momentum (Lees
et al., 1996) and vertical ground reaction forces (Harman et al., 1990; Shetty et al., 1989).
Researchers have also suggested that arm swing improves jump performance by causing additional
downward forces on the upper body thereby enhancing muscle force production by slowing the
shortening velocity of the lower body extensor muscles (Harman et al., 1990; Feltner et al., 1999).
Two more recent studies (Lees et al., 2004; Cheng et al., 2008) showed improved performance in
free arm vertical jumps. The mechanisms behind this performance improvement were analyzed
more extensively by examining some common theories (“joint torque augmentation” theory and
“pull” theory, which will be discussed in detail in Chapter 2). The “joint torque augmentation”
theory has been called into question by Lees et al. (2004), but they supported the “pull” theory for
jump performance improvement due to arm swing. However, Cheng et al. (2008) supported both
theories because they found that both mechanism (joint torque augmentation and pull) were
responsible for improved jump performance in free arm jumps. Domire et al. (2010) did a
simulation energy analysis and suggested that both joint torque augmentation mechanism and
energy contribution (for pull mechanism) from the arm swing were factors that contributed to
increased jump performance.
Ashby and Heegaard (2002) showed that free arm movement improved standing long jump
performance by 21.1% compared to restricted arm jumps. This result was explained by the
increased take-off velocity of the center of gravity (CG) and the change in CG position relative to
the foot at take-off and touchdown. Wu et al. (2003) showed that jump performance improved
20% to 50% for jumps with arm motion compared to jumps without. Hara et al. (2008) examined
the effects of directional arm swing on standing long jump performance and found that jump

13
performance, work done by the joints, and velocity of CG at take-off were greater when the
direction of arm swing was in the jumping direction. In another study, the mechanism of the
improved jump performance for free arm motion in standing long jump was examined with optimal
control simulations (Ashby and Delp, 2006). The results supported the “hold back,” “impart
energy,” and “joint torque augmentation” theories, which will be discussed in detail in Chapter 2.
All previous lateral jumping studies have been conducted with either one-leg jumping or
one-leg landing. Lee et al. (2012) conducted a study on double leg jump with single leg landing to
investigate the effect of jump landing directions on sagittal plane kinematics, kinetics, energy
dissipation. They found knee and ankle joints as the dominant contributors to energy dissipation
for forward, diagonal, and lateral jumping. In an experimental study of one-leg jump landings,
Sinsurin et al. (2013) found that peak knee valgus angle was greater when jumping in lateral and
diagonal directions than in the forward direction.
Many previous studies have provided insight into the motor coordination strategies for
standing vertical or forward jumps and the effect of arm swing on performance. Although
numerous sports require explosive jumping movements in the lateral direction, no study has
documented the biomechanics related to jumping in the lateral direction of two legs. The purpose
of this study was to investigate the standing two-leg lateral jump and examine the role of arm
movement on lateral jump performance. Specifically, the following questions were addressed:
1. To what extent does arm movement improve performance in standing lateral jumps?
2. What biomechanical mechanisms may explain any performance improvement due to
arm motion in standing lateral jumps?
14
The results of this study increase the general understanding about the factors that affect
jumping performance in multidirectional jumping and provide insight into the biomechanical
mechanisms that enable any performance improvement in lateral jumps with arm movement.
Ultimately, these insights could prove helpful in the training of individuals who desire to improve
their physical performance or in the prevention or rehabilitation of injuries.
2 Background
Several previous studies analyzed the biomechanics of human jumping involving arm
movement and showed the effect of arm swing on vertical jump performance (Lees et al., 2004;
Cheng et al., 2008; Nagano et al. 2008; Feltner et al., 1999). The effect of arm motion on jump
performance was also investigated for the standing long jump (Ashby and Heegaard, 2002; Wu et
al., 2003; Ashby and Delp, 2006) and the mechanism of the enhanced performance due to arm
swing has been explained by three main theories: “joint torque augmentation” theory, “impart
energy” theory, and “hold back” theory (Lees et al., 2004; Ashby et al., 2006; Cheng et al., 2008).
Other researchers have investigated one-leg lateral and directional horizontal jump performance
(Lee et al., 2012; Aizawa et al., 2016). The effect of arm swing on standing lateral jumps has not
been investigated in any previous study.
2.1 Arm Swing Effect on Jump performance
Jumping performance is a key concern in any type of jumping and depends on many factors
including muscle strength, functional symmetry, initial body position, and techniques for
performance optimization (Mackala et al., 2013). Coordination of take-off angle and take-off
velocity has also been identified as an important factor for maximum vertical jumping performance

15
(Wakai and Linthorne, 2005). Luhtanen and Komi (1978) first identified arm swing as a key factor
for vertical jumping performance, and several other studies have verified this (Shetty and Etnyre,
1989; Harman et al., 1990; Feltner et al., 1999; Lees and Barton, 1996). The role of arm swing has
also been investigated for standing forward jumps with a significant positive effect on performance
demonstrated (Ashby and Heegaard, 2002; Wu et al., 2003; Ashby and Delp, 2006; Hara et al.,
2008).
The reasons why arm movement increases jump performance have been investigated in
many previous studies. Arm swing has been shown to increase take-off velocity. Several theories
have been proposed to describe the mechanisms that enable this. The theory of “force
transmission,” first introduced by Payne et al. (1968) contends that the ground reaction force is
increased during the arm acceleration phase due to a greater downward force on the body. This
increased ground reaction force creates greater impulse, which increases the vertical velocity of
the CG of the body at take-off. This theory was described as a simple idea to explain the reason
behind the increased take-off velocity due to arm swing (Dapena, 1993; Payne et al., 1968). Later
an experimental study found no relation between the net joint force at the shoulder and the vertical
ground reaction force (Lees et al., 2004). This finding was corroborated by a simulation study
(Cheng et al, 2008) therefore, the force transmission theory has been marked as questionable.
The increased take-off velocity in jumps with free arm jump movement has also been
explained by another theory called the “joint torque augmentation” theory (Feltner et al., 1999).
This theory suggests that the additional downward force on the trunk due to upward acceleration
of the arm slows lower body joint extension velocities, which decreases shortening velocities of
the hip and knee extensor muscle groups, enabling them to produce greater force consistent with
the force-velocity properties of muscle (Feltner et al., 1999; Harman et al., 1990). This theory was

16
further supported by the studies of Hara et al. (2006). Lees et al. (2004) found that joint torque
augmentation was associated with energy that is stored and later released to enhance jump
performance. In a simulation standing long jump study, Ashby and Delp (2006) found increased
joint torque, power, and work due to arm movement slowing joint extension velocities at the hip
and ankle, but not at the knee. Cheng et al. (2008) and Domire et al. (2010) in their vertical jump
simulation studies found torque augmentation at the hips only, thus providing additional support
for the “joint torque augmentation” theory.
Improved jump performance due to arm motion has also been explained by the “pull”
theory (Harman et al., 1990). According to this theory, during the start of deceleration of the arms
near take-off, the increased relative velocity of arms enables them to pull the trunk, which causes
energy transfer from the arms to the rest of the body. This theory is supported by the experimental
study of Lees et al. (2004) and simulation study of Cheng et al. (2008). Ashby and Delp (2006)
provided support for this theory in a simulation study of standing long jump and rephrased it as
the “impart energy” theory. They found by doing a work analysis that additional energy imparted
to the system by muscles crossing the shoulder joints was the most significant factor in increasing
the velocity of the CG at take-off. Domire et al. (2010) also did a simulation study for vertical
jumping and found that the pull mechanism contributed to performance improvement.
Based on a standing long jump study, Ashby and Heegaard (2002) introduced the “hold
back” theory as an explanation for decreased performance in jumps with restricted arm movements
(Ashby and Heegard, 2002). This theory suggests that during restricted arm jumps, without the
ability to rotate the arms backwards during the flight phase to help position the body for landing,
the jumpers had to “hold back” during the take-off phase in order to avoid excessive forward
rotation. The evidence for this theory was the earlier decline of the vertical ground reaction force

17
in restricted arms jumps and the development of a counterproductive backwards moment of the
ground reaction force about the CG.
2.1.1 Vertical Jump Studies
The role of arm motion in vertical jumping has been studied extensively. Luhtanen and
Komi (1978) conducted a study to determine the segmental contributions to vertical jump
performance. This study showed that the arm swing made a 10% contribution in the take-off
velocity of vertical jump. The most important conclusion of the study was that a multibody
movement like jumping needs proper muscle coordination and proper training to increase jumping
performance.
Shetty and Etnyre (1989) conducted a kinetic and kinematic study to determine the
contribution of arm movement to the vertical jump. Maximum vertical ground reaction force, total
work done, total power exerted by the jumper, body velocity at take-off, and impact force at
touchdown were calculated for free and restricted arm movement. The average maximum force,
work done, power, and take-off velocity were greater in free arm jumps than restricted arm jumps.
Shetty and Etnyre concluded that trained jumpers who use their arms more effectively have better
vertical jumping performance. Another important finding was that the impact energy at landing
was smaller in free arm jumps than restricted arm jumps. The reason behind the lower impact
forces in free arm jumps was unclear, which called for further investigation.
Harman et al. (1990) conducted a study to determine the effects of arm swing and
countermovement on vertical jump performance. After doing four different types of jumps in a
combination of arm-swing/no-arm-swing and countermovement/no-countermovement, they found

18
that arm swing contributed up to 10% of the take-off velocity of both countermovement and non-
countermovement vertical jumps, which was similar to the findings of Luhtanen and Komi (1978).
This study also found that both arm swing and countermovement significantly improved the jump
height, but arm swing had a greater effect. Arm swing increased the height of the CG at take-off
(when feet leave the ground) and after the take-off (the peak CG height). But, countermovement
had only peak CG height increase after the take-off. Arm swing increased the peak CG height
(after take-off) by 21%, increasing the vertical ground reaction impulse 10%. However,
countermovement had only 6% increase in the peak CG height (after take-off) due to the 3%
increase of vertical ground reaction impulse. The combination of both arms swing and
countermovement enhanced vertical jump performance by increasing the net vertical ground
reaction impulse.
Lees and Barton (1996) used the relative momentum principle to assess the free limbs’
contribution to countermovement jump performance. In the countermovement jump, the free arms
were found to generate a relative momentum of 30.9 Ns, which was 12.7% of the peak total vertical
momentum of the body.
Feltner et al (1999) conducted a study on countermovement vertical jumps with and
without arm motion of 25 volleyball players to determine the role of arm movement. They found
that the vertical velocity and height of the body CG at take-off was greater with arm motion, which
led to greater jump height. The authors concluded that the body CG height increase contributed
43% and velocity increase contributed 57% to the total performance improvement of free arm
vertical jumps. The total peak jump height was 9% greater in jumps with free arm motion.
Lees et al. (2004) found that jump performance increased due to increased CG height (28%)
and take-off velocity (72%). They examined the various proposed theories for performance

19
improvement due to free arm motion in the vertical jump and suggested that none of the previously
introduced theories (“joint torque augmentation” theory, “impart energy” theory and “pull” theory)
exclusively explained the improved jump performance due to arm swing. The improved jump
performance for free arm motion was due to the series of mechanisms, which were operating
together. The authors claimed that the increased take-off velocity occurred from the energy buildup
by the free arm motion at an early stage and transferred to the rest of the body during the later
stage of the jump. This additional energy was generated from extra work done by muscles at the
shoulder joints, elbow joints, and hip joints. This increased jump performance by increasing kinetic
and potential energies of the body at take-off. The storing and releasing of energy from the muscles
around the joints also resulted in pulling on the body by an upward force acting on the trunk at the
shoulder.
Cheng et al. (2008) did a simulation study to examine the prevailing theories explaining
vertical jump performance improvement. According to the findings of this investigation the “force
transmission” theory was questionable because no vertical ground reaction force change was found
due to the force on shoulder joint from arm movement. The “joint torque/work augmentation”
theory was demonstrated at the hip joints, but not at the knee and ankle joints. The “pull/impart
energy” theory was demonstrated because about the half of the additional energy produced in
jumps with arm motion was generated at the shoulder joints. This simulation study did not count
elbow joint for energy calculation and modeled the forearm and upper arm as a single segment.
More recently, several researchers conducted experimental and simulation studies to
understand the mechanism of enhanced jump performance for free arm motion in vertical jumps
(Lees et al., 2007; Domire et al., 2010; Blache et al., 2013). Energy analyses were done to check
the validity of the previously introduced “pull” or “impart energy/energy transfer” theories. Lees

20
et al. (2007) showed that the developed kinetic energy of free arm motion resulted in a potential
energy increase at take-off, to store and return energy from the lower limb muscles and to pull on
the rest of the body. From simulation results, Domire et al. (2010) and Blache et al., (2013) found
that both mechanisms contributed to the performance improvement due to arm swing. Arm swing
allowed the hip extensors to generate more force by slowing down the hip extension velocities and
also perform greater work. In addition, the shoulder muscles generated a significant amount of
work, which contributed to one-third of the enhanced performance of free arm vertical jumps.
2.1.2 Standing Long Jump Studies
It has also been shown that the use of arm motion during standing long jump increases
jump performance. A study by Ashby and Heegard (2002) found that free arm motion increased
jump performance by 21.2% over jumps with restricted arm motion. The greater performance in
free arms jumps was due to greater take-off velocities of the CG, increased horizontal and vertical
displacement of the CG at take-off, and increased horizontal distance between the toes and CG at
touchdown.
Motion analysis was done to determine the effects of arm motion, initial knee angle, and
anthropometrics on jump performance (Wu et al., 2003). A series of eight jumps for each of 34
female participants was collected for jumps with a combination of free and restricted arm motion
and with initial knee angles of 45° and 90°. It was found that the jump performance with free arm
motion was 20% to 50% greater than with restricted arm motion depending on initial knee flexion.
Additionally, the jump distance with the 90° initial knee angle was 20% longer than with the 45°
initial knee angle. The results also showed that the angle of the CG velocity at take-off was not an
important factor in jump performance and anthropometrics (height, shank length, thigh

21
circumference, shank circumference, leg length, and body weight) played a less important role in
jump performance. Jumpers with longer legs did not always show better performance. Jumpers
with shorter legs, or shorter people who have proper coordination and technique of using
countermovement and arm motion, were able to jump farther than the taller people who did not
use their arm motion in effective ways.
The mechanisms that enable arm motion to improve performance in the standing long jump
were analyzed in a simulation study (Ashby and Delp, 2006). In this study, optimal control
simulations were developed to determine the joint torque activations for maximizing jump
performance of free and restricted arm motion jumps. The results supported the three main theories
(“hold back,” “impart energy,” and “joint torque augmentation”). In restricted arm jumps, evidence
of ‘‘holding back’’ was demonstrated during the propulsive phase by reduced activation levels in
order to allow the segments to be properly positioned for landing. In free arm jumps, the ability to
swing the arms during the flight phase allowed for greater levels of activation of the lower body
joint actuators. The greater activations allowed for greater joint torques, joint powers, and joint
work. The additional work done by the shoulder actuator in the free arm jumps increased the total
energy of the system resulting in greater velocity and greater CG position at take-off, thus
validating the “impart energy” theory. Joint torque augmentation occurred at the hip and ankle
joints due to the reduction of angular velocity caused by arm swing. However, the joint torque was
lower at the knee during the propulsive phase. Since the increased joint torques at the hip and ankle
were achieved because of lower angular velocities, the resulting joint power and work (joint power
integrated over time) may or may not have been greater. In this simulation study, the work done
was greater at the ankle and hip and lower at the knee in jumps with free arm movement.

22
Hara et al. (2008) performed a study on standing long jumps in forward and backward
directions to investigate the differences in jump performance for directional arm swing. The study
was performed by doing a kinematic and kinetic analysis of jumping data of seven participants.
Each subject was instructed to jump for six different cases (forward jump-no arm swing, forward
jump-forward arm swing, forward jump-backward arm swing, backward jump-no arm swing,
backward jump-forward arm swing, and backward jump-backward arm swing). Results indicated
that the jumping performance, work done by the joints and velocity of CG at take-off were
increased when the arm swing had the same direction as jumping direction. The study also showed
that the integrated electromyography (iEMG) of the biceps femoris during the hip power
development phase was significantly larger in the cases of similar direction jumping and arm
swing. The lower activations as demonstrated by the iEMG results may be the evidence of the
participants “holding back” during the jumps with no arm swing and in the jumps with opposite
direction arm swing.
A review of the literature revealed that all previous standing long jump or forward jump
investigations (Ashby and Heegard, 2002; Wu et al., 2003; Ashby and Delp, 2006; Hara et al.,
2008; Filush and Ashby, 2012; Vlietstra, 2014) were done based on a 2D assumption. Only one
study had experimentally investigated forward jumping using a 3D model (Hickox, 2014; Hickox
et al., 2016). In this study, 3D and 2D models were compared to check the validity of the 2D,
sagittal plane assumptions for the standing long jump. The results showed good agreement
between the 2D and 3D models for the lower body, but significant differences were found in the
upper body because of the significant motion of the arms outside of the sagittal plane during the
jumps. Their 3D model also captured the difference between left and right sides of the body that
were not observable with the 2D model. Hickox et al. (2016) concluded that the planar motion
23
assumption may be sufficient for standing long jump studies where only the lower body motion is
important, but in the case where upper body motion is vital, the 3D model is more appropriate.
2.2 Lateral Jump Studies
A thorough literature review discovered many studies that investigated lateral jumping
(Meylan et al., 2010a; Meylan et al., 2010b; Lee et al. 2012; Hewit et al., 2012a; Hewit et al.,
2012b; Sinsurin et al. 2013; Lockie et al., 2013; Mornieux et al., 2014; Lockie et al., 2015 Aizawa
et al. 2016). Meylan et al. (2010a) conducted kinematic analyses to compare the difference of
vertical ground reaction forces between three types of unilateral jumps: vertical, forward, and
lateral. Their comparison study of eccentric (i.e., negative vertical velocity phase of body CG) and
concentric (i.e., positive vertical velocity phase of body CG) vertical ground reaction force and
concentric peak power among three jumps revealed that the eccentric peak force was 14-16%
greater and concentric peak power was 45-51% greater in vertical countermovement jumps than
in forward and lateral countermovement jumps. No significant differences were observed between
forward and lateral countermovement jumps for these three variables. The authors also tried to
establish the best kinetic predictors of jump performance in the vertical, forward, and lateral
directions of motion. Through statistical correlations, they found that concentric peak vertical
power, forward concentric peak power, and eccentric peak vertical ground reaction forces were
the best predictors of jump performance for all three jump types. The authors also did eccentric
kinematics variable comparisons and found that in vertical countermovement jumps, eccentric
peak velocity of CG (body) was 0.15 m/s (p < 0.05) and 0.06 m/s (p < 0.05) greater compared to

24
horizontal countermovement jumps and lateral countermovement jumps, respectively (Meylan et
al., 2010b).
Lee et al. (2012) conducted a study to investigate the effect of different jump-landing
directions on sagittal plane kinematics, kinetics, and energy dissipation. Participants were
instructed to do double leg jumps to a height equivalent to 50% of their maximum vertical jump
height and maintain their balance after landing on one foot for forward, diagonal, and lateral jumps.
Three major findings emerged: 1) the knee and the ankle joints were the major energy dissipaters
for a single-leg jump-landing (all three directions), 2) the knee joints were the dominant energy
dissipaters for forward and diagonal jump-landing directions, and 3) the ankle joint was the
dominant energy dissipater for the lateral jump-landing direction. Participants were found to
change body position (joint angles and angular velocities) and energy dissipation at knee and ankle
joints to maintain the same level of ground reaction force (GRF) for all three jump directions. The
authors concluded that landing strategy changed across three landing directions to maintain the
same level of shock attenuation (GRF).
Hewit et al. (2012a) quantified and compared average symmetry indexes across jumping
directions (vertical, lateral, and forward) and variables (jump distance and height, peak force, and
peak power). Sub-elite netball players performed single leg (for both legs) countermovement
jumps from force plates in vertical, horizontal, and lateral directions with two-leg landings. They
found the variation in the magnitude of the average symmetry indexes ranged from 3.1% (peak
force) to 11.4% (peak power), which depends on the variable and direction used to quantify the
asymmetry.
Hewit et al. (2012b) investigated the leg asymmetry in athletes. This study assessed limb
asymmetry (power, force, and distance/height jumped), the reliability of single-limb

25
multidirectional assessments, and expected magnitudes of asymmetry in non-injured and injured
athletes, which can be used for future injury prevention programming. They concluded that a
threshold of 15% leg asymmetry is appropriate to identify the athletes who are prone to lower limb
injury. Additional training to correct the leg asymmetry can be provided to the athletes who have
leg asymmetry greater than the threshold of 15%.
Sinsurin et al. (2013) conducted a study to examine the peak knee valgus angle during one
leg jump landing in various directions. Eighteen male participants jumped from a 30 cm-high
platform in four directions (forward, 30° diagonal, 60° diagonal, and lateral). The study found that
the peak knee valgus angles were greater when landing in lateral and diagonal directions than when
landing in the forward direction.
Mornieux et al. (2014) analyzed the adaptation in motor control in response to task
unpredictability during lateral jump movements. Participants jumped to the right with three
different landing modalities: 1) without any perturbation (stable condition), 2) with an initial
perturbation to the right (sliding condition), and 3) with an initial perturbation to the left
(counteracting condition) for two settings: 1) participants knew the landing modalities prior to the
jumps (predictable) and 2) participants did not know the landing modalities prior to the jumps
(unpredictable). They found greater hip joint abduction in the unpredictable jump setting compared
to the predictable jump setting. For the sliding landing modality, hip flexion and knee flexion
decreased at touchdown in the unpredictable setting compared to the predictable setting. During
the stable landing modality, the knee joint abduction increased after initial ground contact in the
unpredictable setting compared to the predictable setting. Their results support the hypothesis that
pre-programmed motor activity depends on the predictability of the landing modality during lateral
jumps.

26
Lockie et al. (2013) investigated the interaction between dynamic stability and single leg
lateral jump distance measured by Star Excursion Balance Test (SEBT) for each leg. They found
dynamic stability significant for the dominant leg in lateral jumps. In another study, Lockie et al.
(2015) studied the relationship between dynamic stability and multidirectional jumping. Their
results showed a limited relationship between unilateral dynamic stability and multidirectional
jump performance. Seven out of 36 correlations were found significant for the comparison between
excursion distances and jump performance and no significant differences were observed in jump
performance between better and lesser dynamic stability group. Their results also highlighted the
complex interaction between physiological, biomedical, and technical factors related to lower body
multidirectional movements.
Aizawa et al. (2016) did a study to clarify the correlation between kinematics and impact
forces during lateral jump landings. Results showed that the peak vertical ground reaction force
during single leg lateral jump landings was related to knee flexion during the flight phase and
pelvic anterior inclination during the landing phase. Their findings suggest that the decreased knee
flexion 100 ms before landing and increased pelvic anterior inclination during the landing phase
increased the vertical impact force.
Previous studies have shown that arm swing improves jump performance in vertical and
forward jumps. Data suggest that increased take-off velocity and improved positioning of CG at
take-off with free arm movement are the primary reasons for improved jump performance. Free
arm movement appears to allow lower limb muscles to increase internal work, while the shoulder
and elbow muscles provide additional work in vertical and forward jumps. The mechanisms for
this work improvement due to arm swing have been described using a few theories (“joint torque
augmentation”, “impart energy”, “force transmission” and “hold back”). However, arm swing

27
effect on lateral jump performance has not been investigated. Several lateral jump studies have
been conducted to answer research questions related to jumping symmetry, motor control
technique, and dynamic stability. However, all previous lateral jumping studies involved either
one leg jumping or one leg landing. No studies have examined standing two-leg jumps with two-
leg landings. This is the first study to investigate standing lateral jumps of two legs with two-leg
landings. The main purpose of this study is to study the arm swing effects on jumping performance
of two-leg lateral jumps and to investigate the mechanism underlying any performance change.

28
3 Method
3.1 Experimental Design
This was a quasi-experimental design that compared distance jumped and selected
kinematic and kinetic variables of the arms, trunk, and lower extremities, for jumps with or without
the use of arms. A series of two-leg lateral jump trials was conducted in the Biomechanics and
Motor Performance Laboratory at Grand Valley State University using an eight-camera Vicon
motion capture system and two in-ground force plates. The cameras recorded the 3D positions of
reflective markers placed on the skin and clothing of each participant throughout each jumping
trial. Force plates were used to determine the ground reaction forces and locations of the center of
pressure during the take-off phase of the jumps. All jumping trials also were documented with
video. Participants were instructed to jump for the maximum distance for each trial for two
different types of jumps: free arm lateral jumps and restricted arm lateral jumps. The participants
were instructed to take-off and land with both feet at approximately the same time.
3.1.1 Participant Selection
Six physically active adult males (age: 26.7 ± 2.4 years; weight: 85.5 ± 10.6 kg, and height:
1.823 ± 0.097 m, mean ± standard deviation), volunteered to participate in this study. The
participants were included if they were physically active at least once a week with no persisting
back, neck, ankle, knee, hip, shoulder, or elbow injuries. Participants were excluded if a physician
had placed limitations on their activity levels for physical or medical reasons. All potential
participants completed a written survey (attached as Appendix D) with questions about their age,
height, and weight; frequency, duration, and level exertion of physical activity; past injuries along
with the persisting effects of those injuries; and whether any limitations had been placed on their

29
current physical activity by a physician. The protocol for this study was reviewed and approved
by the Human Research Review Committee at Grand Valley State University.
3.1.2 Equipment
Jumping trials were captured with a 3D motion capture system (Vicon Motion System Ltd,
LA, CA) using eight cameras (8 MX-T40), a set of reflective markers, and two in-ground AMTI
force plates (Advanced Mechanical Technology Inc., Watertown, MA). The three-dimensional
positions of the reflective markers were recorded using infrared LED strobe lights of the cameras
at 120 Hz, and force data was recorded at 1200 Hz. Vicon Nexus v2.5 software was used to process
the marker positions and force plate data. The processed data were exported using Vicon Nexus
into CSV file format for further analysis in MATLAB R2017a (MathWorks, Natick, MA),
Wolfram Mathematica 11.1.1 (Wolfram Research, Inc., Champaign, IL), and SAS® OnDemand
for Academics (SAS Institute Inc., Cary, NC, USA).
3.1.3 Model Selection
In this study, significant motion occurred in all three planes and the motion of the upper
extremities was of particular importance, so using a 3D model was the appropriate choice. A pre-
developed 3D model from the Hickox (2014) study based on these following assumptions was
used:
1. Segment lengths are constant.
2. The CG of each segment is located on the segment long axis.
3. CG and moment of inertia are constant with respect to the anatomical reference
frame of the segments.
4. There is no relative translation at the joints between adjacent segments.

30
1
12 11
10 9 8
7
6 5
4 3
2
There were 12 segments in this model: feet, shanks, thighs, pelvis, trunk, upper arms, and
forearms (Figure 1). The anatomic reference frames were chosen based on Ren et al. (2008) and
recommendations by the International Society of Biomechanics (ISB) (Wu et al., 2002; Wu et al.,
2005) (Appendix A). In the neutral anatomic position, all x-axes were in an anterior direction, all
y-axes were along the segments longitudinal direction, and all z-axes were pointing towards the
right side.
Figure 1: Twelve segments of 3D jumping model
3.1.4 Marker Selection
Similar to Hickox (2014), the biomechanical model used in this study included 53 markers
(Figure 2). The markers were placed on the skin, shoes, and clothing of each participant with
double-sided tape. The marker placements were verified by an experienced physical therapist. A
cluster of three markers was used on the thigh and upper arm segments required for the
• 1 & 2: feet
• 3 & 4: shanks
• 5 & 6: thighs
• 7: pelvis
• 8: head, neck, and trunk
• 9 & 10: upper arms
• 11 & 12: forearms

31
Symmetrical CoR Estimation (SCoRE) method to determine hip and shoulder joint center
locations (Ehrig et al., 2006). In the selected marker set, an additional marker was placed on the
shoulder blade to make the model asymmetric, which assisted in labeling and gap processing. The
Hickox marker set included greater trochanter markers; however, they were not used in this study.
To reduce the soft tissue artifact, bony landmarks were used as much as possible for marker
placement. The complete set of marker names and locations is listed in Appendix B.
Figure 2: Full body marker set of 3D jump model
3.1.5 Data Collection
The participants were directed to warm up by jogging at a self-selected comfortable speed
for 5 minutes on a treadmill. They were then allowed to stretch, if desired. Participants were also
instructed to practice each type of jump three to four times prior to data acquisition. For each
participant, separate static trials data were collected while standing on the force plates to determine
each participant’s weight and to capture the complete marker set for joint center calculations and
segment parameters. For the SCoRE method, four trials were collected in one cycle of a

32
flexion/extension, abduction/adduction, circumduction movement for each hip and shoulder joint.
Two types of lateral jumps to the right: 1) with free arms and 2) with restricted arms (with arms
akimbo – hands on the hips and elbows turned outward) were performed. For data acquisition,
each participant was asked to stand with one foot on each force plate and jump as far as possible
once given a verbal signal. He performed each type of lateral jump six times alternating each type
of jump. Participants were allowed to rest between jumps, if desired, to minimize any fatiguing
effects.
3.2 Data Analysis
Captured 3D position data for static and dynamic trials were labeled and gaps in trajectory
data were filled using spline, pattern, or rigid body software algorithms in Vicon Nexus v2.5
software. Processed data was exported from Nexus as a CSV file, which was read by MATLAB.
The force plate data was subsampled at a 1:10 ratio to match markers data collection frequency
120 Hz. Take-off time was defined by the time when ground reaction force went to zero for both
force plates. The start of the jump was considered as 1.2 s before take-off, which is the time for all
jumps before any movement began when the total lateral ground reaction force was still close to
zero and the total vertical ground reaction force was still close to bodyweight. The remaining data
before and after the take-off was clipped and an extra frame of data on either end of jump cycle
was left to calculate velocities and accelerations in the kinematic analysis. In MATLAB, the
clipped marker position data and force plate data were filtered using a 4th-order, dual pass, zero-
lag Butterworth filter with a cutoff frequency of 10 Hz. The segmental parameters (length, CG
locations, mass and moments of inertia) were calculated from the static trials based on the segment

33
definitions and parameters from Zatsiorsky et al. (1990) and de Leva (1996), and a similar
procedure was followed as described by Hickox (2014)
3.2.1 Joint Center Estimation
Joint center locations were calculated using the functional SCoRE method (Ehrig et al.,
2006) as described by Hickox (2014). The ankle, knee, elbow, and wrist joint centers were
calculated as the midpoint between the medial and lateral joint markers by taking an average over
the entire static trial (Hickox, 2014). The L3/L4 position was determined based on average
anthropometric data from Zatsiorsky et al. (1990) (adjusted by de Leva, 1996), and a similar
procedure was followed to calculate L3/L4 and lower back joints as described by Hickox (2014).
3.2.2 Kinematic Analysis
In MATLAB, technical reference frames for each segment were created from filtered static
trial data (global position data). Calculated global static joint centers were transformed to technical
reference frames to determine the local positions of the joint centers for each segment. These local
joint centers were averaged for all the static data frames resulting in a single position of the joint
centers relative to each segment’s local technical reference frame. For the dynamic trials, technical
reference frames for each segment with the same markers used for the static trials were created
again for each time frame. Rotation matrices generated from these dynamic technical reference
frames were used along with the on local joint center positions calculated from the static trials to
determine the dynamic joint centers in the global reference frame at each point in time. These
dynamic global joint centers along with other dynamic marker data were used to create anatomical
reference frames for each segment as described in Appendix A. Then the anatomic reference

34
frames were used to determine segment rotation matrices. The Euler angle equations for each
segment were determined based on XYZ rotation order shown in Appendix C. These Euler angle
equations and segment rotation matrices were used to calculate three angles (α, β, and γ) for each
segment.
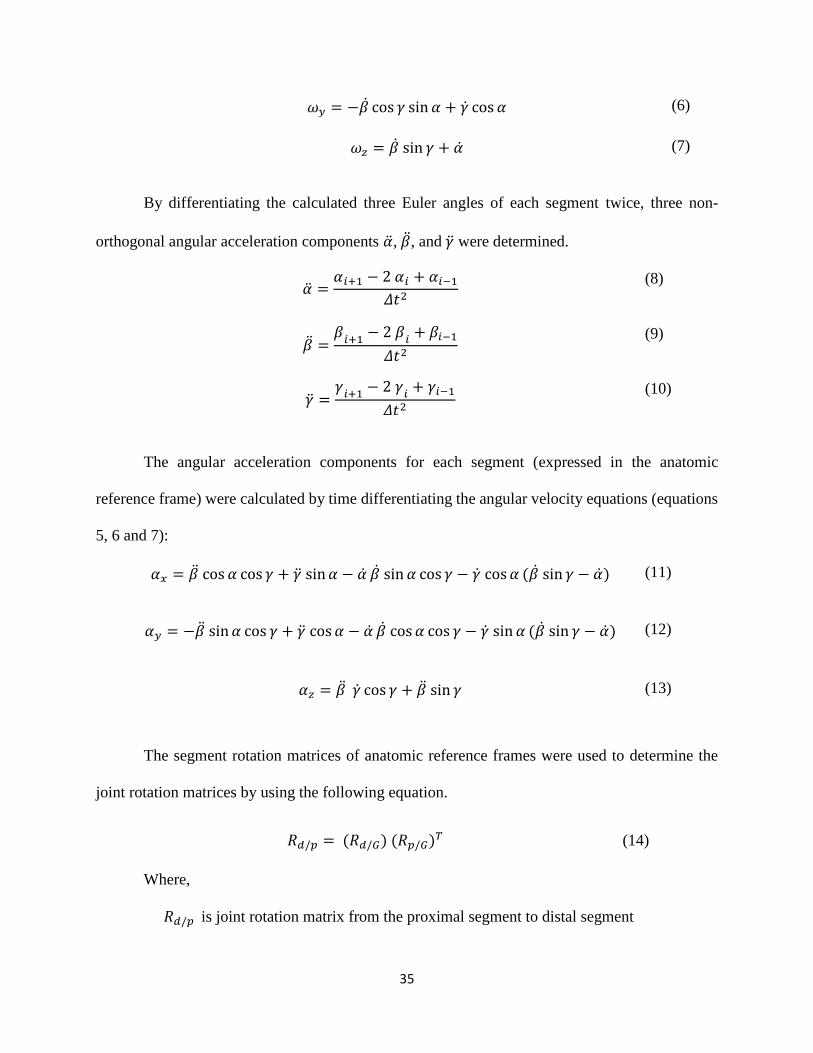
By differentiating the calculated three Euler angles of each segment, three non-orthogonal
angular velocity components �̇�, �̇�, and �̇� were determined.
�̇� =𝛼𝑖+1 − 𝛼𝑖−1
2𝛥𝑡 (1)
�̇� =
𝛽𝑖+1
− 𝛽𝑖−1
2𝛥𝑡
(2)
�̇� =𝛾
𝑖+1− 𝛾𝑖−1
2𝛥𝑡
(3)
These non-orthogonal angular velocity components were transformed to orthogonal
angular velocity components in the segment anatomical reference frame by using Equation 4. Here
Ry and Rz are individual rotation matrices for each rotation about the y and z axes, respectively
(Appendix C)
[
𝜔𝑥
𝜔𝑦
𝜔𝑧
] = 𝑅𝑧 . 𝑅𝑦 . [�̇�00] + 𝑅𝑧 . [
0�̇�0
] + [00�̇�]
(4)
Performing the matrix multiplications in Equation 4 results in the following three equations
for the angular velocity components for each segment (expressed in the anatomic reference
frames):
𝜔𝑥 = �̇� cos 𝛼 cos 𝛾 + �̇� sin𝛼 (5)
35
𝜔𝑦 = −�̇� cos 𝛾 sin 𝛼 + �̇� cos 𝛼 (6)
𝜔𝑧 = �̇� sin 𝛾 + �̇� (7)
By differentiating the calculated three Euler angles of each segment twice, three non-
orthogonal angular acceleration components �̈�, �̈�, and �̈� were determined.
�̈� =𝛼𝑖+1 − 2 𝛼𝑖 + 𝛼𝑖−1
𝛥𝑡2
(8)
�̈� =𝛽
𝑖+1− 2 𝛽
𝑖+ 𝛽𝑖−1
𝛥𝑡2
(9)
�̈� =𝛾
𝑖+1− 2 𝛾
𝑖+ 𝛾𝑖−1
𝛥𝑡2
(10)
The angular acceleration components for each segment (expressed in the anatomic
reference frame) were calculated by time differentiating the angular velocity equations (equations
5, 6 and 7):
𝛼𝑥 = �̈� cos 𝛼 cos 𝛾 + �̈� sin𝛼 − �̇� �̇� sin 𝛼 cos 𝛾 − �̇� cos 𝛼 (�̇� sin 𝛾 − �̇�) (11)
𝛼𝑦 = −�̈� sin𝛼 cos 𝛾 + �̈� cos 𝛼 − �̇� �̇� cos 𝛼 cos 𝛾 − �̇� sin 𝛼 (�̇� sin 𝛾 − �̇�) (12)
𝛼𝑧 = �̈� �̇� cos 𝛾 + �̈� sin 𝛾 (13)
The segment rotation matrices of anatomic reference frames were used to determine the
joint rotation matrices by using the following equation.
𝑅𝑑/𝑝 = (𝑅𝑑/𝐺) (𝑅𝑝/𝐺)𝑇 (14)
Where,
𝑅𝑑/𝑝 is joint rotation matrix from the proximal segment to distal segment

36
𝑅𝑑/𝐺 is a segment rotation matrix from global to distal segment reference frame, and
𝑅𝑝/𝐺 is a segment rotation matrix from global to proximal segment reference frame
The Euler angle equations for each joint were determined based on XYZ rotation order
shown in Appendix C. These Euler angle equations and joint rotation matrices were used to
calculate three angles for each joint. The sign convention for the joint angles was similar to Hickox
(2014) (Appendix B). From the calculated Euler angles (𝛼, 𝛽, and 𝛾), joint angular velocities were
determined by following the similar procedure (using equation 1 to 7) of calculating segmental
angular velocities.
CG position for each segment was determined in anatomical reference frame from static
trial data as described by Hickox (2014). In dynamic trials, local (in anatomical reference frame)
CG positions were transformed to the global reference frame to determine the dynamic CG
positions. These dynamic CG position data were numerically differentiated using the center
difference formula to calculate the linear acceleration of CG for each segment.
𝑎𝑥 =
𝑥𝑖+1 − 2𝑥𝑖 + 𝑥𝑖−1
𝛥𝑡2
(15)
𝑎𝑦 =
𝑦𝑖+1 − 2𝑦𝑖 + 𝑦𝑖−1
𝛥𝑡2
(16)
𝑎𝑧 =
𝑧𝑖+1 − 2𝑧𝑖 + 𝑧𝑖−1
𝛥𝑡2
(17)

37
3.2.3 Inverse Dynamics
An inverse dynamics method was used to calculate the joint forces and internal moments
for each body segment. The generic forms of the equations for the 3D model, which were used for
every segment are given below. Here, Figure 3 represents every segment except the pelvis and
trunk. The pelvis and trunk both have two distal joints (e.g., left and right hips and shoulders)
where the regular segments have only one.
Figure 3: Segmental force and moment diagram for 3D model (Winter, 2009)
The general inverse dynamics equations for forces of 3D model in terms of global reference frame
are in the following form,
∑𝐹𝑥 = 𝐹𝑝𝑥+ 𝐹𝑑𝑥
= 𝑚𝑎𝑥 (18)
y
x
𝑀𝑝𝑦
z
𝐹𝑑𝑦
𝐹𝑊
𝐹𝑑𝑥 𝑀𝑑𝑥
𝑀𝑑𝑧
𝐹𝑑𝑧
𝐹𝑝𝑧
𝑀𝑝𝑧 𝐹𝑝𝑥
𝑀𝑝𝑥
𝑀𝑝𝑦
𝐹𝑝𝑦
38
∑𝐹𝑦 = 𝐹𝑝𝑦
+ 𝐹𝑑𝑦= 𝑚𝑎𝑦 (19)
∑𝐹𝑧 = 𝐹𝑝𝑧+ 𝐹𝑑𝑧
− 𝐹𝑤 = 𝑚𝑎𝑧 (20)
Where,
𝐹𝑝𝑥, 𝐹𝑝𝑦
, 𝐹𝑝𝑧 are proximal joint force components,
𝐹𝑑𝑥, 𝐹𝑑𝑦
, 𝐹𝑑𝑧 are distal joint force components,
𝐹𝑊 is the gravitational force on the segment,
𝑚 is segment mass, and
𝑎𝑥, 𝑎𝑦, 𝑎𝑧 are acceleration components of segment’s CG.
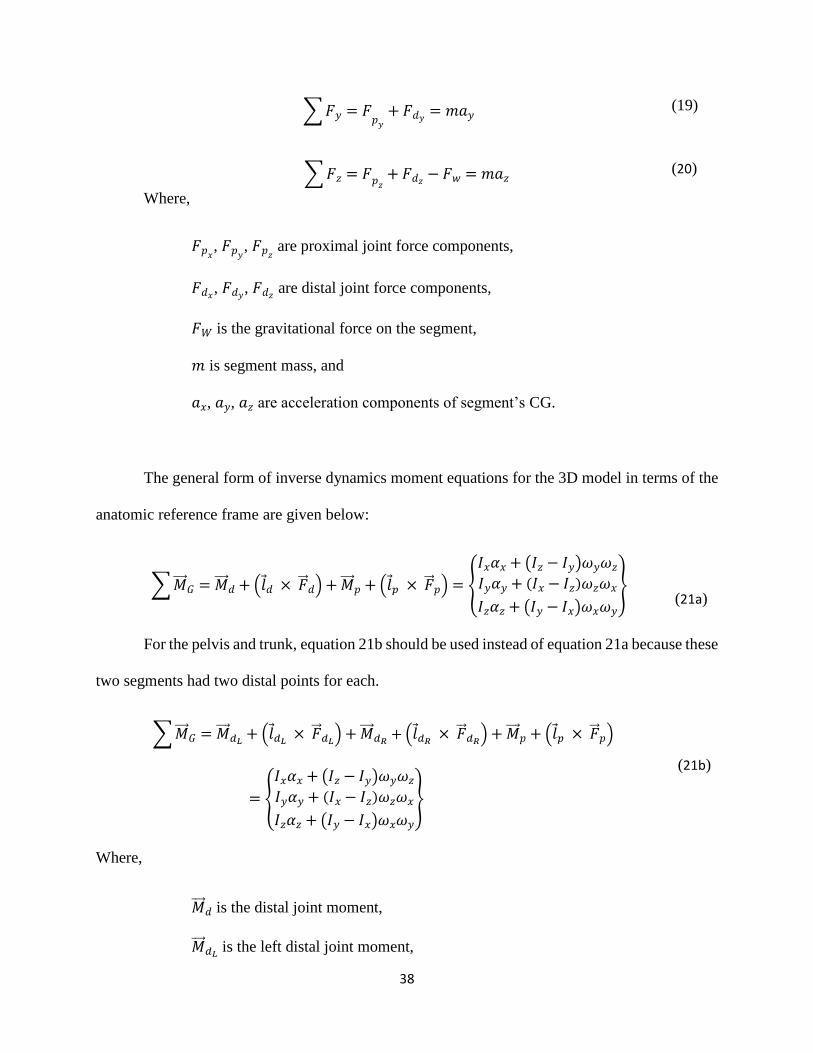
The general form of inverse dynamics moment equations for the 3D model in terms of the
anatomic reference frame are given below:
∑ �⃗⃗⃗� 𝐺 = �⃗⃗⃗� 𝑑 + (𝑙 𝑑 × �⃗⃗� 𝑑) + �⃗⃗⃗� 𝑝 + (𝑙 𝑝 × �⃗⃗� 𝑝) = {
𝐼𝑥𝛼𝑥 + (𝐼𝑧 − 𝐼𝑦)𝜔𝑦𝜔𝑧
𝐼𝑦𝛼𝑦 + (𝐼𝑥 − 𝐼𝑧)𝜔𝑧𝜔𝑥
𝐼𝑧𝛼𝑧 + (𝐼𝑦 − 𝐼𝑥)𝜔𝑥𝜔𝑦
}
(21a)
For the pelvis and trunk, equation 21b should be used instead of equation 21a because these
two segments had two distal points for each.
∑ �⃗⃗⃗� 𝐺 = �⃗⃗⃗� 𝑑𝐿+ (𝑙 𝑑𝐿
× �⃗⃗� 𝑑𝐿) + �⃗⃗⃗� 𝑑𝑅
+ (𝑙 𝑑𝑅 × �⃗⃗� 𝑑𝑅
) + �⃗⃗⃗� 𝑝 + (𝑙 𝑝 × �⃗⃗� 𝑝)
= {
𝐼𝑥𝛼𝑥 + (𝐼𝑧 − 𝐼𝑦)𝜔𝑦𝜔𝑧
𝐼𝑦𝛼𝑦 + (𝐼𝑥 − 𝐼𝑧)𝜔𝑧𝜔𝑥
𝐼𝑧𝛼𝑧 + (𝐼𝑦 − 𝐼𝑥)𝜔𝑥𝜔𝑦
}
(21b)
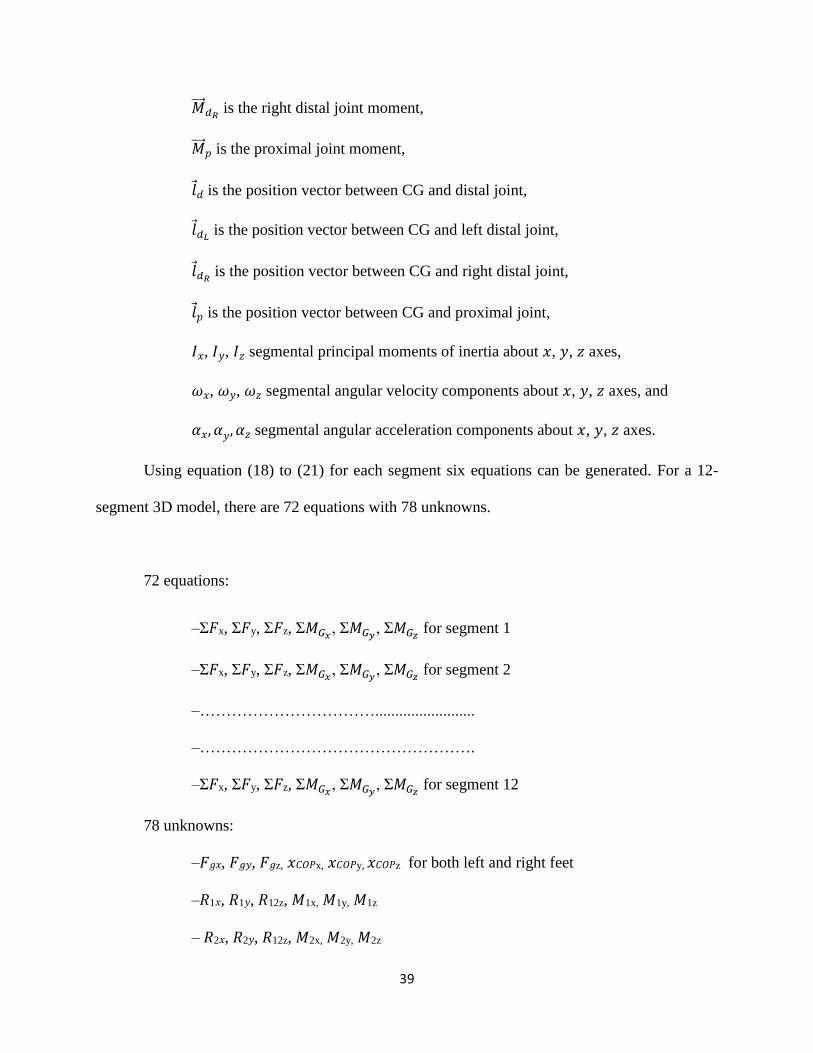
Where,
�⃗⃗⃗� 𝑑 is the distal joint moment,
�⃗⃗⃗� 𝑑𝐿 is the left distal joint moment,
39
�⃗⃗⃗� 𝑑𝑅 is the right distal joint moment,
�⃗⃗⃗� 𝑝 is the proximal joint moment,
𝑙 𝑑 is the position vector between CG and distal joint,
𝑙 𝑑𝐿 is the position vector between CG and left distal joint,
𝑙 𝑑𝑅 is the position vector between CG and right distal joint,
𝑙 𝑝 is the position vector between CG and proximal joint,
𝐼𝑥, 𝐼𝑦, 𝐼𝑧 segmental principal moments of inertia about 𝑥, 𝑦, 𝑧 axes,
𝜔𝑥, 𝜔𝑦, 𝜔𝑧 segmental angular velocity components about 𝑥, 𝑦, 𝑧 axes, and
𝛼𝑥, 𝛼𝑦,𝛼𝑧 segmental angular acceleration components about 𝑥, 𝑦, 𝑧 axes.
Using equation (18) to (21) for each segment six equations can be generated. For a 12-
segment 3D model, there are 72 equations with 78 unknowns.
72 equations:
–Σ𝐹x, Σ𝐹y, Σ𝐹z, Σ𝑀𝐺𝑥, Σ𝑀𝐺𝑦
, Σ𝑀𝐺𝑧 for segment 1
–Σ𝐹x, Σ𝐹y, Σ𝐹z, Σ𝑀𝐺𝑥, Σ𝑀𝐺𝑦
, Σ𝑀𝐺𝑧 for segment 2
–…………………………….........................
–…………………………………………….
–Σ𝐹x, Σ𝐹y, Σ𝐹z, Σ𝑀𝐺𝑥, Σ𝑀𝐺𝑦
, Σ𝑀𝐺𝑧 for segment 12
78 unknowns:
–𝐹𝑔𝑥, 𝐹𝑔𝑦, 𝐹𝑔z, 𝑥𝐶𝑂𝑃x, 𝑥𝐶𝑂𝑃y, 𝑥𝐶𝑂𝑃z for both left and right feet
–𝑅1𝑥, 𝑅1𝑦, 𝑅12z, 𝑀1x, 𝑀1y, 𝑀1z
– 𝑅2𝑥, 𝑅2𝑦, 𝑅12z, 𝑀2x, 𝑀2y, 𝑀2z

40
–………………………………....
–…………………………………
– 𝑅11𝑥, 𝑅11𝑦, 𝑅11z, 𝑀11x, 𝑀11y, 𝑀11z
Force plates data provides the values for 12 unknowns (𝐹𝑔𝑥, 𝐹𝑔𝑦, 𝐹𝑔z, 𝑥𝐶𝑂𝑃x, 𝑥𝐶𝑂𝑃y, 𝑥𝐶𝑂𝑃z)
for both left and right feet, which reduces the number of unknowns from 78 to 66 and makes the
system over-constrained. “Bottom-up” and “top-down” inverse dynamics calculations were used
as described by Hickox (2014), Vlietstra (2014), Filush and Ashby (2012), and Ashby et al. (2015).
The upper part of the model was solved from each hand to the shoulder and the lower part of the
model was solved from the ground to the lower back. The indeterminacy was resolved by not using
the six equations of trunk segment.
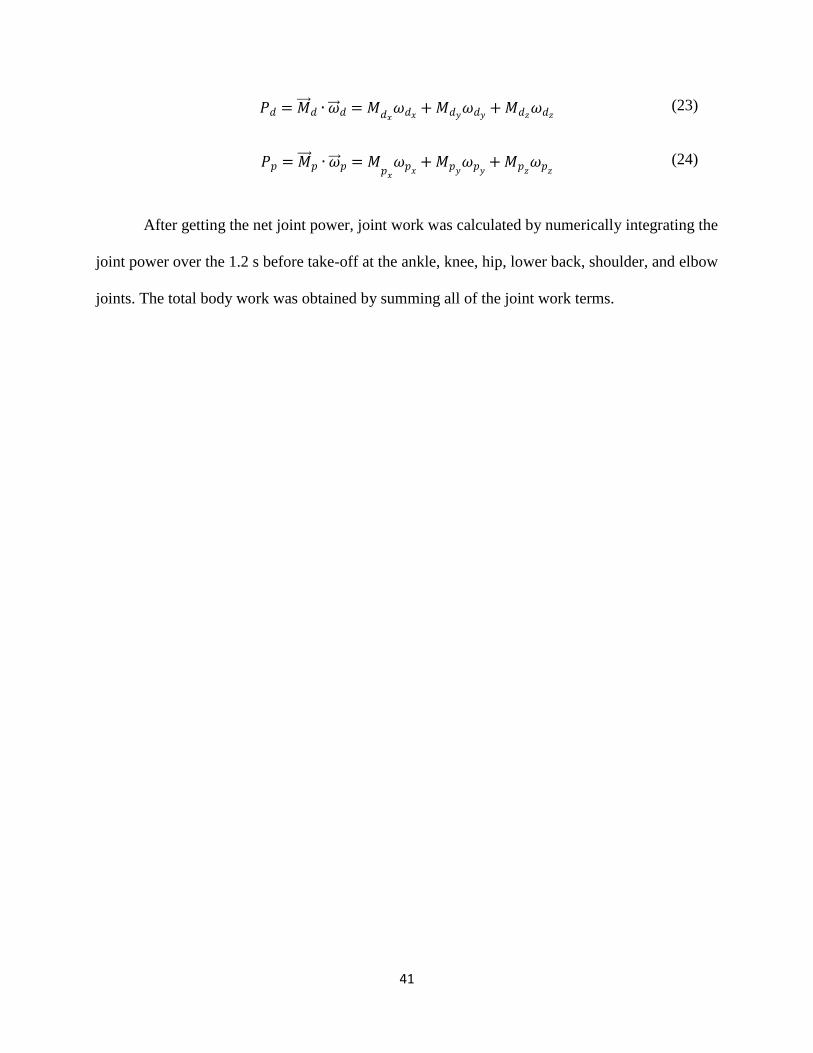
3.2.4 Joint Power and Work
To understand the contributions of muscles at various joints to performance improvement,
a work analysis was required. The net joint power generated or absorbed at each segment of the
3D model was calculated with the following equation:
𝑃𝑗𝑜𝑖𝑛𝑡 = 𝑃𝑑 + 𝑃𝑝 (22)
Where,
𝑃𝑝 is generated or absorbed power at the joint on the proximal segment, and
𝑃𝑑 is generated or absorbed power at the joint on the distal segment.
𝑃𝑑 and 𝑃𝑝 were calculated by using the following equations in the segment anatomical
reference frames (Winter, 2009):
41
𝑃𝑑 = �⃗⃗⃗� 𝑑 ∙ �⃗⃗⃗� 𝑑 = 𝑀𝑑𝑥𝜔𝑑𝑥
+ 𝑀𝑑𝑦𝜔𝑑𝑦
+ 𝑀𝑑𝑧𝜔𝑑𝑧
(23)
𝑃𝑝 = �⃗⃗⃗� 𝑝 ∙ �⃗⃗⃗� 𝑝 = 𝑀𝑝𝑥
𝜔𝑝𝑥+ 𝑀𝑝𝑦
𝜔𝑝𝑦+ 𝑀𝑝𝑧
𝜔𝑝𝑧 (24)
After getting the net joint power, joint work was calculated by numerically integrating the
joint power over the 1.2 s before take-off at the ankle, knee, hip, lower back, shoulder, and elbow
joints. The total body work was obtained by summing all of the joint work terms.

42
3.2.5 Effect of center of gravity (CG) position differences on jump distance
Any increase in the vertical CG position at take-off or any decrease in the vertical CG
position at landing results in additional lateral jump distance. The amount of this increase in lateral
distance as a result of differences in the vertical CG positions at take-off and touchdown was
calculated using the following projectile formulas.
Lateral change in CG position, ∆𝑦 = 𝑉𝑦𝑜𝑡 (25)
Lateral CG velocity at takeoff, 𝑉𝑦𝑜 = 𝑉𝑜 cos 𝜃 (26)
Vertical CG velocity at takeoff, 𝑉𝑧𝑜 = 𝑉𝑜 sin 𝜃 (27)
Vertical change in CG position, ∆𝑧 = 𝑉𝑧𝑜𝑡 −1
2 𝑔𝑡2 (28)
Where,
Lab y-axis (positive) is the lateral jumping direction
Lab z-axis (positive) is the vertical direction (i.e., perpendicular to lab floor)
𝜃 is take-off angle (angle of the CG velocity vector relative to the y-axis in the y-z plane),
𝑡 is time,
𝑉𝑜 is take-off velocity magnitude, and
𝑔 is gravitational acceleration.
The additional jump travel time for any improvement in the vertical CG positions at take-
off and touchdown was calculated using equation 27 and 28.
Additional jump travel time, 𝑡 =𝑉𝑜 sin𝜃−√𝑉𝑜
2 sin𝜃2−2 𝑔 ∆𝑧
𝑔 (29)

43
For this additional jump travel time, the additional lateral jump distance covered by the
participants was calculated using equation 25, 26 and 29.
Additional lateral jump distance,
∆𝑦 = 𝑉𝑜 cos 𝜃 𝑉𝑜 sin𝜃−√𝑉𝑜
2 sin𝜃2−2 𝑔 ∆𝑧
𝑔 (30)
Using equation 30, for any vertical CG improvement ∆𝑧 at take-off and landing, the
resulting lateral jump distance improvement ∆𝑦 was calculated.
3.2.6 Statistical modeling
The statistical SAS Studio server, SAS Institute Inc. 2015. SAS® OnDemand for
Academics (SAS Institute Inc., Cary, NC, USA) was used to create repeated measures mixed
models for comparisons between free and restricted arm jumps for each parameter. Each model
had three classes: subject (1, 2, 3, 4, 5, 6), jump type (free and restricted arms) and trial (1, 2, 3, 4,
5, 6). The subject effect was not counted and the results for each parameter were calculated for
free and restricted arm jumps. Four jump trials (two of each jump type for one subject) out of 72
were not captured properly. These gaps in the data set were properly handled by the statistical
models within the SAS software. All calculated results are reported as the least square mean ± the
95% confidence interval (CI). The p values are reported for each comparison between free and
restricted arm jumps, with a value of 0.05 used to indicate statistical significance for each
comparison.
44
4 Results
4.1 Jump distance
Arm swing allowed participants to jump 29% (p < 0.0001) farther over restricted arm
jumps. The mean jump distances for restricted and free arm jumps were 1.231 ± 0.141 m and 1.587
± 0.141 m, respectively. Jump distance was defined by the lateral distance between the right head
of the 5th metatarsal (RMT5) at take-off and the left head of the 5th metatarsal (LMT5) at
touchdown.
4.2 Center of Gravity (CG) kinematics
The 29% jump performance improvement in free arm jumps was due to the increase in the
take-off velocity, increases in the lateral and vertical position of the CG relative to the right foot
at take-off, and differences in the lateral and vertical position of the CG relative to the left foot at
touchdown. The mean take-off velocity of the CG for free arm jumps was 3.20 ± 0.17 m/s, which
was a 13% increase (p < 0.0001) over the restricted arm jumps average take-off velocity of
2.83 ± 0.17 m/s. There was no significant difference (p = 0.6240) between take-off angle for free
(39.6 ± 1.7 º) and restricted (39.2 ± 1.7 º) arm jumps. At take-off, the mean lateral position of the
CG relative to RMT5 was 0.324 ± 0.038 m for free arm jumps, which was 7.2 cm greater
(p < 0.0001) than for restricted arm jumps (0.252 ± 0.038 m). The mean CG height at take-off for
free arm jumps (1.117 ± 0.012 m) was 2.4 cm greater (p < 0.0001) than for restricted arm jumps
(1.093 ± 0.012 m). Also, the touchdown lateral position of LMT5 relative to the CG was 4.1 cm
greater (p < 0.0001) for free arm jumps (0.147 ± 0.015 m) than for restricted arm jumps
(0.106 ± 0.015 m).
45
Table 1: Comparison of key kinematic and kinetic parameters (mean ± 95% CI)
Free arms Restricted
arms p-value
Jump distance (m) 1.587 ± 0.141 1.231 ± 0.141 <0.0001
lateral position of CG w/r RMT5 at TO (m) 0.324 ± 0.038 0.252 ± 0.038 <0.0001
CG height at TO (m) 1.117 ± 0.012 1.093 ± 0.012 <0.0001
CG velocity at TO (m/s) 3.20 ± 0.17 2.83 ± 0.17 <0.0001
angle of TO velocity (º) 39.6 ± 1.7 39.2 ± 1.7 0.6240
lateral position of LMT5 w/r CG at TD (m) 0.147 ± 0.015 0.106 ± 0.015 <0.0001
CG height at TD (m) 0.988 ± 0.015 0.999 ± 0.014 0.0335
peak VGRF left foot (BW) 1.35 ± 0.04 1.37 ± 0.04 0.2191
peak VGRF right foot (BW) 1.11 ± 0.03 1.04 ± 0.03 <0.0001
time of peak VGRF left foot (s) -0.23 ± 0.02 -0.25 ± 0.02 0.0445
time of peak VGRF right foot (s) -0.15 ± 0.02 -0.17 ± 0.02 0.0126
peak LGRF left foot (BW) 0.58 ± 0.04 0.52 ± 0.04 <0.0001
peak LGRF right foot (BW) 0.37 ± 0.02 0.31 ± 0.02 <0.0001
time of peak LGRF left foot (s) -0.15 ± 0.01 -0.15 ± 0.01 0.8674
time of peak LGRF right foot (s) -0.07 ± 0.01 -0.07 ± 0.01 0.1278
peak VGRF total (BW) 2.38 ± 0.05 2.32 ± 0.05 0.019
time of peak VGRF total (s) -0.18 ± 0.02 -0.21 ± 0.02 0.0004
peak LGRF total (BW) 0.84 ± 0.05 0.75 ± 0.05 <0.0001
time of peak LGRF total (s) -0.13 ± 0.01 -0.13 ± 0.01 0.5029
NOTE: RMT5 = right 5th metatarsal head; LMT5 = left 5th metatarsal head;
TO = take-off; TD = touchdown; BW = body weight
VGRF = vertical ground reaction force;
LGRF = lateral ground reaction force;
4.3 Ground reaction forces (GRF)
The vertical (lab z-axis) and lateral (lab y-axis) ground reaction forces (GRF) on the left
foot and right foot were normalized to the body weight (BW) of each participant to make
meaningful comparisons between free and restricted arm jumps. Total (left foot + right foot)

46
vertical ground reaction forces (VGRF) and lateral ground reaction forces (LGRF) were also
calculated (Figure 4).
The peak left-foot LGRF was 11% (p < 0.0001) greater in free arm jumps (0.58 ± 0.04 BW)
than in restricted arm jumps (0.52 ± 0.04 BW), but the time of peak LGRF was basically the same
(p = 0.8674) for free arm (-0.15 ± 0.01 s) and restricted arm (-0.15 ± 0.01 s) jumps (Figure 4). For
the right foot, the peak LGRF in free arm jumps (0.37 ± 0.02 BW) was 18% greater (p < 0.0001)
than in restricted arm jumps (0.31 ± 0.02 BW). The time of peak LGRF did not differ significantly
(p = 0.1278) between free (-0.07 ± 0.01 s) and restricted (-0.07 ± 0.01 s) arm jumps.
The magnitude of peak left foot VGRF did not differ significantly (p = 0.2191) between
free (1.35 ± 0.04 BW) and restricted (1.37 ± 0.04 BW) arm jumps, but the time of peak VGRF was
about 0.02 s later (p = 0.0445) for free (-0.23 ± 0.02 s) than for restricted (-0.25 ± 0.02 s) arm
jumps (Figure 4). The magnitude of the peak right-foot VGRF was 6% greater (p < 0.0001) in free
arm jumps (1.11 ± 0.03 BW) than in restricted arm jumps (1.04 ± 0.03 BW). The peak VGRF time
for the right foot occurred 0.02 s later (p = 0.0126) in free arm jumps (-0.15 ± 0.02 s) than in
restricted arm jumps (-0.17 ± 0.02 s).
The total VGRF was greater (p = 0.019) for free (2.38 ± 0.05 BW) than for restricted
(2.32 ± 0.05 BW) arm jumps, but the timing of this peak occurred 0.03 s earlier (p = 0.0004) in
restricted arm jumps (-0.21 ± 0.02 s) than in free arm jumps (-0.18 ± 0.02 s) (Figure 4). The total
peak LGRF was 12% greater (p < 0.0001) in free (0.84 ± 0.05 BW) than in restricted
(0.75 ± 0.05 BW) arm jumps, with the magnitude of LGRF for free arm jumps staying slightly
greater in the range of -0.5 to -0.1 s. The time of the total peak LGRF did not differ significantly
(p = 0.5029) for free (-0.13 ± 0.01 s) and restricted (-0.13 ± 0.01 s) arm jumps.
47
Figure 4: GRF profiles for the last 1.2 s before take-off for both free and restricted arm jumps
(mean ± 95% CI)
48
4.4. Work analysis
The work done by the muscles crossing the lower and upper body joints was calculated for
free and restricted arm jumps (Table 2). The total body work was 33% greater (p < 0.001) in free
arm jumps (511.0 ± 53.6 J) than in restricted arm jumps (384.5 ± 53.6 J). In free arm jumps,
significantly more work was performed over restricted arm jumps at the left ankle (82.8 ± 5.3 J
compared to 70.8 ± 5.3 J, p < 0.0001), the right ankle (83.2 ± 5.5 J compared to 74.2 ± 5.5 J,
p < 0.0001), the left hip (60.3 ± 9.7 J compared to 38.0 ± 9.7 J, p = 0.0001), the right hip
(84.7 ± 10.4 J compared to 50.8 ± 10.4 J, p < 0.0001), the lower back (52.4 ± 9.9 J compared to
21.6 ± 9.9 J, p < 0.0001), the left shoulder (17.4 ± 4.8 J compared to 2.2 ± 4.8 J, p < 0.0001), the
right shoulder (35.4 ± 5.3 J compared to -3.5 ± 5.3 J, p < 0.0001), and the left elbow (16.2 ± 2.4 J
compared to 1.1 ± 2.4 J, p < 0.0001), with the largest differences (> 30 J) occurring at the lower
back, right hip, and right shoulder.
In restricted arm jumps, significantly more work was performed over free arm jumps at the
right knee (98.5 ± 16.3 J compared to 80.9 ± 16.3 J, p = 0.0002) and right elbow (3.2 ± 12.5 J
compared to -24.4 ± 12.5 J, p = 0.0027). The work done by muscles crossing the left knee was not
significantly different (p = 0.1455) for free (21.9 ± 14.3 J) than for restricted (27.4 ± 14.3 J) arm
jumps.
49
Table 2: Work done at different joints (mean ± 95% CI, all work units are Joules (J))
Joint Name Free arms Restricted arms p-value
Left ankle 82.8 ± 5.3 70.8 ± 5.3 <0.0001
Right ankle 83.2 ± 5.5 74.2 ± 5.5 <0.0001
Left knee 21.9 ± 14.3 27.4 ± 14.3 0.1455
Right knee 80.9 ± 16.3 98.5 ± 16.3 0.0002
Left hip 60.3 ± 9.7 38.0 ± 9.7 0.0001
Right hip 84.7 ± 10.4 50.8 ± 10.4 <0.0001
Lower back 52.4 ± 9.9 21.6 ± 9.9 <0.0001
Left shoulder 17.4 ± 4.8 2.2 ± 4.8 <0.0001
Right shoulder 35.4 ± 5.3 -3.5 ± 5.3 <0.0001
Left elbow 16.2 ± 2.4 1.1 ± 2.4 <0.0001
Right elbow -24.4 ± 12.5 3.2 ± 12.5 0.0027
Total 511.0 ± 53.6 384.5 ± 53.6 <0.0001
Table 3: Work done at lower body (ankle, knee, hip) and upper body (shoulder and elbow) joints
(mean ± 95% CI, all work units are Joules (J))
Free arms Restricted arms p-value
Left lower body joints 165.0 ± 21.2 136.2 ± 21.2 <0.0001
Right lower body joints 248.8 ± 25.2 223.5 ± 25.2 <0.0001
Total lower body joints 413.9 ± 44.9 359.8 ± 44.9 <0.0001
Left upper body joints 33.6 ± 5.8 3.4 ± 5.8 <0.0001
Right upper body joints 11.1 ± 10.3 -0.3 ± 10.3 0.0879
Total upper body joints 44.7 ± 8.4 3.1 ± 8.4 <0.0001
The total work done by the muscles of three main lower body joints was 54.1 J greater
(p < 0.0001) for free (413.9 ± 44.9 J) than for restricted (359.8 ± 44.9) arm jumps (Table 3), where
the hip joints were the main contributors to this difference. The total work done at upper body
joints was 41.6 J greater (p < 0.0001) in free arm jumps (44.7 ± 8.4 J) compared to restricted arm
jumps (3.1 ± 8.4 J), where the right shoulder was the dominant contributor to this difference. The

50
lower back joint did 30.8 J more work (p < 0.0001) in free arm jumps (52.4 ± 9.9 J) than in
restricted arm jumps (21.6 ± 9.9 J).
4.5 Power analysis of lower back and right hip
Other than the right shoulder, the only two joints to have greater than 30 J increases in
work for free arm jumps compared to restricted arm jumps were the lower back and right hip,
30.8 J and 33.8 J increases, respectively. The large increases in work in free arm jumps at those
two joints justify further investigation.
4.5.1 Power analysis of lower back
Figure 5 shows the total power at the lower back for the last 1.2 s before take-off. Between
about -0.6 s and -0.35 s, power absorption occurred for free and restricted arm jumps. Power
generation occurred after -0.35 s at the lower back joints for free arm jumps. Until about -0.25 s
the net power generation at free arm jumps was greater compared to restricted arm jumps. Between
about -0.25 s and take-off, net power generation for free and restricted arm jumps was not
significantly different.

51
Figure 5: Total power at lower back joint for the last 1.2 s before take-off for free and restricted
arm jumps (mean ± 95% CI)
The power due to x, y and z components of the lower back moment in free and restricted
arm jumps are shown in Figure 6 expressed in the pelvis anatomical reference frame. It is obvious
from the power profiles that most of the power at lower back joints was generated by the
flexion/extension moment (about the z-axis) since net power is the sum of the powers generated
by the moments about the x (left/right bend), y (left/right rotation), and z axes (equation 23 and
24).

52
Figure 6: Powers due to moment about z-axis (pelvis anatomical reference frame) at lower back
joint for the last 1.2 s before take-off for free and restricted arm jumps (mean ± 95% CI)

53
Power due to the z-axis moment, the moment about the z-axis, and the angular velocity
about the z-axis are examined further (Figure 7) since these were the major contributors in the net
lower back joint work for free and restricted arm jumps. Both power profiles for free and restricted
arm jumps remained near zero until -0.6 s and varied after -0.6 s. From about -0.4 s to -0.2 s, the
power due to the z-axis moment was greater for free arm jumps than for restricted arm jumps.
Between about -0.2 s and take-off, the powers for free and restricted arm jumps did not differ
significantly.
At the beginning of the jump cycle, the moments about the z-axis at lower back joints for
free and restricted jumps were small and increased after -0.8 s. Both moments reached their peaks
at about -0.3 s (Figure 7). It is clear from these profiles that the moment for free arm jumps was
greater than for restricted arm jumps between about -0.5 s and -0.1 s.
The angular velocity components of the lower back expressed in the pelvis anatomical
reference frame are shown for free and restricted arm jumps in Figure 7. From about -1.2 s to
- 0.6 s and between about -0.25 s and -0.1 s, the z-axis angular velocity profile was greater for
restricted arm jumps than for free arm jumps. Between about -0.5 s and -0.25 s the z-axis angular
velocity was greater for free arm jumps. There was no significant difference between the z-axis
(flexion/extension) angular velocity profiles for free and restricted arm jumps after -0.1 s to take-
off.

54
Figure 7: Angular velocity, moment and power about z-axis (pelvis anatomical reference frame)
at lower back for the last 1.2 s before take-off for free and restricted arm jumps (mean ± 95% CI)

55
4.5.2 Power analysis of right hip
Figure 8 shows the total power generation and absorption at the right hip for the last 1.2 s
before take-off. Between -0.6 s and -0.4 s, power absorption occurred for free and restricted arm
jumps. After -0.4 s power generation happened until about -0.05 s. Between about -0.15 s and
- 0.05 s, the net power generation at the right hip was greater in free arm jumps than in restricted
arm jumps.
Figure 8: Total power at right hip joint for the last 1.2 s before take-off for free and restricted
arm jumps (mean ± 95% CI)
The power due to x, y and z components of the right hip moment in free and restricted arm
jumps are shown in Figure 9 expressed in the thigh anatomical reference frame. Similar to the
lower back joint, most of the power at the right hip was generated by the flexion/extension moment
(about the z-axis). There was also some power generation and absorption by the y (internal/external
rotation) and x (adduction/abduction) components of the moment. As power due to the moment
about z-axis was the major contributor to total power and work for the right hip, the moment and
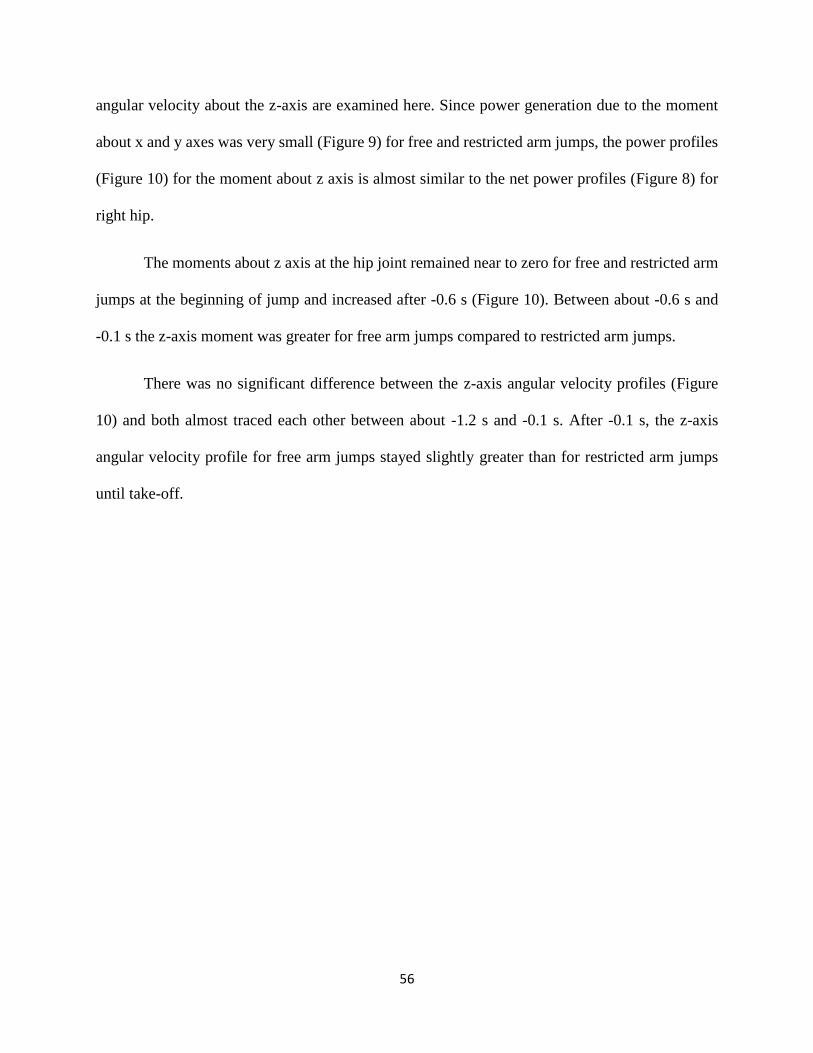
56
angular velocity about the z-axis are examined here. Since power generation due to the moment
about x and y axes was very small (Figure 9) for free and restricted arm jumps, the power profiles
(Figure 10) for the moment about z axis is almost similar to the net power profiles (Figure 8) for
right hip.
The moments about z axis at the hip joint remained near to zero for free and restricted arm
jumps at the beginning of jump and increased after -0.6 s (Figure 10). Between about -0.6 s and
-0.1 s the z-axis moment was greater for free arm jumps compared to restricted arm jumps.
There was no significant difference between the z-axis angular velocity profiles (Figure
10) and both almost traced each other between about -1.2 s and -0.1 s. After -0.1 s, the z-axis
angular velocity profile for free arm jumps stayed slightly greater than for restricted arm jumps
until take-off.
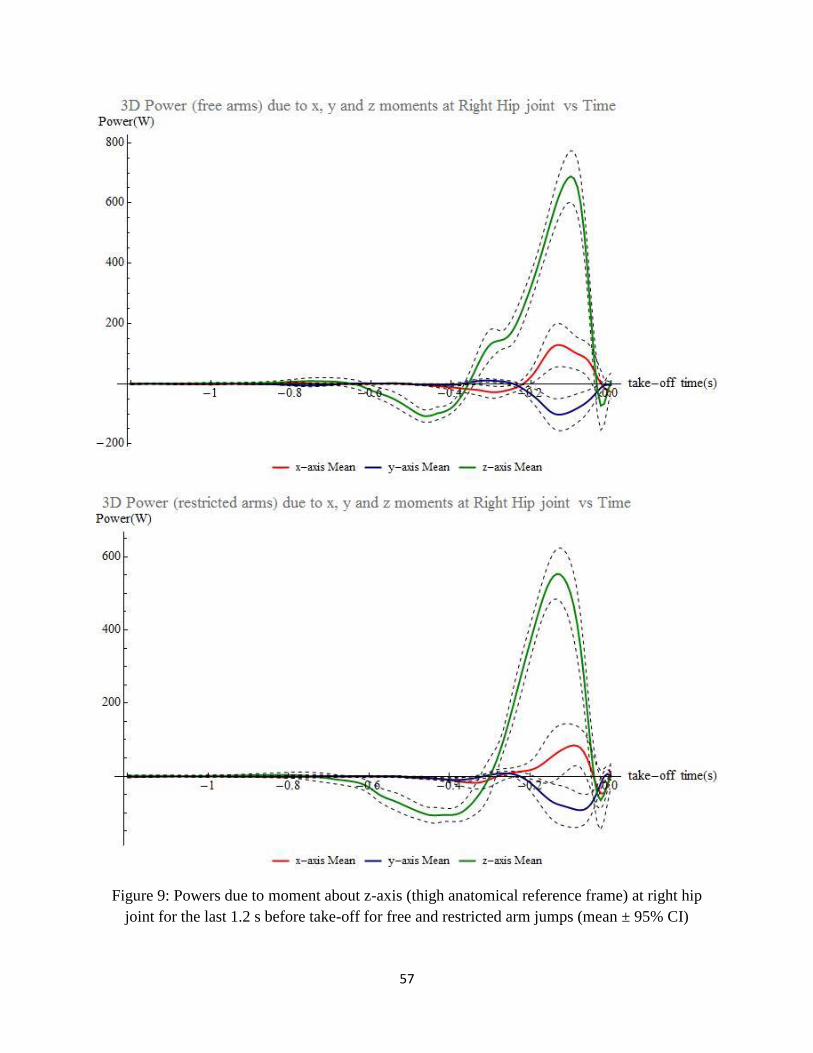
57
Figure 9: Powers due to moment about z-axis (thigh anatomical reference frame) at right hip
joint for the last 1.2 s before take-off for free and restricted arm jumps (mean ± 95% CI)

58
Figure 10: Angular velocity, moment and power about z-axis (thigh anatomical reference frame)
at right hip for the last 1.2 s before take-off for free and restricted arm jumps (mean ± 95% CI)

59
5 Discussion
Several studies showed that the arm swing has a positive effect on standing vertical and
forward jump performance. Investigators also demonstrated the benefits of the arm movement on
jump distance and explored the mechanisms underlying the improved performance. In addition,
researchers have analyzed the motor coordination of lower extremity movement in lateral jumping
in a few studies. However, before the present study, no studies had examined standing two-leg
lateral jumps with two leg landing or the role of arm movement on lateral jump performance. The
purpose of this study was to study the effects of arm swing on jumping performance of two-leg
lateral jumps and to investigate the mechanisms underlying any performance change.
In this study, participants jumped 29% (35.6 cm) farther in free arm jumps over restricted
arm jumps. Of the 35.6 cm improvement, 29% (10.2 cm) was due to the increase in the lateral and
vertical CG position relative to the right foot at take-off, 15% (5.4 cm) was due to the position of
the CG relative to the left foot at landing, and 56% (20.0 cm) was due to the increase in CG velocity
at take-off.
The present study is the first to explore the arm swing effect on lateral jump performance,
so arm contributions to lateral jump performance were compared to similar standing long jump
and vertical jump studies. In previous standing long jump studies, jump performance improvement
due to arm motion was 21% (36 cm) (Ashby and Heegaard, 2002) and 15% (31 cm) (Hara et al.,
2008). This present study found a 29% (35.6 cm) increase in jump performance due to allowed
arm motion. This study also found a 7.2 cm increase in the lateral position of the CG with respect
to the right foot and a 2.4 cm increase in the CG vertical position due to arm movement. These
results are comparable to the 8 cm and 2 cm increase in CG horizontal and vertical directions,
respectively, reported in a standing long jump study (Ashby and Heegaard, 2002). In comparable

60
vertical jump studies, the increase in CG height at take-off was reported as 4.5 cm (Harman et al.,
1990), 6.1 cm (Feltner et al., 1999), 2.4 cm (Lees et al., 2004), and 5 cm (Blache et al., 2013).
The take-off velocity increase due to free arm motion was found to be 13%, which is similar
to the reported 13% (Ashby and Heegaard, 2002) and 11.8% (Hara et al., 2008) increases in take-
off velocity in standing long jump studies, and the 10% (Harman et al., 1990; Feltner et al., 1999),
12.7% (Luhtanen and Komi, 1978), and 8.9% (Lees et al., 2004) reported in vertical jump studies.
The calculated take-off angle 39.6º in free arm jumps is also very close to the 38.6º (Ashby and
Heegaard, 2002), 37.5º (Aguado et al., 1997), and 32.2º (Hara et al., 2008) of standing free arm
long jump studies. The total peak vertical and lateral GRF values of 2.38 BW and 0.84 BW,
respectively, in free arm jumps, are also in good agreement with previously reported vertical (2.27-
2.31 BW) and horizontal (0.63-0.88 BW) GRF values from standing forward jump studies
(Aguado et al., 1997; Ashby and Heegaard, 2002; Filush, 2012).
Since no previous study has reported on joint work during standing lateral jumps, joint
work analysis was compared to similar standing long jump studies (Table 4). Joint work values in
free arm jumps for the present study are compared with the findings from previous standing long
jump investigations.
Table 4: Work comparison at different joints for present lateral jump study with previous
standing long jump studies (Hara et al., 2008; Filush, 2012), all work units are Joules (J).
Present study, 3D Hara, 2D Filush, 2D
Work done at Ankle 166 140 226
Work done at Knee 102.8 44 82
Work done at Hip 145 361 167
Work done at Lower Back 52.4 NA NA
Work done at Shoulder 52.8 5 94
Work done at Elbow -8.2 17 -16.9
Total Body Work 511 583 553

61
In both lateral and forward standing free arm jumps, ankle, knee, hip joints are the dominant
locations for energy generation. Work done at lower joints differs with results from all the
compared investigations. In the present 3D study, one extra joint (lower back) was considered,
which was missing in 2D models of the compared studies. The presence of the lower back joint in
the present study may explain lower work values found at the hip joint. There are differences in
the work values at shoulder and elbow joints among the studies. The ankle work done, and total
body work done in the present study also differ with results from standing long jump studies. These
variations could be due to the differences in segmental movements between these two types of
jumps since the lateral jump movement is not same as forward jump movement. Given that the
standing long jump distances are much greater than lateral jump distances, the total body work
values should be much greater in standing forward jumps compared to lateral jumps. The work
differences at the joints could also be due to differences in the athletic and physical ability of the
considered participants for the respective jump studies.
In a previous standing long jump study, the total work improvement due to free arm
movement was found to be 69 J (Hara et al., 2008), which is less than the present findings of
126.5 J. The total lower joint work improvement of 54.1 J due to free arm motion in the present
study is close to the 42 J previously reported by Hara et al. (2008). In the present investigation,
muscles crossing the upper body joints did 41.6 J extra net work due to free arm motion. This extra
upper limb work was close to the previously reported work improvement of 31 J (Hara et al., 2008)
in standing long jumps. The work done at left and right shoulder joints was 15.1 J and 39 J greater
respectively in free arm lateral jumps compared to restricted arm lateral jumps. The work at left
elbow was also 15.1 J greater in free arm jumps compared to restricted arm jumps. But, -24.4 J
62
energy was absorbed at the right elbow in free arm jumps, which was 27.6 J less than in restricted
arm jumps.
In the present study, arm motion improved jump performance by increasing the total work
done by 33% (126.5 J). 43% (54.1 J) of that extra work due to free arm movement came from the
lower body joints, 33% (41.6 J) came from the upper body joints, and 24% (30.8 J) came from the
lower back. In previous standing long jump studies, it was reported that additional energy imparted
to the system due to the work done at upper extremity joints was the largest factor in increasing
the take-off velocity as well as the jump performance in free arm jumps (Harman et al. 1990, Lees
et al., 2004, Ashby and Delp, 2006, Cheng et al., 2008). In the present study, the total amount of
additional work 41.6 J at the shoulder and elbow joints played an important role in increasing the
CG velocity at take-off by imparting extra energy to the system.
In previous vertical jump studies, arm swing was found to enhance the ability of lower
body extensor muscles to produce larger forces due to decreased muscle shortening (Feltner et al.,
1999; Feltner et al., 2004; Hara et al., 2006 and Cheng et al., 2008). Standing long jump simulations
by Ashby and Delp (2006) also demonstrated work improvement in free arm standing long jumps
due to torque augmentation allowed by lower extension velocities at the hip and ankle joints. In
the present study, arm swing could have had a similar effect on the ankles, hips, and lower back
since work improvement was evident at these joints due to free arm motion. At about -0.4 s to
- 0.2 s power due to the moment about z-axis at the lower back joint in free arm jumps was greater
than the restricted arm jumps (Figure 7). The moment about z-axis at the lower back joint was also
greater in free arm jumps during this time (Figure 7). However, this increased moment about the
z-axis in free arm jumps was caused when the z-axis angular velocity in free arm jumps was greater
compared to restricted arm jumps (Figure 7). Similarly, at the right hip joint, a greater power was

63
generated due to greater moment about z-axis in free arm jumps compared to restricted arm jumps
between about -0.15 s and take-off. There was no significant difference in z-axis angular velocities
for free and restricted arm jumps during this time before take-off. Thus, it can be concluded that
the greater moment at the lower back and right hip joints was not due to the reduced angular
velocities of the extensor muscles crossing these two joints as a result of arm motion.
The increased moments in free arm jumps compared to restricted arm jumps at the lower
back and right hip could be generated due to changes in muscle activations, muscle lengths, and
moment arms. Differences in the lower back and right hip joint angles would result in differences
in the lengths and moment arms of the associated extensor muscles. Further investigations are
needed to quantify the net effect of these differences in muscle moments, powers, and work
generation. The shape of the right hip and lower back moment profiles for free arm and restricted
arm jumps in the present study suggests that these types of jumps may have had differences in
muscle activations. The timing of muscle activations during the jump could explain the greater
joint moments and powers observed. Future electromyography (EMG) or simulation studies could
provide insight into muscle activation patterns and relative degrees of force generation.
The timing of the vertical GRF profiles (Figure 4) suggests that the jumpers may have been
holding back just before take-off in restricted arm jumps. The peak value of the vertical GRF
occurred 0.03 s earlier (p = 0.0004) in restricted arm jumps and trailed off sooner before take-off,
which indicates that the participants may not have used all the available muscle force during this
portion of take-off phase. This evidence supports the “hold back” theory, which suggests that when
arms are restrained, the jumper may limit activation of the extensor muscles during the propulsive
phase to eliminate rotation that would preclude proper landing (Ashby and Heegaard, 2002).
However, without knowing the actual neural activations of the muscles, whether or not the

64
participants were holding back in restricted arm lateral jumps cannot be determined. Future
computer simulation studies that estimate activations could provide insight into the motor
coordination principles of the standing lateral jump and the mechanisms of enhanced jump
performance due to arm swing.
During the data collection, participants were asked to jump to the right side. Jump
performance could vary if the participants were asked to jump according to their dominant side
(left or right). It is also possible that the presence of the reflective markers affected the manner in
which the participants used their arms in free arm jumps. Training the participants while the
markers are on could make a difference in this kind of jump study.
The sample size (six participants) for this study is also a limitation because of the inability
to generalize to the larger population. Collecting data on a greater number of participants could
strengthen the conclusions reached in this study. In this study, inverse dynamics which has some
inherent limitations was used to calculate the joint moments. The assumptions of this method are
not always valid. Some joints may have friction and mass distribution in the segments can vary.
Estimation of the joint center is prone to error because of the errors resulting from soft tissue
artifacts. The accuracy of position measurement by reflective markers is limited by marker motion
on the skin and at the skin-bone interface and by the algorithms used to fill the gaps in the data
due to missing markers. These errors are exacerbated by numerical differentiation to get velocities
and accelerations and are propagated through the successive segments in “bottom-up” and “top-
down” inverse dynamics calculations, which limits the accuracy of the calculated moment, power,
and work. Future investigations might be done using alternate calculation strategies to minimize
these errors.

65
6 Conclusion
Arm swing generally improves the jump performance in vertical and standing long jump
movement, which was previously shown in many studies. In this study, the role of arm movement
on standing two-leg lateral jump performance was examined.
This study found that jump performance was improved by 29% due to free arm swing in
standing two-leg lateral jumps. The jump performance improvement was due to the increase in
take-off velocity, and the change in lateral and vertical CG position at take-off and touchdown in
free arm jumps. In free arm jump, 33% additional work was done which increased the take-off
velocity and improved the CG position at take-off. Some upper body (shoulders), lower body
(ankles and hips), and lower back joints did greater work to increase the total body work in free
arm jumps compared to restricted arm jumps. Total work at upper body joints (shoulders and
elbows) was greater in free arm jumps. The extra energy imparted to the system by the upper body
joints was used to increase jump performance. The work differences were greatest (>30 J) at the
lower back, right hip, and right shoulder joints in free arm jumps. The mechanisms underlying
these work improvements were investigated by examining the “joint torque augmentation” theory.
No evidence of joint torque augmentation was found to explain the work improvement at the lower
back and right hip joints due to slower joint extension velocities. The work improvement at the
lower back and right hip might have been a result of differences in muscular activation, muscle
fiber lengths, moment arms, or some combination of all three. Future studies are required to more
completely understand the mechanisms enabling this work improvement.

66
Appendices
Appendix A
Following are descriptions of the anatomical coordinates systems used in the 3D model of Hickox,
et al., (2014) jump study which is adapted from ISB recommendations
Here,
-All x-axes point in the anterior direction
-All y-axes are along the long axis of the segment and point in the proximal direction
-All z-axes point towards the right side of the subject.
Note: Abbreviations used in this summary are consistent with Marker Set Table
Foot Coordinate System – origin at HEE
x-axis: HEE to midpoint between MT1 and MT5
y-axis: perpendicular to plane with MT1, MT5, and HEE
z-axis: perpendicular to x-axis and y-axis
Shank Coordinate System – origin at KJC
x-axis: AJC to KJC
y-axis: perpendicular to plane containing AJC, KJC, and FBH
z-axis: perpendicular to x-axis and y-axis
Thigh Coordinate System – origin at HJC
x-axis: KJC to HJC
y-axis: perpendicular to plane containing HJC, LKNE, and MKNE
z-axis: perpendicular to x-axis and y-axis
Pelvis Coordinate System – origin at midpoint between LHJC and RHJC
x-axis: LBJC to midpoint between LHJC and RHJC
y-axis: perpendicular to the plane containing LHJC, RHJC, and LBJC

67
z-axis: perpendicular to x-axis and y-axis
Trunk (Thorax) Coordinate System – origin at the midpoint between CLAV and C7
x-axis: LBJC to midpoint between CLAV and C7
y-axis: perpendicular to plane with CLAV, C7, and LBJC
z-axis: perpendicular to x-axis and y-axis
Upper Arm Coordinate System – origin at SJC
x-axis: EJC to SJC
y-axis: perpendicular to plane containing LE, ME, and SJC
z-axis: perpendicular to x-axis and y-axis
Forearm Coordinate System – origin at WJC
x-axis: WJC to EJC
y-axis: perpendicular to plane containing ME, LE, and WJC
z-axis: perpendicular to x-axis and y-axis

68
Appendix B
Marker set for 3D model (modified from marker set used in Hickox (2014)).
Marker
Name
Location
Left Lower Extremity
LTHI1 Left Thigh 1
LTHI2 Left Thigh 2
LTHI3 Left Thigh 3
LLKNE Left Lateral Femoral Epicondyle
LMKNE Left Medial Femoral Epicondyle
LSHN Left Anterior Crest of Tibia
LTUB Left Tibial Tuberosity
LFBH Left Fibular Head
LLML Left Lateral Malleolus
LMLL Left Medial Malleolus
LHEE Left Heel
LMT1 Left Head of 1st Metatarsal
LMT5 Left Head of 5th Metatarsal
Right Lower Extremity
RTHI1 Right Thigh 1
RTHI2 Right Thigh 2
RTHI3 Right Thigh 3
RLKNE Right Lateral Femoral Epicondyle
RMKNE Right Medial Femoral Epicondyle
RSHN Right Anterior Crest of Tibia
RTUB Right Tibial Tuberosity
RFBH Right Fibular Head
RLML Right Lateral Malleolus
RMLL Right Medial Malleolus
RHEE Right Heel
RMT1 Right Head of 1st Metatarsal
RMT5 Right Head of 5th Metatarsal
Pelvis
LASI Left Anterior Superior Iliac Spine
RASI Right Anterior Superior Iliac Spine
LPSI Left Posterior Superior Iliac Spine
RPSI Right Posterior Superior Iliac Spine
Trunk
CLAV Jugular Notch
STRN Xyphoid Process
T8 Mid-lower Back

69
C7 7th Cervical Vertebra
LACR Left Acromion Process
RACR Right Acromion Process
RBAK Right Shoulder Blade
Left Upper Extremity
LUS Left Ulnar Styloid
LRS Left Radial Styloid
LFRM Left Forearm (Lateral Side)
LLE Left Lateral Epicondyle
LME Left Medial Epicondyle
LUA1 Left Upper Arm 1
LUA2 Left Upper Arm 2
LUA3 Left Upper Arm 3
Right Upper Extremity
RUS Right Ulnar Styloid
RRS Right Radial Styloid
RFRM Right Forearm (Lateral Side)
RLE Right Lateral Epicondyle
RME Right Medial Epicondyle
RUA1 Right Upper Arm 1
RUA2 Right Upper Arm 2
RUA3 Right Upper Arm 3
Total: 55 markers
Table: The sign convention (Hickox et al., 2014)
Joint Motion about x- axis
(-/+)
Motion about y -axis
(-/+)
Motion about z -axis
(-/+)
Ankle Inversion Eversion Internal/External Rotation Dorsiflexion/Plantarflexion
Knee Varus/Valgus Internal/External Rotation Flexion/Extension
Hip Adduction/Abduction Internal/External Rotation Flexion/Extension
Lower
Back
Left/Right Bend
(of upper body)
Left/Right Rotation
(of upper body)
Flexion/Extension
Shoulder Adduction/Abduction Internal/External Rotation Flexion/Extension
Elbow Adduction/Abduction Internal/External Rotation Flexion/Extension

70
Appendix C
The XYZ Euler rotation angles used in Hickox, (2014) model were chosen in the following
order:
𝛼= Rotation about the z-axis (flexion/extension or dorsiflexion/plantarflexion)
𝛽= Rotation about the x-axis (abduction/adduction, varus/valgus, inversion/eversion)
𝛾= Rotation about the y-axis (internal/external rotation)
The rotation matrix for the joint angles was determined by sing following equation
𝑅𝑗𝑜𝑖𝑛𝑡 = 𝑅𝑥𝑦𝑧 = [𝑅𝑧"][𝑅𝑦′][𝑅𝑥] (C1)
The individual rotation matrices about each of the axis are
𝑅𝑥 = [1 0 00 cos 𝛽 sin 𝛽0 − sin 𝛽 cos𝛽
] (C2)
𝑅𝑦 = [cos 𝛾 0 −sin 𝛾
0 1 0sin 𝛾 0 cos 𝛾
] (C3)
𝑅𝑧 = [cos 𝛼 sin 𝛼 0−sin 𝛼 cos 𝛼 0
0 0 1] (C4)
Using equation A1 and multiplying individual rotation matrices per this, the following joint
rotation matrix can be form
𝑅𝑗𝑜𝑖𝑛𝑡 = [
cos 𝛼 cos 𝛾 cos 𝛽 sin 𝛼 + cos 𝛼 sin 𝛽 sin 𝛾 sin 𝛼 sin 𝛽 − cos𝛼 cos 𝛽 sin 𝛾− cos 𝛾 sin 𝛼 cos 𝛼 cos 𝛽 − sin 𝛼 sin 𝛽 sin 𝛾 cos 𝛼 sin 𝛽 + cos 𝛽 sin 𝛼 sin 𝛾
sin 𝛾 − cos 𝛾 sin 𝛽 cos𝛽 cos 𝛾] (C5)
The A5 equation will be used to compare along with determined joint rotation matrix to calculate
Euler rotation angles 𝛼, 𝛽 and 𝛾 respectively.
𝛾 = sin−1 𝑅31 (C6)
𝛽 = tan−1 (
𝑅32
−cos (𝛾)𝑅33
cos (𝛾)
⁄ ) (C7)
𝛼 = tan−1 (
𝑅21
−cos (𝛾)𝑅11
cos (𝛾)
⁄ ) (C8)

71
Appendix D
Volunteer Survey
Age (Years and months): ____________ Height: _________ Weight:_________
1) How often do you participate in any sort of physical activity
a) < 1 time per week
b) 1 – 2 times per week
c) 3 – 5 times per week
d) > 5 times per week
2) What is the typical duration of your physical activity?
a) < 20 minutes
b) 20 – 40 minutes
c) 40 – 60 minutes
d) > 60 minutes
3) What is the typical level of exertion during your physical activity?
a) mild
b) moderate
c) strenuous
4) How often is jumping involved in your physical activity?
a) I don’t participate in any physical activity
b) Rarely
c) Moderately often
d) Frequently
5) Have you ever suffered injury to your ankles, knees, hips, shoulders, elbows, back, or neck?
Yes No
6) If 5) was answered “Yes,” please describe the nature of your injury/injuries.
7) Are you still experiencing any negative effects from this/these injury/injuries?
Yes No
8) Is your current physical activity limited in any way by a physician?
Yes No
9) If 8) was answered “Yes,” please describe the nature of this limitation.
72
References
Aguado, X., Izquierdo, M., Montesinos, J.L., 1997. Kinematic and kinetic factors related to the
standing long jump performance. Journal of Human Movement Studies 32, 156-169.
Aizawa, J., Ohji S., Koga, H., Masuda, T., Yagishita, K., 2016. Correlations between sagittal plane
kinematics and landing impact force during single-leg lateral jump-landings. J. Phys. Ther.
Sci. 28: 2316–2321.
Ashby, B.M., Heegaard, J.H., 2002. Role of arm motion in the standing long jump. Journal of
Biomechanics 35, 1631-1637.
Ashby B.M., 2004. Coordination of upper and lower limbs in the standing long jump: kinematics,
dynamics, and optimal control (Ph.D. dissertation). Stanford University, Stanford, CA.
Ashby, B. M., & Delp, S. L. 2006. Optimal control simulations reveal mechanisms by which arm
movement improves standing long jump performance. Journal of Biomechanics, 39(9),
1726-1734.
Ashby, B.M., Vlietstra, N., Hickox, L.J., and Alderink, G.J., 2015. Methods for Full Body Inverse
Dynamics Analysis of Standing Long Jump 39th Meeting of the American Society of
Biomechanics, August 5–8.
Blache Y, Monteil K., 2013. Effect of arm swing on effective energy during vertical jumping:
Experimental and simulation study. Scandinavian Journal of Meicine and Science in
Sports, 23: e121–e129.
Cheng, K., Wang, C.H., Chen, H.C., Wu, C.D., Chiu, H.T., 2008. The mechanisms that enable
arm motion to enhance vertical jump performance – a simulation study. Journal of
Biomechanics 41, 1857-1854.
Dapena, J., 1993. Biomechanical studies in the high jump and implications for coaching. Modern
Athlete and Coach 31 (4), 7–12.
Domire, Z.J., Challis, J.H., 2010. An induced energy analysis to determine the mechanism for
performance enhancement as a result of arm swing during jumping. Sports Biomechanics
March 2010; 9(1): 38–46.

73
de Leva, P., 1996. Adjustments to Zatsiorsky-Seluyanov’s segment inertia parameters. Journal
of Biomechanics 29, 1223-1230.
Ehrig, R.M., Taylor, W.R., Duda, G.N., Heller, M.O., 2006. A survey of formal methods for
determining the centre of rotation of ball joints. Journal of Biomechanics 39, 2798-2809.
Filush, A. and Ashby, B.M., 2012. Effect of Using Hand Weights on Performance in the Standing
Long Jump, Biomedical Engineering Society Annual Meeting, Atlanta, GA, October 24–
27.
Filush, A., 2012. Effect of Using Hand Weights on Performance in the Standing Long Jump
(Master’s thesis). Grand Valley State University, Allendale, MI.
Feltner, M.E., Fraschetti, D.J., Crisp, R.J., 1999. Upper extremity augmentation of lower extremity
kinetics during countermovement vertical jumps. Journal of Sports Sciences 17, 449–466.
Feltner, M.E., Bishop E.J., Perez C.M., 2004. Segmental and Kinetic Contributions in Vertical
Jumps Performed With and Without an Arm Swing. Research Quarterly for Exercise and
Sport, Physical Education, Recreation and Dance, Vol. 75, No. 3, pp. 216-230.
Harman, E.A., Rosenstein, M.T., Frykman, P.N., Rosenstein, R.M., 1990. The effect of arms and
countermovement on vertical jumping. Medicine and Science in Sports and Exercise 22,
825–833.
Hara, M., Shibayama, A., Arakawa, H., Fukashiro, H., 2008. Effect of arm swing direction on
forward and backward jump performance. Journal of Biomechanics 41, 2806–2815.
Hara, M., Shibayama A., Takeshita, D., Fukashiro, S., 2006. The effect of arm swing on lower
extremities in vertical jumping. Journal of Biomechanics 39 (2006) 2503–2511.
Hewit, J.K., Cronin, J.B., Humea, PA., 2012a. Asymmetry in multi-directional jumping tasks.
Physical Therapy in Sport 13, 238-242.
Hewit, J., Cronin, J., Hume, P.,2012b. Multidirectional Leg Asymmetry Assessment in Sport.
Strength & Conditioning Journal, Volume 34 - Issue 1 - pp 82-86.
Hickox, L., 2014. Exploration of the Validity of the Two-Dimensional Sagittal Plane Standing
Long Jump Model (Master’s thesis). Grand Valley State University, Allendale, MI.

74
Hickox, L.J., Ashby, B.M., and Alderink, G.J., 2016. Exploration of the Validity of the Two-
Dimensional Sagittal Plane Assumption in Modeling the Standing Long Jump, Journal of
Biomechanics, Vol. 49, pp. 1085–1093.
Lees, A., Vanrenterghem, J., Clercq, D.D, 2007. The energetics and benefit of an arm swing
in submaximal and maximal vertical jump performance. Journal of Sports Sciences, 24:1,
51-57
Lees, A., Vanrenterghem, J., de Clercq, D., 2004. Understanding how an arm swing enhances
performance in the vertical jump. Journal of Biomechanics 37, 1929-1940.
Lee, Y.M., Lee, H.J., 2012. Effects of different jump-landing directions on sagittal plane
kinematics, kinetics and energy dissipation at lower extremity joints. 30th Annual
Conference of Biomechanics in Sports – Melbourne
Lees, A. and Barton, G, 1996. The interpretation of relative momentum data to assess the
contribution of the free limbs to the generation of vertical velocity in sports activities.
Journal of Sports Sciences, 14:503–511.
Lockie, R.G., Schultz, A.B., Luczo, T.M., Callaghan, S.J., Jeffriess, M.D., 2013. Effect of
unilateral dynamic stability on lateral jump performance in team sport athletes. Serbian
Journal of Sports Sciences, Vol. 7 Issue 4, p159-166. 8p.
Lockie, R.G., Jalilvand, F., Jordan, C.A., Callaghan, S.J., Jeffriess, M.D., Luczo, T.M., Schultz,
A.B., 2015. The Relationship between Unilateral Dynamic Stability and Multidirectional
Jump Performance in Team Sport Athletes, vol. XXIV, no. 5-6, 321-344
Luhtanen, P., Komi, P.V., 1978. Segmental Contribution of Force in Vertical Jump. Europ. J. Appl.
Physiol. 38, 181-188 (1978)
Mackala, K., Stodólka, J., Siemienski, A., Coh, M., 2013. Biomechanical analysis of standing long
jump from varying positions. Journal of Strength and Conditioning Research 27, 2674–
2684.
Meylan, C. M. P., Nosaka, K., Green, J. and Cronin, J. B., 2010a. Temporal and kinetic analysis
of unilateral jumping in the vertical, horizontal, and lateral directions. Journal of Sports
Sciences, 10.1080/02640411003628048

75
Meylan, C.M.P., Nosaka, K., Green, J.P., and Cronin, J.B., 2010b. Variability and influence of
eccentric kinematics on unilateral vertical, horizontal, and lateral countermovement jump
performance. Journal of Strength and Conditioning Research. 24(3): 840-845.
Mornieux, G., Gehring, D., Tokuno, C., Gollhofer, A., Taube, W., 2014. Changes in leg kinematics
in response to unpredictability in lateral jump execution. European Journal of Sport
Science, Vol. 14, No. 7, 678–685.
Nagano, A., Komura, T., Fukashiro, S., 2007. Optimal coordination of maximal-effort horizontal
and vertical jump motions – a computer simulation study. Biomedical Engineering Online
6-20.
Payne, A.H., Slater, W.J., Telford, T., 1968. The use of a force platform in the study of athletic
activities. A preliminary investigation. Ergonomics 11, 123–143.
Ren, L., Jones, R.K., Howard, D., 2008. Whole body inverse dynamics over a complete gait cycle
based only on measured kinematics. Journal of Biomechanics 41, 2750-2759.
Shetty, A.B., Etnyre B.R., 1989. Contribution of Arm Movement to the Force Components of a
Maximum Vertical Jump. The Journal of Orthopedics and Sports Physical Therapy. 0190-
6011/89/1105-0198$02.00/0
Sinsurin, K., Vachalathiti, R., Jalayondeja, W., Limroongreungrat, W., 2013. Altered Peak Knee
Valgus during Jump-Landing among Various Directions in Basketball and Volleyball
Athletes. Asian Journal of Sports Medicine, Volume 4, 195-200.
Vlietstra, N., 2014. Comparing Methods for Full Body Inverse Dynamics Analysis of a Standing
Long Jump (Master’s thesis). Grand Valley State University, Allendale, MI.
Wakai, M., Linthorne, N.P., 2005. Optimum take-off angle in the standing long jump. Human
Movement Science 24, 81-96.
Winter, D., 2009. Biomechanics and motor control of human movement, fourth edition. John
Wiley and Sons, Waterloo, Ontario, Canada.
Wu, W., Wu, J., Lin, H., & Wang, G. (2003). Biomechanical analysis of the standing long jump.
Biomedical Engineering: Applications, Basis and Communications, 15(05), 186-192.

76
Wu, G., Siegler, S., Allard, P., Kirtley, C., Leardini, A., Rosenbaum, D., Whittle, M., D’Lima,
D.D., Cristofolini, L., Witte, H., Schmid, O., Stokes, I., 2002. ISB recommendation on
definitions of joint coordinate systems of various joints for the reporting of human joint
motion – part I: ankle, hip, spine. Journal of Biomechanics 35, 543-548.
Wu, G., van der Helm, F.C.T., Veeger, H.E.J., Makhsous, M., Van Roy, P., Anglin, C., Nagels, J.,
Karduna, A.R., McQuade, K., Wang, X., Werner, F.W., Buchholz, B., 2005. ISB
recommendation on definitions of joint coordinate systems of various joints for the
reporting of human joint motion – Part II: shoulder, elbow, wrist, hand. Journal of
Biomechanics 38, 981-992.
Zatsiorsky, V.M., Seluyanov, V.N., Chugunova, L.G., 1990. Methods of determining massinertial
characteristics of the main segments of the human body. In Biomechanics VIII-B
(Edited by Matsui, H. and Kobayashi, K.), Human Kinetic, Illinois, 1152-1159.