EF Final Sept 15
170
Measuring the Economic Benefits of America’s Everglades Restoration An Economic Evaluation of Ecosystem Services Affiliated with the World’s Largest Ecosystem Restoration Project Prepared for The Everglades Foundation 18001 Old Cutler Road, Suite 625 Palmetto Bay, Florida 33157 www.evergladesfoundation.org 305.251.0001 by Mather Economics 43 Woodstock Street, Roswell, Georgia 30075 www.mathereconomics.com 770.993.4111 Bobby McCormick, Ph.D., Principal Investigator Robert Clement, MA Daniel Fischer, MBA Matt Lindsay, Ph.D. Reed Watson, JD MA with assistance from Danielle Alderman Kristina Catani Joanna Fister Gabi Huber, Ph.D. Exley McCormick Arvid Tchivzhel Emily Wood, MA
-
Upload
bobby-mccormick -
Category
Documents
-
view
52 -
download
5
Transcript of EF Final Sept 15

MMeeaassuurriinngg tthhee EEccoonnoommiicc BBeenneeffiittss ooff AAmmeerriiccaa’’ss
EEvveerrggllaaddeess RReessttoorraattiioonn An Economic Evaluation of Ecosystem Services Affiliated with the World’s Largest Ecosystem
Restoration Project
Prepared for The Everglades Foundation
18001 Old Cutler Road, Suite 625
Palmetto Bay, Florida 33157
www.evergladesfoundation.org
305.251.0001
by
Mather Economics
43 Woodstock Street,
Roswell, Georgia 30075
www.mathereconomics.com
770.993.4111
Bobby McCormick, Ph.D., Principal Investigator
Robert Clement, MA
Daniel Fischer, MBA
Matt Lindsay, Ph.D.
Reed Watson, JD MA
with assistance from
Danielle Alderman
Kristina Catani
Joanna Fister
Gabi Huber, Ph.D.
Exley McCormick
Arvid Tchivzhel
Emily Wood, MA

Summary of Results Everglades restoration will have important and significant economic impacts on several basic services
provided by this massive and complex ecosystem. We have split these services into six distinct divisions. For
each of these categories, we conservatively estimated, using best available data and economic methods, the
increase in economic value of a restored Everglades ecosystem.
Summary of Ecosystem Services Valuation of Everglades RestorationService NPV Best Estimate Lower Bound Upper Bound
1 Groundwater purification 13,150,000,000$ 7,408,000,000$ 27,970,000,000$
2 Real Estate 16,108,000,000$ 536,000,000$ 53,570,000,000$
3 Park Visitation 1,311,588,000$ 655,794,000$ 2,623,177,000$
4 Open space 830,700,000$ 116,600,000$ 2,763,000,000$
5 Fishing
Commercial 524,100,000$ 441,100,000$ 716,000,000$
Recreational 2,037,000,000$ 1,714,000,000$ 2,783,000,000$
6 Wildlife Habitat and Hunting 12,539,900,000$ 498,600,000$ 33,529,700,000$
TOTAL Value of Services 46,501,288,000$ 11,370,094,000$ 123,954,877,000$
Initial Investment 11,500,000,000$
Benefit-Cost Ratio 4.04 -0.01 9.78All calculations are based on discount rate of 2.1% .
Our analysis strongly suggests that restoration of the Everglades as described and planned in CERP will have
large economic benefits. Our best estimate is that restoration will generate an increase in
economic welfare of approximately $46.5 billion in net present value terms that could range
up to $123.9 billion. The return on investment, as measured by the benefit-cost ratio, assuming a cost of
restoration of $11.5 billion, is also high and significant, 404 percent, which means for every one dollar
invested in Everglades restoration $4.04 dollars are generated. Everglades restoration will also have an incremental impact on employment of about 442,000 additional workers over 50 years. In addition, the Corps
of Engineers estimates there will be 22,000 jobs created as a result of the actual restoration projects.
Throughout our analysis, we have taken a very conservative approach to estimation. Accordingly our best estimates almost surely understate the return on investment of Everglades restoration.
Summary of Jobs Results
Sector Incremental Jobs
Commercial Fishing 6,798
Recreational Fishing 36,868
Residential Construction & Real Estate Services 273,601
Tourism (Lodging, Eating & Drinking, Transportation, Retail, Entertainment) 48,552
Agriculture (3,724)
Wildlife Habitat & Hunting 80,569
TOTAL 442,664

b
Table of Contents
Summary of Results ......................................................................................................................................a
Preamble and Executive Summary ................................................................................................................ i
Details ...................................................................................................................................................... iv
Introduction ................................................................................................................................................. 1
Our Assignment ....................................................................................................................................... 7
Our Methods, Approach and Assumptions ............................................................................................... 8
What Others Have to Say About Everglades and Everglades Restoration .................................................10
On Costs .................................................................................................................................................13
Introduction References ..........................................................................................................................14
Appendix to Introduction ........................................................................................................................16
Chapter 1: Ground Water Purification and Aquifer Recharge.......................................................................19
Avoided Desalination Costs .....................................................................................................................20
General approach and data sources ....................................................................................................20
Technical details ..................................................................................................................................21
Results ....................................................................................................................................................26
Chapter 1 References ..............................................................................................................................28
Appendix to Chapter 1 ............................................................................................................................28
Part 1: Total water withdrawals model ................................................................................................28
Part 2: Details on U.S.G.S. data collection ............................................................................................29
Part 3: Locations of and other information on existing SFWMD desalination plants .............................30
Chapter 2: Water Quality and Residential Real Estate Valuation ..........................................................40
Impact of Improved Water Quality ..........................................................................................................40
Real Estate Change-in-Value Estimation Results ......................................................................................41
Appendix to Chapter 2 ............................................................................................................................44

c
Chapter 3: Recreation and Park Visitation Valuation ...................................................................................47
Methodology ..........................................................................................................................................47
Results and Sensitivity Analysis ...............................................................................................................54
Chapter 4: Open-Space Valuation................................................................................................................55
Primary Methodology .............................................................................................................................55
Alternative Methodologies ......................................................................................................................58
Information Sources ................................................................................................................................60
Chapter 5: Commercial and Recreational Fishing Valuation .........................................................................65
Literature Review and Background ..........................................................................................................65
Impact on Fish Population .......................................................................................................................65
Impact on Commercial Fishing ................................................................................................................67
Methodological Approach ...................................................................................................................67
Impact on Recreational Fishing................................................................................................................75
Additional Commercial Fishing Figures ....................................................................................................81
Chapter 5 References ..............................................................................................................................82
Chapter 6: Wildlife Habitat and Hunting Valuation ......................................................................................83
Impact on Hunting ..................................................................................................................................83
Methods and Literature.......................................................................................................................83
Impact on Habitat and Wildlife Viewing ..................................................................................................89
Chapter 7: Other Everglades Valuations, Miscellany ....................................................................................94
The Potential Benefit of Cleaner Water from Restoration ........................................................................95
Nutrient Loading .................................................................................................................................95
Harmful Algal Blooms, Beach Closures, and Public Health Impacts ......................................................99
Conclusions Regarding Water Quality Impacts ...................................................................................103
Fire .......................................................................................................................................................103
Chapter 7 References ............................................................................................................................105
Chapter 8: Impact On Job Creation And Earnings ......................................................................................108
Commercial Fishing ...............................................................................................................................110

d
Recreational Fishing ..............................................................................................................................111
Residential Construction & Real Estate Services ....................................................................................113
Tourism.................................................................................................................................................115
Agriculture ............................................................................................................................................117
Wildlife Habitat and Hunting .................................................................................................................119
Direct Jobs Created as a Result of Restoration Construction ..................................................................121
Chapter 9: Last Words ...............................................................................................................................123
Diamonds and Water ........................................................................................................................123
Outrunning the Bear .............................................................................................................................125
Chapter 10: Acknowledgements................................................................................................................127
Chapter 11: Mather Economics Everglades Valuation Team Biographies ...................................................128

Preamble and Executive Summary
We have been commissioned by the Everglades Foundation to place an economic valuation on
Everglades restoration. The Everglades are sub-tropical wetlands – a ―River of Grass‖ and much,
much more. In order to catalogue the huge array of potential products and services flowing out of
the Everglades, we envision this vast natural cauldron as a firm. Ponder General Electric. Among
many other things, General Electric produces medical imaging, jet engines, and financial
services. Each of its product lines has revenues and costs. GE manufactures and creates the
products, and buyers purchase them. In almost every case, the buyer places a higher value on the
product than the purchase price. The Everglades system is like GE, except that buyers do not
directly pay for the products they consume. Instead, consumption is enjoyed in large measure
without any compensation to the owner or producer, because there is no well-defined owner and
nature is the producer.
We approach our job as if the Everglades were a multi-product firm like GE, and we task
ourselves with estimating the values that consumers place on its products and services. In that
taxonomy, Everglades restoration is akin to a business opportunity, and the Comprehensive
Everglades Restoration Plan, CERP, is a detailed business plan. Our job is to produce a set of pro
forma financial statements to complement and complete that plan. As with all pro forma
projections, we have made assumptions about the future. We have attempted to make our
assumptions as reasonable, visible, and transparent as possible so that readers can adjust our
findings based upon their own assessment of the proper assumptions. As in any analysis of this
type, the best assumption is not always obvious. Therefore, in many cases, we have provided a
range of estimates, but we also offer what we think is our best estimate. In all cases where there
was no clear choice regarding an assumption, we took the conservative approach. Accordingly,
in the analysis you see below, we believe that our estimates are at the lower end of the range
(lower bound) and follow best practices in economic methodology.
We have broken this multi-product firm, the Everglades, into six distinct divisions and a seventh
catch-all branch. These are:
$ Groundwater purification and aquifer recharge
$ Real estate
$ Park Visitation
$ Open space
$ Fishing
$ Wildlife habitat and hunting
$ Water quality, biodiversity, and carbon sequestration
Take groundwater purification and aquifer recharge as the first of many services produced by the

ii
Everglades. CERP, if enacted as planned, will restore Everglades sheet flow. Restored sheet flow
will, in turn, provide additional fresh surface water and groundwater. Consequently, water
available for municipal and private use will be less saline, that is, ground water extracted for use
by South Floridians will be less saline and require less electricity to become usable and potable.
Because it costs money to desalinate water, one service that a restored Everglades would provide
is reducing the cost of desalinating increasingly brackish groundwater. In order to assay this
revenue stream, we have assumed that restoration will return South Florida groundwater and
surface water to its 1970 levels.1 Using data from that period, and assuming that restoration
would create water of similar salinity to that period, we can project how much money the people
of South Florida will not have to spend desalinating groundwater as restoration unfolds. In other
words, Everglades restoration means that groundwater will not be as salty and that less energy
will be required to prepare it for human use. Salty water must be treated to remove chlorides. As
the groundwater is more salty, it takes more electricity to purify the water for humans.
Restoration reduces the amount of electricity required and thus is a direct benefit in terms of
energy cost savings.. We estimate these restoration savings to come primarily from reduced
expenditures on energy which would otherwise be used to filter out more saline pushed through
membranes to create usable water.2
In Table A below, we report in summary format our results of computing the value of services
for all the product lines listed above. In our detailed document that follows, we provide thorough
insight into our methods, sources, and our exact assumptions. They are only sketched and
summarized here. Each division has associated with it a table detailing the best estimates and a
range of estimates that we deem plausible. Again, for parsimony of presentation here, we have
not included all the details of our calculations. They are available in the full document below.
1Our empirical analysis of ground and surface water supports this assumption. Salinity levels appear
relatively constant in ground water test wells up until the early 1970s when they began to grow commensurate with
Everglades flow reduction. 2While it might be argued that fewer plants will have to built for water purification after restoration, this is
not accurate according to our models. Population and income growth will likely necessitate the construction of new
plants, but restoration will not preclude these investments. Hence, the virtue and benefit of restoration on
groundwater purification comes only from the lower expenditures required to clean the salt from the less briny water
not from less capital investment in plants. Plants will have to be built to accommodate increased demand for water,
which will not be impacted by restoration.

iii
Table A Summary of Ecosystem Services Valuation of Everglades RestorationService NPV Best Estimate Lower Bound Upper Bound
1 Ground Water Purification 13,150,000,000$ 7,408,000,000$ 27,970,000,000$
2 Real Estate 16,108,000,000$ 536,000,000$ 53,570,000,000$
3 Park Visitation 1,311,588,000$ 655,794,000$ 2,623,177,000$
4 Open space 830,700,000$ 116,600,000$ 2,763,000,000$
5 Fishing
Commercial 524,100,000$ 441,100,000$ 716,000,000$
Recreational 2,037,000,000$ 1,714,000,000$ 2,783,000,000$
6 Wildlife Habitat and Hunting 12,539,900,000$ 498,600,000$ 33,529,700,000$
TOTAL Value of Services 46,501,288,000$ 11,370,094,000$ 123,954,877,000$
Initial Investment 11,500,000,000$
Benefit Cost Ratio 4.04 -0.01 9.78All calculations are based on discount rate of 2.1% .
Our analysis strongly suggests that restoration of the Everglades as described and planned in
CERP will have large and important economic benefits. Our best estimate is that restoration will
generate an increase in economic benefits of approximately $46.5 billion in net present value
terms.3 The range of this estimate varies from a low of $11.3 billion to a high of $123.9 billion.
The return on investment, assuming a cost of restoration of $11.5 billion, is also high and
significant. Our best estimate is that the benefit-cost ratio is 4.04 with a range of -01 to 9.78
percent. The bottom line, as our analysis strongly suggests, is that the rewards of restoration far
outweigh the economic costs. It is important to note that these are the changes in value to a
restored Everglades. Our valuation does not represent the total value of services that flow from
this ecosystem, currently or in its restored state. It is the incremental or marginal increase in
value from implementing restoration.
To provide perspective, Table B below reports computations on (1) the total value of services per
person in the 16-county South Florida region, (2) the ratio of total services to total income in
2007, and (3) the present value of total income in 2007.4 These calculations say that the total
value of ecosystem services from a restored Everglades amount to an increase in wealth for each
3 We believe that the overall welfare impacts, as distinct from the simple benefits, are even larger. Details
on this economic distinction are provided later in this report. 4
Using the 2007 Census data on population and income.

iv
person in the region of about $5,129 on a one-time basis, which is approximately a 0.3 percent
increase in their wealth (narrowly defined for purposes here as the present value of income over
the next 50 years or an 12.9 percent wealth increase when compared to their annual income).
These computations suggest that the impacts of restoration are not only real and economically
meaningful, but also reasonable.
TABLE B Relevance and Impact of Restoration with respect to Income
and Wealth
Value of Services per capita $ 5,129
Value of Services per dollar of annual income 12.9%
Value of services per npv of income 0.30%
Details Groundwater Purification and Aquifer Recharge Valuation
Avoided Groundwater Desalination Costs
Groundwater in the coastal counties of the South Florida Water Management District (SFWMD)
is brackish. It must be desalinated before most uses. The capital cost of desalination, given the
current state of reverse osmosis (RO) technology, is driven by the volume of fresh water that
must be produced, which in turn is driven by population growth and perhaps other factors (for
instance, climate and income).5 The operating cost of desalination, on the other hand, is a direct
function of the salinity of the water input. Saltier water must go through the RO membranes at a
higher pressure, which requires more energy. The restoration of sheet flow according to CERP
can be expected to decrease groundwater salinity, because the additional fresh water filtered into
the aquifer from above will displace seawater seeping into the aquifer from below. So,
conservatively, restoring the Everglades can be expected to result in at least the energy cost
savings from desalinating less saline groundwater. We ignore any capital cost savings that might
come from possibly having to build fewer desalination plants in the first place. We also ignore
labor and maintenance cost savings from using less saline input (instead of assuming, for
instance, that RO membranes fail at higher rates when higher-pressure, more saline water is
pushed through). This is in keeping with our desire to be ultra-conservative with respect to our
estimates. It is reasonable to subjectively estimate that our metrics of benefits are biased on the
5 Our use of the phrase desalination might be confusing to some people. Here we are not talking about
taking salt out of ocean water instead we are referring to the act of removing salt from brackish or slightly salty fresh
groundwater.

v
low side because of this conservative approach.
Under assumptions detailed below, we estimate that these energy cost savings would be
substantial and vary by county within the region. Growing energy costs would increase these
estimates. Improvements in desalination technology would decrease them. One assumption that
affects our cost savings estimates is whether all the groundwater withdrawn must be desalinated.
We have made two different assumptions: first, that all groundwater is to be desalinated, and
second, that only the groundwater currently classified as saline must be desalinated. The current
salinity readings indicate that all groundwater is brackish, not just the water that is currently
classified as saline.
General Approach and Data Sources
Our model has three steps. First, we used the volume of groundwater withdrawn and its salinity
as observed over time to infer the change in salinity over the next 50 years without Everglades
restoration. Next, we inferred the yearly desalination cost over the same period using regression
analysis and engineering data published by the Texas Water Development Board (TWDB).
Finally, we repeated the cost calculations assuming that, if the Everglades were restored,
groundwater salinity would return to its 1970 level and stay there even as the volume of water
withdrawn grows as population and demand grow.6
In other words, we assumed that implementing CERP would result in a new steady state, where
the aquifer would be replenished with fresh water to a sufficient extent that it could sustain
increased withdrawals with no increase in its salinity. The difference between the discounted
streams of yearly groundwater desalination cost with and without the Everglades restored is our
estimated economic benefit in the form of avoided desalination costs that can be credited to
CERP. In the next 40 or 50 years, south Floridians will still need to desalinate their water, but it
will cost them less because after restoration, the water will be less saline.
We collected data on ground and surface water use in SFWMD, by county and by year, from the
US Geological Survey (USGS). We collected salinity data from DBHYDRO, the official
SFWMD data repository of water research results, and from the National Water Information
System (NWIS) maintained by the USGS.
6 We have not made any adjustment to our predicted levels of ground-water salinity based on any sea-level
rise that might accompany global climate change. Restoration is a marginal adjustment to ground-water salinity. If
climate change increases sea level and that leads to higher salinity of ground water, it will cost more to clean the
water, but that impact is separate and independent of our estimate of any changes in salinity that occur as a result of
restoration of sheet flow.

vi
Technical Details on Water Supply Calculations
The USGS collects county-level data on water withdrawals every five years. We are interested in
data for the 16 counties in the SFWMD. The earliest available records are from the 1985 data set.
The latest available are from 2005. Using these data and yearly population figures by county
over the same time span, we extrapolated water use 50 years into the future. Details are provided
in the full report below.
One of the DBHYDRO measurements is chloride concentration in milligrams per liter. Each
measurement comes with the location of the station and the date it was taken, so it is
straightforward to combine them into yearly averages per county. The USGS maintains the
National Water Information System (NWIS), a similar online database with its own chloride
records, with the same unit of measurement, also with locations and time stamps. Both
DBHYDRO and NWIS record salinity separately by groundwater and surface water. In the case
of groundwater, we are interested in measurements taken in wells no deeper than 500 ft. Below
this depth, the water is saline. Southern Florida's fresh groundwater comes from surficial
aquifers, with water withdrawn from depths well above 500 feet.
Groundwater in the 16 counties has been growing increasingly brackish over time. This result
occurs even after discarding any samples taken from depths either unknown or greater than 500
feet (Figure 1). It is reasonable, then, to assume that desalination will be needed for all
0
500
1,000
1,500
2,000
2,500
1900 1950 2000year
44,735 samples
NWIS, Chloride, water, filtered (p00940), All GW Sites
0
1,000
2,000
3,000
4,000
1970 1980 1990 2000 2010year
6,205 samples
DBHYDRO, Test Name: Chloride (32), Matrix: GW, All Stations
Chloride mg/L at depths above 500 ft.
Groundwater salinity in the 16 counties of SFWMD
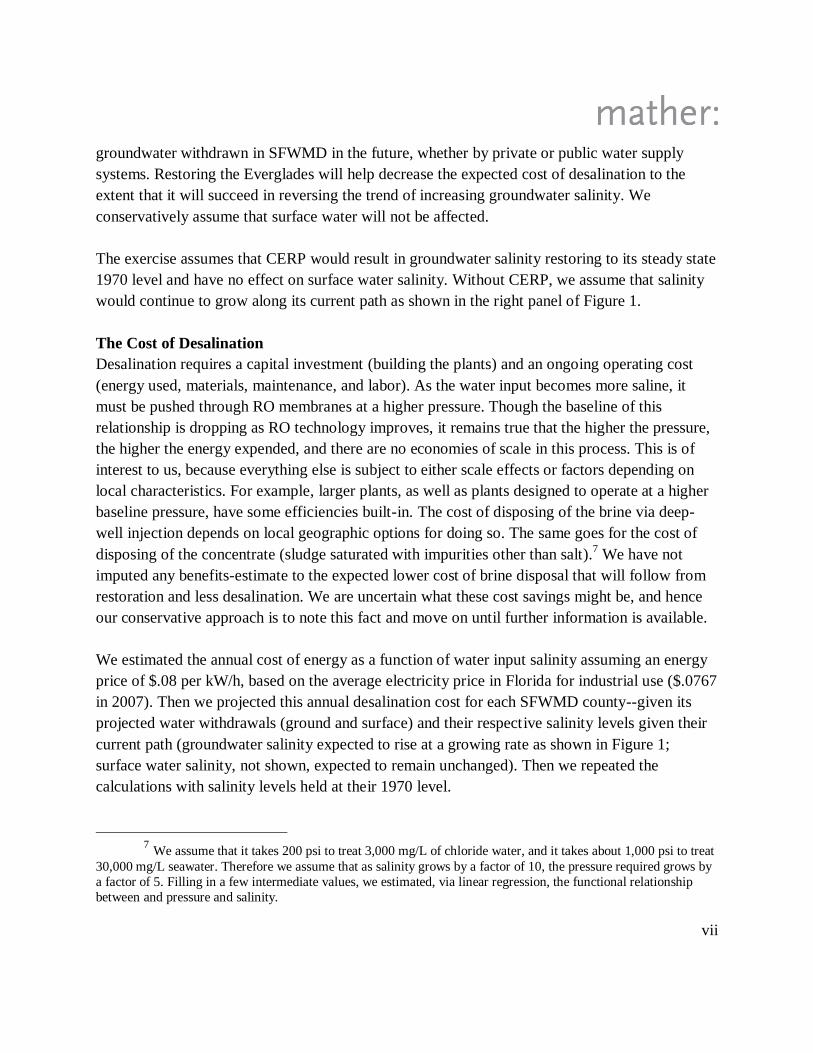
Figure 1 Groundwater Chloride Levels
vii
groundwater withdrawn in SFWMD in the future, whether by private or public water supply
systems. Restoring the Everglades will help decrease the expected cost of desalination to the
extent that it will succeed in reversing the trend of increasing groundwater salinity. We
conservatively assume that surface water will not be affected.
The exercise assumes that CERP would result in groundwater salinity restoring to its steady state
1970 level and have no effect on surface water salinity. Without CERP, we assume that salinity
would continue to grow along its current path as shown in the right panel of Figure 1.
The Cost of Desalination
Desalination requires a capital investment (building the plants) and an ongoing operating cost
(energy used, materials, maintenance, and labor). As the water input becomes more saline, it
must be pushed through RO membranes at a higher pressure. Though the baseline of this
relationship is dropping as RO technology improves, it remains true that the higher the pressure,
the higher the energy expended, and there are no economies of scale in this process. This is of
interest to us, because everything else is subject to either scale effects or factors depending on
local characteristics. For example, larger plants, as well as plants designed to operate at a higher
baseline pressure, have some efficiencies built-in. The cost of disposing of the brine via deep-
well injection depends on local geographic options for doing so. The same goes for the cost of
disposing of the concentrate (sludge saturated with impurities other than salt).7 We have not
imputed any benefits-estimate to the expected lower cost of brine disposal that will follow from
restoration and less desalination. We are uncertain what these cost savings might be, and hence
our conservative approach is to note this fact and move on until further information is available.
We estimated the annual cost of energy as a function of water input salinity assuming an energy
price of $.08 per kW/h, based on the average electricity price in Florida for industrial use ($.0767
in 2007). Then we projected this annual desalination cost for each SFWMD county--given its
projected water withdrawals (ground and surface) and their respective salinity levels given their
current path (groundwater salinity expected to rise at a growing rate as shown in Figure 1;
surface water salinity, not shown, expected to remain unchanged). Then we repeated the
calculations with salinity levels held at their 1970 level.
7 We assume that it takes 200 psi to treat 3,000 mg/L of chloride water, and it takes about 1,000 psi to treat
30,000 mg/L seawater. Therefore we assume that as salinity grows by a factor of 10, the pressure required grows by
a factor of 5. Filling in a few intermediate values, we estimated, via linear regression, the functional relationship
between and pressure and salinity.

viii
Water Supply Results
Our avoided desalination cost estimate is the difference between projected desalination costs
given the current path of rising salinity versus projected desalination costs holding salinity
constant at its 1970 level (our expected environmental effect of CERP). We performed this
calculation under two assumptions regarding water withdrawn by public and private parties in
the SFWMD over the next 50 years. First we assumed that all water will have to be desalinated;
second we assumed that only the water classified as saline will have to be desalinated. Details
are provided in the full report below. Though the latter sounds obvious and results, as expected,
in a lower estimate, the former is also deemed plausible. Current readings show that all
groundwater in SFWMD tested at depths above 500 ft. is saline, to some extent, and growing
more saline on average. If not all of it is treated now, it might need to be in the future. Net
present values of the yearly savings between 2010 and 2060 are shown in Table 1.
Assuming lowered desalination resulting from restoration of the Everglades, the cost savings
from energy-use reduction will be substantial. For purposes here, we made some additional
assumptions. First, we accumulated the cash flows over 30-, 40-, and 50-year periods. Second,
we discounted the dollar amounts by the current real cost of capital to municipalities in South
Florida, 2.1 percent.8
We next report our calculations in pro forma format for the other services and products listed
above. While we have gone to some length in this section to give a sense of our methods, in the
summary sections below we are more succinct and parsimonious, however, complete discussion
of all our methods and technical details are provided in each relevant section of the main
document.
8 Details on our use of this particular discount rate are discussed later in the document.

ix
Assumptions:
Total Growth 3%
Income Growth 0%
Adjusted for
GrowthUnadjusted
Adjusted Unadjusted
Population Growth 1% 27,974,488,275$ $13,150,812,909 50 Years 131% 9%
Energy Cost Growth 2% 18,671,662,550$ $10,306,678,952 40 Years 54% -15%
Technology 0% 11,222,040,888$ $7,408,688,810 30 Years -7% -39%
SF Muni Bond Rates 4.50%
Inflation 2.40%
Discount Rate 2.10%
Initial Investment 12,100,000,000$
County Estimates, Adjusting for Growth
Years B ro ward C harlo tte C o llier Glades H endry H ighlands Lee M art in
NPV 50 $4,609,492,133 $1,753,556,508 $3,037,706,282 $1,919,983,244 $1,162,162,385 $698,345,814 $424,886,022 $1,914,496,540
NPV 40 $3,109,313,065 $1,269,883,770 $2,155,116,915 $939,722,627 $853,459,336 $481,608,784 $267,666,580 $1,268,848,876
NPV 30 $1,896,237,894 $857,682,344 $1,407,512,215 $266,441,931 $571,550,030 $298,391,864 $145,288,674 $759,955,278
M iami-D ade M o nro e Okeecho bee Orange Osceo la P alm B each P o lk St. Lucie
NPV 50 $1,007,782,981 $844,489,817 $445,303,896 $1,933,953,018 $968,626,070 $5,004,265,681 $1,120,046,038 $1,129,391,846
NPV 40 $725,449,099 $592,881,240 $280,842,498 $1,157,340,508 $624,711,897 $3,478,682,745 $701,642,250 $764,492,361
NPV 30 $478,860,798 $377,843,554 $151,122,484 $587,782,360 $361,506,661 $2,205,447,197 $384,229,243 $472,188,362
Return on Investment,
water supply onlyTotal Benefits
Table 1 Value of Groundwater Purification and Aquifer Recharge Services from Everglades Restoration

x
Water Quality and Residential Real Estate Valuation
Impact of Improved Water Quality
We anticipate that a restored Everglades will improve the quality of surface water in the 16-
county South Florida Water Management District.
Water plays an important role in the determination of residential real estate values. Proximity,
type (ocean, bay, lake, river, etc.), view, size and quality are among the water attributes that are
valued by real estate buyers. For example, lakeside or seaside properties sell at a premium to
properties located away from bodies of water. A home on a clear stream trades at a premium to a
similar home on a polluted stream. Of course, water and its attributes are only a small part of the
bundle of attributes that determine a property‘s value. House size, quality of finish, proximity to
a city, and a great many other factors also play important roles. But imagine a thought
experiment of taking a given house and property on some body of water and changing nothing
but the quality of the water. Now observe the change in property value associated with that one
single environmental change. That thought experiment describes our method.
Economists have developed techniques to quantify the incremental value of environmental
attributes. One of the often used and robust techniques employed is hedonic pricing. This method
estimates the price people are willing to pay for individual product characteristics, such as a
swimming pool or air conditioning, and environmental goods, such as air and water quality,
holding other attributes constant. Studies consistently show that the water quality effect is
positive; that is, property located on or around high quality water is more valuable, other things
the same, than property located on or around lower quality water. The magnitude of this effect is
generally in the 0.5 percent to 7.0 percent range. That is, some level of water quality
improvement can have up to a 7 percent impact on real estate values. The same techniques also
find, for example, positive effects on air quality and negative effects on proximity to toxic waste
sites. These results are both intuitively and scientifically robust.
For the purposes of this study, our role is to estimate the impact on residential real estate values
that will derive from a restored Everglades due to improvements in water quality. The aggregate
owner-occupied residential real estate value in the 16-county SFWMD is approximately
$976.217 billion. Based on a survey of hedonic estimates of water quality effects, the elasticity
of real estate values with respect to water quality is .07054.9 Assuming that water quality, as
9A 100 percent improvement in water quality will produce a 7.054 percent increase in real estate values.

xi
measured by dissolved oxygen, can be returned to 1970 levels as a result of restoring the
Everglades, this implies that there is a potential 23.4 percent improvement in water quality.
Combining these estimates, we estimate the incremental value of a restored Everglades on real
estate across all 16 counties as:
$976.217 Billion .07054 X .234 = $16.08 Billion
This change represents a 1.65 percent increase in the aggregate value of real estate, which is
well within the range of typical studies on water quality effects. However, we have also done
what-if analysis, to examine the impacts based on different levels of water quality
improvements. The results of that analysis are reported in Table 2, which also lists the county-
by-county best estimates of additional ecosystem services forthcoming from cleaner surface
water via a restored Everglades. We also estimated the increased value of real estate by
assuming that nitrogen levels would not achieve the high levels of 2004 and 2005 hurricane
years. These estimates are also reported in Table 2.
Next we discuss the additional change in value of services relating to recreation and park
visitation that we expect will flow from restoration of this teapot we call the Everglades.

xii
CountyIncremental Real
Estate Value
Years Until
Water Quality
Goals Met
Potential Increase
in Real Estate
Value at 2.1%
Discount Rate
Broward 3,032,000,000$ 1 15,777,000,000$
Charlotte 261,000,000$ 2 15,452,000,000$ Basis 1% 5% 23% - Best Estimate 25% 50% 100%
Collier 974,000,000$ 3 15,134,000,000$ Suspended Solids Model 536,000,000$ 5,357,000,000$ 16,108,000,000$ 13,392,000,000$ 26,785,000,000$ 53,570,000,000$
Dade 4,379,000,000$ 4 14,823,000,000$ Nitrogen Model 689,000,000$ 6,887,000,000$ 17,216,000,000$ 34,433,000,000$ 68,865,000,000$
Glades 7,000,000$ 5 14,518,000,000$
Hendry 21,000,000$
Highlands 96,000,000$ Discount Rate 2.10%
Lee 1,058,000,000$
Martin 333,000,000$
Monroe 307,000,000$
Okeechobee 21,000,000$
Orange 1,561,000,000$
Osceola 340,000,000$
Palm Beach 2,807,000,000$
Polk 557,000,000$
St. Lucie 353,000,000$
Totals 16,108,000,000$
Real Estate Value Improvement - Best Estimate
Potential Real Estate Value Improvement Using Various % Change in Water Quality
Sensitivity Analysis
Table 2 Value of Everglades Restoration on South Florida Real Estate via Improved Water Quality

xiii
Recreation and Park Visitation Valuation
The Everglades are one of South Florida‘s main tourist and recreational attractions. The rivers,
lakes, and wetlands unique to the Everglades invite sightseeing, photography, bird watching,
manatee watching, camping, cycling, boat tours, sailing, airboat tours, canoeing, nature hikes,
kayaking, hunting, shelling, saltwater fishing, and freshwater fishing. Logic dictates that
Everglades restoration would increase the quality of these activities and, consequently, the
number of resident and non-resident visitors to the Everglades. This increase in recreational and
tourist activity translates to an economic value that we estimate here.
In economic studies similar to this one, sometimes, tourism is seen as a catch-all category. Here
we have tried to use a more laser-like approach and break tourism down into smaller categories
of recreation, park visitation, bird watching and wildlife habitat, hunting, and fishing. Thus, we
have no overall category called ―tourism‖ per se. However, our approach is deemed superior
because it subsumes all the sub-categories and avoids the temptation or problem of doubling
counting.
To estimate this economic value, we employed the travel-cost method. The basic premise of the
travel-cost method is that expenses people incur while traveling to a recreation site or tourist
destination represent the price of admission in the economic sense of opportunity cost. This
outlay of expenditures reflects the traveler‘s willingness-to-pay, that is, the value that a
recreationist or tourist places on accessing a particular site. By aggregating the travel
expenditures of all visitors to an unrestored Everglades, then projecting a marginal increase in
those expenditures attributable to Everglades restoration, we estimated the recreational and
tourism component of CERP‘s economic value.
Our approach has five stages. First, we collected historical data on park visitation in South
Florida.10
Because many recreationists and tourists who travel to the Everglades visit the area‘s
national parks, preserves, state parks, and sanctuaries, we assume changes in park visitation
reflect changes in overall tourist and recreational demands. Second, we used data from National
Park Service visitor surveys to determine the ratio of residents to non-resident visitors for each
park. Third, we estimated county-specific, per-person, per-day travel expenditure figures for both
residents and non-residents who visit the Everglades parks, preserves and sanctuaries.11
10 For the Everglades National Park, Big Cypress National Park, Biscayne National Park, The Dry
Tortugas, Loxahatchee National Wildlife Reserve and Corkscrew Swamp Sanctuary, we obtained data specific to
the total number of annual visits by their recreational activity. For the state parks, we obtained county-specific
visitor data. 11 There were ten counties with specific data on the average daily expenditure for non-resident tourists. For
counties that did not have a non-resident per day expenditure, we used an average daily expenditure of $104.00,
calculated by the Fish and Wildlife Conservation Commission for wildlife-viewing in Florida. To estimate resident
travel expenditures, we used the National Park Service visitor survey data to calculate an average per day resident
expenditure for counties that overlap with a national park: Collier, Monroe and Miami-Dade. For counties that did

xiv
In our fourth stage of analysis, we established a baseline of recreational and park visitation
expenditures by multiplying the county-specific resident and non-resident expenditures by the
number of resident and non-resident park visitors. Finally, in our fifth stage, we estimated the
marginal increase in recreational and park visitation expenditures under a 2 percent increase in
park visitation projected out 50 years. Preliminary regressions of water quality and tourist
expenditures confirm this to be a likely scenario. See Table 3.1.12
Table 3.1 Recreational and Park Visitation
Expenditures 2 Percent Increase over 50 years
County NPV Incremental Increase
Broward $103,206,003
Charlotte $58,458,420
Collier $178,150,740
Lee $122,795,151
Martin $13,306,731
Miami-Dade $201,075,047
Monroe $518,206,430
Okeechobee $987,239
Orange $25,849,076
Palm Beach $49,055,665
Polk $5,519,029
St. Lucie $34,978,795
Total $1,311,588,326
Our best estimate of the change in tourism valuation is based on a 2 percent increase over 50
years. This amounts to an increase in economic well-being of $1.311 billion in net present value
terms.
Open-Space Valuation
If completed, CERP will produce approximately 157,555 acres of preserved open space in South
Florida. In the absence of CERP, this land would likely be inaccessible to the public and or
developed as Florida‘s population grows. But with Everglades restoration pursuant to CERP, this
land will provide enhanced recreational opportunities and aesthetic benefits to the residents of
not have specific data on the per day expenditure for residents, we used the same FWCC wildlife-viewing report
which estimated an average daily expenditure of $58.00 for residents. 12 The counties not listed in this table have tourism benefits in other categories, hunting, wildlife viewing,
and fishing.

xv
South Florida. In this section we quantify these values.
To estimate the value of open-space preservation, we employed a multi-stage process. First, we
used data from the Trust for Public Lands to estimate type-specific and county-specific
willingness-to-pay (WTP) values per acre of preserved open space.13
We estimated type-specific
WTP values because open space preservation projects of different scale and proximity produce
different bundles of aesthetic and recreational benefits.14
Specifically, we grouped the open space
and conservation projects into three types: local open-space bond initiatives, state-wide
conservation projects and federally funded wetland preservation projects.
We estimated county-specific WTP values because the marginal value of open-space
preservation depends on numerous geographic and demographic variables such as population
density and proximity to population centers. Everglades restoration under CERP will encompass
restoration projects throughout South Florida, so using geographically specific values adds
precision to the open-space valuation.
Averaging across all counties, we estimated WTP values per acre of open-space preservation of
$12,133 for county projects, $4,505 for state projects, and $740 for federally funded wetland
projects. These figures comport with economic rationale; voters are willing to tax themselves at a
higher rate for open space that they can enjoy more often and more easily, that is, local open
space.
In the second stage of our analysis, we estimated county-specific open-space value ranges for
each CERP project. We did this by multiplying the county, state and federal WTP values by the
number of acres yet to be acquired under each specific CERP project. For instance, the ―Lakes
Park Restoration‖ project is in the ―Lower West Coast‖ CERP region and has a remaining 40
acres yet to be restored. Because the ―Lower West Coast‖ CERP region overlaps Hendry, Glades
and Lee counties, we multiply an average of those three counties‘ local ($12,133)15
, state
($2,716) and federal ($740) WTP values by 40 to estimate a range of open-space values
attributable to that particular CERP project. Our open-space value estimates for that project
range from $485,331 (local WTP) at the upper bound to $29,600 (federal WTP), with our best
estimate being $108,652 (state WTP).
In the final stage of our analysis, we aggregated the range of open-space values across the
remaining acres of each CERP project. We report these aggregations for county, state and federal
13 We gathered acreage and expenditure data by cross-referencing the Land Almanac and other
conservation databases reported by the Trust for Public Land. 14 For instance, a municipal park in Broward County generates significantly different open space values
than does a federally funded wetland restoration in Glades County. 15 Because we did not have data for local open space bond initiatives in these counties, we used the state-
wide average of $12,133.

xvi
WTP values. These type-specific value estimates define the range of possible open-space values
from Everglades restoration. Because CERP most closely matches the kind of open-space
preservation projects used to calculate the state-level WTP value, the state-level WTP estimate is
our best estimate of the total open-space value attributable to Everglades restoration under
CERP. That estimate is $830,733,000 in net present value terms.
Table 4.1 Open Space Valuation Increase from Everglades Restoration
CERP Region Counties
Open Space
Value Increase
Everglades Agricultural Area Palm Beach and Hendry $31,187,000
Everglades, Florida Bay, and
Keys Broward and Miami $318,739,000
Lake Okeechobee Watershed
Okeechobee, Glades, and
Highlands $30,509,000
Lower West Coast Hendry, Glades, and Lee $41,611,000
Miami Dade County Miami-Dade $115,507,000
North Palm Beach County Palm Beach $5,752,000
Upper East Coast Martin and St. Lucie $215,220,000
Water Preserve Area Palm Beach, Broward, and Miami $72,208,000
Total $830,733,000
Table 4.2 summarizes these calculations, our assumptions, and our sensitivity analysis.
Table 4.2 Changes in Value of S. Florida Open Space Associated with Everglades
Restoration
Lagged Response Possible Range of Values
Years Until
Increase
Begins
Present Value of
Delayed Increase Various WTP/Acre of Open Space
1 $813,646,000 Local State Federal
2 $796,911,000 $2,763,345,000 $830,733,000 $116,593,000
3 $780,520,000
4 $764,467,000
5 $748,743,000

xvii
Fishing Valuation
Everglades fishing is a big business, and it stands to be even bigger business if the Everglades
are restored along CERP guidelines. Florida is fishing. To best catch the changes in fishing
associated with restoration, we have broken our analysis into commercial and recreational
components. There is little difference, however, in the analysis or the methods used.
Commercial Fishing
We obtained data on commercial catch per species for each of the relevant South Florida
counties for the years 1986 through 2008.16
Earlier data are considered unreliable. We assumed
that restoration will enhance commercial fish catch, owing to increased sheet flow. We estimated
the change by comparing current levels to peak levels in the late 1980s. To be conservative, we
assumed that a restored Everglades would provide 75 percent of the difference between current
catch levels and catches in 1989, the first year in which there are reliable data.
The estimates for expected post-CERP value (75 percent of 1989) and total future dockside value
depend on the length of time it takes the fishery to recover after the Everglades project is
completed.17
We calculated future dockside value by summing catch in all Everglades counties
for each species, multiplying this by .75, then multiplying these estimated numbers for future
catch by the per-pound 2009 price for each species.18
We summed these values to obtain the
expected future dockside value post restoration. We estimate that there will be an increase of
$23,271,221 per year in catch, after the fishery is fully restored. This is a 43.3 percent increase
from current (2008) value. Table 5.1 shows the present value of commercial fishing value
increases over a 50-year period assuming a 0, 20-, and 30-year fishery restoration timetable.
16 Commercial catch data obtained from Steve Brown at the Florida Fish and Wildlife Research Institute;
this data can also be viewed at http://research.myfwc.com/features/view_article.asp?id=19224. 17 It is plausible that there will be a short period of diminished catch after Everglades restoration as salinity
levels adjust in Florida Bay and elsewhere. 18 This method may slightly overestimate the impact of recovery as fish prices may fall as larger quantities
are brought to market. At this point in our analysis we have not determined the geographic scope of the relevant fish
markets and hence cannot determine whether the increased catch will impact price.

xviii
Our best estimate is that commercial fishing catch will increase, in present value terms with a 2.1
percent discount rate, by a total of $524 million (assuming a 20-year time to full recovery for the
fishery).19
19 As a check on our estimates, we also estimated the change in fishery catch using data from the net ban
that went into effect in Florida in 1995. This method suggests that Everglades restoration will increase catch by
about 57 percent. To be conservative in our forecasts, we use the earlier, lower estimates already discussed.
Table 5.1 Estimates of Commercial Fish Catch Increase From Everglades Restoration
Time for Fishery to Recover After Everglades
Restoration
Discount Rate Immediately 20 Years 30 Years
2.1%
NPV
Increase $716,129,276
$524,131,653 $441,139,562

xix
Recreational Fishing
Largemouth bass is the most common freshwater fish targeted in the Everglades region.20
Thus,
we chose to use increase in recreational catch of bass as a proxy to estimate the increase in
economic benefits for recreational anglers due to CERP restoration.
On average, each recreational angler catches 59 bass each year in Southeast Florida, with an
estimated marginal value per fish of $4.32.21
The FWC 2006 survey of Fishing, Hunting and
Wildlife estimates that each angler in Florida spends 17 days fishing (this is an average of
residents and non-residents). Therefore, we estimated that on average, anglers currently catch
3.47 bass per day fishing.
We again assumed that restoration will restore 75 percent of total fish population, as used to
estimate the changes in commercial fishing catch. The estimates for commercial fishing suggest
that there is potential for a 49 percent to 56 percent increase in commercial fishing catch post-
CERP. It is assumed that this percent increase in commercial catch can likewise be applied to
recreational fishing.
We conservatively used the minimum estimate of a 49 percent increase in commercial fishing
catch for our estimate of increased recreational fishing catch. This provides a potential estimated
increase in catch per angler per day of 1.7 bass. The total number of fishing licenses sold22
in
2008 in the 16 Everglades counties was approximately 362,300.23
However, the FWC states, ―It
is important to note that only about half of Florida anglers actually have to purchase a license
due to various exemptions, so these numbers do not reflect participation.‖24
Therefore, we
multiplied angler licenses in Everglades counties by two in order to estimate the number of
anglers fishing in these counties. We assumed this number (724,600) is an appropriate, though
likely low-end, estimate for the number of anglers fishing in Everglades counties in a given year.
The FWC estimates the average number of days spent fishing per angler at 17, which leads to an
estimated 12,318,200 angler-days fishing in the Everglades. We multiplied this estimated
number of angler days by the estimated increase in Everglades recreational bass catch (per day,
per angler) post-CERP (1.7) to get an estimated increase of 20,940,940 bass caught each year.
The estimated increase in value due to restoration (based on a marginal value per bass of $4.32)
20 A survey of Everglades anglers by Fedler provided this information; 40 percent of saltwater angler days
are spent targeting largemouth bass. 21 http://myfwc.com/CONSERVATION/FishingBassConservationCenter_Value.htm. 22 This includes both residents and nonresidents for freshwater licenses, saltwater licenses and combination
licenses. 23 Stronge, W.B. The Economics of the Everglades Watershed and Estuaries: Phase 2 - 2010 Update of
Data Analysis (March 2010). Prepared for the Everglades Foundation. 24 http://myfwc.com/CONSERVATION/Conservation_ValueofConservation_EconFreshwaterImpact.htm.

xx
is then $90,464,861 for each year after restoration is complete.
Table 5.2 shows the present value of recreational fishing value increases over a 50-year period
using this estimate of a $90,464,861 increase in value each year after CERP is completed. This is
calculated for both a 20- and 30-year restoration period (assuming catch increases linearly over
those years), as well as for instant restoration.25
Our best estimate is that Everglades restoration will increase the value of recreational fishing by
a total of $2.04 billion in net present value terms.
Wildlife Habitat and Hunting Valuation
While fishing is a major recreational activity in Florida, hunting and wildlife viewing are popular
pastimes as well. In this section, we detail our estimates of these economic impacts.
There are two important hunting groups in the Everglades: deer and waterfowl (primarily ducks).
Restoration stands to impact hunting, it turns out, both positively and negatively. Deer have
moved into and flourished in the drained wetlands of the Everglades, and ducks have been driven
out. Restoration will reverse these recent trends.
Using data for 17 statewide Wildlife Management Areas, we computed the ratio of the economic
value of hunting in the WMAs located within the Everglades to the economic value of hunting in
WMAs statewide. From the lower-bound estimates for each WMA‘s value, we calculated the
ratio of hunting expenditures in the Everglades to the entire state. We then multiplied this ratio
by the U.S. Fish and Wildlife Service‘s estimate of the total economic value of hunting in
Florida, $377,394,000 annually. This method leads to a baseline estimate of $175,000,000 per
year that hunting in the Everglades contributes to the Florida economy.
Fluctuations in water levels are partly responsible for current high mortality rates among deer in
25 We also estimated the total number of anglers in Everglades counties using the ratio (number Everglades
counties)/(number counties in Florida) and multiplied this by the estimated 2.8 million anglers fishing in Florida.
We then used this ratio to estimate the number of anglers in the Everglades to recalculate the increase in bass caught
and increase in value. The results are numbers that are similar and suggest that either assumption is appropriate.
Table 5.2 Estimates of Recreational Fish Catch Increase From Everglades Restoration
Discount
Rate Time for Fishery to Recover After Everglades Restoration
Immediately 20 Years 30 Years
2.1% NPV
Increase $2,783,890,688 $2,037,516,539 $1,714,891,823

xxi
South Florida. CERP estimates that, with the restoration of the Everglades, white tail deer
populations will be reduced to pre-drainage numbers, but that deer mortality due to drowning
and starvation will decrease. CERP estimates suggest that deer hunting in Big Cypress National
Preserve should not be impacted in either direction, but that deer hunting in Everglades WMA
will be adversely affected. For purposes of this model, we assumed no net change in deer hunting
in Big Cypress and a decrease of 75 percent in Everglades and Rotenberger WMAs. The
decrease is due to lower deer populations and more difficulty in accessing huntable areas. While
CERP does not make the Holey Land or Rotenberger as wet as the Conservation Areas, we
assumed that the Rotenberger deer hunting would respond similarly to the Everglades. In effect,
as the discussion below reveals, we believe that this is a worst case scenario for deer. We further
assumed that Holey Land would undergo half the total effect of Everglades or Rotenberger,
because it is already partially rehydrated. It has already seen a notable transition from deer
hunting to waterfowl hunting as a result of these higher water levels.
The Everglades occupy the western portion of the Atlantic Flyway in Florida. Increasing year-
round water levels in Everglades and Rotenberger WMAs would provide more ideal habitat for
waterfowl. It would also induce a shift in hunting patterns in these areas from primarily deer
hunting to primarily duck hunting, as seen in Holey Land WMA after its restoration.
We used the rehydration of Holey Land WMA as a measure of the consequences of restoration
on hunting in the Everglades. This rehydration, which began in 1991, drastically changed
hunting patterns within the Holey Land WMA, and we expect a similar shift in the overall
Everglades. We used days of hunting to estimate percent changes.
While the marginal impact of Everglades restoration on hunting expenditures might be negative,
the expected change in wildlife-viewing expenditures is almost surely positive and far larger than
the potentially negative impact on hunting expenditures. The expansion of habitat produces
additional services, primarily through viewing of birds and other wildlife. We have already
computed the additional value of viewing by tourists. Here, we estimate the habitat impact on
resident viewings in and around their homes, local bird and wildlife watching. The increased
demand from restoration will also be reflected in increased expenditures on bird watching
equipment such as feeders, food and binoculars.
The U.S. Fish and Wildlife Service estimates that the State of Florida generates more than $3
billion in annual expenditures by wildlife watchers.26
Of the 1.5 million people who engage in
away-from-home wildlife watching each year, more than 1.1 million engage in waterfowl
26 Table 31; page 39; FWS – FHWAR. We conservatively excluded from our calculations the ―special
equipment expenditure‖ category because we are attempting to measure the habitat-only demand and not travel or
tourism-related demand. If we had included this effect, overall impact of restoration would be calculated to be much
higher. ―The special equipment‖ category of expenditures is large, as it includes RVs, travel trailers and the like.
Our intent here was to capture local viewing, not tourism. This avoids a potential double-counting problem.

xxii
watching and 1.29 million watch other non-game water birds. In comparison, only 421,000
engage in viewing of large land mammals.27
Using data for 17 statewide Wildlife Management
Areas, for purposes of scaling the state total to the region, we used as a proxy the ratio of the
economic value of hunting in the WMAs located within Everglades to the statewide value. We
then multiplied this number by the U.S. Fish and Wildlife Service‘s estimate of the total
economic value of wildlife watching in Florida, which was $3.08 billion annually. This leads to
an estimated value of $1.43 billion per year that non-consumptive wildlife recreation in the
Everglades contributes to the Florida economy.
The primary source of wildlife-watching value in Florida comes from bird-watching, primarily
of wetlands species, either waterfowl or wading birds.28
CERP estimates significant habitat
improvement for water-reliant bird populations, specifically waterfowl and wading birds. The
Everglades occupy the western portion of the Atlantic Flyway in South Florida. Consequently, a
large portion of migrating waterfowl pass through the Everglades on their way from Canada to
the Caribbean. Increasing year-round water levels in Everglades and Rotenberger WMAs along
with Everglades National Park will provide more ideal habitat for waterfowl and non-game
wetlands birds. It will also induce a shift in wildlife watching demand in these areas due to
increased quality relative to other areas.29
CERP estimates improved habitat for the following endangered species:
West Indian Manatee
American Crocodile
Snail Kite
Wood Stork
Cape Sable seaside sparrow
We estimated the baseline value of habitat and non-consumptive wildlife appreciation in the
Everglades. We used wading bird populations as our indicator metric for habitat value in the
Everglades. The University of Florida estimates that, just prior to drainage, there was a stable
population of approximately 70,000 mating pairs of wading birds. This is our reference
benchmark for restoration. Using 2006 bird populations, our conservative best estimate is that
restoration will return these numbers to 75 percent of the 70,000 mating pairs reference
benchmark. We then estimated the marginal impact of changes in species populations on demand
for viewing, providing an annual improvement in habitat value of approximately $424 million.
Though we have estimated a portion of these values in our recreation and park visitation model
which measures park visitation changes, wildlife viewing generates additional values not
27 Table 26; page 35; FWS – FHWAR. 28
Table 26; page 35; FWS – FHWAR. 29 CERP Sections 8.7 and 8.8.

xxiii
captured by our park visitation model. These values should be considered when evaluating
Everglades restoration, particularly to local residents who derive pleasure from the increased
number of animals residing around their homes. To fully capture the value of the impact of
restoration on wildlife habitat and hunting, we summed the values from habitat and hunting
calculations. Our best estimate is that Everglades restoration will increase wildlife habitat and
hunting services by $407.4 million annually.
As a final word about habitat and hunting, it is important to note that the impact on hunting will
only be negative if significant numbers of deer hunters do not transition to duck hunting as duck
populations expand. The experience with Holey Land restoration suggests that it is complicated
to forecast the impacts on hunting associated with expansive additional CERP restoration. On the
one hand, it appears that additional duck populations attract people to duck hunting, and this is
reasonable from the point of view of economic theory. It may also be true that existing duck
hunters will chose to hunt locally more often and forego trips to distant duck hunting areas such
as Louisiana, but we cannot estimate these shifts with any precision. In order to be conservative,
we have assumed a very low elasticity of substitution between deer and duck hunting and a low
elasticity of new duck hunters. Accordingly, our negative estimate on hunting is probably biased,
and the likely outcome is not so dire. Additional information on hunter switching could refine
this estimate.
Other Everglades Valuations, Miscellany
There are four broad areas of ecosystem services that, at present, we have not conclusively
valued that might be forthcoming or enhanced as a result of Everglades restoration: the potential
for carbon sequestration, potential fire-damage reduction, the potential for enhanced water
purification, peat accretion and soil build-up, and the option value of unknown compounds and
life forms living in the Everglades. While these values stand to be real and to change in
important ways as the Everglades are restored, we are not prepared at this point in time to offer
estimates of the pro forma financial calculations for two reasons. First, the science of these
services is somewhat unsettled and unclear, compared to the other services, and second, the
markets for these services are immature and undeveloped. Hence, while there is rampant
speculation about how these services might be highly valued and special, we are not presently
prepared to put hard numbers to these theories, regardless of what they might turn out to be.
We can note that if the world moves to a market for carbon sequestration, and such markets are
developing, the amount of carbon sinking in the Everglades could be important. Our best
estimate at this time is that the amount of carbon sequestered is small, but we have low
confidence in that assessment. Moreover, the future of these markets is highly uncertain. So
basically, while we acknowledge the potential for important values of carbon sequestration
services and changes that might flow from restoration, in order to maintain our conservative

xxiv
stance, we will not add any hard numbers. As time proceeds, we will revisit our position on this
topic.
Another topic for further study is the potential for Everglades restoration to improve South
Florida‘s water quality in ways not captured by our real estate and recreation value estimates.
Because wetland ecosystems are known for effectively filtering nutrients, we suspect a restored
Everglades would produce significant cost savings in water treatment and create opportunities to
improve poor water quality. In particular, we have researched the potential for CERP to reduce
water quality treatment costs, beach closures and health impacts in South Florida. However, we
have chosen to omit the corresponding valuations from this report because there exists
significant disagreement in the scientific community over the connection between nutrient
reductions and such water contamination cost drivers as harmful algal blooms, beach clean-ups,
and shellfish poisoning.30
Like carbon sequestration, this topic should receive additional
attention as this research continues and progresses.
A third topic we might investigate further is the potential value of unknown compounds and life
forms in a restored Everglades. These are commonly called ―biodiversity values,‖ and we have
found evidence of nascent markets in biodiversity. Michele Zebich-Knos reports on a contract
between Merck Pharmceuticals and INBio, an NGO in Costa Rica for biodiversity
development.31
The amounts of money at play in this market are not fully public. We are
confident that there are others, and this appears to be a fertile area for further analysis. At
present, however, given the high levels of uncertainty, we are not prepared to put hard and fast
estimates to these option values. Given the scientific and policy uncertainty over these topics, our
omission makes our valuation estimates more robust. However, future work should probably pay
close attention to developments here.
There is speculation that the current Everglades is more fire prone because of reduced sheet flow.
Fire has been a part of life throughout the nature history of the Everglades, but the real issue here
is: How might one go about modeling the reduction of fire and then estimating the economic
impact of fewer and less severe fires? According to our principle of a conservative approach to
estimating benefits, we refrain from including any air quality or other impacts that a restored
Everglades might have on fire duration, intensity or frequency. With that said, we suspect that a
restored Everglades might likely have fewer fires or ones of less severity. And, we know that fire
can create negative economic impacts. Fires in the Everglades, as they do elsewhere, cause air
quality issues via smoke, plus they stand to destroy valuable property. Thus, reduced fires, if
they were to be a result of Everglades restoration, would count as an additional benefit. Clearly,
30 See Chapter 7 in the main document for additional discussion on this topic. 31
―Preserving Biodiversity in Costa Rica: The Case of the Merck-INBio Agreement.‖ The J. Of
Environment and Development, 6(2)(1997).

xxv
additional work is warranted here.
Impact On Job Creation And Earnings
Restoration of the Everglades through the implementation of CERP will impact jobs in the state
of Florida. Changes to the different ecosystem services in the Everglades will impact the number
of jobs in a variety of industries and the economic activity they generate. In addition, the Corps of
Engineers estimates there will be 22,000 jobs created as a result of the actual restoration projects.32
It is very important to understand that jobs are not an additional benefit above and beyond the
present value calculations we have already presented. Instead, they are an alternative way of
representing the overall change that is likely to be forthcoming from restoration. Economists
often speak of a circular flow of economic activity where firms purchase inputs (land, labor,
capital and the like) from households in order to engage production. As compensation for the
release of these inputs, households are paid income (sometimes broken into finer gradients called
wages, interest, rents and profit). Firms then sell the outputs made from the inputs to households
in exchange for money. According to this logical truism, one may count the sales of the goods
and services as one measure of the output of the firms, but one might also count the value of the
inputs consumed. They have to be equal by the accounting identity. Jobs then are a loose or
casual way of talking about the extent of economic activity being one of the primary inputs to
production (and hence consumption). Most academic economists would prefer to discuss the
sales of the output of the firms rather than the jobs used in production, but for some reason or
another, policy makers, pundits and politicians seem to prefer the jobs numbers approach. For
sure, jobs are easier to calculate and perhaps easier for lay people to appreciate. Our point here is
to respond to that latter audience, but it would be a big mistake for anyone to interpret our
discussion here as additive. The jobs are not in addition to the calculated benefits. They are an
alternative way of visualizing the impact of Everglades restoration. We urge the reader to be
careful and cautious on this point.
Our approach to estimating net job creation relies on an input/output model that uses data
generated by the key components of this study (inputs) to estimate the number of incremental
jobs and earnings as a result of CERP (outputs). We calculated outputs using jobs and earnings
(or total economy) multipliers from different sources. Unless otherwise specified, we used total
economic output multipliers to reflect the impact on the broader economy (direct, indirect and
induced jobs). In some cases, we used only direct multipliers to avoid overlap (double counting)
among the different sectors. We used the following key inputs and multipliers:
Commercial Fishing
32 See Kopecky report, January 22, 2010.

xxvi
Input: Incremental dockside value of commercial fisheries (finfish, invertebrates and
shrimp).
Multipliers: Fishing producer employment multiplier (jobs/$ billion export value) from
the USDA Economic Research Service and Total Economy multiplier.
Recreational Fishing
Input: Incremental saltwater and freshwater anglers and expenditures in the Everglades
region. We used a modified (50 percent) tourist (visitor) yearly growth-rate to determine
the increase in anglers to the region (using the 2 percent tourist growth scenario). The
incremental number of anglers (over a growing base) due to a restored Everglades was
multiplied by average yearly ―fishing-only‖ expenditures (to avoid overlap with
tourism—shopping) to calculate incremental expenditures.
Multipliers: Employment (jobs per $ million) and earnings (not total economy to avoid
overlap with tourism) from Tony Fedler‘s report: ―The Economic Impact of Recreational
Fishing in the Everglades Region.‖
Residential Construction & Real Estate Services
Input: Incremental value (from the "Potential Value Increase based on 23 percent
Improvement in Water Quality" scenario) and subsequent activity in residential
construction and real estate services. Elasticity between "increase in real estate value" and
"increase in construction activity" was set at 0.5.
Multipliers: Residential construction and real estate multipliers (Direct + Indirect +
Induced) we calculated from ―Shimberg Center for Affordable Housing; THE IMPACT
OF RESIDENTIAL REAL ESTATE ON THE FLORIDA ECONOMY; 2005 update
(Using Roll Year 2004 Property Appraiser Data).‖
Park Visitation
Input: Incremental visitors and expenditures in local park visitation by specific NAICS
sector:
o Hotel and lodging
o Eating and drinking establishments
o Transportation
o Retail trade (shopping)
o Entertainment
Multipliers: Total effects multipliers from the REMI II model (from the MGM2 model,
the University of Michigan). We utilized Large Metro, Small Metro and Rural multipliers
depending on the specific county.
Agriculture
Input: Decrease in crop acreage (mostly sugar cane = 88%) due to repurposing for
stormwater storage and treatment. We used the EAA Water Retention Scenarios –

xxvii
Agricultural Income Loss model (Marcel Aillery, et al) to determine the present value of
income loss in an STA+RS (Stormwater Treatment Area + Reservoir = 83,500 acres)
scenario. We used a 2.5 adjustment factor to include other crops and potential further
land acquisitions.
Multipliers: We used the USDA Economic Research Service ―Sugar Cane and Sugar
Beets) producer employment multiplier.
Table 8.1. Summary of Jobs Impact Results
Sector Incremental Jobs
Commercial Fishing 6,798
Recreational Fishing 36,868
Residential Construction & Real Estate Services 273,601
Tourism (Lodging, Eating & Drinking, Transportation, Retail, Entertainment) 48,552
Agriculture (3,724)
Wildlife Habitat & Hunting 80,569
TOTAL 442,664
In addition to the jobs created by the impacts restoration, there will be jobs created to do the
actual work of restoration. The Corps of Engineers estimates that there will be approximately
22,000 jobs created in the construction projects detailed below in Table 8.2 as reported in
Kopecky (2010). Table 8.2 is reproduced, unaltered, from that report.
Table 8.2. Direct Job Creation as a Result of Construction, COE Estimates33
Appropriation requests were run through IMPLAN (Minnesota IMPLAN Group) software. This is an input-output analysis that attempts to project employment, output and earnings for a given change or event in the economy’s activity. This model is typically set up to run at regional levels, but contains a National function as well and this is what was analyzed. There are three types of effects
Direct effects take place only for the industry immediately affected:
Indirect effects concern inter-industry affects
Induced effects measure the effects of the changes in household income. These
changes effect the related industries employment.
The category of construction used was Sector 36 (Construction of other new non-
residential). This is the closest to our construction technique.
33 See Kopecky (2010) which is reproduced here exactly.

xxviii
South Florida Water Management District Job Creation in Everglades Restoration
AS RUN BY COE USING IMPLAN February 1, 2009
Project Appropriation Request
Direct Indirect Induced Total
Herbert Hoover Dike Rehabilitation (3)
$77,000,000 645 382 510 1538
C-44 Reservoir and STA
$363,000,000 3042 1801 2406 7249
C-43 Reservoir (1) $473,000,000 3963 2347 3135 9446
Kissimmee River (3) $31,000,000 260 154 205 619
Picayune Strand /FAKA Union Pump Station Works and
Road Removal
$57,000,000 478 283 378 1138
Picayune Strand /Merritt Canal Pump Station Works and Road Removal (3)
$52,000,000 436 258 345 1038
C-111 Spreader Canal $35,000,000 293 174 232 699
C-51/STA1E $8,000,000 67 40 53 160
L31 North Seepage Pilot Project (3)
$5,000,000 42 25 33 100
Seminole/Big Cypress (3)
$3,000,000 25 15 20 60
TOTALS(SFWMD PROVIDED)
$1,150,000,000 9636 5707 7623 22966
On Restoration Costs
Since CERP was ratified 10 years ago, it has become obvious that certain aspects of it were
either unreasonable or inappropriate. Accordingly, for this analysis, the original CERP storage
projects have been replaced with an alternative storage approach. This adjustment was made due
to reasonable doubts that have been raised regarding the feasibility of the original storage options
and their estimated costs. In addition, there exists a viable alternative storage method with sound
cost estimates. CERP‘s original cost estimate included costs for the Lake Okeechobee ASR, In-
ground reservoirs, and the EAA reservoir. In 1999 dollars, these three projects cost $2.6 billion,
which represented 33.2 percent of the total $7.8 billion CERP cost. Since the original plan was
completed, the feasibility and costs of these storage options have been reconsidered, and it is

xxix
likely these costs were underestimated by a considerable amount. For our cost estimate, we have
removed these costs from the CERP estimate and replaced the three storage projects with the
River of Grass Reservoir storage option that has an estimated cost of $3.2 billion in 2010 dollars.
The net effect of these changes is to adjust the total Everglades restoration costs to $11.5 billion
in 2010 dollars.
Notes
Diamonds and Water
Economics has a conundrum called the diamond-water paradox. This conundrum ponders why
diamonds, which are so unnecessary to life, are so valuable while water, so necessary, is so
cheap. The paradox is resolved by noting that the prices of diamonds and water are marginal
valuations to society of an additional unit of each, not the total or average value. The implication
of this line of reasoning is profound. For instance, professional football players earn a much
higher salary than do high school teachers, yet it is almost surely true that the value of high
school teachers to the world exceeds the total value of football players. Marginal values do not
reveal total values.
So it is with ecosystem services (or any other product for that matter). Accordingly, if we were to
capture the total value of Everglades restoration, we would have to engage a more complicated
and detailed process. Suffice to say here, our estimates are not total estimates. They only capture
a portion of the total value of restoration. There is considerable consumer surplus, to use
economic jargon, that is not captured by our methodology. Thus, our approach understates the
total value to society of spending resources to restore the Everglades. Indeed, based on other
studies, our gut feeling is that the true total benefits are several times larger than our marginal
valuation estimates.
Consider Figure 2. Our calculations reported here effectively estimate the shaded area labeled E.
There is potentially a much larger area, labeled CS, that represents economic well-being, or
willingness to pay, which buyers or consumers of services obtain without paying for them. We
call this consumer surplus. It is the unrequited or unpaid-for happiness that a consumer gets from
a purchase, above and beyond the purchase price. We have not attempted to estimate this
component of economic system services, but as the graph suggests, the area of CS can be
substantially larger than the area of E, depending upon the price elasticity of demand for the
particular service. As our work progresses, we will attempt to assay and estimate these
valuations. They are important to any properly conceived analysis of economic wellbeing or
welfare.

xxx
Figure 2 Product expenditure and consumer surplus
Regarding the effect of restoration on jobs, from the point of view of economic well-being or
welfare, the important consideration is not total jobs, but incremental welfare above and beyond
the opportunity cost of time or leisure. In a way similar to consumer surplus, most workers are
paid wages higher than the underlying value of their time. This is called economic rent or
producer. This is measured by the triangle above the supply curve of labor. Therefore, while
many people view jobs as an economic good, the real increase in welfare comes not from
employment, but from wages higher than the lost alternatives of leisure or home production. We
have not estimated these additional benefits in our analysis, but suffice to say that, like the
uncounted consumer surplus we mention, it stands to be important and non trivial. Our omission
of this additional welfare makes our estimate of return on investment even more conservative.
Outrunning the Bear
At the outset of this evaluation, we promised to execute our assignment according to best
practices and methods of economic science. We believe we have lived up to this promise, and we
invite all readers to evaluate our success. It bears noting that one of the time-honored tenets of
economic methodology, owed to Nobel Laureate Milton Friedman (and many others) is the
concept that it takes a theory to beat a theory. In this spirit, while readers may criticize or
disagree with our assumptions and techniques here, any such complaints will fall on deaf ears
unless a superior alternative is proposed. Put bluntly, we will not accept criticism that simply
says, ―Your assumptions are wrong.‖ Let the critic propose adequate or superior alternatives.
What this means in practical terms is that our work need not be perfect in order to be useful and

xxxi
acceptable. It just needs to be better than the rest. This does not mean that we believe we have
done our job as well as it can be done. Rather, it is meant to convey that our minds are open to
suggestions of better ways to do this project but not to simple statements that our work is wrong
or incorrect. The Olympic Gold Medalist need not set a world record to climb to the top of the
podium at the medal ceremony. She only need outrun the woman in second place. Of course, we
hope that each piece of our work ―sets a world record,‖ but we will sleep soundly if our work is
better than any other work tendered or suggested.

0
DDeettaaiilleedd RReeppoorrtt SSeeccttiioonn
MMeeaassuurriinngg tthhee EEccoonnoommiicc BBeenneeffiittss ooff AAmmeerriiccaa’’ss
EEvveerrggllaaddeess RReessttoorraattiioonn An Economic Evaluation of Ecosystem Services Affiliated with the World’s Largest Ecosystem
Restoration Project

1
Introduction
The Everglades is a vast ecosystem comprising approximately three million acres, a sub-tropic
wetlands covering a significant portion of South Florida. The wetlands system is fed by rain and
water from Lake Okeechobee which is filled locally and by the Kissimmee River, which flows
into the lake from the North. Figures 3 and 4 show the vastness of the wetlands ecosystem. Note
to the obvious, because of the climate and ocean resources, this is a popular place for humans.
The population of Miami-Dade County alone is approximately 2.5 million people and has grown
by 11 percent over the past decade.34
According to official documents from the State of Florida:
The Everglades Ecosystem extends from the Chain of Lakes south of Orlando to
the reefs beyond the Florida Keys, an area covering 18,000 square miles.
Historically, freshwater moved south from Lake Okeechobee to Florida Bay in a
broad, slow moving sheet—120 miles long and 50 miles wide but less than a foot
deep—creating the Everglades. Known as the River of Grass, the Everglades is
the second largest wetland on the planet. The Everglades is an enormously rich
ecosystem, providing habitat to hundreds of species of birds, fish and other
wildlife. In the late 1800s, primitive canals were dug to drain the vast wetlands in
South Florida. Additional alterations continued throughout the 20th century, as
more than 1,700 miles of canals and levees vastly changed the landscape,
interrupting the Everglades‘ natural sheet flow and sending essential freshwater to
sea. An astounding 2 million acres, or more than half the Everglades wetlands,
were lost to development. Marjory Stoneman Douglas was the first to publicize
the problems of the Everglades in 1947, describing an ecosystem that was
beautiful yet already clearly suffering. Just one year later, in 1948, a massive
project to provide essential flood protection and water management to South
Florida was approved. While the Central and Southern Florida Project allowed the
region‘s rapid growth, it worsened the Everglades‘ problems. The project includes
about 1,000 miles of levees, 720 miles of canals and almost 200 water control
structures. Much of the drained area became sugar farms or was heavily
urbanized.35
Everglades National Park sits in the midst of the ecosystem and occupies nearly 1.4 million
acres:36
Everglades National Park is a subtle place where earth, water and sky blend in a
34 Demographic details of each county in the region are reported below in Table 1. 35 http://www.dep.state.fl.us/ern/restoration/default.htm. 36 http://www.everglades.national-park.com/info.htm.

2
low, green landscape; where mere inches of elevation produce distinct changes in
vegetation; and where a great wealth of birds and other wildlife find refuge. For
this is almost exclusively a biological park dedicated to the preservation of a
complex and precisely ordered living mechanism. It lies at the interface between
temperate and sub-tropical America, giving a rich diversity of species, many at
the limit of their ranges.
The topography is so subdued that a broad sheet of water slowly flows over and
through the porous limestone bedrock on its way to the sea, rather than following
well-defined valleys. Most of the park is actually covered with water during
normal wet seasons, while dry winters cause fresh water to dwindle to a few open
areas crowded with wildlife.
The great floral variety of the Everglades is one of the key resources of the park.
Among its more prominent and colorful plants are Bromeliads and epiphytic
orchids. As many as 25 varieties of orchids are known to occur in the park, in
addition to over 1000 other kinds of seed-bearing plants and 120 species of trees.
Over 36 threatened or endangered animal species reside in Everglades National
Park, such as the American alligator (Alligator mississippiensis) and crocodile
(Crocodylus acutus), the Florida panther (Felis concolor coryi), the West Indian
manatee (Trichechus manatus), and the Cape Sable seaside sparrow
(Ammodramus maritima mirabilis). More than 300 species of birds have been
recorded, seven of which are rare or endangered.37
This is a populated wetland, creating a trove of troubles with many actors occupying what is now
little space. Resource conflicts are common in many places on the planet, but this area seems to
have more than its fair share.
37 http://www.everglades.national-park.com/info.htm.

3
Figure 3 Everglades

4
Figure 4 The Details of the Ecosystem
The sixteen county region of Florida that covers the area of the Everglades is economically and
demographically diverse. Table 1 reports summary statistics on these counties, and it is
noteworthy that, like the biodiversity in the surrounding natural environment, there is rich
demographic diversity amongst the people in this portion of Florida.

5
County
Land area in
acres
Population in
2009
Population
Density,
persons/sq mi.
Percentage
Change in
Population Since
2000
Housing
Units, 2008
Median Value
of Owner
Occupied
Housing, 2000
Total Retail
Sales in 2002 (in
1000s)
Broward 1,205.4 1,766,476 1,465 8.8% 805,772 $128,600 22,012,210$
Charlotte 693.6 156,952 226 10.8% 101,223 97,000$ 1,434,629$
Collier 2,025.3 318,537 157 26.7% 193,808 168,000$ 4,196,902$
Miami-Dade 1,946.1 2,500,625 1,285 11.0% 979,082 124,000$ 24,568,286$
Glades 773.6 10,950 14 3.5% 6,079 72,400$ 7,812$
Hendry 1,152.5 39,594 34 9.3% 13,359 71,500$ 297,216$
Highlands 1,028.3 98704 96 13.0% 55,377 72,800$ 737,104$
Lee 803.6 586,908 730 33.1% 364,932 112,900$ 6,365,752$
Martin 555.6 139,794 252 10.3% 75,920 152,400$ 1,921,445$
Monroe 996.9 73,165 73 -8.1% 53,813 241,200$ 1,183,949$
Okeechobee 773.9 40,241 52 12.1% 16,731 77,600$ 335,976$
Orange 907.5 1,086,480 1,197 21.2% 460,600 107,500$ 12,403,154$
Osceola 1,321.9 270,618 205 56.9% 120,997 99,300$ 1,751,198$
Palm Beach 1,974.1 1,279,950 648 13.2% 640,851 135,200$ 16,480,821$
Polk 1,874.4 583,403 311 20.6% 280,609 83,300$ 4,522,310$
Saint Lucie 572.5 266,502 466 38.3% 132,341 86,100$ 1,886,487$
TOTAL 18,605.23 9,218,899.00 7,212.98 4,301,494 1,829,800$ 98,218,764$
AVERAGE 1,162.83 576,181.19 495.50 17.5% 268,843.38 114,363$ 6,256,578$
Source: US Department of Census at http://quickfacts.census.gov/qfd/states/12000.html
Table 1
Demographic and Economic Facts, 16 county South Florida Region

Copyright 2010 Everglades Foundation and Mather Economics 6
For example, Glades County is rural and basically unpopulated, 14 people per square mile, as
compared with Broward County, which has over 1,400 people per square mile. The owner-
occupied housing in Monroe County is worth more than $241,000 per home (year 2000)
compared with Hendry County where the median owner-occupied home was worth $71,500 in
2000. Some of the counties are bustling metropolises, Miami-Dade, Broward, Palm Beach, and
Orange counties as examples with billions of dollars of retail sales per year (2002), while others
are small, remote, and rural with miniscule total retail sales of less than $10 million for the year
2002. Against this backdrop and landscape we have been commissioned to estimate the
economic impacts of the proposed Everglades restoration plan.38
There is a well vetted plan to restore the Everglades to which we reference all our work. This is
the Comprehensive Everglades Restoration Plan (CERP).39
There are many folk who have
proposed alternatives and additions to this plan.40
We have not, at this point, evaluated any of
these alternatives, save one.41
With that said, the proposed rewards of this investment, somewhat
surprisingly, have not, until now, been measured with any degree of scientific or economic rigor.
The benefits of Everglades restoration, according to CERP, while arguably noble and substantial,
are not precise:
The Plan's focus has been on recovering critical ecological features of the original
Everglades and other parts of the ecosystem. The Plan will restore natural flows of
water, water quality and hydroperiods. The removal of more than 240 miles of internal
levees and canals will improve the health of more than 2.4 million acres of the South
Florida ecosystem, including Everglades and Biscayne National Park. The restoration of
hydrologic conditions of the original natural areas of the South Florida ecosystem will
result in Lake Okeechobee once again becoming a healthy lake. Major benefits will be
provided to the Caloosahatchee and St. Lucie estuaries and Lake Worth Lagoon. The
Plan will also improve fresh water deliveries to Florida and Biscayne bays. The greater
38 ―In 2000, Congress passed the Water Resources Development Act, authorizing the Comprehensive
Everglades Restoration Plan. The State of Florida and federal partners—the U.S. Environmental Protection Agency,
Army Corps of Engineers and Department of Interior—are deeply committed to Everglades restoration. The primary
state agencies charged with carrying out the restoration are the Department of Environmental Protection and the
South Florida Water Management District. Since 2000, Florida has invested more than $2 billion to restore water quality and flow in America‘s Everglades.‖ (http://www.dep.state.fl.us/ern/restoration/default.htm).
39 http://www.evergladesplan.org/index.aspx. 40 The many details of CERP are outlined in a number of fact sheets which are viewable online at
http://www.evergladesplan.org/facts_info/fact_sheets.aspx. 41 Our project is based on an adjustment to the original CERP which replaces artificial injection of water
into underground aquifers with the River of Grass concept. We offer details on this adjustment in more detail below.

Copyright 2010 Everglades Foundation and Mather Economics 7
Everglades ecosystem will be much healthier than it is today. Improvements to native
flora and fauna, including threatened and endangered species, will occur as a result of
the restoration of the hydrologic conditions.42
Essentially, we do not argue or take any position on any aspect of the proposed restoration.
We view ourselves as appraisers or estimators, not engineers or policy makers. We do not
engage the job of deciding how the Everglades should be restored, whether it should be
restored, who should pay for it if it is, when it should be done, or on what schedule. Instead,
we approach our assignment from the perspective of the benign economic scientist, asked to
render a fair, but conservative, estimate of the overall impact of the proposed restoration.
Nothing more, nothing less.
Our Assignment
In February of 2010, we were asked by the Everglades Foundation if we could provide an
economic analysis of the ecosystem service changes that would be associated with the
Comprehensive Everglades Restoration Plan.43
We took this task literally. This means that we do
not do any of the following:
1. We do not evaluate or estimate the costs of restoration. We take these as a given, per se.
Some have suggested that the estimate of costs is not accurate or appropriate. Be that as it
may, we were not assigned that task and have not engaged it in any important way.
Rather, we have relied upon cost estimates provided by the Corps of Engineers to the
Congress and to the public.
2. We do not estimate the marginal or step-wise benefits of any particular portion of the
CERP plan. Our approach is total. We look at the entire project as a whole.
3. We do not evaluate the scientific certainty or appropriateness of any of the CERP plan.
Again, we take the plan as others have prepared it and estimate the benefits of it with the
plan as a given.
4. We do not estimate any probabilities of the plan actually going into effect. We assumed
that CERP will be implemented as described and planned.
42 http://www.evergladesplan.org/about/rest_plan_pt_08.aspx. 43 http://www.evergladesplan.org/index.aspx provides information on this project. The information that
follows in our discussion here was taken primarily from this source.

Copyright 2010 Everglades Foundation and Mather Economics 8
Our Methods, Approach and Assumptions
There are many ways to estimate the value of an asset. We take the revealed preference
approach, which means we only use data from actual transactions of people buying things. Other
methods include contingent valuation and survey techniques. These methods have their place,
but not in our work. We approach the problem of valuation using market data and real
transactions and we do not use survey data or other methods to approximate what people might
pay for a good or service. There is significant literature on these methods, but we are dedicated
to avoiding speculation as much as possible, and hence we only use actual market transactions as
metrics of people‘s willingness to pay. For a starting point on this discussion, consult Harberger
(1971).44
For instance, when it comes to valuing cleaner water, we estimated the increase in value of real
estate associated with water quality improvements caused by Everglades restoration. While we
or others could ask people how much they might pay for an increase in water quality in their
neighboring streams, we believe that method is fraught with issues that we seek to avoid. For
instance, it is very hard for people to estimate how much they might pay for an environmental
service, particularly when they cannot perfectly visualize what it is they are being asked to price
hypothetically. On a related note, if survey respondents don‘t actually have to pay for the
environmental service, they might artificially inflate their response so that they appear and feel
more environmentally conscious. Our technique avoids these issues by only using prices actually
paid by real people for real goods and services.45
The benefits that will flow from a restored
Everglades are a capital asset in that the services will accrue over time. In order to compute a net
present value of these flows of services, it is necessary to discount the future returns or services
to the present. We made no adjustment for inflation; all our calculations are in 2010-dollar terms,
discounted to the present. As such, we make no assumption about the adjustment of relative
prices over time. In effect, we assume that relative prices remain constant at 2010-dollar levels.
We used the current municipal bond rate in South Florida, minus the current inflation rate to
discount the future expected flows of services. This rate as of spring 2010 was 2.1 percent. We
44 Harberger, Arnold C. "Three Basic Postulates for Applied Welfare Economics: An Interpretive Essay."
Journal of Economic Literature, 9(3), (1971): 785-97. 45 For additional information on contingent valuation and criticism of that method, see Glenn Harrison.
―Valuing public goods with the contingent valuation method: A critique of kahneman and knetsch.‖ Journal of
Environmental Economics and Management, (November 1992): 248-257 among a host of others. See also Peter
Diamond and John Hausman. ―Contingent Valuation: Is Some Number Better than no Number?‖ Journal of
Economic Perspectives, 8(4), (Autumn 1994): 45-64.

Copyright 2010 Everglades Foundation and Mather Economics 9
note that the current U.S. Treasury inflation adjusted bond rates, depending upon maturity date,
span our choice of discount rate. The 10-year TIPS bonds issued on July 15, 2010 have a yield of
1.295 percent. The 30-year TIPS bonds issued on February 26, 2010 are currently carrying a
yield of 2.229 percent. Accordingly, we suggest that our discount rate of 2.1 percent is
appropriate and conservative.46
As economists, in any attempt to measure value there is always a tension which arises from
something we call the diamond-water paradox.47
Essentially, there are two ways to measure the
value of a product. One is the expenditures paid by consumers and received by sellers. This is the
price of the product or service times the quantity purchased. In economic jargon, this is called the
rectangle of expenditure or simply the rectangle. This metric is simple, straightforward and easy
to calculate under most circumstances. More meaningful in many situations, however, is the
concept called consumer surplus, which measures the additional or unrequited joy that a buyer
gets, above and beyond the price paid, which is also a measure of economic welfare. This
additional value that consumers place on their purchases is sometimes called the triangle of
consumer surplus (as opposed to the rectangle of expenditure). In fact, most economists take the
position that the total value of an asset is not just what the buyer might have paid for it, but the
price paid plus the additional amounts that buyers would be willing to pay. Note carefully that
this is not the same as contingent valuation.
Contingent valuation is ascertaining or estimating what something might be worth in the absence
of a market or transaction or budget constraint. Consumer surplus is the value that a buyer
receives above and beyond the purchase price of a good or service that is transacted in the
marketplace.48
Why is this important? We discuss consumer surplus in more detail below, but for now suffice to
say that the actual benefits from Everglades restoration, according to standard economic theory,
include not only the direct expenditures, which we measure, but also the consumer surplus which
we do not measure. We choose not to measure the consumer surplus in this case for two reasons:
46 These data were taken from http://www.treasurydirect.gov/RI/OFNtebnd. 47 It is not exactly clear who first coined this phrase, but the concept and its importance are discussed in
virtually every principles of economics textbook published in the last century. We discuss this topic in more detail
below. 48 Estimating consumer surplus requires knowledge or estimation of the consumer‘s entire demand curve,
not just the point of purchase. In that sense, it is somewhat like contingent valuation, but yet very different as there
are empirical methods for estimating the actual demand curve that vary considerably from the techniques of
contingent valuation.

Copyright 2010 Everglades Foundation and Mather Economics 10
first, measuring consumer surplus is a difficult, expensive and time-consuming chore; and
second, our approach is conservative and avoids controversy. This means that our estimates of
benefits associated with restoration are very conservative, perhaps by a factor of two or three
times.
One of the ways we have chosen to be transparent and conservative is to offer sensitivity
analysis. For instance, we project that most benefits will persist for 50 years, and therefore, we
compute the present discounted value of restoration gains out to the year 2060. However, we also
present estimates over just 30 and 40 years as well. As another example, in the case of fisheries
restoration, the science, as we have come to understand it, does not offer us a precise estimate as
to when fish populations will return to their natural levels. To cope with this uncertainty, we
computed gains in fishing from restoration under different scenarios, immediate restoration, 20
year lagged restoration, and 30 years for the fisheries to fully restore. Details of this method are
discussed below.
Our approach is designed to let readers and critics see our methods and assumptions. This allows
readers to make alternative assumptions about facts yet revealed in order to make their own
conclusions. We chose this conservative approach because the future is uncertain, and a
modicum of restraint seems appropriate given the risk and uncertainty about such a large project
as CERP. Furthermore, we are striving to be reasonably non-controversial. In the end,we believe
that our methods are based on the best, sound science. If anything, we expect that our critics
might assert that our estimates of benefits of Everglades restoration are too small and not
reflective of the actual gains that might accrue. We are comfortable with this position.
What Others Have to Say About Everglades and Everglades Restoration
There are more than a few commenters on the current state of the Everglades and the proposed
restoration of this giant environmental asset. Our task is not to assess the value of the Everglades
and its ecosystem, nor to comment on the advisability or scientific wisdom of undertaking
restoration or its many parts. Instead we have the task of estimating, conservatively, the
economic change that would take place if the proposed CERP is actually implemented in total.
Our work should not be interpreted as an assessment of any particular part of CERP restoration
or the advisability or economic consequences of any part. We have not undertaken this marginal
approach. Instead, owing to time constraints and our directed assignment, we have attempted to
estimate the impact of undertaking the entire complement of CERP projects taken as a whole.

Copyright 2010 Everglades Foundation and Mather Economics 11
Caveat emptor, and readers are ill-advised to take our work as speaking on the value or
subjectivity of any particular aspect of CERP.
The National Park Service has this to say about the current state of the Everglades ecosystem:
The same rains that fall on South Florida today once ran off the backs of our
wood stork's forebears, but the similarity ends there. Now, extensive canal and
levee systems shut off the life-giving bounty of the rain before it can reach the
national park, which makes up only one-fifth of the historic Everglades. At times
the water control structures at the park boundary are closed, and no water
nourishes the wood stork's habitat. Or, alternately, water control structures are
opened and unnaturally pent-up, human-managed flood waters inundate
Everglades creatures' nests or eggs and disperse seasonal concentrations of the
wading birds' prey. Added to these problems is the presence of pollutants from
agricultural run-off. High levels of mercury are identified in all levels of the food
chain.
Many animals are specifically adapted to the alternating wet and dry seasons.
When human manipulation of the water supplies are ill-timed with natural
patterns, disasters can results. Alligators build their nests at the high-water level.
If more water is released into the park, their nests are flooded and destroyed.
Endangered snail kite birds feed on the aquatic apple snail. Low-water conditions,
human caused or natural, reduce snail and snailkite populations. In the early
1960s only 20 to 25 snail kites remained in North America because of prolonged
drought. Snails lay eggs above the water in the wet season. If managers release
more water, snails fail to reproduce.
Given present trends, the endangered wood storks may no longer nest in South
Florida by the year 2000. The wood stork has declined from 6,000 nesting birds to
just 500 since the 1960s. Their feeding behavior explains their predicament.
Wood storks feed not by sight, but by touch -"tacto-location"- in shallow and
often muddy water full of plants. Fish can't be seen in those conditions. Walking
slowly forward the stork sweeps its submerged bill from side to side. Touching
prey, mostly small fish, the bill snaps shut with a 25-second millisecond reflex
action, the fastest known for vertebrates. Only seasonally drying wetlands (mostly
in drying ponds) concentrate enough fish to provide the 440 pounds a pair of these

Copyright 2010 Everglades Foundation and Mather Economics 12
big birds requires in a breeding season. When natural wetlands cycles are upset by
human water management, wood storks fail to nest successfully. The wood stork -
which stands more than three feet tall, and has a 5-foot wing span, and weighs 4
to 7 pounds - was placed on the endangered species list in 1984.
Native trees, such as mangroves and cypress, are being replaced by exotic
(introduced) species from other countries. Florida largemouth bass share their
nesting beds with tilapia and oscars, fish imported from Africa and South
America. As the Everglades yield to human introduced plants and fish, native
species diminish.49
The Comprehensive Everglades Restoration Plan lists lofty goals as benefits. With the
implementation of the plan, improvements will be made by:
* Restoring natural flows of water, water quality and hydroperiods;
* Improving the health of more than 2.4 million acres of the South Florida ecosystem,
including the Everglades and Biscayne National Park;
* Improving hydrologic conditions will result in Lake Okeechobee once again,
becoming a healthy lake;
* Improving native flora and fauna, including threatened and endangered species;
* Ensuring a reliable, adequate supply of fresh water for use by all – the environment,
urban and agriculture;
* Maintaining flood protection set in place by the C&SF project; and
* Creating wide-ranging economic benefits, not only for Florida, but the entire
nation.50
Richard Weisskoff has written extensively about Everglades restoration. In ―The Economics of
Everglades Restoration,‖ Weisskoff argues that the economy of Florida and the Everglades
ecosystem are inseparable and that efforts to plan and implement a restoration of the Everglades
ecosystem without incorporating likely economic effects are profoundly flawed. This premise is
a response to the Everglades restoration planning Weisskoff observed in the late 1990s, which
failed to consider the economic activity occurring within the region. To support the argument in
favor of including economic factors in the restoration planning process, Weisskoff provides
forecasts of the Florida economy with and without Everglades restoration using a Regional
Economic Model (REMI) that he has adjusted to incorporate environmental factors specific to
49 http://www.everglades.national-park.com/info.htm. 50 http://www.evergladesplan.org/about/rest_plan_pt_08.aspx.

Copyright 2010 Everglades Foundation and Mather Economics 13
the Florida economy. These economic forecasts provide evidence of 1) the demands placed on
the Everglades ecosystem in the areas of fresh water supply, urban land and agriculture and 2)
the interdependence between South Florida‘s economic activity and the health of the Everglades
ecosystem.
The forecasts produced in Weisskoff‘s book are pre-recession, and, although the author provides
a range of economic growth scenarios, they are likely overestimates of actual economic activity
in the region. Despite what might be errors in these forecasts, the scale of growth that will occur
in the vicinity of the Everglades over the next 30 years is undeniable. Weisskoff argues that
economic growth will be spurred by any restoration efforts and that the enhanced growth will
lead to further degradation of the Everglades ecosystem. This assumed tradeoff between
economic growth and environmental restoration is implicit in his work, and little attention is paid
to the possibility both could occur in tandem.
Weisskoff‘s analysis does provide some estimates of ecosystem services, but they are produced
using a variation of the approach described by Costanza (Nature, 1997). This approach is distinct
from the macroeconomic forecasting methods used throughout the book. To estimate the
ecosystem values for the Everglades, Weisskoff applies average ecosystem service values per
land and sea acre for the areas included within the Everglades ecosystem. He uses two GIS land
surveys of the Everglades to arrive at the land areas that are mapped to each ecosystem service.
He finds that the economic contribution of ecosystem services provided by the land acres within
the Everglades was $31.66 billion in 1995. This reduction of $2.42 billion from the 1988 value is
due to changes in land usage. Both values are given in 1994 dollars. The value of ecosystem
services provided by the water within the Everglades is added to the land totals to arrive at $58.7
billion in 1995. He notes that this estimate of the Everglades‘ ecosystem services is roughly
equal to one-third of the South Florida economy. The Costanza methodology is described
elsewhere in this literature review, but it is worth noting that it includes non-marketed economic
values in the per-acre estimates, which is a substantial departure from the approach used in our
analysis. Also, the Costanza estimates of per-acre ecosystem values are developed using global
estimates of economic service values. Applying these global per acre ecosystem values to a
single ecosystem such as the Everglades is fraught with issues of interpretation.
On Costs
As we mentioned earlier, we were not asked to estimate the costs of Everglades restoration or to

Copyright 2010 Everglades Foundation and Mather Economics 14
analyze the estimates that others have derived. Our analysis is only about the benefits. However,
for purposes of comparison, we use the cost estimates that others have derived, but with some
adjustments. The details of that adjustment are reported in the appendix to this chapter. For our
purposes, we take the cost of restoration as $11.5 billion in 2010 terms and use it only for
comparison to the benefits we estimate (also in 2010 dollar terms).
Introduction References
Barnett, Cynthia. Mirage: Florida and the Vanishing Water of the Eastern U.S., University of
Michigan Press (2007). ISBN 0472115634
Carter, W. Hodding. Stolen Water: Saving the Everglades from its Friends, Foes, and Florida,
Atria Books (2004). ISBN 0743474074
Caulfield, Patricia. Everglades, Sierra Club/Ballantine Books (1970). ISBN 345023536395
Douglas, Marjory S. The Everglades: River of Grass, R. Bemis Publishing (1947). ISBN
0912451440
Douglas, Marjory, Rothchild, John. Marjory Stoneman Douglas: Voice of the River, Pineapple
Press (1987). ISBN 0910923941
George, Jean. Everglades Wildguide, National Park Service (1972): Gov. doc #I 29.62:Ev2
Griffin, John. Archeology of the Everglades, University Press of Florida (2002). ISBN
0813025583
Grunwald, Michael. The Swamp: The Everglades, Florida, and the Politics of Paradise, New
York: Simon & Schuster (2006). ISBN 0743251075
Hann, John, ed. Missions to the Calusa, University Press of Florida (1991). ISBN 0813019664
Jewell, Susan. Exploring Wild South Florida: A Guide to Finding the Natural Areas and Wildlife
of the Everglades and Florida Keys, Pineapple Press, Inc (1993). ISBN 1561640239
Lodge, Thomas E. The Everglades Handbook. Understanding the Ecosystem, CRC Press (2005).
ISBN 1884015069

Copyright 2010 Everglades Foundation and Mather Economics 15
McCally, David. The Everglades: An Environmental History, University Press of Florida (1999).
ISBN 0813023025
Ripple, Jeff. Big Cypress Swamp and the Ten Thousand Islands: Eastern America's Last Great
Wilderness, University of South Carolina Press (1992). ISBN 0872498425
Tebeau, Charlton. Man in the Everglades: 2000 Years of Human History in the Everglades
National Park, University of Miami Press (1968).
Toops, Connie. The Florida Everglades, Voyageur Press (1998). ISBN 0896583724
U.S. Army Corps of Engineers and South Florida Water Management District "Summary."
Central and Southern Florida Project Comprehensive Review Study, (April 1999).
University of Florida Agricultural Experiment Station and United States Department of
Agriculture Soil Conservation Service. Bulletin 442: Soils, Geology, and Water Control in the
Everglades Region, (March 1948).
Whitney, Ellie et al., eds. Priceless Florida: Natural Ecosystems and Native Species, Pineapple
Press, Inc (2004). ISBN 9781561643097

Copyright 2010 Everglades Foundation and Mather Economics 16
Appendix to Introduction
The following appendix describes our method of converting the original 1999 cost of Everglades
restoration to 2010 terms, allowing for the so-called River of Grass option as opposed to the
artificial pumping approach.
Since CERP was ratified 10 years ago, it has become obvious that certain aspects of it were
either unreasonable or inappropriate. Accordingly, for this analysis the original CERP storage
projects have been replaced with an alternative storage approach. This adjustment was made due
to reasonable doubts that have been raised regarding the feasibility of the original storage options
and their estimated costs. In addition, there exists a viable alternative storage method with sound
cost estimates. CERP‘s original cost estimate included costs for the Lake Okeechobee ASR, In-
ground reservoirs, and the EAA reservoir. In 1999 dollars, these three projects cost $2.6 billion,
which represented 33.2 percent of the total $7.8 billion CERP cost. Since the original plan was
completed, the feasibility and costs of these storage options have been reconsidered, and it is
likely these costs were underestimated by a considerable amount. For our cost estimate, we have
removed these costs from the CERP estimate and replaced the three storage projects with the
River of Grass Reservoir storage option that has an estimated cost of $3.2 billion in 2010 dollars.
The net effect of these changes is to adjust the total Everglades restoration costs to $11.5 billion
in 2010 dollars.

Copyright 2010 Everglades Foundation and Mather Economics 17
Construction Land Total Initial Annual O&M Year of $
3 projects that Bill pointed out within current CERP:
Lake Okeechobee ASR $1,108,797,000 $7,515,000 $1,116,312,000 $25,000,000 1999
In-Ground Reservoirs $783,695,000 $255,277,000 $1,038,972,000 $3,205,753 1999
EAA Reservoir $350,112,000 $86,536,000 $436,648,000 $14,458,409 1999
Total of these projects $2,242,604,000 $349,328,000 $2,591,932,000 $42,664,162 1999
Total CERP $5,598,113,000 $2,221,435,000 $7,819,548,000 $172,000,000 1999
33.15%
Revised LO ASR $1,800,000,000 $19,500,000 $1,819,500,000 $150,000,000 2010
Revised In-Ground $1,680,000,000 $1,744,650,000 $3,424,650,000 $2,000,000 2010
Revised EAA Reservoir $1,152,000,000 $224,000,000 $1,376,000,000 $2,066,667 2010
$4,632,000,000 $1,988,150,000 $6,620,150,000 $154,066,667 2010
Add this back in:
River of Grass Reservoir $2,880,000,000 $350,000,000 $3,230,000,000 $6,400,000 2010
Fed - Corps gets money from two sources - land vs. operations
State does not do it that way; they include operations costs to calculate rate of return & interest rates on bonds
EF best guesses of true costs for these three projects; based upon realistic costs from ongoing projects
and comparables; remove these from the original estimate
Cost Estimates of Everglades Restoration

Copyright 2010 Everglades Foundation and Mather Economics 18
2005-07-01 124.678 1.12359976 8,786,042,244
2005-10-01 125.751 1.13326965 8,861,656,413
2006-01-01 126.382 1.13895623 8,906,122,900
2006-04-01 127.388 1.14802231 8,977,015,587
2006-07-01 128.312 1.15634941 9,042,129,746
2006-10-01 128.722 1.16004434 9,071,022,392
2007-01-01 129.994 1.17150762 9,160,660,064
2007-04-01 130.908 1.1797446 9,225,069,524
2007-07-01 131.355 1 1.18377297 9,256,569,555
2007-10-01 131.884 1.00402725 1.18854032 9,293,848,115
2008-01-01 132.066 1.00541281 1.19018051 9,306,673,631
2008-04-01 132.540 1.00902135 1.1944522 9,340,076,349
2008-07-01 133.954 1.01978608 1.20719519 9,439,720,743
2008-10-01 133.627 1.01729664 1.20424826 9,416,677,096
2009-01-01 134.317 1.02254958 1.21046655 9,465,301,305
2009-04-01 134.212 1.02175022 1.20952029 9,457,901,969
2009-07-01 134.260 1.02211564 1.20995287 9,461,284,523
2009-10-01 134.376 1.02299874 1.21099826 9,469,459,027
2010-01-01 134.584 1.02458224 1.21287276 9,484,116,760
12,100,000,000 12,397,445,092
0.331468264
8,288,085,490
3,230,000,000
11,518,085,490 2010 dollars

Copyright 2010 Everglades Foundation and Mather Economics 19
Chapter 1: Ground Water Purification and Aquifer Recharge
One of the prime benefits of restoring the Everglades will be that the ensuing increase in sheet
flow will cause the groundwater extracted by communities, municipalities and individuals in the
region to be less brackish than it is now or would be in the future absent restoration. As more
water flows out of Lake Okeechobee into the restored Everglades region, groundwater will be
recharged at higher rates with clean water mostly free of salt compounds. This higher grade
water and increased flow will recharge the aquifers underneath South Florida, which will in turn
reduce the amount of purification required for the current population and in the future as
population and incomes grow.
Groundwater in the coastal counties of the South Florida Water Management District (SFWMD)
is brackish, so it must be desalinated before most uses. The capital cost of desalination, given the
state of the art of the reverse osmosis (RO) technology, is driven by the volume of fresh water
that must be produced, which in turn is driven by population growth. The operating cost of
desalination, on the other hand, is a direct function of the salinity of the water input. Saltier water
must go through the RO membranes at a higher pressure, which requires more energy. Restoring
sheet flow according to the Comprehensive Everglades Restoration Plan (CERP) can be expected
to decrease groundwater salinity, because more fresh water allowed into the aquifer from above
will displace seawater seeping into it from below. So, conservatively, we expect the restoration
of the Everglades to result in at least the energy cost savings from having to desalinate less saline
water. We ignore any potential capital cost savings from 1) the likely prospect that fewer
desalination plants will be built in the first place, and 2) reduced labor and maintenance costs
from using less saline input (assuming, that is, that RO membranes fail at higher rates when
higher-pressure, more saline water is pushed through).
Using the assumptions detailed below, we estimate that restoration of the Everglades will result
in energy cost savings amounting to between $13.5 and $29.6 billion over the next 50 years,
combined across all parties, public and private, who are expected to desalinate water in the
SFWMD.
We assume no change in reverse osmosis technology or in the cost of electricity, and we use a
discount rate of 2.1 percent. Growing energy costs would increase these estimates.
Improvements in desalination technology would decrease them. The higher figure assumes that
all the water withdrawn must be desalinated. The lower figure assumes that only the water
currently classified as saline must be desalinated. Current salinity readings indicate that all

Copyright 2010 Everglades Foundation and Mather Economics 20
groundwater is brackish, not just that which is currently classified as saline. This makes the
higher figure above plausible.
Finally, the energy costs are computed based on desalinating a combination of surface water and
groundwater in proportions projected based on historic observations. Surface water salinity is
much lower and growing more slowly. We treat it the same way as groundwater for simplicity: if
it is saline, it will have to be desalinated. Its effect, however, on energy cost is far smaller than
that of desalinating groundwater.51
Avoided Desalination Costs
General approach and data sources Our model has four steps. First, we project population and income growth in the area of interest
over the next 50 years, and use the projected values to model water withdrawals over the same
period. Next, we use historical salinity readings to infer the change in salinity over the next 50
years without the Everglades being restored. Then, we infer the yearly desalination cost over the
same period using regression analysis and engineering data published by the Texas Water
Development Board (TWDB). Finally, we repeat the cost calculations assuming that if the
Everglades were restored, water salinity would drop to its 1970 level and stay there even as the
volume of water withdrawn grew as driven by population and income growth.
In other words, we assume that implementing CERP would result in a new steady state where the
aquifer would be replenished with freshwater to a sufficient extent that it could sustain increased
withdrawals with no increase in its salinity. The difference between the discounted streams of
yearly desalination cost with and without Everglades restoration is our estimated economic
benefit in the form of avoided desalination costs that can be credited to CERP.
51 In our forecasting model, predicted groundwater salinity falls over time in some counties before it rises,
and is predicted to dip below its 1970 baseline for the first few years after 2010. This can result in negative savings
in the least-discounted years, with a disproportionate effect on the net present value of the savings combined over
the next 50 years. This is the case of Miami-Dade County, where savings are negative and falling toward zero for
the next 12 years before they move into positive territory. We could have zeroed out such negative savings under the
theory that, while CERP might not make things better, it will not make them worse. We decided against it. This
means that our benefits estimate, on this count, is probably biased downward too low.

Copyright 2010 Everglades Foundation and Mather Economics 21
We collected data on water use in SFWMD, by county and by year, from the U.S. Geological
Survey (USGS). We collected salinity data from DBHYDRO, the official SFWMD data
repository of water research results, and from the National Water Information System (NWIS)
maintained by the USGS.
Technical details Water use
The USGS collects county-level data on water withdrawals every five years. We are interested in
data for the 16 counties in the SFWMD. The earliest available records are from the 1985 data set.
The latest, from 2005. Table 1.1 reports the information over time.
Table 1.1: Total Water Withdrawals in the 16 SFWMD counties, Mgal/d 1985 1990 1995 2000 2005
Groundwater, fresh 1,961.12 2,475.38 2,371.54 2,705.35 2,386.13
Groundwater,
saline
0.00 0.00 4.63 0.00 3.26
Surface water,
fresh
1,284.40 1,777.18 1,868.83 1,987.03 1,560.78
Surface water,
saline
2,523.58 3,195.40 3,319.94 3,948.82 3,754.76
Total, fresh 3,245.52 4,252.56 4,240.37 4,692.38 3,946.91
Total, saline 2,523.58 3,195.40 3,324.57 3,948.82 3,758.02
Source: USGS Water use survey (http://water.usgs.gov/watuse/).
Using these data and yearly population and income figures by county over the same time span,
we extrapolated water use into the future 50 years using a fixed-effects panel regression model
where water withdrawals were modeled as a function of population and per-capita income. This
model assumes that the effect of population or income on water use is the same across all
counties of interest, and the differences come from their relative sizes – more populous counties
draw more water, but at the same per-person rate as less populous ones. This may sound
simplistic, but absent controls for other reasons why different counties might have different
water needs (lawns in Palm Beach, industry in Miami) the model gives a fair representation of
the average water needs. We used this specification for modeling separately four sub-totals of

Copyright 2010 Everglades Foundation and Mather Economics 22
water withdrawals: saline and fresh groundwater, and saline and fresh surface water. Parameter
estimates are in the appendix to this chapter.
Salinity
The SFWMD maintains DBHYDRO, an online database of water quality measurements taken
over time by various parties. One of these measurements is salinity, defined as Chloride in
milligrams per liter (same as parts per million). Each measurement comes with the location of
the station and the date it was taken, so it is straightforward to combine them into yearly
averages per county.
The USGS maintains the National Water Information System (NWIS), a similar online database
with its own Chloride records, with the same unit of measurement, also with locations and time
stamps.
Both DBHYDRO and NWIS record salinity separately by ground and surface water. In the case
of groundwater, we are interested in measurements taken in wells no deeper than 500 feet. Below
this depth, the water is saline. Southern Florida's fresh groundwater comes from surficial
aquifers, with water withdrawn from depths well above 500 feet.
Table 1.1 shows that most groundwater withdrawn inside the SFWMD is classified as fresh. The
two non-zero measurements for saline groundwater come almost entirely from one county –
Miami-Dade. However, salinity measurements tell a different story: groundwater in the 16
counties has been growing increasingly brackish over time, even after discarding any samples
taken from depths either unknown or greater than 500 feet (Figure 1.1). It is reasonable, then, to
assume that desalination will be needed for all groundwater withdrawn in the SFWMD in the
future, whether by private or public water supply systems. Restoring the Everglades will help
decrease the expected cost of desalination to the extent that it will succeed in reversing the trend
of increasing groundwater salinity.

Copyright 2010 Everglades Foundation and Mather Economics 23
Figure 1.1: Evidence of growing salinity in Southern Florida's groundwater
Even as the DBHYDRO and the NWIS data differ about the extent of the growth in salinity, they
agree that the trend is positive and accelerating. The estimated cost savings from avoided
desalination depend on which of the two sets of salinity data we use to extrapolate salinity with
and without CERP into the future. Though the NWIS data record a far larger number of samples,
these cover only 7 of the 16 counties of interest as shown in Table 1.2 below. We had to choose
between using data from fewer samples covering all counties or from more samples covering
some of the counties. We chose DBHYDRO because we believe that complete coverage is more
valuable than higher-density sampling of only part of the area of interest. As Figure 1.1 suggests,
had we chosen NWIS our cost-saving estimates would have been lower, because projected
salinity would have been lower based on the data summarized in the graph on the left.
0
500
1,000
1,500
2,000
2,500
1900 1950 2000year
44,735 samples
NWIS, Chloride, water, filtered (p00940), All GW Sites
0
1,000
2,000
3,000
4,000
1970 1980 1990 2000 2010year
6,205 samples
DBHYDRO, Test Name: Chloride (32), Matrix: GW, All Stations
Chloride mg/L at depths above 500 ft.
Groundwater salinity in the 16 counties of SFWMD

Copyright 2010 Everglades Foundation and Mather Economics 24
Table 1.2: Coverage of Chloride samples
DBHYDRO NWIS
Broward 278 15,004
Charlotte 38
Collier 533 4,644
Glades 92
Hendry 193 639
Highlands 164
Lee 276 4,694
Martin 242
Miami-
Dade
1,007 15,525
Monroe 3 148
Okeechobee 931
Orange 33
Osceola 432
Palm Beach 1,264 4,081
Polk 263
St. Lucie 456
Total 6,205 44,735
The exercise assumes that CERP would result in groundwater salinity falling back to its 1970
level. Without CERP, salinity would continue to grow along its current path as shown in the right
half of Figure 1.1. Surface water would be minimally affected: for the sake of simplicity, we
treat it the same way as groundwater, but its salinity is low and growing very slowly.
The cost of desalination
Desalination requires a capital investment – building the plants – and an ongoing operating cost
in the form of energy used, maintenance, and labor. Our understanding of the desalination
problem comes from a study done for TWDB by LBG-Guyton Associates, available in PDF and
referenced in the Chapter 1 References below. A brief summary follows:
The relation between the total cost of desalination and the salinity of the water input is a matter
of very loose approximation because of technological progress, changes in the relative prices of

Copyright 2010 Everglades Foundation and Mather Economics 25
the various inputs (both in the production of fresh water and the disposal of concentrates and
brine), and local characteristics.
We do know that more saline input must be pushed through RO membranes at a higher pressure.
Though the baseline of this relationship is dropping as RO technology improves, it remains true
that the higher the pressure, the higher the energy expended, and there are no economies of scale
in this process. This is the cost of interest to us, because everything else is subject to either scale
effects or factors depending on local characteristics. For example, larger plants, as well as plants
designed to operate at a higher baseline pressure, have some efficiencies built-in. The cost of
disposing of the brine via deep-well injection depends on the local geographic options for doing
so. The same goes for the cost of disposing of the concentrate (sludge that's saturated with
impurities other than salt). We did not undertake to estimate any cost savings that might result
from having to dispose of less salt, a scenario that would be the result of restoration.
The TWDB study documents two values of pressure required in pounds per square inch (psi) at
given levels of groundwater input salinity in milligrams per liter (mg/L): it takes 200 psi to treat
3,000 mg/L water, and it takes about 1,000 psi to treat 30,000 mg/L sea water. Absent better
data, we can only say that, as salinity grows by a factor of 10, the pressure required grows by a
factor of 5. Filling in a few intermediate values, we estimated, via linear regression, the
following functional relation between pressure y and salinity x:
(1) y(PSI) = 78.18 + .029*x(mg/L).
Next, we estimated a similar relation between energy, in MWh/year, and pressure. The same
study documents that a 10MGD (million gallons/day) plant takes 10,600 MWh/yr to operate at
300psi, 17,700 MWh/yr to operate at 500 psi, and 24,700 MWh/yr to operate at 700 psi. Our
estimated functional relation between energy z and pressure y is:
(2) z(MWh/yr) = 41.67 + 35.25*y(PSI).
Combining (1) and (2) yields the following relation between energy z and salinity x:
(3) z(MWh/yr) = 2,797.5 + 1.014*x(mg/L).
We used equation (3) as our model of the annual cost of energy as a function of water input
salinity assuming an energy price of $.08 per kW/h, based on the average electricity price in
Florida for industrial use ($.0767 in 2007).52
52 http://www.ppinys.org/reports/jtf/electricprices.htm.

Copyright 2010 Everglades Foundation and Mather Economics 26
Next, we projected this annual desalination cost for each SFWMD county, given its projected
water withdrawals (ground and surface) and their respective salinity levels given their current
path (groundwater salinity expected to rise at a growing rate as shown in Figure 1.1; surface
water salinity, not shown, expected to remain unchanged for the most part). Then we repeated
the calculations with salinity levels held at their 1970 level.
Results Our avoided desalination cost estimate is the difference between projected desalination costs
given the current path of rising salinity versus holding it constant at its 1970 level, which is our
expected environmental effect of CERP. Net present values of the yearly savings between 2010
and 2060 are shown in Table 1.3 below. We assume a 2.1 percent discount rate, quadratic growth
patterns in population and income, as well as in salinity (without CERP). We use DBHYDRO
salinity readings. We perform this calculation under two assumptions regarding water withdrawn
in the SFWMD over the next 50 years, by public and private parties: first, we assume that all
water will have to be desalinated; second, we assume that only the water classified as saline will
have to be desalinated. Though the latter sounds obvious and results, as expected, in a lower
estimate, the former is not implausible. Current readings show that all groundwater in SFWMD
tested at depths above 500 feet is saline to some extent, and it is growing more saline on average.
If not all of it is treated now, it likely will need to be in the future.

Copyright 2010 Everglades Foundation and Mather Economics 27
Table 1.3: Projected avoided desalination costs*
under CERP, by county (1) (2)
Broward 4,874,613,988 3,336,185,306
Charlotte 1,845,151,810 110,230,864
Collier 3,199,893,209 1,264,661,598
Glades 1,219,888,896 0
Hendry 737,265,172 0
Highlands 451,662,287 0
Lee 2,028,597,261 1,125,228,393
Martin 1,058,726,538 0
Miami-Dade 2,076,442,179 1,469,949,796
Monroe 889,385,452 0
Okeechobee 473,328,531 0
Orange 2,065,805,877 1,358,980,032
Osceola 1,028,574,150 403,534,040
Palm Beach 5,279,093,539 3,440,020,286
Polk 1,192,452,967 625,697,186
St. Lucie 1,194,564,609 395,420,582
Total 29,615,446,465 13,529,908,083
(1) Assuming that all groundwater withdrawn must be desalinated
(2) Assuming that only saline groundwater must be desalinated
* Energy costs only
These avoided desalination costs are energy-cost savings alone. Water desalination using reverse
osmosis requires pretreatment to prevent membrane fouling, disposal of the byproduct brine and
concentrates and non-trivial capital investments. We ignored maintenance and disposal costs
because they are too dependent on local conditions to be believably projected from the TWDB
study. And we assumed that capital costs would be unchanged with or without CERP, as new
desalination capacity would be built according to freshwater needs, not to the salinity of the
input. This makes our estimates above conservative.

Copyright 2010 Everglades Foundation and Mather Economics 28
Chapter 1 References
Cost Analysis of Groundwater Desalination:
http://www.twdb.state.tx.us/publications/reports/GroundWaterReports/GWReports/Brackish%20
GW%20Manual/35-Ch04.pdf
DBHYDRO data:
http://www.sfwmd.gov/portal/page/portal/xweb%20environmental%20monitoring/dbhydro%20a
pplication
NWIS data: http://waterdata.usgs.gov/nwis
Appendix to Chapter 1
Part 1: Total water withdrawals model
Withdrawals, Million gallons/day
Groundwater Surface-Water
Saline Fresh Saline Fresh
Population, April 1, thousands 0.001* 0.081 0.556*** 0.086
(2.02) (1.87) (4.76) (1.21)
Per-capita income ($1,000) -0.010 0.306 -1.951 0.431
(-0.90) (0.46) (-1.09) (0.40)
Constant -0.329 105.201*** 6.809 57.524*
(-1.33) (7.24) (0.17) (2.43)
R-squared 0.07 0.13 0.34 0.07
N 80 80 80 80
t-values in parentheses (* p<0.05, ** p<0.01, *** p<0.001)

Copyright 2010 Everglades Foundation and Mather Economics 29
Part 2: Details on U.S.G.S. data collection
We used the Google Chrome Sessions Manager to obtain water quality data from the U.S.G.S.
1. http://waterdata.usgs.gov/fl/nwis/nwis -- main portal to Florida data
2. http://nwis.waterdata.usgs.gov/tutorial/finding_qwdata.html -- tutorial on how to access historical data for any
given watershed
3. http://nwis.waterdata.usgs.gov/fl/nwis/qwdata?search_criteria=county_cd&submitted_form=introduction -- GUI
for downloading Florida data by county. This is where we selected out the 16 SFWMD counties.
4.
http://nwis.waterdata.usgs.gov/nwis/pmcodes/pmcodes?pm_search=salinity&casrn_search=&radio_pm_search=srsn
ame_search&srsname_search=potassium&format=html_table&show=parameter_cd&show=parameter_group_nm&
show=parameter_nm&show=casrn&show=srsname -- water quality parameter code definitions
5. http://nwis.waterdata.usgs.gov/nwis/help/?read_file=site_tp&format=table -- USGS site type codes.

Copyright 2010 Everglades Foundation and Mather Economics 30
Part 3: Locations of and other information on existing SFWMD desalination plants
Desalination can be a confusing concept. The following information was obtained from the
SFWMD and is reproduced here, without alternation in its original form and format, for
information about current and future desalination in the region. (It is interesting to note that the
last figure in this section (Named ―Growth of Desalination in the SFWMD‖ and unnumbered)
reveals a forecast of desalination which maps closely to our forecast of ground water salinity in
Figure 1.1 which is some independent confirmation of our approach to groundwater.)
Desalination in South Florida – Frequently Asked Questions
What is desalination?
Desalination removes dissolved substances in groundwater, seawater and municipal wastewaters
making water fit for human consumption, irrigation, industrial use and other purposes. In the
past, distillation was the most widely used desalination process, but use of electrodialysis and
particularly reverse osmosis, is increasing. Electrodialysis retains clean water and allows salts to
pass. Reverse Osmosis (RO) purifies saltwater by forcing it through semi-permeable membranes,
allowing water to pass, but retaining the impurities of heavy metals and compounds such as lead
and nitrates called concentrate or reject that must be safely disposed. The filtered water is so pure
that it must be post-treated and blended with other sources for potable supply.
What is the difference between brackish water and seawater?
The primary difference between these two sources of water is in the amount of dissolved salts.
Seawater contains higher amounts of dissolved salts (from 15,000 milligrams per liter (mg/l) to
over 35,000 mg/l of total dissolved solids). Brackish water has 1,00015,000 mg/l. The greater the
salt content of the water, the higher the pressure or electric power needed to treat water using
membranes, resulting in higher energy costs.
Why is desalination an important issue in Florida?
With more than 120 desalination plants in Florida, our state leads the nation in desalination.
Texas has 38, California, 33. Florida leads because the water underneath, east and west of the
peninsular is salty. The increasing demand for water, coupled with the state‘s vulnerability to
drought events, compel water planners to consider all alternatives. The 2001 and 2007 droughts
stressed surface water systems, but seawater sources are not affected by drought.
How does everyone benefit from seawater desalination?
Desalination benefits everyone in Florida through diversification of our choices. Treating
seawater to serve coastal Florida reduces competition with the Everglades initiatives and relieves
dependence on existing conventional surface water and groundwater supply sources. Using
seawater by coastal residents could increase availability of surface water for water users located

Copyright 2010 Everglades Foundation and Mather Economics 31
away from the coast. Consequently, seawater desalination can indirectly benefit people who live
farther away from the coast.
How does desalination affect the environment or climate change?
Environmental Protection Agencies have specific guidelines that must be followed by builders of
desal facilities to avoid harmful effects to environments. Environmental impact studies are
conducted to identify, investigate and issue recommendation regarding possible impacts of
disposing waste on land, air and water. In the recently completed Tampa Bay seawater project,
monitoring has shown no significant impacts on fauna and flora. Highly concentrated salts, the
major by-products of desalination, can be safely disposed using best management practices.
Desalination does not substantially affect climate change because its activities are insignificant
compared to others. Advances in energy recovery devices and low-pressure RO systems are
substantially reducing power demand and the carbon footprint.
How much does desalination cost?
Advancements in reverse osmosis technology have brought desalination costs closer to other
alternatives. Ten years ago, desalinated water cost more than $9 per 1,000 gallons, but today, the
range is $2 to $5 per 1,000 gallons. Israel‘s world-largest desal water costs are about $2 per
1,000 gallons and the recently completed 25 MGD Tampa Bay plant produces water at about $3
per 1,000 gallons. The cost depends on whether the source water is brackish groundwater or
seawater. Brackish water desalination costs less than seawater desalination because it contains
less dissolved salts. The total costs also depend on the amount of pre-treatment and post-
treatment needed. Because of available grants, subsidies and innovative financing, the costs are
not entirely passed to the end user.
Some pros and cons of water desalination
Pros:
• Provides a dependable, drought-proof source of water
• Provides an alternative that could allow other stressed water sources to recover.
• Prevents water ―wars‖ and addresses the state legislation for source diversification
• Provides the way of the future either for potable or wastewater treatment due to
advancing technologies and the associated reduction in costs
• Provides high quality water
• Saves construction of future dams and reservoirs.
Cons:
• Still more expensive than traditional sources due to high energy consumption
• Concentrate or waste brine from the desal process is an environmental concern
• Intakes and discharge points may present harm to marine life
• Permitting desal plants is still difficult

Copyright 2010 Everglades Foundation and Mather Economics 32
Does the District support or fund desalination projects?
The District‘s Regional Water Supply Plans have recognized desalination as an economically
viable method and support it through the Alternative Water Supply Grant Program. Other state
grant programs, federal appropriations and private/public partnering may be used to fund
desalination projects.
How many brackish and seawater desalination plants are currently in operation in
Florida? Florida has more than 130 desalination plants. In the SFWMD, there are about 26 facilities using
brackish water and reverse osmosis treatment with a total capacity of more thanover 140 MGD.
In addition, there is over 120 MGD of RO capacity under construction within our District.
Statewide, there are three seawater desalination facilities, the two oldest in Key West with a
capacity of 3 MGD and the newest in Tampa producing 25 MGD.
Are there plans to build more desalination plants in Florida?
Every fiscal year, the District receives applications for new desalination facilities. Regarding
seawater, the District completed a feasibility study in December 2006. The study identified three
locations where seawater treatment facilities could be co-located with electric power plants to
take advantage of abundant plant cooling water and existing intake and discharge facilities.
Utilities are considering moving forward more thoughtfully and deliberately, in view of the
experience gained from the new Tampa Bay seawater plant.
Contact Person: Ashie Akpoji (561) 682-2571, Water Supply Department, SFWMD
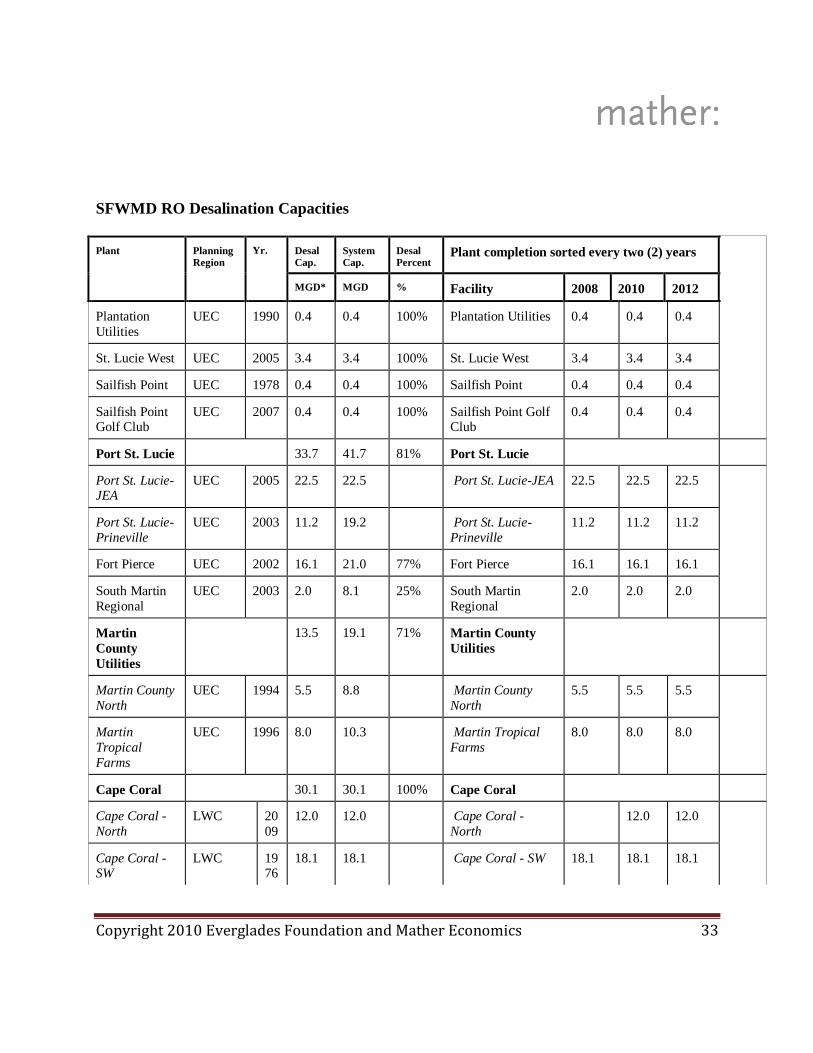
Copyright 2010 Everglades Foundation and Mather Economics 33
SFWMD RO Desalination Capacities
Plant
Planning
Region Yr. Desal
Cap. System
Cap. Desal
Percent Plant completion sorted every two (2) years
MGD* MGD % Facility 2008 2010 2012
Plantation
Utilities
UEC 1990 0.4 0.4 100% Plantation Utilities 0.4 0.4 0.4
St. Lucie West UEC 2005 3.4 3.4 100% St. Lucie West 3.4 3.4 3.4
Sailfish Point UEC 1978 0.4 0.4 100% Sailfish Point 0.4 0.4 0.4
Sailfish Point Golf Club
UEC 2007 0.4 0.4 100% Sailfish Point Golf Club
0.4 0.4 0.4
Port St. Lucie 33.7 41.7 81% Port St. Lucie
Port St. Lucie-JEA
UEC 2005 22.5 22.5 Port St. Lucie-JEA 22.5 22.5 22.5
Port St. Lucie-
Prineville
UEC 2003 11.2 19.2 Port St. Lucie-
Prineville
11.2 11.2 11.2
Fort Pierce UEC 2002 16.1 21.0 77% Fort Pierce 16.1 16.1 16.1
South Martin
Regional
UEC 2003 2.0 8.1 25% South Martin
Regional
2.0 2.0 2.0
Martin
County
Utilities
13.5 19.1 71% Martin County
Utilities
Martin County
North
UEC 1994 5.5 8.8 Martin County
North
5.5 5.5 5.5
Martin
Tropical
Farms
UEC 1996 8.0 10.3 Martin Tropical
Farms
8.0 8.0 8.0
Cape Coral 30.1 30.1 100% Cape Coral
Cape Coral -
North
LWC 20
09
12.0 12.0 Cape Coral -
North
12.0 12.0
Cape Coral - SW
LWC 1976
18.1 18.1 Cape Coral - SW 18.1 18.1 18.1

Copyright 2010 Everglades Foundation and Mather Economics 34
Plant
Planning
Region Yr. Desal
Cap. System
Cap. Desal
Percent Plant completion sorted every two (2) years
Clewiston LWC 20
08
3.0 3.0 100% Clewiston 3.0 3.0 3.0
Fort Myers LWC 20
02
13.0 13.0 100% Fort Myers 13.0 13.0 13.0
Greater Pine
Island
LWC 19
99
3.8 3.8 100% Greater Pine Island 3.8 3.8 3.8
Island Water
Association
LWC 19
73
4.7 4.7 100% Island Water
Association
4.7 4.7 4.7
Collier
County
30.0 54.0 56% Collier County
Collier County
North
LWC 1999 10.0 22.0 Collier County
North
10.0 10.0 10.0
Collier County South
LWC 2004 20.0 32.0 Collier County South
20.0 20.0 20.0
Lee County
Utilities
9.9 39.0 25% Lee County
Utilities
Corkscrew LWC 2008 1.0 15.0 Corkscrew 1.0 1.0 1.0
North incl.
Olga
LWC 2006 5.0 10.0 North incl. Olga 5.0 5.0 5.0
Pinewoods LWC 2008 2.9 5.0 Pinewoods 2.9 2.9 2.9
Green
Meadows
LWC 2008 1.0 9.0 Green Meadows 1.0 1.0 1.0
Bonita Springs LWC 2003 6.5 15.0 43% Bonita Springs 6.5 6.5 6.5
Marco Island LWC 1992 6.0 12.7 47% Marco Island 6.0 6.0 6.0
Manalapan LEC 2004 1.7 2.4 72% Manalapan 1.7 1.7 1.7
Tequesta LEC 2008 2.4 5.1 47% Tequesta 2.4 2.4 2.4
Jupiter LEC 1989 13.7 29.3 47% Jupiter 13.7 13.7 13.7
PBC - Lake
Region WTP
LEC 2008 10.0 10.0 100% PBC - Lake Region
WTP
10.0 10.0 10.0
North Miami LEC 2012 6.0 14.0 43% North Miami 6.0
Hialeah LEC 2011 10.0 24.0 42% Hialeah 10.0
FKAA 9.0 24.0 38% FKAA

Copyright 2010 Everglades Foundation and Mather Economics 35
Plant
Planning
Region Yr. Desal
Cap. System
Cap. Desal
Percent Plant completion sorted every two (2) years
FKAA -
Marathon
LEC 1980 2.0 2.0 FKAA - Marathon 1.0 1.0 2.0
FKAA - South
Dade
LEC 2009 6.0 24.0 FKAA - South
Dade
6.0 6.0
FKAA - Stock
Island
LEC 1980 1.0 1.0 FKAA - Stock
Island
2.0 2.0 1.0
North Miami
Beach
LEC 2008 6.5 32.0 20% North Miami Beach 6.5 6.5 6.5
Highland Beach
LEC 2004 3.0 3.0 100% Highland Beach 3.0 3.0 3.0
Seacoast
Utilities
LEC 2012 4.3 30.5 14% Seacoast Utilities 4.3
Miramar LEC 2009 2.0 14.8 14% Miramar 2.0 2.0
Deerfield
Beach
LEC 2010 3.0 23.0 13% Deerfield Beach 3.0 3.0
Fort Lauderdale
Dixie
LEC 2010 6.0 88.0 7% Fort Lauderdale Dixie
6.0 6.0
Hollywood LEC 1996 2.0 55.5 4% Hollywood 2.0 2.0 2.0
MGD* = Million gallons per day 207.1 236.1 250.4
2008 2010 2012
Updated October 8, 2009FKAA = Florida Keys Aqueduct Authority
LEC = Lower East Coast of the SFWMD
UEC = Upper East Coast of the SFWMD
LWC = Lower West Coast of the SFWMD
Source: South Florida Water Management District

Copyright 2010 Everglades Foundation and Mather Economics 36

Copyright 2010 Everglades Foundation and Mather Economics 37

Copyright 2010 Everglades Foundation and Mather Economics 38

Copyright 2010 Everglades Foundation and Mather Economics 39

Copyright 2010 Everglades Foundation and Mather Economics 40
Chapter 2: Water Quality and Residential Real Estate Valuation
Impact of Improved Water Quality
We anticipate that a restored Everglades will improve the quality of water in the 16-county South
Florida Water Management District.53
Water plays an important role in the determination of residential real estate values. Proximity,
type (ocean, bay, lake, river, etc.), view, size and quality are among the water attributes that are
valued by real estate buyers. For example, lakeside or seaside properties sell at a premium to
properties located away from bodies of water. A home on a clear stream trades at a premium to a
similar home on a polluted stream. Of course, water and its attributes are only a small part of the
bundle of attributes that determine a property‘s value. House size, quality of finish, proximity to
a city and a great many other factors also play important roles.
Economists have developed techniques to quantify the incremental value of environmental
attributes.54
One of the often-used and robust techniques employed is hedonic pricing.55
This
method estimates the price people are willing to pay for individual product characteristics, such
as a swimming pool or air conditioning, and environmental goods, such as water quality, holding
other attributes constant. Studies consistently show that the water-quality effect is positive; that
is, property located on or around high quality water is more valuable, other things the same, than
property located on or around lower quality water. The magnitude of this effect is generally in
the 0.5 percent to 7.0 percent range.56
That is, some level of water quality improvement can have
up to a 7 percent impact on real estate values. The same techniques also find, for example,
53 The CERP as currently planned leaves some question about the overall impact on water quality
throughout the 16 county region. However, it is our determination, after consultation with Everglades Foundation
scientists, that overall water quality will increase throughout all of the counties and probably by more than the
estimate we provide below. With that said, an extremely conservative approach would be to carefully examine the
proposed impacts of the CERP on each individual county exploring the expected changes in the relevant water
quality parameters there. This individualized inquiry would be advised except for the lack of time and precise details
about exactly how the CERP will improve water quality in each sub-region within South Florida. 54 There is a giant literature on hedonic pricing as a generic method in economics. For the pure theory see
Sherwin Rosen. "Hedonic Prices and Implicit Markets: Product Differentiation in Pure Competition." Journal of
Political Economy. 82 (January/February1974): 34-55 or Jack E. Triplett. "The Economic Interpretation of Hedonic
Methods." Survey of Current Business, 66 (January 1986): 36-40. For a recent paper involving environmental amenities, see Frank F. Limehouse, Peter C. Melvin, and Robert E. McCormick. ―The Demand for Environmental
Quality: An Application of Hedonic Pricing in Golf.‖ Journal of Sports Economics, 11 (June 2010) : 261-286. 55 See, for example, Tom Kauko, Roland Goetgeluk, Ad Straub, and Hugo Priemus. ―Presence of water in
residential environments – value for money?‖ OTB Research Institute for Housing, Urban and Mobility Studies,
(2003). 56 Kauko, et al. (2003).

Copyright 2010 Everglades Foundation and Mather Economics 41
positive effects on air quality and negative effects on proximity to toxic waste sites.57
These
results are both intuitively and scientifically robust.
For the purposes of this study, our role is to estimate the impact on residential real estate values
that will derive from a restored Everglades due to improvements in water quality. The
calculation is:
Δ Real Estate Value = Total Real Estate Value E wq Δwq
where,
E wq= home price elasticity of water quality
wq = measure of water quality.
In order to estimate this effect we need several inputs:
The total value of real estate in the impacted area,
The extent to which water quality will be improved based on a restored Everglades
( Δwq), and
The sensitivity of real estate values to changes in water quality ( E wq ).
We cannot know any of these inputs with precision. However, there are proxies available and we
have made assumptions as noted below.
Real Estate Change-in-Value Estimation Results
The aggregate owner-occupied residential real estate value in the 16-county SFWMD is
approximately $976.217 billion.58
Based on a survey of hedonic estimates of water-quality
effects, the elasticity of real estate values with respect to water quality is .07054.59,60
Assuming
that water quality, as measured by dissolved oxygen, can be returned to 1970 levels as a result of
57 Boyle, M.A. and K.A. Kiel. ―A Survey of House Price Hedonic Studies of the Impact of Environmental
Externalities.‖ Journal of Real Estate Literature, 9 (2001): 117-44. 58 Florida County Perspectives 2009, University of Florida Bureau of Economic and Business Research..
59 Poor, P., J., K. L. Pessagno and R. W. Paul. ―Exploring the Hedonic Value of Ambient Water Quality: A
Local Waterhsed-Based Study.‖ Ecological Economics, 60(4) (2007).
60 A 100 percent improvement in water quality will produce a 7.054 percent increase in real estate values.

Copyright 2010 Everglades Foundation and Mather Economics 42
restoring the Everglades, there is a potential 23.454 percent improvement in water quality.61
Combining these estimates, we estimate the incremental value of a restored Everglades on real
estate across all 16 counties as:
$976.217 Billion .07054 X .234 = $16.108 Billion.
This change represents a 1.655 percent increase in the aggregate value of real estate, which is
well within the range of typical studies on water-quality effects. However, we have also done
what-if analysis, to examine the impacts based on different levels of water-quality
improvements. The results of that analysis are reported in Table 2.1, which also lists the county-
by-county best estimates of additional ecosystem services forthcoming from a restored
Everglades. We also estimated the increased value of real estate by assuming that nitrogen levels
would not achieve the high levels of 2004 and 2005 hurricane years. These estimates are also
reported in Table 2.1. Additionally, we assumed that it would take 1, 2, 3, 4 and 5 years for water
quality goals to attain. These alternative assumptions are designed to provide the reader and
analyst with a measure of sensitivity. For instance, if it takes three years for the water quality
impacts to render, then total effect on real estate is $15.1 billion instead of $16.1 for all 16
counties.
61 Restoring the current water quality to the 1970 level means, increasing the average dissolved oxygen
content from its 2009 level 4.2359 (unfiltered) milligrams per liter to its 1970-71 level of 5.2485. See the appendix
to this chapter for more information on the time series of dissolved oxygen in the region. Dissolved oxygen is not
the only measure of water quality. There is salinity, turbidity, nitrogen content, and others. However, these are
typically, but not always, correlated. While other metrics can be used, we did in fact create an estimate using
nitrogen levels and the results were robust, we assert that dissolved oxygen is the best, single metric.

Copyright 2010 Everglades Foundation and Mather Economics 43
Table 2.1: Value of Everglades Restoration on South Florida Real Estate via Improved Water Quality
Table 2.1 Value of Everglades Restoration on South Florida Real Estate via Improved Water Quality
County
Incremental Real Estate
Value
Years Until
Water Quality
Goals Met
Potential Increase in
Real Estate Value at
2.1% Discount Rate Basis 1% 5% 23% - Best Estimate 25% 50% 100%
Broward 3,032,000,000$ 1 15,777,000,000$ Suspended Solids Model 536,000,000$ 5,357,000,000$ 16,108,000,000$ 13,392,000,000$ 26,785,000,000$ 53,570,000,000$
Charlotte 261,000,000$ 2 15,452,000,000$ Nitrogen Model 689,000,000$ 6,887,000,000$ 17,216,000,000$ 34,433,000,000$ 68,865,000,000$
Collier 974,000,000$ 3 15,134,000,000$
Dade 4,379,000,000$ 4 14,823,000,000$
Glades 7,000,000$ 5 14,518,000,000$
Hendry 21,000,000$
Highlands 96,000,000$ Discount Rate 2.10%
Lee 1,058,000,000$
Martin 333,000,000$
Monroe 307,000,000$
Okeechobee 21,000,000$
Orange 1,561,000,000$
Osceola 340,000,000$
Palm Beach 2,807,000,000$
Polk 557,000,000$
St. Lucie 353,000,000$
Totals 16,108,000,000$
Real Estate Value Improvement - Best Estimate Potential Real Estate Value Improvement Using Various % Change in Water Quality
Sensitivity Analysis
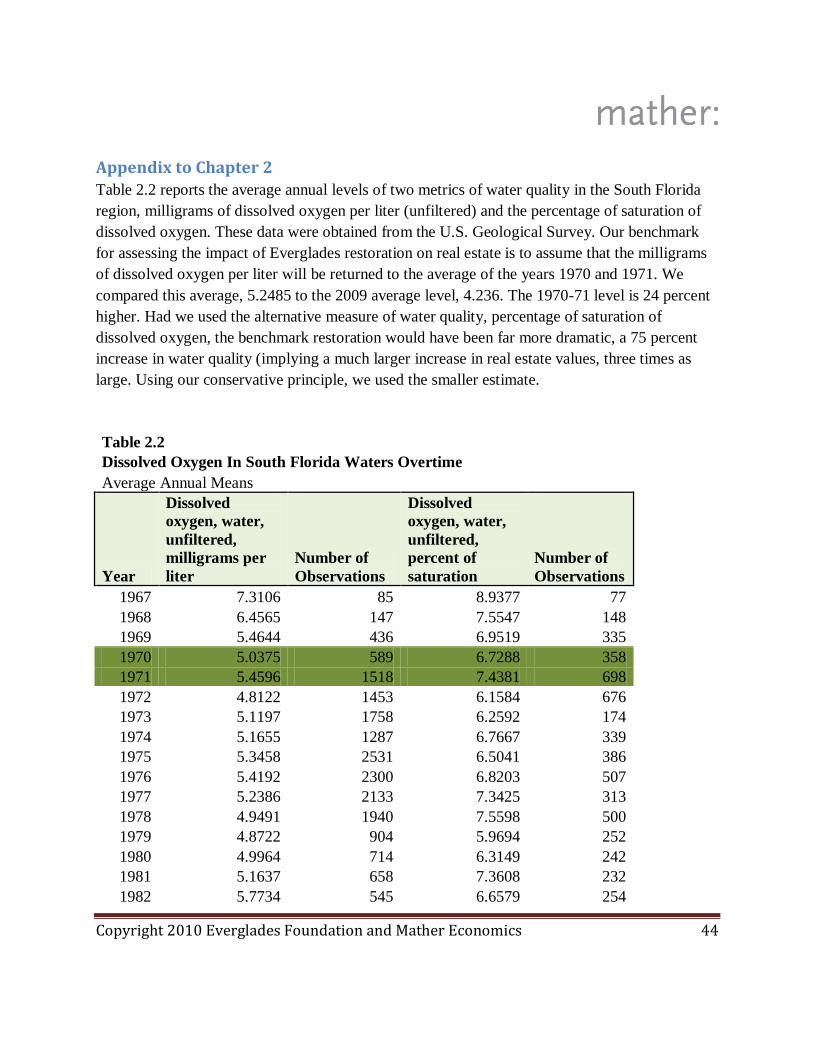
Copyright 2010 Everglades Foundation and Mather Economics 44
Appendix to Chapter 2
Table 2.2 reports the average annual levels of two metrics of water quality in the South Florida
region, milligrams of dissolved oxygen per liter (unfiltered) and the percentage of saturation of
dissolved oxygen. These data were obtained from the U.S. Geological Survey. Our benchmark
for assessing the impact of Everglades restoration on real estate is to assume that the milligrams
of dissolved oxygen per liter will be returned to the average of the years 1970 and 1971. We
compared this average, 5.2485 to the 2009 average level, 4.236. The 1970-71 level is 24 percent
higher. Had we used the alternative measure of water quality, percentage of saturation of
dissolved oxygen, the benchmark restoration would have been far more dramatic, a 75 percent
increase in water quality (implying a much larger increase in real estate values, three times as
large. Using our conservative principle, we used the smaller estimate.
Table 2.2
Dissolved Oxygen In South Florida Waters Overtime
Average Annual Means
Year
Dissolved
oxygen, water,
unfiltered,
milligrams per
liter
Number of
Observations
Dissolved
oxygen, water,
unfiltered,
percent of
saturation
Number of
Observations
1967 7.3106 85 8.9377 77
1968 6.4565 147 7.5547 148
1969 5.4644 436 6.9519 335
1970 5.0375 589 6.7288 358
1971 5.4596 1518 7.4381 698
1972 4.8122 1453 6.1584 676
1973 5.1197 1758 6.2592 174
1974 5.1655 1287 6.7667 339
1975 5.3458 2531 6.5041 386
1976 5.4192 2300 6.8203 507
1977 5.2386 2133 7.3425 313
1978 4.9491 1940 7.5598 500
1979 4.8722 904 5.9694 252
1980 4.9964 714 6.3149 242
1981 5.1637 658 7.3608 232
1982 5.7734 545 6.6579 254

Copyright 2010 Everglades Foundation and Mather Economics 45
1983 6.1857 481 7.1209 43
1984 5.8818 314 7.3077 13
1985 5.8915 271 6.8250 12
1986 5.2963 187 6.9316 19
1987 5.1434 198 6.2333 30
1988 5.9341 305 4.3400 10
1989 4.8433 217 3.4167 12
1990 5.2206 286 4.7500 8
1991 4.6030 166 4.4000 9
1992 4.9944 178 4.0800 5
1993 3.6132 152 4.1286 7
1994 4.1200 115 4.5143 7
1995 6.0110 82 5.1000 1
1996 4.6989 271 5.0906 32
1997 4.4092 759 5.1321 28
1998 3.8424 1004 4.5971 69
1999 4.5947 758 3.8577 26
2000 5.1187 610 4.2240 25
2001 4.2306 157 4.4622 45
2002 4.0013 149 4.1782 55
2003 4.7906 106 4.1545 44
2004 3.9030 912 4.9691 139
2005 4.5929 1247 5.3142 106
2006 4.4014 568 5.1630 73
2007 3.8034 561 5.5491 53
2008 3.6657 1149 6.1551 69
2009 4.2360 470 4.0500 80
Source: USGS (for details, see discussion in appendix to Chapter 1).

Copyright 2010 Everglades Foundation and Mather Economics 46
Figure 2.1 USGS Data on Dissolved Oxygen, annual averages, all stations, 16-County South
Florida region
Figure 2.1 displays the decline in dissolved oxygen content over the past 40 years in South
Florida. Our estimate of the impact of restoration on real estate values is based upon restoring
dissolved oxygen to its 1970-71 levels.
0.00
1.00
2.00
3.00
4.00
5.00
6.00
7.00
8.00
1967 1970 1973 1976 1979 1982 1985 1988 1991 1994 1997 2000 2003 2006 2009
Dissolved oxygen, water, unfiltered, milligrams per liter

Copyright 2010 Everglades Foundation and Mather Economics 47
Chapter 3: Recreation and Park Visitation Valuation
The Everglades is one of South Florida‘s main tourist and recreational attractions. The rivers,
lakes, wetlands and waterbodies unique to the Everglades invite sightseeing, bird watching,
manatee watching, sailing, camping, diving, snorkeling, boat tours, airboat tours, canoeing,
kayaking, hunting, shelling, saltwater fishing and freshwater fishing. To the extent Everglades
restoration will improve the quality of these activities, we expect the demand for these activities
to increase and, consequently, the number of residents and non-residents visiting the Everglades
to increase. This increase in recreational and park visitation activity translates to an economic
value that we estimate in this section.
In economic studies similar to this one, sometimes, tourism is seen as a catch-all category. Here
we have tried to use a more laser-like approach and break tourism down into smaller, more
transparent, categories of recreation, park visitation, bird watching and wildlife habitat, hunting,
and fishing. Thus, we have no overall category called ―tourism‖ per se. However, our approach
is deemed superior because it subsumes all the sub-categories and avoids the temptation or
problem of doubling counting.
Methodology To estimate the economic impact of Everglades restoration on recreational and park visitation
expenditures, we employ the travel-cost method.62
The basic premise of the travel-cost method is
that expenses people incur while traveling to a recreation site or tourist destination represent the
price of admission to that site. This outlay of expenditures reflects the traveler‘s willingness-to-
pay, that is, the value that a recreationist or tourist places on accessing a particular site. By
aggregating the travel expenditures of all visitors to an unrestored Everglades, then projecting a
marginal increase in those expenditures attributable to Everglades restoration, we estimated the
recreational and park visitation component of CERP‘s economic impact.
62
The travel-cost method is widely used throughout basic economics and natural resource economics to
estimate the value that individuals place on events and locations that they visit. See Gardner Brown and Robert
Mendelsohn. ―The Hedonic Travel Cost Method.‖ Review of Economics and Statistics. 66 (3) (August 1984): 427-
33; K. G. Willis and G. D. Garrod. ―An Individual Travel-cost Method of Evaluating Forest Recreation,‖ Journal of Agricultural Economics, 42 (1) (January 1991): 33-42; Eric Bertonazzi, Michael Maloney and Robert McCormick.
―Some Evidence on the Alchian and Allen Theorem: The Third Law of Demand?" Economic Inquiry, XXXI(3)
(July 1993): 383-93; and for a detailed discussion see http://www.ecosystemvaluation.org/travel_costs.htm which
was developed and written by Dennis M. King, Ph.D, Univ. of Maryland, and Marisa J. Mazzotta, Ph.D. and was
funded by U.S. Department of Agriculture Natural Resources Conservation Service and National Oceanographic
and Atmospheric Administration.

Copyright 2010 Everglades Foundation and Mather Economics 48
Our approach has five stages. First, we collected historical data on park visitation in South
Florida.63
Because many recreationists and tourists who travel to the Everglades visit the area‘s
national parks, preserves, state parks and sanctuaries, we assume changes in park visitation
reflect changes in overall tourist and recreational demands. Our team contacted Matt Johnson, a
Supervisory Ranger for the National Park Services at Biscayne National Park, about park
visitation data. He was very helpful in supplying data on annual park visitations for all of the
parks in Florida: Everglades National Park, Biscayne National Park, Big Cypress National Park,
and the Dry Tortugas. This data was available online in an interactive format breaking down the
annual visitors into recreational activities, and it also dated back to the first year each park was
opened. Our team also contacted Eve Irwin, the Coordinator of Research Program Services for
the Bureau of Economic and Business Research at the University of Florida, regarding their
Florida Annual Abstract, which provides data on State Park annual visitation at the county level.
She was extremely helpful in providing all of the yearly data that they had available for county-
level State Park visitation. We took the average increase in park visitations from year to year to
determine the baseline.
Our team also contacted Corkscrew Swamp Sanctuary and Loxahatchee National Wildlife
Refuge regarding annual park visitation, as these were larger parks in other counties within
South Florida that kept track of visitation annually. Sirena Rinker at Loxahatchee NWR
compiled annual data by recreational activity dating back to the early 1970s. Her work was
essential to our research. We were able to use these data for Palm Beach County in our
63 For the Everglades National Park, Big Cypress National Park, Biscayne National Park, The Dry
Tortugas, Loxahatchee National Wildlife Reserve and Corkscrew Swamp Sanctuary, we obtained data specific to
the total number of annual visits by their recreational activity. For the state parks, we obtained county-specific
visitor data. While it might appear that turnstile data do not account for entries by boat, our investigation suggests
otherwise. Matt Johnson, who is a supervisory park ranger at Biscayne NP, explained that because these four parks
are part of the national park system they actually keep very good track on the numbers, not just of those entering
through gates but for those entering by boat as well. Specificallyfor each national park: The Dry Tortugas accounts
for every visitor because you can only access it by boat. Big Cypress National Preserve allows ―chartered‖ boat
companies in the area to do guided tours within the park and then those numbers are supposed to be reported
annually to the park because there is an agreement. The monthly breakdown of visitors includes boat launches (see
excel file bigcyp02.10YTD) and these numbers make up the annual report numbers that we used. Biscayne National
Park – this number could be biased downward because there are more ways to participate in recreational activities within the park, but again the outside companies that offer tours have charters with the park. There are snorkeling
companies and chartered boating companies, and the use of these services is already included in the data.
Everglades National Park – again these numbers could be biased downward, but there are 5 entry points into the
park that keep up with the visitors. If there are visitors accessing through other channels, we have now way to know
how many there are or in which spending category (resident, non-resident, overnight, day trip) they fall. Data on all
park visitation are online at http://www.nature.nps.gov/stats/state.cfm?st=fl.

Copyright 2010 Everglades Foundation and Mather Economics 49
estimation. Our main contact at Corkscrew Swamp Sanctuary, Ed Carlson, provided data for
annual visitation to the park dating to when the Sanctuary opened in the late 1950s. Carlson and
his team at the Swamp were very helpful in answering questions and providing data on historical
park visitation.
Second, we used data from National Park Service visitor surveys to determine the ratio of
resident to non-resident visitors for each park. We spoke with Matt Johnson of the National Park
Service (NPS) who directed us to the NPS‘s Project Surveys conducted by the University of
Idaho. The data that was collected within these studies on the ratio of resident to non-resident
respondent visitors for each park was used as a random stratified sample to calculate the ratio of
the total visitors annually. Since there are two national parks in Monroe County, Everglades
National Park and The Dry Tortugas, the average of the respondents for each survey was taken to
determine the ratio. These ratios of residents to non-residents were then applied to the counties
without visitation data that were similar. Counties that were smaller had a ratio of 66 percent
resident to 34 percent non-resident visitors, while larger counties had a ratio of 48 percent to 52
percent. Because there was a large portion of respondents that were Floridians visiting from
another county partaking in these recreational activates, they were counted as resident visitors
because of the high likelihood they were on a day-trip and returned home as shown by their
estimated time of visiting the park. Non-resident visitors were shown to have a longer average
stay time and stayed close to the area.
Third, we estimated county-specific, per-person, per-day travel expenditure figures for both
residents and non-residents who visit the Everglades ecosystem parks, preserves and
sanctuaries.64
See Table 3.1. Our team contacted Kathy Torian, the Corporate Communications
Manager for VISIT FLORIDA, Florida‘s official visitor‘s information company located in
Tallahassee, Florida, because they have a research department that keeps track of tourism
quarterly and annually for the State of Florida. VISIT FLORIDA produces an Annual Visitor‘s
Study each year which tracks the total visitation within the entire state. The data they have for
2008 on resident and non-resident visitation in Florida were used to double check our ratios used
from the NPS Surveys. However, we could not use state-wide data for our purposes. As a result
64 There were 10 counties with specific data on the average daily expenditure for non-resident tourists. For
counties that did not have a non-resident, per day expenditure, we used an average daily expenditure of $106,
calculated by the Fish and Wildlife Conservation Commission for wildlife-viewing in Florida. To estimate resident
travel expenditures, we used the National Park Service visitor survey data to calculate an average per day resident
expenditure for counties that overlap with a national park: Collier, Monroe and Miami-Dade. For counties that did
not have specific data on the per day expenditure for residents, we used the same FWC wildlife-viewing report
which estimated an average daily expenditure of $152 for residents.

Copyright 2010 Everglades Foundation and Mather Economics 50
of this, we looked up every Convention Bureaus or Tourist Development Councils for each of
the 16 counties in South Florida, and contacted someone within each, requesting any data on the
annual visitation to the county they might have and the average per-day travel expenditure. The
following is a list of all the counties and everyone we contacted there concerning county level
visitation annually. Some had information, others did not. Most information was available
online. Some data were for multiple counties, and some counties did not have any data on the
county level. The data on tourism were compiled by tourist marketing agencies in Miami-Dade,
Broward, Palm Beach, Monroe, Collier, Lee, Osceola and Orange counties. The data from the
tourist marketing agencies were obtained from the websites reported in Table 3.1.
Table 3.1 County-Specific Tourism Websites
County Tourism Agency Website
Miami-Dade
Greater Miami CVB
http://www.miamiandbeaches.com
Broward Greater Ft.
Lauderdale CVB
http://www.sunny.org/
Palm Beach Palm Beach County
TDC
http://www.pbcgov.com/touristdevelopment/
Collier Naples, Marco Island
Everglades CVB
http://www.paradisecoast.com/
Lee Lee County CVB
http://www.leecvb.com
Monroe Monroe County TDC
http://www.monroecounty-
fl.gov/Pages/MonroeCoFL_TDC/index
Orange Orlando/Orange
County CVB
http://www.orlandoinfo.com/
Osceola Kissimmee CVB http://www.floridakiss.com/
Correspondence for the data on visitors annually and expenditures were obtained via email for
the counties as listed below in Table 3.2. Some counties do not track these data. For counties
with no available data, a county with data of similar size was used as a proxy for the average
daily expenditure.

Copyright 2010 Everglades Foundation and Mather Economics 51
Table 3.2 County-Specific Information Sources
Palm Beach Chesney, Jackie
http://www.pbcgov.com/touristdevelopment/statistics.htm
St. Lucie
Lombard, Charlotte
http://www.youredc.com/html/visitors.asp
http://www.visitstluciefla.com/media_center.html
Charlotte Huber, Jennifer
http://www.floridaedo.com/
Broward Flippen, Justin
http://www.sunny.org/partners/market-research/
Collier Modys, Jonell
http://www.paradisecoast.com/media_center/research.php
Miami-
Dade
Anderson, William
Director, Panning & Research
Telephone: 305.539.3065
http://www.miamiandbeaches.com/members/webreports.aspx
Martin Palozer, Mary
(772) 288-5445
Hendry
Beer, Kellie
Hendry County Economic
Development Council
http://www.hendryedc.com/
Polk Skinner, Brandy
http://www.cfdc.org/contact
http://www.visitcentralflorida.org/contact/
There were 10 counties with specific data on the average daily expenditure for non-resident
tourists. For counties that did not have a non-resident, per day expenditure, we used an average
daily expenditure of $106, calculated by the Fish and Wildlife Conservation Commission for
wildlife-viewing in Florida. This report was used in lieu of a report conducted by Robert
Kerlinger at Corkscrew Swamp Sanctuary in the early 1990s, which calculated the economic
impact of birding ecotourism on the Corkscrew Swamp Sanctuary, because Kerlinger‘s report
could not be obtained from either Corkscrew Swamp or Kerlinger himself. To estimate resident

Copyright 2010 Everglades Foundation and Mather Economics 52
travel expenditures, we used the National Park Service visitor survey data to calculate an average
per day resident expenditure for counties that overlap with a national park: Collier, Monroe and
Miami-Dade. For counties that did not have specific data on the per day expenditure for
residents, we used the same FWC wildlife-viewing report, which estimated an average daily
expenditure of $152 for residents.
Table 3.3. Expenditure Estimates
County Non-Resident Resident Average
Broward $295.76 $152.00 $223.88
Charlotte $295.45 $152.00 $223.73
Collier $245.67 $140.00 $192.84
Lee $120.08 $152.00 $136.04
Martin $106.00 $152.00 $129.00
Miami-
Dade $242.76 $104.00 $173.38
Monroe $360.00 $113.00 $236.50
Okeechobee $106.00 $152.00 $129.00
Orange $190.25 $152.00 $171.13
Palm Beach $196.11 $152.00 $174.06
Polk $106.00 $152.00 $129.00
St. Lucie $143.00 $152.00 $147.50
In our fourth stage of analysis, we established a baseline of recreational and park visitation
expenditures by multiplying the county-specific resident and non-resident expenditures by the
number of resident and non-resident park visitors.
Finally, in our fifth stage, we estimated the marginal increase in recreational and tourism
expenditures under a 2 percent increase in park visitation projected out 50 years. See Table 3.4.65
Preliminary regressions of water quality and tourist expenditures confirm this to be a likely
scenario.66
65 The counties not listed here have tourism related benefits in other categories, hunting, fishing, wildlife
viewing, but they do not have any official parks and hence there is no increment to park visitation. See Table 4.1
below for instance. 66 Early in our analysis, we investigated a link between species biodiversity, specifically wading bird
populations, and visitation to parks. Carlson and Jason Lauritsen provided extensive data on Wood Stork nesting
populations. We were given data on the number of mating couples each year, the date of nesting initiation, and the
number of young fledged. We were also able to obtain water level data within the Sanctuary as well as the dissolved

Copyright 2010 Everglades Foundation and Mather Economics 53
Table 3.4 Recreational and Park Visitation
Expenditures 2 Percent Increase over 50 years
County NPV Incremental Increase
Broward $103,206,003
Charlotte $58,458,420
Collier $178,150,740
Lee $122,795,151
Martin $13,306,731
Miami-Dade $201,075,047
Monroe $518,206,430
Okeechobee $987,239
Orange $25,849,076
Palm Beach $49,055,665
Polk $5,519,029
St. Lucie $34,978,795
Total $1,311,588,326
O2 levels, phosphorous counts and nitrate levels within the swamp from the SWFMD interactive database. Matthew
Harwell, a Senior Ecologist at Loxahatchee NWR, was very helping in establishing an understanding of the
ecological impact. He sent extensive water data for the park to our team as well as further studies on the ecology of the Everglades. Due to the breadth and scope of this assignment, we did not use this approach to determine the
impact restoring the Everglades pursuant to CERP would have on park visitation. However, we did find some initial
evidence showing a link between red tide data that were collected and the total number of visitors per year to
Corkscrew Swamp based on Wood Stork nesting habits and the water quality. Further investigation is required and
extensive data collection is needed to explore this link further. Though we exhausted every contact at our disposal,
we were not able to assemble this data set.

Copyright 2010 Everglades Foundation and Mather Economics 54
Results and Sensitivity Analysis
Our best estimate of the change in tourism valuation is based on an assumption of a 2 percent
increase over 50 years. This amounts to an increase in economic well-being of $1.146 billion in
net present value terms.
The following scenario analysis explains how the net present value of park visitation and
recreational expenditures vary (a) under different percentage increases in park visitation and (b)
projected to different time horizons. See Table 3.5.
Table 3.5 Sensitivity Analysis
Percent Changes in Park Visitation
Time
Horizon 1% 2% 4%
30 years $470,784,000 $941,567,000 $1,883,134,000
40 years $572,867,000 $1,145,734,000 $2,291,467,000
50 years $655,794,000 $1,311,588,000 $2,623,177,000

Copyright 2010 Everglades Foundation and Mather Economics 55
Chapter 4: Open-Space Valuation
If implemented in its entirety, the Comprehensive Everglades Restoration Plan will produce
approximately 157,555 acres of preserved open space in South Florida. In the absence of the
CERP, this land would likely be inaccessible to the public and or developed as Florida‘s
population grows. But with restoration, this land will provide enhanced recreational
opportunities and aesthetic benefits to the residents of South Florida. In this section, we quantify
these values.
Primary Methodology To estimate the value of open space preservation, we employed a multi-stage process. First, we
used data from the Trust for Public Lands to estimate type-specific and county-specific
willingness-to-pay (WTP) values per acre of preserved open space.67
Our assumption is that
open-space ballot initiatives reveal information on the open space values of Florida voters,
namely, the per acre rate at which voters are willing to tax themselves in order to protect or
enhance open space.
To collect information on voters‘ willingness to pay for open space, we communicated on
4/12/2010 and 4/30/2010 with Andrew DuMoulin, the National Programs Director of the Center
for Conservation Finance Research for Trust for Public Lands. He assisted in creating the Land
Almanac, which documents all land initiatives for a total of 10 states. Mr. DuMoulin explained
and confirmed that the Land Almanac contains information on all voting initiatives specific to
preserving land. Below is his description of the data from the Land Almanac:
All of the COUNTY data in the Almanac has been derived from contacting every
county in Florida that has passed a conservation finance ballot measure. All the
dollars you see are those used for conservation purposes. In [TPL], the LandVote
database which has the details on the ballot measures, you can see how much the
bond, sales tax, prop tax, might generate, and how much of that would be
dedicated to new land conservation. So in short LandVote will show you what
was generated on Election Day, and the Almanac will show you what was spent.
From the Land Almanac, we searched and extracted all data that pertained to Florida, which
included initiatives at the federal, state, municipal and county level of government. We created
67 We gathered acreage and expenditure data by cross-referencing the Land Almanac and other
conservation databases reported by the Trust for Public Land.

Copyright 2010 Everglades Foundation and Mather Economics 56
individual datasets for every county in Florida that aggregated all county or municipal bond
initiatives. We excluded Broward County from our value-per-acre county average because it was
an extreme outlier. Specifically, Broward County‘s willingness to pay per open space acre was
$352,686. This amount is more than 28 times the Florida average ($12,133), and more than 9
times the second highest value per acre (Palm Beach, $37,304). All of Broward County‘s land
initiatives were managed by either Broward County Parks and Recreation or an unknown
manager. Thus, the open space protected under these land initiatives was probably unlike the
CERP land initiatives in scope and size.
We estimated type-specific WTP values because open space preservation projects of different
scale and proximity produce different bundles of aesthetic and recreational benefits.68
Specifically, we grouped the open space and conservation projects into three types: local open-
space bond initiatives, state-wide conservation projects and federally funded wetland
preservation projects.
We estimated county-specific WTP values because the marginal value of open-space
preservation depends on numerous geographic and demographic variables such as population
density and proximity to population centers. Everglades restoration under CERP will encompass
restoration projects throughout South Florida, so using geographically specific values add
precision to the open space valuation.
Averaging across all counties, we estimated WTP values per acre of open-space preservation of
$12,133 for county projects, $4,505 for state projects and $740 for federally funded wetland
projects. These figures comport with economic rationale; voters are willing to tax themselves at a
higher rate for open space that they can enjoy more often and more easily, that is, local open
space.
In the second stage of our analysis, we estimated county-specific open-space value ranges for
each CERP project. We did this by multiplying the county, state and federal WTP values by the
number of acres yet to be acquired under each specific CERP project. For instance, the ―Lakes
Park Restoration‖ project is in the ―Lower West Coast‖ CERP region and has a remaining 40
acres yet to be restored. Because the ―Lower West Coast‖ CERP region overlaps Hendry, Glades
68 For instance, a municipal park in Broward County generates significantly different open space values
than does a federally funded wetland restoration in Glades County.

Copyright 2010 Everglades Foundation and Mather Economics 57
and Lee counties, we multiply an average of those three counties‘ local ($12,133),69
state
($2,716) and federal ($740) WTP values by 40 to estimate a range of open-space values
attributable to that particular CERP project. Our open-space value estimates for that project
range from $485,331 (local WTP) at the upper bound to $29,600 (federal WTP), with our best
estimate being $108,652 (state WTP).
In the final stage of our analysis, we aggregated the range of open-space values across the
remaining acres of each CERP project. We report these aggregations for county, state and federal
WTP values. These type-specific-value estimates define the range of possible open-space values
from Everglades restoration. Because CERP most closely matches the kind of open-space
preservation projects used to calculate the state-level WTP value, the state-level WTP estimate is
our best estimate of the total open space value attributable to Everglades restoration under the
CERP. That estimate is $830,733,000 in net present value terms.
Table 4.1 Open Space Valuation Increase from Everglades Restoration
CERP Region Counties
Open Space
Value Increase
Everglades Agricultural Area Palm Beach and Hendry $31,187,000
Everglades, Florida Bay, and Keys Broward and Miami $318,739,000
Lake Okeechobee Watershed Okeechobee, Glades and Highlands $30,509,000
Lower West Coast Hendry, Glades and Lee $41,611,000
Miami Dade County Miami-Dade $115,507,000
North Palm Beach County Palm Beach $5,752,000
Upper East Coast Martin and St. Lucie $215,220,000
Water Preserve Area Palm Beach, Broward and Miami $72,208,000
Total $830,733,000
If we had used the county-level averages, within their county lines, the value of CERP
restoration would have an aggregate value of $2,763,345,000. If we had used the federal-level
averages for the specific counties with CERP projects, the open-space values of restoration
would have an aggregate value of $116,593,000. We believe that CERP restoration, as planned,
mostly closely reflects state-level valuations for the relevant open space and accordingly that is
our best estimate.
69 Because we did not have data for local open space bond initiatives in these counties, we used the state-
wide average of $12,133.

Copyright 2010 Everglades Foundation and Mather Economics 58
Though the benefits of open-space preservation accrue most directly to residents who live in
close proximity to the conservation area, people who are not part of the local electorate and have
no intention of visiting the Everglades may also be willing to pay for Everglades restoration.
Though we did not include these so-called existence values in our open-space valuation, we can
estimate them using a benefit-transfer method from the existing literature. However, because
these values are based on stated preference (surveys) rather than revealed preference (ballot
initiative voting) and because these values would not impact the South Florida economy, but
rather the larger world economy, we have left them out. This makes our estimate of open space
conservative.
Table 4.2 summarizes these calculations, our assumptions and our sensitivity analysis.
Table 4.2 Changes in Value of S. Florida Open Space Associated with Everglades
Restoration
Lagged Response Possible Range of Values
Years Until
Increase
Begins
Present Value of
Delayed Increase Various WTP/Acre of Open Space
1 $813,646,000 Local State Federal
2 $796,911,000 $2,763,345,000 $830,733,000 $116,593,000
3 $780,520,000
4 $764,467,000
5 $748,743,000
Alternative Methodologies
If we had decided to use contingent valuation studies, we would have focused on studies that
measured the value of an area similar in size and type to the Everglades. Two studies we found
that measured the open space of large, vast areas were studies on the Adirondacks in New York
and the Amazon in Brazil. Both studies surveyed individuals who were not in close proximity to
the large areas. The study of the Adirondacks surveyed individuals who didn‘t necessarily live
close to the Adirondack Park, but still had a willingness to pay $48 to $107 per year, per
household for ecological improvements to the park. The study of the Amazon surveyed
individuals from the UK and Italy and concluded that individuals who may never visit the

Copyright 2010 Everglades Foundation and Mather Economics 59
Amazon had a willingness to pay £29.83 per year per household for 5 percent protection of the
Amazon.
We also looked at the Florida Natural Area Inventory (FNAI) as a possible resource to track the
value of conserved land. We spoke to Sally Jue there who explained that her reports included all
land that had natural vegetation where the managing agency had a commitment to manage and
upkeep the natural state; so this includes recreational parks if they have natural vegetation and
maintain the natural resources. However, the natural areas that the FNAI reports on did not
publish the respective costs to conserve those acres. Thus, it was difficult to assign a per acre
value for the natural areas they track.
We also tried other measures to estimate the open-space value, which included measuring
Florida Forever projects. Much of Florida‘s conserved land is purchased through Florida Forever
(formally P2000). Florida Forever does publish the number of acres and the respective costs of
purchasing those acres. So a value per acre is available. We spoke to Greg Brock at the
Department of Environmental Protection on May 5, 2010, who explained that:
Because the state‘s Florida Forever program funds numerous state, regional and
local land acquisition programs, it is very confusing. The Florida communities
Trust (FCT), which receives 22 percent of the Florida Forever funds, provides
grants of matching funds to some local governments and 100 percent grants to
other qualifying small local governments. The state agencies and water
management districts also cooperate with local governments to acquire property
on their overlapping lists, although many of these partnerships may not be as
formalized as those under FCT. Thus, a local government may be representing
any of these Florida Forever sources for matching funds or grants. Some local
governments have specific program requirements or give great emphasis to
matching local funds with state funds. The state program was authorized by a
constitutional referendum in 1998 that allowed bonds to be sold for acquiring
conservation lands but did not specify a specific amount. However, since then the
state has appropriated more than $3 billion, mostly in bonds, to finance
conservation land purchases of over 650,000 acres.
We also spoke to Theresa Johnson from the Department of Environmental Protection on May 6,
2010, who further explained that Florida Forever receives some funding from bonds that are
bought by individuals. This funding does not accrue by vote of the general electorate and thus
doesn‘t exactly convey the general public‘s willingness to pay.

Copyright 2010 Everglades Foundation and Mather Economics 60
Information Sources
The Nature Conservancy:
Our team contacted Thomas Jordan, director of The Nature Conservancy's (TNC) S. Florida
office; Mary Anne Graves & Victoria Tschinkel in TNC's Tallahassee office; Bob Burns at the
Orlando office; Dan Speilman at the Disney Wilderness Reserve office; Allison Higgins at the
Florida Keys office; Jenny Conners, a senior federal policy representative; and Laura Geselbatch,
a senior marine scientist.
The Conservation Fund:
Our team contacted the national, southeast, Gainesville, Tallahassee and West Palm offices.
Trust for Public Land:
Our team called the national office, and we were directed to the Florida office. Our contact in the
South Florida office, Bob McClemins, pointed us to some existing literature.
Our team spoke with and had email correspondence with Kevin Mooney, the Florida Projects
manager in the Tallahassee office. He was helpful in clarifying the LandVote data.70
He
explained that the ballot measures were prior to the land acquisition, so the voter didn‘t know the
exact acreage they were voting on. Thus we couldn‘t use this data for an acreage value. He
suggested we speak to his director, Will Abbarger, and the county Forever program contact,
Doug Weaver.
Our team obtained the empirical data for open-space value in Florida from the Trust for Public
Land‘s website. Our team used the LandVote database on their website, which reports voting
measures on land conservation. Our team called the contact on the LandVote website who
directed us to Andrew duMoulin. Mr. duMoulin is the National Programs Director for the Center
of Conservation Finance Research. He was extremely helpful, and pointed us to the Land
Almanac. He explained the data behind the Land Almanac database on his website.
American Land Conservancy:
Our team called the national office and spoke to Tim Richardson. He didn‘t have any specific
data to offer, but he did refer us to a number of individuals listed below.
70 See http://www.tpl.org/tier3_cd.cfm?content_item_id=12010&folder_id=2386 for details.

Copyright 2010 Everglades Foundation and Mather Economics 61
Florida Natural Areas Inventory (FNAI):
Our team spoke to Sally Jue, a conservation lands biologist. She was very helpful and supplied
empirical data regarding the acreage of natural areas that are conserved throughout Florida. She
said this included all land that had natural vegetation where the managing agency had a
commitment to manage and upkeep the natural state, so this includes recreational parks if they
have natural vegetation and maintain the natural resources. Ms. Jue noted that South Florida is
more lenient on the classifications. This was a backup plan for determining the acreage value of
conserved land in Florida. We obtained conserved acreage state wide and county wide.
Florida Forever (DEP):
Our team spoke to Theresa Johnson, who is involved with state lands acquisition. She explained
how Florida Forever benefits from state bonds. She said that the legislature sets a budget that is
approved by the governor and his cabinet. Then individuals buy Florida Forever specific bonds.
We obtained Florida Forever (formally P2000) data on acreage and purchase amounts for public
land. However, we felt this didn‘t accurately capture the general public‘s willingness to pay as
well as would an initiative to pass a bond measure. Our team also spoke to Ray Petty, Florida
Forever‘s bond specialist, who explained that the SFWMD sells their own bonds, and that the
Everglades has one bond per year worth $40 million.
Our team spoke to Sheryl Jones, who supplied us with empirical Florida Forever data that
contained both the approved commitments and the anticipated acquisitions for all agencies that
receive Florida Forever funding. We considered this as a possible method to determining acreage
value. However, we decided that the Land Almanac data captured a more accurate figure for
estimating the open-space value of the Everglades. This Florida Forever data could not be broken
down into county-level data. It also included greenways, trails, agriculture and water open
spaces. This data also included land that was acquired by imminent domain, which definitely
does show an individual‘s willingness to pay.
Via email correspondence, Greg Brock, director of Florida Forever, explained the Florida
Forever bonds in the Land Almanac:
Because the state‘s Florida Forever program funds numerous state, regional and
local land-acquisition programs it is very confusing. The Florida communities
Trust (FCT), which receives 22 percent of the Florida forever funds, provides
grants of matching funds to some local governments and 100 percent grants to
other qualifying small local governments. The state agencies and water
management districts also cooperate with local governments to acquire property

Copyright 2010 Everglades Foundation and Mather Economics 62
on their overlapping lists, although many of these partnerships may not be as
formalized as those under FCT. Thus, a local government may be representing
any of these Florida Forever sources for matching funds or grants. Some local
governments have specific program requirements or give great emphasis to
matching local funds with state funds. The state program was authorized by a
constitutional referendum in 1998 that allowed bonds to be sold for acquiring
conservation lands, but did not specify a specific amount. However, since then,
the state has appropriated more than $3 billion, mostly in bonds, to finance
conservation land purchases of more than 650,000 acres.
Our team was referred to Amy Graham in the DEP and John Atlan who is in the office of the
secretary and part of the ―Save our Everglades‖ campaign. Our team spoke to John Outland,
from the DEP Office of Ecosystem Projects, who put us in touch with Jim Muller. Jim Muller
sent us multiple pieces of literature and links.
Land Trust Alliance:
Our team contacted the national office in Washington, D.C.
Local Florida Land Trust Alliances:
Our team also tried calling all the local land trusts in Florida in efforts to gather more
information on county specific open-space value. Our team called the Calusa Land Trust in Lee
County and spoke to Bill Spikowski, who directed us to The Nature Conservancy. He directed us
to some existing literature on land conservation. We also called the Conservation Foundation
located in Sarasota County. Our team called the Indian River Land Trust and spoke with Dana
who directed us to the director, Ralph Monticello. Mr. Monticello gave us contact information.
Our team contacted Manatee Audubon, Tall Timbers in Leon County, Green Horizon in Polk
County, the Alachua Conservation Trust, Bay County Conservancy, Tampa Bay Conservancy,
Putnam Land Conservancy, North Florida Land Trust located in Duval County, Treasured Lands
located in Martin County, Lemon Bay Conservancy located in Sarasota County, Davie Land
Trust located in Broward County and Conserve Florida located in Alachua County.
Individuals:
We were referred to a number of individuals from previous contacts at The Nature Conservancy,
Trust for Public Land, American Land Conservancy and/or Land Trust Alliance:
Our team spoke to Mark Duda from responsive management. He offered some recreational

Copyright 2010 Everglades Foundation and Mather Economics 63
studies and surveys on his website. However, that open space was not comparable to the open
space in the Everglades. Our team spoke with Brad Gentner from Gentner Consulting group,
who specializes in natural resource economics consulting. He pointed us to the Environmental
Valuation Reference Inventory (EVRI) database, which contains contingent valuation studies for
all environmental topics. We searched open space and other large open spaces, i.e. Adirondacks,
and found some possible studies. However, our team decided not to use contingent valuation
studies. Our team spoke with Rob Southwick from Southwick and Associates. Our team spoke to
Evan Miller from Florida Acquisition & Appraisal. He explained to us different types of bonds
used for land conservation. He then suggested we call Florida Forever. He also gave us a specific
Hillsboro bond to look at as an example.
South Florida Water Management District (SFWMD):
Our team spoke with Anita from the SFWMD Palm Beach service center, and she said the entire
16-county area was serviced by the SFWMD, whose website says the area is a total of 17,930
square miles (11,475,200 acres) (over 7 million people) and includes 700,000 acres of
Everglades Agricultural Area. The following map shows the boundaries of SFWMD by county:
https://my.sfwmd.gov/portal/page/portal/pg_grp_sfwmd_aboutsfwmd/pg_sfwmd_aboutsfwmd_o
verviewmaps.
Our team also spoke to Clarence Tear, director of the Big Cypress SFWMD Office, who told us
future water data is on the SFWMD website, under water supply plans. There are four areas:
Upper East Coast, Lower East Coast, Lower West Coast and Kissimmee Basin. Each has its own
water plan (and model) that projects water usage for the next 20 years. These are updated every
five years (last one on web, 2005). Then, based on these reports, each county updates its utility
plan.
County Level Desalination Efforts:
To learn about county-level desalination efforts, our team called the SFWMD regional service
centers. Our team spoke to Jennifer Drozd in the permit office, and she said there weren‘t
permits regarding desalination. Our team also spoke to Donna Ricabus, Sr. Scientist. We also
contacted Mark Elsner in the water supply department. He pointed out the desalination section
on their website: http://www.sfwmd.gov/portal/page/portal/xweb%20-
%20release%203%20water%20supply/desalination. He also showed us the current and projected
desalination efforts by region:
http://www.sfwmd.gov/portal/page/portal/xrepository/sfwmd_repository_pdf/desal_comb_2008.
pdf‘. He pointed out the Water supply library, which has different water supply plans by region

Copyright 2010 Everglades Foundation and Mather Economics 64
and lays out project summaries by region:
http://www.sfwmd.gov/portal/pls/portal/portal_apps.repository_lib_pkg.repository_browse?p_ke
ywords=uecwatersupplyplandocs&p_thumbnails=no. For example, see the Upper East Coast
Water Supply plan:
http://www.sfwmd.gov/portal/page/portal/xrepository/sfwmd_repository_pdf/uec-plan_final.pd.
The Water supply development plan, which has utility and project summaries in specific counties
in Part III (starting on page 29). Mr. Elsner said that he would compile county-level data that
would show data on each county‘s facilities, water capacity and desalination capacity as of 2012.
Mark followed up in an email on 7/26/2010 with county-level desalination efforts.
Water Utilities:
Our team spoke to Lisa Bockarton, from the SEFLUC, in an effort to obtain water prices. She
referred us to individual utilities departments to get the different prices of water by county. Our
team spoke to Andy Potts from Collier County, and he faxed us over some rate tables from 2002
– 2008. This was our most successful contact at the county utility level.

Copyright 2010 Everglades Foundation and Mather Economics 65
Chapter 5: Commercial and Recreational Fishing Valuation
Literature Review and Background
Effect of Everglades Degradation on Fish Population
A number of studies and articles point to 1987 as the year when degradation of fish habitat and
population began. The following statement from Broward and Robblee (1999) implies that the
majority of occurrences that negatively impacted fish population, such as die-off of seagrasses,
hypersaline conditions and algal blooms, all began after 1986:71
The decline roughly coincided with the die-off of seagrasses in western Florida
Bay beginning in fall 1987, drought-related hypersaline conditions between 1989
and 1991 and extensive algal blooms that persisted into the 1990s (p. S20).
In addition, a 2002 article in U.S. Water News Online reported the following:
Although increasingly salty, Florida Bay still drew anglers from around the world
who were attracted by its fabulous fishing and its crystal waters. Then, in the
summer of 1987, about 100,000 acres of seagrass died off. Algae blooms and
sponge die-offs followed, spoiling the water's clarity. The population of fish,
shrimp, sponges and other creatures declined.72
These observations imply that 1986 may be an acceptable base year to use as an estimator of
fishing value prior to the majority of degradation in Florida Bay. It is assumed that the timing of
degradation in Florida Bay provides an appropriate estimate for the timing of fish habitat and
population degradation throughout the rest of the 16 Everglades ecosystem counties.
Impact on Fish Population
From Browder and Robblee (1999), it is hypothesized that CERP will have the following
consequences on fish population:
Hypothesis 1: CERP will expand the gradient of salinities from near fresh to
71 Browder, Joan A. and Robblee, Michael B. ―Pink shrimp as an indicator for restoration of everglades
ecosystems.‖ Ecological Indicators, 9 (6, Supplement 1), (November 2009): S17-S28. 72 http://www.uswaternews.com/archives/arcquality/2sciwar9.html.

Copyright 2010 Everglades Foundation and Mather Economics 66
polyhaline to cover a larger nearshore zone and will reduce salinity fluctuation to
a range and frequency characteristic of natural estuarine conditions, increasing the
area of optimum salinity conditions for many species and, as a result, expanding
local distribution, increasing abundance, and allowing a richer species
assemblage.
Hypothesis 2: CERP will reduce the intensity, duration, and area of coverage of
hypersaline conditions, thereby increasing the area of optimum salinity conditions
for nearshore fish and invertebrates.
Hypothesis 3: CERP will increase the area covered by patchy or heterogeneous
seagrass habitat, thereby increasing the area of optimum habitat for seagrass-
associated fish and invertebrate species.
Hypothesis 4: CERP will increase the length of shoreline receiving direct
freshwater inflow and establish more persistent salinity gradients, thereby
increasing the area of optimum habitat for fish species spending all or a part of
their life cycle along the shoreline.
Hypothesis 5: CERP will increase the area of overlap of favorable salinities with
favorable bottom habitats and shoreline features, thereby increasing the
distribution and abundance of a richer assemblage of species characteristic
of estuaries.73
The Comprehensive Everglades Restoration Plan states that ―not enough is known about the
linkages between fishing and hydrological changes, which would be brought about by plan
implementation, nor is enough known about the timing of the linkages between these changes,
the resulting ecological changes, and ultimately the changes in the value of fishing, to estimate
the economic effects on fishing in this study.‖ CERP therefore does not currently provide an
estimate by which to measure the effect of fish population due to restoration.
However, the 2009 paper ―Pink shrimp as an indicator for restoration of Everglades ecosystems‖
by Browder and Robblee suggests a means by which to measure the success of the CERP in
terms of marine life post-restoration and suggests they adjust restoration according to this
73 Browder and Robblee (2009).

Copyright 2010 Everglades Foundation and Mather Economics 67
measure. The authors state that an appropriate target for CERP to adopt is the maintenance, at a
minimum, of an annual mean density of pink shrimp at the 75th quartile of the long-term record.
Pink shrimp thrive at particular levels of salinity, and actions could be taken to keep average
salinity within the optimal range. Their description is as follows:
Annual assessment will consist of determining whether mean shrimp density
exceeds a threshold based on the available pre-CERP data. Because shrimp
density is expected to vary from year to year as a result of natural patterns of
variability in salinity and other influencing factors, annual mean density (fall and
spring separately) will also be viewed as a three-year running average when
sufficient data become available. Annual mean density targets for each season are
to meet or exceed the 75th quartile from the long-term record for each assessment
area.74
We assumed that if the CERP adopts this measure, the catch of pink shrimp would also be 75
percent of the long-term record. It is also assumed that all fish populations would respond
similarly. Under these assumptions, the year with the largest amount of commercial catch (in
pounds) would serve as the base by which to calculate the 75th percentile target catch.
Impact on Commercial Fishing
Methodological Approach Data on commercial catch per species for each county in Florida were obtained for the years
1986 through 2008.75
Earlier data are considered unreliable (according to the Florida Fish and
Wildlife Research Institute), and 2009 data are currently incomplete. Nine of the 16 Everglades
counties affected by CERP have local commercial fishing industries. These counties are
Broward, Charlotte, Collier, Miami-Dade, Lee, Martin, Monroe, Palm Beach and St. Lucie.
In order to determine the total commercial catch in Everglades ecosystem counties in a given
year, total commercial catch (in pounds) for all species caught in each of the nine counties in that
year were added together. Figure 5.1 illustrates the general decrease in total catch over the 23
years examined.
74 Browder and Robblee (2009). 75 Commercial catch data obtained from Steve Brown at the Florida Fish and Wildlife Research Institute;
this data can also be viewed at http://research.myfwc.com/features/view_article.asp?id=19224.

Copyright 2010 Everglades Foundation and Mather Economics 68
In order to determine the direct value of commercial catch in the Everglades for a given year,
commercial catch in each county (in pounds) was summed for each species; these values were
then multiplied by the 2009 average dockside values for the species to obtain total dockside
values for catch of each species in all Everglades counties.76
These total dockside values for all
species were then summed to obtain the total dockside value of commercial catch in all
Everglades counties. Figure 5.2 shows the values for each of the 23 years examined.
Figure 5.1: Total Commercial Catch in Everglades Counties (pounds)
76 Available on the Florida Fish and Wildlife Conservation Commission‘s website
http://research.myfwc.com/features/view_article.asp?id=19224 under commercial landings, statewide.
0
10,000,000
20,000,000
30,000,000
40,000,000
50,000,000
60,000,000
70,000,000
198619881990199219941996199820002002200420062008
Total Catch in Everglades Counties,in Pounds
Total Catch

Copyright 2010 Everglades Foundation and Mather Economics 69
Figure 5.2: Total Dockside Value of Commercial Catch in Everglades Counties (dollars)
As an initial estimate of the change in the direct value of commercial fishing due to Everglades
degradation, total dockside value of commercial catch in 2008 was compared with total dockside
value in 1986 in Table 5.1. It is assumed that commercial fishing regulations are enacted such
that commercial fishing catch as a percent of fish stock remains constant over time, and thus, as
fish stock increases with restoration, regulations will change to allow total commercial catch to
increase linearly.
Table 5.1: Historical Change in Commercial Catch and Dockside Value, 1986 to 2008
1986
2008
Change in
Value
Percent Change
Total Catch
54,675,865
27,962,536
-26,713,329
- 48.9%
Total Dockside
Value
$93,096,606
$53,717,243
-$39,379,363
- 42.3%
0
20,000,000
40,000,000
60,000,000
80,000,000
100,000,000
120,000,000
19
86
19
88
19
90
19
92
19
94
19
96
19
98
20
00
20
02
20
04
20
06
20
08
Total Dockside Value of Commercial Catch in Everglades Counties, in Dollars
Total Dockside Value

Copyright 2010 Everglades Foundation and Mather Economics 70
Dockside value decreased $53,717,243 or 42.3 percent, from 1986 to 2008. However, there was
a net ban that went into effect in Florida in 1995: "The net ban which was passed by plebiscite in
1994 and became effective in July of 1995 has reduced the number of commercial fishermen by
several thousand."77
In order to eliminate the possibility of this net ban as the cause of this large
decrease in catch and dockside value, we also calculate the change in dockside value between
1996 and 2008 in Table 2. The effects in Everglades counties appear to be about the same when
comparing 1986 to 2008 as they are when comparing 1996 to 2008. Table 5.2 shows that
dockside value decreased by $51,560,745, or 49 percent, from 1996 to 2008.
Table 5.2: Historical Change in Commercial Catch and Dockside Value, 1996 to 2008
1996
2008
Change in
Value
Percent Change
Total Catch
55,561,538
27,962,536
-27,599,002
- 48.7%
Total Dockside
Value
$105,277,988
$53,717,243
-$51,560,745
- 49.0%
Based on the recommended CERP measure discussed in Browder and Robblee‗s 2009 pink
shrimp study, we assume that total commercial catch post-CERP will be at least 75 percent of the
highest commercial catch on record. The year with the highest commercial catch in Everglades
counties is 1989. The estimates for expected post-CERP value (75 percent of 1989) and total
future dockside value are shown in Table 3. Future dockside value was calculated by adding up
catch in all Everglades counties for each species, multiplying this by .75, then multiplying these
estimated numbers for future catch by the per-pound 2009 price for each species. These values
were summed to obtain the expected future dockside value given in Table 5.3. The difference in
total dockside value post-CERP using 1989 values and this means of estimation is $23,271,221,
or a 43.3 percent increase in 2009 dollars from current 2008 value.
77 http://www.southeasternfish.org/Documents/EcoValueAquatic.pdf.

Copyright 2010 Everglades Foundation and Mather Economics 71
Table 5.3: Estimated Change in Commercial Catch and Dockside Value Post-CERP
(based on 1989 catch)
1989
Post-CERP
estimate (89)
2008
Change in
Value
Percent
Change
Total Catch
58,302,223
43,726,667
27,962,536
15,764,131
+ 56.4%
Total
Dockside
Value
N/A
$76,988,464
$53,717,243
$23,271,221
+ 43.3%
If we look at the years post-1995 in order to take the net ban into account, the largest commercial
catch landed in Everglades counties was in 1996. The estimation technique used in Table 5.4 is
the same as that described using the 1989 catch for Table 5.3. The difference in total dockside
value is $25, 241, 248, or a 47 percent increase, using 1996 values and this means of estimation.
Table 5.4: Estimated Change in Commercial Catch and Dockside Value Post-CERP
(based on 1989 catch)
1996
Post-CERP
estimate (96)
2008
Change in
Value
Percent
Change
Total Catch
55,561,538
41,671,154
27,962,536
13,708,618
+ 49.0%
Total
Dockside
Value
N/A
$78,958,491
$53,717,243
$25,241,248
+ 47.0%
The estimated change in commercial dockside value per year in Everglades counties (direct
value) due to completed CERP restoration, based upon the target measures laid out by Browder
and Robblee, is estimated as an increase in value between $23,271,221 and $25,241,248. CERP
is estimated to take 20 to 30 years to reach its complete restoration goals. We assume that CERP
will cause a linear increase in the dockside value of commercial fish over this period, and then
remain at a constant dockside value in perpetuity once the restoration point is reached. A 20-year
restoration period was used for our calculations in Table 5.5, and a 30-year restoration period
was used for calculations in Table 5.6. Both estimations used a 2.1 percent discount rate.

Copyright 2010 Everglades Foundation and Mather Economics 72
Using the 20-year restoration period (Table 5.5), we estimate that CERP will increase total
Everglades commercial dockside value by $1,262,062.40 each year for 20 years (using the 1996-
based estimate of a 49 percent increase in catch). This is followed by a constant expected
restored dockside value of $25,241,1250 above non-restoration expected value (if conditions
remain as-is in perpetuity) in perpetuity beginning in year 21. The present value for each year‘s
increase in value was calculated and discounted back to the present based on a 2.1 percent
discount rate in Table 5.5. The sum of these numbers provides an estimated increase in the
present value of commercial fishing in the Everglades due to CERP of $1,052,463,057.
Using the 30-year restoration period (Table 5.6), we estimate that CERP will increase total
Everglades commercial dockside value by $841,375 each year for 30 years (using the 1996-
based estimate of a 49 percent increase in catch). The present value for each year‘s increase in
value was calculated and discounted back to the present based on a 2.1 percent discount rate in
Table 5.6. The sum of these numbers provides an estimated increase in the present value of
commercial fishing due to CERP of $24,603,244 over these 30 years.
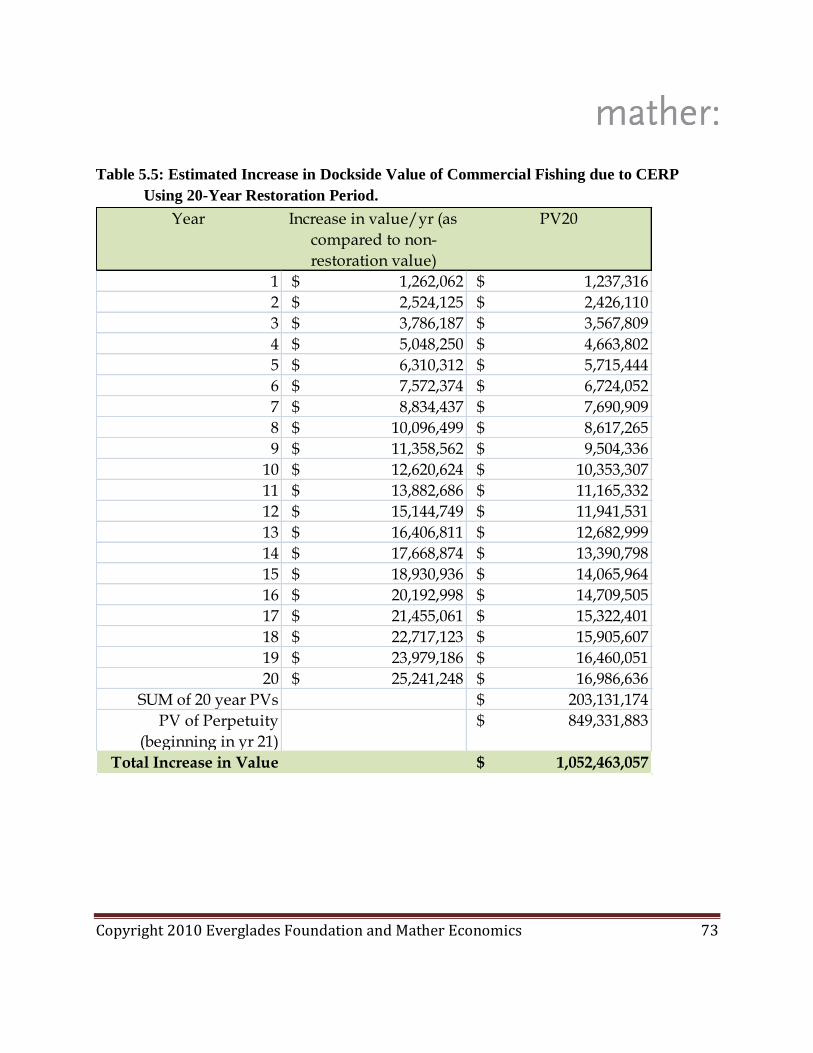
Copyright 2010 Everglades Foundation and Mather Economics 73
Table 5.5: Estimated Increase in Dockside Value of Commercial Fishing due to CERP
Using 20-Year Restoration Period.
Year Increase in value/yr (as
compared to non-
restoration value)
PV20
1 $ 1,262,062 $ 1,237,316
2 $ 2,524,125 $ 2,426,110
3 $ 3,786,187 $ 3,567,809
4 $ 5,048,250 $ 4,663,802
5 $ 6,310,312 $ 5,715,444
6 $ 7,572,374 $ 6,724,052
7 $ 8,834,437 $ 7,690,909
8 $ 10,096,499 $ 8,617,265
9 $ 11,358,562 $ 9,504,336
10 $ 12,620,624 $ 10,353,307
11 $ 13,882,686 $ 11,165,332
12 $ 15,144,749 $ 11,941,531
13 $ 16,406,811 $ 12,682,999
14 $ 17,668,874 $ 13,390,798
15 $ 18,930,936 $ 14,065,964
16 $ 20,192,998 $ 14,709,505
17 $ 21,455,061 $ 15,322,401
18 $ 22,717,123 $ 15,905,607
19 $ 23,979,186 $ 16,460,051
20 $ 25,241,248 $ 16,986,636
SUM of 20 year PVs $ 203,131,174
PV of Perpetuity
(beginning in yr 21)
$ 849,331,883
Total Increase in Value $ 1,052,463,057

Copyright 2010 Everglades Foundation and Mather Economics 74
Table 5.6: Estimated Increase in Dockside Value of Commercial Fishing due to CERP
Using 30-Year Restoration Period.
Year Increase in value/yr (as
compared to non-
restoration value)
PV30
1 $ 841,375 $ 824,877
2 $ 1,682,750 $ 1,617,407
3 $ 2,524,125 $ 2,378,539
4 $ 3,365,500 $ 3,109,202
5 $ 4,206,875 $ 3,810,296
6 $ 5,048,250 $ 4,482,702
7 $ 5,889,625 $ 5,127,273
8 $ 6,731,000 $ 5,744,844
9 $ 7,572,375 $ 6,336,225
10 $ 8,413,750 $ 6,902,206
11 $ 9,255,125 $ 7,443,555
12 $ 10,096,500 $ 7,961,021
13 $ 10,937,875 $ 8,455,333
14 $ 11,779,250 $ 8,927,199
15 $ 12,620,625 $ 9,377,310
16 $ 13,462,000 $ 9,806,338
17 $ 14,303,375 $ 10,214,935
18 $ 15,144,750 $ 10,603,739
19 $ 15,986,125 $ 10,973,368
20 $ 16,827,500 $ 11,324,425
21 $ 17,668,875 $ 11,657,496
22 $ 18,510,250 $ 11,973,152
23 $ 19,351,625 $ 12,271,948
24 $ 20,193,000 $ 12,554,422
25 $ 21,034,375 $ 12,821,101
26 $ 21,875,750 $ 13,072,495
27 $ 22,717,125 $ 13,309,101
28 $ 23,558,500 $ 13,531,403
29 $ 24,399,875 $ 13,739,870
30 $ 25,241,250 $ 13,934,959
SUM of 30 year PVs $ 264,286,741 $ 264,286,741
PV of Perpetuity
(beginning in yr 31)
$ 696,747,966
Total Increase in Value $ 961,034,707

Copyright 2010 Everglades Foundation and Mather Economics 75
Our best estimate is that commercial fishing catch will increase, in present value terms, by a total
of $524 million (assuming a 20-year time to full recovery for the fishery).78
Table 5.7 captures
these calculations in summary form.79
Table 5.7 Estimates of Commercial Fish Catch Increase From Everglades Restoration
Time for Fishery to Recover After Everglades
Restoration
Discount Rate 2.1% Immediately 20 Years 30 Years
NPV Increase 716,129,276 $524,131,653
$41,139,562
Impact on Recreational Fishing
The estimates for commercial fishing suggest that there is potential for a 49 percent to 56 percent
increase in commercial fishing catch post-CERP (see table 5.3 and 5.4, percent change in
commercial catch). It is assumed that this estimated percent increase in commercial catch can
also be applied to recreational fishing in the Everglades.
According to Fedler (2009), largemouth bass is the most common fish targeted in the Everglades
region, but we note that it is not the most valuable.80
Salt water fish such as bone and tarpon have
much higher valuation in the eyes of fishermen,81
and these species will be impacted in Florida
Bay in a positive way by the return of sheet flow. However, as is revealed below, we use a
conservative approach using time series data from the fresh water species where the impacts of
restoration are more certain in our eyes. In addition, CERP‘s Lake Okeechobee Performance
78 As a check on our estimates, we also estimated the change in fishery catch using data from the net ban
that went into effect in Florida in 1995. This method suggests that Everglades restoration will increase catch by
about 57 percent. To be conservative in our forecasts, we use the earlier, lower estimate already discussed. 79 Keep in mind that we are only forecasting a return to 49 percent of the baseline catch. Therefore, our
estimates are only 49 percent of the values in Tables 5.5 and 5.6. Again, this emphasizes our conservative approach to benefits calculations.
80 A survey of Everglades anglers by Fedler provided this information; 40 percent of saltwater angler days
are spent targeting largemouth bass. 81 See Fedler and Hayes, ―Economic Impact of Recreational Fishing for Bonefish, Permit and Tarpon in
Belize for 2007,‖ online at http://www.turneffeatoll.org/fota-action-plan/economic-study where the value of these
species are estimated in nearby Belize.

Copyright 2010 Everglades Foundation and Mather Economics 76
Measure Documentation Sheet (2007)82
states that desired post-restoration conditions include:
―Improved density, age structure, and condition of black crappie, largemouth bass and brim in
the littoral and near-shore regions of the lake. Increased diversity and extent of forage fish. Fish
are expected to respond directly to changes in habitat structure, caused by more favorable water
levels, and changes in resource availability, which will be determined in part by external nutrient
inputs. Setting quantitative targets for the fish populations requires further research and data
collection.‖ Thus, we choose to use increase in recreational catch of largemouth bass to estimate
the increase in consumer surplus for recreational anglers due to CERP restoration.
We again assume that quantitative targets are set at 75 percent of total fish population, as
suggested by Broward and Robblee and used to estimate the changes in commercial fishing catch
in the previous section. Thus, we estimate that there is potential for a 49 percent increase in
recreational fishing catch.
On average, recreational anglers catch 59 bass each year in Southeast Florida, with an estimated
marginal value per fish of $4.32.83
The FWC 2006 survey of Fishing, Hunting and Wildlife
estimates that each angler in Florida spends 17 days fishing (this is an average of residents and
non-residents); therefore we estimate that on average, anglers currently catch 3.47 bass per day.
Using the potential 49 percent increase in catch due to the CERP estimated for commercial
fishing, this provides a potential estimated increase in catch per angler, per day of 1.7 bass. The
total number of fishing licenses sold84
in 2008 in the 16 Everglades counties was found by
Stronge (2010) to be 362,300.85
However, the FWC states, ―It is important to note that only
about half of Florida anglers actually have to purchase a license due to various exemptions, so
these numbers do not reflect participation.‖86
Therefore, we multiply resident angler licenses in
Everglades counties by 1.5 in order to estimate the number of resident anglers in these counties.
The number of combination licenses sold was given only in total number rather than by resident
status; as residents purchased 54 percent of freshwater licenses and 67 percent of saltwater
licenses, we estimate that about 60 percent of combination licenses will have been purchased by
residents, and we multiply this number by 1.5 in order to estimate the number of resident fresh
82 http://www.evergladesplan.org/pm/recover/recover_docs/et/lo_pm_fish.pdf. 83 http://myfwc.com/CONSERVATION/FishingBassConservationCenter_Value.htm. 84 This includes both residents and nonresidents for freshwater licenses, saltwater licenses, and combination
licenses. 85 Stronge, W.B. The Economics of the Everglades Watershed and Estuaries: Phase 2 - 2010 Update of
Data Analysis. Prepared for the Everglades Foundation (March 2010). 86 http://myfwc.com/CONSERVATION/Conservation_ValueofConservation_EconFreshwaterImpact.htm.

Copyright 2010 Everglades Foundation and Mather Economics 77
and saltwater combination anglers.
We then sum these estimates to obtain the estimated number of anglers who have purchased
licenses in Everglades counties or fish in Everglades counties, but are exempt from the need to
purchase a license. We assume this is an appropriate (though on the low-end) estimate for the
number of anglers fishing in Everglades counties in a given year. Given the FWC estimates the
average number of days spent fishing per angler at 17.2, the estimate of 467,855 anglers in the
Everglades leads to an estimated 8,047,113 angler-days fishing in the Everglades. Table 5.8
reports these details.
Table 5.8: Estimated Number of Recreational Fishermen in Everglades Counties
Estimated # Recreational Saltwater Anglers (x1.5) 173,278.50
Estimated # Recreational Freshwater Anglers (x1.5) 100,005.00
Nonresident Saltwater Licenses 99,913.00
Resident Freshwater Licenses 31,995.00
Estimated # Resident Combo Anglers (x.6x1.5) 43,382.70
Estimated # Nonresident Combo Licenses (x.4) 19,281.20
Sum of Non-residential Licenses and Resident Angler Estimates 467,855.40
EST DAYS (Sum licenses x 17) 8,047,112.88
This estimated number of angler days is multiplied by the estimated increase in Everglades
recreational bass catch post-CERP (1.7) to get an estimated increase of 13,841,034 fish caught
each year. The estimated increase in value due to restoration (based on a marginal value per bass
of $4.32) is then $59,793,267.54 for each year after restoration is complete. A 20-year
restoration period was used for our calculations in Table 5.8. A 30-year restoration period was
used for calculations in Table 5. 9. A 2.1 percent discount rate was used for both estimations.
Using the 20-year restoration period (Table 5.8), we estimate that CERP will increase total
angler surplus in the Everglades by $2,989,663 each year for 20 years. This is followed by a
constant expected restored dockside value of $59,793,268 above non-restoration expected value
(if conditions remain as-is in perpetuity) in perpetuity beginning in year 21. The present value for
each year‘s increase in value was calculated and discounted back to the present based on a 2.1
percent discount rate in Table 5.9. The sum of these numbers provides an estimated increase in
the present value of recreational fishing in the Everglades due to CERP of $2,287,076,218.
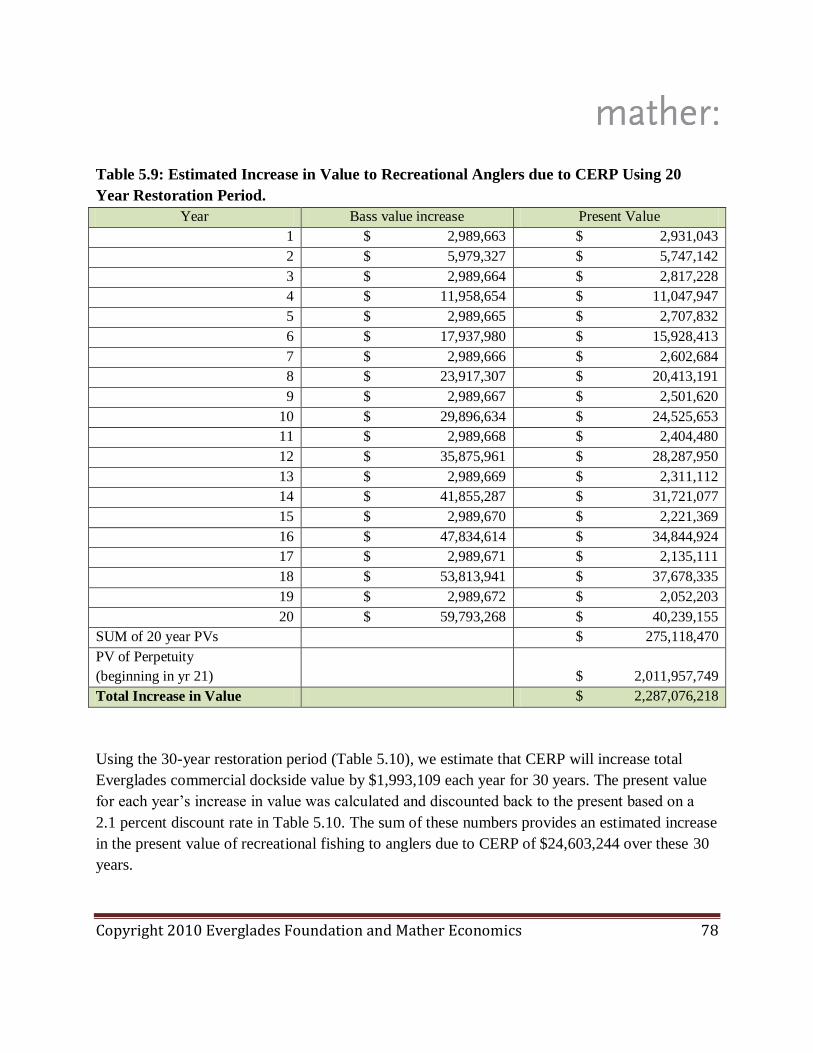
Copyright 2010 Everglades Foundation and Mather Economics 78
Table 5.9: Estimated Increase in Value to Recreational Anglers due to CERP Using 20
Year Restoration Period.
Year Bass value increase Present Value
1 $ 2,989,663 $ 2,931,043
2 $ 5,979,327 $ 5,747,142
3 $ 2,989,664 $ 2,817,228
4 $ 11,958,654 $ 11,047,947
5 $ 2,989,665 $ 2,707,832
6 $ 17,937,980 $ 15,928,413
7 $ 2,989,666 $ 2,602,684
8 $ 23,917,307 $ 20,413,191
9 $ 2,989,667 $ 2,501,620
10 $ 29,896,634 $ 24,525,653
11 $ 2,989,668 $ 2,404,480
12 $ 35,875,961 $ 28,287,950
13 $ 2,989,669 $ 2,311,112
14 $ 41,855,287 $ 31,721,077
15 $ 2,989,670 $ 2,221,369
16 $ 47,834,614 $ 34,844,924
17 $ 2,989,671 $ 2,135,111
18 $ 53,813,941 $ 37,678,335
19 $ 2,989,672 $ 2,052,203
20 $ 59,793,268 $ 40,239,155
SUM of 20 year PVs $ 275,118,470
PV of Perpetuity
(beginning in yr 21) $ 2,011,957,749
Total Increase in Value $ 2,287,076,218
Using the 30-year restoration period (Table 5.10), we estimate that CERP will increase total
Everglades commercial dockside value by $1,993,109 each year for 30 years. The present value
for each year‘s increase in value was calculated and discounted back to the present based on a
2.1 percent discount rate in Table 5.10. The sum of these numbers provides an estimated increase
in the present value of recreational fishing to anglers due to CERP of $24,603,244 over these 30
years.

Copyright 2010 Everglades Foundation and Mather Economics 79
Table 5.10: Estimated Increase in Value to Recreational Anglers due to CERP Using 30-
Year Restoration Period.
Year Bass value increase Present Value
1 $ 1,993,109 $ 1,954,028
2 $ 3,986,218 $ 3,831,428
3 $ 5,979,327 $ 5,634,453
4 $ 7,972,436 $ 7,365,298
5 $ 9,965,545 $ 9,026,101
6 $ 11,958,654 $ 10,618,942
7 $ 13,951,762 $ 12,145,849
8 $ 15,944,871 $ 13,608,794
9 $ 17,937,980 $ 15,009,699
10 $ 19,931,089 $ 16,350,435
11 $ 21,924,198 $ 17,632,822
12 $ 23,917,307 $ 18,858,633
13 $ 25,910,416 $ 20,029,594
14 $ 27,903,525 $ 21,147,385
15 $ 29,896,634 $ 22,213,639
16 $ 31,889,743 $ 23,229,950
17 $ 33,882,852 $ 24,197,864
18 $ 35,875,961 $ 25,118,890
19 $ 37,869,069 $ 25,994,494
20 $ 39,862,178 $ 26,826,103
21 $ 41,855,287 $ 27,615,106
22 $ 43,848,396 $ 28,362,854
23 $ 45,841,505 $ 29,070,662
24 $ 47,834,614 $ 29,739,807
25 $ 49,827,723 $ 30,371,535
26 $ 51,820,832 $ 30,967,056
27 $ 53,813,941 $ 31,527,545
28 $ 55,807,050 $ 32,054,149
29 $ 57,800,159 $ 32,547,981
30 $ 59,793,268 $ 33,010,122
SUM of 30-year PVs $ 626,061,222
PV of Perpetuity
(beginning in yr 31)
$ 1,650,506,118
Total Increase in Value $ 2,276,567,341
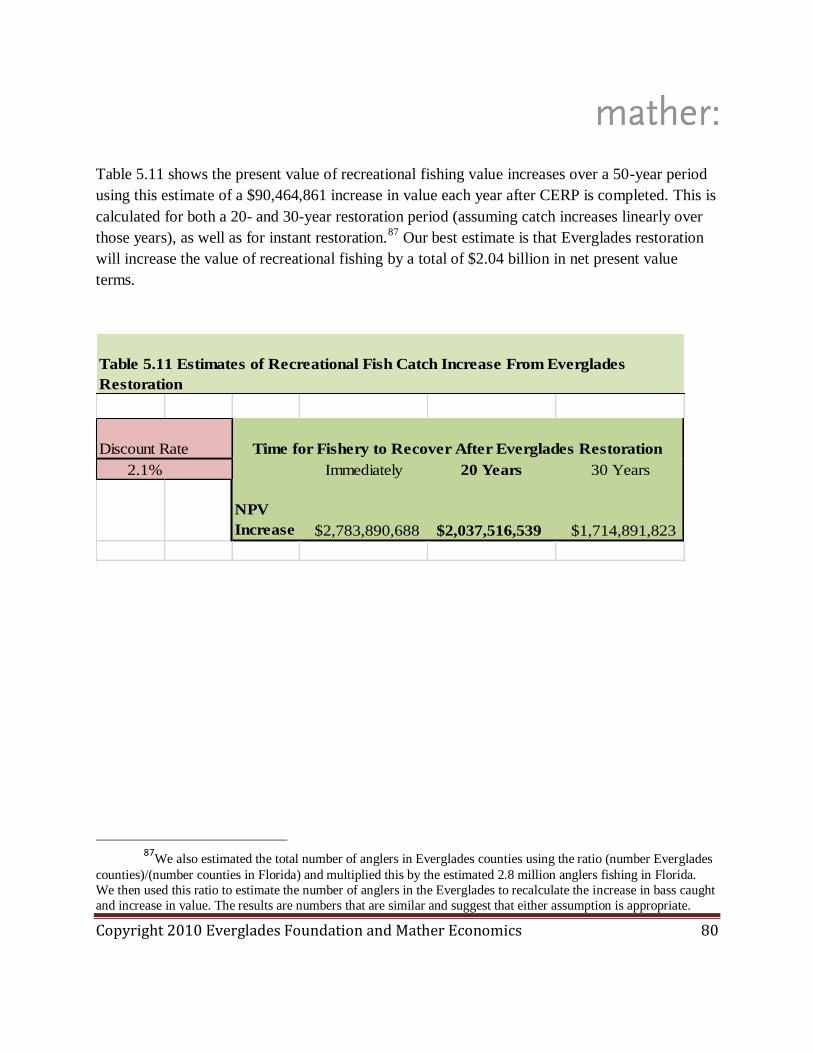
Copyright 2010 Everglades Foundation and Mather Economics 80
Table 5.11 shows the present value of recreational fishing value increases over a 50-year period
using this estimate of a $90,464,861 increase in value each year after CERP is completed. This is
calculated for both a 20- and 30-year restoration period (assuming catch increases linearly over
those years), as well as for instant restoration.87
Our best estimate is that Everglades restoration
will increase the value of recreational fishing by a total of $2.04 billion in net present value
terms.
Discount Rate
2.1% Immediately 20 Years 30 Years
NPV
Increase $2,783,890,688 $2,037,516,539 $1,714,891,823
Table 5.11 Estimates of Recreational Fish Catch Increase From Everglades
Restoration
Time for Fishery to Recover After Everglades Restoration
87
We also estimated the total number of anglers in Everglades counties using the ratio (number Everglades
counties)/(number counties in Florida) and multiplied this by the estimated 2.8 million anglers fishing in Florida.
We then used this ratio to estimate the number of anglers in the Everglades to recalculate the increase in bass caught
and increase in value. The results are numbers that are similar and suggest that either assumption is appropriate.

Copyright 2010 Everglades Foundation and Mather Economics 81
Additional Commercial Fishing Figures
Figure 5.12: Total Finfish Caught Commercially in Everglades Counties (pounds)
Figure 5.13: Total Invertebrates Caught Commercially in Everglades Counties (pounds)
0
5,000,000
10,000,000
15,000,000
20,000,000
25,000,000
30,000,000
35,000,000
40,000,000
45,000,000
1986
1988
1990
1992
1994
1996
1998
2000
2002
2004
2006
2008
Total Finfish
Total Finfish
0
2,000,000
4,000,000
6,000,000
8,000,000
10,000,000
12,000,000
14,000,000
16,000,000
18,000,000
1986
1988
1990
1992
1994
1996
1998
2000
2002
2004
2006
2008
Total Invertebrates
Total Invertebrates

Copyright 2010 Everglades Foundation and Mather Economics 82
Chapter 5 References
Browder, Joan A. and Robblee, Michael B. ―Pink shrimp as an indicator for restoration of
everglades ecosystems.‖ Ecological Indicators, 9(6, Supplement 1), (November 2009): S17-S28.
Fedler, Tony. ―Estimated Impact of Recreational Fishing in the Everglades Region.‖ Prepared
for the Bonefish and Tarpon Trust (2009).
Gates, J. M. ―Investing in Our Future: The economic case for rebuilding mid-Atlantic fish
populations.‖ The PEW Environment Group (2009).
Hazen and Sawyer. Indian River Lagoon Economic Assessment and Analysis Update. For the
Indian River Lagoon National Estuary Program in cooperation with St. Johns River Water
Management District and South Florida Water Management District (2008).
Stronge, W.B. The Economics of the Everglades Watershed and Estuaries: Phase 2 - 2010
Update of Data Analysis. Prepared for the Everglades Foundation (March 2010).
Data used for Commercial Fisheries Landings in Florida available at
http://research.myfwc.com/features/view_article.asp?id=19224.

Copyright 2010 Everglades Foundation and Mather Economics 83
Chapter 6: Wildlife Habitat and Hunting Valuation
While fishing is a major recreational activity in Florida, hunting and wildlife viewing are popular
pastimes as well. In this section, we detail our estimates of the economic impacts on these
pursuits as we model them subsequent to Everglades restoration.88
Impact on Hunting
There are two important hunting groups in the Everglades: deer and waterfowl (primarily ducks).
Restoration stands to impact hunting, it turns out, both positively and negatively. Deer have
moved into and flourished in the drained wetlands over the last half century, and ducks have
been driven out. Restoration will reverse these recent trends.89
Methods and Literature As an initial study into the valuation of non-market resources, we performed a literature review
on environmental valuation, focusing on the economic impact of ecosystem services that cannot
be directly valued on a market. Within this type of valuation, the methodology can be broken
down into two major categories: contingent valuation (CV) and revealed preferences. The
contingent valuation method of economic analysis can be defined as a means of valuing non-
market resources by using surveys and questionnaires to estimate the population‘s ―willingness
to pay‖ for a service. One relevant example of this method in existing literature is found in a
1995 paper by Fried, Adams, Berren, and Bergland90
in which the authors evaluate the value of
increased quality of elk hunting in the Starkey Experimental Forest in Oregon. In this
experiment, hunters in the area were given a ―dichotomous choice‖ survey, offering an increased
quality of hunting along with an increased fee to hunt the area. This survey had a ―take it or leave
it‖ format, with different prices assigned at random to survey participants. Based on the
aggregate of their choices, it is possible to estimate the demand curve for increased hunting
83 There is considerable evidence that deer populations might actually increase in certain areas after
restoration, but as is revealed below, there is evidence from Holy Land Management Area that deer hunting does not
necessarily follow the growth in species. We can note that deer populations have been increasing throughout the
United States over the past 30 years, but deer hunting has been declining. The presence of more deer does not by
itself lead to additional hunting. 89 We fully expect that alligator hunting will increase after restoration, but we have not attempted to assay
these benefits in any scientific way for three reasons: i) there is considerable uncertainty about the regulatory regime
for alligator hunting owing to their potential endangered status and the methods required for hunting; ii) we assert that the economic benefits are small and compared to the overall effects we are measuring, they are second order or
smaller impacts here; and iii) we have so far been unable to get any reliable indications on the value of alligator
hunting, the total extent of it, or a reliable forecast of its impact post restoration. With all this said, out best estimate
is that alligator habitat and populations will increase and that alligator hunting will also go up some. 90 Fried, B., R. Adams, R. Berrens, O. Bergland. ―Willingness to pay for a change in elk hunting quality.‖
Wildlife Society Bulletin 23(4), (1995): 680-686.

Copyright 2010 Everglades Foundation and Mather Economics 84
quality. However, this method is difficult to implement accurately, because it requires boots on
the ground conducting surveys, and it requires a significant number of surveys to be conducted if
it is to be accurate. Another example of contingent valuation estimation for non-market assets
occurs in a 2000 paper by John Loomis91
In this paper, Loomis evaluates different methods of
―nonmarket valuation concepts and techniques‖ and presents a detailed case study in using
dichotomous-choice contingent valuation to estimate a community‘s willingness-to-pay for a
restoration project that would upgrade ecosystem services. He analyzes a 72-kilometer section of
the South Platte River in Colorado and attempts to estimate the non-use value the community
puts on the river and associated riparian zone.
The alternative to the contingent valuation method is the revealed preference method. Instead of
focusing on what affected people would be willing to pay, revealed preference analyses
determine what those same people have actually spent in the past due to changes in similar
circumstances. This method is more effective at determining the current value of non-market
services, as it is unlikely to overestimate or encourage exaggeration on the part of the CV survey
takers. Among other options, revealed preference estimations can use travel cost, historical fee
payments or license purchases or visitation statistics to measure willingness to pay. The U.S.
Fish and Wildlife Service released a report entitled ―National Survey of Fishing, Hunting, and
Wildlife-Associated Recreation,‖ in which they estimate the economic impact of various
wildlife-associated recreational activities using the travel-cost method.
After reviewing the various methods of estimating the valuation of non-market resources, we
chose to focus -- in this section of our model -- exclusively on revealed preference estimations
for a number of reasons. First, revealed preference is a more objective, scientific method of
determining current values of an ecosystem service. When implementing CV surveys, survey
takers may be inclined to overstate their actual willingness to pay, as they will not actually be
required to pay any money. Revealed preference estimations use the money that people have
actually spent, guaranteeing that this method is not overestimating the value of the assets in the
area. Essentially, contingent valuation estimations attempt to capture the entire consumer surplus
(or what consumers would be willing to pay in addition to what they are actually paying) for a
service, while revealed preference merely captures the money consumers spent on the service.
This difference ensures that revealed preference is a more conservative, baseline estimate of any
service‘s value. While contingent valuation might provide a more accurate estimate under some
conditions, it also greatly increases the risk of overestimating the value of an asset.
91 Loomis, John. ―Can Environmental Valuation Techniques Aid Ecological Economics and Wildlife
Conservation?‖ Wildlife Society Bulletin. 28(1). (2000): 52 – 60.

Copyright 2010 Everglades Foundation and Mather Economics 85
Shown below is an illustration of the area under a demand curve that contingent valuation
estimations attempt to capture compared to the area that revealed preference estimations attempt
to capture. This further illustrates the conservative nature of the model we have created.
Using data presented in the Florida Fish and Wildlife Conservation Commission‘s 2003 Report
entitled ―The Economics of Selected Florida Wildlife Management Areas‖ for 17 selected
statewide Wildlife Management Areas, we computed an estimated ratio of the economic value of
hunting in the WMAs located within the Everglades to the economic value of hunting in WMAs
statewide. From the lower-bound estimates for each WMA‘s value, we calculated the ratio of
hunting expenditures in the Everglades to the entire state. This estimation suggested that
approximately 46 percent of total expenditures on hunting and fishing in Florida occurred in the
Everglades watershed. We then multiplied this ratio by the U.S. Fish and Wildlife Service‘s
estimate of the total economic value of hunting in Florida, $377,394,000 annually. This method
leads to a baseline estimate of $175,000,000 per year that hunting in the Everglades area
contributes to the Florida economy.
Fluctuations in water levels are responsible for current high mortality rates among deer in South
In this figure, the downward sloping (blue) line represents a demand curve for a service. As the price (P = price
of service) increases, the number of people demanding the service (Q = quantity of service demanded) decreases. Because the actual expenditures in our revealed preference models only captures this smaller area, we
can ensure that there is a very low probability of overestimation in our base-line estimates. On the other hand,
contingent valuation attempts to capture the total consumer surplus, so any overstatement by the survey takers
directly translates to an overestimation on the part of the model.

Copyright 2010 Everglades Foundation and Mather Economics 86
Florida. CERP estimates that, with the restoration of the Everglades, white tail deer populations
will be reduced to pre-drainage numbers, but that deer mortality due to drowning and starvation
will decrease. CERP estimates suggest that deer hunting in Big Cypress National Preserve should
not be impacted in either direction, but that deer hunting in Everglades WMA will be adversely
affected. For purposes of this model, we assumed no net change in deer hunting in Big Cypress
and a decrease of 75 percent in Everglades and Rotenberger WMAs. The decrease is due to
lower deer populations and increased difficulty in accessing huntable areas. We further assumed
that Holey Land would undergo half the total effect of Everglades or Rotenberger, because it is
already partially rehydrated. It has already seen a notable transition from deer hunting to
waterfowl hunting as a result of higher water levels.
The Everglades occupy the western portion of the Atlantic Flyway as it passes through Florida.
Increasing year-round water levels in Everglades and Rotenberger WMAs would provide more
ideal habitat for waterfowl. It would also induce a shift in hunting patterns in these areas from
primarily deer hunting to primarily duck hunting, as seen in Holey Land WMA after its
restoration. At present, waterfowl hunting in the Everglades does not provide a significant
portion of total hunting expenditures, but we expect that, after restoration, duck hunting will
increase significantly in quality, and thus it will become an attraction and increase its
significance greatly.
We used the rehydration of Holey Land WMA as a measure of the consequences of restoration
on hunting in the Everglades. This rehydration, which began in 1991, drastically changed
hunting patterns within the Holey Land WMA, and we expect a similar shift in the Everglades.
We used days of hunting to estimate percent changes.
Table 6.1 Estimates of Change in Hunting
Waterfowl Hunting (days) Deer Hunting(days) Total Hunting (days)
Prior To Restoration Negligible 972 972
Post Restoration 266 156 422
The calculations in Table 6.1 suggest a notable decline in total hunting in the area due to
restoration, but we expect the quality of duck hunting in the various areas to be super additive,
because the benchmark reference case does not properly mimic the substitution that will take
place in the Everglades. In the Holey Land WMA, hunters simply moved their deer hunting to
adjacent properties. In the case of Everglades restoration, there are no nearby areas for deer
hunters to go, so we expect many of them to turn to duck hunting, hence the super additive
Copyright 2010 Everglades Foundation and Mather Economics 87
effect.
We note that restoration, while leading to flooding of existing deer habitat, may not have a
dramatic impact on deer population as the wetlands have hammocks and dry spots for deer to
reside. However, the Holy Land experiment is the best estimate of the impact of restoration on
hunting, and while it stands to be conservative in the sense that the impact on deer populations is
not likely to be as severe as a decline of 75 percent, we think the experiment in place is the best
available science, and hence it is our approach. We concede that deer hunting may not fall as
dramatically as the Holy Land restoration suggests, but our judgment is to be conservative for all
the reasons issued earlier.
Figure 6.1 reveals the potential for deer population increases as estimated by Jane Comiskey.92
Accordingly, there is good reason to believe that deer populations will not be negatively
impacted, overall, by restoration, and might even improve. If this turns to be true, and contrary to
the Holy Land restoration, then our estimates of benefits are biased downward, and restoration is
more valuable than we conclude there.
92 See Appendix D (Attachment C) of the 1999 Restudy report. The text on D-C-88 suggests that, overall,
deer herd will be reduced (based on this breeding potential index) only slightly with CERP (Aternative D) compared
to without CERP (2050 Base.
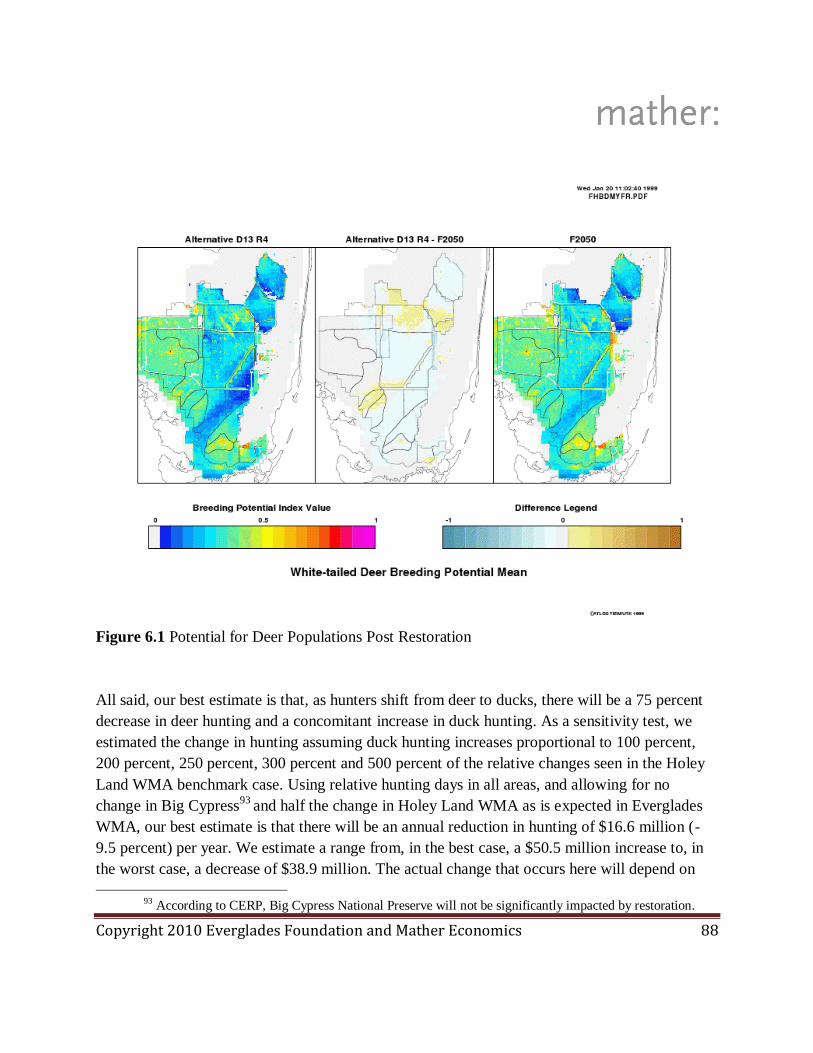
Copyright 2010 Everglades Foundation and Mather Economics 88
Figure 6.1 Potential for Deer Populations Post Restoration
All said, our best estimate is that, as hunters shift from deer to ducks, there will be a 75 percent
decrease in deer hunting and a concomitant increase in duck hunting. As a sensitivity test, we
estimated the change in hunting assuming duck hunting increases proportional to 100 percent,
200 percent, 250 percent, 300 percent and 500 percent of the relative changes seen in the Holey
Land WMA benchmark case. Using relative hunting days in all areas, and allowing for no
change in Big Cypress93
and half the change in Holey Land WMA as is expected in Everglades
WMA, our best estimate is that there will be an annual reduction in hunting of $16.6 million (-
9.5 percent) per year. We estimate a range from, in the best case, a $50.5 million increase to, in
the worst case, a decrease of $38.9 million. The actual change that occurs here will depend on
93 According to CERP, Big Cypress National Preserve will not be significantly impacted by restoration.

Copyright 2010 Everglades Foundation and Mather Economics 89
the proportion of deer hunters who cease hunting altogether or move to a different area to deer
hunters who begin taking advantage of the improved duck hunting in the area instead.
While the marginal impact of Everglades restoration on hunting expenditures might be negative,
the expected change in wildlife viewing expenditures is almost surely positive and far larger than
the potentially negative impact on hunting expenditures. The expansion of habitat produces
additional services, primarily through viewing of birds and other wildlife. We have already
computed the additional value of viewing by tourists, and, to avoid double counting, in this
section we only estimate the habitat impact on resident viewings in and around their homes, that
is, local bird and wildlife watching. The increased demand from restoration will also be reflected
in increased expenditures on bird watching equipment such as feeders, food and binoculars.
Impact on Habitat and Wildlife Viewing The U.S. Fish and Wildlife Service estimates that the state of Florida has more than $3 billion in
annual expenditure by wildlife watchers.94
Of the 1.5 million people who engage in away-from-
home wildlife watching each year, more than 1.1 million engage in waterfowl watching and 1.29
million watch other non-game water birds. In comparison, only 421,000 engage in viewing of
large land mammals.95
Using data for 17 statewide Wildlife Management Areas, for purposes of
scaling the state total to the region, we used as a proxy the ratio of the economic value of hunting
in the WMAs located within Everglades to the statewide value. We then multiplied this number
by the U.S. Fish and Wildlife Service‘s estimate of the total economic value of wildlife watching
in Florida, which was $3.08 billion annually. This leads to an estimated value of $1.43 billion per
year that non-consumptive wildlife recreation in the Everglades contributes to the Florida
economy.
The primary source of wildlife watching value in Florida comes from bird-watching, primarily of
wetlands species, either waterfowl or wading birds.96
CERP estimates significant habitat
improvement for water-reliant bird populations, specifically waterfowl and wading birds. Due to
the Everglades‘ position along the Atlantic Flyway, a large portion of migrating waterfowl pass
through the area on their way from Canada to the Caribbean. Increasing year-round water levels
in Everglades and Rotenberger WMAs along with Everglades National Park will provide more
ideal habitat for waterfowl and non-game wetlands birds. It will also induce a shift in wildlife
94 Table 31; page 39; FWS – FHWAR. We excluded for our calculations the ―special equipment
expenditure‖ category because we are attempting to measure the habitat-only demand and not travel- or tourism-
related demand. 95 Table 26; page 35; FWS – FHWAR. 96 Table 26; page 35; FWS – FHWAR.
Copyright 2010 Everglades Foundation and Mather Economics 90
watching demand in these areas due to increased quality relative to other areas.97
CERP estimates improved habitat for the following endangered species:
West Indian Manatee
American Crocodile
Snail Kite
Wood Stork
Cape Sable seaside sparrow
Table 6.2 reports wildlife participation rates in the Everglades region.
Table 6.2
Wildlife Watching Participation Figures
Wildlife Type Participants** % Participants
Waterfowl 1166 74.7%
Wading Birds 1290 82.7%
Birds of Prey 858 55.0%
Total birds 1418 90.9%
Marine Mammals 685 43.9%
Other Wildlife* 985 63.1%
TOTAL 1560 100.0%
* ―Other Wildlife‖ includes reptiles and insects
** Numbers in thousands
On page ii of the CERP‘s Draft Fish and Wildlife Coordination Report, it is estimated that the
wading bird population has declined by 90 percent from its natural level. In spite of these
drastically reduced numbers, Florida remains the number one tourist destination in the United
States for wildlife watching. The state currently draws 746,000 visitors a year to participate in
wildlife watching. Restoration should return wetland-dependent bird populations to some larger
percent of their historical population. Ecologists use wading-bird population as an indicator of
environmental health because these birds are a fragile part of the ecosystem. Due to this frailty,
their success indicates a successful ecosystem. For this reason, and because of the high
percentage of wildlife viewing aimed at wading birds, the economic impact of improved habitat
97 CERP Sections 8.7 and 8.8.
Copyright 2010 Everglades Foundation and Mather Economics 91
on demand for wildlife watching can be conservatively estimated by measuring the effect of
increasing bird populations on wildlife-watching expenditures.
Over the last several years, the number of wading birds residing within the Everglades has grown
rapidly. The population increase is believed to be a result of several years of high rainfall, and it
corresponds to a dramatic increase in the economic impact of wildlife watching in Florida. Since
2001, the total expenditure for non-consumptive, wildlife-associated recreation in the state of
Florida has approximately doubled. The 1990s were a low-population period for wading birds,
and their recent recovery is correlated with the large increase in wildlife-watching activity in the
state. The change in bird numbers along with the change in bird-watching values indicates a
relatively high elasticity of demand based on the quality of bird watching and changing
preferences. The implication of this is that Everglades restoration will lead to important and
significant increases in wildlife populations, viewing and enjoyment. As habitat and bird
populations increase, the economic impact of wildlife watching should improve at an even more
rapid rate than it has recently.
To calculate these values, we estimated the baseline value of habitat and non-consumptive
wildlife appreciation in the Everglades. We used wading-bird populations as our indicator metric
for habitat value in the Everglades. The University of Florida estimates that, just prior to
drainage, there was a stable population of approximately 70,000 mating pairs of wading birds
living in the Everglades. This is our reference benchmark for restoration. Using 2005 bird
populations, our conservative best estimate is that restoration will return these numbers to 75
percent of the 70,000 mating pairs reference benchmark. We then estimated the marginal impact
of changes in species populations on demand for viewing by extrapolating the changes seen
between 2000 and 2005 to the increased, restored numbers estimated in the table below. Our best
estimate, or 75 percent of historical populations restored, provides an annual improvement in
habitat value of approximately $424 million.

Copyright 2010 Everglades Foundation and Mather Economics 92
Table 6.3
Estimated Nesting
Pairs 1999 - 2001 2004- 2006
75%
Restoration
100%
Restoration
Great Egret 5996 8296 - -
Snowy Egret 4270 6410 - -
White Ibis 16555 24926 - -
Wood Stork 1538 800 - -
Total 28359 40432 52500 70000
Birdwatching Value: $734,174,000 $1,435,977,000 $1,900,427,000 $2,573,934,000
Value of Restoration: $464,450,000 $1,137,957,000
Changes in total number of wading birds inhabiting the Everglades
Δ (2000 - 2005) Δ(2005 - 75% Restored) Δ(2005 - 100% Restored)
12073 12068 29568
Though we have estimated a portion of these values in our recreation and park visitation model,
which measures park visitation changes, wildlife viewing generates additional values not
captured by our park visitation model. These values should be considered when evaluating
Everglades restoration, particularly to local residents who derive pleasure from the increased
number of animals residing around their homes. To fully capture the value of the impact of
restoration on wildlife habitat and hunting, we summed the values from habitat and hunting
calculations. Our best estimate is that Everglades restoration will increase wildlife habitat and
hunting services by $407.4 million annually.
As a final word about habitat and hunting, it is important to note that the impact on hunting will
only be negative if significant numbers of deer hunters do not transition to duck hunting as duck
populations expand. The experience with Holey Land restoration suggests that it is complicated
to forecast the impacts on hunting associated with expansive additional CERP restoration. On the
one hand, it appears that additional duck populations attract people to duck hunting, and this is
reasonable from the point of view of economic theory. It may also be true that existing duck
hunters will chose to hunt locally more often and forego trips to distant duck hunting areas such
as Louisiana, but we cannot estimate these shifts with any precision. In order to be conservative,
we have assumed a very low elasticity of substitution between deer and duck hunting and a low

Copyright 2010 Everglades Foundation and Mather Economics 93
elasticity of new duck hunters. Accordingly our negative estimate on hunting is probably biased,
and the likely outcome is not so dire. Additional information on hunter switching could refine
this estimate.

Copyright 2010 Everglades Foundation and Mather Economics 94
Chapter 7: Other Everglades Valuations, Miscellany
There are four broad areas of ecosystem services that, at present, we have not conclusively
valued that might be forthcoming or enhanced as a result of Everglades restoration: the potential
for carbon sequestration, potential fire damage reduction, the potential for enhanced water
purification, and the option value of unknown compounds and life forms living in the
Everglades. While these values stand to be real and to change in important ways as the
Everglades is restored, we are not prepared at this point in time to offer estimates of the pro
forma financial calculations for two reasons. First, the science of these services is somewhat
unsettled and unclear, compared to the other services, and second, the markets for these services
are immature and undeveloped. Hence, while there is rampant speculation about how these
services might be highly valued and special, we are not presently prepared to put hard numbers
to these theories, as good as they might turn out to be.
We can note that if the world moves to a market for carbon sequestration, and such markets are
developing, the amount of carbon sinking in the Everglades could be important. Our best
estimate at this time is that the amount of carbon is small, but we have low confidence in that
assessment. There is evidence that higher temperatures will lead to higher sea levels. As this
happens, sheet flow, aquifer recharge, and peat accumulation take on increasing importance.
Accordingly, restoration of the Everglades could be a formidable force for adjustment to climate
change. However, given the uncertainty of these events, and the lack of any existing markets
with which we might measure these changes, we take the conservative, not sanguine, approach
of not including any value to restoration on this count. This is doubtless conservative. For, even
if climate change does not occur, there is evidence of its possibility. Hence, restoration creates an
option value mitigating against climate change. Our position is that we are simple incapable of
putting a dollar figure on this option value. So basically, while we acknowledge the potential for
important values of carbon sequestration services and changes that might flow from restoration,
in order to maintain our conservative stance, we will not add any hard numbers. As time
proceeds, we will revisit our position on this topic.
Another topic for further study is the potential for Everglades restoration to improve South
Florida‘s water quality in ways not captured by our real estate and recreation value estimates.
Because wetland ecosystems are known for effectively filtering nutrients, we suspect a restored
Everglades would produce significant cost savings in water treatment and the secondary impacts
of poor water quality. In particular, we have researched the potential for CERP to reduce water
quality treatment costs, beach closures and health impacts in South Florida. However, we have

Copyright 2010 Everglades Foundation and Mather Economics 95
chosen to omit that research and the corresponding valuations from this report because there
exists significant disagreement in the scientific community over the connection between nutrient
reductions and such water contamination cost drivers as harmful algal blooms, beach clean-ups,
and shellfish poisoning. Like carbon sequestration, this topic should receive additional attention
as this research continues and progresses. We discuss this topic in more detail below.
A third topic we might investigate further is the potential value of unknown compounds and life
forms in a restored Everglades. These are commonly called ―biodiversity values,‖ and we have
found evidence of nascent markets in biodiversity. Michele Zebich-Knos reports on a contract
between Merck Pharmaceuticals and INBio, a Costa Rican NGO for biodiversity development.98
The amounts of money at play in this market are not fully public. We are confident that there are
others, and this appears to be a fertile area for further analysis. At present, however, given the
high levels of uncertainty, we are not prepared to put hard and fast estimates to these option
values. Given the scientific and policy uncertainty over these topics, our omission makes our
valuation estimates more robust. However, future work should probably pay close attention to
developments here.
The Potential Benefit of Cleaner Water from Restoration
Nutrient Loading Background
Environmental degradation of the Everglades has caused several problems in the water flow in
South Florida. Due to the lack of natural flows southward (from the Kissimmee down to Lake
Okeechobee and out to Key Biscayne) and the redirecting of these flows east and west (via the
St. Lucie and Caloosahatchee estuaries), the natural, slow filtration and storage capabilities of the
Everglades ecosystem no longer function as they had in the past.
Damming and flow redirection were beneficial for the agricultural industry, but they depleted the
natural environment. The ―River of Grass‖ has dried up in many areas and has been reduced
drastically in size. Redirecting the water flow east/west had several negative impacts on the
environment. Lake Okeechobee receives excess flows from the Kissimmee area, which bring
98
―Preserving Biodiversity in Costa Rica: The Case of the Merck-INBio Agreement.‖ The J. of
Environment and Development, 6(2), (1997).

Copyright 2010 Everglades Foundation and Mather Economics 96
nutrients and pollutants through the lake. During dry seasons, the lake stores this runoff instead
of letting it filter naturally, thereby taking in deposits of these nutrients.
Fresh water that slowly flowed south now flows east/west, and at times there are sudden
overflows due to storms and flood control measures. This impacts not only the Everglades, but
also the estuarine areas where the St. Lucie and the Caloosahatchee flow into the Atlantic and the
Gulf of Mexico. This excess water not only distorts the natural estuarine water with freshwater,
but also brings runoff from the agricultural areas (phosphorous, nitrogen, potassium and other
pollutants) into the estuarine ecosystem. Environmental conditions in the estuaries deteriorate
due to the excess freshwater and nutrient-saturated water. This also has a negative impact on the
local wildlife.
Theory and Methods
One option under the Comprehensive Everglades Restoration Plan is to restore the River of
Grass flowing from Lake Okeechobee to South Florida. This restoration model is designed to
restore the water filtration function of the wetland habitat prior to its engineered conversion to
dry-land agriculture. In particular, restoring the River of Grass will enhance the absorption and
filtration of excess nutrients and pollution coming from agriculture, stormwater, and waste.
In addition to enhancing water filtration, this approach would reduce stresses on stormwater
treatment facilities because the restored habitat would store and filter the excess runoff.
Treatment facilities would not be overrun with flows (either from dam discharges, storms or
flood control maneuvers). Fewer overflows at treatment facilities would reduce unnatural
saturation of the estuaries, and natural abatement would reduce the stresses on treatment
facilities. The treatment facilities would be less stressed because less nutrients and pollution
would need to be treated and filtered. If the water was less saturated with nutrients and
pollutants, the facilities would have to spend less effort to treat the water because the water
would flow south and any nutrients or pollutants would be absorbed into the ecosystem through
the slow-moving River of Grass.
Additionally, reduced overflows of the treatment facilities would reduce the impact of
agricultural runoff in the two estuaries. With the regulations on the agricultural industry, less
pollution emanating from farms as well as the restored absorption capabilities of the Everglades,
the environmental conditions in South Florida would improve, and these improved conditions
would have a measurable economic impact.

Copyright 2010 Everglades Foundation and Mather Economics 97
The economic impacts of our theorized effects could have been measured by estimating the
expected reduction in pollution/nutrient runoff and tying that to an ecosystem service. For
example, a certain reduction in the amount of phosphorous per gallon flowing into the
Caloosahatchee estuary would improve the overall health of the estuary, which in turn might
have multiple effects on local economic conditions. Among the possible effects are: improved
property values (discussed by Michael, et al., (1996) and Krysel, et al., (2003)), a boost in
tourism and tourism services (hotels, water sports, beach activities), reduced cleanup costs on
beaches, more fishing revenues, fewer expenditures on treating food poisoning from healthier
shellfish/fish, reduced cost to treat stormwater, nutrient-saturated water and excess runoff as well
as reduced need for treatment facilities and other indirect economic effects due to improved
water quality as discussed in Abbott, et al., (2009); Steidinger, et al., (1999); Parsons, et al.,
(2008); Hoagland, et al., (2002); and Morgan, et al., (2009) as well as numerous other reports.
Results and Discussion
After speaking with several water quality experts in South Florida, we realized that the
hydrological connections between Everglades restoration, water quality treatment, beach
closures, and human health impacts were present but too uncertain to quantify and value. Though
most of the experts agreed that restoration would reduce nutrient loading of the Caloosahatchee
and St. Lucie estuaries – and that nutrient loading reductions would reduce treatment, beach
closure, and human health costs – none were willing to speculate on the magnitude of those cost
reductions.
Helpful information in reaching this conclusion came from Tracy Piccone at South Florida Water
Management District, Sandra Whitehead at the Florida Department of Health, Rae Ann Wessel
with the Sanibel Captiva Conservation Foundation, and Eric Bush with the United States Army
Corps of Engineers. In particular, Tracey Piccone and Eric Bush suggested that restoration of the
natural habitat and flow would not necessarily reduce the need for stormwater treatment and
might, in fact, increase it. This suggestion is premised on the belief that the flows redirected from
Lake Okeechobee southward will have phosphorus concentrations high enough to damage a
restored Everglades ecosystem.
Conversations with the SFWMD and local water management districts confirmed disagreement
over the effect of Everglades restoration on nutrient loading in South Florida. Specifically,
SFWMD staff and treatment facility administrators do not expect restoration of the Everglades

Copyright 2010 Everglades Foundation and Mather Economics 98
ecosystem would provide South Florida with a natural water treatment facility. Their belief was
that the redirected stormwater, runoff, and flows resulting from CERP implementation would
require additional facilities to be constructed. It was suggested that the newly redirected water
(south flowing) would need to be filtered down to acceptable levels because the local Native
American population required a maximum of 10 ppb of phosphorous for all flows. Thus,
according to SFWMD staff, additional water treatment capacity will be required following
restoration; not less. The additional capacity will most likely take the form of stormwater
treatment areas (―STAs‖), which are artificial wetlands constructed to absorb nutrient loads.99
According to Tracey Piccone, in order to achieve high standards for water quality (low parts per
billion), existing treatment facilities would need to work harder to remove each incremental part
per billion. Thus, with more stringent regulation expected, the cost per pound of phosphorous
reduction may increase in coming years. This approach to pollution reduction seems to ignore
our theory that there are cost savings from the Everglades naturally abating nutrients/pollution.
In addition to conceptual disagreements over the potential water quality improvements flowing
from Everglades restoration, the South Florida Water Management District took exception to our
proposed method of measuring water quality improvements in terms of parts per billion (ppb).
Specifically, the SFWMD only considers whether a water body meets the Total Maximum Daily
Load (TMDL) promulgated by the Environmental Protection Agency. Theirs is a binary world of
either compliance or non-compliance; thus, marginal improvements in water quality which do
not cross the TMDL threshold are irrelevant to the SFWMD. While these TMDL‘s serve as
measures of clean water, they do not clearly measure the impact from individual projects on
water quality. In other words, we needed to measure incremental changes in nutrients due to
specific projects outlined in CERP. SFWMD and the EPA could only provide the required
nutrient levels regardless of any projects or cleanup efforts.
Another problem with TMDL‘s mentioned by Rae Ann Wessel is that the process to issue a
TMDL to a specific body of water is not a quick process and many areas in the Everglades
ecosystem still do not have TMDL classifications. TMDL‘s do not measure the impact of
restoration efforts outlined in CERP.
The final problem with measuring a direct economic impact from water quality improvements is
that a causal relation between pollutants, nutrients (for example ppb of Phosphorous) and
99 It should also be noted that CERP clearly outlines construction projects where STAs (including filtration,
treatment and storage facilities) are an important part in restoring the natural habitat. Thus, while there doesn‘t
appear to be any cost savings in STAs, the cost of CERP already includes these new construction projects.

Copyright 2010 Everglades Foundation and Mather Economics 99
environmental conditions is not yet established in the scientific community. Biologists and
scientists admit that there may be some relation between nutrients and algal blooms/fish kills, but
that relation is unknown.
It appears that no relevant expert will venture an opinion at this point on the true source of
increased or decreased algal blooms. If there were only one factor that affected HAB‘s, the
relation might be measurable. However, in the Gulf of Mexico, there are numerous known and
unknown sources of nutrients (manmade or natural) that may cause a sudden growth in an algal
bloom. The source of these events cannot be attributed solely to nutrient runoff from Florida
farms or stormwater runoff from the two estuaries.
After numerous conversations with experts in South Florida from a variety of organizations, we
still do not know the impact Everglades restoration will have on nutrient loading in South
Florida. The relation between different ecosystems within the Everglades, the sum of their roles
in the larger Everglades Ecosystem, and the roles of the Everglades in the larger South
Florida/Gulf of Mexico/Atlantic Ocean ecosystem are not understood with sufficient certainty
for our team to attempt an economic valuation. These relations or ―linkages‖ are still not
understood completely and in some cases are still debated among biologists and scientists.
Harmful Algal Blooms, Beach Closures, and Public Health Impacts Background
Existing literature on algal blooms by Abbott, et al., (2009) and Steidinger, et al., (1999) provide
some background on the subject. Algae forms naturally in the Gulf of Mexico and has been
recorded in Florida since the 1800‘s. The algal bloom is swept by ocean currents and
occasionally makes landfall on beaches. Algal blooms deplete oxygen, thereby inducing fish kills
or poisoning fish and shellfish. Harmful algal blooms routinely cause beach closures and
warnings in South Florida. It is generally believed that the recent increases in polluted water
flowing into the estuarine areas (as well as into Lake Okeechobee and other bodies of water)
contribute to the blooms of harmful algae.
As noted by Abbott, et al., (2009); Steidinger, et al., (1999); Parsons, et al., (2008); Hoagland, et
al., (2002); and Morgan, et al., (2009), beach warnings and closures attributable to harmful algal
blooms have a negative economic impact on Florida‘s economy, both in terms of reduced tourist
expenditures and increased beach clean-up costs. Morgan et, al., (2006, 2007) report losses of
$6.5 million due to beach red tides between 1995-2000 in Okaloosa County, as well as losses in

Copyright 2010 Everglades Foundation and Mather Economics 100
Pinellas, Sarasota, Lee, and Collier counties and cities of Longboat Key and Naples of $654,890
between 2004-2007. In addition, harmful algal blooms can impact humans who catch and eat
polluted fish. Hoagland, et al., (2002) estimates costs per shellfish poisoning to be between
$1,100-1,400 per case and $700-1,000 for ciguatera fish poisoning. Fish kills and beach closures
have significant, negative impacts on the South Florida economy. This section explains our
attempt to quantify those impacts.
Scientific Uncertainty
Much like the impact of Everglades restoration on water quality, the relationship between
restoration and harmful algal blooms is disputed in the scientific community. According to Rae
Ann Wessel, Sanibel Captiva Conservation Foundation, nutrient-saturated water from
agricultural runoff does not necessarily cause the development of algal blooms (red tide,
bluegreen algae, microalgae and others) but may have some impact on the intensity of algal
blooms presently occurring.
On the other hand, Stevenson, et al., (2007) note the following relations between nutrient loading
and algal growth:
1. Reductions in algal growth rates from maximum rates to 33 or 66 percent lower rates
with nutrient load reductions should have great benefits for controlling macroalgal
accumulation.
2. Reductions in TN and TP concentrations to less than 0.591 or 0.026 mg/L, respectively,
should reduce the extent of cover of spring bottoms by Vaucheria spp. in Florida springs;
however, greater reductions in TN and TP will likely be necessary to substantially reduce
Vaucheria cover.
3. Reductions in TN and TP concentrations to less than 0.250 or 0.033 mg/L respectively
should reduce the extent of cover of spring bottoms by Lyngbya wollei in Florida springs;
however, greater reductions in TN and TP will likely be necessary to substantially reduce
Lyngbya wollei cover.
4. In many springs, nitrogen reductions may be the only practical restoration strategy
because natural phosphorus concentrations may be higher than the concentrations that
constrain algal growth.
Supporting the assertion that nutrient loading increases algal blooms, Patricia M. Gilbert and
Daniel E. Terlizzi (1999) also note, ―In aquaculture ponds, dinoflagellate blooms were found on

Copyright 2010 Everglades Foundation and Mather Economics 101
10 of 14 occasions to co-occur with concentrations of urea in excess of 1.5 M nitrogen. When
urea levels were <1.5 M nitrogen, on seven occasions, no evidence of dinoflagellate blooms was
observed in these ponds.‖
Although a clear and measurable relation is still uncertain between nutrient outflow/saturation
and algal blooms (such as Red Tide), Hoagland, et al., (2002), Abbott, et al., (2009) and
Steidinger, et al., (1999) suggest that effects of polluted waters on local fisheries is generally
accepted. Fish and shellfish can become poisoned or die from excess pollution. Fish poisonings
and kills can cause human health impacts if the poisoned fish or shellfish are consumed, and they
can cause beach closures and warnings. The cost of beach closures has been estimated by
Parsons, et al., (2008), ranging from $25,000-$852,000 depending on location, time of year and
day of week, as well as by Hoagland, et al., (2002) to be about $170,000 per mile, per year of
cleanup in Florida. While these estimates may be used to estimate costs per closure due to HAB
events, estimating HAB events and their incremental change (as well as an economic value of
that change) would require knowledge of the interaction between nutrient loading from the
Everglades and red tide incidence and intensity.
If runoff saturated with nutrients exacerbates the intensity of South Florida algal blooms, then a
reduction in nutrient concentrations following Everglades restoration would likely reduce algal
bloom intensity and frequency. However, none of the experts with whom we spoke had
attempted to quantify this potential impact. They were also unwilling to speculate on the
magnitude of algal bloom reduction given the myriad variables – in addition to nutrient loading –
which influence algae growth. A potential reduction in algal blooms would have significant
economic impact. For example, Habas, et al., (1974, 1975) report a three- to five-month bloom
caused $15-$20 million in losses.
Also unknown is the relation between harmful algal blooms intensity and fish kills. Algae
deplete oxygen and grow from organic matter. Thus, nutrient runoff that increases organic matter
would likely increase the intensity of the algal blooms and decrease oxygen concentrations,
thereby killing fish and shellfish. Algae will also feed off the dead fish and continue to bloom,
potentially creating a positive feedback loop as described by Abbott, et al., (2009) and
Steidinger, et al., (1999).
Here again, the experts with whom we spoke agreed that reducing nutrient concentrations would
reduce harmful algal blooms and, therefore, the occurrence and severity of fish kills, but they
were unwilling to speculate on the likely magnitude of the fish kill reduction. Though the

Copyright 2010 Everglades Foundation and Mather Economics 102
economic impact of discrete fish kills and harmful algal blooms has been measured in the past,
as discussed by Abbott, et al., (2009); Steidinger, et al., (1999); Hoagland, et al., (2002); and
Morgan, et al., (2009), modeling the impact of Everglades restoration on fish kills and algal
blooms throughout the South Florida coastline has not yet been done.
In addition to environmental impacts, there are certain health effects that might be linked to
reductions in nutrient pollution. The potential health impacts are discussed by Abbott, et al.,
(2009) and Steidinger, et al., (1999) and include, but are not limited to ingestion of tainted
shellfish/fish and contact with polluted water. For example, Dwight, et al., (2005) estimate the
economic impact of shellfish and fish poisoning at $33.35 per illness; Rabinovici, et al., (2004)
employ a more expansive cost model and estimate the impact at $280 per illness; Hoagland, et
al., (2002) also present a survey of cost estimates; and Sandra Whitehead at the Florida
Department of Health confirms there is an economic cost of swimming in polluted waters,
though she has not quantified that cost. A more technical discussion on algal blooms and health
is presented by Fleming, et al.
Despite these cost estimates, predicting the marginal reduction in illness and illness costs
attributable to Everglades restoration is fraught with scientific uncertainty. The precise reduction
in pollution is unknown and none of the experts with whom we spoke has attempted to estimate
the reduction in pollution, the resulting reduction in harmful algal blooms, or the reduction in
human health impacts.
Beach Clean-Up Model
Despite these complexities, our team attempted to model avoided beach cleanup costs following
Everglades restoration and, more specifically, various reductions in the nutrient concentrations of
the Caloosahatchee and St. Lucie estuary discharges. Our literature review revealed that the most
consistent metric for beach clean-up costs is ―feet of beach cleaned per year‖ as indicated by
Hoagland, et al., (2002). However, the best available data on harmful algal blooms in South
Florida reported their impact in terms of beach closures and beach warnings (i.e., beach action
days). As such, our team converted beach action days into linear feet of beach cleaned per year
using county-specific data from the Florida Fish and Wildlife Conservation Commission (FWC)
and the FWC‘s 1:4 ration of beach clean-up to beach closure/warning. We use the approach by
Hoagland, et al., (2002) that assumes only about 1:4 of total beach miles is cleaned due to
patchiness of red tide events. Next, we regressed estimated nutrient concentration reductions
against beach action days and then we converted the marginal reduction in beach action days to

Copyright 2010 Everglades Foundation and Mather Economics 103
the marginal reduction in linear feet beaches cleaned. The results of this modeling effort were not
statistically significant, so we have excluded them from our final results table.
Public Health Model
We assembled data on shellfish poisoning as presented in Hoagland, et al., (2002), which
reported all shellfish poisoning cases for several years in several states. We found total
populations for those states and calculated the ratio of illness to population. We then applied this
ratio to the counties in South Florida to find an estimated illness rate. We estimated an arbitrary
reduction in pollution would decrease the number of these incidences and found the economic
impact of these reductions. Our literature review shows studies of costs per poisoning, which we
applied to our estimates.
The challenge of measuring health effects is that shellfish poisoning is largely underreported and
when it is reported it may be misdiagnosed as poisoning from other sources. Deaths from
shellfish poisoning are very few and so far unreported in Florida. Another challenge is, again, to
measure what the relationship between poisoning incidence and pollution levels is. Not only is
this difficult to measure, but the source of the poisoning and the pollution may not be clear.
Following our conservative principle, this model was not used in the final report.
We did not attempt to measure sickness due to swimming in polluted bodies of water. Individual
characteristics and time spent in the polluted body of water are variable. Assigning a dollar value
of sickness as a result of pollution/nutrient levels proved impossible given our assessment of the
current state of the science and the relevant available data.
Conclusions Regarding Water Quality Impacts To summarize, we have so far been unable to find any record or study of the expected impacts of
Everglades restoration on nutrient loading, harmful algal blooms, beach closures and clean-ups
or human health impacts. We were also unable to find any scientist or study willing to predict
those marginal impacts. Because the precise impact of Everglades restoration on nutrient loading
is still unknown – and depends in large part on the choice and implementation of various
restoration plans – our attempts to model the secondary and tertiary economic impacts failed to
produce scientifically significant results.
Fire There is speculation that the current Everglades is more fire prone because of reduced sheet

Copyright 2010 Everglades Foundation and Mather Economics 104
flow:100
The second change to the fire regime has been indirectly caused by human
changes to the hydrologic regime. In some areas, water has been impounded, thus
fire frequencies are decreased (Gunderson and Loftus 1993). But the larger
management problem is where marshes have been drained either by stopping
sheet flow or by increasing runoff in canal systems. Under these drainage
scenarios, severe ground fires have become more common resulting in changes to
plant communities (Gunderson and Loftus 1993, Robertson 1953, Snyder 1991).
Wildfires under dry conditions in the 1990s have caused at least top-kill of all
trees on many thousands of tree islands within the water conservation areas
(Hoffman et al. 1994). Statements by several authors and policies by managing
agencies dating as far back as the 1950s reflect concern over the perceived
increase in frequency with which tree islands suffered severe fire due to changes
in hydrology and fire ignition patterns (Robertson 1953, Taylor 1981). Marshes in
urban interface areas often have shortened hydroperiods as waters are diverted for
flood control. These same areas are often subject to increased fire ignition sources
as accident or arson. Thus these areas often experience increased fire frequencies
(Lockwood et al. 2003).101
The real issue is: How might one go about modeling the reduction of fire, and then, estimating
the economic impact of fewer fires?102
According to our principle of a conservative approach to
estimating benefits, we have decided to not include any air quality or other impacts that a
restored Everglades might have on fire duration, intensity, or frequency. With that said, we
suspect that a restored Everglades might likely have fewer and less severe fires. And, we know
that fire creates negative economic impacts. Fires in the Everglades, as they do elsewhere, cause
air quality issues via smoke, plus they stand to destroy valuable property.103
Thus, reduced fires, if they were to be a result of Everglades restoration, would count as an
additional benefit, but one we eschew economic evaluation of at this time.
100 For a clear and detailed discussion of fire in the Everglades, see
http://www.forestencyclopedia.net/p/p270. 101 http://www.forestencyclopedia.net/p/p270. 102 See ―Modeling the Effects of Hydrology on Fire, Vegetation Dynamics, and their Interaction in the
Florida Everglades.‖ USGS, (October 2004): http://pubs.usgs.gov/fs/2004/3110/ for a discussion of modeling fires
in the Everglades. 103 http://www.forestencyclopedia.net/p/p1769. see also
http://www.env.gov.bc.ca/epd/bcairquality/topics/forest-fires-air-quality.html and
http://www.nasa.gov/vision/earth/environment/central_am_fires.html.

Copyright 2010 Everglades Foundation and Mather Economics 105
Chapter 7 References
Abbott GM, JH Landsberg, AR Reich, KA Steidinger, S Ketchen, C Blackmore. ―Resource
Guide for Public Health Response to Harmful Algal Blooms in Florida.‖ Fish and Wildlife
Research Institute Technical Reports, (2009). Florida Fish and Wildlife Conservation
Commission.
KA Steidinger, JH Landsberg, CR Tomas, JW Burns. ―Harmful Algal Blooms in Florida.‖
Harmful Algal Bloom Task Force Technical Advisory Group, (1999).
Gilbert, Patricia M., and Daniel E Terlizzi. ―Concurrence of Elevated Urea Levels and
Dinoflagellate Blooms in Temperate Estuarine Aquaculture Ponds.‖ (1999).
Stevenson, et al. ―Ecological Condition of Algae and Nutrients in Florida Springs: The Synthesis
Report.‖ (2007).
Fleming, Lora E, Easom, Hana, Baden, Daniel, Rowan, Alan and Levin, Bonnie. ―Emerging
Harmful Algal Blooms and Human Health: Pfiesteria and Related Organisms.‖ Dept. of
Epidemiology and Public Health. University of Miami School of Medicine.
Habas, E.J. and Gilbert, C.K. 1974. ―The Economic Effects of the 1971 Florida Red Tide and the
Damage it Presages for Future Occurrences.‖ Environmental Letters, 6 (1974):139-147.
Habas, E.J. and Gilbert, C.K. 1975. ―A Preliminary Investigation of the Economic Effects of the
Red Tide of 1973-1974 of the West Coast of Florida.‖ (1975): 499-505. First Int. Conf. Toxix
Dinoflagellate Blooms. LoCicero, V.R.[ed], Massachusetts Science and Technology Foundation,
Wakefield, MA.
Michael, Holly J., Boyle, Kevin J., and Bouchard, Roy. ―Water Quality Affects Property Prices:
A Case Study of Selected Maine Lakes.‖ Maine Agricultural and Forest Experiment Station.
University of Maine. (February 1996). ISSN 1070-1516.
Krysel, Charles, Boyer, Elizabeth Marsh, Parson, Charles and Welle, Patrick. ―Lakeshore
Property Values and Water Quality: Evidence from Property Sales in the Mississippi Headwaters
Region.‖ Mississippi Headwaters Board and Bemidji State University. (May 2003). Submitted to

Copyright 2010 Everglades Foundation and Mather Economics 106
the Legislative Commission on Minnesota Resources.
Parsons, George R., Legget, Christopher, Boyle, Kevin, and Kang, Ami. ―Valuing Beach
Closures on the Padre Island National Seashore.‖ National Oceanic and Atmospheric
Administration Coastal Response Research Center at the University of New Hampshire and the
National Park Sercice. (March 2008).
Beckage, B., and W. J. Platt. ―Predicting severe wildfire years in the Florida Everglades.
Frontiers in Ecology and the Environment. 1(3), (2003): 235-239.
Cohen, A. ―Evidence of fires in the ancient Everglades and coastal swamps of southern Florida.‖
In: P.J. Gleason. Environments of South Florida: Present and Past, Memoir 2. Coral Gables,
Florida: Miami Geological Society (1974).
Davis, S. M. and J. C. Ogden. ―Introduction.‖ In: S. M. Davis and J. C. Ogden. Everglades: The
Ecosystem and Its Restoration. Delray Beach, Florida: St. Lucie Press (1994): 3-8.
Deuver, M.J., J.F. Meeder, L.C. Meeder, and J.M. McCollom. 1994. ―The climate of South
Florida and its role in shaping the Everglades ecosystem.‖ In: S. M. Davis and J. C. Ogden.
Everglades: The Ecosystem and Its Restoration, Delray Beach, Florida: St. Lucie Press (1994):
225-248.
FNAI. ―Guide to the Natural Communities of Florida.‖ FNAI and FDNR, Tallahassee, Florida
(1990).
Gunderson and Loftus. 1993. ―The Everglades.‖ In: W. H. Martin, S. G. Boyce, and A. C.
Echternacht. Biodiversity of the Southeastern United States: Lowland Terrestrial Communities,
New York: John Wiley and Sons, (1993): 199-255.
Hoffman, W., G. Bancroft and R. Sawicki. 1994. ―Foraging habitat of wading birds in the Water
Conservation Areas of the Everglades.‖ In: S. M. Davis and J. C. Ogden. Everglades: The
Ecosystem and Its Restoration, Delray Beach, Florida: St. Lucie Press, (1994): 585-614.
Lockwood, J. L., M.S. Ross, and J.P. Sah. ―Smoke on the water: the interplay of fire and water
flow on Everglades Restoration.‖ Frontiers Ecol. Environ, 1(9), (2003): 462-468.
Robertson, W. B. Jr. ―A Survey of the Effects of Fire in Everglades National Park.‖ Homestead,

Copyright 2010 Everglades Foundation and Mather Economics 107
Florida: Everglades National Park (1953).
Snyder, J. R. ―Fire regimes in subtropical South Florida.‖ In: Proceedings of the 17th Tall
Timbers Fire Ecology Conference 17 (1991): 303-319.
Taylor, D. ―Fire history and fire records for Everglades National Park 1948-1979.‖ South Florida
Research Center Report T-619. Homestead, Florida (1981).

Copyright 2010 Everglades Foundation and Mather Economics 108
Chapter 8: Impact On Job Creation And Earnings Restoration of the Everglades through the implementation of CERP will impact jobs in the State
of Florida. Changes to the different ecosystem services in the Everglades will impact the number
of jobs in a variety of industries and the economic activity that restoration will generate.
It is very important to understand that jobs are not an additional benefit above and beyond the
present value calculations we have already presented. Instead, they are an alternative way of
representing the overall change that is likely to be forthcoming from restoration. Economists
often speak of a circular flow of economic activity where firms purchase inputs (land, labor,
capital, and the like) from households in order to engage production. As compensation for the
release of these inputs, households are paid income (sometimes broken into finer gradients called
wages, interest, rents, and profit). Firms then sell the outputs made from the inputs to households
in exchange for money. According to this logical truism, one may count the sales of the goods
and services as one measure of the output of the firms, but one might also count the value of the
inputs consumed. They have to be equal by the accounting identity. Jobs then are a loose or
casual way of talking about the extent of economic activity. Most academic economists would
prefer to discuss the sales of the output of the firms rather than the jobs used in production, but
for some reason or another, policy makers, pundits, and politicians seem to prefer the jobs
numbers approach. For sure, jobs are easier to calculate and perhaps easier for lay people to
appreciate. Our point here is to respond to that latter audience, but it would be a big mistake for
anyone to interpret our discussion here as additive. The jobs are not in addition to the calculated
benefits. They are an alternative way of visualizing the impact of Everglades restoration. We
urge the reader to be careful on this point.
While we do not expect an increase in water supply to have much, if any, direct and significant
effect on new jobs, we do expect an improvement in water quality to directly affect jobs and
earnings in commercial fishing, recreational fishing, and real estate (residential construction and
real estate services). We also expect that habitat and open-space enhancements will have a direct
impact on the number of tourists who visit Florida. An increase in tourism will positively affect
jobs and earnings in hotels and lodging, eating and drinking establishments, transportation, retail
trade, and entertainment. Conversely, we expect the repurposing of crop land (mostly sugar cane)
for storm water storage and treatment facilities to have a direct and negative impact on the
number of jobs and earnings in the agricultural sector. In sum, we predict Everglades restoration
will have both positive and negative impacts on the number of jobs in the South Florida
economy. We have designed our jobs model to account for both impact types and thus to report a

Copyright 2010 Everglades Foundation and Mather Economics 109
net impact on jobs creation.
Our approach to estimating net job creation relies on an input/output model that uses data
generated by the key components of this study (inputs) to estimate the number of incremental
jobs and earnings as a result of CERP (outputs). We calculated outputs using jobs and earnings
(or total economy) multipliers from different sources. Unless otherwise specified, we used total
economic output multipliers to reflect the impact on the broader economy (direct, indirect, and
induced jobs). In some cases, we used only direct multipliers to avoid overlap (double counting)
among the different sectors.
As detailed below, our work shows that as a direct effect of Everglades restoration more than
442,000 new jobs over a 50-year period will be added to the State of Florida with the highest
number coming in the residential construction and real estate services sector. Total contribution
to the local economy will be in excess of $17 Billion. Repurposing of mostly sugar cane crop
land for storm water storage and treatment facilities will result in the loss of 3,724 jobs and $471
Million in earnings.

Copyright 2010 Everglades Foundation and Mather Economics 110
Commercial Fishing
To determine the impact that an increase of commercial fishing due to a restored Everglades will
have on jobs, we estimated the net present value (NPV) of the incremental dockside value ($
million) of saltwater and freshwater fish (including finfish, invertebrates, and shrimp) caught
over a 50-year period and applied a commercial fishing jobs multiplier.
Input: Net present value of the incremental dockside value of commercial fisheries
(finfish, invertebrates and shrimp) caught in a restored Everglades.
Multipliers: Fishing producer employment multiplier equal to 15,409 jobs/$ billion
export value104
.
Key Formulas:
o Increase in employment (# jobs) = (NPV dockside value ($ million)/1000) *
Producer employment multiplier (15,409 jobs/billion $ export value)
o Increase in earnings & economic activity ($ million) = NPV dockside value ($
million) * economic output multiplier (1.710).
Results:
Sector Incremental Jobs
(over 50 years)
Incremental Value
($ millions)
Commercial Fishing 6,798 $ 754
104 2008 ERS Trade Multipliers, Open Model (USDA Economic Research Service – Updated November
2009).

Copyright 2010 Everglades Foundation and Mather Economics 111
Recreational Fishing
To determine the impact of the increase of recreational fishing due to a restored Everglades on
jobs, we estimated the incremental number of freshwater and saltwater anglers over a 40-year
period and its inherent impact on ―fishing-related expenditures.‖ To the net present value of
fishing related expenditures, we applied multipliers derived from Tony Fedler‘s105
report to
estimate impact on jobs and overall economy. Fedler‘s report focuses exclusively on Florida
residents, but we have used its results to estimate ratios that could be used for a broader group of
anglers.
Input: Incremental saltwater and freshwater anglers and expenditures in the Everglades
region. We used a modified (50 percent) tourist (visitor) yearly growth-rate to determine
the increase in anglers to the region (using the 2 percent tourist growth scenario). The
incremental number of anglers (over a growing base) due to a restored Everglades was
multiplied by average yearly ―fishing-only‖ expenditures (to avoid overlap with
tourism—shopping) to calculate incremental expenditures. Fishing-only expenditures
include:
o Trip expenditure categories: guide fees; live and cut bait; ice; equipment rental;
boat fuel; boat launch fees; boat mooring; maintenance and insurance.
o Equipment expenditure categories: Rods and reels; lines and leaders; artificial
flies; lures and baits; hooks, swivels and sinkers; tackle boxes; creels, stringers
and nets; minnow traps, seines and containers; electronic devices; scales knives
and miscellaneous equipment; boats, maintenance and tow vehicles.
Fishing-related expenditures (trip and equipment) account for 66.21 percent of total
angler expenditures in the Everglades region as calculated from Fedler‘s study. This
rationale was applied to yearly total expenditures over a 50-year period. Expenditures
that were not included as fishing-related expenditures include: food, drink and
refreshments; lodging; airline transportation; other public transportation; private vehicle
transportation; public access fees; private access fees; and heating and cooking fuels.
Multipliers: Employment (jobs per $ million) and earnings (not total economy to avoid
overlap with tourism) from Tony Fedler‘s report: ―The Economic Impact of Recreational
Fishing in the Everglades Region.‖
105The Economic Impact of Recreational Fishing in the Everglades Region; Prepared by Tony Fedler Ph.D.
for the Bonefish and Tarpon Trust; December 2009.

Copyright 2010 Everglades Foundation and Mather Economics 112
Key Formulas:
o Increase in fishing-related jobs (# jobs) = NPV Incremental Freshwater and
Saltwater Angler expenditures in the Everglades Region ($ millions) *
Employment multiplier (17.14 jobs per $ million) * 66.21%
o Increase in earnings ($ million) = NPV Incremental Freshwater and Saltwater
Angler expenditures in the Everglades Region ($ millions) * Earnings multiplier
(0.524)
o NPV Incremental Freshwater and Saltwater Angler expenditures in the
Everglades Region ($ millions) = NPV (
o # anglers no change and 2% change scenarios = 50% growth rates of no change
and 2% change scenarios in incremental tourism to the Everglades region
Results:
Sector Incremental Jobs
(over 50 years)
Incremental Value
($ millions)
Recreational Fishing 36,868 $ 1,668

Copyright 2010 Everglades Foundation and Mather Economics 113
Residential Construction & Real Estate Services
Everglades restoration will have a direct impact on real estate activity – both construction and
real estate services. As demand for real estate increases, so will direct and indirect jobs tied to
the sector. Three types of impacts are estimated for non-residential construction and real estate
related transactions: direct effects, indirect effects, and induced effects. Direct effects are the
changes in the industries to which a final demand change was made. Indirect effects are the
changes made in inter-industry purchases as they respond to the new demands of the directly
affected industries. Induced effects typically reflect changes in spending from households as
income increases or decreases due to the changes in production.
Input: Incremental value (from the "Potential Value Increase based on 23 percent
Improvement in Water Quality" scenario) and subsequent activity in residential
construction and real estate services. Elasticity between "increase in real estate value" and
"increase in construction activity" was set at 0.55.
Multipliers: Residential construction and real estate multipliers (Direct + Indirect +
Induced) were calculated from existing jobs and earnings data.106
Figure 8.1. Residential Construction & Real Estate Services Multiplier Calculations
106 Shimberg Center for Affordable Housing; THE IMPACT OF RESIDENTIAL REAL ESTATE ON
THE FLORIDA ECONOMY; 2005 update (Using Roll Year 2004 Property Appraiser Data).
New in 2005 Direct Indirect Induced Direct Indirect Induced Total
Residential construction *** $36,940,456,476 12,153,937,000$ 5,827,958,000$ 4,315,513,000$ 0.329 0.158 0.117 0.604
Demand for real estate transactions *** 6,352,883,351$ 46,062,000$ 39,182,000$ 23,749,000$ 0.007 0.006 0.004 0.017
New in 2005 Direct Indirect Induced Direct Indirect Induced Total
Residential construction *** $36,940,456,476 336,216 189,744 165,529 9.102 5.136 4.481 18.719
Demand for real estate transactions *** 6,352,883,351$ 45,725 20,423 11,138 7.198 3.215 1.753 12.165
*** Shimberg Center for Affordable Housing; THE IMPACT OF RESIDENTIAL REAL ESTATEON THE FLORIDA ECONOMY; 2005 update (Using Roll Year 2004 Property Appraiser Data)
Earnings Earnings Multiplier
Jobs Employment Multiplier (jobs per $ 1million)

Copyright 2010 Everglades Foundation and Mather Economics 114
Key Formulas:
o Increase in residential construction and residential real estate employment (# jobs)
= Potential Value Increase based on 23% Improvement in Water Quality ($
millions) * 0.6 * (Total construction employment multiplier + Total real estate
services employment multiplier)
o Increase in residential construction and residential real estate economic activity $
million) = Potential Value Increase based on 23% Improvement in Water Quality
($ millions) * 0.6 * (Total construction earnings multiplier + Total real estate
services earnings multiplier)
Results:
Sector Incremental Jobs
(over 40 years)
Incremental Value
($ millions)
Residential Construction & Real Estate
Services 273,601 $ 7,319

Copyright 2010 Everglades Foundation and Mather Economics 115
Tourism
A restored Everglades will generate increased tourism activity in the region. Increased
tourism will positively impact direct and indirect job creation. To determine the impact of
tourism on jobs and earnings we looked at its impact on five directly and indirectly related
sectors in all 16 counties.
Input: Incremental visitors and expenditures in local tourism by specific NAIC107
sector for all 16 counties:
o Hotel and lodging (NAICS code 7211)
o Eating and drinking establishments (NAICS codes 7221, 7222, 7224)
o Transportation (NAICS codes 485113 , 485119 Other Urban Transit Systems;
485210, 485310 , 487110, 487210)
o Retail trade (NAICS codes 45211, 4451, 4452, 4453, 4461, 4481, 4482, 4512)
o Entertainment (NAICS code 71).
Multipliers: We used total effects multipliers from the REMI II model108
. We utilized
Large Metro, Small Metro, and Rural multipliers depending on the specific county.
Figure 8.2. portrays our county classification for the purpose of assigning multipliers.
Figure 8.2. County Classification for Tourism Specific Multipliers
107 QWI ONLINE LOCAL EMPLOYMENT DYNAMICS; US Census Bureau. 108 MGM2 MODEL, the University of Michigan.
County Select County Type
Broward Larger Metro
Charlotte Rural
Collier Smaler Metro
Glades Rural
Hendry Rural
Highlands Rural
Lee Smaler Metro
Martin Rural
Miami-Dade Larger Metro
Monroe Smaler Metro
Okeechobee Rural
Orange Larger Metro
Osceola Rural
Palm Beach Smaler Metro
Polk Rural
Saint Lucie Rural

Copyright 2010 Everglades Foundation and Mather Economics 116
Figure 8.3. Tourism Multipliers
Key Formulas:
o Increase in employment (# jobs) = increase in lodging spend * Hotels and lodging
multiplier + increase in eating & drinking spend * eating & drinking multiplier +
increase in transportation spend * local transportation multiplier + increase in
retail trade spend * retail trade multiplier + increase in entertainment spend *
amusement and entertainment multiplier
o Increase in income ($ millions) = increase in lodging spend * Hotels and lodging
total effect multiplier + increase in eating & drinking spend * eating & drinking
total effect multiplier + increase in transportation spend * local transportation
total effect multiplier + increase in retail trade spend * retail trade total effect
multiplier + increase in entertainment spend * amusement and entertainment total
effect multiplier
Results:
Sector Incremental Jobs
(over 50 years)
Incremental Value
($ millions)
Tourism (Lodging, Eating & Drinking,
Transportation, Retail, Entertainment) 48,552 $ 1,905
RuralSmaler
Metro
Larger
MetroState Total Effect
Hotels And Lodging Places 35.24 33.04 30.26 27.41 1.52
Eating & Drinking 40.41 38.80 37.86 35.05 1.44
Amusement And Recreation 38.85 40.61 39.08 35.47 1.45
Local transportation 42.94 37.71 35.52 32.98 1.43
Apparel from purch mate 19.50 19.70 20.21 19.72 1.36
Sporting goods 12.50 18.48 17.70 17.11 1.42
Manufacturing 16.11 15.83 17.22 17.02 1.33
Retail Trade 44.67 37.00 34.42 31.54 1.38
Wholesale trade 18.84 18.93 18.08 16.40 1.38
Retail is average or sum of the 7 retail trade sectors
* Money Generation Model Version 2 (MGM2); University of Michigan
Sector
Total effects multipliers (Jobs/ MM sales) *

Copyright 2010 Everglades Foundation and Mather Economics 117
Agriculture
In order to retain wet-season water flows in the northern watershed instead of diverting it to sea
and the Everglades, the CERP contemplates the purchase of land in the Everglades Agricultural
Area (EAA) to develop storm water storage and treatment facilities. These measures to improve
water retention south of Lake Okeechobee will have a negative impact on agricultural activity in
the region. Some of the counties impacted by potential loss of sugar cane land are in the process
of evaluating ways to diversify their agriculturally dependent economies.109
To determine the economic impact of expanding water storage and treatment facilities in the
EAA, we use a dynamic simulation model of crop production, soil loss, and water retention
developed by Marcel Aillery, et al.,110
which addresses the potential cost of forgone agricultural
profit. The model estimates the NPV of lost crop production over a 15-year period under various
land acquisition scenarios (for conversion into water storage and treatment areas. (Table 8.1.
summarizes income loss under different land acquisition scenarios.)
Figure 8.4. EAA Water Retention Scenarios – Agricultural Income Loss
109 The Collins Center for Public Policy has information on this adjustment. See
http://www.collinscenter.org/. 110 Aillery, Marcel, Shoemaker, Robbin, and Caswel, Margriet. ―AGRICULTURE AND ECOSYSTEM
RESTORATION IN SOUTH FLORIDA: ASSESSING TRADE-OFFS FROM WATER-RETENTION
DEVELOPMENT IN THE EVERGLADES AGRICULTURAL AREA.‖
Scenario Land Acquisition Scenarios (Acres) Total Acres PV Income Loss ($ millions) -- 15 Years
1 STA (43,500) 43,500 13.70$
2 STA+RS(25,000) 68,500 15.80$
3 STA+RS(40,000) 83,500 50.00$
4 STA+RS(50,000) 93,500 65.90$
5 STA+RS(50,000)+FR(10,000) 103,500 81.40$
6 STA+RS(75,000) 118,500 104.10$
7 STA+RS(75,000)+FR(25,000) 143,500 141.30$
8 STA+RS(75,000)+FR(50,000) 168,500 180.20$
9 STA+RS(75,000)+FR(75,000) 193,500 225.30$
STA -- stormwater treatment area FR -- Floodwater retention area
RS -- Reservoir storage area
*Agriculture and Ecosystem Restoration in South Florida: Assessing Trade-Offs From Water-Retention Development
In The Everglades Agricultural Area; Marcel Aillery, Robbin Shoemaker, and Margriet Caswell

Copyright 2010 Everglades Foundation and Mather Economics 118
Input: It is estimated that under the CERP proposal, 60,000 acres of productive
agricultural land will be repurposed for storm water storage and treatment facilities. To
err on the conservative side, we used a scenario in which 83,500 acres of productive
agricultural land would be repurposed (43,500 acres for storm water treatment area and
40,000 acres for reservoir storage area).
The water-retention model estimates economic loss due to loss of sugar cane agricultural
acreage. Sugar cane crops are estimated at 88% of total EEA crop production. Output
results from our model are adjusted to account for all types of crops.
Multipliers: We used the USDA Economic Research Service ―Sugar Cane and Sugar
Beets‖ producer employment multiplier111
(22,173 jobs/billion $ export value). To
determine the impact on earnings we projected five-year historic weighted average yearly
wages for NAICS code 111112
and multiplied by the number of incremental jobs. We
utilized a multiplier of 5 for total economic impact.
Key Formulas:
o Decrease in employment (# jobs) = NPV of Sugar Cane Agricultural Activity
Loss ($129 million over 50 years) in 83,500-acre scenario) * Producer
employment multiplier (22,173 jobs/billion $ export value) * 1.136 (adjust for
total crops)
o Decrease in Earnings ($ million) = 5 * Decrease in employment (# jobs) *
Weighted average of five-year historical yearly wages
o We converted Water Retention model 15-year NPV results to a 50-year baseline
Results:
Sector Incremental Jobs
(over 50 years)
Incremental Value
($ millions)
Agriculture (3,724) $ (471)
111 2008 ERS Trade Multipliers, Open Model (USDA Economic Research Service – Updated November
2009). 112 QWI ONLINE LOCAL EMPLOYMENT DYNAMICS; US Census Bureau.

Copyright 2010 Everglades Foundation and Mather Economics 119
Wildlife Habitat and Hunting
Variations in Wildlife Habitat and Hunting activity due to Everglades restoration will have a
direct effect on jobs and economic activity. Since overall hunting activity will decrease, its
impact on jobs will be negative. However, the net effect of Wildlife Habitat and Hunting on jobs
is positive and very significant.
Input: Incremental expenditure in direct goods and equipment for Wildlife Habitat
and Hunting. This excludes transportation, lodging, food (except bird food and
feeders), etc.
Multipliers: We used total effects multipliers from the REMI II model113
. We utilized
the multipliers for sporting goods since we are mostly measuring the impact on direct
equipment shopping. Multipliers were adjusted as needed.
Key Formulas:
o Increase in employment (# jobs) = NPV of Hunting Expenditures over 50
years * Sporting Goods Jobs Multiplier + NPV of Wildlife Habitat
Expenditures over 50 years * Sporting Goods Jobs Multiplier (adjusted)
o Increase in Economic Activity ($ millions) = NPV of Hunting Expenditures
over 50 years * Sporting Goods Economic Activity Multiplier + NPV of
Wildlife Habitat Expenditures over 50 years * Sporting Goods Economic
Activity Multiplier (adjusted)
Results:
Sector Incremental Jobs Incremental Value
($ millions)
Wildlife Habitat & Hunting 80,569 $ 6,664
113MGM2 MODEL, the University of Michigan.

Copyright 2010 Everglades Foundation and Mather Economics 120
Figure 8.5. Summary of Jobs Impact Drivers and Approach
Ecosystem
Service Industries Value Drivers Incremental Jobs Approach
Water Supply Not relevant
Water Quality
Commercial
fishing
Lbs & value of fish
caught (finfish,
invertebrates & shrimp)
Apply fishing jobs multiplier (USDA
Economic Research Service) to incremental
dockside value projections. Use 2008 annual
wage average to estimate yearly earnings
increase (projecting at inflation rate).
Calculate NPV of earnings at 2.1% discount
rate
Recreational
fishing
Saltwater & freshwater
angler expenditure in the
region
Estimates year-over-year growth in number of
anglers in the region and determines annual
expenditure in ―fishing related‖ goods and
services (to avoid overlap with ―Tourism‖).
Applies jobs and earnings multipliers from Fedler‘s study
Real estate
Residential construction
& real estate services
activity
Apply direct, indirect and induced jobs and
earnings multiplier for residential construction
and real estate services. Uses the "Potential
Value Increase based on 23% Improvement in
Water Quality" as an input. Elasticity between
"increase in real estate value" and "increase in
construction activity" is set at 0.55
Habitat &
Open Space Tourism
Hotel & lodging
expenditure Apply direct + indirect jobs multiplier to
projected incremental spend per sector (i.e.,
lodging, eating & drinking, transportation,
shopping, entertainment). Multiply jobs by
average (2011) yearly wages to determine total earnings
Eating & Drinking
expenditure
Transportation
expenditure
Shopping expenditure
Entertainment
expenditure
Other
Agriculture
Agricultural acreage
repurposed for storm
water storage &
treatment
Use the Aillery, Shoemaker & Caswell water-retention model to estimate the NPV of lost
sugar cane income (88% of crops in EAA)
under proposed land acquisition program. Use
USDA sugar cane multiplier to estimate the
number of lost jobs. Use average 2008 annual
wage as base to estimate lost job earnings.
The model also uses an 1.136 multiplier to
adjust for other kinds of crops (other than
sugar cane) and possibility of purchasing
further croplands for stormwater storage
Hunting Baseline jobs not available due to low number of current jobs with
unemployment

Copyright 2010 Everglades Foundation and Mather Economics 121
Figure 8.6. Summary of Jobs Impact Results
Sector Incremental Jobs Incremental Value
($ millions)
Commercial Fishing 6,798 $ 754
Recreational Fishing 36,868 $ 1,668
Residential Construction & Real Estate
Services 273,601 $ 7,319
Tourism (Lodging, Eating & Drinking,
Transportation, Retail, Entertainment) 48,552 $ 1,905
Agriculture (3,724) $ (471)
Wildlife Habitat & Hunting 80,569 $ 6,664
TOTAL 442,664 $ 17,840
Direct Jobs Created as a Result of Restoration Construction
In addition to the jobs created by the impacts restoration, there will be jobs created to do the
actual work of restoration. The Corps of Engineers estimates that there will be approximately
22,000 jobs created in the construction projects detailed below in Table 8.7 as reported in
Kopecky (2010). Table 8.7 is reproduced, unaltered, from that report.
Table 8.7. Direct Job Creation as a Result of Construction, COE Estimates114
Appropriation requests were run through IMPLAN (Minnesota IMPLAN Group) software. This is an input-output analysis that attempts to project employment, output and earnings for a given change or event in the economy’s activity. This model is typically set up to run at regional levels, but contains a National function as well and this is what was analyzed. There are three types of effects
Direct effects take place only for the industry immediately affected:
Indirect effects concern inter-industry affects
114 See Kopecky (2010) which is reproduced here exactly.

Copyright 2010 Everglades Foundation and Mather Economics 122
Induced effects measure the effects of the changes in household income. These
changes effect the related industries employment.
The category of construction used was Sector 36 (Construction of other new non-
residential). This is the closest to our construction technique.
South Florida Water Management District Job Creation in Everglades Restoration
AS RUN BY COE USING IMPLAN February 1, 2009
Project Appropriation Request
Direct Indirect Induced Total
Herbert Hoover Dike Rehabilitation (3)
$77,000,000 645 382 510 1538
C-44 Reservoir and STA
$363,000,000 3042 1801 2406 7249
C-43 Reservoir (1) $473,000,000 3963 2347 3135 9446
Kissimmee River (3) $31,000,000 260 154 205 619
Picayune Strand /FAKA Union Pump Station Works and
Road Removal
$57,000,000 478 283 378 1138
Picayune Strand /Merritt Canal Pump Station Works and Road Removal (3)
$52,000,000 436 258 345 1038
C-111 Spreader Canal $35,000,000 293 174 232 699
C-51/STA1E $8,000,000 67 40 53 160
L31 North Seepage Pilot Project (3)
$5,000,000 42 25 33 100
Seminole/Big Cypress (3)
$3,000,000 25 15 20 60
TOTALS(SFWMD PROVIDED)
$1,150,000,000 9636 5707 7623 22966

Copyright 2010 Everglades Foundation and Mather Economics 123
Chapter 9: Last Words
Diamonds and Water Economic theory has an ageless conundrum called the diamond-water paradox. This conundrum
ponders why diamonds, which are so unnecessary to life, are so valuable while water, so
necessary, is so cheap. The paradox is resolved by noting that the prices of diamonds and water
are marginal valuations to society of an additional unit of each, not the total or average value.
The implication of this line of reasoning is profound. For instance, professional football players
earn a much higher salary than do high school teachers, yet it is almost surely true that the value
of high school teachers to the world exceeds the total value of football players. Marginal values
do not reveal total values, as every economist is taught.
So it is with ecosystem services (or any other product for that matter). Accordingly, if we were to
capture the total value of Everglades restoration, we would have to engage a more complicated
and detailed process. Suffice to say here, our estimates are not total estimates.115
They only
capture a portion of the total value of restoration. There is considerable consumer surplus, to use
economic jargon, that is not captured by our methodology. Thus, our approach understates the
total value to society of spending resources to restore the Everglades. Indeed, based on other
studies, our gut feeling is that the true total benefits are several times larger than our marginal
valuation estimates.
Consider Figure 9.1. Our calculations that we report here effectively estimate the shaded area
labeled E. There is potentially a much larger area, labeled CS, that represents economic well-
being, or willingness to pay, which buyers or consumers of services obtain without paying for
them. We call this consumer surplus. It is the unrequited or unpaid-for happiness that a consumer
gets from a purchase, above and beyond the purchase price. We have not attempted to estimate
this component of economic system services, but as the graph suggests, the area of CS can be
substantially larger than the area of E, depending upon the price elasticity of demand for the
particular service. As our work progresses, we will attempt to assay and estimate these
valuations. They are important to any properly conceived analysis of economic well-being or
welfare.
115 For more discussion on this point, consult http://www.ecosystemvaluation.org/market_price.htm.

Copyright 2010 Everglades Foundation and Mather Economics 124
Figure 9.1 Consumer Surplus (triangles) and Expenditures (rectangles)
Regarding the effect of Everglades restoration on jobs, from the point of view of economic well-
being or welfare, the important consideration is not total jobs, but incremental welfare above and
beyond the opportunity cost of time or leisure. In a way similar to consumer surplus, most
workers are paid wages higher than the underlying value of their time. This is called economic
rent or producer. This is measured by the triangle above the supply curve of labor. Therefore,
while many people view jobs as an economic good, the real increase in welfare comes not from
employment, but from wages higher than the lost alternatives of leisure or home production. We
have not estimated these additional benefits in our analysis, but suffice to say that, like the
uncounted consumer surplus we mention, it stands to be important and non trivial. Our omission
of this additional welfare makes our estimate of return on investment even more conservative.
Why don‘t we attempt to measure the total change in economic welfare, the area of E plus the
area of CS? There are two good reasons here. First, the time and research costs are substantial. In
order to properly estimate the total economic welfare, we would have to determine not only the
prices at which consumers bought ecosystem services, but also their willingness to pay over a
large range of quantities. In many if not most cases, there are no data available to perform this
calculation. Where it has been done, the estimates suggest that the area of consumer surplus can

Copyright 2010 Everglades Foundation and Mather Economics 125
be large compared to the area of expenditure. For instance, Bin et al. estimate that the consumer
surplus of a day at the North Carolina beach is $11-80 for day visitors and $11-$41 for overnight
visitors. Since there is no charge for visiting the beach, the ratio of consumer surplus to
expenditure cannot be calculated.116117
Brynjolfsson, Hu and Smith say that:
Our analysis indicates that the increased product variety of online bookstores
enhanced consumer welfare by $731 million to $1.03 billion in the year 2000,
which is between 7 and 10 times as large as the consumer welfare gain from
increased competition and lower prices in this market. There may also be large
welfare gains in other SKU-intensive consumer goods such as music, movies,
consumer electronics, and computer software and hardware.118
What is our point here? It is actually quite simple. We have underestimated the consumer welfare
increase associated with Everglades restoration. We are not sure by how much, but leaving aside
all of our earlier conservative assumptions, not counting the consumer surplus associated with
restoration stands to be substantial. So for those who might wonder about the underestimated
costs of restoration in the CERP plan, or the ambiguity of some of the estimated benefits, rest
assured that there are potentially large and significant benefits to consumers of restoration that
are not being counted, and we have explained why.
Outrunning the Bear
At the outset of this evaluation, we promised to execute our assignment according to best
practices and methods of economic science. We believe we have lived up to this promise, and we
invite all readers to evaluate our success. It bears noting that one of the time-honored tenets of
economic methodology, owed to Nobel Laureate Milton Friedman (and many others) is the
concept that it takes a theory to beat a theory. In this spirit, while readers may criticize or
disagree with our assumptions and techniques here, any such complaints will fall on deaf ears
116 Bin, Okmyung, Landry, Craig E., Ellis, Christopher L.,Vogelsong, Hans. ―Some Consumer Surplus
Estimates for North Carolina Beaches.‖ Marine Resource Economics, Volume 20 (2005): 145–161. 117 See also Bapna, Ravi, Janks, Wolfgang, Shmueli, Galit. ―Consumer Surplus in Online Auctions.‖ Information
Surplus in Online Auctions, 19(4), (December 2008): 400-16. 118 Brynjolfsson, Erik, Hu, Jeffrey, Smith, Michael. ―Consumer Surplus in the Digital Economy:
Estimating the Value of Increased Product Variety at Online Booksellers.‖ paper 176, Center for eBusiness @MIT,
(November 2003): 1.

Copyright 2010 Everglades Foundation and Mather Economics 126
unless a superior alternative is proposed. Put bluntly, we will not accept criticism that simply
says, ―Your assumptions are wrong.‖ Let the critic propose adequate or superior alternatives.
What this means in practical terms is that our work need not be perfect in order to be useful and
acceptable. It just needs to be better than the rest. This does not mean that we believe we have
done our job as well as it can be done. Rather, it is meant to convey that our minds are open to
suggestions of better ways to do this project but not to simple statements that our work is wrong
or incorrect. The Olympic Gold Medalist need not set a world record to climb to the top of the
podium at the medal ceremony. She only need outrun the woman in second place. Of course, we
hope that each piece of our work ―sets a world record,‖ but we will sleep soundly if our work is
better than any other work tendered or suggested.

Copyright 2010 Everglades Foundation and Mather Economics 127
Chapter 10: Acknowledgements
We are grateful to a large number of people for their help on this project. First of all, the team at
the Everglades Foundation, including members of the Board, were especially valuable (natural)
resources and always available to us with advice, helpful criticism, and comments. We are also
grateful to them for affording us the opportunity to work on this project. We appreciate the time
and energy that so many people at various agencies, local, state, and federal took to answer our
questions, render helpful suggestions, and point us in the right direction, including the U.S.
Army Corps of Engineers, Jacksonville Office; Everglades National Park; the South Florida
Water Management District; Florida Forever; Florida Earth Foundation; National Wildlife
Foundation; Ducks Unlimited and a host of others.
Additionally, we appreciate the remarks, comments, and suggestions received in a number of
workshops on our work, including individuals at the Army Corps of Engineers, Institute for
Water Resources, Washington, D.C.; the Property Environment Research Center in Bozeman,
MT.; and particularly the comments of many at the Everglades Summit in Washington, D.C.,
May, 2010. Kathryn S. Watson provided insightful remarks and opinions that helped move this
project successfully. Of course, we alone are responsible for all errors remaining in this work.

Copyright 2010 Everglades Foundation and Mather Economics 128
Chapter 11: Mather Economics Everglades Valuation Team Biographies
Bobby McCormick, Ph.D., Principal Investigator
Professor Bobby McCormick attended Clemson University with a two-year interruption for
military service as 1LT in the U.S. Army, graduating with a B.A. in Economics in 1972 and
M.A. in1974. Bobby earned the Ph.D. in Economics from Texas A&M University in 1978. He
served as Assistant Professor of Business Administration at the Graduate School of Business at
the U. of Rochester and, beginning in 1982, was Associate and then Professor of Economics at
Clemson. In 2000 he was named BB&T Scholar and Director of the BB&T Center for Economic
Education at Clemson.
Bobby has won several Clemson University teaching awards: The Prince Innovative Teacher of
the Year (1998), the Alumni Professor of the Year (2000), the MBA Professor of the Year
(several occasions), and the National Scholars Mentor Award (2004 and 2006).
In 2001, Bobby was the Julian Simon Research Fellow at the Property Environmental Research
Center (PERC) in Bozeman, Montana. The following year, he was recognized as Senior Fellow
at PERC, a position he still holds today. From 2002-2005, he was the Director of the Kinship
Conservation Institute housed in Bozeman, MT. Starting in 2006 to the present, Bobby has been
the Director of TEAM, a training program for environmental scientists and policy makers at
PERC.
Bobby has served as an associate editor of the academic journals, Journal of Corporate Finance
and the Southern Economic Journal and is a frequent reviewer of manuscripts for publication in
a wide array of other academic journals. He consults on corporate financial affairs, litigation
matters, and a wide range of economics-related matters. His scholarly research and extensive
publications cover a broad spectrum of microeconomics, including the areas of antitrust, public
choice, regulation, sports and economics, managerial and financial economics, environmental
economics, and general microeconomic theory.
Robert Clement, MA
Robert Clement is a consultant to a variety of businesses. Robert provides consulting in the areas
of business strategy, business operations, project management, and antitrust economics. In
addition, Robert has lectured at the PERC Enviropreneur Institute, Clemson University,
Consortium of Universities for International Studies in Asolo, Italy, and the University of Notre
Dame.
Robert had a 15-year career at Accenture, one of the world‘s largest technology consulting
companies, from which he retired as a Partner in 2004. Robert‘s work at Accenture included
consulting with several of the world‘s largest telecommunications companies. Robert has also

Copyright 2010 Everglades Foundation and Mather Economics 129
participated in a number of conferences on free market environmentalism at PERC and the
Liberty Fund.
Robert serves on the boards of PERC and The Reserve at Lake Keowee Foundation. Robert
holds a BS in Economics and MA in Economics, both from Clemson University.
Daniel Fischer, MBA
Daniel Fischer is an executive and entrepreneur with over 20 years of international experience in
business strategy and strategic marketing in best-in-class companies and a variety of industries.
Daniel has been a management consultant with several top-tier consulting companies including
A.T. Kearney, Arthur D. Little and Zyman Group where he led and performed in-depth business
strategy, branding and marketing spend effectiveness work for best-in-class clients including:
Vodafone, EDS, Bellsouth, Dell, Alcoa Chick-fil-A, Clorox, InterContinental Hotels, Merck,
Safeco and Colgate Palmolive.
In addition to being a consultant, Daniel was a senior executive at TLC Vision – a company that
owns and operates over 80 Lasik eye surgery centers in the US -- where he built and managed
the Strategic Marketing & Analytics department.
Daniel also spent five years as an entrepreneur when he founded, managed and ran marketing
and business development functions at Comerxia -- a company that provides US online retailers
with a platform (i.e., technology, logistics and marketing) for international cross-border
ecommerce. The company‘s largest single shareholder is UPS, and it was featured in TIME
magazine as the leading solution for international ecommerce.
Daniel graduated from The Wharton School‘s Executive Education Program, holds an MBA
from IESA and a BSEE from Simon Bolivar University and the University of Tel Aviv.
Matt Lindsay, Ph.D.
Matt Lindsay is the Managing Partner of Mather Economics LLC, an economics consultancy
based in Atlanta, Georgia. He has worked as an applied economist for eighteen years specializing
in pricing strategy, forecasting, market analysis, and financial modeling.
Prior to founding Mather Economics, Matt worked for Arthur Andersen Business Consulting and
United Parcel Service. Matt received a Ph.D. in Economics from the University of Georgia, an

Copyright 2010 Everglades Foundation and Mather Economics 130
MA in applied Economics from Clemson University, and a BBA in Economics from the
University of Georgia. Matt speaks frequently on the topics of applied economics at conferences,
and he has published white papers on applied economics with a focus on using this type of
analytical framework to increase profits, lower costs, or grow revenues within multiple industry
contexts. Matt‘s work has led to millions of dollars of increased profits for his clients.
Reed Watson, JD MA
Reed Watson is the Director of Applied Programs and a Research Fellow at the Property and
Environment Research Center in Bozeman, Montana. Reed is primarily interested in
entrepreneurial environmental stewardship and the ability of markets to improve environmental
quality. He conducts research and coordinates workshops on water markets, payments for
ecosystem services and environmental contracting. He also directs PERC's state-wide
educational campaign on the link between private resource ownership and environmental
stewardship.
In addition to his role at PERC, Reed advises state and local governments, non-profits, and
private landowners on environmental resource contracting. This consulting practice specializes
in asset specification and measurement, payment structures, and resource valuation.
Reed holds a J.D. and M.A. in Environmental Economics from Duke University and a B.S. in
Economics from Clemson University.
Danielle Alderman
As an analyst at Mather Economics, Danielle is proficient in econometric modeling and STATA
programming. Danielle earned her bachelor‘s degree from Mercer University in International
Finance and Economics. She also attended Hong Kong Baptist University in Hong Kong, China,
where she completed a Chinese Language and Business Cultural Studies program, and also
studied in London, England where she completed an International Studies in Corporation and
Business Environment program.
Kristina Catani
Kristina Catani was born and raised in Washington Township, New Jersey. She attended
Clemson University in 2005 as a Clemson National Scholar and obtained her B.S. in Economics
in 2009. At Clemson, she spent much of her time in Death Valley at Tiger football games and
served five years in various roles on Clemson‘s student government. Her college summers were
spent studying abroad in England, Iceland, Ireland, and the Czech Republic. Kristina also spent
a summer as an intern at The Property and Environment Research Center in Bozeman,

Copyright 2010 Everglades Foundation and Mather Economics 131
Montana, where she immediately fell in love with the mountains and the West. She is currently
pursuing an M.A. in Economics from Clemson and working as a Teach for America corps
member in Denver, Colorado.
Joanna Fister
Joanna joined Mather Economics in 2008. She graduated with a B.A. in Economics from the
University of Georgia. While at Mather Economics, Joanna has created survival analysis that
demonstrates a customer‘s profitability and helped to develop strategy to retain more customers
for her clients. She has worked with over 50 newspaper clients in optimizing their renewal
pricing strategy for new and existing customers. She has also helped to develop revenue models
that project fiscal year revenue which clients use as a budgetary tool.
Prior to working at Mather Economics, Joanna worked at Culpepper and Associates as a
Research Analyst for two years. While at Culpepper and Associates, Joanna assisted in
processing worldwide salary surveys that provided market data on compensation and employee
benefits. Additionally, Joanna has interned for Athens-Clarke county Human and Economic
Development Department, where she assisted in creating a housing trust fund plan.
Gabi Huber, Ph.D.
Gabi received his BSc in Economics from the University of Cluj in Romania and the Ph.D. in
Applied Economics from Clemson University, with concentrations in industrial organization and
labor economics. He worked in, then managed the Economic Analysis Group at the UPS
headquarters in Atlanta, where he modeled costs and outputs in the UPS network. Gabi
specializes in applied microeconometrics using Stata.
Exley McCormick
Exley holds the B.S. in Biomaterials Engineering and B.A. in Economics from Clemson
University. He has extensive laboratory work while in undergraduate school. He has worked as
guide and ranch hand in South Africa and Montana. Exley is currently Research Assistant at the
Property Environmental Research Center in Bozeman, MT. He is past state cross-country
champion while in high school and an avid kayaker. He is a proficient computer programmer and
analyst in economics and engineering data.
Arvid Tchivzhel
An Analyst with Mather Economics LLC, Arvid has developed numerous econometric and
financial models that have been applied to a variety of industries. Major projects include:

Copyright 2010 Everglades Foundation and Mather Economics 132
predicting ticket sales in state and international lotteries, optimizing newspaper pricing and
circulation, analyzing revenue channels for international hotels, and valuing ecosystem services.
In addition to work with the Everglades Foundation, Arvid has conducted independent research
within the field of environmental economics. An econometric approach successfully measured
sensitivity of automobile sales to changes in fuel prices and informed a pragmatic discussion of
viable future options in alternative energy. Also completed was a cost-benefit study of
converting all university vehicles to alternative fuels, which was submitted for review to the
Furman Sustainability Planning Council.
Prior to Mather Economics, Arvid worked with various companies in the financial services
industry, including Waterfield Mortgage and Morgan Stanley. Arvid was born in Petrozavodsk,
Russia, and immigrated to the United States with his family at a young age. He graduated from
Furman University in Greenville, South Carolina, with degrees in Economics and Spanish.
Emily Wood, MA
Emily is a freelance copyeditor based in Clemson, South Carolina. She is certified in
Proofreading Skills by the Business Writing Center and holds a B.A. and an M.A. in English
Literature, both from Clemson University.
About Mather Economics
Mather Economics is an economics consultancy based in Atlanta, Georgia. Mather Economics
was founded in 2002, and we work with our clients to improve their performance through
applied economic analysis. We have worked extensively as economic consultants in multiple
industries and to complete economic valuations of ecosystem services. In addition to our
consulting engagements, we work with over 70 clients on a recurring basis to assist them with
applied analytics and performance reporting. We have particular expertise at helping companies
that have customers on a subscription or contractual relationship maximize profitability. In this
work, our analytics focuses on balancing customer acquisition and retention with revenue so that
each customer‘s lifetime value to the company is maximized. Mather Economics utilizes
econometric modeling and other quantitative modeling approaches to support our
recommendations, and we use extensive tracking and reporting to monitor the performance of
our programs. For further information, please contact us at [email protected]

Copyright 2010 Everglades Foundation and Mather Economics 133
or at (770) 993-4111.