Een stageverslag van: Naam: Matthijs Zuidberg Internal ...s3.amazonaws.com/zanran_storage/ · 1...
97
1 Cross-checking the National Estimates for the Non-energy Use of Fossil Fuels Naam: Matthijs Zuidberg Nummer: NWS-I-2005-13 Een stageverslag van: Naam: Matthijs Zuidberg Internal Report: NWS-I-2005-13 Begeleider/Supervisor: Martin Weiss and Maarten Neelis / Martin Patel Copernicus Institute for Sustainable Development and Innovation Department of Science Technology and Society Utrecht University Heidelberglaan 2 3584 CS Utrecht The Netherlands
Transcript of Een stageverslag van: Naam: Matthijs Zuidberg Internal ...s3.amazonaws.com/zanran_storage/ · 1...
1
Cross-checking the National Estimates for the Non-energy
Use of Fossil Fuels
Naam: Matthijs Zuidberg
Nummer: NWS-I-2005-13
Een stageverslag van: Naam: Matthijs Zuidberg Internal Report: NWS-I-2005-13 Begeleider/Supervisor: Martin Weiss and Maarten Neelis / Martin Patel Copernicus Institute for Sustainable Development and Innovation Department of Science Technology and Society Utrecht University Heidelberglaan 2 3584 CS Utrecht The Netherlands

2
Table of contents i. List of abbreviations 4 ii. Index of tables, figures and diagrams 5 iii. Summary 7 1. Introduction 9 2. Methodology 13 2.1. Top-down approach 14 2.2. Bottom-up approach 15 2.2.1. Ethylene production 15 2.2.2. Ammonia production 16 2.2.3. Methanol production 17
2.2.4. Carbon Black production 17 2.2.5. Aromatics production 17 2.2.6. Electrode consumption 18 2.2.7. Lubricants and Bitumen consumption 18
2.3. Comparison between the top-down and bottom-up approach 20 3. Results 21 3.1. Results of the top-down approach 21
3.1.1. General overview of the non-energy use 21 3.1.2. Non-energy use statistics 21
3.2. Results of the bottom-up approach 25 3.3. Results for the comparison of the top-down and bottom-up approach 26
3.3.1. Relative deviations 26 3.3.2. Relative deviations of countries in range 27 3.3.3. Countries with relative negative deviations 27 3.3.4. Countries with relative positive deviations 28
3.3.5. Absolute deviations 34 4. Discussion 41
4.1. Discussion about the methodology of this thesis 41 4.1.1. Discussion about the top-down methodology 41 4.1.2. Discussion about the bottom-up methodology 41 4.2. Discussion about the results of this thesis 44
4.3. Summary of discussion 45 5. Conclusions 46 6. Reference list 47

3
Appendices

4
i. List of abbreviations CO2: Carbon dioxide ESD: Energy Statistics Division GJ: Giga-joules
IEA: International Energy Agency IPCC: Intergovernmental Panel on Climate Change
IPTS: Institute for Prospective Technological Studies Ktoe: Kilotonnes of oil equivalents LHV: Lower heating value LPG: Liquefied Petroleum Gases
NEAT: Non-energy use Emission Accounting Tables NEU(Feedstock): Non-energy use due to feedstock use in the chemical industry
NEU(Ind.-Trans.-Energy): Non-energy use in the Industry, Transformation and Energy
Sector (other than feedstock use)
NEU(Other): Non-energy use in other sectors NEU(Refinery, Coke oven): Non-energy use consumed in refineries and coke ovens
NEU(Ind.-Trans.-Energy) + NEU(Transport) + NEU(Other)
NEU(Total): Total non-energy use
NEU(Refinery, Coke oven) + NEU(Feedstock)
NEU(Transport): Non-energy use in the transport sector
OECD: Organization for Economic Co-operation and
Development
PJ: Peta-joules
TPES: Total Primary Energy Supply
UN: United Nations
U.S.: United States

5
ii. Index of tables and figures Tables Table 1: Share of the non-energy use of fossil fuels with respect to the total
primary energy supply for different regions and years 9
Table 2: Feedstock specific lower heating values and yields for the ethylene Production 15
Table 3: Specific feedstock consumptions for the production of ethylene 16 Table 4: Assumptions made to calculate total non-energy use with
the bottom-up approach 18 Table 5: Specific yields, lower heating values and specific feedstock
consumptions for the bottom-up approach 19 Table 6: Country specific NEUFeedstock in descending order with respect to
both the OECD and non-OECD 21
Table 7: Country specific NEURefinery and Coke oven products in descending order with respect to both the OECD and non-OECD 22
Table 8: Country specific total non-energy use in descending order with
respect to both the OECD and non-OECD 23 Figures Figure 1: Two definitions of non-energy use i.e. the net and the gross
definition. (Adapted from Neelis et al. 2005) 11 Figure 2: Top-down and a bottom-up approach which are in turn composed
of respectively various sectors or products 13 Figure 3: Share on worldwide consumption of NEUFeedstock across the world 23 Figure 4: Share on worldwide consumption of NEURefinery and coke oven products
across the world 23 Figure 5: Relative deviations between the top-down and the bottom-up
approach in the total non-energy 30 Figure 6: Relative deviations between the top-down and bottom-up approach
in the total non-energy use of countries within range 31 Figure 7: Relative deviations between the top-down and bottom-up approach
in the total non-energy use of countries out of range, -100% to 0% 32 Figure 8: Relative deviations between the top-down and bottom-up approach
in the total non-energy use of countries out of range, 0% to 160% 33

6
Figure 9: Absolute deviations in PJ between the top-down and bottom-up
approach in the total non-energy use 35 Figure 10: Absolute deviations in PJ between the top-down and bottom-up
approach in the total non-energy use of countries within range 36 Figure 11: Absolute deviations in PJ between the top-down and bottom-up
approach in the total non-energy use of countries out of range, -700 to 0 PJ 37
Figure 12: Absolute deviations in PJ between the top-down and bottom-up
approach in the total non-energy use of countries out of range, 0 to 450 PJ 38
Figure 13: Map of Europe with respect to the non-energy use deviation. 39 Figure 14: Maps of America, Africa and Middle-East Europe with respect to
the non-energy use deviation 40 Figure 15: Map of Asia and Oceania with respect to the non-energy use deviation 40
7
iii. Summary CO2 emissions are an important issue now that the Kyoto Protocol has been approved. Most
attention was paid to CO2 emissions from the combustion of fossil fuels. However, the non-
energy use accounts for a significant fraction of fossil fuel consumption and might therefore also
contribute significantly to the CO2 emissions.
National energy statistics are sent to the International Energy Agency (IEA), which brings them
together in the international energy statistics. The non-energy use is given in a separate line in
the international energy statistics for various OECD and non-OECD countries. The national
energy statistics are also used by many countries in the IPCC Reference Approach of their
National Greenhouse Gas Inventory to estimate the amount of carbon storage and CO2
emissions from the non-energy use of fossil fuels.
It is however almost impossible to compare these country specific emissions because the
definition of the total non-energy use is not internationally harmonized. A various range of non-
energy use definitions is applied throughout the world, a gross definition and several net
definitions. To harmonize the country specific non-energy use, the main objective of this thesis
was to create a simplified bottom-up approach which was then compared with a top-down
approach, i.e. the non-energy use derived from energy statistics. The bottom-up approach was
based on 6 parameters (e.g. steam cracking figures, ammonia production, methanol production,
carbon black production, aromatics production and electrode consumption), which were
independent of the energy statistics. The top 51 countries with the highest non-energy use are
included in the bottom-up calculation which was done as gross as possible. The bottom-up
approach as well as the top-down approach is done for the year 2000. The two data sets were
compared in order to (i) determine if the simplified bottom-up approach is suitable, (ii) to estimate
total non-energy use to identify possible ‘hot spots’, i.e. countries where IEA data deviate
considerably from our bottom-up results and (iii) to obtain a deeper insight in the definition of non-
energy use chosen throughout the international community.
According to the top-down approach, which is done for the year 2000, the United States has the
largest non-energy use (5096 PJ) followed by Republic of China (2147 PJ), Japan (1824 PJ),
Korea (1149 PJ) and Germany (1058 PJ). The Netherlands has a non-energy use of respectively
430 PJ.
When we compared the top-down data with the bottom-up data, it showed that 13 out of 51
countries are in range. For 22 countries the bottom-up calculation results in higher non-energy
use and for another 16 countries the bottom-up calculation results in a higher non-energy use
than the top-down method, i.e. data stated by the IEA. Since the bottom-up calculation was done
as gross as possible, we can say that the countries in range apply a gross definition. The 22
8
countries that report too little non-energy use, i.e. the bottom-up calculation results in a higher
non-energy use, apply a possible net definition.
A few hotspots were identified with Venezuela (121% higher non-energy use than reported in the
energy statistics) and Columbia (74% lower non-energy use than reported in the energy statistics)
as extremes.
Based on our results derived from the comparison between the top-down and bottom-up
approach, we assumed that the Netherlands apply a net definition since the Netherlands report
too little non-energy use and that Germany applies a gross definition since Germany is a country
in range. From the NEAT results we know that this is true. Therefore, just looking at the countries
Germany and the Netherlands, we assume that the simplified bottom-up approach is reliable
enough.
Comparing the other bottom-up results with these example cases of Germany and the
Netherlands, a good indication can be given of the definition of non-energy use applied in other
countries. The extreme hot-spots (i.e. Venezuela and Columbia) can in turn be used in further
research to explain the possible error between the top-down and bottom-up approach. The
bottom-up approach can further be checked with the more sophisticated NEAT model to clarify
the reliability of this bottom-up calculation. In the end, we might come up with a harmonized
definition of non-energy use so that the non-energy use CO2-emissions can be more easily
calculated.

9
1. Introduction
Since the Kyoto Protocol has been approved by many countries, CO2 emissions should and will
be more closely monitored throughout the world. So far, most attention was paid to CO2
emissions from the combustion of fossil fuels. However, also the non-energy use accounts for a
significant fraction of fossil fuel consumption and might therefore contribute significantly to the
CO2-emissions.
Non-energy use is defined in this thesis as:
The use of fossil fuels as feedstock for the petrochemical/chemical industry. (e.g.
consumption of naphtha or natural gas to produce olefins or ammonia respectively).
The non-energy use of various refinery and coke oven products such as bitumen and
lubricants (e.g. in the building and transport sector).
The share of the total non-energy use of fossil fuels has significantly increased the last 30 years
(Table 1).
Table 1: Share of the non-energy use of fossil fuels with respect to the total primary energy supply for different regions and years (IEA 2002) TPES
(PJ) Non-energy use
(PJ) Non-Energy use /
TPES World 1971 228525 9804 4.3% 1985 322426 15648 4.9% 2000 416901 22130 5.3% European Union 1971 43620 2463 5.6% 1985 51689 3181 6.2% 2000 61139 3949 6.5% The Netherlands 1971 2148 188 8.7% 1985 2576 309 12% 2000 3174 430 14%
In the European Union for example non-energy use covered 5.6% of the total primary energy
supply in 1971 and 6.5% in 2000. This increase can be seen in table 1 for the world and the
Netherlands as well.
The non-energy use is given in a separate line in the international energy statistics for various
OECD and non-OECD countries. National energy statistics are sent to the International Energy
Agency (IEA), which brings them together in the international energy statistics.
The IEA does publish an international extended energy balance every year. The IEA is the
energy forum for 26 industrialised countries which have agreed to share energy information,
coordinate their energy policies and to cooperate on the development of rational energy
programmes (IEA 2005). The Energy Statistics Division (ESD) of the IEA collects this energy
information for the 30 OECD countries as well as the 100 non-OECD countries (Energy Statistics
Division 2005).

10
Non-energy use as given in the international energy balances consists of: feedstock use and non-
energy use in various sectors, e.g. industry, transport and others.
In the energy statistics feedstock use refers to hydrocarbons that are used to produce synthetic
organic materials e.g. solvents and plastics.
The non-energy use refers to the consumption of certain refinery products that are used as
materials e.g. bitumen and lubricants (Patel et al. 2003). Feedstock use is in this report denoted
as NEUFeedstock while consumption of non-energy use is denoted as NEURefinery, Coke oven.
In the international Energy Balances, non-energy use of various refinery and coke oven products
is further divided into 3 subgroups:
Non-Energy use in industry, transformation and energy
Non-Energy use in transport
Non-Energy use in other sectors
In this report these non-energy uses will be denoted as respectively NEUInd/Trans/Energy, NEUTransport
and NEUOther.
We, therefore, define total non-energy use as:
Non-energy use = NEUTotal = NEUFeedstock + NEUInd/Trans/Energy + NEUTransport + NEUOther
= NEUFeedstock + NEURefinery, Coke oven
Apart from the international energy statistics, the national energy statistics are also used by many
countries in the IPCC Reference Approach of their National Greenhouse Gas Inventory to
estimate the amount of carbon storage and CO2 emissions from the non-energy use of fossil
fuels.
It is however almost impossible to compare these country specific emissions because the
definition of the total non-energy use is not internationally harmonized.
There are many definitions of non-energy use possible. However, two definitions can be
considered as boundaries for a large variety of definitions for the non-energy use of fossil fuels:
A gross definition includes the share of the feedstock, which is combusted in steam
crackers and in ammonia, methanol and carbon black production in order to raise
process heat. Also the backflows from steam crackers to refineries are included in this
gross definition. In other words the total amount of raw material input is stated as non-
energy use (figure 1).
A net definition in contrast excludes this share of feedstock for heat production. The
backflows from steam crackers are also excluded in the net definition. Here, only the
amount of feedstock directly used to produce products is stated as non-energy use
(figure 1).

11
Figure 1: Two definitions of non-energy use i.e. the net and the gross definition (Adapted from Neelis et al. 2005)
A various range of non-energy use definitions is applied throughout the world, a gross definition
and several net definitions in which parts of the hydrocarbon input is not allocated to non-energy
use. If a gross definition is applied a relatively high non-energy use, compared to the several net
definitions, is reported.
Because of this not harmonized non-energy use definition, comparing the non-energy use from
different countries is by no means straight forward but requires detailed insight in the accounting
praxis of the respective country. However, a comparison of the data given by the international
energy statistics with the total non-energy use as calculated with a simplified bottom-up approach
(in which the non-energy use in defined as gross as possible) can serve as indication of what
definition is used in the respective country. For example if the reported non-energy use in these
energy balances is lower than the results of this bottom-up approach, it could be possible that the
specific country uses a net-definition. If the reported non-energy use is higher than the results of
the simplified bottom-up approach, it can be an indication for a possible error in the reported non-
energy use. It can also indicate that our simplified bottom-up approach is not exact enough.
Based on these findings, further research can be done to elaborate details and reduce data
uncertainties related to the non-energy use of fossil fuels.

12
The goal of this study is, therefore, to develop an independent bottom-up estimate for non-energy
use, independently from official energy statistics and to compare the total non-energy use as
calculated with this bottom-up approach with non-energy use data given for both OECD and non-
OECD countries in the extended energy balances (Top down approach).
The objective of this study is twofold. The first is to develop a simplified bottom-up approach in
order to calculate total non-energy use for various countries based on 6 different parameters
independently from official energy statistics. In a second step, the results obtained with the
simplified bottom-up approach should be compared with the top-down approach i.e. non-energy
use data from the extended international balances as published by the IEA (2002). From this
comparison a deeper insight in the applied non-energy use definition can be obtained. In this
thesis the bottom-up calculations and the comparisons are done for the year 2000.
Country-specific non-energy use data from the international energy balances is collected and
ordered in a way that it is suitable for comparison. Next, the total non-energy use is calculated
based on the simplified bottom-up approach that is independent from the international extended
energy balances. Finally the two data sets are compared in order to determine (i) if the simplified
bottom-up approach is suitable (ii) to estimate total non-energy use to identify possible ‘hot spots’,
i.e. countries where IEA data deviate considerably from our bottom-up results and (iii) to obtain a
deeper insight in the definition of non-energy use chosen throughout the international community.
Summarized, the outcome of this study will first of all give us some information of the non-energy
use definition chosen in various countries. It will also allow us to calculate the total non-energy
use of a country independently of the international extended energy balances and in turn allow us
to identify possible hotspots. Next to this, the outcome can be used for further research to identify
the applied non-energy use definition of a country and eventually might help to harmonize the
non-energy use definition. The hotspots might therefore serve as starting point for further
research on non-energy use for the respective countries.
The methodology chosen for this bottom-up calculation is explained in detail in the following
section. The results of this thesis are given in Section 3. In section 4 a short discussion about the
assumptions and possible errors is included and finally the conclusions of this thesis are given in
section 5.

13
2. Methodology The methodology section is split up in two parts since this cross-check was done by the means of
a top down and a bottom up approach. In this section the two approaches will be discussed in
detail followed by a detailed description of the comparison between the two approaches. The
general methodology of this research can be seen in figure 2.
Figure 2: Top-down and a bottom-up approach which are in turn composed of respectively various sectors or products

14
As can be seen from figure 2 the top-down approach consists of 4 different sectors e.g.
NEUfeedstock, NEUInd/Trans/Energy, NEUTransport and NEUOther while the bottom-up approach consists of
7 different products. All those products are independent from the international energy balances
except for the lubricants and bitumen consumption. These products are separately discussed
later in this methodology section as part of the bottom-up approach.
2.1. Top-down approach The top-down approach is based on fuel specific data for the non-energy use in the year 2000 in
various countries as given in the extended International Energy Balances, which are published by
the International Energy Agency (IEA 2002).
The extended energy balances were accessed with the program beyond 20/20.
Data in the extended Energy Balances are sorted with respect to 4 different criteria:
FLOW: in which the different sectors are stated (e.g. petrochemical industry and
electricity plants) where the energy carriers are consumed.
TIME: in which the respective year is mentioned.
COUNTRY: in which the specific country is mentioned.
PRODUCT: in which the product, i.e. the specific energy carrier, is mentioned (e.g. hard
coal, naphtha or other petroleum cokes).
There are two sets of extended International Energy Balances, one for the 30 OECD-countries
and one for the 105 non-OECD countries. In this research both are reviewed, thereby taking the
non-energy use for all countries into account.
We extracted fuel specific data of non-energy use i.e. NEUFeedstock and NEURefinery, Coke oven from the
energy statistics for every country for the year 2000.
The non-energy data from the extended international energy balances were listed in an excel file
containing 6 worksheets i.e. 1 for NEUfeedstock, 4 for the NEU groups (e.g. NEUInd/Trans/Energy,
NEUTransport, NEUOther, NEURefinery, Coke oven) and 1 for the total non-energy use (NEUTotal). In the
worksheets the countries are ordered alphabetically but separated into OECD and non-OECD.
The various fossil fuels and feedstocks are arranged according to the extended energy balances.
Some of those fossil fuels and feedstocks are however not included (e.g. Heat and Wind energy)
since they do not contribute to the NEUFeedstock nor to the NEURefinery, Coke oven and thus not to the
NEUTotal.
The total non-energy use was calculated as the sum of NEUfeedstock and the NEURefinery, Coke oven
because the energy statistics do not hold a value for total non-energy use. Please note that
NEURefinery, Coke oven is the sum of NEUInd/Trans/Energy , NEUTransport and NEUOther. The energy unit in the
extended balances is kilotonne of oil equivalents (ktoe). These values are also used in the
worksheets. We have however re-calculated the non-energy use values into peta-joule (PJ) to be
able to compare the results from the top-down approach with the bottom up approach.

15
A selection of countries was made before starting with the bottom up approach.
Based on the top down approach a list of countries was derived with descending total non-energy
use (Appendix 1).
From this list the top 51 countries with the highest non-energy use were included in the bottom-up
approach. By this approach we cover 97.6% of the worldwide total non-energy use as given in the
International Energy Balance. Appendix 2 shows the selected 51 countries.
2.2. Bottom-up approach The bottom up approach is based on 6 different independent parameters and 1 dependent
parameter e.g. lubricants and bitumen consumption. The 7 parameters are subdivided in either
NEUfeedstock or NEURefinery, Coke oven which can again be seen in figure 2.
In short:
NEUFeedstock = Ethylene production + ammonia production + methanol production +
carbon black production
NEURefinery, Coke oven = Aromatics production + electrode consumption + lubricants
and bitumen consumption
In the following part we will describe each of the components of the bottom-up calculations of
non-energy use in detail.
2.2.1. Ethylene production To approximate feedstock use in steam crackers, we use information on the ethylene production
capacities of various countries as given in Oil & Gas Journal (2001). We assume a load factor of
100% to estimate actual ethylene production per country. Specific steam cracker yields and lower
heating values were obtained from the best available technique Reference Documents (IPTS
2003). The yields and lower heating values are shown in table 2.
Table 2: Feedstock specific lower heating values and yields for the ethylene production Naphtha Gas oil Ethane Propane Butane Yields (t/t feedstock) 0.324 0.250 0.803 0.458 0.440 LHV (GJ/t feedstock) 44.0 42.7 47.5 46.3 45.7
We further assumed that typical steam cracker yields for Western Europe also hold for other parts
of the world. In some countries the feedstock for the ethylene production was stated under
unknown. In case of this unknown feedstock, we assumed that naphtha was used since the
majority of the countries use naphtha as most important feedstock. The Northern American
countries (e.g. Canada and the United States) were however an exception. For those countries
we assumed that ethane was used as only steam cracker feedstock. These assumptions were
based on the specific feedstock requirements derived from Oil & Gas Journal (2001).

16
Based on the ethylene production capacity figures and specific yields, we calculate specific
feedstock requirements for ethylene production in the various countries. The lower heating values
for the different feedstock’s (Hooijdonk et al. 2004) were in turn used to calculate the required
energy in ktoe. A factor of 41.868 TJ/ktoe was then used to re-calculate the required energy into
peta-joule. Summarized, the total energy needed to produce 1 ton of ethylene for the various
feedstocks is shown in table 3.
Table 3: Specific feedstock consumptions for the production of ethylene Naphtha Gas oil Ethane Propane Butane Unit 136 171 59 101 104 GJ/t ethylene
The results were placed in a worksheet with the same layout as the international energy balances
for more easy comparison only this time with the 51 selected countries with the highest total non-
energy use in contrast to the 160 countries in the international energy balances. Also, there are
only 4 feedstocks included in contrast to the 59 in the energy statistics since the rest of them did
not contribute to the ethylene production e.g. had a value of 0.
2.2.2. Ammonia production Information about ammonia production is derived from U.S. Geological Survey Minerals Yearbook
(2001). These ammonia production figures have been checked with reliable information derived
from Ramirez-Ramirez (2005) to avoid any data uncertainties.
The production figures are stated in thousands of metric tons of nitrogen. Since nitrogen has a
molecular mass of 14 gram and ammonia of molecular mass of 17, a factor of 17/14 is used to
recalculate tons of nitrogen into tons of ammonia.
We assumed that natural gas is the only feedstock for the production of ammonia. A specific
feedstock consumption of 32 GJ natural gas / tonne ammonia was used. This specific feedstock
consumption is an average value derived from Worrell (1994) in which the specific energy
consumptions of natural gas to produce ammonia, were stated for the European countries.
Multiplying the ammonia production figures with this specific energy consumption value the total
energy use of natural gas was calculated in peta-joule. As was done for the ethylene production,
the results of the ammonia production bottom-up calculation were placed in the worksheet. Only
natural gas was included since we assumed that this was the only feedstock to produce
ammonia. The specific energy requirement of natural gas for the ammonia production was add up
to the energy requirement of natural gas for the ethylene production.
2.2.3. Methanol production Information about the methanol capacity figures was taken from Chemical week (2003). We
assumed that the only feedstock to produce methanol is natural gas and that this feedstock use
also holds for the rest of the world. The same specific energy consumption of 32 GJ natural
17
gas / tonne methanol (Worrell 1994) was assumed. A load factor of 100% was further assumed to
be able to calculate the actual methanol production from capacity data. The total energy use in
peta-joule was calculated by multiplying the specific feedstock consumption with the country
specific capacity figures. The results were placed in the worksheet again.
2.2.4. Carbon Black production We assume carbon black to be produced from natural gas and crude oil. According to Neelis et
al. (2005) 0.6 tonne of carbon black requires 1 tonne of crude oil and 243 cubic meters of natural
gas. The lower heating values for both feedstocks were also derived from the NEAT model
(Neelis et al. 2005). Natural gas has a lower heating value of 31.7 MJ/cubic meter and crude oil
has a lower heating value of 42 GJ/tonne. The production capacity figures are derived from
Chemical week (2005) since there wasn’t any carbon black capacity data available for the year
2000. Carbon black production is assumed to remain almost constant between 2000 and 2005,
therefore information about 2005 is assumed not to differ significantly from capacity data for
2000. Since capacity data is used, we again assumed a load factor of 100%. The specific yields
and lower heating values for the two feedstocks were again used to calculate the amount of
energy needed in the process. The results were again placed in the worksheet.
2.2.5. Aromatics production Aromatics production was approximated in the bottom-up approach by using capacity data for
aromatics production. Information about aromatics production capacities was taken from Gas &
Oil Journal Special (1999). Production capacity figures were stated in barrels per calendar day.
First, these capacity figures are multiplied with a factor 365 to get to barrels per calendar year. A
barrel contains 159 liters, we therefore multiplied with 0.159 m3/b. These aromatics capacity
figures in cubic meters were then, as a final step, multiplied with an average density of 0.85 t/m3.
Again a load factor of 100% was assumed to calculate actual production figures from capacity
data. In Gas & Oil Journal Special (1999) the aromatics are split up in benzene, toluene and
xylenes. In the international energy statistics however the feedstock for aromatics production is
stated as ‘other petroleum products’ and the aromatics are not split up. We therefore assumed
the aromatics to consist of a mixture with equal shares of benzene, toluene and xylenes. The
lower heating values of benzene, toluene and xylenes were add up and divided by 3 to calculate
an average lower heating value of 40.455 GJ/t aromatics. Since the yield was assumed to be
1.00 for the aromatics production, the required other petroleum products were calculated by
multiplying the country specific aromatics capacity figures with the average lower heating value.
18
2.2.6. Electrode consumption Electrodes are mainly used to produce aluminium. We therefore assumed that the total electrode
consumption of all countries studied is caused by the production of aluminium. Aluminum
production figures were derived from the UN Statistics (UN 2000). It was further assumed that
the electrodes are produced from 100% petroleum coke with a respective yield of 1.0. According
to the IPCC Guidelines (1997) the lower heating value for petroleum coke is 40.19 GJ/t and the
specific electrode consumption is 0.4 tonne of electrodes to produce 1 tonne of aluminium.
Summarized, for the production of 1 tonne aluminium a specific feedstock consumption of 16.08
GJ petroleum coke is needed.
We then multiplied the specific feedstock requirement per tonne aluminium with the country
specific aluminium production to calculate the total amount of energy needed.
2.2.7. Lubricants and Bitumen consumption There was no reliable information for lubricants and bitumen consumption available to us
independent from official energy statistics. We therefore derived values from the International
Energy Balances (2002). This resulting in a total non-energy use as calculated with the simplified
bottom-up approach that is not totally independent anymore from the top down approach i.e. the
official energy statistics.
We included population data derived from the UN statistics (UN 2000) to be able to calculate the
lubricants and bitumen consumption per capita as a research extension just to see if there is a
trend in these consumption values.
During this thesis a lot of assumptions were done. These are summarized in table 4.
Table 4: Assumptions made to calculate total non-energy use with the bottom-up approach Non-energy use Assumed NEU(Feedstock) Ethylene production Capacity data derived from Oil & Gas Journal (2001) is
used A load factor of 100% is used to estimate actual
ethylene production per country Typical west European yields also hold for the rest of
the world In case of unknown feedstock, naphtha is used In case of an unknown feedstock in North America,
ethane is used Ammonia production Natural gas is the only feedstock to produce ammonia
Production figures derived from U.S. Geological Survey Minerals Yearbook (2001) are used
A specific feedstock consumption for the production of ammonia of 32 GJ natural gas / tonne ammonia
Methanol production Natural gas is the only feedstock to produce methanol Capacity data derived from Chemical week (2003) is
19
used A load factor of 100% is used to estimate actual
methanol production per country A specific feedstock consumption for the production of
methanol of 32 GJ natural gas / tonne methanol Carbon black production Specific feedstock consumption of 1t crude oil and 243
cubic meters of natural gas / 0.6 t carbon black Natural gas has a lower heating value of 31.7 MJ/cubic
meter Crude oil has a lower heating value of 42 GJ/tonne Values for carbon black production capacities were
taken from 2005. Therefore it is assumed that capacity data for 2005 do not differ significantly from capacity data for 2000
NEU(Refinery-Coke oven products) Aromatics production Aromatics are stated under ‘Other petroleum products’
in the energy statistics A yield of 1.00 A load factor of 100% to estimate actual aromatics
production per country Aromatics consist of a mixture with equal shares of
benzene, toluene and xylenes An average lower heating value of 40.455 GJ/t
aromatics Electrodes consumption The total electrode consumption is covered by the
aluminium production Electrodes are produced from 100% petroleum coke Petroleum coke has a lower heating value of 40.19 GJ/t 0.4 tonne of electrodes are consumed to produce 1
tonne of aluminum
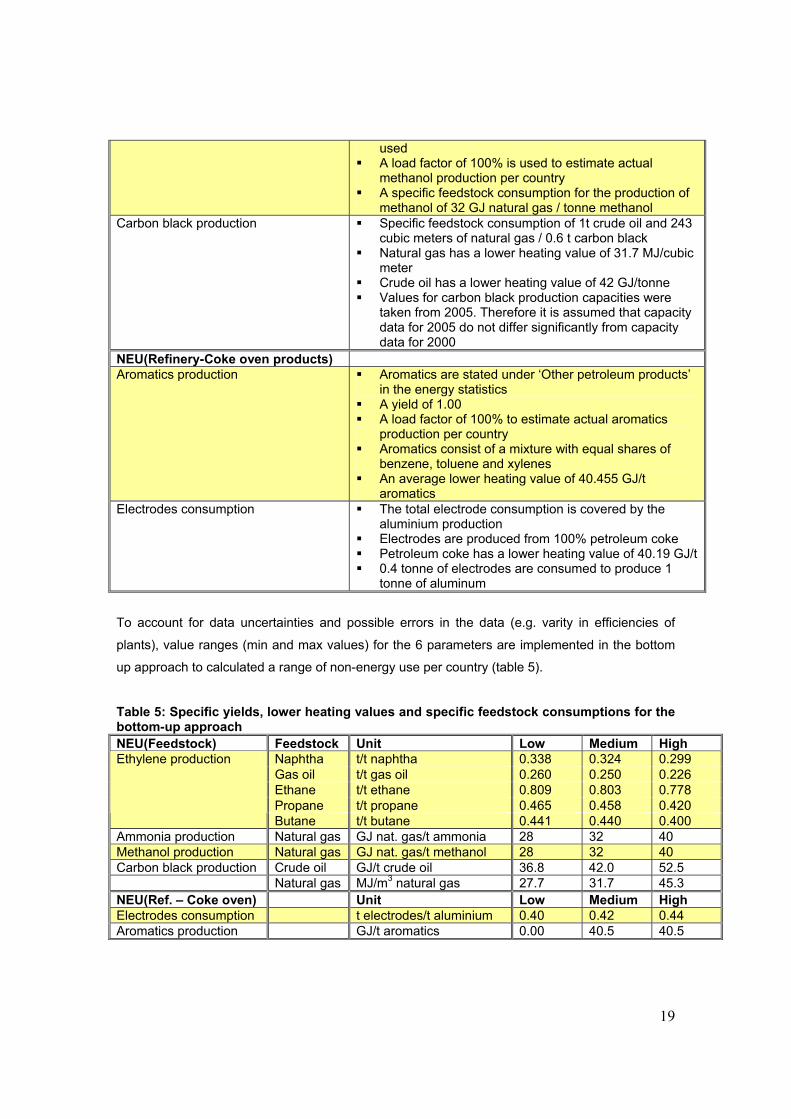
To account for data uncertainties and possible errors in the data (e.g. varity in efficiencies of
plants), value ranges (min and max values) for the 6 parameters are implemented in the bottom
up approach to calculated a range of non-energy use per country (table 5).
Table 5: Specific yields, lower heating values and specific feedstock consumptions for the bottom-up approach NEU(Feedstock) Feedstock Unit Low Medium High
Naphtha t/t naphtha 0.338 0.324 0.299 Gas oil t/t gas oil 0.260 0.250 0.226 Ethane t/t ethane 0.809 0.803 0.778 Propane t/t propane 0.465 0.458 0.420
Ethylene production
Butane t/t butane 0.441 0.440 0.400 Ammonia production Natural gas GJ nat. gas/t ammonia 28 32 40 Methanol production Natural gas GJ nat. gas/t methanol 28 32 40 Carbon black production Crude oil GJ/t crude oil 36.8 42.0 52.5 Natural gas MJ/m3 natural gas 27.7 31.7 45.3 NEU(Ref. – Coke oven) Unit Low Medium High Electrodes consumption t electrodes/t aluminium 0.40 0.42 0.44 Aromatics production GJ/t aromatics 0.00 40.5 40.5
20
The low and high yields for ethylene production were again taken from best available technique
Reference Documents (IPTS 2003) and the specific feedstock consumptions for both methanol
and ammonia were taken from Worrell (1994). The lower heating values for carbon black were in
turn calculated using the same range as the specific feedstock consumption for methanol and
ammonia.
The range for the specific electrode consumption in the aluminium production process was
assumed to be 0.40 to 0.44. The value range of non-energy use for the aromatics production was
calculated by neglecting the aromatics production in the low approach. For the medium and high
boundary we used the average lower heating value.
2.3. Comparison between the top-down and bottom-up approach In this section, we compare non-energy use data as calculated with the bottom-up approach with
data as given in the International Energy Balance (top-down).
Relative deviations between the top-down and bottom-up approach were calculated with the
formula:
Bottom-up(relative) = (Bottom-up(medium) – Top-down) / Top-down
Absolute deviations were calculated with the formula:
Bottom-up(absolute) = Bottom-up(medium) – Top-down
This was also done for the low and the high boundary of the bottom-up approach.
As a result two bar-diagrams were created per country, one for the relative deviation and one for
the absolute deviation. The bar-diagrams were assembled in a two larger graphs, again one for
the relative and one for the absolute deviations. The countries with a high relative deviation were
identified as possible hot-spots.

21
3. Results This section starts out with a short presentation of the non-energy use as it is stated in the
International Energy Balance (top-down approach) for the various OECD and non-OECD
countries followed by 3 top 10’s in NEUFeedstock, NEURefinery and coke oven, and NEUTotal.
In the second part of this section we show the intermediate results of the bottom-up calculation
followed by the results of this calculation. Finally, we give results for the comparison of the top-
down and bottom-up approach.
3.1. Results of the top-down approach 3.1.1. General overview of the non-energy use The first part of results of the top-down approach consists of a general overview of the non-
energy use as it is stated in the international energy statistics (IEA 2002). The results of this top-
down approach are stored in an excel file, composed of 6 worksheets, and can be downloaded at
http://www.chem.uu.nl/nws/www/nenergy.
3.1.2. Non-energy use statistics From the 6 worksheets, which are stored on http://www.chem.uu.nl/nws/www/nenergy, 3 top 10’s
are created, a top 10 for NEUFeedstock, for NEURefinery and Coke oven and for NEUTotal. In the top 10, the
10 OECD countries as well as the 10 non-OECD countries with the highest NEUFeedstock,
NEURefinery and Coke oven and NEUTotal are mentioned.
In table 6 the countries with the highest NEUFeedstock can be seen.
Table 6: Country specific NEUFeedstock in descending order with respect to both the OECD and non-OECD NEUFeedstock Top 10 OECD (Total OECD: 9172 PJ)
(PJ) Top 10 non-OECD (Total non-OECD: 5241 PJ)
(PJ)
1 United States 2743 1 Republic of China 1241 2 Japan 1416 2 Russia 664 3 Korea 1056 3 Brazil 411 4 Germany 842 4 India 405 5 Canada 557 5 Saudi Arabia 372 6 France 485 6 Indonesia 242 7 United Kingdom 310 7 South Africa 211 8 Netherlands 306 8 Chinese Taipei 196 9 Spain 231 9 Argentina 137 10 Mexico 221 10 Trinidad and Tobago 131
On the left side of the table the 10 OECD countries with the highest NEUFeedstock are listed and on
the right side of the table the 10 non-OECD countries. United States has the largest NEUFeedstock
followed by Japan and Republic of China. Furthermore, it can be seen that Netherlands is
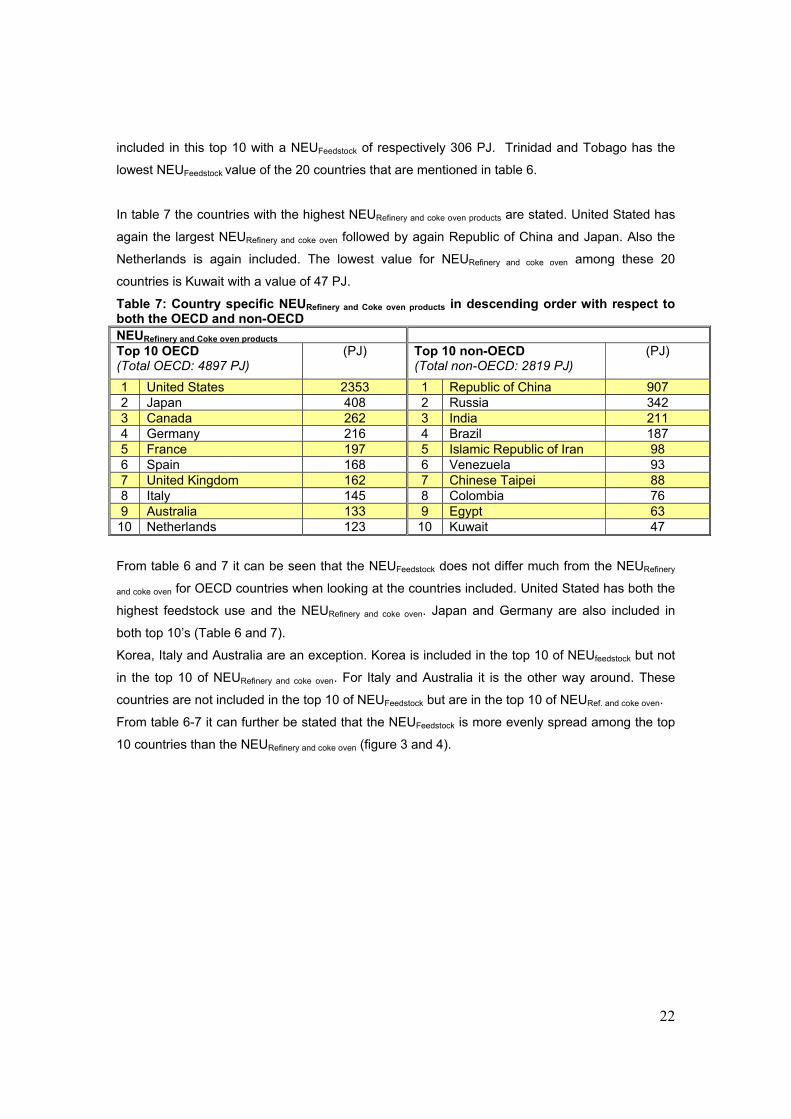
22
included in this top 10 with a NEUFeedstock of respectively 306 PJ. Trinidad and Tobago has the
lowest NEUFeedstock value of the 20 countries that are mentioned in table 6.
In table 7 the countries with the highest NEURefinery and coke oven products are stated. United Stated has
again the largest NEURefinery and coke oven followed by again Republic of China and Japan. Also the
Netherlands is again included. The lowest value for NEURefinery and coke oven among these 20
countries is Kuwait with a value of 47 PJ.
Table 7: Country specific NEURefinery and Coke oven products in descending order with respect to both the OECD and non-OECD NEURefinery and Coke oven products Top 10 OECD (Total OECD: 4897 PJ)
(PJ) Top 10 non-OECD (Total non-OECD: 2819 PJ)
(PJ)
1 United States 2353 1 Republic of China 907 2 Japan 408 2 Russia 342 3 Canada 262 3 India 211 4 Germany 216 4 Brazil 187 5 France 197 5 Islamic Republic of Iran 98 6 Spain 168 6 Venezuela 93 7 United Kingdom 162 7 Chinese Taipei 88 8 Italy 145 8 Colombia 76 9 Australia 133 9 Egypt 63 10 Netherlands 123 10 Kuwait 47
From table 6 and 7 it can be seen that the NEUFeedstock does not differ much from the NEURefinery
and coke oven for OECD countries when looking at the countries included. United Stated has both the
highest feedstock use and the NEURefinery and coke oven. Japan and Germany are also included in
both top 10’s (Table 6 and 7).
Korea, Italy and Australia are an exception. Korea is included in the top 10 of NEUfeedstock but not
in the top 10 of NEURefinery and coke oven. For Italy and Australia it is the other way around. These
countries are not included in the top 10 of NEUFeedstock but are in the top 10 of NEURef. and coke oven.
From table 6-7 it can further be stated that the NEUFeedstock is more evenly spread among the top
10 countries than the NEURefinery and coke oven (figure 3 and 4).

23
27%
14%
13%
11%
9%
7%
6%
5%4% 4%
United States
Japan
People's Republic of China
Korea
Germany
Russia
Canada
France
Brazil
India
Figure 3: Share on worldwide consumption of NEUFeedstock across the world
44%
17%
8%
7%
5%
4%
4%
4% 4% 3%United States
People's Republic of China
Japan
Russia
Canada
Germany
India
France
Brazil
Spain
Figure 4: Share on worldwide consumption of NEURefinery and coke oven products
across the world As can be seen from figure 3 and 4, the United States consumes 27% of the total NEUFeedstock and
44% of the total NEURefinery and coke oven.
In table 8 the top 10 for the total non-energy use is shown. The countries that are included in both
the top 10 for NEUFeedstock and the top 10 for NEURefinery and coke oven are expected to be also included
in this top 10.
Table 8: Country specific total non-energy use in descending order with respect to both the OECD and non-OECD NEUTotal Top 10 OECD (Total OECD: 14070 PJ)
(PJ) Top 10 non-OECD (Total non-OECD: 8060 PJ)
(PJ)
1 United States 5096 1 Republic of China 2147 2 Japan 1824 2 Russia 1006 3 Korea 1149 3 India 616 4 Germany 1058 4 Brazil 599

24
5 Canada 819 5 Saudi Arabia 416 6 France 681 6 Chinese Taipei 284 7 United Kingdom 472 7 Indonesia 273 8 Netherlands 430 8 South Africa 234 9 Spain 399 9 Islamic Republic of Iran 186 10 Italy 324 10 Argentina 182
From these country specific non-energy use figures can be derived that the United Stated has the
greatest non-energy use and even have twice and much as the number 2, People’s Republic of
China (Table 8).
In appendix 1 the countries are arranged in descending order with respect to their total non-
energy use. The country specific NEUFeedstock and NEURefinery and coke oven are also added.
3.2. Results of the bottom-up approach The intermediate results which are given in this section are based on the bottom-up calculations
for the various parameters (e.g. ethylene production and bitumen consumption). For every
parameter a worksheet is created. In this worksheet the 51 countries with the highest non-energy
use are included this resulting in United Stated on top of the country list and Finland on the
bottom. These worksheets are shortly discussed in this section.
The worksheet for the ethylene production can be seen in appendix 8. Ethane, LPG, Gas/Diesel
Oil and naphtha are the different feedstocks used for the ethylene production. United has the
largest ethylene production with a specific feedstock consumption of 2210 PJ. Republic of China
is positioned as second in NEUTotal list but does not has the second largest ethylene production
since Republic of China has a specific feedstock consumption of 581 PJ in contrast to 895 PJ for
Japan and 699 PJ for Germany.
The worksheet for the production of ammonia can be seen in appendix 9. We assumed that
ammonia is produced from natural gas only. The United Stated does not have the largest
ammonia production. It uses 486 PJ of natural gas in contrast to the 1076 PJ that Republic of
China uses.
For the methanol production we also assumed that the only feedstock used to produce methanol
is natural gas. The results can be seen in appendix 10. The United Stated has the largest
methanol production with a specific feedstock consumption of 166 PJ. If we look at countries with
a lower total non-energy use, we can see that Saudi Arabia (126 PJ), Trinidad and Tobago (94
PJ) and New Zealand (77 PJ) have a great methanol production with respect to their total non-
energy use. Japan which is the number 3 on the list of total non-energy use has a specific
feedstock consumption of 0 PJ for the production of methanol i.e. does not produce methanol or
reports it differently.
Carbon black is the fourth parameter of the bottom-up approach and is produced from natural gas
and crude oil. The created worksheet can be seen in appendix 11. The United States has the
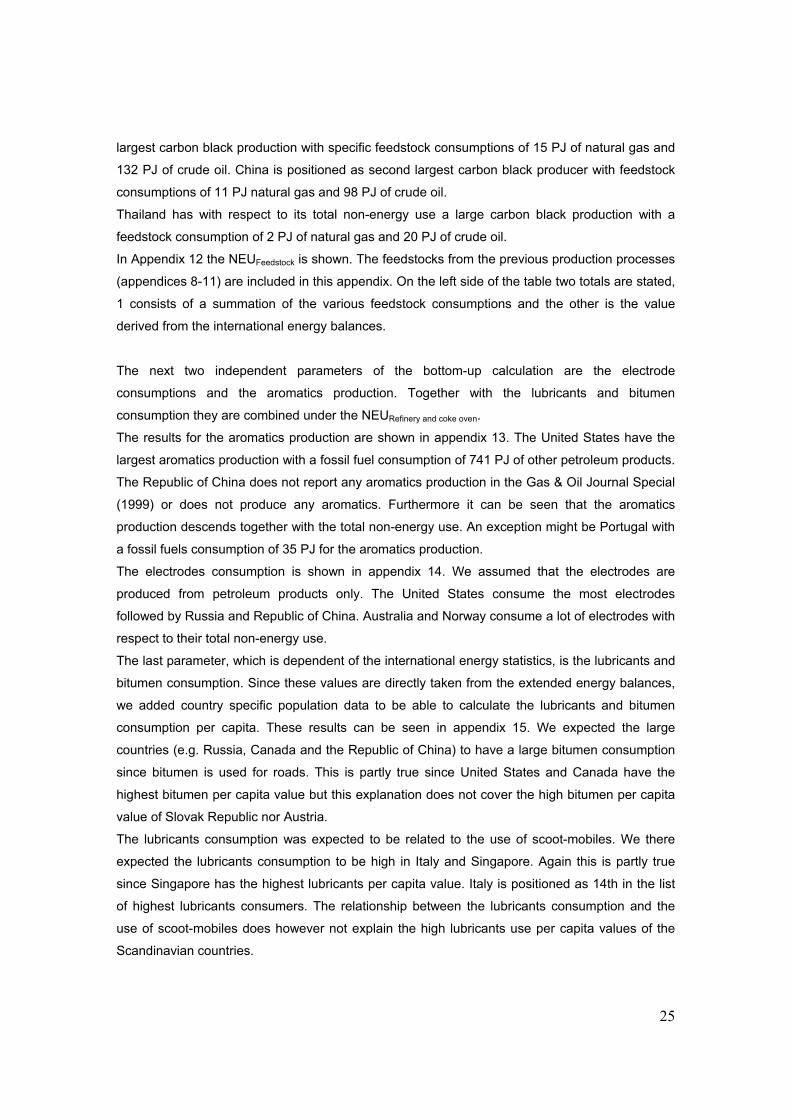
25
largest carbon black production with specific feedstock consumptions of 15 PJ of natural gas and
132 PJ of crude oil. China is positioned as second largest carbon black producer with feedstock
consumptions of 11 PJ natural gas and 98 PJ of crude oil.
Thailand has with respect to its total non-energy use a large carbon black production with a
feedstock consumption of 2 PJ of natural gas and 20 PJ of crude oil.
In Appendix 12 the NEUFeedstock is shown. The feedstocks from the previous production processes
(appendices 8-11) are included in this appendix. On the left side of the table two totals are stated,
1 consists of a summation of the various feedstock consumptions and the other is the value
derived from the international energy balances.
The next two independent parameters of the bottom-up calculation are the electrode
consumptions and the aromatics production. Together with the lubricants and bitumen
consumption they are combined under the NEURefinery and coke oven.
The results for the aromatics production are shown in appendix 13. The United States have the
largest aromatics production with a fossil fuel consumption of 741 PJ of other petroleum products.
The Republic of China does not report any aromatics production in the Gas & Oil Journal Special
(1999) or does not produce any aromatics. Furthermore it can be seen that the aromatics
production descends together with the total non-energy use. An exception might be Portugal with
a fossil fuels consumption of 35 PJ for the aromatics production.
The electrodes consumption is shown in appendix 14. We assumed that the electrodes are
produced from petroleum products only. The United States consume the most electrodes
followed by Russia and Republic of China. Australia and Norway consume a lot of electrodes with
respect to their total non-energy use.
The last parameter, which is dependent of the international energy statistics, is the lubricants and
bitumen consumption. Since these values are directly taken from the extended energy balances,
we added country specific population data to be able to calculate the lubricants and bitumen
consumption per capita. These results can be seen in appendix 15. We expected the large
countries (e.g. Russia, Canada and the Republic of China) to have a large bitumen consumption
since bitumen is used for roads. This is partly true since United States and Canada have the
highest bitumen per capita value but this explanation does not cover the high bitumen per capita
value of Slovak Republic nor Austria.
The lubricants consumption was expected to be related to the use of scoot-mobiles. We there
expected the lubricants consumption to be high in Italy and Singapore. Again this is partly true
since Singapore has the highest lubricants per capita value. Italy is positioned as 14th in the list
of highest lubricants consumers. The relationship between the lubricants consumption and the
use of scoot-mobiles does however not explain the high lubricants use per capita values of the
Scandinavian countries.
26
Summarized, no trends were discovered for either the lubricants or bitumen consumptions.
In appendix 16 the results for the NEURefinery and coke oven are shown. The United States has the
largest NEURefinery and coke oven with a fossil fuels consumption of 2353 PJ. Japan and Republic of
China follow with a fossil fuels consumption of respectively 535 PJ and 310 PJ.
In the last appendix the total non-energy use is stated (appendix 17). It can be directly seen that
the countries Saudi Arabia, India and the Netherlands have a higher actual non-energy use than
the value that they report in the international energy statistics. Korea, in contrast, has a lower
actual non-energy use. This comparison between the top-down and bottom-up approach is
mentioned in more detail in the next section.
3.3. Results for the comparison of the top-down and bottom-up approach In the comparison between the top-down and bottom-up approach non-energy use data as
calculated with the bottom-up approach is cross-checked with data as given in the international
energy balances (top-down). The comparison results in both relative and absolute deviations
between the top-down and the bottom-up approach. We have chosen to identify the hot-spots
with the relative deviations. Relative deviations tell us something about the country specific non-
energy use with respect to the country specific non-energy use stated in the energy statistics
Since we are interested in the way various countries report their non-energy use, i.e. apply either
a gross or a net definition, the relative deviations give are better to identify the hot-spots in this
research. The absolute deviations can be used in further research on for example the
greenhouse effect, since these absolute deviations can tell us something about the change in the
world’s total non-energy use when a country is reporting more or little non-energy use than the
non-energy use in the energy statistics.
3.3.1. Relative deviations between the top-down and the bottom-up approach In figure 5 the relative deviations between the non-energy use values stated in the international
energy statistics and the non-energy use values as calculated with the bottom-up approach are
shown. 51 countries are included in this figure. The low and the high boundary of the bottom-up
approach are also included for every country, this resulting in 51horizontal lines. The black dot in
this line represents the medium bottom-up approach and the two boundaries represent the low
(left boundary) and the high bottom-up approach (right boundary).
A relative deviation of 0% represents the non-energy use which is derived from the top-down
approach (IEA 2002). Furthermore, the x-axis has a minimum of -100%. When a country reaches
this minimum it can be stated that the country reports non-energy use, while the non-energy use,
calculated with the bottom-up approach, is 0.
27
The maximum of this axis goes across 100% since 100% means twice as much non-energy use
than reported in the international energy balances. 200% in turn means three times as much non-
energy use than reported.
The y-axis is chosen with respect to the descending amount of total non-energy use. Therefore
United Stated given the highest y-value and Finland the lowest.
The color of the error intervals tells us whether a specific country is in range with the non-energy
use derived from the top-down approach or not. In case the country is in range the error interval
is given a green color. In all other cases, either negatively or positively out of range, the error
interval are black. In turn it can be stated that 13 out of 51 countries (25.5%) are in range, 16 of
out 51 countries (31.4%) have a negative relative deviation and 22 out of 51 countries (43.1%)
have a positive relative deviation.
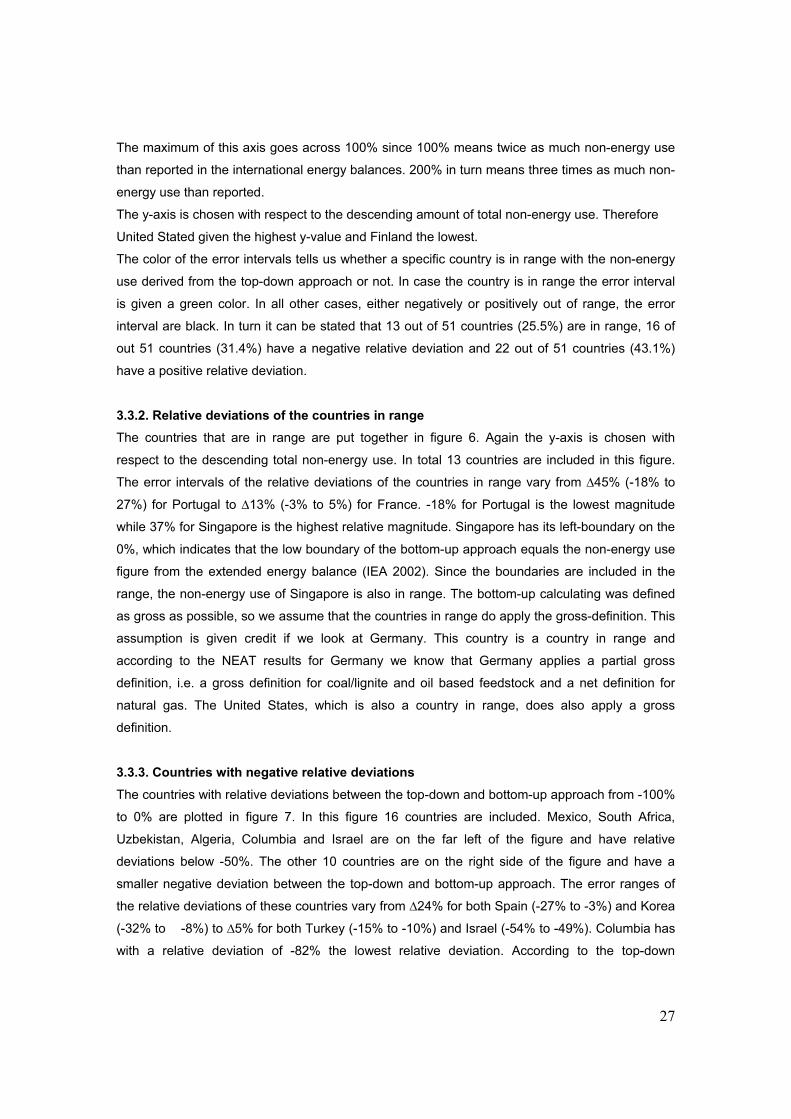
3.3.2. Relative deviations of the countries in range The countries that are in range are put together in figure 6. Again the y-axis is chosen with
respect to the descending total non-energy use. In total 13 countries are included in this figure.
The error intervals of the relative deviations of the countries in range vary from ∆45% (-18% to
27%) for Portugal to ∆13% (-3% to 5%) for France. -18% for Portugal is the lowest magnitude
while 37% for Singapore is the highest relative magnitude. Singapore has its left-boundary on the
0%, which indicates that the low boundary of the bottom-up approach equals the non-energy use
figure from the extended energy balance (IEA 2002). Since the boundaries are included in the
range, the non-energy use of Singapore is also in range. The bottom-up calculating was defined
as gross as possible, so we assume that the countries in range do apply the gross-definition. This
assumption is given credit if we look at Germany. This country is a country in range and
according to the NEAT results for Germany we know that Germany applies a partial gross
definition, i.e. a gross definition for coal/lignite and oil based feedstock and a net definition for
natural gas. The United States, which is also a country in range, does also apply a gross
definition.
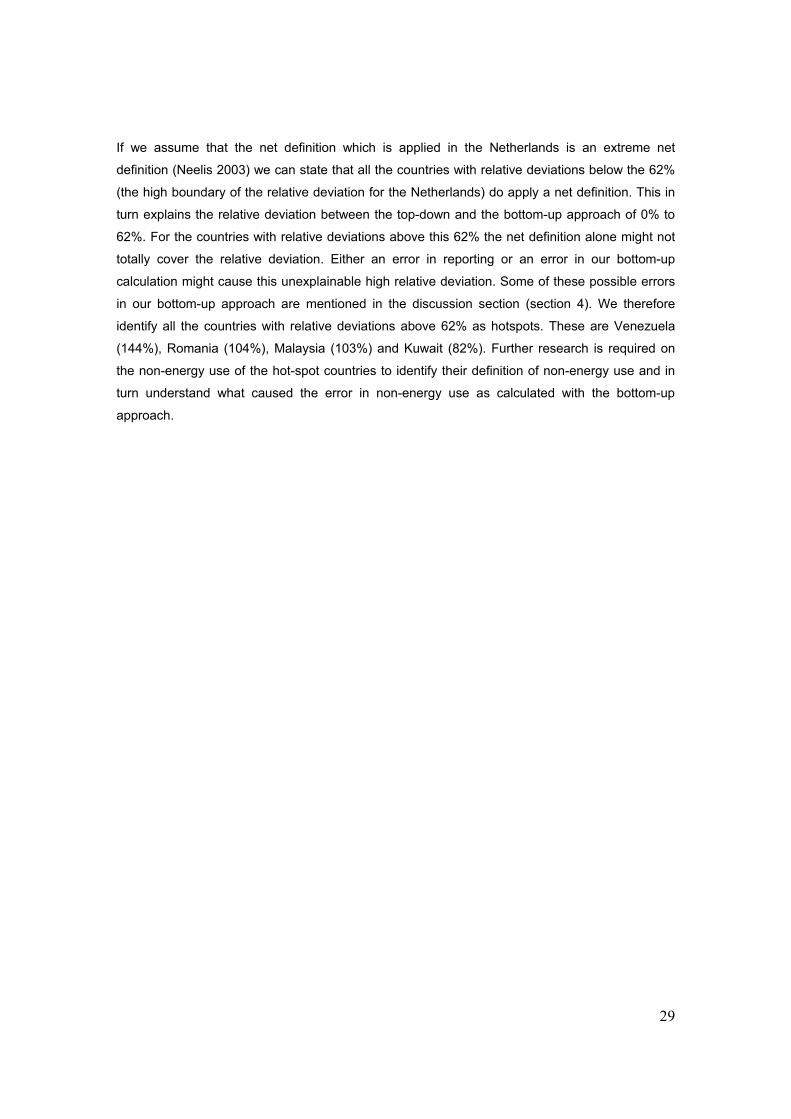
3.3.3. Countries with negative relative deviations The countries with relative deviations between the top-down and bottom-up approach from -100%
to 0% are plotted in figure 7. In this figure 16 countries are included. Mexico, South Africa,
Uzbekistan, Algeria, Columbia and Israel are on the far left of the figure and have relative
deviations below -50%. The other 10 countries are on the right side of the figure and have a
smaller negative deviation between the top-down and bottom-up approach. The error ranges of
the relative deviations of these countries vary from ∆24% for both Spain (-27% to -3%) and Korea
(-32% to -8%) to ∆5% for both Turkey (-15% to -10%) and Israel (-54% to -49%). Columbia has
with a relative deviation of -82% the lowest relative deviation. According to the top-down

28
approach Columbia reported a non-energy use of 76 PJ. With respect to the bottom-up approach
the actual non-energy use of Columbia is 19 PJ (14-22 PJ). These results can be in indication
that the non-energy use for Columbia is overestimated in the international energy statistics. It can
also be an indication that our bottom-up calculation is not reliable enough for Columbia. Looking
at the various non-energy use definitions applied internationally, it can be seen that when a gross
definition is applied the highest possible non-energy use for a country is obtained. Since the
bottom-up calculation is done as gross as possible i.e. results in the highest possible value for the
non-energy use, it shouldn’t be possible for a country to report even more non-energy use.
Therefore, not only Columbia should be identified as hotspot but actually all the countries that
have negative relative deviations. Since we used a simplified method to get to the actual non-
energy use, we assume that the negative relative deviations above -5% can be caused by this
calculation. We therefore do not identify the country Spain as a hotspot.
The possible shortcomings of this simplified bottom-up approach as well as some detailed
information about the countries Korea and South Africa to explain their negative deviation are
mentioned in the discussion section (section 4).
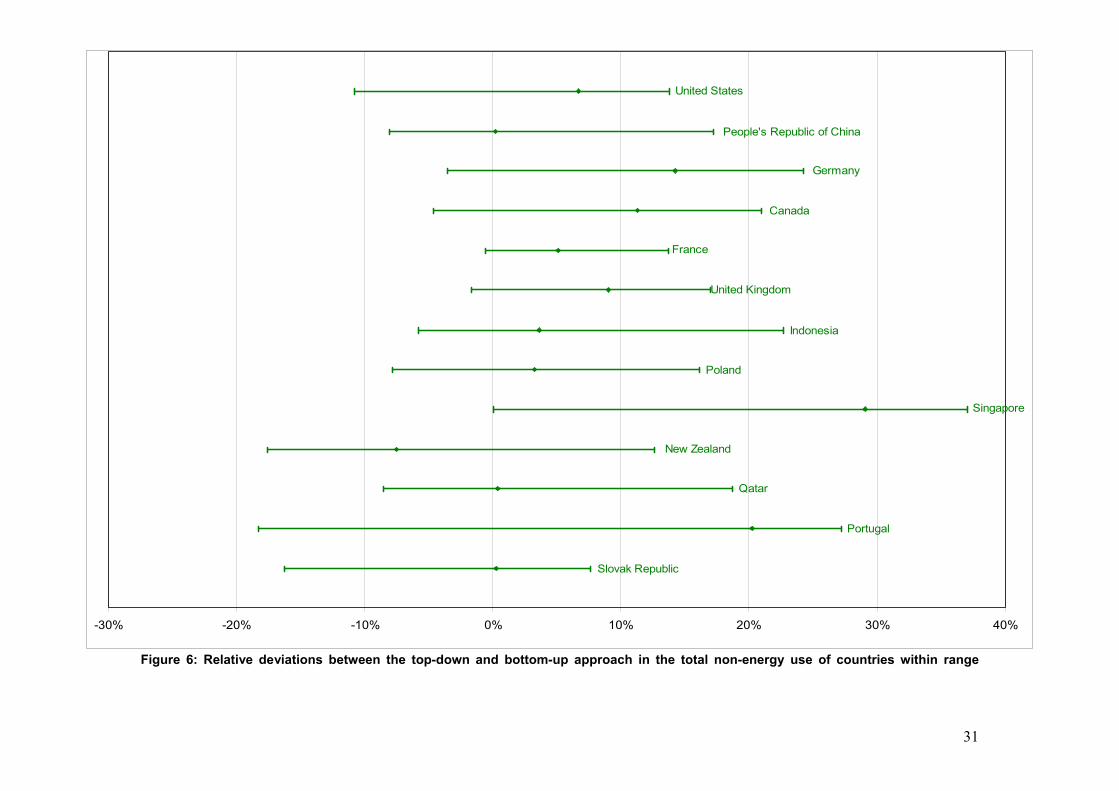
3.3.4. Countries with positive relative deviations The countries with relative deviations from 0% to 200% are plotted in figure 8. In this figure 22
countries are included. Venezuela, Malaysia, Romania and Kuwait are on the far right edge of the
figure and have relative deviations above 70%. The other 18 countries are on the left side and
more close to the top-down value.
The relative deviations of these countries differ from ∆57% for Trinidad and Tobago (32% to 89%)
to ∆11% for Finland (27% to 38%). Venezuela has with 144% the highest relative deviation.
According to the top-down approach Venezuela reported a non-energy use of 93 PJ. The bottom-
up approach shows an actual non-energy use of 206 (192-227 PJ). These results can be an
indication that Venezuela reports too little non-energy use. As for the large negative deviations it
can also indicate that our bottom-up calculation is not reliable enough. Also the Netherlands does
report less non-energy use than the non-energy use as stated in the energy statistics. 430 PJ of
non-energy use is reported in the international extended energy balances (IEA 2002). According
to the bottom-up approach the actual non-energy use for the Netherlands is 626 PJ (541-696 PJ).
Like was stated before, the definition of non-energy use is not harmonized internationally. A
various range of definitions for the non-energy use is used. From the NEAT results for the
Netherlands (Neelis et al. 2005) it is known that the Netherlands use a net definition. Since a net
definition results in less non-energy use than a gross definition, it could be an explanation for the
higher actual non-energy use of the Netherlands especially because in the bottom-up approach
non-energy use was defined as gross as possible.
29
If we assume that the net definition which is applied in the Netherlands is an extreme net
definition (Neelis 2003) we can state that all the countries with relative deviations below the 62%
(the high boundary of the relative deviation for the Netherlands) do apply a net definition. This in
turn explains the relative deviation between the top-down and the bottom-up approach of 0% to
62%. For the countries with relative deviations above this 62% the net definition alone might not
totally cover the relative deviation. Either an error in reporting or an error in our bottom-up
calculation might cause this unexplainable high relative deviation. Some of these possible errors
in our bottom-up approach are mentioned in the discussion section (section 4). We therefore
identify all the countries with relative deviations above 62% as hotspots. These are Venezuela
(144%), Romania (104%), Malaysia (103%) and Kuwait (82%). Further research is required on
the non-energy use of the hot-spot countries to identify their definition of non-energy use and in
turn understand what caused the error in non-energy use as calculated with the bottom-up
approach.

30
United StatesPeople's Republic of China
JapanKorea
GermanyRussia
CanadaFrance
IndiaBrazil
United KingdomNetherlands
Saudi ArabiaSpain
ItalyChinese Taipei
MexicoIndonesia
BelgiumSouthAfrica
Islamic Republic of IranArgentina
PolandAustralia
ThailandTurkey
SingaporeEgypt
Trinidad and TobagoLibya
PakistanNew Zealand
QatarPortugal
VenezuelaUzbekistan
BelarusMalaysia
NorwayRomaniaCzech Republic
AlgeriaColombia
IsraelSlovak Republic
HungaryAustria Sweden
BulgariaKuwait
Finland
-100% -50% 0% 50% 100% 150% 200%
Figure 5: Relative deviations between the top-down and the bottom-up approach in the total non-energy
31
United States
People's Republic of China
Germany
Canada
France
United Kingdom
Indonesia
Poland
Singapore
New Zealand
Qatar
Portugal
Slovak Republic
-30% -20% -10% 0% 10% 20% 30% 40%
Figure 6: Relative deviations between the top-down and bottom-up approach in the total non-energy use of countries within range

32
Japan
Korea
Brazil
Spain
Mexico
SouthAfrica
Argentina
Australia
Turkey
Libya
Pakistan
Uzbekistan
Belarus
Algeria
Colombia
Israel
-90% -80% -70% -60% -50% -40% -30% -20% -10% 0%
Figure 7: Relative deviations between the top-down and bottom-up approach in the total non-energy use of countries out of range, -100% to 0%
33
Russia
India
Netherlands
Saudi Arabia
Italy
Chinese Taipei
Belgium
Islamic Republic of Iran
Thailand
Egypt
Trinidad and Tobago
Venezuela
Malaysia
Norway
Romania
Hungary
Austria
Sweden
Bulgaria
Kuwait
Finland
Czech Republic
0% 20% 40% 60% 80% 100% 120% 140% 160%
Figure 8: Relative deviations between the top-down and bottom-up approach in the total non-energy use of countries out of range, 0% to 160%
34
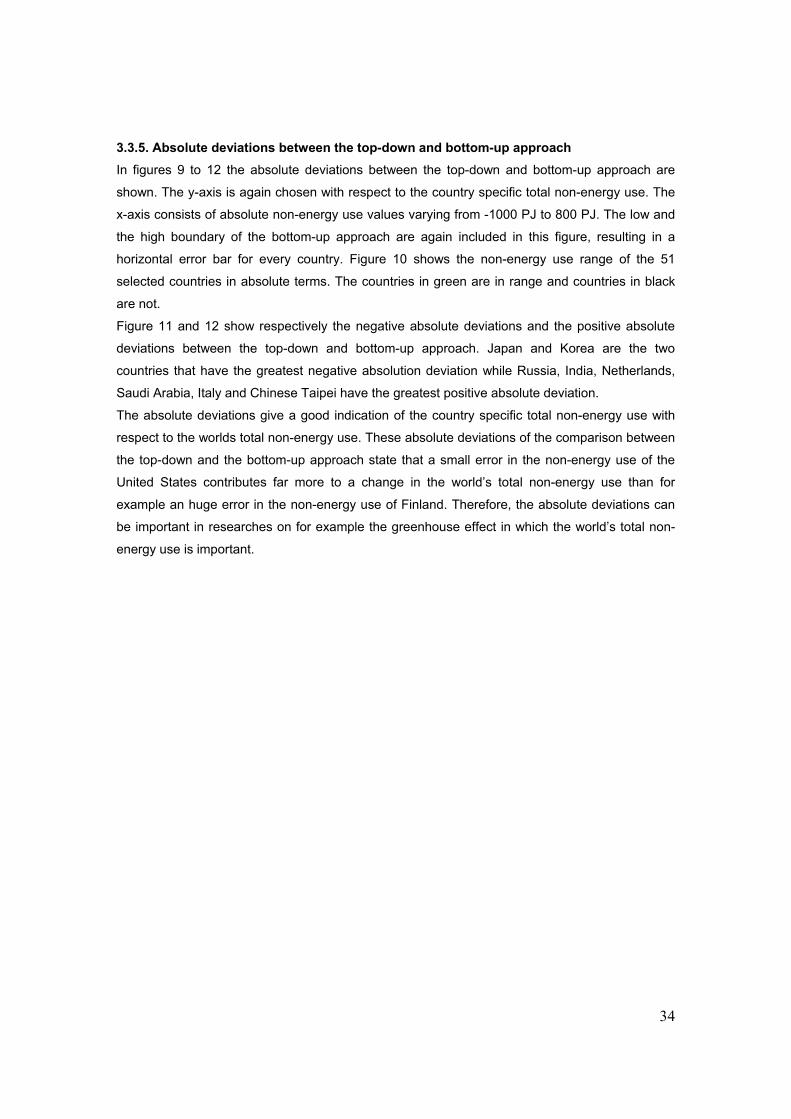
3.3.5. Absolute deviations between the top-down and bottom-up approach In figures 9 to 12 the absolute deviations between the top-down and bottom-up approach are
shown. The y-axis is again chosen with respect to the country specific total non-energy use. The
x-axis consists of absolute non-energy use values varying from -1000 PJ to 800 PJ. The low and
the high boundary of the bottom-up approach are again included in this figure, resulting in a
horizontal error bar for every country. Figure 10 shows the non-energy use range of the 51
selected countries in absolute terms. The countries in green are in range and countries in black
are not.
Figure 11 and 12 show respectively the negative absolute deviations and the positive absolute
deviations between the top-down and bottom-up approach. Japan and Korea are the two
countries that have the greatest negative absolution deviation while Russia, India, Netherlands,
Saudi Arabia, Italy and Chinese Taipei have the greatest positive absolute deviation.
The absolute deviations give a good indication of the country specific total non-energy use with
respect to the worlds total non-energy use. These absolute deviations of the comparison between
the top-down and the bottom-up approach state that a small error in the non-energy use of the
United States contributes far more to a change in the world’s total non-energy use than for
example an huge error in the non-energy use of Finland. Therefore, the absolute deviations can
be important in researches on for example the greenhouse effect in which the world’s total non-
energy use is important.

35
United StatesPeople's Republic of China
JapanKorea Germany
RussiaCanada
FranceIndia
BrazilUnited Kingdom
NetherlandsSaudi Arabia
SpainItaly
Chinese TaipeiMexico
Indonesiabelgium
South AfricaIslamic Republic of Iran
ArgentinaPoland
AustraliaThailand
TurkeySingaporeEgypt
Trinidad and TobagoLibya
PakistanNew ZealandQatarPortugal
VenezuelaUzbekistan
BelarusMalaysia
NorwayRomania
Czech RepublicAlgeria
ColumbiaIsrael
Slovak RepublicHungary
AustriaSwedenBulgariaKuwait
Finland
-1000 -800 -600 -400 -200 0 200 400 600 800 Figure 9: Absolute deviations in PJ between the top-down and bottom-up approach in the total non-energy use

36
United States
People's Republic of China
Germany
Canada
France
United Kingdom
Poland
Singapore
New Zealand
Qatar
Portugal
Slovak Republic
Indonesia
-1000 -800 -600 -400 -200 0 200 400 600 800Figure 10: Absolute deviations in PJ between the top-down and bottom-up approach in the total non-energy use of countries within range
37
Japan
Korea
Brazil
Spain
Mexico
South Africa
Argentina
Australia
Turkey
Libya
Pakistan
Uzbekistan
Belarus
Algeria
Columbia
Israel
-700 -600 -500 -400 -300 -200 -100 0Figure 11: Absolute deviations in PJ between the top-down and bottom-up approach in the total non-energy use of countries out of range, -700 to 0 PJ

38
Russia
India
Netherlands
Saudi Arabia
Italy
Chinese Taipei
belgium
Islamic Republic of Iran
Thailand
Egypt
Trinidad and Tobago
Venezuela
Malaysia
Norway
Romania
Hungary
Austria
Sweden
Bulgaria
Kuwait
Finland
Chech Republic
0 50 100 150 200 250 300 350 400 450Figure 12: Absolute deviations in PJ between the top-down and bottom-up approach in the total non-energy use of countries out of range, 0 to 450 PJ

39
Summarized, we have identified the possible hotspots with the relative deviations of the specific
countries (figures 5-8). The results which are obtained from the figures 5-8 are summarized in the
maps below (figure 13, 14 and 15). The green countries are those in range i.e. apply a possible
gross definition, the yellow countries are those that report too little non-energy use according to
the top-down data in the international energy balances i.e. use a possible net-definition and the
red countries are those that report too much non-energy use i.e. a possible error in the non-
energy use figures or an error in our bottom-up calculation.
Figure 13: Map of Europe with respect to the non-energy use deviation (Green countries are those in range, yellow countries are those that report too little non-energy use and red countries are those that report too much non-energy use)

40
Figure 14: Maps of America, Africa and Middle-East Europe with respect to the non-energy use deviation
Figure 15: Map of Asia and Oceania with respect to the non-energy use deviation
41
4. Discussion In this thesis a cross-check of the National estimates for non-energy use of fossil fuels in the
chemical/petrochemical sector was done. Top-down figures were derived from International
extended energy balances and the bottom-up figures were calculated by adding up the 7 most
important components of non-energy use (see Section 2.2) derived from both NEUfeedstock and
NEURefinery and coke oven.
In this section the possible errors due to assumptions done in both the top-down and the bottom-
up method are discussed followed by a discussion of the results of this thesis.
4.1. Discussion about the methodology of this thesis In this section the methodology of the top-down method is shortly discussed followed by a
discussion about the bottom-up calculation.
4.1.1. Discussion about the top-down methodology The top-down figures in this thesis were derived from the energy statistics. We did not do any
assumptions in the top-down approach. However, we chose to collect data for the year 2000.
Maybe another year, to collect data for, is more suitable for the comparison between the top-
down approach and the bottom-up calculation, since there was not always information available
for the year 2000 for the different parameters of the bottom-up calculation.
4.1.2. Discussion about the bottom-up methodology NEU Feedstock
From section 2.2 can be seen that the bottom-up calculation was composed 7 parameters which
were in turn split up in NEUFeedstock and NEURefinery and coke oven.
Specific feedstock use was derived from steam cracking figures, methanol capacity figures,
ammonia production figures and carbon black capacity figures. We have checked the ammonia
production figures with a more reliable but confidential source. Maybe both the ethylene and the
methanol figures should have been checked as well just to avoid any possible data uncertainties.
Next to this uncertainty, the year of the production and capacity figures might as well be a pitfall.
Methanol production figures are taken from Chemical week (2003) in which the capacity figures
were given for the year 2003. The carbon black capacity figures were even from the year 2005.
Since we investigate non-energy use for the year 2000 this might a pitfall. Capacity figures for
methanol could have changed during these 3 years.
Due to the data from beyond 2000 we might overestimate the country specific non-energy use.
Therefore, the methanol production, the carbon black production and even the ethylene
production (ethylene capacity figures for 2001) might be slightly overestimated.
42
Furthermore, we assumed that the capacity data for ethylene, methanol and carbon black
production equal the production figures (i.e. a load of 100% was assumed). Again, the country
specific non-energy use might be overestimated in this case, since it is not known if the load
factor of 100% is reliable.
We further assumed that the specific European yields and feedstock for both ethylene production,
ammonia production and methanol production also hold part for the rest of the world. A possible
extension of this research can be a more country specific approach and make sure the yields and
feedstock used to produce ethylene, ammonia or methanol are checked with reliable country
specific data. For example for Korea it is known that ammonia is not produced from natural gas
(like we assumed) but from naphtha. We therefore underestimate the total non-energy use of
Korea. The bottom-up calculation for the ammonia production is therefore not reliable enough for
Korea. This might be an explanation why the non-energy use value in the energy statistics is
lower than the non-energy use value which was calculated by the bottom-up approach for Korea.
For the steam cracking figures some major assumptions were done. We firstly assumed that the
ethylene production is representative to estimate total steam cracker input. This is not necessarily
the case because the ratio ethylene/propylene or ethylene/other products are not constant but
varies depending on market prices and steam cracker configurations.
We have for example not taken in account the propylene capacity figures and therefore we might
underestimate the steam cracking figures. Maybe these propylene figures should be included to
cover the actual steam cracker input more accurate and in turn come up with a more reliable
approach. A possible research extension of included chemicals in the steam cracking process
can be done to deal with this pitfall.
Next to these simplified steam cracking figures, it can be possible that also the feedstock use of a
country is too simple and not totally covered since we assumed that every country except the
United States and Canada use naphtha as feedstock for the ethylene production. This
assumption can cause the bottom-up calculation to be not reliable enough for some countries. A
more detailed approach for some countries could verify whether the assumed feedstock is used
or not and in turn know whether the bottom-up calculation is reliable enough for the various
countries.
NEU Refinery and coke oven
The NEURefinery and coke oven figures were derived from aromatics capacity figures as well as
electrodes, lubricants and bitumen consumption. The same possible research extensions also
hold part for the NEURefinery and coke oven figures. We can check the figures with more reliable sources
to avoid data uncertainties, be more country specific with respect to yields and feedstock use and
finally use data that is more close to the year 2000. The aromatics production for example is
derived from Gas & Oil Journal Special (1999) in which capacity data was available for the year

43
1999. Like was already mentioned before, the use of capacity data instead of production data
might slightly overestimate the actual non-energy use. However, the fact that those capacity
figures were from 1999 might underestimate the actual non-energy use.
To use production figures for the year 2000 instead of capacity figures for various years, the
bottom-up calculations can be done more correctly which will result in hopefully a more reliable
approach.
For the electrodes consumption we assumed that aluminium production figures were
representative to estimate the country specific electrodes consumption. Various other metals
should be included to cover this electrode consumption more preciously.
As can be seen from section 3.3 South Africa reports too much non-energy use with respect to
our bottom-up calculation. In South Africa, however, a lot of metals (other than alluminium) are
produced. All those metal production processes might require the use of electrodes. We therefore
might underestimate the actual non-energy use for South Africa. If all these other metals are
included in the electrodes consumption parameter we might come up with a more reliable actual
non-energy use for South Africa. Another problem is the coal based ethylene production is South
Africa. Since coal is not included in our bottom-up calculation, we might again underestimate the
total non-energy use of South Africa. If coal is included in the ethylene production parameter we
might obtain an even more reliable non-energy use.
For the lubricants and bitumen consumption there was not any independent information from the
energy statistics available to us. Therefore we derived the actual consumptions directly from the
energy balances, this resulting in a less independent bottom-up calculation. From the IEA we
know that the bitumen consumption figures are reliable and can therefore be used in our bottom-
up calculation. The lubricants consumption, however, is less reliable. Since a lot of chemicals are
combined under lubricants, a bottom-up calculation for the lubricants consumption requires a
detailed insight in the various chemicals. To improve the reliable of the bottom-up calculation
independent figures for the lubricants consumption should be included in this thesis.
The major bottleneck in this research was the dilemma between a simplified bottom-up
calculation to approach the actual non-energy use for various countries and the reliability of this
calculation. It was our purpose to keep the bottom-up approach as simple as possible but on the
other hand reliable enough to be able to use this simplified bottom-up calculation to save both
time and money.
As we have stated the research can be extended on various aspects but we have to make sure
the simplified approach remains simple. If we want to be more specific the NEAT model can be
used. Further research can be done to clarify whether this bottom-up approach is reliable enough.
44
4.2. Discussion about the results of this thesis The results of this research consist of both relative deviations and absolute deviations between
the top-down and bottom-up calculation (figures 5-12). As was stated in the results section, we
know that the Netherlands apply a net definition and that Germany as well as the United States
applies a gross definition.
The Netherlands apply an almost extreme net definition (Neelis 2003). From the results (section
3) we can derive that the Netherlands has relative deviation of 62% (high boundary of the bottom-
up calculation). Since we assumed an almost extreme net definition for the Netherlands, we can
state that all the country specific relative deviations below the 62% can be explained by an
applied net definition. The countries with a relative deviation between the top-down and bottom-
up approach above this 62% might also apply a net definition but it suggests that an error might
also be included. Further research is therefore required to identify the exact reason for the high
deviation. However, the Netherlands do not apply an extreme net definition but an almost
extreme net definition (i.e. a more gross definition than the extreme net definition), relative
deviations slightly above 62% can therefore also be explained by an applied net definition. This
can limit the number of hotspots on the far right edge of figure 5 (section 3.3).
For the gross definition it was assume that countries in range apply a gross definition since the
bottom-up calculation was done as gross as possible. Both Germany and the United States apply
a gross definition. The gross definition, which was used in our bottom-up calculation, is already
an extreme. More non-energy use reported in the energy statistics with respect to the bottom-up
calculation should therefore not be possible. The countries with relative deviations below 0%
might therefore be an indication that our bottom-up calculation is not reliable enough and that it
should be improved.
Since not much background information is known about the country specific definition use, it
cannot be checked (in this research) whether these conclusions are correct. We have to remain
cautious because possible errors might be included. The actual range can therefore be either
smaller or larger. The range can also be shifted to either a more negative or a more positive
relative deviation between the top-down and bottom-up approach. For example the possible
hotspot Venezuela has a low absolute deviation. A possible error due to an assumption in the
bottom-up approach can cause a large shift which results in a new actual non-energy use range.
This non-energy use range can have the same value as the top-down figure i.e. Venezuela is in
range. The other way around is also possible. For example Singapore has a low boundary that
equals the top-down value, i.e. the IEA value. A small error already can cause a shift to the high
boundary, this resulting in an out of range non-energy use.
45
4.3. Summary of discussion Summarized, the results are quite promising if we look at for example the Netherlands and
Germany. However, the simplified bottom-up calculation can be yet be improved (e.g. use
production data instead of capacity data, use data from the year 2000).
Also further research has to be done at the hotspot countries to check what causes the
unexplainable high positive and negative relative deviations between the energy statistics and out
bottom-up calculation. This can be helpful to improve the bottom-up calculation and make it more
reliable.
In the future we might come up with a harmonized definition, so that the country specific non-
energy use CO2 emissions can be more easily calculated and compared between different
countries.

46
5. Conclusions The actual goal of this study was to develop an independent and reliable bottom-up estimate for
non-energy use, independently from official energy statistics and to compare the total non-energy
use as calculated with this bottom-up approach with non-energy data given for both OECD and
non-OECD countries in the extended energy balances (Top down approach).
A simplified bottom-up approach is developed based on 6 different independent parameters, i.e.
ethylene production, ammonia production, methanol production, carbon black production,
aromatics production and electrode consumption. Nevertheless, the data we used for the
lubricants and bitumen consumption was not independent from the energy statistics. The
developed bottom-up approach is therefore not totally independent. Bitumen figures from the
energy statistics are fortunately reliable enough. The lubricants consumption however requires
more intensive research to come up with a good bottom-up estimate.
The reliability of the bottom-up approach is given credit when looking at the results from the
comparison for Germany, the Netherlands and the United States. We expected both Germany
and the United States to be in range since a gross definition was applied in the two countries.
Since the bottom-up calculating was done as gross as possible, we assume that the countries in
range apply a gross definition. The United States and Germany do apply a gross definition and
are in our results both countries in range. This good correspondence between the bottom-up
approach and the top-down data for Germany and the United States indicate that the chosen
bottom-up approach is reliable to estimate non-energy use. For the Netherlands we know that a
net definition is applied, i.e. too less non-energy use compared to the bottom-up approach is
reported, since the bottom-up calculation for the Netherlands was again done as gross as
possible. As can be seen from Figure 5, the Netherlands does indeed report too little non-energy
use. This is also an indication that are bottom-up calculation is reliable enough.
Furthermore, the countries with negative deviations are also an indication for the reliability of the
bottom-up approach. Since it should not be possible that countries report more non-energy use
than was calculated, these countries indicate the bottom-up approach might be not exact enough.
16 out of the 51 countries (30%) have negative deviations. Another 4 countries have relative
deviations larger than 62%. Since this cannot be explained with an extreme net definition, again
an error is probably included. Also this is an indication that the reliability of our bottom-up
calculation is for some countries not good enough. Based on these findings it can be stated that
the bottom-up approach can still be improved upon some points, for example the electrodes
consumptions and the steam cracking process.
Summarized, we partly succeeded in developing a bottom-up approach that is totally independent
from the energy statistics. The bottom-up approach was reliable enough for the majority of
countries but can still be improved upon some methodology aspects.

47
6. Reference list
Chang, T. Oil & Gas Journal Special, Dec. 20, 1999. Worldwide refinery capacity creeps upward,
most growth in Asia-Pacific. Table, Worldwide Refineries-Capacities as of January 1, 2000
Chemical week, February 23/March 2, 2005. Product focus: Carbon Black.
Chemical week, June 11, 2003. Product focus: Methanol.
Hooijdonk G., Neelis M.L., Patel M., 2004. Defining the energy use and the CO2-emissions of the
steam cracking process.
IEA – International Energy Agency, 2000: International Energy Balances (extended balances).
Accessed with Beyond 20/20.
IEA – International Energy Agency, 2005: Homepage: About the IEA. Source:
http://www.iea.org/Textbase/about/index.htm. Date: 14 May 2005
IEA - International Energy Agency, 2005: Homepage: Energy Statistics Division. Source:
http://www.iea.org/Textbase/about/esd.htm. Date: 14 May 2005
IPCC/IEA/OECD/UNEP, 1997. Greenhouse Gas Inventory Reporting Instruction, Revised 1996
IPCC Guidelines for National Greenhouse Gas Inventories.
IPCC/IPTS, 2003. Reference Document on the Best Available Techniques in the Large Volume
Organic Industry.
Neelis M.L., Patel M., Gielen D.J., Blok K., 2005. Modeling CO2-emissions from non-energy use
with the Non-energy use Emission Accounting Tables (NEAT model).
Neelis M.L., Patel M., de Feber M., April 2003. Improvement of CO2 emission estimates from the
non-energy use of fossil fuels in the Netherlands
Oil & Gas Journal, week of Apr. 23, 2001. Ethylene Report.

48
Patel M., Neelis M.L., Gielen D.J., Olivier J., Simmons T., Theunis J., 2003. Carbon dioxide
emissions from non-energy use of fossil fuels: Summary of key issues and conclusions from the
country analyses.
Patel M. Statistical definitions of non-energy use.
Proceedings of the first NEU-CO2 Workshop Paris, 23-24 September 1999.
Source: http://www.chem.uu.nl/nws/nenergy/ Date : 21-06-2005
Ramirez-Ramirez, A. Personal communication, 2005. University of Utrecht.
Date: 1st of April 2005
United Nations, Statistics Division, 2000. Industrial Commodity Production Statistics Dataset,
1950-2000.
U.S. Geological Survey Minerals Yearbook, 2001. Table 12, Ammonia: world production, by
country.
Worrell, 1994. Potentials for Improved use of Industrial Energy and Materials. PhD 1994.
University of Utrecht

49
Appendices
Appendix 1: List of countries/regions with descending non-energy use 50 Appendix 2: 51 countries with the highest non-energy use selected with
the top-down approach 58
Appendix 3: Interpretation of the top-down results obtained from the online worksheets (http://www.chem.uu.nl/nws/www/nenergy) 59
Appendix 8a/b/c: Countries specific feedstock consumption of the 51 selected
countries for ethylene production (low/medium/high) 60
Appendix 9a/b/c: Countries specific feedstock consumption of the 51 selected countries for ammonia production (low/medium/high) 66
Appendix 10a/b/c: Countries specific feedstock consumption of the 51 selected
countries for methanol production (low/medium/high) 69
Appendix 11a/b/c: Countries specific feedstock consumption of the 51 selected countries for carbon black production (low) 72
Appendix 12a/b/c: Countries specific NEUfeedstock of the 51 selected countries
(low/medium/high) 75 Appendix 13a/b/c: Countries specific fossil fuel consumption of the 51 selected
countries for Aromatics production (low/medium/high) 81 Appendix 14a/b/c: Countries specific fossil fuel consumption with respect to
the electrode consumption of the 51 selected countries (low/medium/high) 84
Appendix 15: Countries specific lubricants and bitumen consumption of the 87
51 selected countries Appendix 16a/b/c: Countries specific NEURefinery and coke oven the 51 selected
countries (low/medium/high) 88 Appendix 17: Countries specific NEUTotal(medium) the 51 selected countries 94

50
Appendix 1: List of countries/regions with descending non-energy use with country specific NEUfeedstock, NEUInd/Transformation/Energy, NEUTransport, NEUOther Sectors, NEURefinery and coke oven and population data included
Countries Population Totals (ktoe)
Estimates in 2000 NEU(Total) NEU(Feedstock) NEU(Refinery-Coke oven)
United States 275 265 121716 65510 56207 People's Republic of China 1 268 853 (IDB) 51286 29630 21655 Japan 126 843 43569 33812 9757 Korea 47 008 27442 25212 2230 Germany 82 183 25266 20102 5163 Russia ¨145 559 24027 15870 8157 Canada 30 689 19573 13314 6259 France 58 893 16273 11576 4697 India 1 014 825 14714 9665 5049 Brazil 167 724 14304 9827 4477 United Kingdom 59 756 11272 7395 3878 Netherlands 15 908 10259 7311 2949 Saudi Arabia 20 847 9942 8881 1061 Spain 39 927 9528 5517 4011 Italy 57 762 7762 4292 3470 Chinese Taipei 22 151 (IDB) 6781 4691 2090 Mexico 100 249 6775 5288 1487 Indonesia 224 138 (IDB) 6509 5786 723 Belgium 10 251 5983 4524 1458 South Africa 43 686 5585 5051 534 Islamic Republic of Iran 63 664 4442 2112 2330 Argentina 37 032 4354 3276 1078 Poland 38 646 4347 2697 1650 Australia 19 157 4297 1122 3175 Thailand 61 770 3926 2960 967 Turkey 67 469 3581 1475 2106 Singapore 4 037 (IDB) 3489 2953 536 Egypt 63 976 3279 1775 1504 Trinidad and Tobago 1 290 3144 3134 10 Libya 5 115 (IDB) 2986 2770 216 Pakistan 137 510 2844 2465 379 New Zealand 3 831 2417 2119 298 Qatar 744 483 (IDB) 2382 2382 0 Portugal 10 008 2349 1686 663 Venezuela 24 170 2224 0 2224 Uzbekistan 24 650 2219 1556 662 Belarus 10 002 2169 1788 380 Malaysia 23 266 2097 1475 622 Norway 4 491 2080 1312 769 Romania 22 435 2056 1280 776 Czech Republic 10 273 2031 900 1132 Algeria 30 386 1881 1540 341

51
Appendix 1-continued (1) Countries
NEU(Ind/Trans/Energy) NEU(Transport) NEU(Other Sectors)
United States 51586 4620 0 People's Republic of China 21655 0 0 Japan 8832 314 611 Korea 1777 453 0 Germany 4777 372 14 Russia 7412 0 745 Canada 4671 193 1395 France 4253 377 67 India 5049 0 0 Brazil 4477 0 0 United Kingdom 3493 293 92 Netherlands 2760 72 117 Saudi Arabia 1061 0 0 Spain 3689 303 19 Italy 2826 453 191 Chinese Taipei 2090 0 0 Mexico 1487 0 0 Indonesia 723 0 0 Belgium 1407 37 13 South Africa 534 0 0 Islamic Republic of Iran 2330 0 0 Argentina 1078 0 0 Poland 1262 255 132 Australia 3175 0 0 Thailand 967 0 0 Turkey 1841 265 0 Singapore 536 0 0 Egypt 1504 0 0 Trinidad and Tobago 10 0 0 Libya 216 0 0 Pakistan 379 0 0 New Zealand 298 0 0 Qatar 0 0 0 Portugal 512 60 92 Venezuela 2224 0 0 Uzbekistan 534 0 129 Belarus 379 0 1 Malaysia 622 0 0 Norway 769 0 0 Romania 672 77 27 Czech Republic 941 191 0 Algeria 341 0 0

52
Appendix 1-continued (2)
Countries Population Totals (ktoe)
Estimates in 2000 NEU(Total) NEU(Feedstock) NEU(Refinery-Coke oven)
Colombia 42 321 1808 0 1808 Israel 6 289 1673 1040 633 Slovak Republic 5 400 1610 807 803 Hungary 10 024 1599 1091 508 Austria 8 109 1547 248 1299 Sweden 8 872 1471 639 832 Bulgaria 8 170 1254 1097 157 Kuwait 2 190 1134 0 1134 Finland 5 176 1013 444 569 Ukraine 49 711 855 0 855 Iraq 23 577 800 0 800 Azerbaijan 8 049 756 504 252 Greece 10 008 728 172 557 Lithuania 3 500 687 550 137 Croatia 4 381 680 535 145 Switzerland 7 184 568 136 432 Ireland 3 787 565 383 182 Bangladesh 130 407 (IDB) 531 0 531 Syria 16 320 502 130 372 Nigeria 115 224 416 0 416 Philippines 76 348 378 0 378 Denmark 5 319 285 0 285 Morocco 28 705 260 54 206 Slovenia 1 990 253 134 119 Ecuador 12 299 228 0 228 Kazakhstan 14 896 221 0 221 Estonia 1 369 218 142 77 Federal Rep. of Yugoslavia … 214 0 214 Tunisia 9 564 186 0 186 Hong Kong, China 6 665 148 0 148 Cuba 11 199 147 0 147 Sudan 31 081 141 28 113 Jordan ·5 039 132 0 132 Iceland 281 123 0 123 Peru 25 662 122 0 122 Myanmar ... 93 83 11 Togo 5 033 (IDB) 92 0 92 Lebanon 3 578 (IDB) 90 0 90 Cyprus 782 86 0 86 Latvia 2 373 74 0 74 Netherlands Antilles 210 134 (IDB) 70 0 70 Sri Lanka 19 359 67 0 67 Uruguay 3 337 67 0 67 Costa Rica 3 925 61 1 60 Ghana 18 412 60 0 60

53
Appendix 1-continued (3)
Countries
NEU(Ind/Trans/Energy) NEU(Transport) NEU(Other Sectors)
Colombia 1808 0 0 Israel 633 0 0 Slovak Republic 803 0 0 Hungary 508 0 0 Austria 1196 104 0 Sweden 661 171 0 Bulgaria 157 0 0 Kuwait 1134 0 0 Finland 569 0 0 Ukraine 855 0 0 Iraq 800 0 0 Azerbaijan 252 0 0 Greece 513 41 2 Lithuania 116 21 0 Croatia 121 22 2 Switzerland 395 37 0 Ireland 152 29 2 Bangladesh 531 0 0 Syria 372 0 0 Nigeria 416 0 0 Philippines 378 0 0 Denmark 250 32 4 Morocco 206 0 0 Slovenia 119 0 0 Ecuador 228 0 0 Kazakhstan 221 0 0 Estonia 72 3 2 Federal Republic of Yugoslavia 214 0 0 Tunisia 186 0 0 Hong Kong, China 148 0 0 Cuba 141 6 0 Sudan 113 0 0 Jordan 132 0 0 Iceland 117 0 7 Peru 122 0 0 Myanmar 11 0 0 Togo 92 0 0 Lebanon 90 0 0 Cyprus 82 5 0 Latvia 53 21 0 Netherlands Antilles 70 0 0 Sri Lanka 67 0 0 Uruguay 67 0 0 Costa Rica 60 0 0 Ghana 60 0 0

54
Appendix 1-continued (4)
Countries Population Totals (ktoe)
Estimates in 2000 NEU(Total) NEU(Feedstock) NEU(Refinery- Coke oven)
Yemen 18 261 60 0 60 Albania 3 474 (IDB) 59 0 59 Gabon 1 206 56 11 45 Kenya 29 986 (IDB) 54 0 54 Angola 10 132 (IDB) 53 0 53 Demo. Republic of Congo … 46 0 46 Oman 2 401 39 0 39 United Arab Emirates 2 369 (IDB) 37 0 37 Ethiopia 63 495 36 0 36 For. Republic of Macedonia 2 024 36 0 36 Armenia 3 803 35 0 35 Cote d'Ivoire 16 398 35 0 35 Panama 2 856 35 0 35 Jamaica 2 605 33 0 33 Zambia 10 723 31 0 31 Cameroon 14 792 (IDB) 30 0 30 Nicaragua 4 957 28 0 28 Georgia 5 023 27 0 27 El Salvador 6 276 25 0 25 Guatemala 11 385 25 0 25 Zimbabwe 12 186 (IDB) 24 0 24 Brunei 325 23 6 16 Senegal 9 524 19 0 19 Gibraltar 27 18 0 18 United Republic of Tanzania 33 065 (IDB) 17 0 17 Luxembourg 436 16 0 16 Congo ... 14 0 14 Bolivia 8 329 13 0 13 Bahrain 638 12 0 12 Haiti 7 959 12 0 12 Nepal 22 904 12 0 12 Mozambique 17 691 8 0 8 Kyrgyzstan 4 895 7 0 7 Republic of Moldova 4 431 (IDB) 7 0 7 Paraguay 5 586 (IDB) 7 0 7 Namibia 1 817 6 0 6 Eritrea 4 243 (IDB) 5 0 5 Tajikistan 6 170 1 0 1 Benin 6 169 0 0 0 Bosnia and Herzegovina 3 836 (IDB) 0 0 0 Chile 15 211 0 0 0 Dominican Republic 8 396 0 0 0 Honduras 6 201 (IDB) 0 0 0 Korea, DPR 47 008 0 0 0 Malta ·391 0 0 0
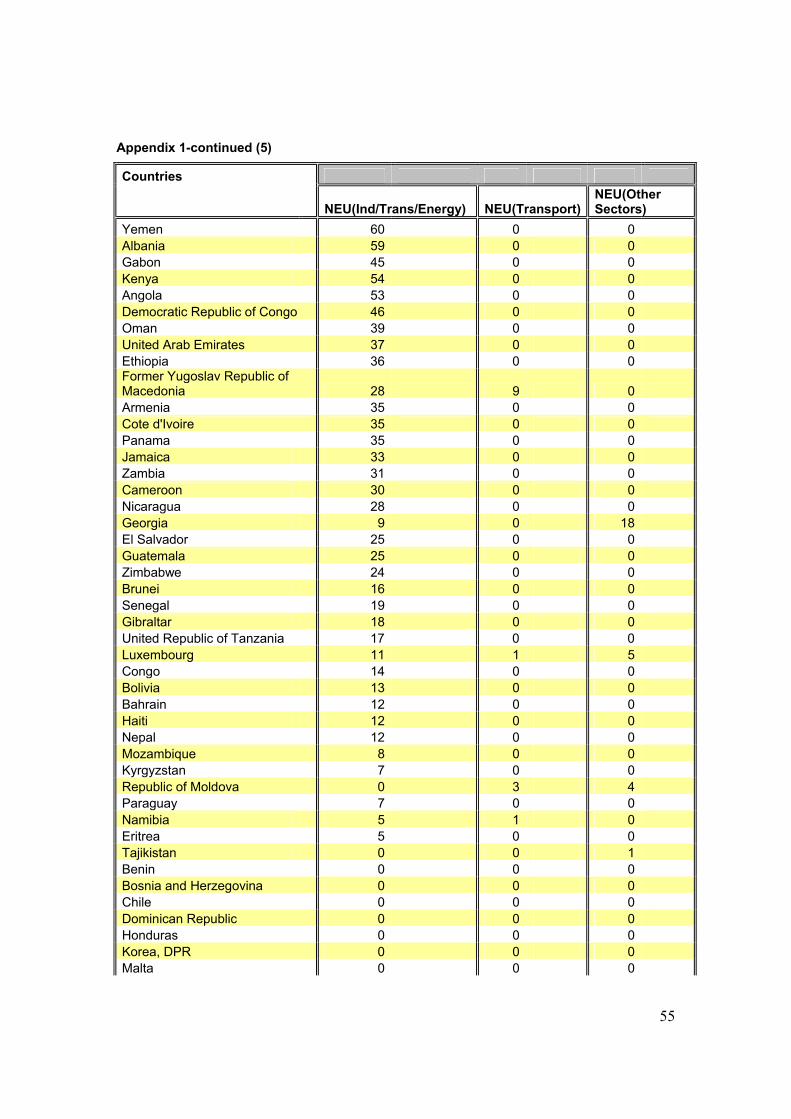
55
Appendix 1-continued (5)
Countries
NEU(Ind/Trans/Energy) NEU(Transport) NEU(Other Sectors)
Yemen 60 0 0 Albania 59 0 0 Gabon 45 0 0 Kenya 54 0 0 Angola 53 0 0 Democratic Republic of Congo 46 0 0 Oman 39 0 0 United Arab Emirates 37 0 0 Ethiopia 36 0 0 Former Yugoslav Republic of Macedonia 28 9 0 Armenia 35 0 0 Cote d'Ivoire 35 0 0 Panama 35 0 0 Jamaica 33 0 0 Zambia 31 0 0 Cameroon 30 0 0 Nicaragua 28 0 0 Georgia 9 0 18 El Salvador 25 0 0 Guatemala 25 0 0 Zimbabwe 24 0 0 Brunei 16 0 0 Senegal 19 0 0 Gibraltar 18 0 0 United Republic of Tanzania 17 0 0 Luxembourg 11 1 5 Congo 14 0 0 Bolivia 13 0 0 Bahrain 12 0 0 Haiti 12 0 0 Nepal 12 0 0 Mozambique 8 0 0 Kyrgyzstan 7 0 0 Republic of Moldova 0 3 4 Paraguay 7 0 0 Namibia 5 1 0 Eritrea 5 0 0 Tajikistan 0 0 1 Benin 0 0 0 Bosnia and Herzegovina 0 0 0 Chile 0 0 0 Dominican Republic 0 0 0 Honduras 0 0 0 Korea, DPR 0 0 0 Malta 0 0 0

56
Appendix 1-continued (6)
Countries Population Totals (ktoe)
Estimates in 2000 NEU(Total) NEU(Feedstock) NEU(Refinery-Coke oven)
Turkmenistan 4 518 (IDB) 0 0 0 Vietnam 77 686 0 0 0 Regions Population Totals (ktoe) Estimates in 2000 Non-Energy-Use Feedstock NEU Total World 528570 344270 184300 OECD Total 336047 219081 116966 Total OECD 336047 219081 116966 IEA 323192 210289 112903 Non-OECD Total 192523 125189 67334 OECD N. America 148064 84111 63953 OECD Europe 110258 72704 37553 European Union 94318 64288 30031 OECD Pacific 77725 62265 15460 China 51434 29630 21803 Asia Excluding China 41489 30083 11407 Former USSR 31302 20410 10892 Former USSR 31302 20410 10892 Latin America 26747 16241 10507 Middle East 21244 14544 6700 Africa 15650 11235 4414 Non-OECD Europe 4657 3046 1611 Former Yugoslavia … 1184 669 515 Other Africa 328 6 323 Other Latin America 42 2 39 Other Asia 26 0 26

57
Appendix 1-continued (7)
Countries
NEU(Ind/Trans/Energy) NEU(Transport) NEU(Other Sectors)
Turkmenistan 0 0 0 Vietnam 0 0 0 Regions
NEU Ind/Trans/Energy NEU in Transport NEU in Other Sectors
World 171767 8842 3691 OECD Total 105528 8675 2763 Total OECD 105528 8675 2763 IEA 101860 8419 2624 Non-OECD Total 66239 167 928 OECD N. America 57744 4813 1395 OECD Europe 33701 3094 758 European Union 27067 2345 619 OECD Pacific 14082 767 611 China 21803 0 0 Asia Excluding China 11407 0 0 Former USSR 9944 48 899 Former USSR 9944 48 899 Latin America 10501 6 0 Middle East 6700 0 0 Africa 4413 1 0 Non-OECD Europe 1470 112 29 Former Yugoslavia 482 31 2 Other Africa 323 0 0 Other Latin America 39 0 0 Other Asia 26 0 0
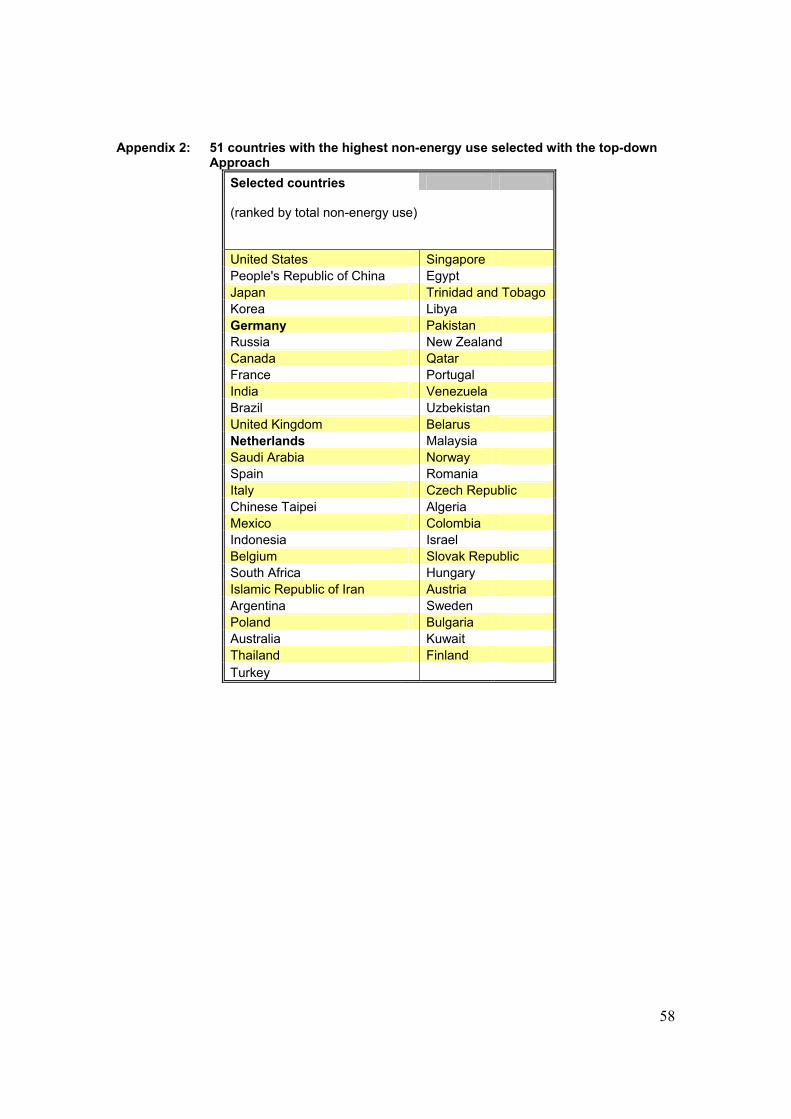
58
Appendix 2: 51 countries with the highest non-energy use selected with the top-down Approach
Selected countries (ranked by total non-energy use) United States Singapore People's Republic of China Egypt Japan Trinidad and Tobago Korea Libya Germany Pakistan Russia New Zealand Canada Qatar France Portugal India Venezuela Brazil Uzbekistan United Kingdom Belarus Netherlands Malaysia Saudi Arabia Norway Spain Romania Italy Czech Republic Chinese Taipei Algeria Mexico Colombia Indonesia Israel Belgium Slovak Republic South Africa Hungary Islamic Republic of Iran Austria Argentina Sweden Poland Bulgaria Australia Kuwait Thailand Finland Turkey
59
Appendix 3: Interpretation of the top-down results obtained from the online worksheets (http://www.chem.uu.nl/nws/www/nenergy)
In the first 4 worksheets the 4 different sectors discussed. Then 2 worksheets about the
NEURefinery and coke oven and NEUTotal are mentioned. In worksheet 1 NEUFeedstock of 160 countries is
shown. The countries are separated in OECD and non-OECD countries and are stored
alphabetically. Also some regions (e.g. OECD Total, IEA and World) are included. The various
fossil fuels and feedstocks are arranged according to the extended energy balances. The two
most relevant feedstocks, with respect to the total non-energy use, are natural gas and naphtha.
There are two total NEUFeedstock columns present in worksheet 1. The first column i.e. column C
contains the total NEUFeedstock derived from the international extended energy balances. The
second column i.e. column D is a summation of the various specific feedstock consumptions. This
value is often a bit higher due to the presence of summation columns e.g. Lignite/Brown Coal/ Sub-Bituminous Coal and Hard Coal, this resulting in double counting of some feedstocks.
Coking Coal for example is summarized under Hard Coal. This double counting can be seen
when looking at the NEUFeedstock value for the world, 14414 PJ. The summation of the specific
feedstock consumptions however shows a value of 14875 PJ.
In worksheet 2 the NEUInd-Transformation-Energy is shown. The same layout is used for all the 6
worksheets. Bitumen consumption and other petroleum products are two most relevant fossil
fuels/feedstocks. The total NEUInd-Transformation-Energy for the world is 7191 PJ.
In worksheet 3 the NEUTransport is shown. In this sector only the use of lubricants contributes to the
total fossil fuel consumption in NEUTransport. The total lubricants consumption is this sector and
thus the value for NEUTransport in the world is 370 PJ.
The last worksheet about the 4 different sectors is the NEUOther Sectors. Bitumen consumption as
well as other petroleum products the most relevant fossil fuels/feedstocks with respect to the total
non-energy use. The total NEUOther Sectors for the world is 155 PJ.
It can be seen from the worksheets 1-4 that the sectors NEUFeedstock and NEUInd-Transformation-Energy
contribute the most to the total non-energy use. NEUInd-Transformation-Energy, NEUTransport and NEUOther
Sectors are add up to get NEURefinery and coke oven. The result can be seen in worksheet 5. The world’s
total NEURefinery and coke oven is 7716 PJ.
Finally, in the worksheet 6 the country specific values for NEUTotal are stated. The total non-
energy use for the world is 22796 PJ. Since this value is derived from the total as summation of
the various feedstocks and fossil fuels, the real total non-energy use might be a bit lower.

60
Appendix 8a: Countries specific feedstock consumption of the 51 selected countries for ethylene production (low)
Countries Total (PJ) (ranked by total non-energy use) (∑feedstocks) Ethane
Liquefied Petroleum Gases (LPG)
Gas/Diesel Oil Naphtha
United States 2161 645 592 139 785People's Republic of China 557 0 0 0 557Japan 874 0 30 0 844Korea 639 0 0 0 639Germany 672 4 41 92 535Russia 428 0 8 3 417Canada 359 251 40 15 53France 426 0 4 37 385India 272 31 17 0 223Brazil 292 61 13 0 218United Kingdom 308 15 0 0 293Netherlands 397 0 16 0 380Saudi Arabia 455 220 40 0 295Spain 172 0 0 0 172Italy 280 5 2 51 223Chinese Taipei 308 0 0 0 308Mexico 82 82 0 0 0Indonesia 72 0 0 0 72Belgium 248 0 10 0 239South Africa 27 25 2 0 0Islamic Republic of Iran 84 5 1 0 79Argentina 48 41 4 0 4Poland 51 0 0 0 51Australia 42 24 0 17 0Thailand 155 19 8 0 129Turkey 52 0 0 0 52Singapore 131 0 1 0 130Egypt 39 0 0 0 39Trinidad and Tobago 0 0 0 0 0Libya 46 0 0 0 46Pakistan 0 0 0 0 0New Zealand 0 0 0 0 0Qatar 31 31 0 0 0Portugal 43 0 0 0 43Venezuela 42 25 17 0 0Uzbekistan 0 0 0 0 0Belarus 17 0 0 0 17Malaysia 96 23 0 0 73Norway 40 8 32 0 0Romania 92 2 7 0 83Czech Republic 58 0 0 12 46Algeria 17 0 0 0 17Colombia 7 5 2 0 0Israel 23 1 2 0 20

61
Appendix 8a-continued (1)
Countries Total (PJ) (ranked by total non-energy use) (∑feedstocks) Ethane
Liquefied Petroleum Gases (LPG)
Gas/Diesel Oil Naphtha
Slovak Republic 26 0 3 0 23Hungary 47 1 1 9 35Austria 39 3 8 0 28Sweden 58 14 12 0 32Bulgaria 52 0 0 0 52Kuwait 47 47 0 0 0Finland 38 0 0 0 38

62
Appendix 8b: Countries specific feedstock consumption of the 51 selected countries for ethylene production (medium)
Countries Total (PJ) (ranked by total non-energy use) (∑feedstocks) Ethane
Liquefied Petroleum Gases (LPG)
Gas/Diesel Oil Naphtha
United States 2210 650 600 144 818People's Republic of China 581 0 0 0 581Japan 895 0 30 0 880Korea 667 0 0 0 666Germany 699 4 41 96 558Russia 446 0 8 3 435Canada 364 253 40 16 55France 392 0 4 38 402India 280 31 18 0 233Brazil 302 61 13 0 228United Kingdom 298 15 0 0 306Netherlands 413 0 16 0 397Saudi Arabia 466 222 40 0 204Spain 180 0 0 0 180Italy 292 5 2 53 232Chinese Taipei 321 0 0 0 321Mexico 82 82 0 0 0Indonesia 75 0 0 0 75Belgium 258 0 10 0 249South Africa 27 25 2 0 0Islamic Republic of Iran 66 5 1 0 82Argentina 47 41 4 0 4Poland 54 0 0 0 54Australia 42 24 0 18 0Thailand 150 19 8 0 134Turkey 54 0 0 0 54Singapore 137 0 1 0 136Egypt 41 0 0 0 41Trinidad and Tobago 0 0 0 0 0Libya 48 0 0 0 48Pakistan 0 0 0 0 0New Zealand 0 0 0 0 0Qatar 31 31 0 0 0Portugal 45 0 0 0 45Venezuela 43 25 18 0 0Uzbekistan 0 0 0 0 0Belarus 18 0 0 0 18Malaysia 100 24 0 0 76Norway 40 8 32 0 0Romania 90 2 7 0 87Czech Republic 45 0 0 12 48Algeria 6 0 0 0 18Colombia 7 5 2 0 0Israel 24 1 2 0 21
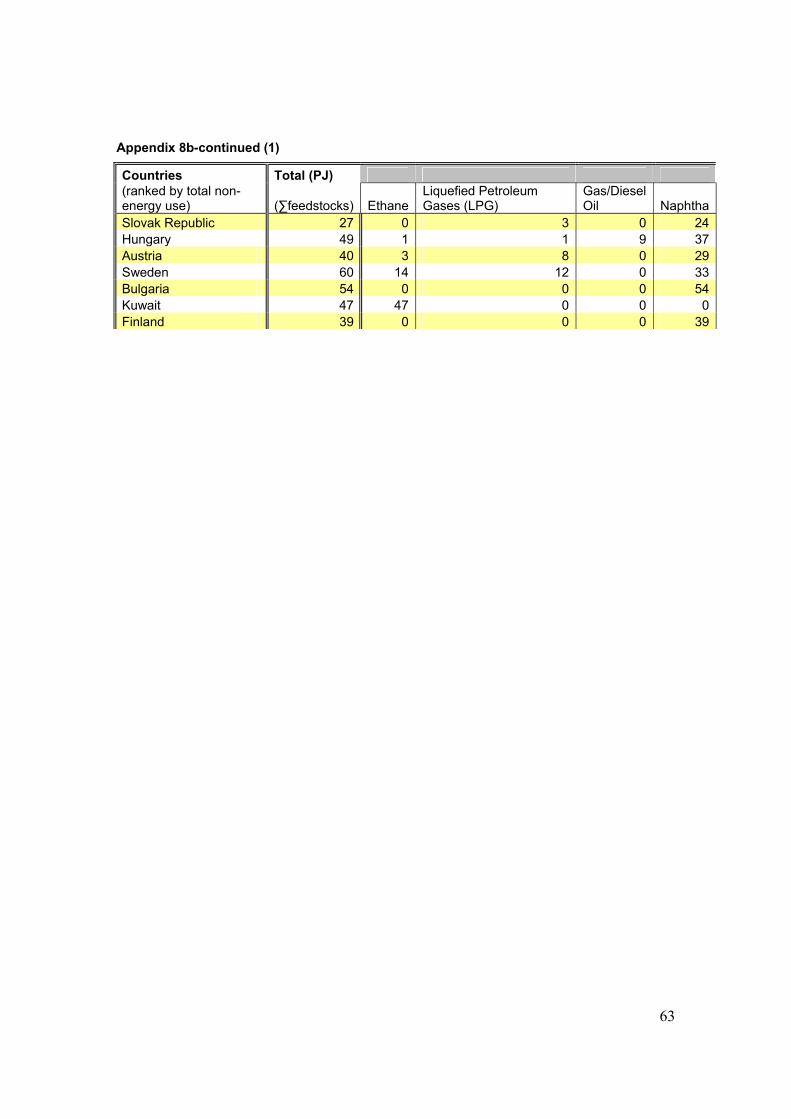
63
Appendix 8b-continued (1)
Countries Total (PJ) (ranked by total non-energy use) (∑feedstocks) Ethane
Liquefied Petroleum Gases (LPG)
Gas/Diesel Oil Naphtha
Slovak Republic 27 0 3 0 24Hungary 49 1 1 9 37Austria 40 3 8 0 29Sweden 60 14 12 0 33Bulgaria 54 0 0 0 54Kuwait 47 47 0 0 0Finland 39 0 0 0 39

64
Appendix 8c: Countries specific feedstock consumption of the 51 selected countries for ethylene production (high)
Countries Total (PJ) (ranked by total non-energy use) (∑feedstocks) Ethane
Liquefied Petroleum Gases (LPG)
Gas/Diesel Oil Naphtha
United States 2372 671 655 159 886People's Republic of China 630 0 0 0 630Japan 987 0 33 0 954Korea 722 0 0 0 722Germany 760 4 45 106 605Russia 484 0 9 4 471Canada 382 261 44 18 59France 482 0 4 43 436India 304 32 19 0 252Brazil 324 63 14 0 247United Kingdom 347 15 0 0 331Netherlands 448 0 18 0 430Saudi Arabia 494 229 44 0 221Spain 195 0 0 0 195Italy 318 5 2 59 252Chinese Taipei 348 0 0 0 348Mexico 85 85 0 0 0Indonesia 81 0 0 0 81Belgium 280 0 10 0 270South Africa 28 26 2 0 0Islamic Republic of Iran 95 5 1 0 89Argentina 51 42 4 0 4Poland 58 0 0 0 58Australia 45 25 0 20 0Thailand 174 20 9 0 146Turkey 59 0 0 0 59Singapore 148 0 1 0 147Egypt 44 0 0 0 44Trinidad and Tobago 0 0 0 0 0Libya 52 0 0 0 52Pakistan 0 0 0 0 0New Zealand 0 0 0 0 0Qatar 32 32 0 0 0Portugal 49 0 0 0 49Venezuela 45 26 19 0 0Uzbekistan 0 0 0 0 0Belarus 20 0 0 0 20Malaysia 107 24 0 0 82Norway 43 8 35 0 0Romania 104 2 7 0 94Czech Republic 66 0 0 14 52Algeria 20 0 0 0 20Colombia 7 5 2 0 0Israel 26 1 2 0 23

65
Appendix 8c-continued (1)
Countries Total (PJ) (ranked by total non-energy use) (∑feedstocks) Ethane
Liquefied Petroleum Gases (LPG)
Gas/Diesel Oil Naphtha
Slovak Republic 29 0 3 0 26Hungary 53 1 1 10 40Austria 44 3 9 0 31Sweden 64 15 13 0 36Bulgaria 59 0 0 0 59Kuwait 49 49 0 0 0Finland 43 0 0 0 43

66
Appendix 9a: Countries specific feedstock consumption of the 51 selected countries for ammonia production (low)
Countries Feedstocks (PJ) Countries
Feedstocks (PJ)
(ranked by total non-energy use) Natural gas
(ranked by total non-energy use) Natural gas
United States 425 Singapore 0People's Republic of China 942 Egypt 51Japan 48 Trinidad and Tobago 91Korea 14 Libya 19Germany 84 Pakistan 64Russia 297 New Zealand 4Canada 140 Qatar 37France 55 Portugal 8India 345 Venezuela 13Brazil 31 Uzbekistan 28United Kingdom 28 Belarus 25Netherlands 86 Malaysia 21Saudi Arabia 59 Norway 11Spain 15 Romania 35Italy 14 Czech Republic 8Chinese Taipei 0 Algeria 16Mexico 24 Colombia 3Indonesia 123 Israel 0Belgium 29 Slovak Republic 9South Africa 19 Hungary 12Islamic Republic of Iran 33 Austria 15Argentina 7 Sweden 0Poland 63 Bulgaria 18Australia 20 Kuwait 14Thailand 0 Finland 0Turkey 2

67
Appendix 9b: Countries specific feedstock consumption of the 51 selected countries for ammonia production (medium)
Countries Feedstocks (PJ) Countries
Feedstocks (PJ)
(ranked by total non-energy use) Natural gas
(ranked by total non-energy use) Natural gas
United States 486 Singapore 0People's Republic of China 1076 Egypt 59Japan 55 Trinidad and Tobago 104Korea 16 Libya 21Germany 96 Pakistan 73Russia 339 New Zealand 4Canada 160 Qatar 43France 63 Portugal 10India 394 Venezuela 15Brazil 36 Uzbekistan 31United Kingdom 32 Belarus 28Netherlands 99 Malaysia 24Saudi Arabia 68 Norway 13Spain 17 Romania 39Italy 16 Czech Republic 10Chinese Taipei 0 Algeria 18Mexico 27 Colombia 4Indonesia 141 Israel 0Belgium 34 Slovak Republic 11South Africa 22 Hungary 14Islamic Republic of Iran 37 Austria 17Argentina 8 Sweden 0Poland 72 Bulgaria 21Australia 22 Kuwait 16Thailand 0 Finland 0Turkey 2

68
Appendix 9c: Countries specific feedstock consumption of the 51 selected countries for ammonia production (high)
Countries Feedstocks (PJ) Countries
Feedstocks (PJ)
(ranked by total non-energy use) Natural gas
(ranked by total non-energy use) Natural gas
United States 607 Singapore 0People's Republic of China 1345 Egypt 73Japan 68 Trinidad and Tobago 130Korea 19 Libya 27Germany 120 Pakistan 92Russia 424 New Zealand 5Canada 201 Qatar 53France 79 Portugal 12India 493 Venezuela 18Brazil 45 Uzbekistan 39United Kingdom 40 Belarus 35Netherlands 123 Malaysia 29Saudi Arabia 85 Norway 16Spain 21 Romania 49Italy 20 Czech Republic 12Chinese Taipei 1 Algeria 22Mexico 34 Colombia 5Indonesia 176 Israel 0Belgium 42 Slovak Republic 13South Africa 27 Hungary 17Islamic Republic of Iran 47 Austria 22Argentina 10 Sweden 0Poland 90 Bulgaria 26Australia 28 Kuwait 20Thailand 0 Finland 0Turkey 3
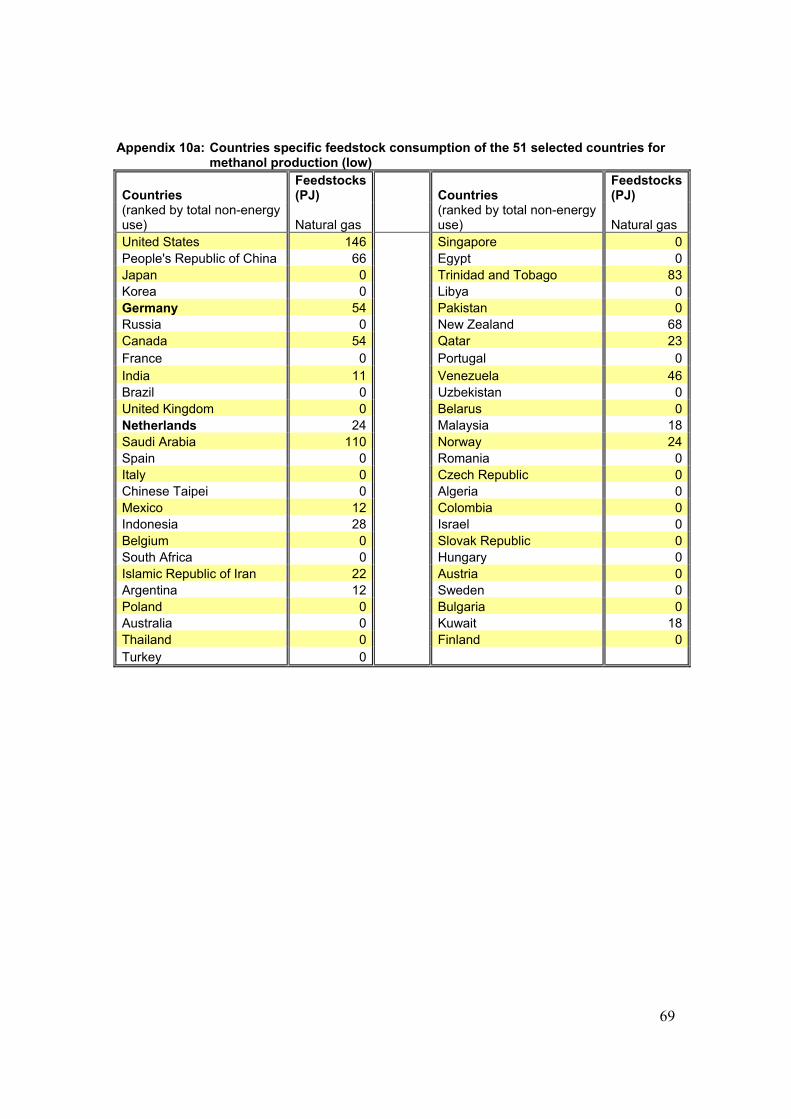
69
Appendix 10a: Countries specific feedstock consumption of the 51 selected countries for methanol production (low)
Countries Feedstocks (PJ) Countries
Feedstocks (PJ)
(ranked by total non-energy use) Natural gas
(ranked by total non-energy use) Natural gas
United States 146 Singapore 0People's Republic of China 66 Egypt 0Japan 0 Trinidad and Tobago 83Korea 0 Libya 0Germany 54 Pakistan 0Russia 0 New Zealand 68Canada 54 Qatar 23France 0 Portugal 0India 11 Venezuela 46Brazil 0 Uzbekistan 0United Kingdom 0 Belarus 0Netherlands 24 Malaysia 18Saudi Arabia 110 Norway 24Spain 0 Romania 0Italy 0 Czech Republic 0Chinese Taipei 0 Algeria 0Mexico 12 Colombia 0Indonesia 28 Israel 0Belgium 0 Slovak Republic 0South Africa 0 Hungary 0Islamic Republic of Iran 22 Austria 0Argentina 12 Sweden 0Poland 0 Bulgaria 0Australia 0 Kuwait 18Thailand 0 Finland 0Turkey 0

70
Appendix 10b: Countries specific feedstock consumption of the 51 selected countries for methanol production (medium)
Countries Feedstocks (PJ) Countries
Feedstocks (PJ)
(ranked by total non-energy use) Natural gas
(ranked by total non-energy use) Natural gas
United States 166 Singapore 0People's Republic of China 75 Egypt 0Japan 0 Trinidad and Tobago 94Korea 0 Libya 0Germany 62 Pakistan 0Russia 0 New Zealand 77Canada 61 Qatar 26France 0 Portugal 0India 12 Venezuela 53Brazil 0 Uzbekistan 0United Kingdom 0 Belarus 0Netherlands 27 Malaysia 21Saudi Arabia 126 Norway 27Spain 0 Romania 0Italy 0 Czech Republic 0Chinese Taipei 0 Algeria 0Mexico 14 Colombia 0Indonesia 32 Israel 0Belgium 0 Slovak Republic 0South Africa 0 Hungary 0Islamic Republic of Iran 25 Austria 0Argentina 14 Sweden 0Poland 0 Bulgaria 0Australia 0 Kuwait 21Thailand 0 Finland 0Turkey 0

71
Appendix 10c: Countries specific feedstock consumption of the 51 selected countries for methanol production (high)
Countries Feedstocks (PJ) Countries
Feedstocks (PJ)
(ranked by total non-energy use) Natural gas
(ranked by total non-energy use) Natural gas
United States 208 Singapore 0People's Republic of China 94 Egypt 0Japan 0 Trinidad and Tobago 118Korea 0 Libya 0Germany 78 Pakistan 0Russia 0 New Zealand 97Canada 77 Qatar 33France 0 Portugal 0India 16 Venezuela 66Brazil 0 Uzbekistan 0United Kingdom 0 Belarus 0Netherlands 34 Malaysia 26Saudi Arabia 158 Norway 34Spain 0 Romania 0Italy 0 Czech Republic 0Chinese Taipei 0 Algeria 0Mexico 17 Colombia 0Indonesia 40 Israel 0Belgium 0 Slovak Republic 0South Africa 0 Hungary 0Islamic Republic of Iran 31 Austria 0Argentina 17 Sweden 0Poland 0 Bulgaria 0Australia 0 Kuwait 26Thailand 0 Finland 0Turkey 0

72
Appendix 11a: Countries specific feedstock consumption of the 51 selected countries for carbon black production (low)
Countries Feedstocks (PJ) Countries Feedstocks (PJ) (ranked by total non-energy use) Natural gas
Crude Oil
(ranked by total non-energy use) Natural gas
Crude Oil
United States 13 115 Singapore 0 1People's Republic of China 9 86 Egypt 1 10Japan 5 44 Trinidad and Tobago 0 0Korea 4 32 Libya 0 0Germany 2 18 Pakistan 0 0Russia 6 52 New Zealand 0 0Canada 2 16 Qatar 0 0France 2 15 Portugal 0 2India 4 34 Venezuela 1 4Brazil 2 19 Uzbekistan 0 0United Kingdom 1 11 Belarus 0 0Netherlands 1 9 Malaysia 1 6Saudi Arabia 0 0 Norway 0 0Spain 0 4 Romania 0 2Italy 2 15 Czech Republic 1 6Chinese Taipei 1 6 Algeria 0 0Mexico 1 7 Colombia 0 4Indonesia 1 7 Israel 0 0Belgium 0 0 Slovak Republic 0 0South Africa 1 4 Hungary 0 0Islamic Republic of Iran 1 5 Austria 0 0Argentina 1 5 Sweden 0 3Poland 0 2 Bulgaria 0 0Australia 1 6 Kuwait 0 0Thailand 2 17 Finland 0 0Turkey 0 2
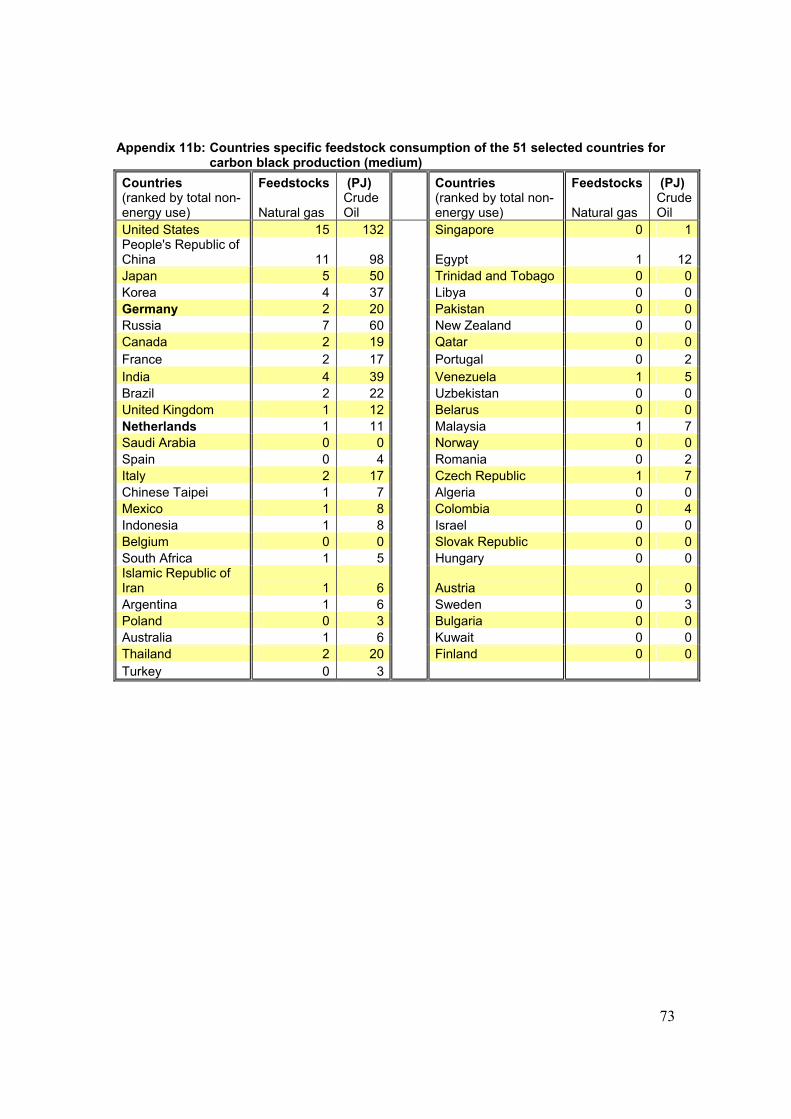
73
Appendix 11b: Countries specific feedstock consumption of the 51 selected countries for carbon black production (medium)
Countries Feedstocks (PJ) Countries Feedstocks (PJ) (ranked by total non-energy use) Natural gas
Crude Oil
(ranked by total non-energy use) Natural gas
Crude Oil
United States 15 132 Singapore 0 1People's Republic of China 11 98 Egypt 1 12Japan 5 50 Trinidad and Tobago 0 0Korea 4 37 Libya 0 0Germany 2 20 Pakistan 0 0Russia 7 60 New Zealand 0 0Canada 2 19 Qatar 0 0France 2 17 Portugal 0 2India 4 39 Venezuela 1 5Brazil 2 22 Uzbekistan 0 0United Kingdom 1 12 Belarus 0 0Netherlands 1 11 Malaysia 1 7Saudi Arabia 0 0 Norway 0 0Spain 0 4 Romania 0 2Italy 2 17 Czech Republic 1 7Chinese Taipei 1 7 Algeria 0 0Mexico 1 8 Colombia 0 4Indonesia 1 8 Israel 0 0Belgium 0 0 Slovak Republic 0 0South Africa 1 5 Hungary 0 0Islamic Republic of Iran 1 6 Austria 0 0Argentina 1 6 Sweden 0 3Poland 0 3 Bulgaria 0 0Australia 1 6 Kuwait 0 0Thailand 2 20 Finland 0 0Turkey 0 3

74
Appendix 11c: Countries specific feedstock consumption of the 51 selected countries for carbon black production (high)
Countries Feedstocks (PJ) Countries Feedstocks (PJ) (ranked by total non-energy use) Natural gas
Crude Oil
(ranked by total non-energy use) Natural gas
Crude Oil
United States 21 165 Singapore 0 1People's Republic of China 15 123 Egypt 2 15Japan 8 62 Trinidad and Tobago 0 0Korea 6 46 Libya 0 0Germany 3 25 Pakistan 0 0Russia 9 74 New Zealand 0 0Canada 3 23 Qatar 0 0France 3 21 Portugal 0 3India 6 48 Venezuela 1 6Brazil 3 27 Uzbekistan 0 0United Kingdom 2 15 Belarus 0 0Netherlands 2 14 Malaysia 1 9Saudi Arabia 0 0 Norway 0 0Spain 1 5 Romania 0 3Italy 3 21 Czech Republic 1 9Chinese Taipei 1 9 Algeria 0 0Mexico 1 11 Colombia 1 5Indonesia 1 11 Israel 0 0Belgium 0 1 Slovak Republic 0 0South Africa 1 6 Hungary 0 0Islamic Republic of Iran 1 7 Austria 0 0Argentina 1 7 Sweden 0 4Poland 0 4 Bulgaria 0 0Australia 1 8 Kuwait 0 0Thailand 3 25 Finland 0 0Turkey 0 4

75
Appendix 12a: Countries specific NEUfeedstock of the 51 selected countries (low)
Countries Total Total Feedstocks (PJ) (ranked by total non-energy use)
Bottom-up
Top-down Natural Gas
Crude Oil Ethane
Liquefied Petroleum Gases (LPG)
Gas/Diesel Oil Naphtha
United States 2859 2743 583 115 645 592 139 785People's Republic of China 1660 1241 1017 86 0 0 0 557Japan 970 1416 53 44 0 30 0 844Korea 689 1056 17 32 0 0 0 639Germany 830 842 140 18 4 41 92 535Russia 783 664 303 52 0 8 3 417Canada 571 557 196 16 251 40 15 53France 498 485 57 15 0 4 37 385India 665 405 360 34 31 17 0 223Brazil 344 411 34 19 61 13 0 218United Kingdom 347 310 29 11 15 0 0 293Netherlands 517 306 111 9 0 16 0 380Saudi Arabia 625 372 170 0 220 40 0 195Spain 192 231 15 4 0 0 0 172Italy 311 180 16 15 5 2 51 223Chinese Taipei 315 196 1 6 0 0 0 308Mexico 126 221 37 7 82 0 0 0Indonesia 231 242 152 7 0 0 0 72Belgium 278 189 29 0 0 10 0 239South Africa 50 211 19 4 25 2 0 0Islamic Republic of Iran 145 88 55 5 5 1 0 79Argentina 73 137 19 5 41 4 0 4Poland 117 113 64 2 0 0 0 51Australia 67 47 20 6 24 0 17 0Thailand 175 124 2 17 19 8 0 129Turkey 57 62 2 2 0 0 0 52
76
Appendix 12a-continued (1)
Countries Total Total Feedstocks (PJ) Ranked by NEU(Total)
Bottom-up
Top-down Natural Gas
Crude Oil Ethane
Liquefied Petroleum Gases (LPG)
Gas/Diesel Oil Naphtha
Singapore 132 124 0 1 0 1 0 130Egypt 102 74 53 10 0 0 0 39Trinidad and Tobago 174 131 174 0 0 0 0 0Libya 64 116 19 0 0 0 0 46Pakistan 64 103 64 0 0 0 0 0New Zealand 71 89 71 0 0 0 0 0Qatar 91 100 60 0 31 0 0 0Portugal 54 71 9 2 0 0 0 43Venezuela 106 0 60 4 25 17 0 0Uzbekistan 28 65 28 0 0 0 0 0Belarus 42 75 25 0 0 0 0 17Malaysia 142 62 40 6 23 0 0 73Norway 75 55 35 0 8 32 0 0Romania 129 54 35 2 2 7 0 83Czech Republic 73 38 9 6 0 0 12 46Algeria 33 64 16 0 0 0 0 17Colombia 14 0 4 4 5 2 0 0Israel 23 44 0 0 1 2 0 20Slovak Republic 35 34 9 0 0 3 0 23Hungary 59 46 12 0 1 1 9 35Austria 54 10 15 0 3 8 0 28Sweden 61 27 0 3 14 12 0 32Bulgaria 70 46 18 0 0 0 0 52Kuwait 79 0 32 0 47 0 0 0Finland 38 19 0 0 0 0 0 38

77
Appendix 12b: Countries specific NEUfeedstock of the 51 selected countries (medium)
Countries Total (PJ) Total Feedstocks
(ranked by total non-energy use)
(Bottom-up) (IEA) Natural Gas
Crude Oil Ethane
Liquefied petroleum gas (LPG)
Gas/Diesel Oil Naphtha
United States 3011 2743 667 132 650 600 144 818 People's Republic of China 1841 1241 1162 98 0 0 0 581 Japan 1021 1416 60 50 0 30 0 880 Korea 723 1056 20 37 0 0 0 666 Germany 880 842 160 20 4 41 96 558 Russia 852 664 346 60 0 8 3 435 Canada 606 557 224 19 253 40 16 55 France 526 485 65 17 0 4 38 402 India 731 405 411 39 31 18 0 233 Brazil 362 411 38 22 61 13 0 228 United Kingdom 366 310 33 12 15 0 0 306 Netherlands 551 306 127 11 0 16 0 397 Saudi Arabia 660 372 194 0 222 40 0 204 Spain 202 231 18 4 0 0 0 180 Italy 327 180 18 17 5 2 53 232 Chinese Taipei 329 196 1 7 0 0 0 321 Mexico 133 221 42 8 82 0 0 0 Indonesia 256 242 173 8 0 0 0 75 Belgium 292 189 34 0 0 10 0 249 South Africa 54 211 22 5 25 2 0 0 Islamic Republic of Iran 157 88 63 6 5 1 0 82 Argentina 77 137 22 6 41 4 0 4 Poland 129 113 73 3 0 0 0 54 Australia 72 47 23 6 24 0 18 0 Thailand 183 124 2 20 19 8 0 134 Turkey 59 62 2 3 0 0 0 54

78
Appendix 12b-continued (1)
Countries Total (PJ) Total Feedstocks
(ranked by total non-energy use)
(Bottom-up) (IEA) Natural Gas
Crude Oil Ethane
Liquefied petroleum gas (LPG)
Gas/Diesel Oil Naphtha
Singapore 138 124 0 1 0 1 0 136 Egypt 113 74 60 12 0 0 0 41 Trinidad and Tobago 199 131 199 0 0 0 0 0 Libya 69 116 21 0 0 0 0 48 Pakistan 73 103 73 0 0 0 0 0 New Zealand 82 89 82 0 0 0 0 0 Qatar 100 100 69 0 31 0 0 0 Portugal 57 71 10 2 0 0 0 45 Venezuela 116 0 68 5 25 18 0 0 Uzbekistan 31 65 31 0 0 0 0 0 Belarus 46 75 28 0 0 0 0 18 Malaysia 152 62 45 7 24 0 0 76 Norway 80 55 40 0 8 32 0 0 Romania 138 54 40 2 2 7 0 87 Czech Republic 78 38 10 7 0 0 12 48 Algeria 36 64 18 0 0 0 0 18 Colombia 15 0 4 4 5 2 0 0 Israel 24 44 0 0 1 2 0 21 Slovak Republic 37 34 11 0 0 3 0 24 Hungary 63 46 14 0 1 1 9 37 Austria 58 10 17 0 3 8 0 29 Sweden 63 27 0 3 14 12 0 33 Bulgaria 75 46 21 0 0 0 0 54 Kuwait 84 0 37 0 47 0 0 0 Finland 40 19 0 0 0 0 0 39

79
Appendix 12c: Countries specific NEUfeedstock of the 51 selected countries (high)
Countries Total Total Feedstocks (PJ)
Ranked by NEU(Total) Bottom-up
Top-down Natural Gas
Crude Oil Ethane
Liquefied Petroleum Gases (LPG)
Gas/Diesel Oil Naphtha
United States 3372 2743 836 165 671 655 159 886People's Republic of China 2207 1241 1455 123 0 0 0 630Japan 1126 1416 76 62 0 33 0 954Korea 794 1056 25 46 0 0 0 722Germany 986 842 201 25 4 45 106 605Russia 992 664 434 74 0 9 4 471Canada 685 557 280 23 261 44 18 59France 585 485 81 21 0 4 43 436India 866 405 515 48 32 19 0 252Brazil 399 411 48 27 63 14 0 247United Kingdom 403 310 41 15 15 0 0 331Netherlands 621 306 159 14 0 18 0 430Saudi Arabia 736 372 242 0 229 44 0 221Spain 222 231 22 5 0 0 0 195Italy 362 180 23 21 5 2 59 252Chinese Taipei 358 196 2 9 0 0 0 348Mexico 148 221 53 11 85 0 0 0Indonesia 308 242 217 11 0 0 0 81Belgium 323 189 42 1 0 10 0 270South Africa 62 211 28 6 26 2 0 0Islamic Republic of Iran 181 88 79 7 5 1 0 89Argentina 86 137 28 7 42 4 0 4Poland 153 113 91 4 0 0 0 58Australia 82 47 29 8 25 0 20 0Thailand 202 124 3 25 20 9 0 146Turkey 65 62 3 4 0 0 0 59

80
Appendix 12c-continued (1)
Countries Total Total Feedstocks (PJ) Ranked by NEU(Total)
Bottom-up
Top-down Natural Gas
Crude Oil Ethane
Liquefied Petroleum Gases (LPG)
Gas/Diesel Oil Naphtha
Singapore 149 124 0 1 0 1 0 147Egypt 134 74 75 15 0 0 0 44Trinidad and Tobago 248 131 248 0 0 0 0 0Libya 78 116 27 0 0 0 0 52Pakistan 92 103 92 0 0 0 0 0New Zealand 102 89 102 0 0 0 0 0Qatar 118 100 86 0 32 0 0 0Portugal 64 71 12 3 0 0 0 49Venezuela 137 0 85 6 26 19 0 0Uzbekistan 39 65 39 0 0 0 0 0Belarus 55 75 35 0 0 0 0 20Malaysia 172 62 57 9 24 0 0 82Norway 94 55 50 0 8 35 0 0Romania 157 54 50 3 2 7 0 94Czech Republic 88 38 13 9 0 0 14 52Algeria 42 64 22 0 0 0 0 20Colombia 18 0 5 5 5 2 0 0Israel 26 44 0 0 1 2 0 23Slovak Republic 42 34 13 0 0 3 0 26Hungary 70 46 17 0 1 1 10 40Austria 66 10 22 0 3 9 0 31Sweden 69 27 0 4 15 13 0 36Bulgaria 85 46 26 0 0 0 0 59Kuwait 95 0 46 0 49 0 0 0Finland 43 19 0 0 0 0 0 43
81
Appendix 13a: Countries specific fossil fuel consumption of the 51 selected countries for Aromatics production (low)
Countries Fossil fuel (PJ) Countries Fossil fuel (PJ) (ranked by total non-energy use)
Other Petroleum Products
(ranked by total non-energy use)
Other Petroleum Products
United States 0 Singapore 0People's Republic of China Egypt 0Japan 0 Trinidad and Tobago Korea 0 Libya Germany 0 Pakistan Russia New Zealand Canada 0 Qatar France 0 Portugal 0India 0 Venezuela 0Brazil Uzbekistan United Kingdom 0 Belarus Netherlands 0 Malaysia Saudi Arabia 0 Norway Spain 0 Romania 0Italy 0 Czech Republic 0Chinese Taipei 0 Algeria Mexico 0 Colombia 0Indonesia Israel Belgium Slovak Republic 0South Africa 0 Hungary 0Islamic Republic of Iran Austria Argentina Sweden Poland 0 Bulgaria 0Australia Kuwait Thailand Finland 0Turkey

82
Appendix 13b: Countries specific fossil fuel consumption of the 51 selected countries for Aromatics production (medium)
Countries Fossil fuel (PJ) Countries Fossil fuel (PJ) (ranked by total non-energy use)
Other Petroleum Products
(ranked by total non-energy use)
Other Petroleum Products
United States 741 Singapore 37People's Republic of China Egypt 3Japan 266 Trinidad and Tobago Korea 168 Libya Germany 138 Pakistan Russia New Zealand Canada 95 Qatar France 10 Portugal 35India 9 Venezuela 4Brazil Uzbekistan United Kingdom 32 Belarus Netherlands 51 Malaysia Saudi Arabia 26 Norway Spain 64 Romania 16Italy 43 Czech Republic 1Chinese Taipei 28 Algeria Mexico 34 Colombia 4Indonesia Israel Belgium Slovak Republic 9South Africa 3 Hungary 14Islamic Republic of Iran Austria Argentina Sweden Poland 9 Bulgaria 4Australia Kuwait Thailand Finland 0Turkey

83
Appendix 13c: Countries specific fossil fuel consumption of the 51 selected countries for Aromatics production (high)
Countries Fossil fuel (PJ) Countries Fossil fuel (PJ) (ranked by total non-energy use)
Other Petroleum Products
(ranked by total non-energy use)
Other Petroleum Products
United States 741 Singapore 37People's Republic of China Egypt 3Japan 266 Trinidad and Tobago Korea 168 Libya Germany 138 Pakistan Russia New Zealand Canada 95 Qatar France 10 Portugal 35India 9 Venezuela 4Brazil Uzbekistan United Kingdom 32 Belarus Netherlands 51 Malaysia Saudi Arabia 26 Norway Spain 64 Romania 16Italy 43 Czech Republic 1Chinese Taipei 28 Algeria Mexico 34 Colombia 4Indonesia Israel Belgium Slovak Republic 9South Africa 3 Hungary 14Islamic Republic of Iran Austria Argentina Sweden Poland 9 Bulgaria 4Australia Kuwait Thailand Finland 0Turkey

84
Appendix 14a: Countries specific fossil fuel consumption with respect to the electrode consumption of the 51 selected countries (low)
Countries Fossil fuel (PJ) Countries
Fossil fuel (PJ)
(ranked by total non-energy use)
Petroleum Coke
(ranked by total non-energy use)
Petroleum Coke
United States 59 Singapore People's Republic of China 48 Egypt 3Japan 1 Trinidad and Tobago Korea 0 Libya Germany 10 Pakistan Russia 52 New Zealand 5Canada 38 Qatar France 7 Portugal India 9 Venezuela 9Brazil 20 Uzbekistan United Kingdom 5 Belarus Netherlands 5 Malaysia Saudi Arabia Norway 16Spain 6 Romania 3Italy 3 Czech Republic Chinese Taipei Algeria Mexico 1 Colombia Indonesia 3 Israel Belgium Slovak Republic 2South Africa 11 Hungary 1Islamic Republic of Iran 2 Austria 0Argentina 4 Sweden 2Poland 1 Bulgaria Australia 28 Kuwait Thailand Finland Turkey 1

85
Appendix 14b: Countries specific fossil fuel consumption with respect to the electrode consumption of the 51 selected countries (medium)
Countries Fossil fuel (PJ) Countries
Fossil fuel (PJ)
(ranked by total non-energy use)
Petroleum Coke
(ranked by total non-energy use)
Petroleum Coke
United States 62 Singapore People's Republic of China 50 Egypt 3Japan 1 Trinidad and Tobago Korea 0 Libya Germany 11 Pakistan Russia 55 New Zealand 6Canada 40 Qatar France 8 Portugal India 9 Venezuela 10Brazil 21 Uzbekistan United Kingdom 5 Belarus Netherlands 5 Malaysia Saudi Arabia Norway 17Spain 6 Romania 3Italy 3 Czech Republic Chinese Taipei Algeria Mexico 1 Colombia Indonesia 3 Israel Belgium Slovak Republic 2South Africa 11 Hungary 1Islamic Republic of Iran 2 Austria 0Argentina 4 Sweden 2Poland 1 Bulgaria Australia 29 Kuwait Thailand Finland Turkey 1
86
Appendix 14c: Countries specific fossil fuel consumption with respect to the electrode consumption of the 51 selected countries (high)
Countries Fossil fuel (PJ) Countries
Fossil fuel (PJ)
(ranked by total non-energy use)
Petroleum Coke
(ranked by total non-energy use)
Petroleum Coke
United States 65 Singapore People's Republic of China 53 Egypt 3Japan 1 Trinidad and Tobago Korea 0 Libya Germany 11 Pakistan Russia 57 New Zealand 6Canada 42 Qatar France 8 Portugal India 10 Venezuela 10Brazil 22 Uzbekistan United Kingdom 5 Belarus Netherlands 5 Malaysia Saudi Arabia Norway 18Spain 6 Romania 3Italy 3 Czech Republic Chinese Taipei Algeria Mexico 1 Colombia Indonesia 3 Israel Belgium Slovak Republic 2South Africa 12 Hungary 2Islamic Republic of Iran 3 Austria 0Argentina 5 Sweden 2Poland 1 Bulgaria Australia 31 Kuwait Thailand Finland Turkey 1
87
Appendix 15: Countries specific lubricants and bitumen consumption of the 51 selected countries
Countries
Lubricants (PJ) per capita Countries
Lubricants per capita Countries
Bitumen (PJ) per Capita Countries
Bitumen per Capita
(xMillion) (xMillion) (xMillion) Singapore 62 South Africa 7 United States 111 Malaysia 27 Sweden 39 Turkey 7 Canada 102 Poland 22 Canada 30 Romania 6 Slovak Republic 77 Singapore 22 United States 30 Islamic Republic of Iran 6 Austria 69 Hungary 22 Hungary 24 Belarus 6 Norway 69 Kuwait 21 Australia 24 Libya 6 Venezuela 64 Turkey 18 Czech Republic 21 Egypt 5 Finland 56 Netherlands 17 Norway 19 Uzbekistan 5 France 55 Thailand 16 Russia 17 Brazil 5 Portugal 53 Argentina 14 Finland 16 Bulgaria 4 Sweden 53 Romania 13 Belgium 16 Algeria 3 Spain 45 Egypt 13 Japan 15 New Zealand 3 Italy 40 Bulgaria 13
France 14 People's Republic of China 2 Australia 40 Brazil 10
Italy 14 Indonesia 1 Germany 39 Algeria 8 Germany 13 Pakistan 1 New Zealand 38 Uzbekistan 5 United Kingdom 13 India 1 Belgium 37 South Africa 5
Austria 13 Saudi Arabia 0 Israel 36People's Republic of China 3
Chinese Taipei 12 Mexico 0 Japan 36 India 3 Venezuela 11 Thailand 0 Czech Republic 35 Trinidad and Tobago 2 Netherlands 11 Trinidad and Tobago 0 Korea 35 Pakistan 2 Korea 11 Qatar 0 Libya 33 Indonesia 1 Portugal 11 Malaysia 0 Chinese Taipei 33 Saudi Arabia 0 Spain 10 Colombia 0 Russia 32 Mexico 0 Argentina 10 Israel 0 United Kingdom 32 Qatar 0 Slovak Republic 10 Kuwait 0 Belarus 30 Colombia 0 Poland 8 Republic of Iran 29
88
Appendix 16a: Countries specific NEURefinery and coke oven the 51 selected countries (low)
Countries Total Total Feedstocks (PJ) (ranked by total non-energy use)
Bottom-up
Top-down Lubricants Bitumen
Petroleum Coke
Other Petroleum Products
United States 1682 2353 344 1278 59 0People's Republic of China 308 907 111 148 48 0Japan 269 408 79 190 1 0Korea 90 93 22 68 0 0Germany 190 216 45 135 10 0Russia 355 342 106 197 52 0Canada 209 262 39 132 38 0France 179 197 36 136 7 0India 160 211 33 118 9 0Brazil 125 187 35 70 20 0United Kingdom 116 162 32 79 5 0Netherlands 24 123 7 12 5 0Saudi Arabia 0 44 0 0 0 0Spain 98 168 17 75 6 0Italy 134 145 33 98 3 0Chinese Taipei 41 88 11 30 0 0Mexico 1 62 0 0 1 0Indonesia 26 30 10 13 3 0Belgium 23 61 7 16 0 0South Africa 33 22 13 9 11 0Islamic Republic of Iran 97 98 17 77 2 0Argentina 41 45 16 21 4 0Poland 50 69 14 36 1 0Australia 79 133 19 32 28 0Thailand 40 40 0 40 0 0Turkey 70 88 18 51 1 0Singapore 14 22 10 4 0 0Egypt 52 63 15 34 3 0

89
Appendix 16a-continued (1)
Countries Total Total Feedstocks (PJ) (ranked by total non-energy use)
Bottom-up
Top-down Lubricants Bitumen
Petroleum Coke
Other Petroleum Products
Trinidad and Tobago 0 0 0 0 0 0Libya 8 9 1 7 0 0Pakistan 14 16 5 9 0 0New Zealand 12 12 0 6 5 0Qatar 0 0 0 0 0 0Portugal 27 28 4 22 0 0Venezuela 85 93 11 65 9 0Uzbekistan 11 28 5 5 0 0Belarus 15 16 2 13 0 0Malaysia 26 26 0 26 0 0Norway 33 32 4 13 16 0Romania 21 32 6 12 3 0Czech Republic 24 47 9 15 0 0Algeria 14 14 4 10 0 0Colombia 0 76 0 0 0 0Israel 10 26 0 10 0 0Slovak Republic 21 34 2 17 2 0Hungary 21 21 10 9 1 0Austria 28 54 4 24 0 0Sweden 35 35 14 20 2 0Bulgaria 6 7 1 4 0 0Kuwait 2 47 0 2 0 0Finland 16 24 4 12 0 0

90
Appendix 16b: Countries specific NEURefinery and coke oven the 51 selected countries (medium)
Countries Total Total Fossil Fuels (ranked by total non-energy use)
(Bottom-up) (IEA) Lubricants Bitumen
Petroleum Coke
Other Petroleum Products
United States 2426 2353 344 1278 62 741People's Republic of China 310 907 111 148 50 0Japan 535 408 79 190 1 266Korea 258 93 22 68 0 168Germany 328 216 45 135 11 138Russia 358 342 106 197 55 0Canada 306 262 39 132 40 95France 190 197 36 136 8 10India 169 211 33 118 9 9Brazil 126 187 35 70 21 0United Kingdom 149 162 32 79 5 32Netherlands 75 123 7 12 5 51Saudi Arabia 26 44 0 0 26Spain 162 168 17 75 6 64Italy 177 145 33 98 3 43Chinese Taipei 69 88 11 30 28Mexico 35 62 0 0 1 34Indonesia 26 30 10 13 3 0Belgium 23 61 7 16 0South Africa 36 22 13 9 11 3Islamic Republic of Iran 97 98 17 77 2 0Argentina 42 45 16 21 4 0Poland 59 69 14 36 1 9Australia 80 133 19 32 29 0Thailand 40 40 0 40 0Turkey 70 88 18 51 1 0Singapore 51 22 10 4 37Egypt 55 63 15 34 3 3

91
Appendix 16b-continued (1)
Countries Total Total Fossil Fuels (ranked by total non-energy use)
(Bottom-up) (IEA) Lubricants Bitumen
Petroleum Coke
Other Petroleum Products
Trinidad and Tobago 0 0 0 0 0Libya 8 9 1 7 0Pakistan 14 16 5 9 0New Zealand 12 12 0 6 6 0Qatar 0 0 0 0 0Portugal 61 28 4 22 35Venezuela 90 93 11 65 10 4Uzbekistan 11 28 5 5 0Belarus 15 16 2 13 0Malaysia 26 26 0 26 0Norway 34 32 4 13 17 0Romania 37 32 6 12 3 16Czech Republic 26 47 9 15 1Algeria 14 14 4 10 0Colombia 4 76 0 0 4Israel 10 26 0 10 0Slovak Republic 30 34 2 17 2 9Hungary 35 21 10 9 1 14Austria 28 54 4 24 0 0Sweden 36 35 14 20 2 0Bulgaria 10 7 1 4 4Kuwait 2 47 0 2 0Finland 16 24 4 12 0

92
Appendix 16c: Countries specific NEURefinery and coke oven the 51 selected countries (high)
Countries Total Total Feedstocks (PJ) (ranked by total non-energy use)
Bottom-up
Top-down Lubricants Bitumen
Petroleum Coke
Other Petroleum Products
United States 2429 2353 344 1278 65 741People's Republic of China 312 907 111 148 53 0Japan 535 408 79 190 1 266Korea 258 93 22 68 0 168Germany 329 216 45 135 11 138Russia 361 342 106 197 57 0Canada 308 262 39 132 42 95France 190 197 36 136 8 10India 170 211 33 118 10 9Brazil 128 187 35 70 22 0United Kingdom 149 162 32 79 5 32Netherlands 75 123 7 12 5 51Saudi Arabia 26 44 0 0 0 26Spain 163 168 17 75 6 64Italy 177 145 33 98 3 43Chinese Taipei 69 88 11 30 0 28Mexico 35 62 0 0 1 34Indonesia 26 30 10 13 3 0Belgium 23 61 7 16 0 0South Africa 37 22 13 9 12 3Islamic Republic of Iran 97 98 17 77 3 0Argentina 42 45 16 21 5 0Poland 59 69 14 36 1 9Australia 82 133 19 32 31 0Thailand 40 40 0 40 0 0Turkey 70 88 18 51 1 0Singapore 51 22 10 4 0 37Egypt 55 63 15 34 3 3
93
Appendix 16c-continued (1)
Countries Total Total Feedstocks (PJ) (ranked by total non-energy use)
Bottom-up
Top-down Lubricants Bitumen
Petroleum Coke
Other Petroleum Products
Trinidad and Tobago 0 0 0 0 0 0Libya 8 9 1 7 0 0Pakistan 14 16 5 9 0 0New Zealand 12 12 0 6 6 0Qatar 0 0 0 0 0 0Portugal 61 28 4 22 0 35Venezuela 90 93 11 65 10 4Uzbekistan 11 28 5 5 0 0Belarus 15 16 2 13 0 0Malaysia 26 26 0 26 0 0Norway 35 32 4 13 18 0Romania 37 32 6 12 3 16Czech Republic 26 47 9 15 0 1Algeria 14 14 4 10 0 0Colombia 4 76 0 0 0 4Israel 10 26 0 10 0 0Slovak Republic 30 34 2 17 2 9Hungary 35 21 10 9 2 14Austria 28 54 4 24 0 0Sweden 36 35 14 20 2 0Bulgaria 10 7 1 4 0 4Kuwait 2 47 0 2 0 0Finland 16 24 4 12 0 0
94
Appendix 17: Countries specific NEUTotal(medium) the 51 selected countries
Countries Totals (PJ) Feedstocks (PJ) (ranked by total non-energy use) BU-low BU-med BU-high IEA Natural Gas
Crude Oil Ethane LPG
Gas/Diesel Oil Naphtha
United States 4544 5435 5798 5096 667 132 650 600 144 816People's Republic of China 1970 2151 2517 2147 1162 98 0 0 0 581Japan 1240 1540 1661 1824 60 50 0 30 0 865Korea 778 981 1052 1149 20 37 0 0 0 666Germany 1020 1208 1314 1058 160 20 4 41 96 558Russia 1141 1210 1350 1006 346 60 0 8 3 435Canada 781 912 991 819 224 19 253 40 16 55France 677 663 775 681 65 17 0 4 38 349India 826 899 1036 616 411 39 31 18 0 231Brazil 471 488 526 599 38 22 61 13 0 228United Kingdom 464 492 552 472 33 12 15 0 0 283Netherlands 541 626 696 430 127 11 0 16 0 397Saudi Arabia 625 685 762 416 194 0 222 40 0 204Spain 290 364 385 399 18 4 0 0 0 180Italy 445 504 539 325 18 17 5 2 53 232Chinese Taipei 356 398 427 284 1 7 0 0 0 321Mexico 127 168 183 284 42 8 82 0 0 0Indonesia 257 282 334 273 173 8 0 0 0 75Belgium 301 315 346 250 34 0 0 10 0 249South Africa 84 90 98 234 22 5 25 2 0 0Islamic Republic of Iran 241 231 278 186 63 6 5 1 0 60Argentina 114 117 127 182 22 6 41 4 0 3Poland 168 188 211 182 73 3 0 0 0 54Australia 147 152 162 180 23 6 24 0 18 0Thailand 215 213 242 164 2 20 19 8 0 123Turkey 127 130 136 150 2 3 0 0 0 54Singapore 146 188 200 146 0 1 0 1 0 136Egypt 154 168 190 137 60 12 0 0 0 41
95
Appendix 17-continued (1)
Countries (ranked by total non-energy use) Lubricants Bitumen
Petroleum Coke
Other Petroleum Products
United States 344 1278 62 741People's Republic of China 111 148 50 0Japan 79 190 1 266Korea 22 68 0 168Germany 45 135 11 138Russia 106 197 55 0Canada 39 132 40 95France 36 136 8 10India 33 118 9 9Brazil 35 70 21 0United Kingdom 32 79 5 32Netherlands 7 12 5 51Saudi Arabia 0 0 26Spain 17 75 6 64Italy 33 98 3 43Chinese Taipei 11 30 28Mexico 0 0 1 34Indonesia 10 13 3 0Belgium 7 16 0South Africa 13 9 11 3Islamic Republic of Iran 17 77 2 0Argentina 16 21 4 0Poland 14 36 1 9Australia 19 32 29 0Thailand 0 40 0Turkey 18 51 1 0Singapore 10 4 37Egypt 15 34 3 3

96
Appendix 17-continued (2)
Countries Feedstocks (PJ) (ranked by total non-energy use) Natural Gas
Crude Oil Ethane
Liquefied Petroleum Gases (LPG)
Gas/Diesel Oil Naphtha
Trinidad and Tobago 199 0 0 0 0 0Libya 21 0 0 0 0 48Pakistan 73 0 0 0 0 0New Zealand 82 0 0 0 0 0Qatar 69 0 31 0 0 0Portugal 10 2 0 0 0 45Venezuela 68 5 25 18 0 0Uzbekistan 31 0 0 0 0 0Belarus 28 0 0 0 0 18Malaysia 45 7 24 0 0 76Norway 40 0 8 32 0 0Romania 40 2 2 7 0 81Czech Republic 10 7 0 0 12 32Algeria 18 0 0 0 0 6Colombia 4 4 5 2 0 0Israel 0 0 1 2 0 21Slovak Republic 11 0 0 3 0 24Hungary 14 0 1 1 9 37Austria 17 0 3 8 0 29Sweden 0 3 14 12 0 33Bulgaria 21 0 0 0 0 54Kuwait 37 0 47 0 0 0Finland 0 0 0 0 0 39
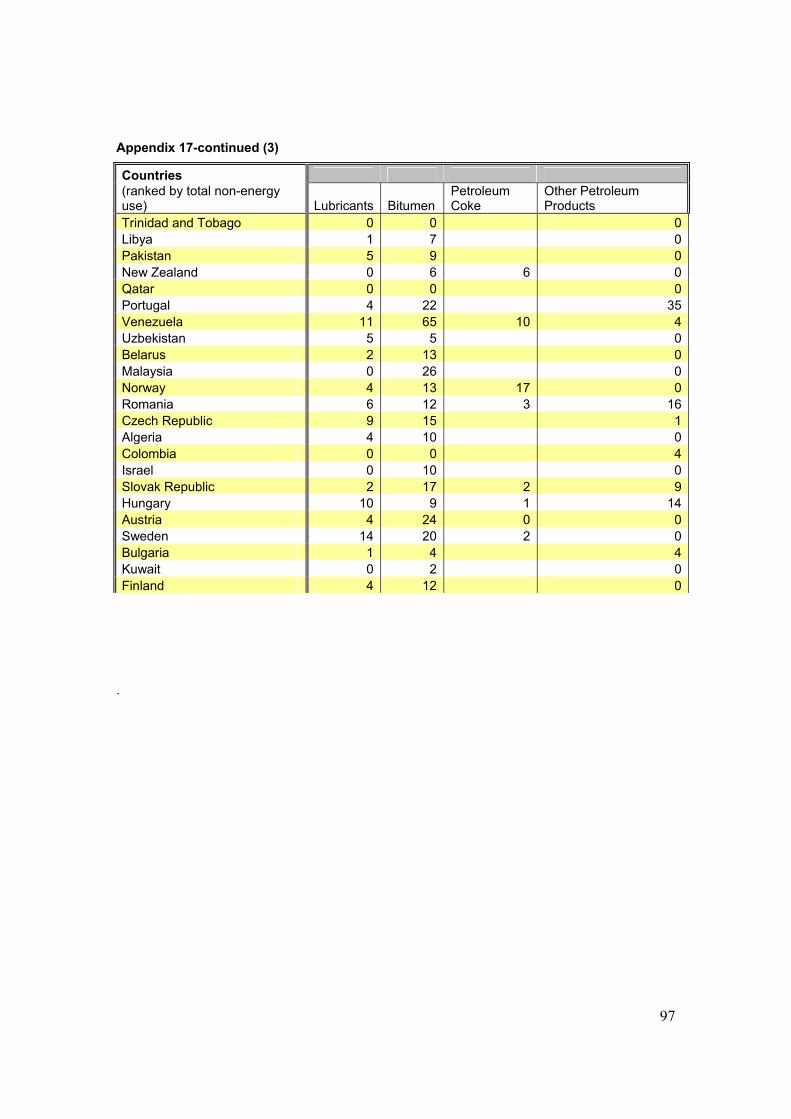
97
Appendix 17-continued (3)
Countries (ranked by total non-energy use) Lubricants Bitumen
Petroleum Coke
Other Petroleum Products
Trinidad and Tobago 0 0 0Libya 1 7 0Pakistan 5 9 0New Zealand 0 6 6 0Qatar 0 0 0Portugal 4 22 35Venezuela 11 65 10 4Uzbekistan 5 5 0Belarus 2 13 0Malaysia 0 26 0Norway 4 13 17 0Romania 6 12 3 16Czech Republic 9 15 1Algeria 4 10 0Colombia 0 0 4Israel 0 10 0Slovak Republic 2 17 2 9Hungary 10 9 1 14Austria 4 24 0 0Sweden 14 20 2 0Bulgaria 1 4 4Kuwait 0 2 0Finland 4 12 0
.