EED EANS BUSINE
35
EED EANS BUSINE . . Private Employers Assess the State Jobs Program .{\. . " . '( .' December, 1984 This study was funded by a major grant from The Minneapolis Foundation
Transcript of EED EANS BUSINE

EEDEANSBUSINE
~."- .
. Private EmployersAssess theState Jobs Program
.{\. .
" . '(
.' ~!f December, 1984This study was funded by a major grant
from The Minneapolis Foundation

M E E D
MEA N S
BUS I N E S S
Private Employers Assess
The state Jobs Program
by
Asha Rangan
This study was funded by a major grantfrom The Minneapolis Foundation
December, 1984
ACKNOWLEDGEMENTS
The Jobs Now Coalition would like to thank all theprivate employers who participated in the survey.We are grateful for the cooperation and assistanceprovided by the program administrators in the taskof data collection; the helpful suggestions ofProfessor J. Galaskiewicz, Department of Sociology,University of Minnesota, on the survey instrument;and the special effort made by Fred Matson, DeputyCoordinator, and JoAnne Jenko of MEED, in coordinatingthe data collection.
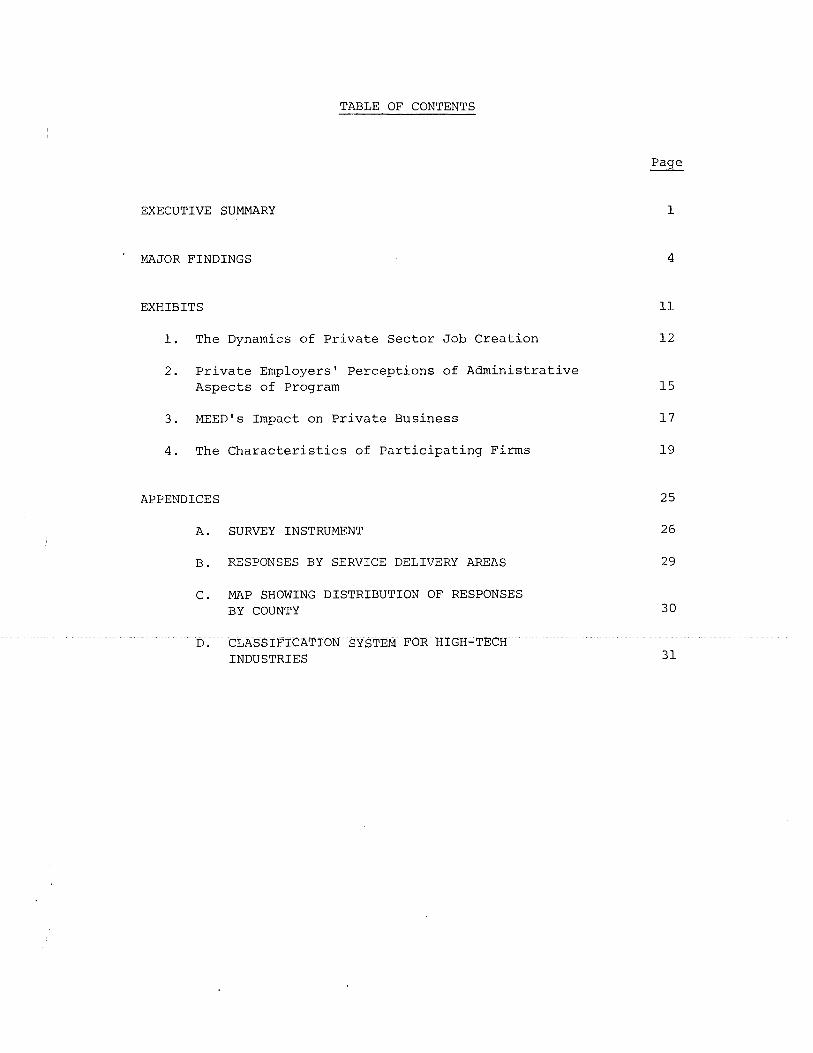
TABLE OF CONTENTS
EXECUTIVE SUMMARY
MAJOR FINDINGS
EXHIBITS
1. The Dynamics of Private Sector Job Creation
2. Private Employers' Perceptions of AdministrativeAspects of Program
3. MEED's Impact on Private Business
4. The Characteristics of Participating Firms
APPENDICES
A. SURVEY INSTRUMENT
B. RESPONSES BY SERVICE DELIVERY AREAS
C. MAP SHOWING DISTRIBUTION OF RESPONSESBY COUNTY
D. CLASSIFICATION SYSTEM FOR HIGH-TECHINDUSTRIES
1
4
11
12
15
17
19
25
26
29
30
31

E X E CUT I V E
- 1 -
SUMMARY
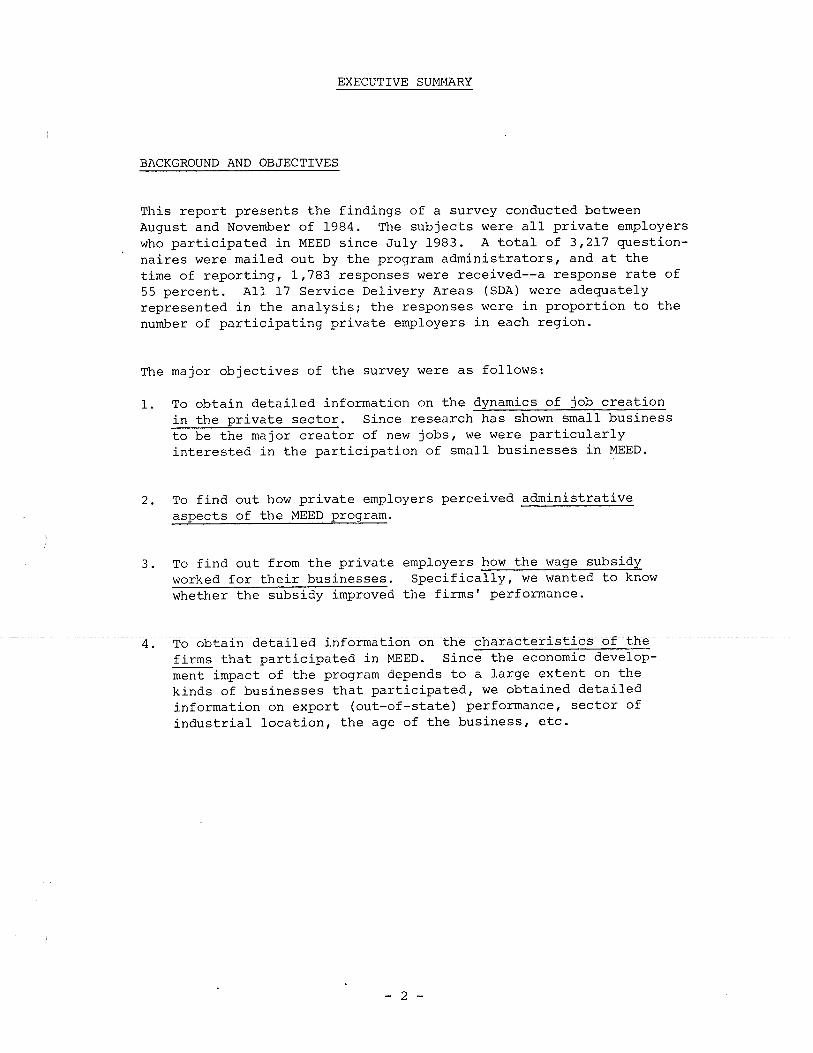
EXECUTIVE SUMMARY
BACKGROUND AND OBJECTIVES
This report presents the findings of a survey conducted betweenAugust and November of 1984. The subjects were all private employerswho participated in MEED since July 1983. A total of 3,217 questionnaires were mailed out by the program administrators, and at thetime of reporting, 1,783 responses were received--a response rate of55 percent. All 17 Service Delivery Areas (SDA) were adequatelyrepresented in the analysis; the responses were in proportion to thenumber of participating private employers in each region.
The major objectives of the survey were as follows:
1. To obtain detailed information on the dynamics of job creationin the private sector. Since research has shown small businessto be the major creator of new jobs, we were particularlyinterested in the participation of small businesses in MEED.
2. To find out how private employers perceived administrativeaspects of the MEED program.
3. To find out from the privateworked for their businesses.whether the subsidy improved
employers how the wage subsidySpecifically, we wanted to know
the firms' performance.
4. To obtain detailed iriformatiori ori the characteristics of thefirms that participated in MEED. Since the economic development impact of the program depends to a large extent on thekinds of businesses that participated, we obtained detailedinformation on export (out-of-state) performance, sector ofindustrial location, the age of the business, etc.
- 2 -
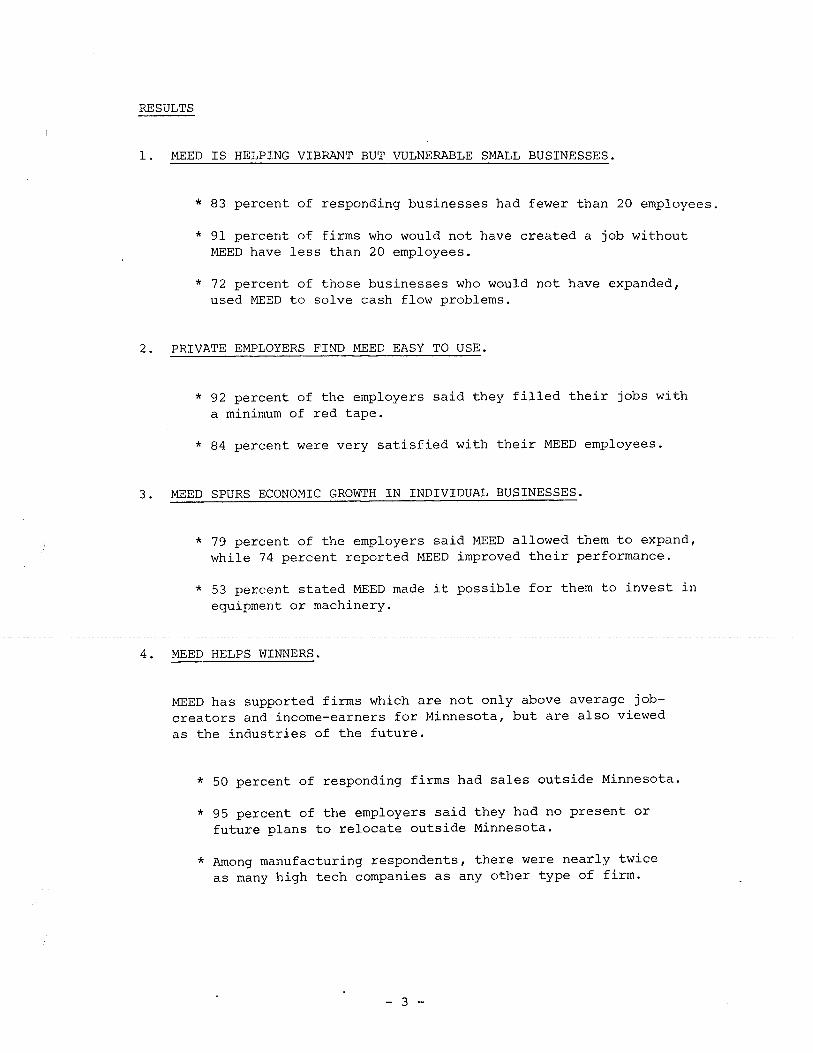
RESULTS
1. MEED IS HELPING VIBRANT BUT VULNERABLE SMALL BUSINESSES.
* 83 percent of responding businesses had fewer than 20 employees.
* 91 percent of firms who would not have created a job withoutMEED have less than 20 employees.
* 72 percent of those businesses who would not have expanded,used MEED to solve cash flow problems.
2. PRIVATE EMPLOYERS FIND MEED EASY TO USE.
* 92 percent of the employers said they filled their jobs witha minimum of red tape.
* 84 percent were very satisfied with their MEED employees.
3. MEED SPURS ECONOMIC GROWTH IN INDIVIDUAL BUSINESSES.
* 79 percent of the employers said MEED allowed them to expand,while 74 percent reported MEED improved their performance.
* 53 percent stated MEED made it possible for them to invest inequipment or machinery.
4. MEED HELPS WINNERS.
MEED has supported firms which are not only above average jobcreators and income-earners for Minnesota, but are also viewedas the industries of the future.
* 50 percent of responding firms had sales outside Minnesota.
* 95 percent of the employers said they had no present orfuture plans to relocate outside Minnesota.
* Among manufacturing respondents, there were nearly twiceas many high tech companies as any other type of firm.
- 3 -

M A J 0 R FIN DIN G S
- 4 -
MAJOR FINDINGS
1. MEED HELPS VIBRANT YET VULNERABLE SMALL BUSINESSES
* 95 percent of all responding businesses had fewer than 100employees, and 83.4 percent had fewer than 20 employees.
Research by MIT economist, David Birchl , as wellas studies by the Brookings Institute2 , have shownthat 78 to 82 percent of all new jobs in the nationare created by businesses with fewer than 100 employees. Businesses with fewer than 20 employeescreate 55 to 66 percent of all new jobs.
* 83.7 percent of the jobs created by the 1,769 respondents werein businesses with fewer than 100 employees. 60.4 percent ofthese jobs were in businesses with fewer than 20 employees.
The Small Business Administration (SBA)3 reports thatduring the 1980-82 recessions, small firms with fewerthan 20 employees generated virtually all of the 2.7million new jobs, offsetting the loss of 1.7 millionjobs incurred by large businesses. MEED is certainlyreaching the most prolific generators of jobs.
* 63 percent of the responding employers would not have expandedtheir workforce without the MEED wage subsidy.
* 90.6 percent of those who would not have expanded without thesubsidy were businesses with fewer than 20 employees.
* 72 percent of those businesses who would not have created jobswithout a subsidy cited a shortage of cash flow as the reason.The next most important factor was an inability to. affordtraining new employees.
While small businesses have the greatest potentialfor creating jobs, it is also true that they facethe greatest difficulty in acquiring capital.
- 5 -
Even growing, profitable firms have inadequate access
to equity and long-term debt. The reasons are several:small firms generally have fewer assets to mortgage,and banks have traditionally required their smallercustomers to pay higher interest rates than their"prime" clients.
In addition, tax credits are of little benefit to new,small firms that face a shortage of capital. Small,new firms seldom make a profit during their firstcouple of years. And even if they do, the firm mustwait a year before applying for a tax credit. Forsmall, job-creating firms, MEED may be one of the fewsources of working capital.
2. PRIVATE EMPLOYERS FIND MEED EASY TO USE
* 92 percent of the responding employers felt that they were ableto fill their jobs with a minimum of red tape.
* 84 percent of the respondents were very satisfied with theperformance of their MEED employees.
* 93.5 percent of the respondents found the rules easy to understand.
The above findings indicate that MEED has been successfulin overcoming the Achilles' heel of several employmentand training programs--the problem of attracting privateemployers. Too much paper work and excessive contactwith government agencies scared private employers awayin the case of several public programs (e.g., NAB-JOBS,CETA-OJT, early WIN programs)~ MEED has been able toovercome this major obstacle.
3. MEED SPURS ECONOMIC GROWTH IN INDIVIDUAL BUSINESSES
* 79 percent of the responding employers agreed that MEED enabledthem to expand their production or their scale of operations.
* 74 percent of the responding employers mentioned that the subsidyimproved the performance of their business.
* 52.5 percent of the respondents claimed that the subsidy made itpossible for them to invest in equipment and machinery.
- 6 -

* 46.5 percent of the respondents mentioned that the subsidy enabledthem to diversify into new areas.
The above findings indicate that MEED worked exactly likea capital subsidy, with two crucial differences. First,capital subsidies, unlike MEED, offer no guarantee ofjob creation. Second, with a wage subsidy, the jobs aretargeted at the unemployed who are most in need. Otherwise,from the private employer's point of view a dollar is adollar is a dollar •..
4. MEED HELPS WINNERS
Since MEED's impact on economic development depends to a great extenton the kinds of firms it served, we analyzed the characteristics of thefirms that participated in MEED. We found:
Exporters
* 49.6 percent of the responding firms sold goods/services outsideMinnesota.
* 74.1 percent of the exporting businesses had fewer than 20 employees.
Some critics have suggested that a wage subsidy would bedisproportionately used by declining firms, and that thesubsidy would merely delay the demise of industrial "losers."The above findings refute that argument. Firms that export,or sell goods or services out-of-state, not only add to theGross State Product (GSP) , but also increase local employment opportunities. Most economists assert that exportsare a key to economic growth.
Competitive Firms
* 88.9 percent of all responding employers felt that the performanceof their business over the past year was above average or average.
Manufacturing Firms
* 19 percent of the responding businesses were in the manufacturing
sector.
- 7 -
While only 8.6 percent of the firms in the SBA data baseSwere in manufacturing, MEED, although serving a similarclientele, served twice as many manufacturing firms.We should note that manufacturing employment is veryimportant from the point of view of economic developmentbecause of its multiplier effect, i.e., each job createdin manufacturing is expected to spin off at least threeother jobs in the service sector.
. High Technology Firms
* 17 percent of all manufacturers were "high technology" firms.
within the manufacturing sector, high technology accountedfor the largest number of firms--nearly twice as much asits nearest rival, printing and publishing. High technology firms are not only above-average income-earnersfor the state, but are also viewed as the industries ofthe future.
Retail and Service Firms
* 55 percent of all MEED respondents were in Services and Retail Trade.
* 44 percent of all Service firms were in Business, Professional andRelated Services.
MEED served about the same percent of Retail and Servicefirms as are represented in the SBA data base. 6 We shouldnote, however, that the large number of Service firms werein Business and Professional Services--industries that aremore likely to be export-oriented.
Job Creators and Job Retainers
* 52 percent of all responding firms were older than 5 years; 48percent were younger than 5 years.
Research shows that young firms face a very high probabilityof going out of business. Conversely, research also showsthat young firms are the most prolific in creating jobs.MEED has struck a judicious balance between those firmsthat are the greatest job creators (firms younger than 5years), and those that are older, and as a consequencemore stable.
- 8 -
Home-Grown and Employment-Centered Firms
* 95 percent of all responding employers stated that they had NOplans (short- or long-term) of relocating their business toanother state.
* 95.7 percent of all responding employers mentioned that they hadno plans of buying equipment or machinery that would reduce theirworkforce.
Since MEED is a response to an unemployment problemthat is caused in part by business relocation and theintroduction of labor-displacing machinery, we wantedto find out whether the participating firms had suchplans. The above findings indicate that MEED servedbusinesses which seem to be labor-intensive and arefirmly rooted in the state.
David Birch7 has shown that only 0.5 percent of the newjobs over a three-year period were found to result frominter-state migration of firms. Birch notes: "Development policies aimed at attracting new firms address avery small part of employment change, while policiesaimed at assisting firms already in the state or firmswanting to get started here, hit at the heart of thematter."
Government may give indiscriminate tax credits andcapital subsidies in the hope that jobs will eventually"trickle down." These policies may actually have anunintended consequence: labor-displacing investmentsmay occur. MEED offers an alternative model of economicdevelopment--employment-centered growth.
- 9 -

FOOTNOTES
1. Birch, David, "The Job Generation Process,"Mass: MIT, Program on Neighborhood & Regional Change, 1979.
2(a). Harris, Candee, "U.S. Establishment & Enterprise MicrodataDatabase Description," Brookings Institution, 1983.
2 (b). Armington, Catherine, "Business Microdata Project,"Washington, D.C.: The Brookings Institution, 1982.
3. The State of Small Business: A Report of the president,Transmitted to the Congress, March, 1984.
4. Bishop, John, "The Targeted Jobs Tax Credit: What Has BeenLearned," A Statement Before the Subcommittee on SelectRevenue Measures, Committee on Ways and Means, U.S. Houseof Representatives, April 10, 1984.
5. See (3) above.
6. See (3) above.
7. See (1) above.
- 10 -

E X H I BIT S
- 11 -
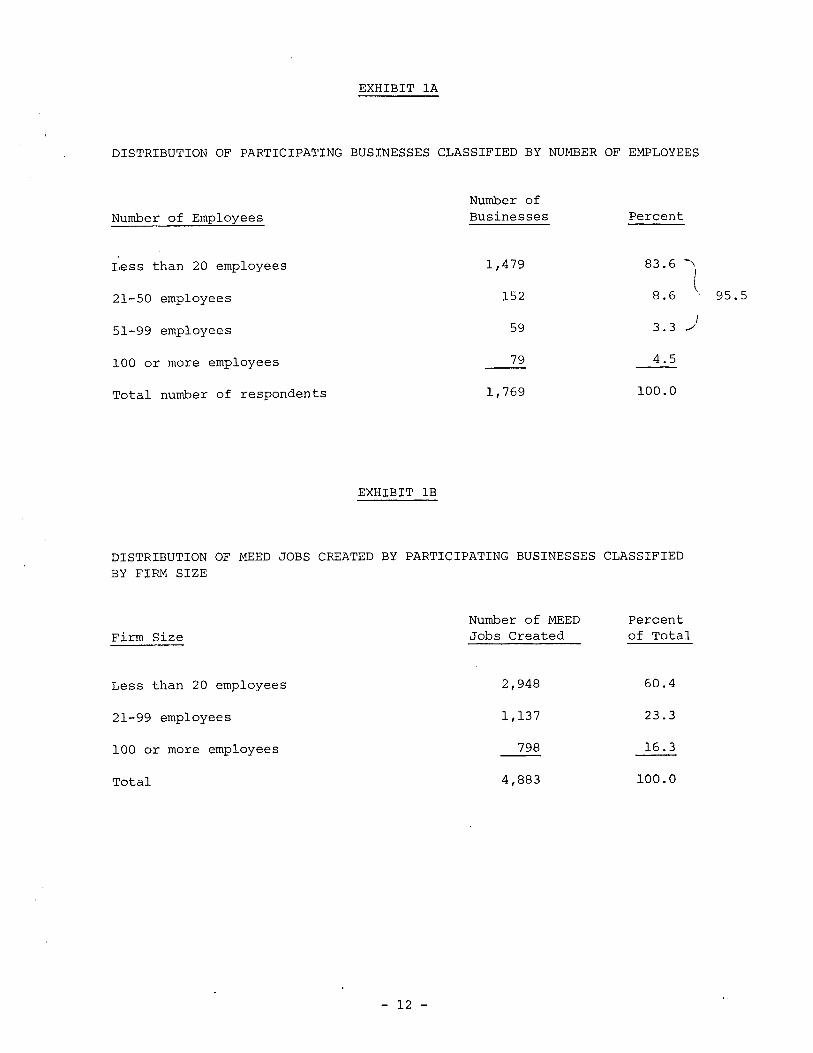
EXHIBIT lA
DISTRIBUTION OF PARTICIPATING BUSINESSES CLASSIFIED BY NUMBER OF EMPLOYEES
Number ofNumber of Employees Businesses Percent
Less than 20 employees 1,479 83.6 "\)
21-50 employees 152 8.6 ~. 95.5
51-99 employees 59 3.3 j
100 or more employees 79 4.5
Total number of respondents 1,769 100.0
EXHIBIT lB
DISTRIBUTION OF MEED JOBS CREATED BY PARTICIPATING BUSINESSES CLASSIFIEDBY FIRM SIZE
Number of MEED PercentFirm Size Jobs Created of Total
Less than 20 employees 2,948 60.4
21-99 employees 1,137 23.3
100 or more employees 798 16.3---Total 4,883 100.0
- 12 -

EXHIBIT 1C
PRIVATE EMPLOYERS' RESPONSE TO QUESTION:
WOULD YOU HAVE EXPANDED YOUR WORKFORCE TO ITS PRESENT SIZE WITHOUT THEMEED SUBSIDY?
Response
No, we would not have expanded ourworkforce to its present size withoutthe MEED subsidy
No, we would not have expanded asquickly as we did
Yes, we would have expanded ourworkforce to its present size withoutthe MEED subsidy
Total number of respondents
EXHIBIT 1D
Number ofEmployers
988
68
616
1,672
Percentof Total
59.1
4.1
36.8
100.0
BREAKDOWN OF BUSINESSES THAT SAID THEY WOULD NOT HAVE EXPANDED THEIRWORKFORCE WITHOUT MEED, CLASSIFIED BY FIRM SIZE
Number of PercentFirm Size Businesses of Total
Less than 20 employees 895 90.6
21-99 employees 75 7.6
100 or more employees 18 1.8
Total number of respondents 988 100.0
- 13 -
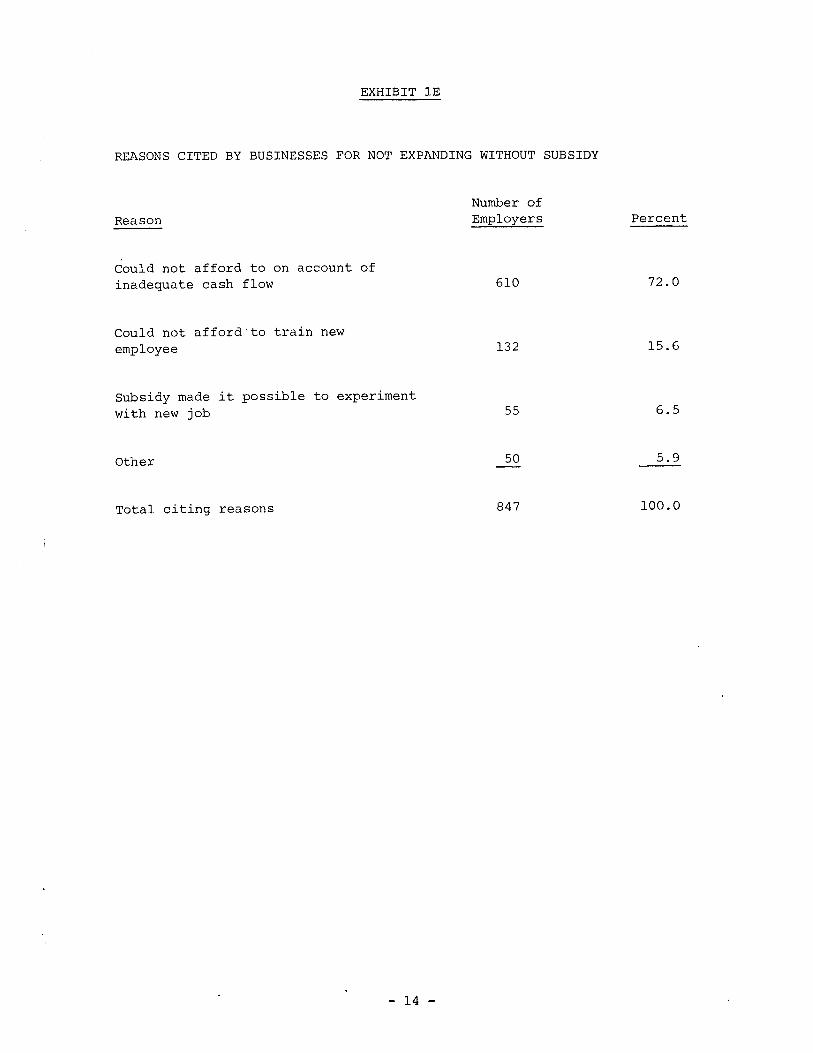
EXHIBIT IE
REASONS CITED BY BUSINESSES FOR NOT EXPANDING WITHOUT SUBSIDY
Reason
Could not afford to on account ofinadequate cash flow
Could not afford to train newemployee
Subsidy made it possible to experimentwith new job
Other
Total citing reasons
- 14 -
Number ofEmployers
610
132
55
50
847
Percent
72.0
15.6
6.5
5.9
100.0
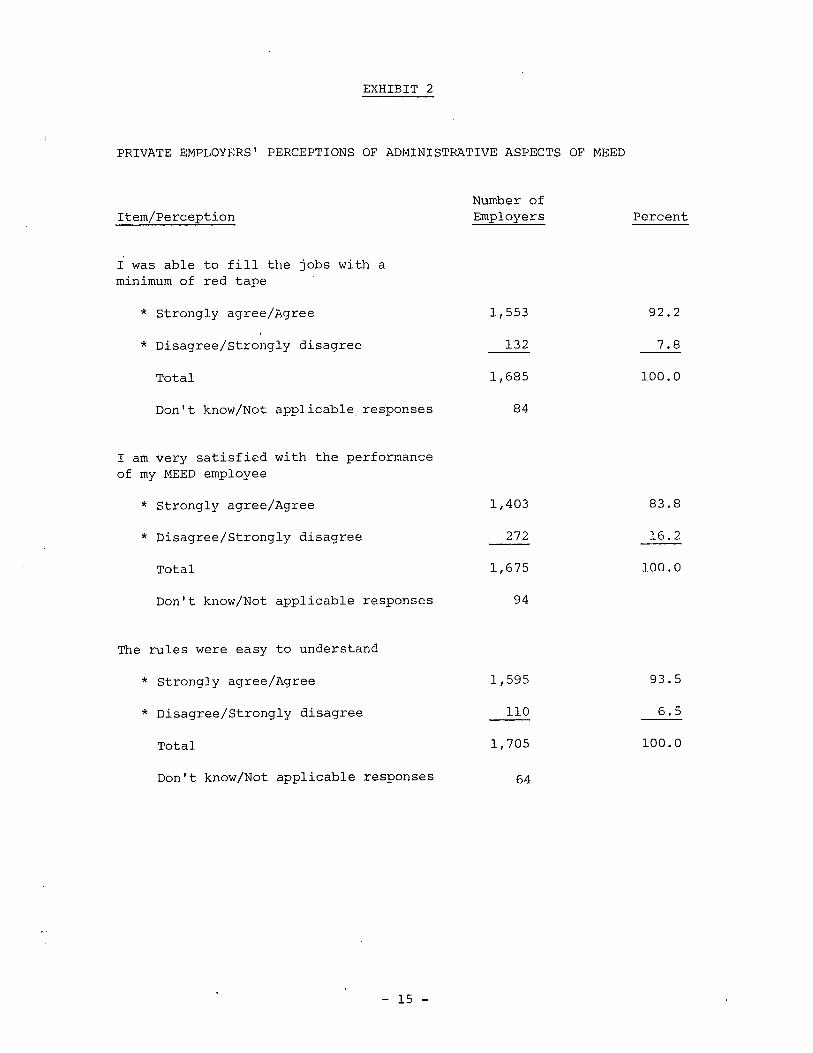
EXHIBIT 2
PRIVATE EMPLOYERS' PERCEPTIONS OF ADMINISTRATIVE ASPECTS OF MEED
Item/Perception
I was able to fill the jobs with aminimum of red tape
* Strongly agree/Agree
* Disagree/strongly disagree
Total
Don't know/Not applicable responses
I am very satisfied with the performanceof my MEED employee
* Strongly agree/Agree
* Disagree/Strongly disagree
Total
Don't know/Not applicable responses
The rules were easy to understand
* Strongly agree/Agree
* Disagree/Strongly disagree
Total
Don't know/Not applicable responses
- 15 -
Number ofEmployers
1,553
132
1,685
84
1,403
272
1,675
94
1,595
no
1,705
64
Percent
92.2
7.8
100.0
83.8
16.2
100.0
93.5
6.5
100.0
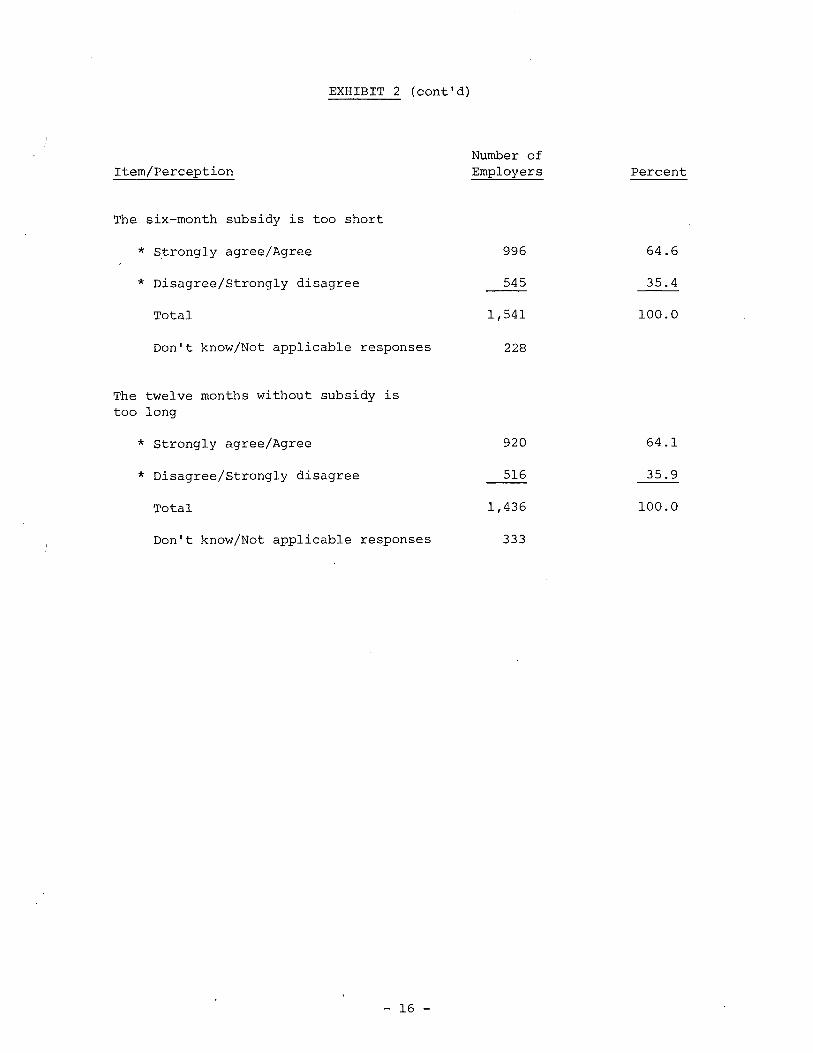
EXHIBIT 2 (cont'd)
Number ofItem/Perception Employers Percent
The six-month subsidy is too short
* Strongly agree/Agree 996 64.6
* Disagree/Strongly disagree 545 35.4
Total 1,541 100.0
Don't know/Not applicable responses 228
The twelve months without subsidy istoo long
* Strongly agree/Agree 920 64.1
* Disagree/Strongly disagree 516 35.9
Total 1,436 100.0
Don't know/Not applicable responses 333
- 16 -
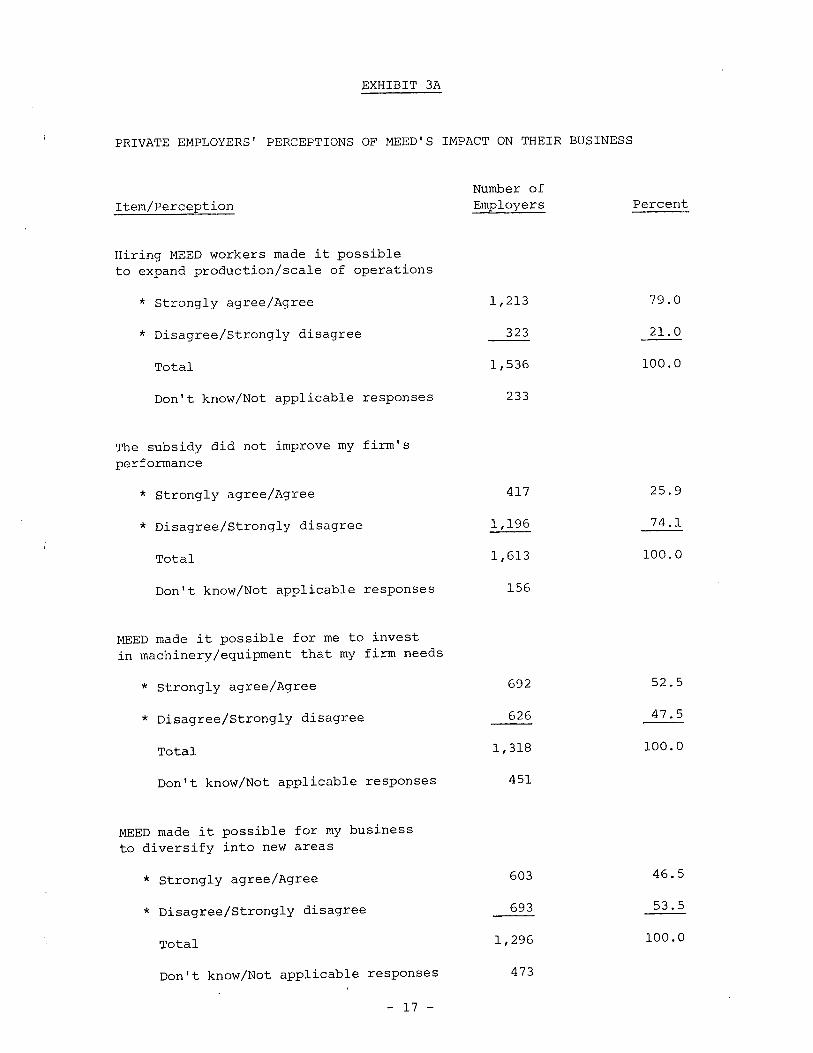
EXHIBIT 3A
PRIVATE EMPLOYERS' PERCEPTIONS OF MEED'S IMPACT ON THEIR BUSINESS
Item/Perception
Hiring MEED workers made it possibleto expand production/scale of operations
* Strongly agree/Agree
* Disagree/Strongly disagree
Total
Don't know/Not applicable responses
The subsidy did not improve my firm'sperformance
* Strongly agree/Agree
* Disagree/Strongly disagree
Total
Don't know/Not applicable responses
MEED made it possible for me to investin machinery/equipment that my firm needs
* strongly agree/Agree
* Disagree/Strongly disagree
Total
Don't know/Not applicable responses
MEED made it possible for my businessto diversify into new areas
* strongly agree/Agree
* Disagree/Strongly disagree
Total
Don't know/Not applicable responses
- 17 -
Number ofEmployers
1,213
323
1,536
233
417
1,196
1,613
156
692
626
1,318
451
603
693
1,296
473
Percent
79.0
21.0
100.0
25.9
74.1
100.0
52.5
47.5
100.0
46.5
53.5
100.0
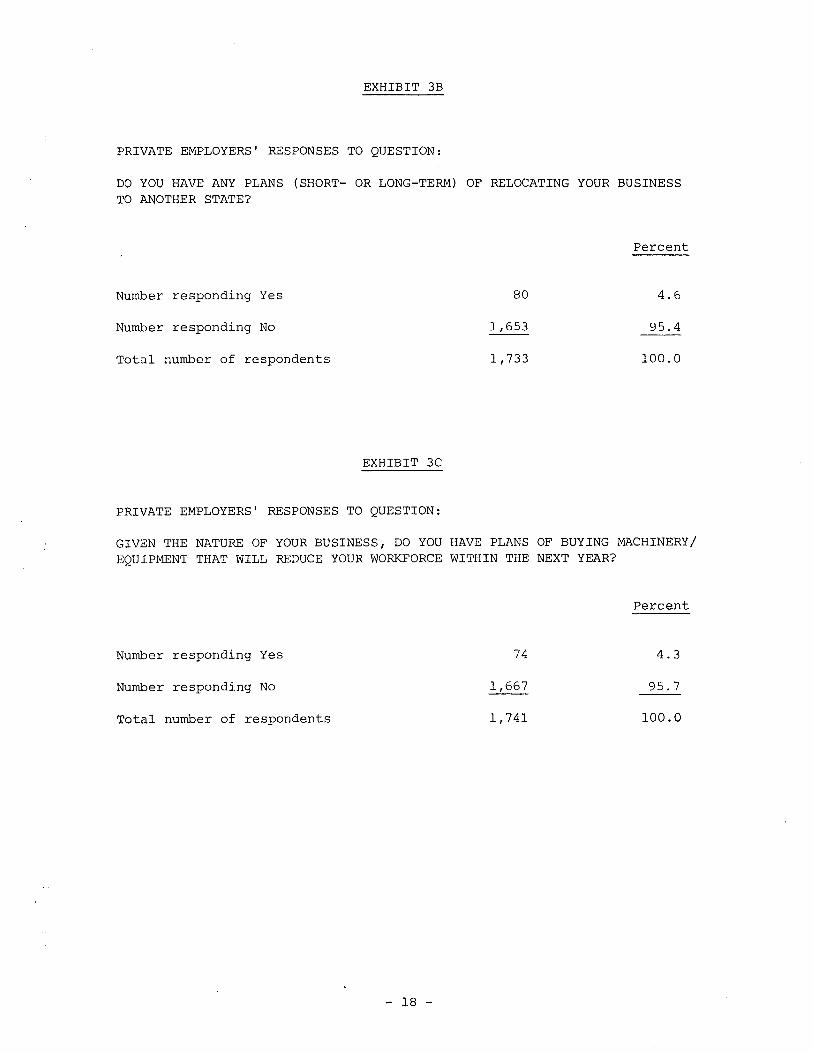
EXHIBIT 3B
PRIVATE EMPLOYERS' RESPONSES TO QUESTION:
DO YOU HAVE ANY PLANS (SHORT- OR LONG-TERM) OF RELOCATING YOUR BUSINESSTO ANOTHER STATE?
Percent
Number responding Yes
Number responding No
Total number of respondents
EXHIBIT 3C
PRIVATE EMPLOYERS' RESPONSES TO QUESTION:
80
1,653
1,733
4.6
95.4
100.0
GIVEN THE NATURE OF YOUR BUSINESS, DO YOU HAVE PLANS OF BUYING MACHINERY/EQUIPMENT THAT WILL REDUCE YOUR WORKFORCE WITHIN THE NEXT YEAR?
Percent
Number responding Yes
Number responding No
Total number of respondents
- 18 -
74
1,741
4.3
95.7
100.0
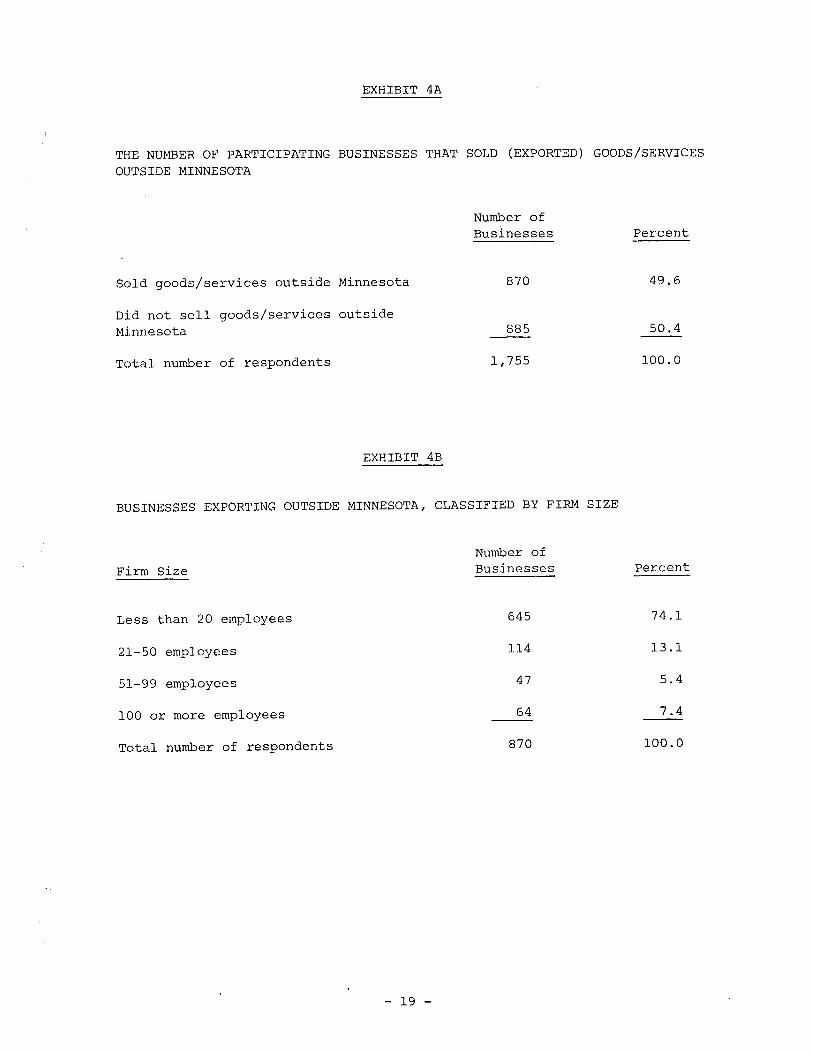
EXHIBIT 4A
THE NUMBER OF PARTICIPATING BUSINESSES THAT SOLD (EXPORTED) GOODS/SERVICESOUTSIDE MINNESOTA
Number ofBusinesses Percent
Sold goods/services outside Minnesota 870 49.6
Did not sell goods/services outsideMinnesota 885 50.4
Total number of respondents 1,755 100.0
EXHIBIT 4B
BUSINESSES EXPORTING OUTSIDE MINNESOTA, CLASSIFIED BY FIRM SIZE
Number ofFirm Size Businesses Percent
Less than 20 employees 645 74.1
21-50 employees 114 13.1
51-99 employees 47 5.4
100 or more employees 64 7.4
Total number of respondents 870 100.0
- 19 -
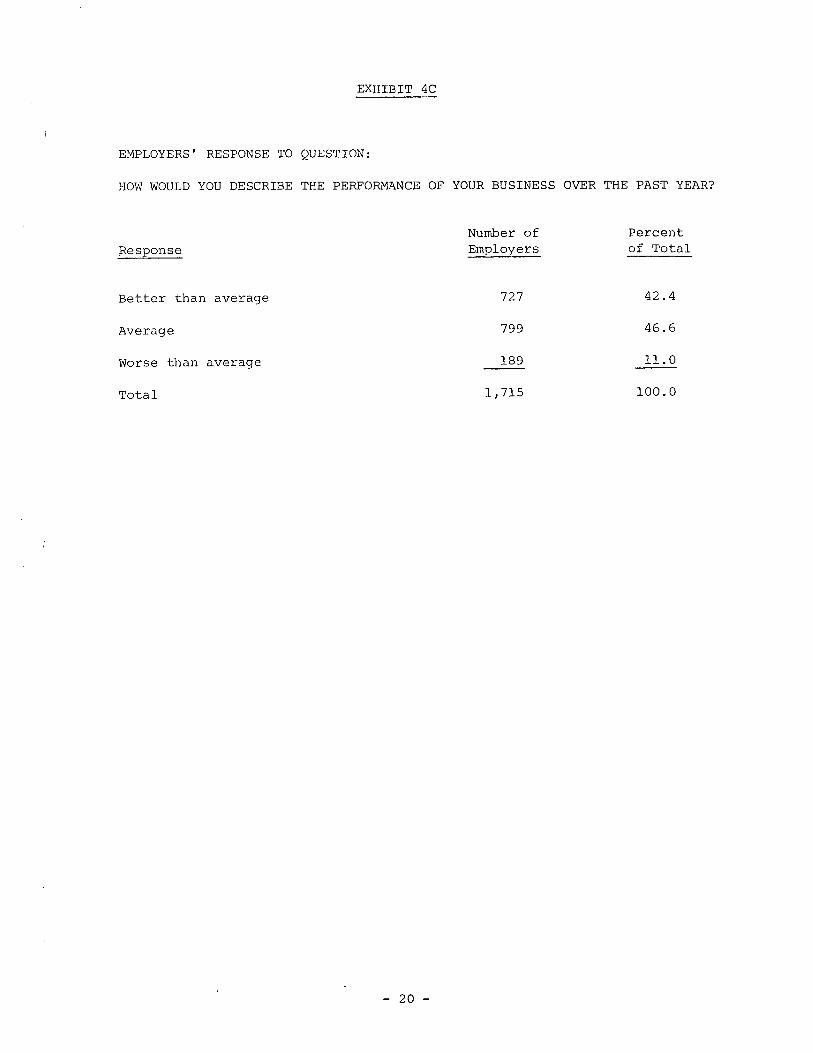
EXHIBIT 4C
EMPLOYERS' RESPONSE TO QUESTION:
HOW WOULD YOU DESCRIBE THE PERFORMANCE OF YOUR BUSINESS OVER THE PAST YEAR?
Number of Percent,Response Employers of Total
Better than average 727 42.4
Average 799 46.6
Worse than average 189 11.0
Total 1,715 100.0
- 20 -
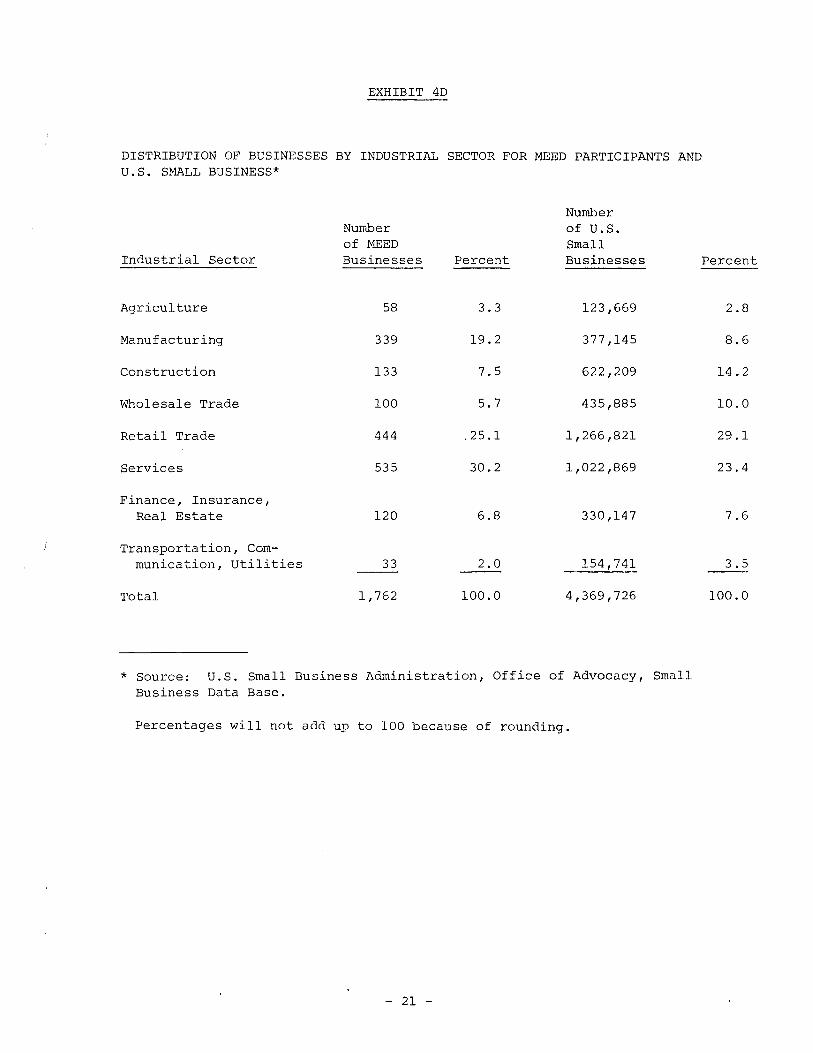
EXHIBIT 4D
DISTRIBUTION OF BUSINESSES BY INDUSTRIAL SECTOR FOR MEED PARTICIPANTS ANDU.S. SMALL BUSINESS*
Industrial Sector
Agriculture
Manufacturing
Construction
Wholesale Trade
Retail Trade
Services
Finance, Insurance,Real Estate
Transportation, Communication, utilities
Total
Numberof MEEDBusinesses
58
339
133
100
444
535
120
33
1,762
Percent
3.3
19.2
7.5
5.7
.25.1
30.2
6.8
2.0
100.0
Numberof U.S.SmallBusinesses
123,669
377 ,145
622,209
435,885
1,266,821
1,022,869
330,147
154,741
4,369,726
Percent
2.8
8.6
14.2
10.0
29.1
23.4
7.6
3.5
100.0
* Source: U.S. Small Business Administration, Office of Advocacy, SmallBusiness Data Base.
Percentages will not add up to 100 because of rounding.
- 21 -
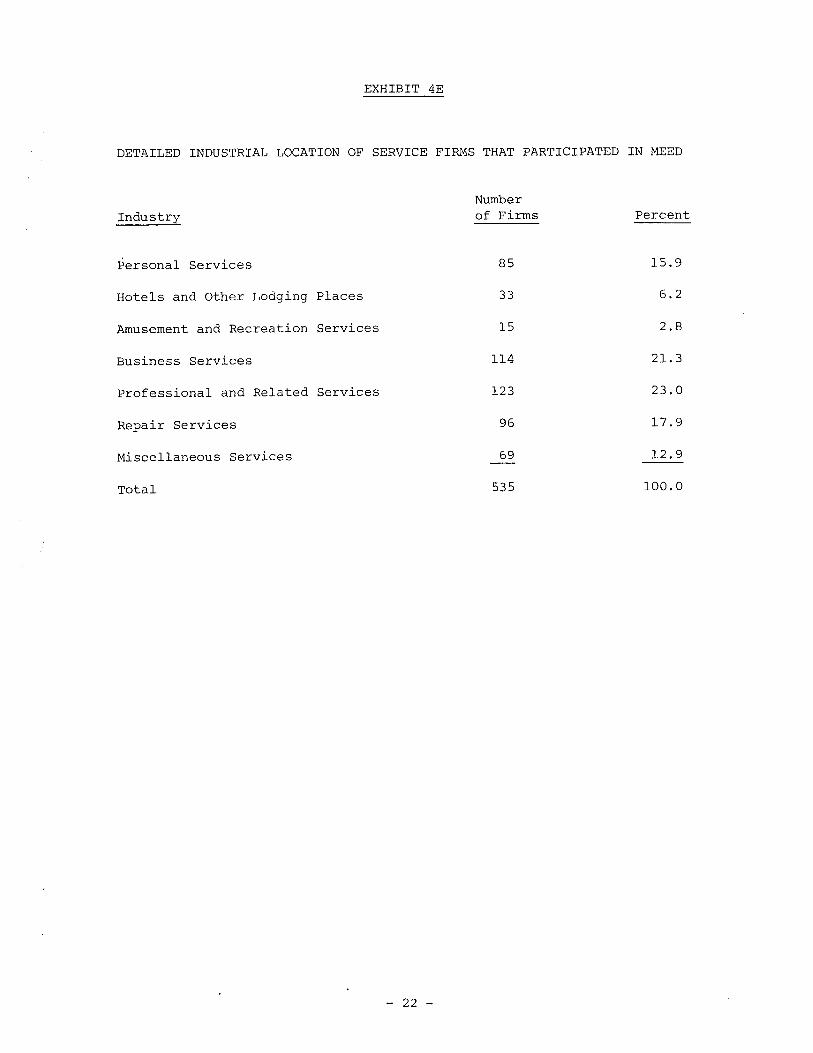
EXHIBIT 4E
DETAILED INDUSTRIAL LOCATION OF SERVICE FIRMS THAT PARTICIPATED IN MEED
NumberIndustry of Finns Percent
Personal Services 85 15.9
Hotels and Other Lodging Places 33 6.2
Amusement and Recreation Services 15 2.8
Business Services 114 21.3
Professional and Related Services 123 23.0
Repair Services 96 17.9
Miscellaneous Services 69 12.9
Total 535 100.0
- 22 -
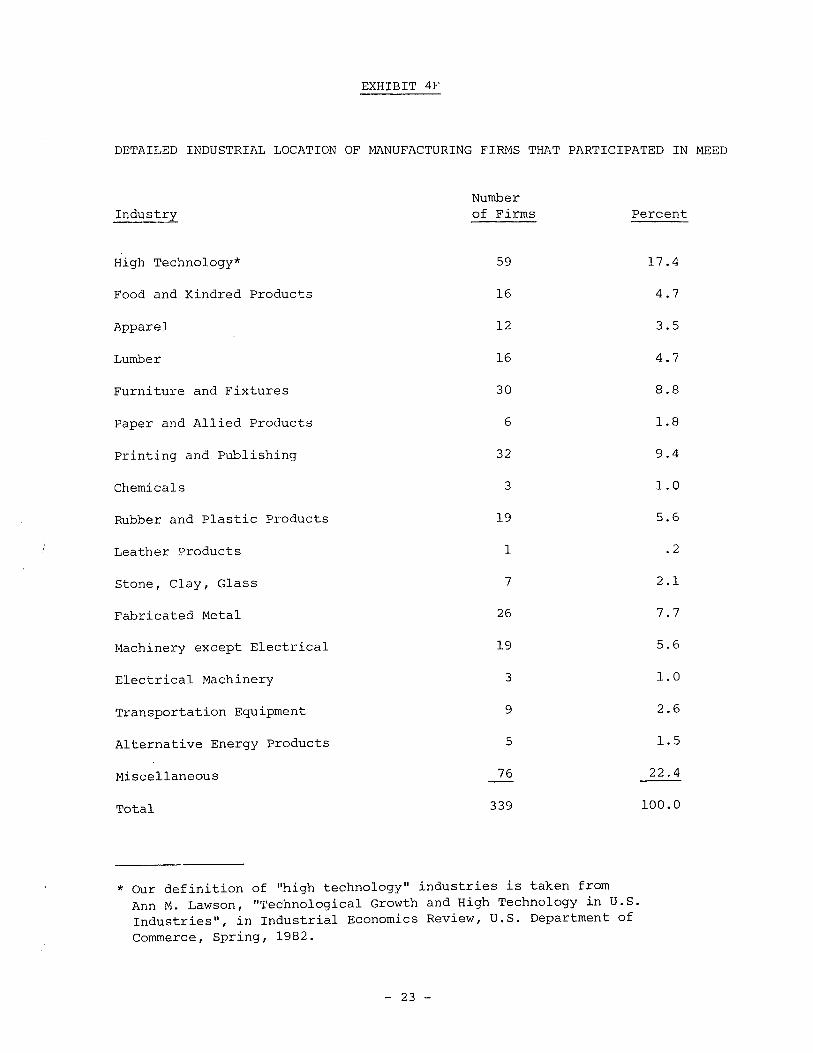
EXHIBIT 4F
DETAILED INDUSTRIAL LOCATION OF MANUFACTURING FIRMS THAT PARTICIPATED IN MEED
Industry
High Technology*
Food and Kindred Products
Apparel
Lumber
Furniture and Fixtures
Paper and Allied Products
Printing and Publishing
Chemicals
Rubber and Plastic Products
Leather Products
Stone, Clay, Glass
Fabricated Metal
Machinery except Electrical
Electrical Machinery
Transportation Equipment
Alternative Energy Products
Miscellaneous
Total
Numberof Firms
59
16
12
16
30
6
32
3
19
1
7
26
19
3
9
5
76
339
Percent
17 .4
4.7
3.5
4.7
8.8
1.8
9.4
1.0
5.6
.2
2.1
7.7
5.6
1.0
2.6
1.5
22.4
100.0
* Our definition of "high technology" industries is taken fromAnn M. Lawson, "Technological Growth and High Technology in U.S.Industries", in Industrial Economics Review, U.S. Department ofCommerce, Spring, 1982.
- 23 -
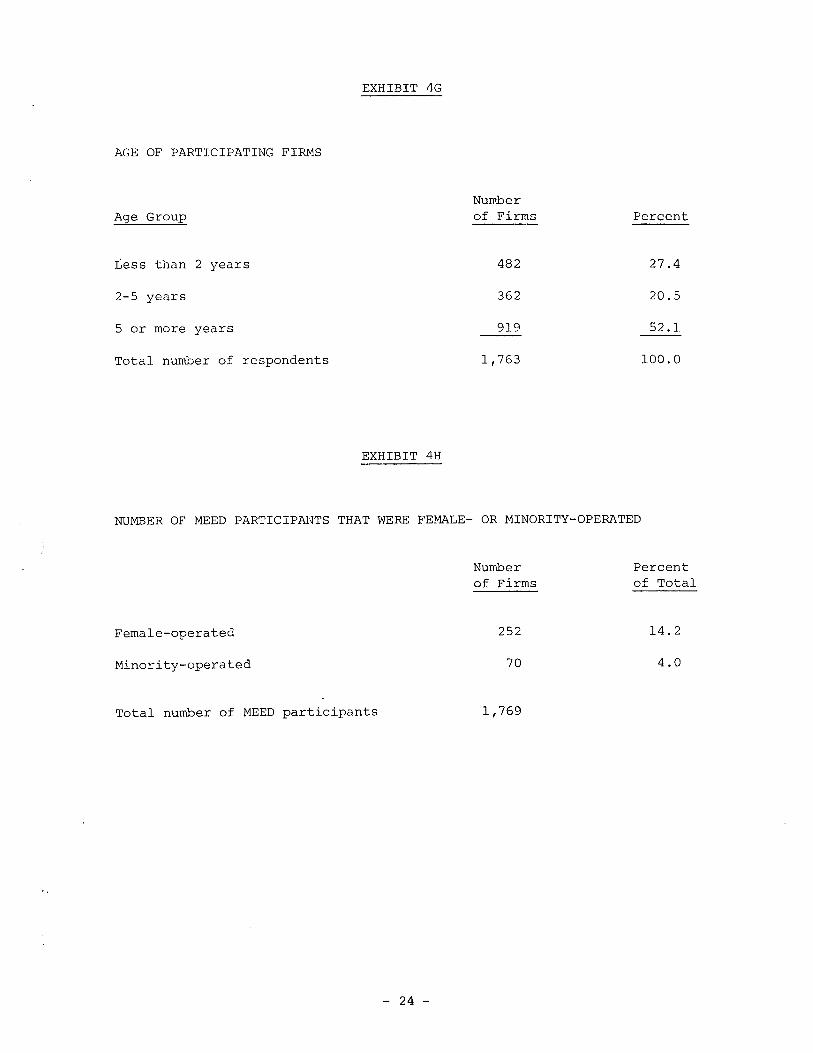
EXHIBIT 4G
AGE OF PARTICIPATING FIRMS
NumberAge Group of Firms Percent
Less than 2 years 482 27.4
2-5 years 362 20.5
5 or more years 919 52.1
Total number of respondents 1,763 100.0
EXHIBIT 4H
NUMBER OF MEED PARTICIPANTS THAT WERE FEMALE- OR MINORITY-OPERATED
Female-operated
Minority-operated
Total number of MEED participants
- 24 -
Numberof Firms
252
70
1,769
Percentof Total
14.2
4.0

A P PEN DIe E S
- 25 -
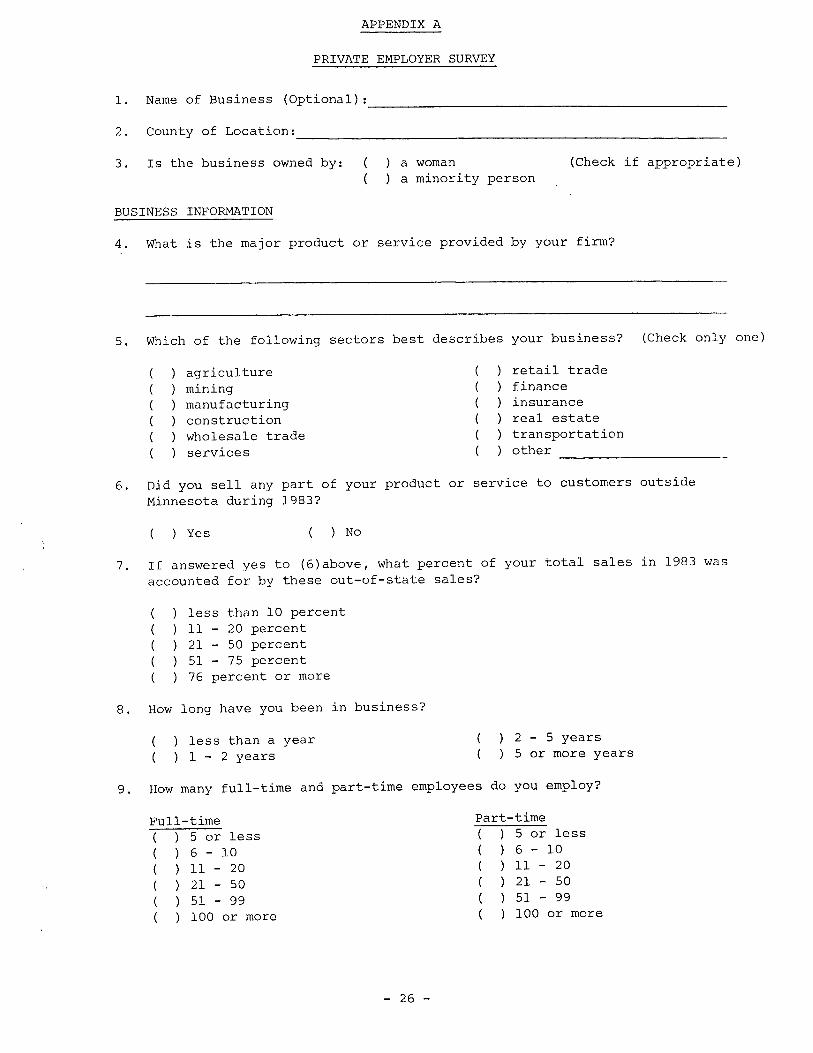
APPENDIX A
PRIVATE EMPLOYER SURVEY
1. Name of Business (Optional):------------------------2. County of Location:------------------------3. Is the business owned by:
BUSINESS INFORMATION
a womana minority person
(Check if appropriate)
4. What is the major product or service provided by your firm?
5. Which of the following sectors best describes your business? (Check only one)
agricultureminingmanufacturingconstructionwholesale tradeservices
retail tradefinanceinsurancereal estatetransportationother
6. Did you sell any part of your product or service to customers outsideMinnesota during 1983?
) Yes ) No
7. If answered yes to (6)above, what percent of your total sales in 1983 wasaccounted for by these out-of-state sales?
less than 10 percent11 - 20 percent21 - 50 percent51 - 75 percent76 percent or more
8. How long have you been in business?
less than a year1 - 2 years
2 - 5 years5 or more years
9. How many full-time and part-time employees do you employ?
Full-time) 5 or less) 6 - 10) 11 - 20) 21 - 50) 51 - 99) 100 or more
- 26 -
Part-time5 or less6 - 1011 - 2021 - 5051 - 99100 or more
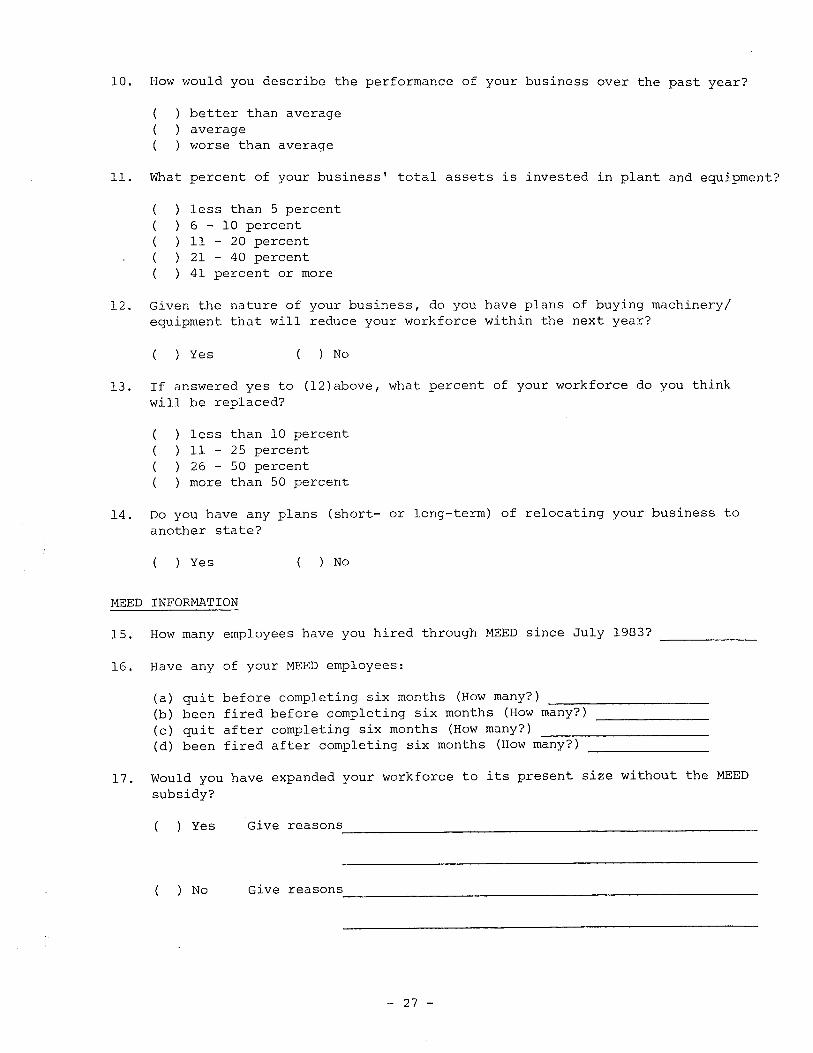
10. How would you describe the performance of your business over the past year?
better than averageaverageworse than average
11. What percent of your business' total assets is invested in plant and equipment?
less than 5 percent6 - 10 percent11 - 20 percent21 - 40 percent41 percent or more
12. Given the nature of your business, do you have plans of buying machinery/equipment that will reduce your workforce within the next year?
) Yes ) No
13. If answered yes to (12)above, what percent of your workforce do you thinkwill be replaced?
less than 10 percent11 - 25 percent26 - 50 percentmore than 50 percent
14. Do you have any plans (short- or long-term) of relocating your business toanother state?
) Yes
MEED INFORMATION
) No
15. How many employees have you hired through MEED since July 1983? -------
16. Have any of your MEED employees:
(a) quit before completing six months (How many?)(b) been fired before completing six months (How many?)(c) quit after completing six months (How many?)(d) been fired after completing six months (How many?)
17. Would you have expanded your workforce to its present size without the MEEDsubsidy?
) Yes
) No
Give reasons---------------------------
Give reasons---------------------------
- 27 -
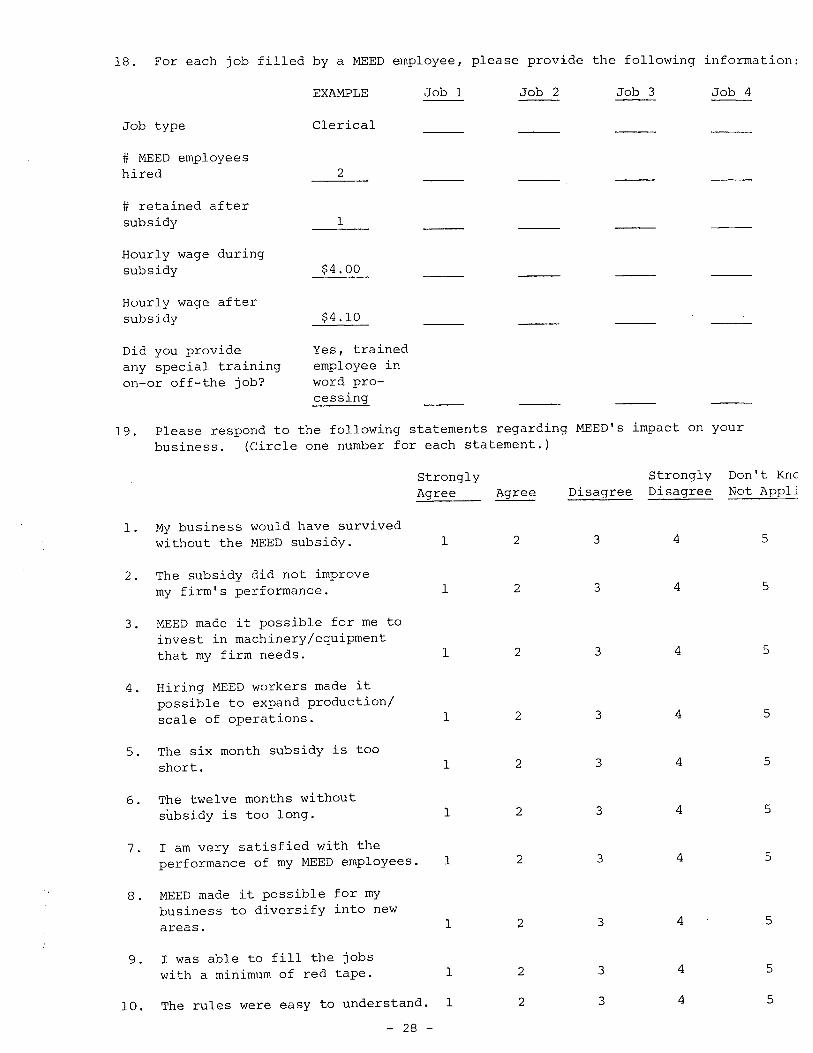
18. For each job filled by a MEED employee, please provide the following information:
Job type
# MEED employeeshired
# retained aftersubsidy
Hourly wage duringsubsidy
Hourly wage aftersubsidy
Did you provideany special trainingon-or off-the job?
EXAMPLE
Clerical
2
1
$4.00
$4.10
Yes, trainedemployee inword processing
Job 1 Job 2 Job 3 Job 4
19. Please respond to the following statements regarding MEED's impact on yourbusiness. (Circle one number for each statement.)
StronglyAgree Agree Disagree
stronglyDisagree
Don't KncNot Appli
1. My business would have survivedwithout the MEED subsidy.
2. The subsidy did not improvemy firm's performance.
3. MEED made it possible for me toinvest in machinery/equipmentthat my firm needs.
4. Hiring MEED workers made itpossible to expand production/scale of operations.
5. The six month subsidy is tooshort.
6. The twelve months withoutsubsidy is too long.
7. I am very satisfied with theperformance of my MEED employees.
8. MEED made it possible for mybusiness to diversify into newareas.
1
1
1
1
1
1
1
1
2
2
2
2
2
2
2
2
3
3
3
3
3
3
3
3
4
4
4
4
4
4
4
4
5
5
5
5
5
5
5
5
9. I was able to fill the jobswith a minimum of red tape. 1
10. The rules were easy to understand. 1
- 28 -
2
2
3
3
4
4
5
5
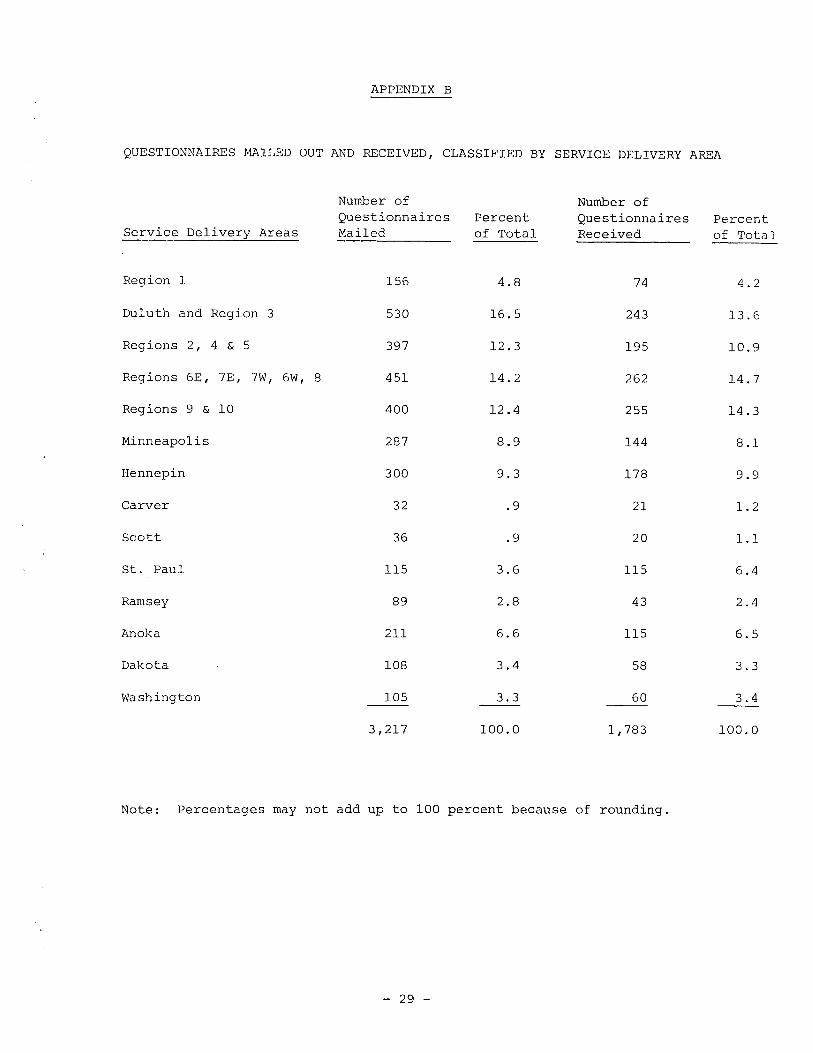
APPENDIX B
QUESTIONNAIRES MAILED OUT AND RECEIVED, CLASSIFIED BY SERVICE DELIVERY AREA
Number ofQuestionnaires
service Delivery Areas Mailed--'----'------
Region 1 156
Duluth and Region 3 530
Regions 2, 4 & 5 397
Regions 6E, 7E, 7W, 6W, 8 451
Regions 9 & 10 400
Minneapolis 287
Hennepin 300
Carver 32
Scott 36
st. Paul 115
Ramsey 89
Anoka 211
Dakota 108
Washington 105
3,217
Percentof Total
4.8
16.5
12.3
14.2
12.4
8.9
9.3
.9
.9
3.6
2.8
6.6
3.4
3.3
100.0
Number ofQuestionnairesReceived
74
243
195
262
255
144
178
21
20
115
43
115
58
60
1,783
Percentof Total
4.2
13.6
10.9
14.7
14.3
8.1
9.9
1.2
1.1
6.4
2.4
6.5
3.3
3.4
100.0
Note: Percentages may not add up to 100 percent because of rounding.
- 29 -
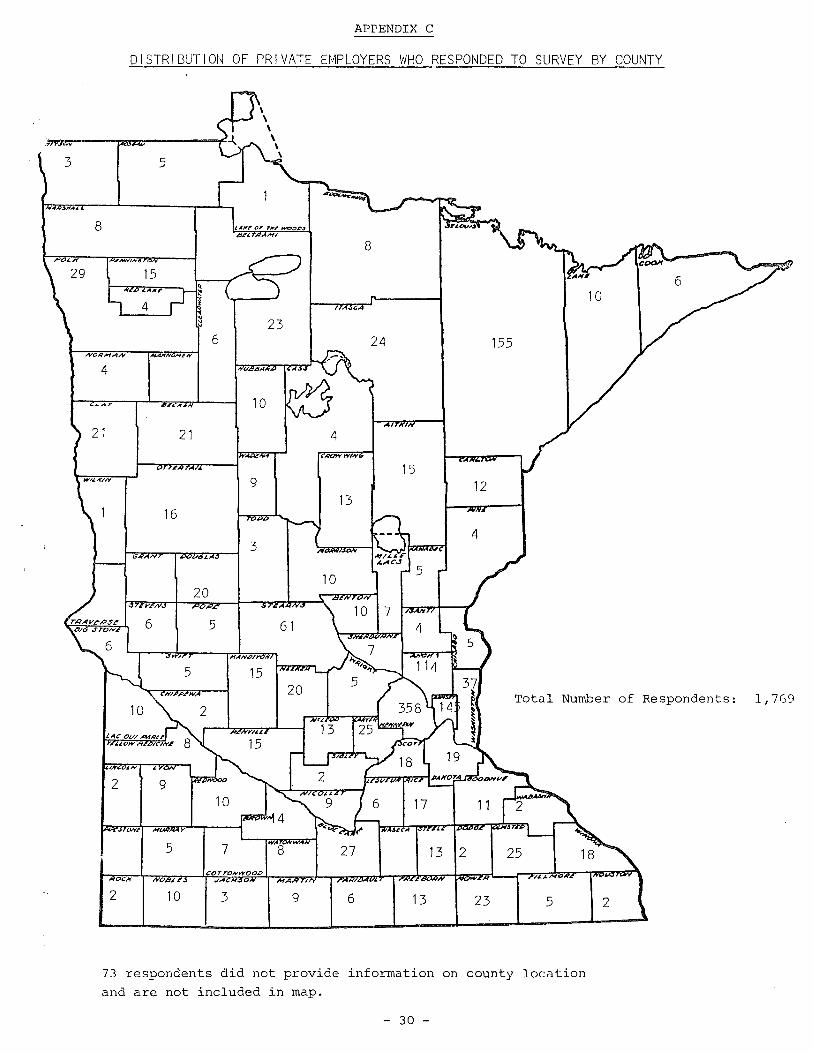
APPENDIX C
DISTRIBUTION OF PRIVATE EMPLOYERS WHO RESPONDED TO SURVEY BY COUNTY
5
8
N.VlN6
15~
~
I
236 24 155
O,q;tAh -"ANN EN
4 " .sA
....... ~t:",IR 10
21 4..... ftl1C)WWIN
r. 159 12
1316
43
6J.
20TEV.
6 5 61
HAN~J/ N.
5 1520
Total Number of Respondents: 1,769
~u
'" <N
2 9
17
TONE '" Y
5 7 13 2 25cor roN II'YOOD ilL J. MOOCIr NOO.£:5 .IA H 0 M IN W
2 10 3 9 6 13 23 5 2
73 respondents did not provide information on county location
and are not included in map.
- 30 -

APPENDIX D
CLASSIFICATION SYSTEM FOR HIGH-TECH INDUSTRIES
Drugs
Petroleum Refining
Ordnance and Accessories
Office Computing and Accounting Machines
Electronic Computing Equipment
Electric Transmission and Dist. Equipment
Electrical Industrial Appliances
Household Appliances
Electric Lighting and Wiring Equipment
Radio and TV Receiving Equipment
Communications Equipment
Electronic Computing Accessories
Misc. Electrical Machinery/Equipment/Supplies
Engineering, Laboratory, Scientific and Research Instruments and Equipment
Measuring and Controlling Equipment
Optical Instruments and Lenses
Surgical, Medical, and Dental Instruments and Supplies
Opthalmic Goods
photographic Equipment
Watches, Clocks, etc.
Source: Ann M. Lawson, "Technological Growth and High Technology inU.S. Industries," in Industrial Economics Review, U.S. Dept.of Commerce, Spring, 1982.
- 31 -