EDUCATION SECTOR ANALYSIS - IIPE Pôle de Dakar · PDF fileMin-Hajj (IT specialists ......
48
Regional Bureau for Education in Africa Tanzania Beyond Primary Education, the Quest for Balanced and Efficient Policy Choices for Human Development and Economic Growth EDUCATION SECTOR ANALYSIS EXECUTIVE SUMMARY
Transcript of EDUCATION SECTOR ANALYSIS - IIPE Pôle de Dakar · PDF fileMin-Hajj (IT specialists ......

Regional Bureaufor Education in Africa
TanzaniaBeyond Primary Education, the Quest for Balanced and EfficientPolicy Choices for Human Development and Economic Growth
EDUCATION SECTOR ANALYSIS
EXECUTIVE SUMMARY

The findings, interpretations, and conclusions expressed in this volume do not necessarily reflect the views of theExecutive Director of UNESCO or the Government of Mainland Tanzania.

TanzaniaBeyond Primary Education, the Quest for Balanced and
E�cient Policy Choices for Human Developmentand Economic Growth
EXECUTIVE SUMMARY
EDUCATION SECTOR ANALYSIS
Regional Bureaufor Education in Africa
2011
Tanzania Education Sector Analysis4
AcknowledgmentsThis Education Sector Analysis was prepared through a close collaborative effort by thegovernment of Tanzania, the Pôle de Dakar (UNESCO/BREDA), the UNESCO Institute ofStatistics, and the UNESCO Dar es Salaam cluster office.
The government team consisted of staff from the different ministries in charge of education,led by the Ministry of Education and Vocational Training (MoEVT), as well as other ministriesand departments, including the Ministry of Community Development, Gender and Children(MCDGC), the Ministry of Finance and Economic Affairs (MoFEA), the Prime Minister’s Officefor Regional Administration and Local Government (PMO-RALG), the National ExaminationsCouncil of Tanzania (NECTA), the National Council for Technical Education (NACTE), theTanzania Commission for Universities (TCU), the Vocational Education and Training Authority(VETA), the National Bureau of Statistics (NBS) and the Bureau for Educational Research andEducation of the University of Dar es Salaam (BERE/UDSM), which was instrumental infacilitating all theoretical workshops.
The government team was successively led by Cyprian Miyedu, former Chief of theMonitoring and Evaluation (M&E) Section, Department of Policy and Planning of MoEVT,the late George Maliga, Chief of the M&E Section of MoEVT, and Muhwela Kalinga, ActingChief, M&E Section, under the overall leadership of Professor H.O. Dihenga, the PermanentSecretary of MoEVT. Related administrative issues were handled by Mr Malili and Ms Levira.For Chapters 1 and 3, the government ESA team consisted of Ms Baitwa (Chapters head,Budget and Finance Division, MoEVT), Ms Elinzu (NBS), Mr Kitali (PMO-RALG), Ms Luena(EMIS, MoEVT), Mr Minja (Administration and Personnel, MoEVT), Mr Mtyama (MoEFA), MsOmolo (TMC-DPLO/LGA Temeke District Council) and Mr Zullu (Administration andPersonnel, MoEVT). Mr Pambe (Chapters head, Primary Education, MoEVT), Ms Kiisheweko(TCU), Ms Levira (Adult Education, MoEVT), Mr Maiga (Adult Education, MoEVT), MrMchunguzi (Higher Education, MoEVT), Ms Sigwejo (NACTE), Mr Saro (FDC, MCDGC) andMr Wilberforce (EMIS, MoEVT) constituted the government team for Chapters 2 and 5. Theteam for Chapter 6 included Mr Mhagama (Chapter head, VETA Division, MoEVT), MrMisana (Technical Education, MoEVT), Mr Malili (Higer Education, MoEVT), Mr Mwakapalala(NBS), Mr Ndamgoba (FDC, MCDGC), Mr Petro (EMIS, MoEVT) and Mr Sunday (MIS,MCDGC). The government team for Chapters 4, 7 and 8 was composed of Mr Mwenda(Chapters head, Secondary Education, MoEVT), Mr Gabriel (LGA Bagamoyo, PMO-RALG),
Ack
now
legd
men
ts

Tanzania Education Sector Analysis 5
Mr Kinunda (Higher Education, MoEVT), Mr Nzoka (Teacher Training, MoEVT), Mr Mbowe(NECTA), Ms Mrigo (Administration and Personnel, MoEVT), Mr Pambe (Primary Education,MoEVT), Mr Ponera (EMIS, MoEVT) and Mr Shauri (Primary Education, MoEVT). Chapter 7received additional inputs from staff from the Inspection Department of MoEVT.
The Pôle de Dakar (UNESCO/BREDA) team consisted of Borel Foko (Team Leader, EducationPolicy Analyst) and Diane Coury (Education Policy Analyst), under the overall guidance ofJean-Pierre Jarousse (former Head of the Pôle de Dakar) and Mohammed Bougroum (Headof the Pôle de Dakar). Inputs were also provided by Pôle’s members, Alain Patrick NkengneNkengne, Mireille Harivola Ravelojaona and Ibrahima Dao.
The team received constant support from the UIS team of the UNESCO Dar es Salaam clusteroffice, which consisted of Marc Bernal (UIS Regional Advisor for Eastern and SouthernAfrica), Criana Connal (former EMIS Programme Specialist) and Erick Makoye and AbdulatifMin-Hajj (IT specialists). Special thanks are due to Marc Bernal and Criana Connal whoprovided strong support and facilitated the policy dialogue throughout the process.
The UNESCO Dar es Salaam cluster office was also instrumental in the effective elaborationof the ESA. The team would particularly like to thank Min Jeong Kim (Education ProgrammeSpecialist) who helped complete the process and Flora Rusenene and Rahma Islem for theirconstant administrative support. Special thanks are due to Barnaby Rooke for the editingwork and Regis L’Hostis for the graphic design.
The team received valuable comments from the peer reviewers Criana Connal, Jean-PierreJarousse, Jean-Marc Bernard, Agripina Habicht, Monica Githaiga, and Joseph Vere, as wellas from the development partner groups led by Corey Huntington (Canadian HighCommission).
The preparation of this report was funded by the Education Management InformationSystem (EMIS) Programme, financially supported by multiple donors, under theadministrative responsibility of the UIS/UNESCO-Dar es Salaam cluster office, and by thePôle de Dakar (UNESCO/BREDA).

Tanzania Education Sector Analysis6
Foreword
This education sector analysis (ESA) for mainland Tanzania is a detailed analyticaldocument that offers a comprehensive picture of mainland Tanzania’s educationsector. The main purpose of an ESA (also known as Country Status Report, or CSR)is to provide an evidence-based diagnosis of an education sector, to enabledecision-makers to orient national policies. It also provides relevant analytical
information to nourish the dialogue between the government and education sectorstakeholders, including development partners. In the current development context, markedby the necessity for countries to develop sound, sustainable and credible strategies andplans in which education is embedded, ESAs represent a valuable and essential tool.
This is the second ESA for Tanzania; the first one having been conducted in 2001. Althoughits main objective is to provide a comprehensive picture of the education system in 2009(the last year for which statistics were available), it also provides some analysis of theevolution of the system over the decade, when feasible and relevant. This second report isalso more than an update. It provides more in-depth analysis on certain aspects of thesystem: detailed unit costs by subsector, external efficiency, quality and out-of-school, andtechnical education and vocational training and higher education in particular. It provideskey monitoring and evaluation inputs on the education sector as a whole, that areparticularly valuable in the framework of the implementation of the Education SectorDevelopment Programme.
This 2011 ESA was carried out between February 2009 and November 2010 by a multi-ministerial national team with the support of the Pôle de Dakar (UNESCO/BREDA) and theUNESCO Institute of Statistics. It was part of the activities conducted under the EducationSector Management Information System (ESMIS) Programme,1 one goal of which is tosupport the development of capacities in data analysis using data generated by the ESMISand other sources to strengthen sector-wide planning and policy reforms. The ESA processcontributed to the strategy for building capacities in data analysis through a combinationof: (i) learning-by-doing, through a series of workshops, and (ii) theoretical training sessions,offered in parallel to the workshops by the Bureau of Educational Research and Evaluationof the University of Dar es Salaam (BERE/UDSM), based on the SAMES2 materials providedby the Pôle de Dakar.
Fore
wor
d
Tanzania Education Sector Analysis 7
The analyses presented in this ESA were made possible by using existing data andinformation from multiple sources, and more particularly: school administrative surveysconducted by the Ministry of Education and Vocational Training (BEST, TCU and NACTEdata); household budget, labor force, demographic and health surveys conducted by theNational Bureau of Statistics; and SACMEQ data on learning achievements, includingexamination data from NECTA. Macroeconomic data and government finance statistics wereprovided by MoFEA, and specific data were made available from VETA and the HESLB.Obtaining timely (household surveys, SACMEQ, and payroll data) and reliable key data (EMISdata were fraught with flaws) was a major constraint that has heavily limited the scope ofsome analyses. Nevertheless, some important conclusions have been reached, both on theachievement front, and on the major challenges faced by the education system.
The 2011 ESA has highlighted some interesting achievements, including:
• Sustained economic growth and greater public resources have translated into a relativelyhigher education budget. The government spent 4.3 percent of GDP on education inFY 2008/09 (from a low 2.5 percent in FY 2000/01), much more than countries withsimilar levels of development. Education has also been given high budget priority. Thesector benefited from 26.5 percent of recurrent government expenditure after debtservice in FY 2008/09, well above the African low-income countries’ average of 21.4percent;
• Tanzania is on track to achieve the millennium development goal of universal primaryeducation. Access is almost universal and the primary completion rate is close to 90percent. The fee-free primary education policy has had a positive impact by boostingboth access and retention. Tanzania’s preprimary gross enrollment ratio is close to 37percent, compared with just 20 percent on average for comparable African countries.Tanzania’s administration of this level, using similar teaching approaches as for theprimary cycle and similar school premises, has helped to lower unit costs and increaseenrollment;

• Enrollment has increased for all cycles, and particularly in higher education, allowingTanzania to rapidly catch up with the levels of comparable developing countries: in 2009,the number of higher education students in Tanzania was 36 percent lower than theaverage, down from 50 percent in 2006. This trend is likely to continue as a directconsequence of the expected development of secondary education;
• The Tanzanian higher education and TVET sectors are well positioned to adequatelymanage the development and diversification of supply. Existing policies and regulatorybodies provide a sufficient, solid and modern institutional framework for the system tobuild upon for its future development;
• Education has a significant impact on social and human development, particularly onliteracy, poverty, fertility, and maternal and child health. Primary education is the levelthat has the greatest impact on social outcomes: it contributes to almost 60 percent ofthe total impact, which further reinforces the justification for sustained efforts to ensurethat all Tanzanian children complete at least the primary cycle; and
• Education responds to labor market needs. Greater levels of education lead to higherincomes. The wage premium for workers with secondary education is particularlysignificant, suggesting that there is a severe shortage of individuals with secondaryqualifications. There is also a strong connection between vocational training andgraduates’ employment. In general, the income of VET graduates compares favorablywith that of self-employed individuals with primary education or O-Level secondary.
The 2011 ESA also points to key challenges in the coming years for the development of theeducation sector in Tanzania, including:
• Achieving greater efficiency gains (or implementing cost-saving strategies) in the use ofpublic education resources. Indeed, it is unlikely that the current level of budget prioritygiven to the education sector will be maintained over the next decade, due to competingdemands by health, agriculture and infrastructure;
• Increasing the public resources allocated to secondary education. Tanzania’s secondarycycle receives 35 percent less funding than countries who are equally close to achievinguniversal primary education. This situation should be carefully reviewed to avoidaffecting quality as the sector expands. Secondary schools already display high pupil toteacher ratios (49 to 1);
• Ensuring children enter primary school at the right age. Approximately 13 percent ofprimary school-aged children were still out of school in 2006, 88 percent of which hadnever attended. Although poverty is a constraint, age appeared to be the main reasonfor nonattendance. Late primary entry is common (only 36 percent of Standard Istudents were of official school age _ seven years _ in 2006) and is known to have adetrimental impact on schooling paths;
Tanzania Education Sector Analysis8
Fore
wor
d

• Improving access to and retention in secondary cycles. Although considerableimprovements in access to secondary school have been noted, especially at O-Level,they are still limited. In 2009, half of children had access to O-Level and 23 percent wereable to reach the last grade of the cycle, up from just eight percent in 2003. A-Levelaccess is still strikingly low, at five percent. Whereas lack of supply is a major hindranceto O-Level and A-Level access, economic difficulties and cultural issues among certainpopulation groups also contribute to fragile school demand. The policy to have asecondary school in each ward has had a very positive impact on secondary access andon primary retention rates;
• Supporting pro-poor schooling. Important disparities in access exist according to genderand area of residence, and they increase with successive levels of education, but themost discriminatory factor in schooling patterns is families’ level of income. It has alsobeen shown that households’ contributions to education are still significant at theprimary level (equivalent to a quarter of public resources), despite the fee-free primaryeducation policy. Furthermore, disadvantages tend to be cumulative. Poor rural girls facethe worst access and retention conditions;
• Taking affirmative action to enhance girls’ participation in school to ensure gender parityat postprimary levels. Insistence on girls fulfilling their traditional role in society, earlymarriage and pregnancy all favor dropout. Trends could be reversed by: (i) awarenessraising campaigns to sensitize parents on the value of educating girls beyond primary,and on the negative impact of early marriage and pregnancy on schooling and femalehealth; (ii) greater numbers of female teachers and the provision of community-basedhostels to avoid girls the long journeys to and from school, addressing security concerns;and (iii) scholarships and cash transfers targeting bright girls, reducing direct andopportunity costs, mirroring the government’s programme targeting the most talentedprimary graduates from poorer backgrounds;
• Improving pedagogical management to raise the quality of basic education. Althoughthe improvement dynamic observed in primary education learning outcomes between2000 and 2007 is very encouraging, and better than in neighboring countries, learningachievements are still modest by international standards. In addition, nationalexamination pass rates are dropping, and the results of those who graduate are low,especially at primary and O-Level;
• Reducing disparities between regions, districts and schools, that persist despitedecentralization, highlighting the need for effective planning and monitoring tools toallocate education inputs more efficiently. A decentralized information and monitoringsystem could help by providing decision makers with timely, accurate and reliable data onthe education sector. In addition to an EMIS system, financial and human resourcemanagement systems would improve fiscal management and accountability. A firstresponse to this challenge was given in 2009, with the development of a pilot decentralizedBasic-Education Management Information System (BE-MIS). Tested in 28 district councilsin 14 regions, the BE-MIS is to be scaled up to all councils nationwide by 2014; and
Tanzania Education Sector Analysis 9

• Adequate planning of TVET and higher education expansion. The increase in primaryand secondary school enrollments is already placing much strain on secondary, TVETand higher education institutions. An urgent response is required to ensure the smoothand manageable development of these subsectors.
The challenges faced by higher education are of particular importance:
• It is essential that funding mechanisms be improved. Higher education is blatantlyinefficient, paying little attention to potential economies of scale. In addition,approximately 28 percent of the level’s budget is devoted to badly targeted socialexpenditures, particularly loans transferred directly to students: 48 percent of studentsbenefit from a loan, yet less than 10 percent come from the poorest quintiles, whichcalls for an improvement in the loan targeting mechanisms; and
• Students’ career objectives and the distribution of graduates by subject area must beadjusted, to achieve better relevancy of higher education programmes to the labormarket and enable Tanzania to keep abreast of rapid technological development andneeds. Science subjects in particular attract too few students (only 24 percent ofstudents for the 2007/08 academic year, down from 34 percent in 2003/04). Adequateanalytical tools should be implemented, such as labor market tracer surveys.
Technical education and vocational training will also be key to Tanzania’s development.Some of the key required actions that this ESA highlights for the subsector include:
• Strengthening the subsector’s coordination mechanisms. Although regulatory andquality assurance bodies provide important guarantees for the controlled developmentof the TVET subsector, it still faces a series of challenges, including: (i) the diversity oftraining demand linked to the heterogeneity of the target population; (ii) the institutionalfragmentation of technical education, under the umbrella of various ministries; (iii) thefragmentation of vocational education and training service delivery, involving twoministries and a parastatal agency; and (iv) the practical continuity between vocationaland technical curricula and programmes, although theoretically bridges do exist, asdefined by the national qualifications’ framework;
• Revising subsector budget trade-offs. The Tanzanian TVET system as a whole is not asunderfunded as in many other African countries. However, technical nonhighereducation absorbs almost 57 percent of all TVET resources, against just 37 percent forvocational training, and six percent for folk education. This funding imbalance shouldbe reduced in order to scale-up vocational education and training activities; and
Tanzania Education Sector Analysis10
Fore
wor
d

• Defining a funding formula to rationalize the allocation of resources among technicalinstitutions. Surprisingly, it has been noticed that planning and welfare courses are twiceas expensive as health and allied science courses. However, even for a given subjectarea, and among institutions with comparable levels of enrollment, variations in theresources allocated are sizeable. This situation merits an improved funding formula andfor more coordination in planning and budgeting among parent ministries.
More broadly, this ESA offers valuable and comprehensive resources to anyone interestedin the education sector in Tanzania. It is however a snapshot of the system at a particulartime. As the sector makes progress in implementing its sector plan, this report’s findingsare therefore likely to become outdated, although many features will remain valid. It is thehope of both the Ministry of Education and development partners that this document willbe of use to all stakeholders in the education sector.
Tanzania Education Sector Analysis 11
Dr. ShukuruKawambwa (MP)P)Minister of Education andVocational TrainingTanzania
Vibeke JensenDirector
and RepresentativeUNESCO Dar es Salaam
Office for Comoros,Madagascar,
Mauritius, Seychellesand Tanzania
Ann Therese Ndong-JattaDirector
Regional Bureaufor Education in Africa
UNESCO
1 The Education Sector Management Information System (ESMIS) Programme is implemented by the government of Tanzania withthe financial and technical support of development partners (the European Union, UNESCO, UNICEF, and UNFPA), within theoverall framework of the Education Sector Development Programme for 2008-17. The UNESCO Institute of Statistics is providingtechnical assistance through its permanent Dar es Salaam cluster office.
2 The Sectoral Analysis and Management of the Education System (SAMES), also known as the PSGSE (Politiques Sectorielles etde Gestion des Systèmes Educatifs) is a masters degree offered by the University Cheikh Anta Diop of Dakar (Senegal) with thesupport of the Pôle de Dakar, targeting Ministry of Education staff and other actors working in the field of education in Africa.The training is currently available in French. An English course is currently under development with the University of The Gambia.For the purpose of this ESA, all training modules were translated into English and made available to BERE.

Tanzania Education Sector Analysis12
Abbreviations
Abb
revi
atio
ns
ACSEE
AE/NFE
BE-MIS
BERE
BEST
BREDA
CBET
COBET
CSEE
ESA
ECCD
EMIS
ESMIS
FDC
GDP
GER
IIEP
ILFS
HBS
HESLB
HLI
LGA
LIC
MCDGC
MoEVT
MoFEA
Advanced Certificate of Secondary Education Examination
Adult Education and Nonformal Education
Basic Education - Management Information System
Bureau of Educational Research and Evaluation
Basic Education Statistics in Tanzania
Regional Bureau for Education in Africa
Competence Based Education and Training
Complementary Basic Education in Tanzania
Certificate of Secondary Education Examination
Education Sector Analysis
Early Childhood Care and Development
Education Management Information System
Education Sector Management Information System
Folk Development College
Gross Domestic Product
Gross Enrollment Rate
International Institute for Educational Planning
Integrated Labor Force Survey
Household Budget Survey
Higher Education Student Loan Board
Higher Learning Institution
Local Government Authority
Low-Income Country
Ministry of Community Development, Gender and Children
Ministry of Education and Vocational Training
Ministry of Finance and Economic Affairs

Tanzania Education Sector Analysis 13
MRY
NACTE
NBS
NECTA
NGO
PEDP
PMO-RALG
PSLE
PTR
SACMEQ
SADC
TCU
TDHS
TE
TVET
UDSM
UIS
UNESCO
VET
VTC
Most Recent Year
National Council for Technical Education
National Bureau of Statistics
National Examinations Council of Tanzania
Nongovernmental Organization
Primary Education Development Plan
Prime Minister’s Office - Regional Administration and Local Government
Primary School Leaving Examination
Pupil to Teacher Ratio
The Southern and Eastern Africa Consortium for Monitoring Educational Quality
Southern African Development Community
Tanzania Commission for Universities
Tanzania Demographic and Health Survey
Technical Education
Technical and Vocational Education and Training
University of Dar es Salaam
UNESCO Institute of Statistics
United Nations Educational, Scientific, and Cultural Organization
Vocational Education and Training
Vocational Training Center

Executive Summary1. In a context of high demographic pressure, Tanzania has mobilized important
public resources to adequately address the growing demand for education.
The total population is expected to grow by 32 percent between 2010 and 2020. Over thesame period, the under 15 years age-group will remain constant at 44.2 percent of the total.The primary school-aged population (seven to 13 years) is projected to reach 10.2 million by2020, corresponding to an additional 1.8 million children compared with 2009.
Tanzania Education Sector Analysis14
The government has given high budget priority to the education sector: in FY 2008/09,education was allocated about 26.5 percent of government recurrent expenditure after debtservice, higher than the East African Community average (25.1 percent), and than the otherAfrican low-income countries’ average (21.4 percent). In terms of GDP, the increase issignificant: from 2.5 percent of GDP in FY 2000/01 to 4.3 percent of GDP in FY 2008/09, avalue that is also higher than the average for all African low-income countries (3.3 percent).
Population (million)
Annual Growth Rate (%)
Sex Ratio (number of boys per 100 girls)
Population Under 15 Years (% of total)
Urban Population (% of total)
Demographic Trends and Projections, 1967-2020
12.3
n.a.
95.2
—
6.4
34.4
3.0
96.0
46.5
23.1
43.2
2.9
96.9
44.4
26.3
Census-Years
1967 2002 2010 2020
NBS-Projections
57.1
2.8
98.6
44.2
29.7
2000/01
2004/05
2008/09
Percentage of Actual Public Expenditure Allocated to Education
—
16.6
6.1
—
1.19
0.56
—
20.4
18.2
RecurrentExpenditure
DevelopmentExpenditure
TotalExpenditure
% of Total
24.3
23.3
26.5
% of Total,(after debt)
2.5
3.1
4.3
% of GDP % of GDP % of Total % of GDP
—
4.3
4.9
Source: NBS data and projections (NBS, 2006; URT, 2005); and authors’ estimates.
Source: Authors’ calculations based on Tables 1.3, 1.4, 1.5 and 1.6.
Exec
utiv
e S
umm
ary
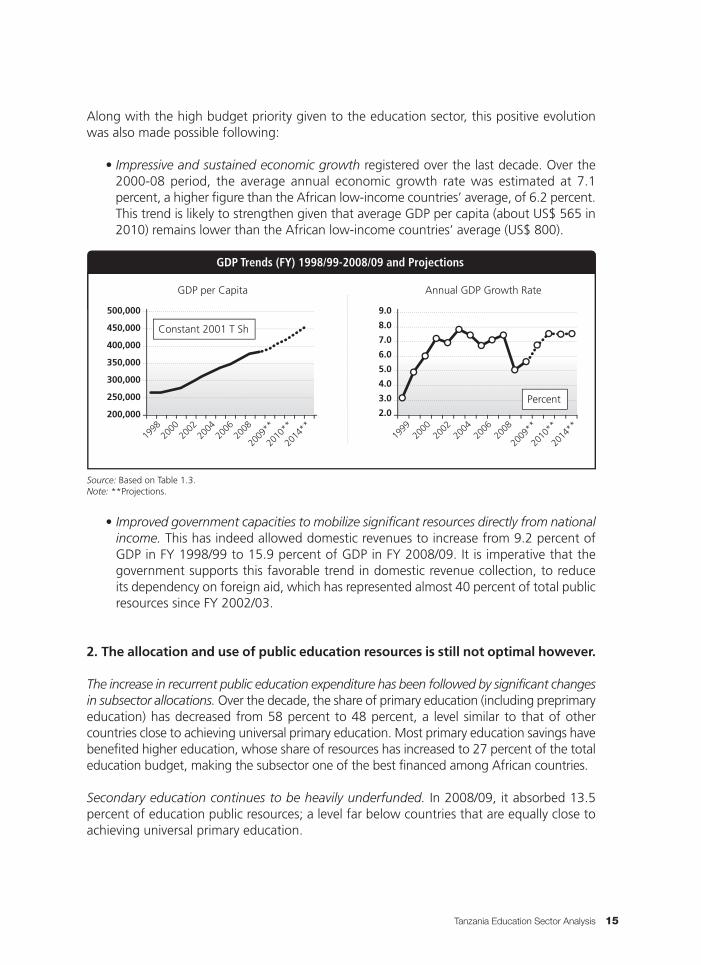
• Improved government capacities to mobilize significant resources directly from nationalincome. This has indeed allowed domestic revenues to increase from 9.2 percent ofGDP in FY 1998/99 to 15.9 percent of GDP in FY 2008/09. It is imperative that thegovernment supports this favorable trend in domestic revenue collection, to reduceits dependency on foreign aid, which has represented almost 40 percent of total publicresources since FY 2002/03.
2. The allocation and use of public education resources is still not optimal however.
The increase in recurrent public education expenditure has been followed by significant changesin subsector allocations. Over the decade, the share of primary education (including preprimaryeducation) has decreased from 58 percent to 48 percent, a level similar to that of othercountries close to achieving universal primary education. Most primary education savings havebenefited higher education, whose share of resources has increased to 27 percent of the totaleducation budget, making the subsector one of the best financed among African countries.
Secondary education continues to be heavily underfunded. In 2008/09, it absorbed 13.5percent of education public resources; a level far below countries that are equally close toachieving universal primary education.
Tanzania Education Sector Analysis 15
500,000
450,000
400,000
350,000
300,000
250,000
200,000
1998
2000
2002
2004
2006
2008
2009
**
2010
**
2014
**19
9920
0020
0220
0420
0620
08
2009
**
2010
**
2014
**
Constant 2001 T Sh
GDP per Capita Annual GDP Growth Rate
9.0
8.0
7.0
6.0
5.0
4.0
3.0
2.0Percent
GDP Trends (FY) 1998/99-2008/09 and Projections
Lake Natron
Arusha45 Kilimanjaro
37
Tanga54
Manyara52
Singida56
Tabora68
Shinyanga73
Mara62
Lake Victoria
Kagera61
Kigoma59
Rukwa65
Mbeya55
LakeTangyanika
Dodoma56
Pwani42
DSM49
Lindi55
Mtwara52
Ruvuma48
Iringa45
Morogoro48
Source: Based on Table 1.3.Note: **Projections.
Along with the high budget priority given to the education sector, this positive evolutionwas also made possible following:
• Impressive and sustained economic growth registered over the last decade. Over the2000-08 period, the average annual economic growth rate was estimated at 7.1percent, a higher figure than the African low-income countries’ average, of 6.2 percent.This trend is likely to strengthen given that average GDP per capita (about US$ 565 in2010) remains lower than the African low-income countries’ average (US$ 800).
Tanzania Education Sector Analysis16
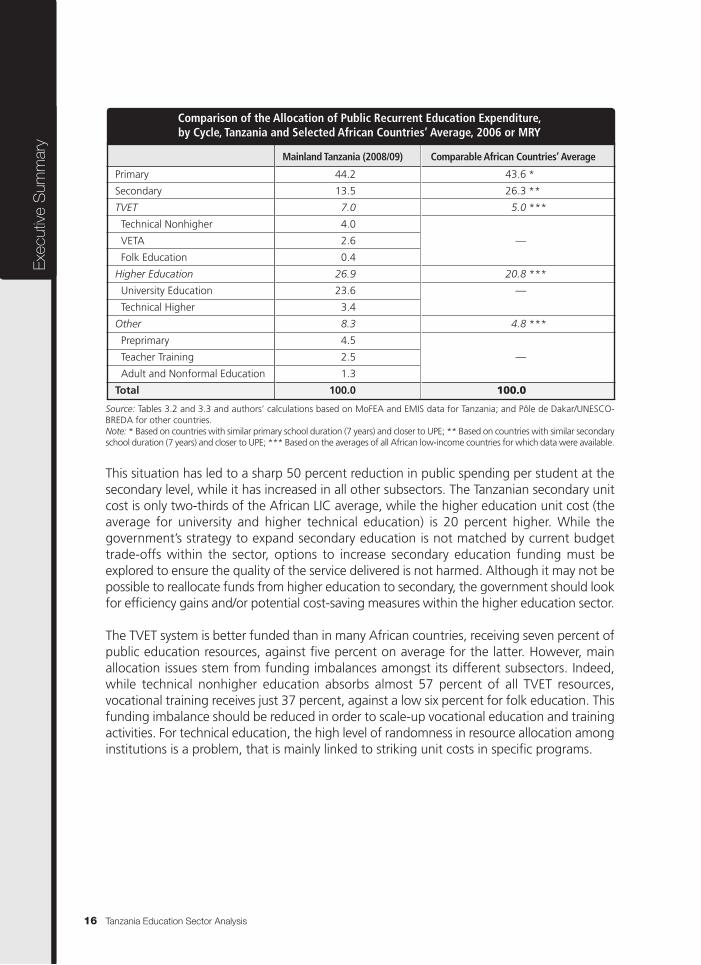
This situation has led to a sharp 50 percent reduction in public spending per student at thesecondary level, while it has increased in all other subsectors. The Tanzanian secondary unitcost is only two-thirds of the African LIC average, while the higher education unit cost (theaverage for university and higher technical education) is 20 percent higher. While thegovernment’s strategy to expand secondary education is not matched by current budgettrade-offs within the sector, options to increase secondary education funding must beexplored to ensure the quality of the service delivered is not harmed. Although it may not bepossible to reallocate funds from higher education to secondary, the government should lookfor efficiency gains and/or potential cost-saving measures within the higher education sector.
The TVET system is better funded than in many African countries, receiving seven percent ofpublic education resources, against five percent on average for the latter. However, mainallocation issues stem from funding imbalances amongst its different subsectors. Indeed,while technical nonhigher education absorbs almost 57 percent of all TVET resources,vocational training receives just 37 percent, against a low six percent for folk education. Thisfunding imbalance should be reduced in order to scale-up vocational education and trainingactivities. For technical education, the high level of randomness in resource allocation amonginstitutions is a problem, that is mainly linked to striking unit costs in specific programs.
Source: Tables 3.2 and 3.3 and authors’ calculations based on MoFEA and EMIS data for Tanzania; and Pôle de Dakar/UNESCO-BREDA for other countries.Note: * Based on countries with similar primary school duration (7 years) and closer to UPE; ** Based on countries with similar secondaryschool duration (7 years) and closer to UPE; *** Based on the averages of all African low-income countries for which data were available.
Exec
utiv
e S
umm
ary
Primary
Secondary
TVET
Technical Nonhigher
VETA
Folk Education
Higher Education
University Education
Technical Higher
Other
Preprimary
Teacher Training
Adult and Nonformal Education
Total
Mainland Tanzania (2008/09) Comparable African Countries’ Average
Comparison of the Allocation of Public Recurrent Education Expenditure,by Cycle, Tanzania and Selected African Countries’ Average, 2006 or MRY
44.2
13.5
7.0
4.0
2.6
0.4
26.9
23.6
3.4
8.3
4.5
2.5
1.3
100.0
43.6
26.3
5.0
—
20.8
—
4.8
—
100.0
*
**
***
***
***

The way resources are used highlights potential room for improvement. Indeed, evidenceshows that:
• Basic education focuses too little on spending that directly improves the quality of theservice delivered;
• In secondary education, capitation grant spending is 40 percent lower than the norm,and student meals absorb four times as much of the budget;
• Teacher training colleges also overspend on student meals, to the tune of 90 percentof nonsalary expenditures;
• Preprimary and primary pupil to teacher ratios are excessively high, partly because highsalaries constitute a constraint to further recruitment. Secondary PTRs are also wellabove par, due to a quantitative and qualitative shortage of teachers; and
• In higher education, social spending is excessive (28 percent of higher education unitcosts not including scholarships for study abroad), and inequitable (almost 48 percentof students receive a loan, although less than 10 percent are from the poorest quintiles).
3. Households and the private sector contribute considerably to the cost ofschooling, at varying degrees according to the level of education.
Households contribute significantly to education funding; their spending is equivalent to 32.1percent of public education expenditure. This is however comparatively lower than in otherLICs (48 percent on average). Despite the fee-free primary policy, household contributionsremain important: a quarter of primary public education costs are covered by households.This raises some concern as for the poorest households, as it might be a major obstacle tosend their children to schools. At the higher education level, the cost-sharing mechanismseems to be effective, reducing the government’s financial burden. But its effectiveness overthe long run will very much depend on the capacity of the HESLB to recover loans.
Tanzania Education Sector Analysis 17
Secondary Education Public Unit Costs, (FY) 2000/01 - 2008/09
280
260
240
220
200
180
160
140
120
100
2000/01
2001/02
2002/03
2003/04
2004/05
2005/06
2006/07
2007/08
2008/09
T Sh
(’00
0s)
136
269
248
Thousands of Constant 2008/09 T Sh
Lake Natron
Arusha45 Kilimanjaro
37
Tanga54
Manyara52
Singida56
Tabora68
Shinyanga73
Mara62
Lake Victoria
Kagera61
Kigoma59
Rukwa65
Mbeya55
LakeTangyanika
Dodoma56
Pwani42
DSM49
Lindi55
Mtwara52
Ruvuma48
Iringa45
Morogoro48
Source: Authors’ calculations based on MoFEA and BEST and EMIS data.

Tanzania Education Sector Analysis18
International Comparison of Household Spending on Education, by Level, 2009 or MRYPercentage Equivalent of Public Recurrent Education Expenditure
Primary Secondary Higher/Tertiary Average
90
80
70
60
50
40
30
20
10
0
48
3230
53
83
21
41
26
Mainland Tanzania
African LICs
Lake Natron
Arusha45 Kilimanjaro
37
Tanga54
Manyara52
Singida56
Tabora68
Shinyanga73
Mara62
Lake Victoria
Kagera61
Kigoma59
Rukwa65
Mbeya55
LakeTangyanika
Dodoma56
Pwani42
DSM49
Lindi55
Mtwara52
Ruvuma48
Iringa45
Morogoro48
The role of the private sector varies greatly across sectors. On the one hand it is marginal atthe preprimary and primary levels (where expansion has mainly been supported by the publicsector), and decreasing at O-Level and to a lesser extent at A-Level, following the government’spolicy of increasing secondary access. On the other hand, the expansion of the teacher trainingand higher education subsectors increasingly relies on cost-sharing, favoring the developmentof private sector contributions. In 2009, 39 percent of students were enrolled in private TeacherTraining Colleges, against five percent in 2004. In technical education, all folk developmentcourses are government-run, but those delivered through vocational centers are increasinglyprivate, reflecting the ministry’s policy of diversification to promote the subsector.
Source: Table 3.5 for Tanzania; Rwanda CSR, 2010 and Brossard et al., 2008 for 17 African low-income countries.Note: 18 African low-income countries are considered here: Benin, Burkina Faso, Cameroon, Chad, Congo, Côte d’Ivoire, Djibouti,Guinea Bissau, Madagascar, Malawi, Mali, Mauritania, Niger, Rwanda, Senegal, Sierra Leone, Togo and Uganda.
Source: BEST, NACTE, TCU, various years; authors’ computations for Tanzania. World Bank and Pôle de Dakar/UNESCO-BREDA forother countries.Note: * Refers to NACTE-registered institutions.
Exec
utiv
e S
umm
ary
Preprimary
Primary
O-Level
A-Level
Teacher Training
Technical Education *
VET (VTC Long Courses)
Higher Education
Share of Students Enrolled in Nongovernmental Institutions, 2004-09Percent
1.3
0.6
38.0
48.6
5.4
—
—
7.4
2.3
1.0
26.6
38.6
9.3
15.5
67.8
19.4
7.8
1.3
14.2
36.4
23.7
16.2
—
23.9
Tanzania
2004 2006 2008 2009 2009 or MRY
Average LIC
5.0
1.5
10.8
32.3
38.6
—
—
28.2
—
16.7
20.4
27.7
—
—
—
19.5

Tanzania Education Sector Analysis 19
4. School enrollment has increased at all levels.
The preprimary sector is comparatively well developed. The policy to mainstream the provisionof preprimary teaching through primary schools (thus controlling unit costs) has enabled agrowing number of young children to benefit from this level. Coverage at the preprimary levelreached 37 percent in 2009, up from 26 percent in 2004. This is a very reasonable level ofpreschool attendance compared with the 20 percent average of other countries in the region.
Source: Table 2.1, and census projections for Tanzania.Note: * TVET includes VTC and FDC long courses, and nonhigher technical education; ** Higher education includes universities,university colleges and higher technical education.
Tanzania is on the way to reaching universal primary education, but late entry still remainsa major challenge and many children are still out of school. Access to Standard I is almostuniversal, although 5.5 percent of children did not have access to primary school in 2006.The primary completion rate has steadily increased over the past decade, to reach at least89 percent in 2009. The fee-free primary education policy and extensive classroomconstruction have had positive impacts on both primary access and retention levels. Thesystem is still marked by considerable late entry however: only 36 percent of Standard Istudents were of official school-age in 2006.
Source: DHS, 2004; HBS, 2000/01 and 2007; authors’ computations.
Age at Standard I
Perc
ent
1.0 0.45.0 3.8
11.0
17.0
22.6
36.0
23.0
30.7
22.019.0
20.5
14.017.0
11.89.0 9.0
5.12.0
5.03.0 2.0
5.02.1 1.0
Age Distribution of Standard I New Entrants, 2000, 2004 and 2006Percent
5 6 7 8 9 10 11 12 13+
40353025201510
50
2000
2004
2006
Lake Natron
Arusha45 Kilimanjaro
37
Tanga54
Manyara52
Singida56
Tabora68
Shinyanga73
Mara62
Lake Victoria
Kagera61
Kigoma59
Rukwa65
Mbeya55
LakeTangyanika
Dodoma56
Pwani42
DSM49
Lindi55
Mtwara52
Ruvuma48
Iringa45
Morogoro48
3.0
2003
2004
2005
2006
2007
2008
2009
Preprimary PrimarySecondary
O-Level
GER (%) Per 100,000 inhabitants
A-Level AllTVET * Higher
Education **
Schooling Coverage, by Level, 2003-09Percent, and Students per 100,000 inhabitants
—
26.3
29.3
29.8
34.4
36.7
36.6
104.5
109.5
113.1
115.9
117.6
115.4
112.4
10.5
12.8
15.2
19.0
28.3
33.0
38.6
1.9
2.2
2.3
3.0
3.4
3.6
3.9
7.8
9.5
11.2
14.0
20.5
23.8
27.7
—
—
—
235
—
252
250
—
—
—
174
—
291
335

Tanzania Education Sector Analysis20
This situation tends to inflate out-of-school statistics. Indeed, among the 925,000 estimatedout-of-school (representing 13 percent of primary school-aged children in 2006), 88 percenthad never attended. Should all children enter on time, the number of children estimated tonever attend school would drop to 425,500. Given its detrimental impact on schoolingpaths (exposing them to greater risk of early dropout), ensuring that children attend schoolat the correct age should be a priority. MoEVT may address both supply and demandconstraints, for instance through sensitization campaigns to alter parents’ perceptions aboutthe appropriate age for school attendance, assisted further by the expansion of ECCDprogrammes.
School coverage at secondary and higher education levels is still low compared with otherAfrican countries, but is rapidly increasing, especially at the higher education level. Schoolcoverage is particularly low at A-Level, where only four out of 100 school-aged childrenwere enrolled in 2009, one of the lowest rates of all African low-income countries. Thesituation is less problematic at O-Level, for which the GER reached 39 percent in 2009, upfrom a low 10.5 percent in 2003.
Considerable emphasis has been put on higher education, to adequately meet the growingdemand from secondary school leavers and produce skills relevant to current and futureeconomic growth. University enrollment has grown at an average annual rate of 30 percentover 2005-09, among the highest annual growth rates registered for all subsectors (althoughit started with lower enrollment), allowing Tanzania to rapidly catch up with the levels ofcomparable developing countries. In 2009, the number of higher education students inTanzania was 36 percent lower than the average, down from 50 percent in 2006. However,university and technical higher education coverage remains low, at 335 students per 100,000inhabitants in 2009/10, against 381 students per 100,000 in other low-income countries.
Source: Table 2.8 for Tanzania; World Bank and Pôle de Dakar/UNESCO-BREDA for other countries.Note: To allow for international comparisons: * TVET includes VET and FDC long courses and NACTE-registered technical nonhighereducation; and ** Higher education includes universities, university colleges and technical higher education.
Exec
utiv
e S
umm
ary
Tanzania (2008)
Burundi
Kenya
Rwanda
Uganda
East African Community Average
African Low-income Countries
Average
Min – Max
Preprimary Primary LowerSecondary
GER (%) Per 100,000 inhabitants
UpperSecondary
TVET * Higher Education **
International Comparison of Enrollment, by Level, 2008 or MRYPercent, and Students per 100,000 inhabitants
36.7
5.4
54.0
18.0
3.7
23.5
20.4
0.8 – 141
115.4
115.3
114.7
151.0
120.7
122.8
103.1
56.9 – 157.7
33.0
22.9
94.6
28.0
28.1
42.4
43.4
15.9 – 94.6
3.6
6.0
39.6
9.0
10.3
13.7
17.2
2.6 – 39.6
252
156
74
440
115
212
228
35 – 484
291
243
359
474
329
337
381
61 – 1009

Tanzania Education Sector Analysis 21
TVET education coverage in Tanzania is higher than in other low-income countries (250students per 100,000 inhabitants in 2009, compared with 228 students per 100,000).Seventy percent of TVET students are registered on vocational courses (in VTCs and FDCs),whereas 30 percent are in nonhigher technical learning streams. The sector still falls short ofthe huge needs in TVET programmes for primary and secondary school leavers. The currentannual flow of students into vocational education represents less than five percent of thepotential demand for VET services, while technical nonhigher education covers about 22percent of potential demand. This underlines the urgency for the diversification of TVETprovision, offering more short and tailor-made courses to enhance productivity and the qualityof products and services.
The number of teacher trainees has increased over the decade, with the exception of the2007-08 period that registered a decrease in TTC trainees (places were more limited as aresult of the extension of the curricula from one to two years in 2006). However, given thegrowing demand for teachers at all levels, the pursuit of the expansion of teacher training isto be closely monitored and planned, so as to not jeopardize the development of the primaryand secondary school system.
Literacy programmes cover just a quarter of the target population. Similarly, COBETprogrammes only cater for a small fraction of out-of-school children, and their efficiency inmainstreaming children’s return to school is weak.
Access to postprimary levels still remains challenging for many children. Although strongimprovements in access to secondary have been noted, especially at O-Level, they are stilllimited. In 2009, half of children had access to O-Level and 23 percent were able to reachthe last grade of the cycle, against just eight percent in 2003. A-Level access is still strikinglylow, at five percent. Whereas lack of supply is a major hindrance to O-Level and A-Levelaccess, economic difficulties and cultural issues among certain groups also contribute tofragile school demand. With respect to the former, the policy to have a secondary school ineach ward has had a very positive impact on secondary access and on primary retentionrates. The pursuit of the policy is expected to improve both O-Level and A-Level access andretention in the coming years.

Tanzania Education Sector Analysis22
The increase in primary and secondary school enrollments is already putting a lot of strainon secondary, TVET and higher education institutions, and enrollment at these levels isexpected to grow more rapidly still over the coming years. An urgent and well-plannedresponse is required to ensure the smooth and manageable development of the system andthat it remains in line with labor market needs. This raises both financial and practicalchallenges (teacher requirements, classroom supply). A sectorwide financial simulationmodel may help to explore policy options, assessing both facilities and required resources.
5. Dropout is still a problem at postprimary levels however, despite generally goodinternal efficiency levels.
While internal efficiency is generally good, dropout remains a problem, particularly atpostprimary levels. Tanzania’s education system is comparatively efficient at both primary andO-level, and its A-Level efficiency is in line with the African low-income countries’ average.The primary IEC was estimated at 88 percent in 2007, implying that 12 percent of resourcesare wasted due to repetition or dropout. Repetition being generally low (2.4 percent in primaryand under two percent in secondary, on average in 2009), dropout is the main source of
Education Pyramid for Tanzania, 2009
23%
3%
5%
55%
108%
108%
Upp
erSe
cond
ary
Higher Education:335 Students
per 100,000 inhabitants
TVET:6% of Secondary
GER = 4%
GER = 39%
GER = 112%
Low
erSe
cond
ary
Prim
ary
49%
33%
Lake Natron
Arusha45 Kilimanjaro
37
Tanga54
Manyara52
Singida56
Tabora68
Shinyanga73
Mara62
Lake Victoria
Kagera61
Kigoma59
Rukwa65
Mbeya55
LakeTangyanika
Dodoma56
Pwani42
DSM49
Lindi55
Mtwara52
Ruvuma48
Iringa45
Morogoro48
Source: Tables 2.8 and 2.11 and Figure 2.7.Note: TVET refers to technical non-higher education and VET courses (both VETA and NACTE-registered).
Exec
utiv
e S
umm
ary

Tanzania Education Sector Analysis 23
Improving retention will necessarily require addressing both supply and demand constraints.This could entail:
• Alleviating schooling direct and opportunity costs. Although most of the interventionscited above (regarding the expansion of secondary education for instance) should alsofavor primary school retention, special attention should be given to costs borne byparents, that increase with successive grades and levels. School feeding programmesand cash transfer programmes are being implemented to compensate, but furthercost-benefit analysis is necessary before expanding them, mainly because of theirnotoriously high cost;
• Further improving school supply. Schools with incomplete cycles are known tonegatively affect retention. Although this issue appears to be marginal in Tanzania,scope for improvement nevertheless exists at the primary level: satellite schools, knownto offer incomplete cycles, could possibly be converted into full-cycle schools throughmultigrade teaching. At postprimary levels, building more schools will prove decisive;and
inefficiency, especially at O-Level and A-Level. More efforts are needed to reduce dropout inorder to improve the overall internal efficiency of the system, and reduce resource wastage.
Source: BEST, various years.Note: * Not provided as 2009 primary schooling patterns are highly affected by the multicohort phenomenon, which tends tounderestimate dropout; ** Because 2007 A-level repetition data were not available, the proportion observed in 2009 was assumedto have remained constant over the period. The change in the A-Level IEC is therefore only related to the rise in dropout.
Primary
Internal Efficiency Coefficient
Dropout-Related (no Repetition)
Repetition-Related (no Dropout)
Years Required to Completion
O-Level
Internal Efficiency Coefficient
Dropout-Related (no Repetition)
Repetition-Related (no Dropout)
Years Required to Completion
A-Level
Internal Efficiency Coefficient
Dropout-Related (no Repetition)
Repetition-Related (no Dropout)
Years Required to Completion
Primary and Secondary Schooling Internal Efficiency Coefficients, 2000-09
67
69
97
10.5
82
83
98
4.9
—
—
—
—
88
92
96
7.9
83
85
98
4.8
83
84
99
2.4
2000 2007 2009
—
—
—
—
81
82
98
5.0
72
73
99
2.8
**
**
*
Percent and Number of Years

Tanzania Education Sector Analysis24
• At the primary level, closely monitoring repetition would be helpful, especially forStandard I, that has the highest proportion of repeaters. However, as ECCDprogrammes expand and the school preparedness of children improves, this issueshould resolve itself. Assessing the relevance and quality of teaching would beworthwhile, as dropout is often justified by a lack of interest in school.
6. Important disparities persist in access to formal schooling according to gender,area of residence and especially families’ income levels; and, they tend to becumulative.
Beyond the primary level, girls’ participation in education is systematically lower than that ofboys. Gender parity indexes decrease from 1.04 (girls’ enrollment is greater than boys’) inprimary school to 0.65 at the higher/tertiary level. TVET is still slightly gender-oriented: malestudents accounted for 55 percent of trainees in 2008. At the higher education level, femaleenrollment has barely reached 34 percent: girls are doubly prejudiced by their lower chancesof reaching secondary school, and by their comparatively lower results in the ACSEE exam.
Schooling inequalities are particularly unfair to children from rural areas. Children fromurban areas have better access probabilities to all levels of education than their rural peers,in part due to the inadequate supply of rural schools. The gap in the probability of accessreaches 23 percentage points for O-Level entry, and eight percentage points for A-Levelentry.
Exec
utiv
e S
umm
ary
Gender
Male
Female
Gender Parity Index (Female/Male)
(Memo: Index, 2000)
Area of Residence
Urban
Rural
Location Parity Index (Rural/Urban)
(Memo: Index, 2000)
Income Group
Q5 (The wealthiest)
Q1 (The poorest)
Wealth Parity Index (Q1/Q5)
(Memo: Index, 2000)
Total Tanzania
GERs and Parity Indexes, by Socioeconomic Characteristic, 2006
29.9%
27.2%
0.91
0.89
45.9%
23.8%
0.52
0.53
48.1%
23.0%
0.48
0.21
28.6%
114.6%
118.8%
1.04
0.95
119.6%
115.8%
0.97
0.79
125.3%
117.1%
0.93
0.82
116.6%
31.7%
30.2%
0.95
1.13
56.6%
21.9%
0.39
0.13
64.8%
19.1%
0.30
0.23
30.9%
7.2%
6.0%
0.83
0.95
16.2%
2.6%
0.16
0.09
26.8%
1.6%
0.06
0.19
6.6%
2.9%
1.9%
0.65
0.75
n.a. *
7.9%
0.0%
0.00
0.15
2.4%
Preprimary Primary O-Level A-Level Higher
Source: HBS, 2007, authors’ calculations.Note: The location parity index is irrelevant to higher learning institutions, that are all located in urban areas. Reading Note: A gender parity index of 0.83 (2006, A-Level) indicates that for every 100 boys enrolled, there were 83 girls.

Tanzania Education Sector Analysis 25
The unavailability of a school nearby is often a major hindrance (in some rural areas, 22percent of children live over five kilometers away). There is clearly potential to build moreschools in underserved areas, compensating the cost by offering multigrade teaching underclose supervision. Lack of interest in school is also a major reason for nonattendance(mentioned by 12 percent) that might be counter arrested by improving the relevancy andquality of teaching.
Disparities in access increase sharply with successive levels of education, especially thoserelated to income. Wealth parity indexes decrease from 0.94 in primary school to 0.09 atA-Level, and are virtually nil at the higher/tertiary level. Retaining the poorest students inprimary schools and ensuring their transition to postprimary cycles is a major challenge.Although the abolition of school fees has been a major measure in alleviating educationexpenses, the poorest households still face prohibitive schooling costs (uniforms, stationery,books, and so on). Interventions specifically targeting these households, such as cashtransfers, may help to remove economic and financial barriers. Better coverage of thescholarship grants and remedial classes should make schooling more equitable for the poor.
Furthermore, disadvantages tend to be cumulative. Poor rural girls face the worst accessconditions, and disparities tend to broaden as of the end of primary (for every 100 rich urbanboys completing primary, only 53 poor rural girls do). They then explode at postprimary levels,leaving poor rural girls with virtually no opportunities to pursue secondary education.
Finally, literacy programmes targeted at parents should give positive results, mainly bygradually overcoming cultural barriers to education. The encouragement of families andschools to ensure that all children have birth certificates (although not strictly an educationsector intervention), may also have a positive impact on school access and retention.
Access disparities by region are equally marked. For instance, primary access and retentionare particular issues in Rukwa, Tabora and Dodoma regions. Beyond school supplyconstraints, economic, cultural and environmental issues (agro-pastoral activities, culturalbeliefs, tobacco production and climate conditions) shape demand and keep children outof school. In 2006, secondary access probabilities were as low as four percent in one region,and were just 16 percent in five others, well below the national average of 27 percent.Extensive primary and secondary school construction has contributed to loosen school supplyconstraints in many of those regions since.
Source: HBS, 2007: authors’ calculations.
Primary Access
Primary Completion
O-Level Access
O-Level Completion
A-Level Access
A-Level Completion
Cumulated Disparities in Schooling Profiles, by Extreme Group, 2006Percent
98.8
94.2
55.4
36.5
21.3
12.8
Male/Urban/Q5 Female/Rural/Q1 Parity Ratio
92.5
50.1
7.1
1.1
0
0
0.94
0.53
0.13
0.03
—
—

Socioeconomic Status
Q1
Q2
Q3
Q4
Q5
Area of Residence
Rural
Urban
Gender
Girls
Boys
Benefit Incidence of Public Education Resources, by Level of Income, Area of Residence, and Gender, 2009
Percent, and Appropriation Index
27.0
23.8
20.0
17.3
11.9
74.0
26.0
52.3
47.7
Share of thePopulation
(%)
(a)
12.7
15.4
21.1
18.0
32.8
47.1
52.9
45.7
54.3
Public Resources
Absorbed (%)
(b)
0.5
0.6
1.1
1.0
2.8
0.6
2.0
0.9
1.1
AppropriationRatio
(b)/(a)
1.0
1.4
2.2
2.2
5.9
1.0
3.2
1.0
1.3
AppropriationIndex
Tanzania Education Sector Analysis26
TVET and higher education opportunities are also unequal across areas and regions. Justfive regions (Dar es Salaam, Iringa, Arusha, Kilimanjaro and Mwanza) are home to almost55 percent of VTCs. HLIs are also particularly present in cities and the eastern part of thecountry. The expansion of open distance learning will be crucial in breaking the urban/ruralfracture.
Regional Disparities in Primary Access and Retention Probabilities, 2006
Primary Access Probability (%)
Prim
ary
Rete
ntio
n Pr
obab
ility
(%) 110
100
90
80
70
60
50
40
88 90 92 94 96 98 100 102
TaboraKigoma
ArushaKilimanjaro Dar
IringaMaraRuvuma
KageraMbeyaTanga
Mwanza
ShinyangaLindi Morogoro
MtwaraSingindaDodoma
Manyara Rukwa
Pwani
Lake Natron
Arusha45 Kilimanjaro
37
Tanga54
Manyara52
Singida56
Tabora68
Shinyanga73
Mara62
Lake Victoria
Kagera61
Kigoma59
Rukwa65
Mbeya55
LakeTangyanika
Dodoma56
Pwani42
DSM49
Lindi55
Mtwara52
Ruvuma48
Iringa45
Morogoro48
Source: Authors’ calculations based on probabilistic profiles using HBS, 2007 data.
Source: Authors’ calculations based on Annex Table 5.8.
Exec
utiv
e S
umm
ary

Tanzania Education Sector Analysis 27
The distribution of public education resources is therefore unequal, benefiting the mostprivileged students. Indeed, the 10 percent most educated benefit from 47 percent of publiceducation resources, in line with the LIC average. The benefit incidence analysis furthershows that boys benefit from 30 percent more public education expenditure than girls. Dueto longer schooling, 33 percent of public resources are allocated to the 12 percent ofstudents from the most privileged households, and those belonging to the poorest familiesonly benefit from 13 percent of these resources, despite representing 27 percent of thepopulation.
Further action is required to support pro-poor schooling, ensure a more equitabledevelopment of the education system and ultimately of society. The opportunity cost maybe to favor future iniquities and the intergenerational transmission of poverty.
7. Quality continues to represent an important challenge to the sector, asdemonstrated by the modest level of learning outcomes.
Although the dynamic of improvement in learning outcomes observed in primary educationbetween 2000 and 2007 is very encouraging, and good compared to neighboring countries,learning achievements are modest by international standards.
SACMEQ Reading and Mathematics Scores, 2007SACMEQ Scores
SACMEQ Score
MauritiusKenya
TanzaniaSeychellesSwazilandBotswanaZimbabweSACMEQ
South AfricaZanzibar
MozambiqueUgandaLesothoNamibiaMalawiZambia
300 400 500 600 700
623574
434
Math: 553Reading: 578
Math: 510Reading: 512
Math
Reading
Lake Natron
Arusha45 Kilimanjaro
37
Tanga54
Manyara52
Singida56
Tabora68
Shinyanga73
Mara62
Lake Victoria
Kagera61
Kigoma59
Rukwa65
Mbeya55
LakeTangyanika
Dodoma56
Pwani42
DSM49
Lindi55
Mtwara52
Ruvuma48
Iringa45
Morogoro48
Source: SACMEQ 2007 data; IIEP, 2010.
Tanzania Education Sector Analysis28
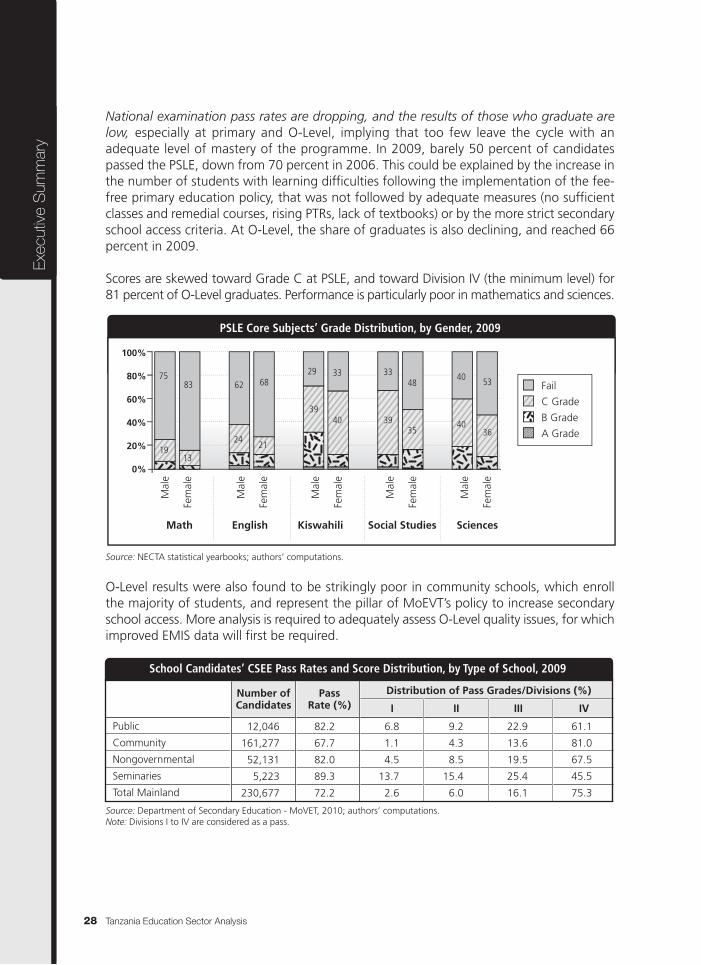
National examination pass rates are dropping, and the results of those who graduate arelow, especially at primary and O-Level, implying that too few leave the cycle with anadequate level of mastery of the programme. In 2009, barely 50 percent of candidatespassed the PSLE, down from 70 percent in 2006. This could be explained by the increase inthe number of students with learning difficulties following the implementation of the fee-free primary education policy, that was not followed by adequate measures (no sufficientclasses and remedial courses, rising PTRs, lack of textbooks) or by the more strict secondaryschool access criteria. At O-Level, the share of graduates is also declining, and reached 66percent in 2009.
Scores are skewed toward Grade C at PSLE, and toward Division IV (the minimum level) for81 percent of O-Level graduates. Performance is particularly poor in mathematics and sciences.
PSLE Core Subjects’ Grade Distribution, by Gender, 2009
Math English Kiswahili Social Studies Sciences
Mal
e
Fem
ale
Mal
e
Fem
ale
Mal
e
Fem
ale
Mal
e
Fem
ale
Mal
e
Fem
ale
100%
80%
60%
40%
20%
0%
Fail
C Grade
B Grade
A Grade
75
1913
83 62
2421
6829
3940
33
3539
3348
4036
5340
Lake Natron
Arusha45 Kilimanjaro
37
Tanga54
Manyara52
Singida56
Tabora68
Shinyanga73
Mara62
Lake Victoria
Kagera61
Kigoma59
Rukwa65
Mbeya55
LakeTangyanika
Dodoma56
Pwani42
DSM49
Lindi55
Mtwara52
Ruvuma48
Iringa45
Morogoro48
Source: NECTA statistical yearbooks; authors’ computations.
Source: Department of Secondary Education - MoVET, 2010; authors’ computations. Note: Divisions I to IV are considered as a pass.
O-Level results were also found to be strikingly poor in community schools, which enrollthe majority of students, and represent the pillar of MoEVT’s policy to increase secondaryschool access. More analysis is required to adequately assess O-Level quality issues, for whichimproved EMIS data will first be required.
Exec
utiv
e S
umm
ary
Public
Community
Nongovernmental
Seminaries
Total Mainland
School Candidates’ CSEE Pass Rates and Score Distribution, by Type of School, 2009
12,046
161,277
52,131
5,223
230,677
82.2
67.7
82.0
89.3
72.2
6.8
1.1
4.5
13.7
2.6
Number ofCandidates
PassRate (%) I II III IV
Distribution of Pass Grades/Divisions (%)
9.2
4.3
8.5
15.4
6.0
22.9
13.6
19.5
25.4
16.1
61.1
81.0
67.5
45.5
75.3

Tanzania Education Sector Analysis 29
At A-Level, the situation is generally better, although pass rates have fallen slightly, to 89percent in 2009. School candidates systematically outperform private ones, both in quantity(with respective pass rates of 93 percent and 74 percent in 2009), and in quality (12 percentand 38 percent reached the minimum level). Half of school candidates score a Division IIIgrade, a quarter scores a Division II grade and 14 percent a Division I grade, a result almostnever attained by private candidates. Gender disparities are minimal. The globally goodscores could be due to only the best and most fortunate students reaching A-Level.Implementing mechanisms to adequately monitor learning outcomes will be important giventhe rising number of O-Level graduates to enroll and the introduction of the new A-Levelcurriculum in 2010.
In VET, 78 percent of long course students completed their year in 2008; 58 percent enteredan exam, 80 percent of whom passed. As far as technical education and higher educationexamination results are concerned, high levels of success (above 82 percent) are observed,although the low number of candidates sitting the exam implies that those who do are thebest performers. The fact that many students bear the cost of their studies has probablyencouraged greater care in the choice of courses, and greater responsibility in learning. Nogender differences are apparent in success rates or the quality of results, although relativelyfewer girls sit higher examinations, and their participation drops the higher the awardinvolved.
The objective that all children should achieve acceptable levels of learning is made all themore elusive by the disparities in achievements, although these have narrowed over theyears. At both primary and O-Level, disparities in results exist according to gender, wealthand area of residence. Although the analysis of SACMEQ scores over 2000-07 shows thatdisparities are narrowing, it also pinpoints that: (i) the poorest children’s performance isstarkly below that of their wealthier peers; and (ii) disadvantages tend to be cumulative:poor rural girls perform the worst. Girls underperformance at CSEE is of particular concern.
Share of Students Reaching Minimum SACMEQ Levels in Reading (Kiswahili) and Math, by Socioeconomic Characteristic, 2000-07
2000 2007 2000 2007
100%
80%
60%
40%
20%
Reading
Math Urban
25% Richest (Q4)
Boys
Girls
Rural
25% Poorest (Q1)
Lake Natron
Arusha45 Kilimanjaro
37
Tanga54
Manyara52
Singida56
Tabora68
Shinyanga73
Mara62
Lake Victoria
Kagera61
Kigoma59
Rukwa65
Mbeya55
LakeTangyanika
Dodoma56
Pwani42
DSM49
Lindi55
Mtwara52
Ruvuma48
Iringa45
Morogoro48
Source: SACMEQ, 2000, 2007 data; MoEVT.
Tanzania Education Sector Analysis30
8. Education does nevertheless have an important impact on social and humandevelopment.
Education, especially primary education, has an important impact on literacy, poverty,fertility, and maternal and child health. From 7.7 percent for uneducated individuals, theprobability of being literate increases to 87.3 percent for those with full primary educationand to 99 percent for O-Level leavers. Women who have never attended school benefitfrom antenatal care from a health professional for only 73 percent of pregnancies, whereas
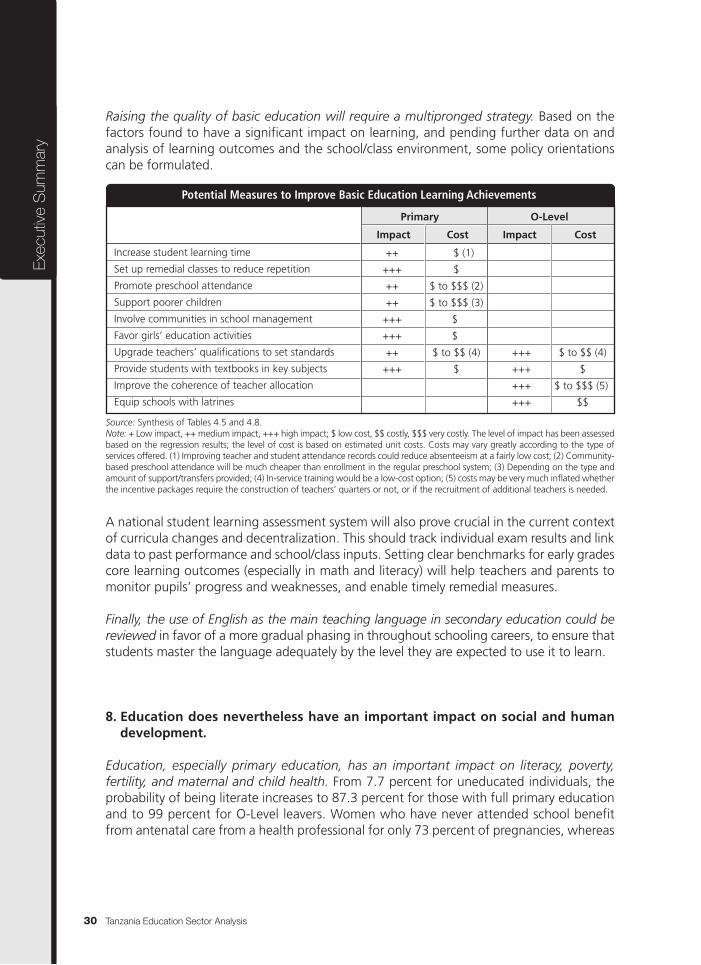
Raising the quality of basic education will require a multipronged strategy. Based on thefactors found to have a significant impact on learning, and pending further data on andanalysis of learning outcomes and the school/class environment, some policy orientationscan be formulated.
A national student learning assessment system will also prove crucial in the current contextof curricula changes and decentralization. This should track individual exam results and linkdata to past performance and school/class inputs. Setting clear benchmarks for early gradescore learning outcomes (especially in math and literacy) will help teachers and parents tomonitor pupils’ progress and weaknesses, and enable timely remedial measures.
Finally, the use of English as the main teaching language in secondary education could bereviewed in favor of a more gradual phasing in throughout schooling careers, to ensure thatstudents master the language adequately by the level they are expected to use it to learn.
Exec
utiv
e S
umm
ary
Increase student learning time
Set up remedial classes to reduce repetition
Promote preschool attendance
Support poorer children
Involve communities in school management
Favor girls’ education activities
Upgrade teachers’ qualifications to set standards
Provide students with textbooks in key subjects
Improve the coherence of teacher allocation
Equip schools with latrines
Potential Measures to Improve Basic Education Learning Achievements
++
+++
++
++
+++
+++
++
+++
Impact Cost Impact Cost
Primary O-Level
$ (1)
$
$ to $$$ (2)
$ to $$$ (3)
$
$
$ to $$ (4)
$
+++
+++
+++
+++
$ to $$ (4)
$
$ to $$$ (5)
$$
Source: Synthesis of Tables 4.5 and 4.8.Note: + Low impact, ++ medium impact, +++ high impact; $ low cost, $$ costly, $$$ very costly. The level of impact has been assessedbased on the regression results; the level of cost is based on estimated unit costs. Costs may vary greatly according to the type ofservices offered. (1) Improving teacher and student attendance records could reduce absenteeism at a fairly low cost; (2) Community-based preschool attendance will be much cheaper than enrollment in the regular preschool system; (3) Depending on the type andamount of support/transfers provided; (4) In-service training would be a low-cost option; (5) costs may be very much inflated whetherthe incentive packages require the construction of teachers’ quarters or not, or if the recruitment of additional teachers is needed.

Tanzania Education Sector Analysis 31
The primary level thus has the greatest impact on social outcomes, contributing to almost60 percent of the total impact of education on social development, which further reinforcesthe justification for efforts made to ensure that all Tanzanian children complete at least theprimary cycle. At equal investment, the efficiency of the primary cycle in enhancing humandevelopment is 2.4 times higher than that of the secondary cycle.
9. The sector also has a direct connection to labor market requirements.
Tanzania’s labor force has a better education profile today than in 2001, although highlyqualified human capital remains limited. The share of individuals aged 15 to 60 years withsecondary education and above increased from 5.6 percent to just seven percent between2001 and 2006. Although progress is slow, the number of individuals with tertiary or highereducation has more than doubled over the period. Over the same period, the averagenumber of salaried jobs created has increased by about 10.3 percent per year, casting somedoubts on the absorptive capacity of the salaried employment sector (the main supplier ofjobs for higher education leavers), to adequately absorb the growing number of highereducation leavers. To maintain this growth rate, policy makers should assess the ability of
those who have completed primary education are assisted in 81 percent of all cases, andthose who have completed O-Level do so for 85 percent of pregnancies. Age at firstchildbirth ranges from 18 years for uneducated women to 21 years for those with completesecondary, a three year difference.
Source: Authors’ calculations based on TDHS, 2004/05 data.Note: * Literacy: based on 5,107 men and women aged 22 to 44 years, assessing the probability of being literate; ** Poverty:based on 6,838 household heads, assessing the relationship between the probability of a household belonging to the first povertyquintile (Q1) and the level of schooling of the head of household. The poverty measure is based on a wealth index derived fromavailable assets in the household; *** Child health: based on 6,650 children aged under five years, assessing the relationshipbetween women’s schooling and the probability that their child is given vitamin A; # Other indicators: based on 4,020 to 5,684women aged 15 to 49 years, with at least one childbirth for the probability of being assisted at delivery by a qualified healthprofessional, and at least two childbirths otherwise.Reading Note: Figures are not simple descriptive statistics of the different phenomenon according to the highest education levelcompleted; they result from econometric models that identify the net impact of education with all other variables (gender, age,area of residence, income level) held constant. So, the simulated net probability of literacy for a person having completed A-Levelis 99.7 percent. This rate being simulated means that it is for a theoretical individual with the same socioeconomic characteristicsas an average Tanzanian person, but with complete secondary education.
Literacy
Extreme Poverty
Woman’s Age at First Childbirth (Years)
Total Births (Number)
Probability of Receiving Antenatal Care
Probability of Professionally Assisted Birth Delivery
Probability of Receiving Vitamin A Treatment
Simulated Net Impact of Education on Social Behavior, 2004/05
81.9%
23.3%
19.0
4.0
80.8%
47.4%
22.1%
7.7%
62.9%
17.9
4.5
73.5%
31.6%
8.7%
87.3%
21.9%
19.5
3.8
81.2%
53.3%
18.6%
98.8%
9.1%
20.5
3.4
84.8%
75.5%
27.3%
99.7%
5.6%
20.9
3.2
86.3%
85.3%
32.5%
NoneAverage
Primary O-Level A-Level
Highest Level Completed

Tanzania Education Sector Analysis32
higher education leavers to join the nonwage sector and become self-employed, forinstance. Indeed, according to the regional pattern, Tanzania should have about 570,000higher education students in 2025. This should require enrollment growth of 8.8 percentper year, much lower than in recent years. These issues should be discussed in theframework of a simulation model relating the development of secondary education to thatof higher education.
Nevertheless, improved education leads to higher income. The wage premium for workerswith secondary education is particularly high, especially among A-Level leavers. This patternsuggests that there is a severe shortage of secondary qualifications in the economy. Theaverage income of tertiary education (technical nonhigher) leavers depends very much ontheir sector of employment, being close to that of O-Level leavers in the public sector, but30 percent higher in the private sector (although still barely half the income of an A-Levelleaver). Individuals who never pursued their education beyond primary earn more in self-employment than in the private sector.
Source: Authors' computations based on ILFS, 2006 data.Note: * Too few individuals to compute reliable average income.
Exec
utiv
e S
umm
ary
Labor Force
Employed
Public Sector - Salaried
Private Sector - Salaried
Self-Employed or Family Business
Agriculture and Other
Unemployed
Inactive
Employment Status of the Labor Force (25-35 Years), by Level of Education, 2006
98.4
97.5
0.7
8.8
24.5
63.5
0.9
1.6
97.6
97.3
0.2
2.1
14.6
80.4
0.3
2.5
98.1
96.2
16.8
21.6
37.7
20.1
1.9
1.9
95.7
88.0
37.5
33.6
13.2
3.7
7.7
4.3
100.0
100.0
53.3
27.2
4.0
15.5
0.0
0.0
98.2
97.3
2.1
8.8
23.6
62.8
0.9
1.8
AverageNoSchooling
Tertiary/Higher Total
O-Level A-Level
Secondary
Percent
No Schooling
Primary
O-Level
A-Level
Technical Nonhigher
Higher education
Annual Income, by Education Attainment and Employment Sector, 2006
1,426
1,663
2,125
5,361
1,921
5,682
526
713
1,453
4,100
1,881
5,413
585
902
1,831
4,906
1,915
5,592
700
1,060
1,548
4,029
—
—
Public
Self-Employment
(Nonagricultural)Private Average
Wage Sector
Thousands of T Sh
*
*
Source: Authors' computations based on ILFS, 2006 data.
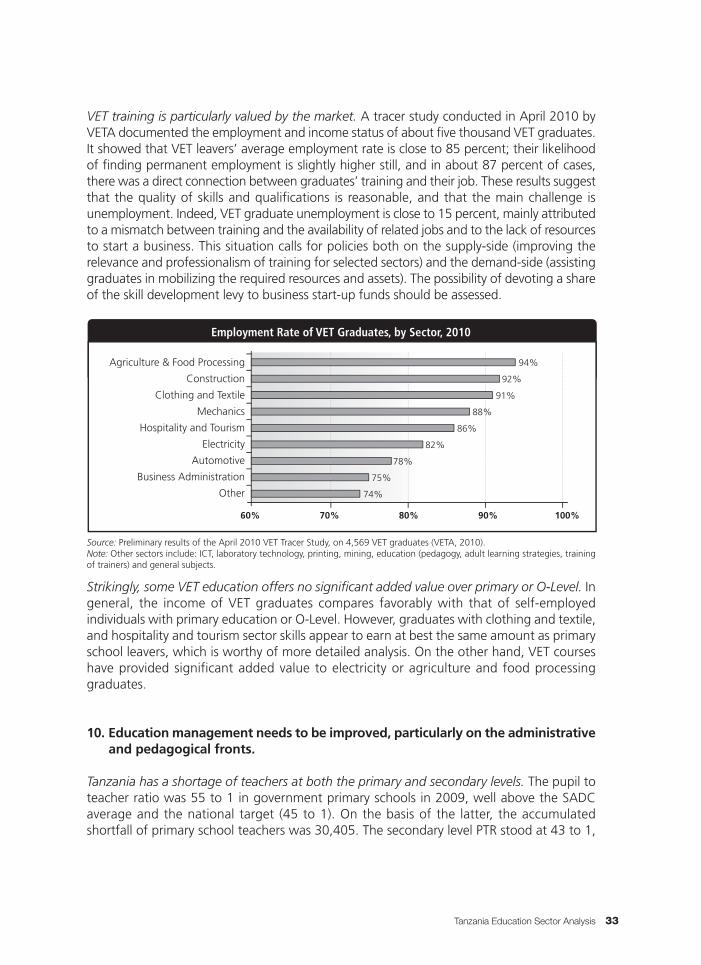
Tanzania Education Sector Analysis 33
VET training is particularly valued by the market. A tracer study conducted in April 2010 byVETA documented the employment and income status of about five thousand VET graduates.It showed that VET leavers’ average employment rate is close to 85 percent; their likelihoodof finding permanent employment is slightly higher still, and in about 87 percent of cases,there was a direct connection between graduates’ training and their job. These results suggestthat the quality of skills and qualifications is reasonable, and that the main challenge isunemployment. Indeed, VET graduate unemployment is close to 15 percent, mainly attributedto a mismatch between training and the availability of related jobs and to the lack of resourcesto start a business. This situation calls for policies both on the supply-side (improving therelevance and professionalism of training for selected sectors) and the demand-side (assistinggraduates in mobilizing the required resources and assets). The possibility of devoting a shareof the skill development levy to business start-up funds should be assessed.
Strikingly, some VET education offers no significant added value over primary or O-Level. Ingeneral, the income of VET graduates compares favorably with that of self-employedindividuals with primary education or O-Level. However, graduates with clothing and textile,and hospitality and tourism sector skills appear to earn at best the same amount as primaryschool leavers, which is worthy of more detailed analysis. On the other hand, VET courseshave provided significant added value to electricity or agriculture and food processinggraduates.
10. Education management needs to be improved, particularly on the administrativeand pedagogical fronts.
Tanzania has a shortage of teachers at both the primary and secondary levels. The pupil toteacher ratio was 55 to 1 in government primary schools in 2009, well above the SADCaverage and the national target (45 to 1). On the basis of the latter, the accumulatedshortfall of primary school teachers was 30,405. The secondary level PTR stood at 43 to 1,
Employment Rate of VET Graduates, by Sector, 2010
Agriculture & Food Processing
Construction
Clothing and Textile
Mechanics
Hospitality and Tourism
Electricity
Automotive
Business Administration
Other
60% 70% 80% 90% 100%
94%
92%
91%
88%
86%
82%
78%
75%
74%
Lake Natron
Arusha45 Kilimanjaro
37
Tanga54
Manyara52
Singida56
Tabora68
Shinyanga73
Mara62
Lake Victoria
Kagera61
Kigoma59
Rukwa65
Mbeya55
LakeTangyanika
Dodoma56
Pwani42
DSM49
Lindi55
Mtwara52
Ruvuma48
Iringa45
Morogoro48
Source: Preliminary results of the April 2010 VET Tracer Study, on 4,569 VET graduates (VETA, 2010).Note: Other sectors include: ICT, laboratory technology, printing, mining, education (pedagogy, adult learning strategies, trainingof trainers) and general subjects.

O-Level Only
Both Levels
A-Level Only
Total
Secondary Level PTRs and PqTRs, by Level and School Type, 2009
52:1
19:1
20:1
46:1
26:1
23:1
23:1
25:1
48:1
21:1
21:1
41:1
74:1
20:1
21:1
61:1
37:1
27:1
24:1
32:1
68:1
22:1
22:1
54:1
Nongvt.Gvt. Total Nongvt.Gvt. Total
PTR PqTRSchools offering
Tanzania Education Sector Analysis34
The proportion of qualified teachers has increased at the primary level, but has plummetedat the secondary level, reaching 90 percent and 76 percent in 2009, respectively. The teachertraining system has shown difficulties to respond to the growing demand for teachersfollowing the surge in secondary enrollment. The lack of language, mathematics and scienceteachers is a particular issue. Only 28 percent of teachers specialized in sciences in 2009 forinstance, down from 40 percent in 2004.
Analyses show poor consistency in teacher allocation across schools, both at the primaryand secondary levels, highlighting management flaws. The average degree of consistencyfor school teacher allocation was 40 percent in 2007, meaning that 60 percent of teacherswere allocated according to criteria other than the level of enrollment. The results underlinethe limits of current management practices and raise the issue of the need for newmonitoring tools to ensure more equitable deployment.
Primary Level PTRs, by School Type, 2000-09
2000 2001 2002 2003 2004 2005 2006 2007 2008 2009
70
60
50
40
30
20
10
0
48
21
56
25
53
24
54
22
56 55
23
47
5957
21
46
28
534641
Government Schools Nongovernmental Schools
PTR
Lake Natron
Arusha45 Kilimanjaro
37
Tanga54
Manyara52
Singida56
Tabora68
Shinyanga73
Mara62
Lake Victoria
Kagera61
Kigoma59
Rukwa65
Mbeya55
LakeTangyanika
Dodoma56
Pwani42
DSM49
Lindi55
Mtwara52
Ruvuma48
Iringa45
Morogoro48
Source: Regional BEST, 2000-07, BEST, 2008 and 2009.
Source: BEST.
Exec
utiv
e S
umm
ary
up from a low 19 to 1 in 2004, government schools accounting for most of the increase,with the average PTR reaching 49 to 1 (against 23 to 1 in nongovernmental schools).

Tanzania Education Sector Analysis 35
The primary teaching profession is more financially attractive in Tanzania than in thesubregion. A Tanzanian primary school teacher earns about US$ 6,560 per year (in 2005purchasing power parity, or 6.1 times GDP per capita), against an average of US$ 4,320 forother African LICs (4.5 times GDP per capita). Although this should facilitate recruitment, italso imposes a constraint on resources. Tanzania is however close to achieving universalprimary education, and as teacher requirements drop in line with the demographic pressure,reducing the primary PTR should be more feasible, improving learning conditions, andultimately, the quality of service.
Secondary school teachers on the other hand are comparatively underpaid, despite theirshortage. Their low compensation (5.9 times GDP per capita, against 7.5 times incomparable countries) is partly due to the high proportion of unqualified teachers at thislevel. MoEVT developed a multipronged Teacher Development and Management Strategyin 2008, focusing mainly on supply-side issues. The attractiveness of the profession shouldalso be reviewed to better retain candidates, inspired by labor market surveys and cross-country comparisons.
The loose school-level relationship between learning outcomes and school resources pointsto weaknesses in pedagogical management. Students from schools that cost the most donot perform the best, and the least endowed schools do not always achieve the worstresults. These patterns show that beyond the issue of resource allocation, the way resourcesare used seems to have a major influence on the level of learning outcomes. Improvingsupervision and accountability at the local level is known to be an effective remedy, throughgreater information on school inputs and performance, favoring school-based managementand teacher incentives.
Coherence in the Allocation of Primary Teachers among Government Schools, 2007
0 500 1,000 1,500 2,000 2,500 3,000 3,500
80
70
60
50
40
30
20
10
0
y = 0.0178x + 1.5023
R2 = 0.5947
Number of Pupils
Num
ber
of T
each
ers
Lake Natron
Arusha45 Kilimanjaro
37
Tanga54
Manyara52
Singida56
Tabora68
Shinyanga73
Mara62
Lake Victoria
Kagera61
Kigoma59
Rukwa65
Mbeya55
LakeTangyanika
Dodoma56
Pwani42
DSM49
Lindi55
Mtwara52
Ruvuma48
Iringa45
Morogoro48
Source: SACMEQ, 2007, authors' computations.

Tanzania Education Sector Analysis36
Exec
utiv
e S
umm
ary
11. The strong disparities in the allocation of education inputs further illustratesmanagement shortcomings.
Significant geographical disparities exist in teacher deployment, with particular allocationissues in remote rural areas. This is striking at the district-level: primary PTRs range from alow 28 to 1 in Iringa district, to levels in excess of 80 to 1, such as in the districts of Ukerewe(129 to 1), Ilala (115 to 1), Chato (95 to 1), Manyoni (91 to 1) and Uyui (89 to 1). In theSikonge district, one school reported an extraordinary PTR of 313 to 1 (PEDP II, 2009). Theaverage urban district-level PTR was 43 to 1, compared with 60 to 1 in rural districts.
Lake Natron
Arusha45 Kilimanjaro
37
Tanga54
Manyara52
Singida56
Tabora68
Shinyanga73
Mara62
Lake Victoria
Kagera61
Kigoma59
Rukwa65
Mbeya55
LakeTangyanika
Dodoma56
Pwani42
DSM49
Lindi55
Mtwara52
Ruvuma48
Iringa45
Morogoro48
Relationship between CSEE Pass Rates and Secondary Level Unit Costs, 2009
- 100 200 300 400 500 600 700 800 900
100
80
60
40
20
0
Unit Costs (Thousands of T Sh)
CSE
E Pa
ss R
ate
(%)
R2 = 0.042
Source: Cost of teachers and textbooks from BEST, 2009; Salaries from Table 3.18; CSEE results from NECTA.Note: Unit costs for the CSEE analysis include teacher salaries and textbook prices.

Tanzania Education Sector Analysis 37
The situation is more critical still as far as qualified teachers are concerned. The pupil toqualified teacher ratio (PqTR) ranges from above 100 to 1 (Ilala, Bahi, Ulanga, Nanyumbu,Ukerewe, Manyoni, Urambo and Uyui districts) to under 35 to 1. This situation implies avery heavy workload for some teachers, potentially negatively affecting their motivation andwillingness to stay in remote areas. This major issue will need to be adequately addressedthrough the implementation of an incentive package that could include cash benefits, ahardship or relocation allowance, fast-track career progression, and/or preferential accessto training and learning materials and improved school environment facilities (includingteachers’ quarters).
Textbooks are generally in short supply in government schools, especially at the secondarylevel, and suffer from misallocation. One textbook is shared by three students on averagein primary and between four to nine students at O-Level, according to the subject. Althoughmany possible explanations exist, the timely transfer and amount of school capitation grantsare definitely related to the lethargic supply. Regional disparities reveal the kind of extremes
Government School Pupil to Teacher Ratios, Primary Level, by Region, 2009
Lake NatronLake Natron
ArushaArusha4545 KilimanjaroKilimanjaro
3737
TangaTanga5454
ManyaraManyara5252
SingidaSingida5656
TaboraTabora6868
ShinyangaShinyanga7373
MaraMara6262
Lake VictoriaLake Victoria
KageraKagera6161
KigomaKigoma5959
RukwaRukwa6565
MbeyaMbeya5555
LakeLakeTangyanikaTangyanika
DodomaDodoma5656
PwaniPwani4242
DSMDSM4949
LindiLindi5555
MtwaraMtwara5252
RuvumaRuvuma4848
IringaIringa4545
MorogoroMorogoro4848
Iringa45
Lake Natron
Arusha45 Kilimanjaro
37
Tanga54
Manyara52
Singida56
Tabora68
Shinyanga73
Mara62
Lake Victoria
Kagera61
Kigoma59
Rukwa65
Mbeya55Lake
Rukwa
LakeTanganyika
LakeNyasa
Dodoma56
Pwani42
DSM49
Lindi55
Mtwara52
Ruvuma48
Morogoro48
Source: BEST, 2009.Legend: Light grey – PTR under 45:1; Medium grey – PTR between 46:1 and 65:1; Dark grey – PTR above 65:1.

Tanzania Education Sector Analysis38
Exec
utiv
e S
umm
ary
that averages can conceal, showing ratios of more than 3.6 pupils per textbook in Kageraand Lindi regions, against 1.3 in Tanga region. The coherence of textbook availability acrossdistricts is weak, with R2 values ranging from 57 percent for math books to 67 percent forEnglish books.
The allocation of capitation grants is also fraught with inefficiencies. They are mainly dueto amounts allocated often being lower than planned budgets, and to delays in thereception of funds by schools. The allocation formula is currently based on expectedenrollment; a more equitable formula would take the different needs of schools intoaccount. Timely fund transfers might be facilitated by the option of sending block grantsfor nonwage spending directly to schools. Finally, to ensure that the funds are spent asplanned, a reliable and sustainable accounting system is to be implemented. Schoolmanagement committees and boards could provide valuable oversight of such functions.Strengthening their capacity in planning, budgeting, monitoring and evaluation is becomingcritical.
These disparities highlight the need for effective planning and monitoring tools to allocateeducation inputs more efficiently. In addition to an EMIS system, financial and humanresource management systems would improve fiscal management and accountability. A firstresponse to this challenge was given in 2009, with the development of a pilot decentralizedBasic-Education Management Information System (BE-MIS), which was tested in 28 districtcouncils in 14 regions, and is to be scaled up to all councils nationwide by 2014.
3.6
2.7
1.4
Availability of English Books in Government Primary Schools, by Region, 2009Pupil - Textbook Ratio
4.0
3.5
3.0
2.5
2.0
1.5
1.0
Num
ber
of P
upils
per
Boo
k
Lake Natron
Arusha45 Kilimanjaro
37
Tanga54
Manyara52
Singida56
Tabora68
Shinyanga73
Mara62
Lake Victoria
Kagera61
Kigoma59
Rukwa65
Mbeya55
LakeTangyanika
Dodoma56
Pwani42
DSM49
Lindi55
Mtwara52
Ruvuma48
Iringa45
Morogoro48
Tang
a
Kili
man
jaro
Rukw
a
Tabo
ra
Mw
anza
Kig
oma
Nat
ion
al
Sing
ida
Shin
yang
a
Man
yara
Iring
a
Dod
oma
Dar
es
Sala
am
Ruvu
ma
Mtw
ara
Aru
sha
Mbe
ya
Mor
ogor
o
Pwan
i
Mar
a
Kag
era
Lind
i
2.7
3.6
1.4
Source: BEST, 2009.

Tanzania Education Sector Analysis 39
12. Higher education is in a favorable position to adequately manage thedevelopment and diversification of the subsector’s supply.
The government has deployed a series of strategies to ensure the adequate and moreconcerted development of both higher education and the TVET subsectors, to supply theeconomy with the increasing number of skilled and knowledgeable professionals it needsto sustain its growth. A solid and modern institutional framework has been established forhigher education’s development: the sector was integrated into MoEVT in 2008 to promotemore integration across education subsectors, and the Tanzania Commission for Universitieshas been strengthened to comply with quality assurance requirements. Various mechanismshave been implemented or are under consideration to improve equity and access, including:(i) a streamlined admissions procedure and centralized admissions system; (ii) an extendednational qualifications framework, building bridges between vocational and universityeducation; (iii) cost-sharing policies; and (iv) student loans, provided to 81 percent of allhigher education students via the HESLB.
Many HLIs are still not running at full capacity, allowing for the expansion of the system atlimited cost. In the sample of HLIs used in this report, the total intake capacity was 50,508,of which only 37,142 places were effectively occupied, or 74 percent. Nevertheless, if thecurrent enrollment trend continues, the need for greater capacity will require imminentattention, considering subject specializations.
University teaching conditions are favorable. Although staff are predominantly male, femaleteachers accounting for just a fifth of HLI teachers in 2009/10: (i) half are aged 40 yearsand under, and 30 percent are aged over 50 years; (ii) 25 percent of the teaching staff werehighly ranked (professor, associate professor or senior lecturer); (iii) almost all lecturers hadthe required level of qualifications; (iv) 87 percent of teachers were full-time; (v) highereducation teaching salaries were very attractive; and (vi) student to teacher ratios averaged15 to 1.
However, the high level of administrative staff in higher learning institutions is an issue. Theratio of administrative staff to teaching staff in the sample used was 1 to 1 on average, insome cases reaching 2.4 to 1, underlining the scope for efficiency gains.
In theory, the country is today adequately equipped to cater for the expected growth in theintake of students. However, to ensure the smooth and coherent development of the sector,attention must be paid to course requirements, and to the likely timescale in which thesubsector is going to expand. The existing state institutions and parastatal agencies shouldbe able to orient this policy both from its supply and its demand side.

Tanzania Education Sector Analysis40
Exec
utiv
e S
umm
ary
13. The TVET system is also endowed with an improved and solid institutionalframework, including regulatory and quality assurance bodies.
TVET coordination is being improved through a new institutional set-up, incorporatingvocational education and training and technical education under MoEVT. The sometimesincoherent development of trainings by individual institutions is being addressed throughthe development of a TVET development programme. Yet, technical and vocationaleducation are still separately managed.
Quality assurance processes have been greatly improved under both NACTE and VETA, through:
• Registration and accreditation standards and procedures. At the end of 2009, 96 percentof the 221 physically recorded technical education institutions were fully or provisionallyregistered, up from 41 percent in 2002. Thirty nine percent were given accreditation;
• Education qualification frameworks, including the National Technical Awards;
• An outcome-based training approach;
• The registration of all technical education teachers. In June 2009, 1,574 out of 2,970had full or provisional registration (53 percent); and
• VETA’s rigorous registration and accreditation guidelines. In 2008, 78 percent of VTCcenters were registered (50 percent provisionally, and 28 percent fully), andunderperforming or unoperational centers’ registration was revoked.
An effective monitoring and evaluation mechanism to make the technical and vocationaleducation more responsive to labor market demands has been put in place. Under VETA,zonal labor market analysts regularly collect data that is then compiled at the national level,and complemented with mini market surveys to track current and prospective industryneeds. FDC training programmes are also demand-driven; curricula are developed afterconducting community training needs assessments. However, labor market surveys are stilllimited by technical education institutions’ capacities and resources, creating a mismatchbetween the development of needed skills and current institutional service delivery.
Source: NACTE.Note: Includes Zanzibar. Out of a total number of 221 HLIs.
Preparatory / Candidacy
Provisional
Full
Total (Full + Provisional)
% (Out of 221 HLIs)
Registration and Accreditation Status of Technical HLIs, 2009
8
35
178
213
96%
33
36
50
86
39%
Registered Accredited
NumberStage of

Tanzania Education Sector Analysis 41
14. TVET nevertheless faces a series of challenges.
Technical and vocational education institutions are facing increasing pressure to supportnew socioeconomic developments and ensure that a growing number of basic andsecondary school leavers are provided with adequate skills to enable them to develop theirfull potential in the workplace. Although regulatory and quality assurance bodies provideimportant guarantees for the controlled development of the TVET subsector, it faces a seriesof challenges:
(i) The diversity of training demand linked to the heterogeneity of the target population(school leavers, technicians wanting to upgrade or change jobs, low skilled/educatedpeople from urban and rural areas);
(ii) The variety of TVET programs and providers (ministries, parastatal agencies, faith-based organizations, NGOs, private institutions, vocational training centers, FolkDevelopment Colleges, and so on);
(iii) The institutional fragmentation of the TVET system, involving two ministries and threedifferent parastatal agencies;
(iv) The practical continuity between VET and TE curricula/programmes, althoughtheoretical bridges do exist between both sectors, as defined in the nationalqualifications’ framework;
(v) The lack of practical mechanisms for vertical academic promotion within VET. Thecompetency-based qualifications framework should facilitate the transition betweenlevels. In 2008 however, only 13 percent of the 889 VTCs offered the CBET.
To date, the training of tutors has not been given enough attention and support. Thetraining of vocational training centre staff is still a major challenge. The shortage of qualityteaching staff and FDC tutors is acute. Trainers’ competencies are focused on methodology,and their practical industrial competencies need reinforcing and updating. Preservice andin-service training opportunities will need to be adequately set up to improve teachingquality.
The TVET system seems to have adequate monitoring tools (such as labor market surveysand tracer surveys) to adequately develop and update curricula according to changingmarket demand and forthcoming economic needs. However, a dynamic connectionbetween TVET training institutions and industry is desirable to sustain and facilitate thesmooth and coherent development of relevant workforce skills.

Tanzania Education Sector Analysis42
Exec
utiv
e S
umm
ary
Adequately diversifying the sources and level of funding will prove key to enable the TVETsubsector and its institutions to meet their goals. Technical institutions particularly lackmodern training equipment and sufficient and relevant learning materials. Cost-sharingmechanisms and granting trainees access to higher education loans should be considered.VET resources are also insufficient to adequately cater for institutions’ operational needs.To complement trainee fees, government grants, the proceeds from fund-raising activitiesand the development and skills levy, the subsector could seek funds from the private sectoror communities, and implement short-term cost-efficiency measures.
15. The way forward should involve more balanced and efficient sector policies.
Important progress has been registered as much on the institutional front (throughcoordination and piloting mechanisms) as on the school coverage one. This has been greatlyhelped by the additional resources devoted to education over the decade. The possibility thatthis trend not be sustained due to competing sectors’ needs calls for more effective educationpolicies and the removal of major inefficiencies. In this context, the Education Sector Analysis(ESA) has helped to identify the following options that are available to policy makers:
• Increase the public resources allocated to secondary education, especially for capitationgrants and more teachers;
• Improve higher education funding mechanisms, by better targeting loan beneficiariesand better taking advantage of potential economies of scale;
• Ensure children enter primary school at the right age;
• Improve secondary access and retention;
• Support pro-poor schooling, starting at primary level;
• Take affirmative action to enhance girls’ participation in school and ensure genderparity at postprimary levels;
• Improve pedagogical management to raise the quality of basic education;
• Reduce disparities in the allocation of education inputs between regions, districts andschools;
• Strengthen the development of literacy programmes targeted at parents, women andactive adults;

Tanzania Education Sector Analysis 43
• Revise TVET budget trade-offs and strengthen TVET coordination mechanisms tobetter respond to the strong and heterogeneous demand;
• Define a funding formula to rationalize the allocation of resources among technicalinstitutions;
• Adequately plan the expansion of TVET and higher education. University students’career objectives and the distribution of graduates by subject area must be adjustedon the basis of the results of relevant tracer surveys;
• Strengthen the EMIS to further improve the coverage and quality of education data atschool and district levels;
• Scale-up the BE-MIS, including decentralized financial and human resource databasesto improve fiscal management and accountability systems.


This education sector analysis (ESA) for mainland Tanzania is a detailed analyticaldocument that offers a comprehensive picture of mainland Tanzania’s educationsector. This ESA is part of an on-going series of education country-specific reportsbeing prepared by government teams, technically supported by UNESCO, the WorldBank and other development partners. The main purpose of an ESA (also known asa Country Status Report, or CSR) is to provide an evidence-based diagnosis of aneducation sector to enable decision-makers to orient national policies. It alsoprovides relevant analytical information to nourish the dialogue between thegovernment and education sector stakeholders, including development partners.In the current development context, marked by the necessity for countries todevelop sound, sustainable and credible strategies and plans in which education isembedded, ESAs represent a valuable and essential tool.
This is the second ESA for Tanzania; the first one having been conducted in 2001.Although its main objective is to provide a comprehensive picture of the educationsystem in 2009 (the last year for which statistics were available), it also providessome analysis of the evolution of the system over the decade, when feasible andrelevant. This second report is also more than an update. It provides more in-depthanalysis on certain aspects of the system: detailed unit costs by subsector, externalefficiency, quality and out-of-school, and technical education and vocationaltraining and higher education in particular. It provides key monitoring andevaluation inputs on the education sector as a whole, that are particularlyvaluable in the framework of the implementation of the Education SectorDevelopment Programme.
Regional Bureaufor Education in Africa