“Education in North Carolina: Facts and ... - BEST...
29
EDUCATION IN NORTH CAROLINA Facts & Figures January 2015 v2.1
Transcript of “Education in North Carolina: Facts and ... - BEST...

EDUCATIONIN NORTH CAROLINAFacts & Figures January 2015
v2.1

This handy guide is designed to give you quick and easy access to key data that will support you in your work to improve North Carolina’s education system.
Students Who goes to school in North Carolina? Where do they go to school? How are students divided across the state?
TalentWho is teaching in K-12 schools in North Carolina? How do K-12 teachers enter the profession? How are K-12 teachers compensated?
Schools & ProgramsHow many schools are in North Carolina? Where do students in North Carolina go to school from Pre-K to Post-Secondary? What schooling options do students have in North Carolina?
School Finance in NCHow is education paid for in North Carolina? How is funding distributed? Where are there funding inequities?
AchievementHow are students performing on state and national assessments? At what rate do North Carolina students graduate from high school and post-secondary programs? How prepared are our students for careers and life? How are students performing in higher education?
BEST NC (Business for Educational Success and Transformation) is a non-profit organization created by business leaders who believe the future of our state’s economy is inseparable from the quality of our education. North Carolina’s public education system must keep pace with the rapidly changing economic landscape of the 21st century. BEST NC supports the creation of the boldest education success story in America, one that nurtures the talents of every student, from early learning to post-graduate, by investing in students, teachers, school leaders, innovation, and establishing high standards of success for all.
BEST NC’s Vision:
Every student graduates with the knowledge, skills and behaviors to succeed in a competitive global economy.
2 3
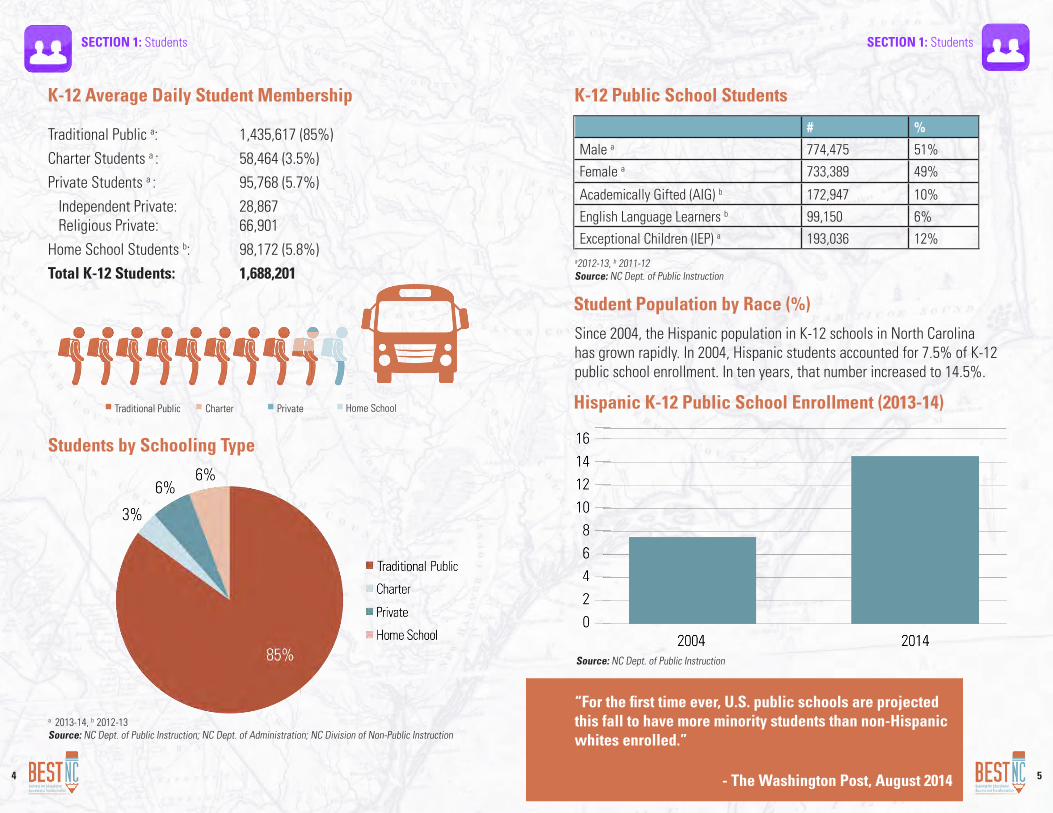
K-12 Average Daily Student Membership
Traditional Public a: 1,435,617 (85%)
Charter Students a : 58,464 (3.5%)
Private Students a : 95,768 (5.7%)
Independent Private: 28,867 Religious Private: 66,901
Home School Students b: 98,172 (5.8%)
Total K-12 Students: 1,688,201
SECTION 1: Students
a 2013-14, b 2012-13Source: NC Dept. of Public Instruction; NC Dept. of Administration; NC Division of Non-Public Instruction
SECTION 1: Students
Student Population by Race (%)
a2012-13, b 2011-12Source: NC Dept. of Public Instruction
# %
Male a 774,475 51%
Female a 733,389 49%
Academically Gifted (AIG) b 172,947 10%
English Language Learners b 99,150 6%
Exceptional Children (IEP) a 193,036 12%
K-12 Public School Students
Traditional Public Charter Private Home School
Since 2004, the Hispanic population in K-12 schools in North Carolina has grown rapidly. In 2004, Hispanic students accounted for 7.5% of K-12 public school enrollment. In ten years, that number increased to 14.5%.
“For the first time ever, U.S. public schools are projected this fall to have more minority students than non-Hispanic whites enrolled.”
- The Washington Post, August 2014
Students by Schooling Type
Hispanic K-12 Public School Enrollment (2013-14)
4 5
Source: NC Dept. of Public Instruction

7
Percent of K-12 Students Eligible for Free orReduced-Price Lunch
56%: The percentage of all K-12 students who were eligible to receive free or reduced price lunchin 2012-13.
Source: NC Dept. of Public Instruction
Source: : NC Dept. of Public Instruction, National Center for Education Statistics
SECTION 1: Students
6
Source: US Census Bureau Current Population Survey (1994-2013)
North Carolina Poverty Rate

Districts with the Highest # of Students Enrolled (2014)
Students
Charlotte-Mecklenburg 10,804
Wake 6,721
Durham 4,776
Guilford 3,553
Forsyth 2,386
Districts with the Highest % of Enrollment (Charter Enrollment/Total LEA Enrollment) (2014)
Percentage
Person 18.5
Pamlico 16.5
Halifax 15
Northampton 13.9
Durham 12.6
3 8%: Overall enrollment in public charter schools in 2014 (compared to 3.0 in 2012).
Source: NC Dept. of Public Instruction .
SECTION 1: Students
Source: NC Dept. of Public Instruction
Charter Schools
School Attendance by Ethnicity (Charter and Traditional Public)
Source: NC Dept. of Public Instruction 9

Number of School Teachers (2013-14)
Source: NC Dept. of Public Instruction
SECTION 2: Talent SECTION 2: Talent
11
Percentage of Total Teachers by Route of Entry (2011-12)
*Data only includes state-funded positions Source: NC Dept. of Public Instruction
The drop in teachers with 2-4 years of experience correlates with a steep decrease in ADM in 2009-10. There were fewer new teachers hired for the 2009-2010 school year compared to surrounding years.
Number of Teachers by Years of Experience (2013-14)*
4 yrs.
10
Percentage of First Year Teachers by Route ofEntry (2011-12)
Source: UNC General Administration
Source: UNC General Administration

12 13
HS GPA, UNC System
The UNC System collects information about the credentials of students in Schools of Education versus all other majors. The charts below summarize data on UNC System graduates from 2013.
Average SAT Scores, UNC System
Source: UNC General Administration
SECTION 2: Talent SECTION 2: Talent
Source: UNC General Administration
SECTION 2: Talent SECTION 2: Talent
Board Certification
NC has more board certified teachers than any other state in the nation with 20,122 teachers in the State identified as being certified in 2013.
Source: National Board for Professional Teaching Standards
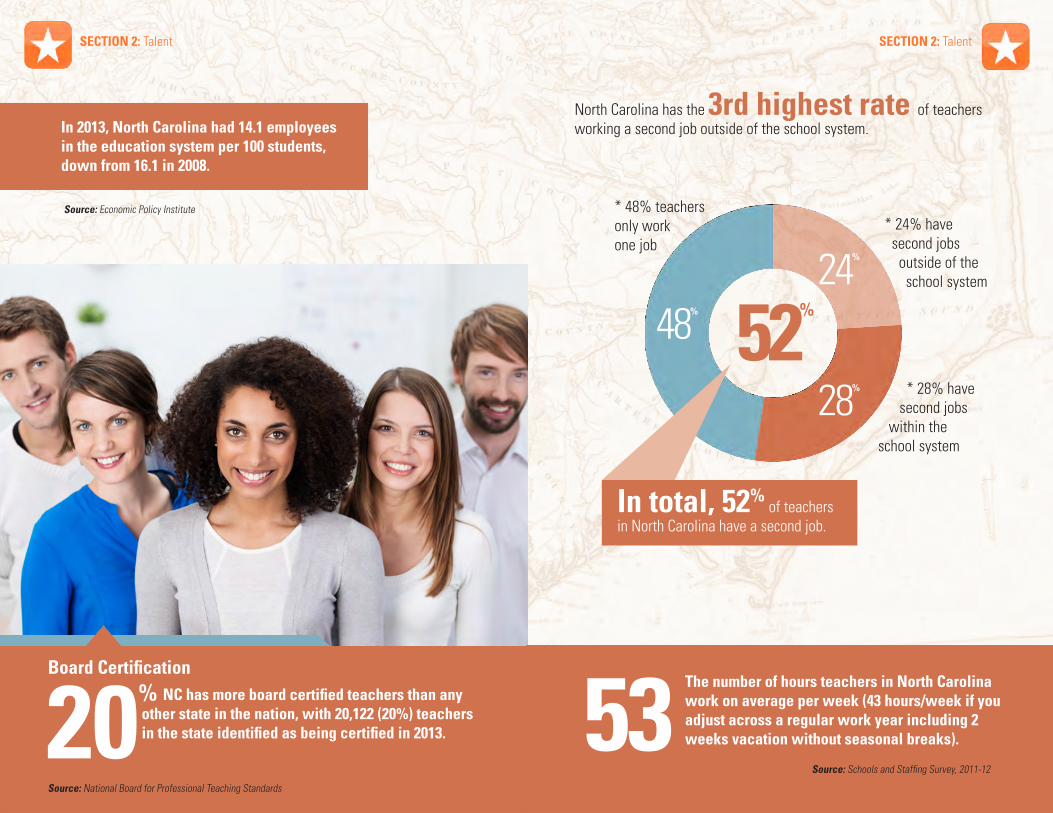
North Carolina has the 3rd highest rate of teachers working a second job outside of the school system.
53The number of hours teachers in North Carolina work on average per week (43 hours/week if you adjust across a regular work year including 2 weeks vacation without seasonal breaks).
52%
* 24% have second jobs outside of the school system
* 28% have second jobs within the school system
28%
24%
48%
* 48% teachers only work one job
In 2013, North Carolina had 14.1 employees in the education system per 100 students, down from 16.1 in 2008.
Source: Economic Policy Institute
20% NC has more board certified teachers than any other state in the nation, with 20,122 (20%) teachers in the state identified as being certified in 2013.
In total, 52% of teachersin North Carolina have a second job.
Source: Schools and Staffing Survey, 2011-12

*Includes intrastate transfers: teachers who transfer from one district to another or from traditional public schools to public charter schoolsSource: NC Dept. of Public Instruction
SECTION 2: Talent
Teacher Turnover 2008-13
Teacher turnover: 14.33% (2012-13)
62.8% of teachers believe that non-instructional time provided for teachers in their schools is sufficient.
66% of teachers agree that they have sufficient instructional time to meet the needs of all students.
Source: 2014 Teacher Working Conditions Survey
SECTION 2: Talent
42% of early education teachers received public assistance within the last three years.
Source: Child Care Services Association, 2013 Workforce Study
Teacher Turnover by County
Source: NC Dept. of Public Instruction; Quick Facts
16 17

Teacher Compensation and Benefits
* This is Schedule ”A” for teachers without a Master’s degree or National Board Certification; includes longevity pay
Source: NC Dept. of Public Instruction, North Carolina General Assembly
Prior to the passage of the 2014-2015 state budget that included a new teacher salary schedule, North Carolina was ranked 47th in the nation for teacher compensation.
Teacher Benefits
Teachers receive an additional 15% of their base pay for retirement, retirement health, disability and life insurance. In addition, teachers receive $4179-$5377 in health insurance benefits annually.
Source: NC Dept. of State Treasurer
SECTION 2: Talent
19
Teacher Evaluation Based on Educator Effectiveness Data (2012-13)
North Carolina teachers are evaluated based on a set of six professionalstandards. They are as follows:
• Standard 1. Teachers demonstrate leadership. • Standard 2. Teachers establish a respectful environment for a diverse population of students.• Standard 3. Teachers know the content they teach. • Standard 4. Teachers facilitate learning for their students. • Standard 5. Teachers reflect on their practice.• Standard 6. Teachers contribute to the academic success of students.
Standards 1-5: 97% of teachers are rated proficient or above. Standard 6: Nearly 80% of teachers meet or exceed expected student growth
Source: NC Dept. of Public Instruction
SECTION 2: Talent
18

SECTION 3: Schools and Programs
K-12 Public Schools by Level (2012-13)Elementary (Grades K-8): 1,834 Secondary (Grades 9-12): 413 Secondary (Grades 9-13 Early College): 73 Combined: 98
K-12 Schools by Type (2013-2014)Traditional Public: 2,436Charter: 127Private: 715Regional: 1Total Schools: 3,279
Source: NC Dept. of Public Instruction; NC Dept. of Administration 33% of the state’s students are served by the largest five out of 115 school districts in North Carolina.
Source: NC Dept. of Public Instruction
NC has 115 school districts.
(otherwise known as LocalEducation Agencies or LEAs)
Distric Size (Students)
# of Districts
Average # of Students
Total # of Students
% of All Students
100,000+ 2 147,712 295,423 21%
75,000-99,999 0 -- -- --
50,000-74,999 3 58,855 176,564 12%
25,000-49,999 8 30,513 244,103 17%
10,000-24,999 22 16,483 362,635 25%
5,000-9,999 31 7,332 227,288 16%
1,000-4,999 47 2,733 128,467 9%
500-999 2 569 1,137 0.1%
20

SECTION 3: Schools and Programs
Five Largest by Student Population:Wake County Schools 153,217Charlotte-Mecklenburg Schools 142,206Guilford County Schools 71,897Winston Salem/Forsyth County Schools 53,316Cumberland County Schools 51,351
Five Smallest by Student Population:Graham County Schools 1,183Jones County Schools 1,123Weldon City Schools 1,036Hyde County Schools 593Tyrrell County Schools 544
Average LEA Size: 12,484 students
Source: NC Dept. of Public Instruction
Five Largest and Five Smallest Districts byStudent Population (2013)
How Many Higher Education Institutions are in North Carolina?
Community Colleges (2014)
58 Public Colleges
UNC System (2014)
17 Public Campuses
North Carolina Independent Colleges and Universities
36 Indep Collegesand Universities
“The General Assembly shall provide that the benefits of The University of North Carolina and other public institutions of higher education, as far as practicable, be extended to the people of the State free of expense.”
– Article IX, Section 9, North Carolina Constitution
SECTION 3: Schools and Programs
22 23
Source: NCICU
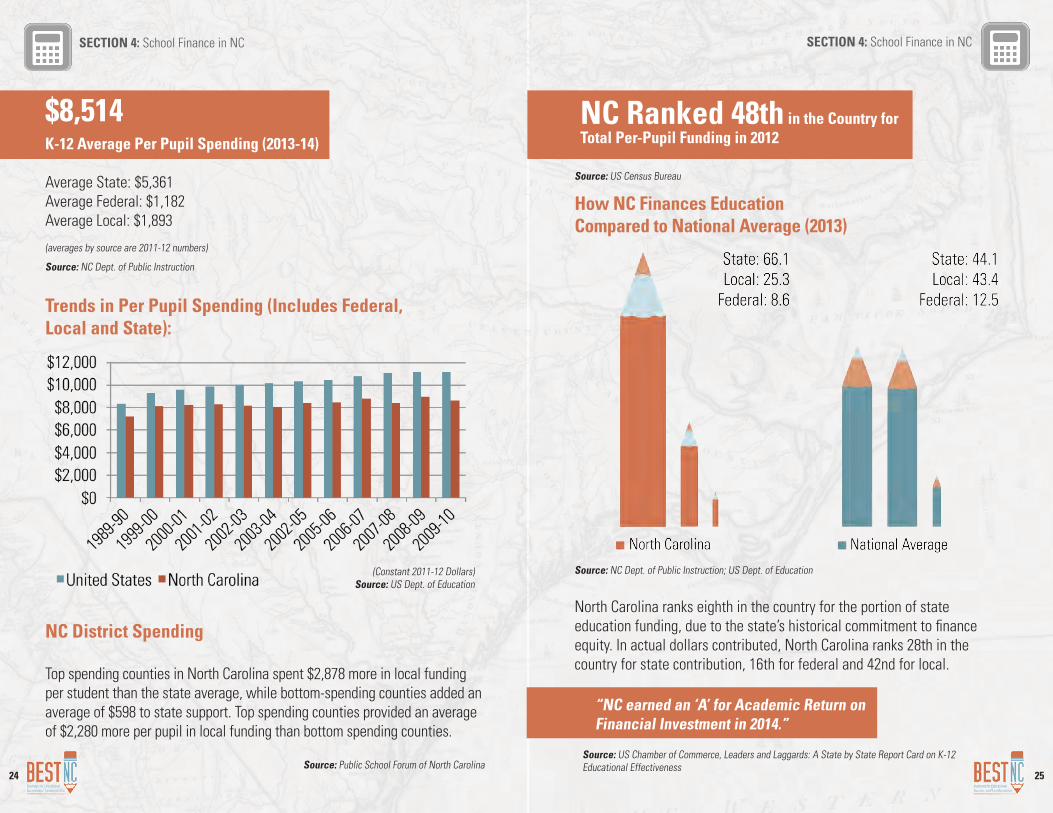
$8,514
K-12 Average Per Pupil Spending (2013-14)
Average State: $5,361Average Federal: $1,182Average Local: $1,893
(averages by source are 2011-12 numbers)
Source: NC Dept. of Public Instruction
Trends in Per Pupil Spending (Includes Federal, Local and State):
NC District Spending
Top spending counties in North Carolina spent $2,878 more in local funding per student than the state average, while bottom-spending counties added an average of $598 to state support. Top spending counties provided an average of $2,280 more per pupil in local funding than bottom spending counties.
Source: Public School Forum of North Carolina
SECTION 4: School Finance in NC
How NC Finances Education Compared to National Average (2013)
Source: NC Dept. of Public Instruction; US Dept. of Education
North Carolina ranks eighth in the country for the portion of state education funding, due to the state’s historical commitment to finance equity. In actual dollars contributed, North Carolina ranks 28th in the country for state contribution, 16th for federal and 42nd for local.
SECTION 4: School Finance in NC
Source: US Chamber of Commerce, Leaders and Laggards: A State by State Report Card on K-12Educational Effectiveness
(Constant 2011-12 Dollars)Source: US Dept. of Education
24
“NC earned an ‘A’ for Academic Return on Financial Investment in 2014.”
NC Ranked 48th in the Country for Total Per-Pupil Funding in 2012
Source: US Census Bureau
25

2013-2014 North Carolina State General Fund Appropriations (*in Millions)
Elementary and Secondary Education: $7,905 (38.5%)Community Colleges: $1,012 (4.9%)UNC System: $2,560 (12.5%)Health and Human Services: $5,020 (24.4%) Child care subsidy: $41 (0.2%) NC Pre-K General Fund: $65 (0.33%) Smart Start: $143 (0.7%)Natural and Economic Resources: $355 (1.7%)Justice and Public Safety: $2353 (11.5%) General Government: $403 (2%)Other: $930.5 (4.5%)
Source: North Carolina Legislature
SECTION 4: School Finance in NC
27
SECTION 4: School Finance in NC
Health and Human Services: $5,020 (24.4%)
Percentage of Total State Income Spent on K-12 Students
Source: Ed Source
26

SECTION 4: School Finance in NC
Access to Technology
Classrooms connected to the internet: 99.8%Average Number of students per internet-connected digital learning device: 1.79
Source: NC Dept. of Public Instruction
“The reliability and speed of Internet connections in this school are suffi-cient to support instructional practices.”
“Teachers have sufficient access to instructional technology, including computers, printers, software and internet access.”
Source: Friday Institute for Educational Innovation analysis of 2014 NC Teacher Working Conditions Survey data. Maps show proportion of teachers in each LEA who Agree or Strongly Agree with each statement.
SECTION 4: School Finance in NC
Where Inequities Still Exist
In 2012, the gap between the highest and lowest spending counties was $2,280 per child, which was an increase of $1,039 since 1997. This means that the highest spending county spent $57,000 more on a classroom of 25 students than the lowest spending county.
Source: Public School Forum of North Carolina
Finance Equity
In 2009, North Carolina tied for 4th place in school finance equity with an inequity index of 9%. This means that variations in state per pupil spending across districts were, on average, 9% above or below the state average. In comparison, Virginia had an inequity index of 17%.
Source: Federal Education Budget Project
28 29

30
SECTION 5: Achievement
Early Education in North Carolina
Licensed Early Education Programs* (2013-14)
North Carolina uses a range of one to five stars to rate early learning programs. Programs that meet minimum standards receive one star, while programs exceeding these basic requirements may volunteer to apply to receive up to five stars.
*Licensed early education programs include licensed child care centers and licensed family child care homes.
Pre-K in North Carolina
North Carolina has distinguished itself as a national leader in pre-K quality. During the 2012-2013 school year, NC Pre-K met all 10 quality standard benchmarks from the National Institute of EarlyEducation Research.
Source: National Institute for Early Education Research
SECTION 5: Achievement
% of NC 4 Year-Olds Enrolled in Pre-K
Early Education – 2013-2014 (Includes Pre-K)
Enrollment: 179,620Sites (Center and Homes): 7,150Quality: 71% of children attend 4 or 5-star programsNumber of Children Receiving Subsidy: 80,457
Pre-K – 2012-2013 School Year
Enrollment: 32,142Sites: 1,218Quality: 80.2% of sites received a 4 or 5-star rating Average class size: 16 studentsEligible for free or reduced-price lunch: 91%State cost per child: $4,960 (2013) All reported spending per child (State + Local + Other): $7,086
Source: Child Care Services Association Data RepositorySince it was initiated in 2001, the North Carolina Pre-K program has served more than 255,000 children. Students enrolled in North Carolina Pre-K attend school for 6.5 hours per day, 180 days per year.
Source: UNC Frank Porter Graham Child Development Institute
31

32
SECTION 5: Achievement
23% of all 4-year-olds in North Carolina are enrolled in Pre-K.
Source: UNC Frank Porter Graham Child Development Institute; National Institute for Early Education Research
State Spending per Child Enrolled in Pre-K*
*Spending in constant 2013 dollars.
End of third grade reading proficiency is the single greatest predictor of high school graduation and later success.
Source: Annie E. Casey Foundation
Standards and Assessments
Prior to the implementation of NC-developed assessments in 2013 aligned to higher standards, North Carolina’s state End of Grade (EOG) assessments were misaligned with national benchmarks. Demonstrated here, while it appeared that 81% and 69% of our students were proficient in math and reading, the National Assessment of Educational Progress (NAEP) scores indicated that North Carolina students were in fact only 43 and 32 percent proficient, respectively in math and reading.
2009 National vs State Results – Before Common Core
North Carolina adopted the Common Core State Standards in 2010 and statewide assessments changed to reflect the new standards. Proficiency ratings are now more closely aligned with national benchmarks. In fourth grade reading, data show fewer than 50 percent of NC students achieving proficiency on state or national assessments.
2013 National vs State Results – After Common Core
Source: Annie E. Casey Foundation 33

NAEP 4th Grade Math – National Trends
2013 NAEP Scores
Source: National Center for Education Statistics
SECTION 5: Achievement
When comparing 2003 to 2013 NAEP score improvements, here is how North Carolina ranks in comparison with other states:
Crisis of Mediocrity
34
NAEP Racial and Income Breakdown (2013)
Percentage of Students Scoring Proficient or Above: 4th Grade
Percentage of Students Scoring Proficient or Above: 8th Grade
35
SECTION 5: Achievement
-------------------------------
--------------------------

SECTION 5: Achievement
NC and International Achievement Comparisons
North Carolina participates in twointernational exams, the PISA (Programfor International Student Assessment,given to 15-year-olds in reading, math andscience) and TIMSS (Trends in InternationalMathematics and Science Study, taken byfourth and eighth grade students in mathand science).
This graph shows where students in theUnited States rank against their peersin 34 OECD countries on PISA. In math,the United States ranks 26th out of 34countries. In reading, we’re 17th, and inscience, US students rank 21st out of 34OECD nations.
2012 PISA ComparisonsUS vs 34 OECD Countries
36

Percentage of Students who took the AP Exam and Passed (2013)
Source: National Center for Education Statistics
Four-Year Cohort High School Graduation Rate by Year
Source: Department of Public Instruction; U.S. Department of Education
SECTION 5: Achievement
On TIMMS, North Carolina students in 4th and 8th grade rank above the international average and the average of participating US states in both science and math. However, because of the limited number of participating countries and US states, we find these data inconclusive about NC’s international competitiveness.
2011 TIMSS Scores
High School
19.3% of the 2013 North Carolina High School Graduating Class passed an Advanced Placement Exam.
National Average: 20.1%
INCONCLUSIVE
38 39

College Preparedness
The ACT and the SAT are both used to measure college preparedness among high school students. In North Carolina, all high school juniors are required to take the ACT. Students are not required to take the SAT, but many opt to do so.
The ACT
Percentage of 2014 ACT-Tested HS Students Who Met College Readiness Benchmarks
In 2014, 47% of NC high school graduates met none of the four ACT college readiness benchmarks
Source: ACT
40
SECTION 5: Achievement SECTION 5: Achievement
Percent of 2009-2013 ACT-Tested High School Graduates Meeting Three or More Benchmarks by Race/Ethnicity
Source: ACT
Asian
44%White
36%Pac. Islander
20%Hispanic
15%Am. Indian
11%Black
7%
41

SECTION 5: Achievement
43
ACT Composite Score Comparisons*
*North Carolina compared with the other 11 states that had comparable (100%) participation in the ACT exams.
Source: ACT 2014
42

The SAT
Percentage of Students Who Took The SAT (2013)
2013 Average SAT Score
44
SECTION 5: Achievement
44
33 % of the state’s students are served by the largest five out of 115 school districts in North Carolina18.9
Source: ACT (on a 36-pt. scale)
: NC’s Average Composite Score on the ACT in 2014.

UNC System
Enrollment
More than 220,000 students enrolled In-State: 188,353 Out-of-State: 32,657
Source: UNC
Graduation Rates (2010)
Source: The Chronicle of Higher Education
71% of students who go to UNC after receiving their associate’s from the NCCCS graduate within 4-years.
Employment
• 77% of graduates* were employed in NC within 1 year of graduation
• 63% of graduates* were employed in NC within 5 years of graduation
*all subjects, all colleges, 2007-2008
Source: NC Tower
47
Remedial Education
% of UNC Freshman Enrolled in Remedial Courses (Fall 2011)Math 6.3English 2.5Taking both remedial courses 7.3
UNC Remedial Enrollment and Expenditures
Source: UNC
$1,821,3212011 expenditures for remedial/developmental activities
46
SECTION 5: Achievement SECTION 5: Achievement

SECTION 5: Achievement
North Carolina High School Graduation Ratesby Subgroups (2011-12)
Graduates Dropouts# % # %
White 53,343 53% 5,098 45%Black 25,855 26% 3,679 33%Hispanic 9,180 9% 1,753 16%Asian 7,063 7% 124 1%Multiracial 2,999 3% 350 3%Am. Indian 1,307 1% 205 2%Pac. Islander 86 0% 8 0%Total 99,833 11,217
49
Source: NC Dept. of Public Instruction
SECTION 5: Achievement
North Carolina Community College System
Enrollment
More than 850,000 students served annually
2012-2013 Full Time Equivalent Enrollment: 241,513 2012-2013 Diploma Program FTE: 13,021 2012-2013 Certificate Program FTE: 7,997Source: NC Community Colleges
Employment
• 83% of graduates* were employed in NC within 1 year of graduation• 76% of graduates* were employed in NC within 5 years of graduation
* all subjects, all colleges, 2007-2008
Source: NC Tower
North Carolina Independent Colleges and Universities
Enrollment
More than 89,000 students enrolled
• 69,000 Undergraduate• 20,000 Graduate• Of the 89K, 54K from NC
Source: NCICU
4826.8
%: of NC Residents with a Bachelor’s Degree or Higher (persons 25+, 2008-2012)
National Average: 28.5%
Source: US Census (Persons 25+, 2008-2012).
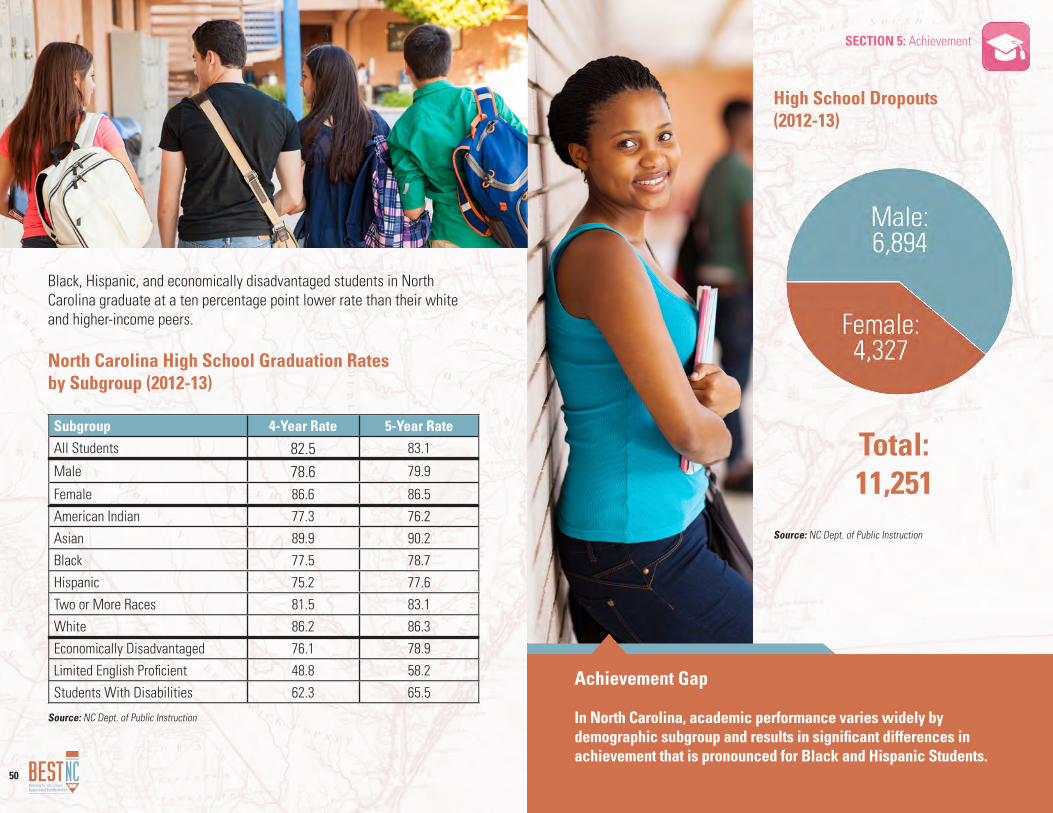
High School Dropouts(2012-13)
Total: 11,251
Source: NC Dept. of Public Instruction
SECTION 5: Achievement
Achievement Gap
In North Carolina, academic performance varies widely by demographic subgroup and results in significant differences in achievement that is pronounced for Black and Hispanic Students.
50
North Carolina High School Graduation Ratesby Subgroup (2012-13)
Subgroup 4-Year Rate 5-Year Rate
All Students 82.5 83.1
Male 78.6 79.9
Female 86.6 86.5
American Indian 77.3 76.2
Asian 89.9 90.2
Black 77.5 78.7
Hispanic 75.2 77.6
Two or More Races 81.5 83.1
White 86.2 86.3
Economically Disadvantaged 76.1 78.9
Limited English Proficient 48.8 58.2
Students With Disabilities 62.3 65.5
Source: NC Dept. of Public Instruction
Black, Hispanic, and economically disadvantaged students in North Carolina graduate at a ten percentage point lower rate than their white and higher-income peers.
SECTION 5: Achievement
Putting it All Together
In North Carolina, 8 out of 10 students graduate from high school.
2013 4-Year NC High School Graduation Rate: 82.4%
Based on ACT data, approximately
6 of those 8 students are preparedfor college.
Of those 6 students who enter college,
59% or approximately 3 students
will graduate from a UNC campus within 6 years.
2008 4-Year Graduation Rate (All UNC Campuses): 40.4%53
SECTION 5: Achievement
52
NC Educational Attainment by Race/Ethnicity (2008)
Source: National Governors Association

SECTION 5: Achievement
2012 NC Median Earnings and Unemployment Rate by Education Level
55Source: BLS and American Community Survey
SECTION 5: Achievement
Skills Gap
In 2020… 67% of North Carolina jobs will require some postsecondary education
58% of North Carolina adults in 2013 have that level of education
34% of adults age 25 and older in North Carolina have an associate’s degree or higher
Source: Center for Education in the Workforce (Georgetown University)
54

BEST NC’s mission is to unite an engaged and informed business perspective to dramatically transform and improve North Carolina’s public education system.
BEST NC President and CEO: Brenda Berg
BEST NC Vice-President of Policy and Research: Julie Kowal
Thanks to Katie Hagan, LEE Summer Fellow, for her tenacity and attention to detail in the creation of this report.
www.BEST-NC.org© Copyright 2014-2015. Best NC | Business for Educational Success and Transformation.
BEST NC Board:
Chair: Walter McDowell
Members:Emma BattleBrenda BergHannah GageJames F. GoodmonAnn B. Goodnight Venessa Harrison
Leroy LailJane Lewis-Raymond Leigh McNairyRobert A. NiblockJim PhillipsJohn Replogle
Pat RileyThomas VaidhyanPaul WilesBrad Wilson
“The General Assembly shall provide by taxation and otherwise for a general and uniform system of free public schools… wherein equal opportunities shall be provided for all students.”
– Article IX, Section 2(1), North Carolina Constitution