
Edinburgh 2020 digital changes everything v10
55
“Digital Changes Everything” Why , How and Some Examples
-
Upload
ian-abbott-donnelly -
Category
Environment
-
view
45 -
download
0
Transcript of Edinburgh 2020 digital changes everything v10
“Digital Changes Everything”
Why , How and Some Examples
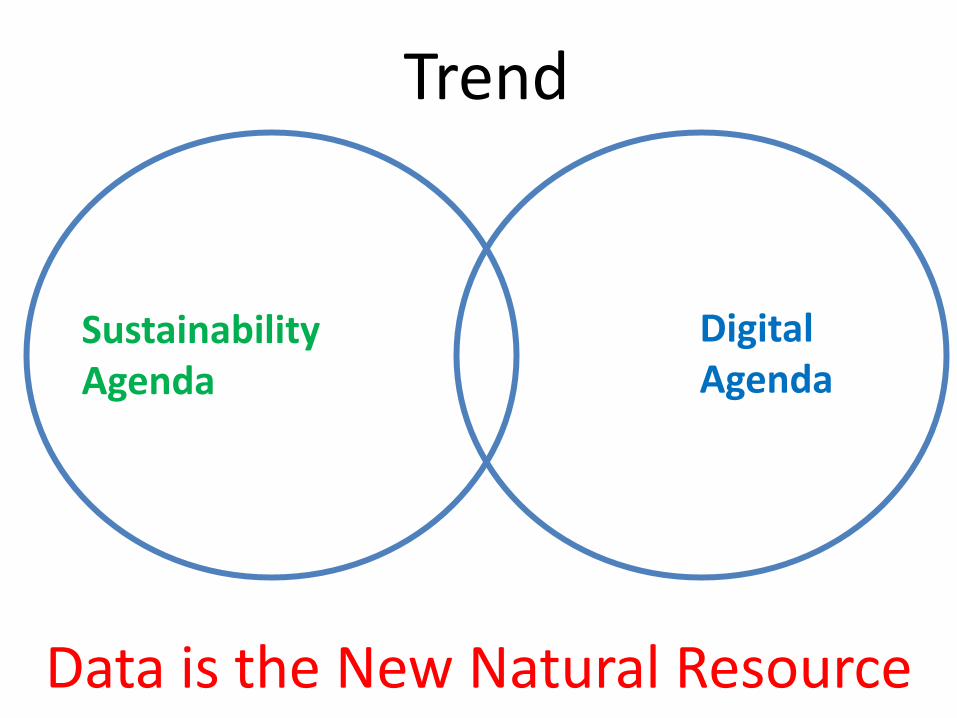
Digital Agenda
Sustainability Agenda
Data is the New Natural Resource
Trend
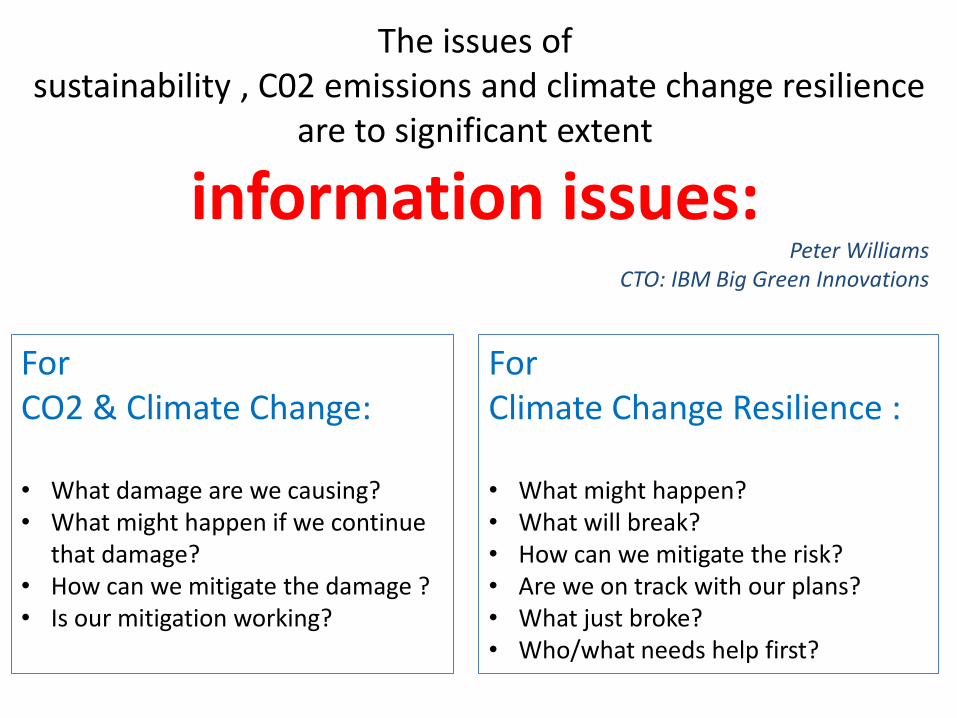
The issues of sustainability , C02 emissions and climate change resilience
are to significant extent
information issues: Peter Williams
CTO: IBM Big Green Innovations
For CO2 & Climate Change: • What damage are we causing? • What might happen if we continue
that damage? • How can we mitigate the damage ? • Is our mitigation working?
For Climate Change Resilience : • What might happen? • What will break? • How can we mitigate the risk? • Are we on track with our plans? • What just broke? • Who/what needs help first?
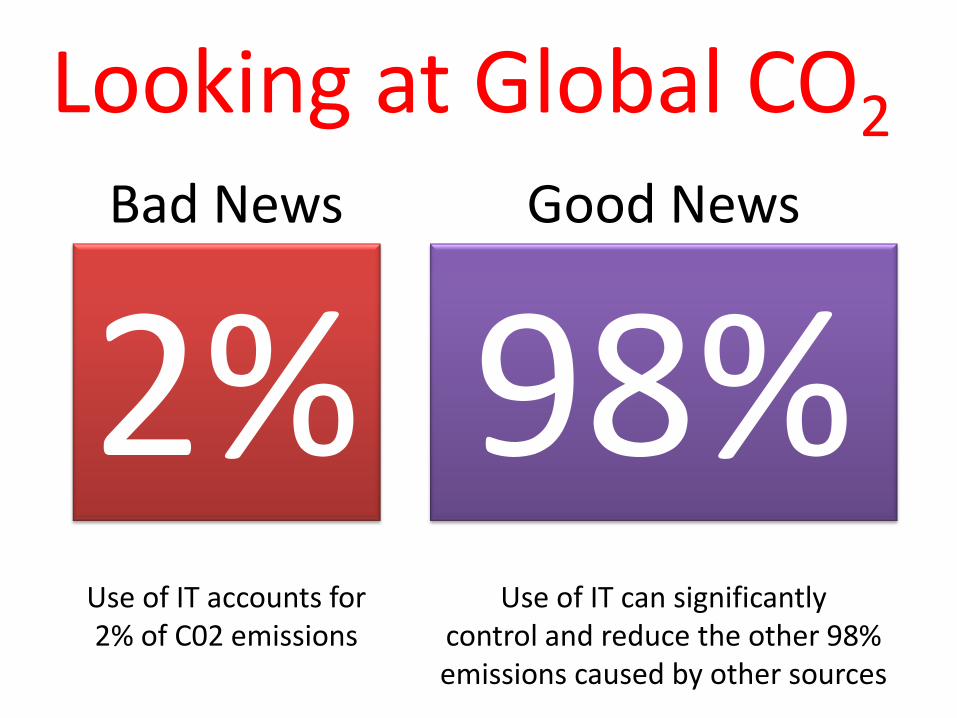
Looking at Global CO2
Bad News Good News
2% 98% Use of IT accounts for 2% of C02 emissions
Use of IT can significantly control and reduce the other 98% emissions caused by other sources

What is driving the change?
It is estimate …
1 billion transistors per human
Each costing
1/10 millionth of a cent.

http://research.ibm.com/cognitive-computing/neurosynaptic-chips.shtml#fbid=TlDdajeaAJZ
IBM: SyNAPSE Chip: 5 Billion Transistor Inspired by the brain, very low power consumption

An opportunity to think and
act in new ways :
economically, socially and
environmentally.
+ + =
A Smarter Planet
Something profound is happening….
Instrumented
Interconnected
Intelligent

As a New Natural Resource Data is changing quickly
Vo
lum
e o
f D
ata
Perc
enta
ge o
f U
nce
rtai
n d
ata
9
Big Data
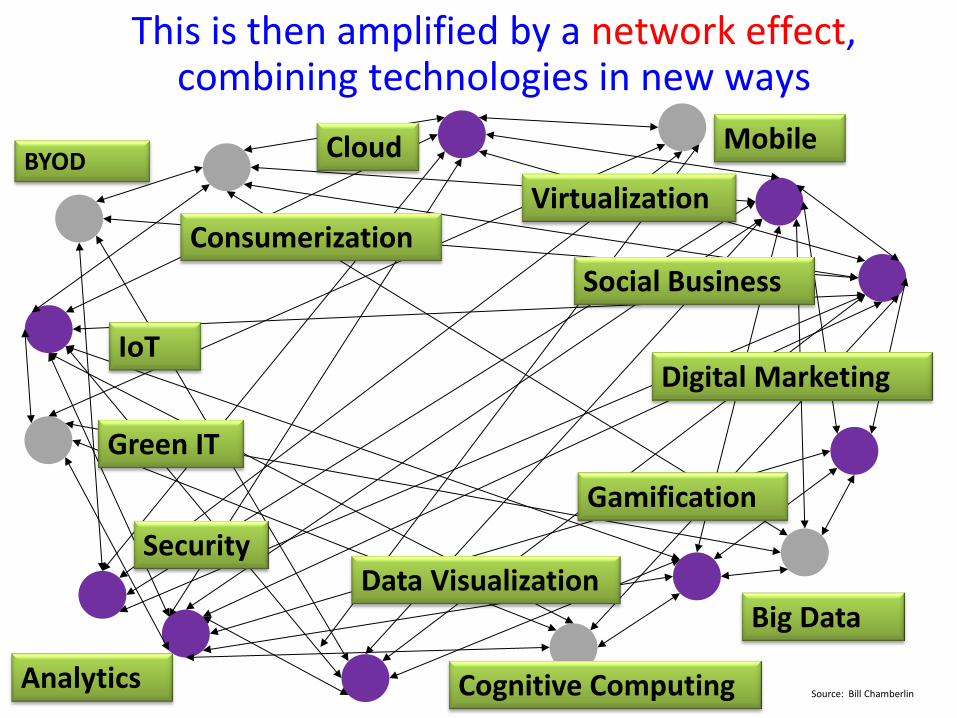
This is then amplified by a network effect, combining technologies in new ways
Source: Bill Chamberlin
Cloud
Virtualization
Social Business
Mobile
Data Visualization
Green IT
Analytics
Consumerization
BYOD
Digital Marketing
Cognitive Computing
IoT
Gamification
Security
10
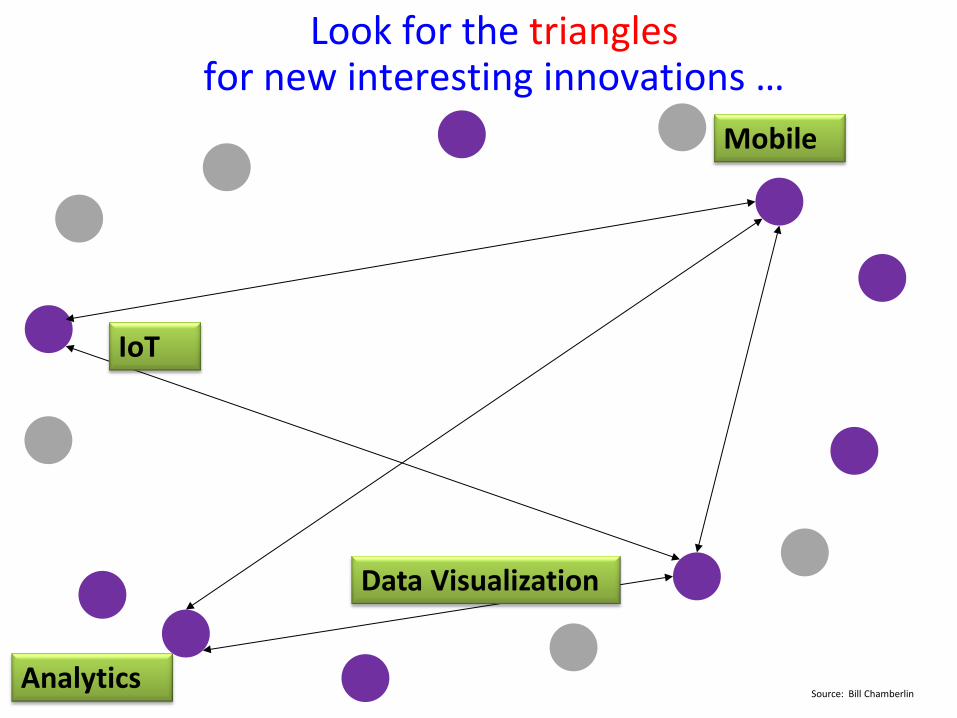
Look for the triangles for new interesting innovations …
Source: Bill Chamberlin
Mobile
Data Visualization
Analytics
IoT

What makes a system smarter?
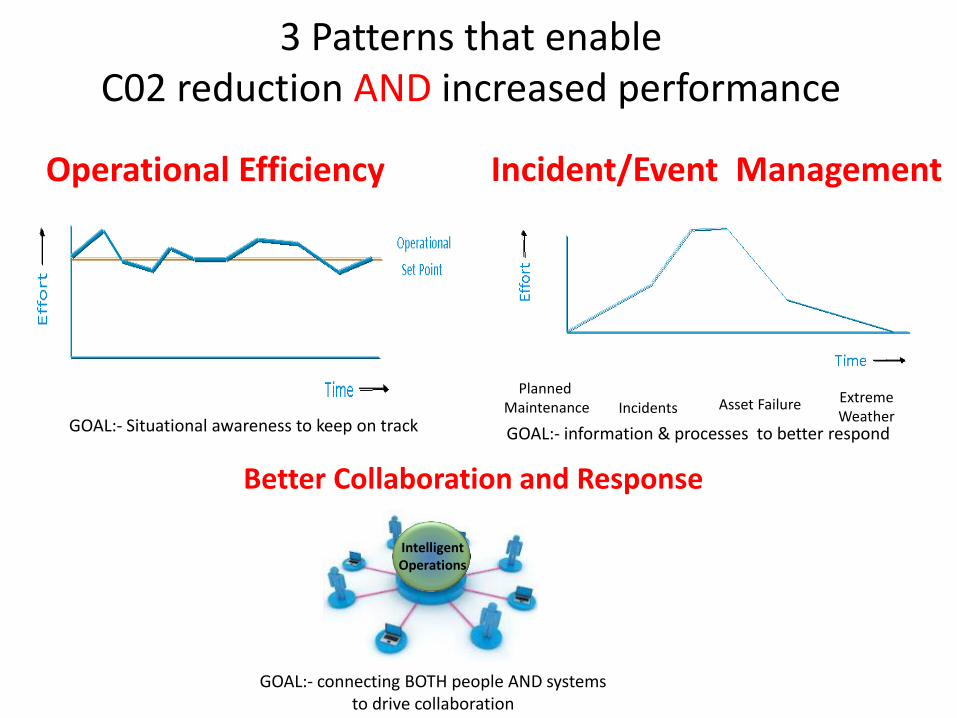
3 Patterns that enable C02 reduction AND increased performance
Operational Efficiency Incident/Event Management
Planned Maintenance Asset Failure Extreme
Weather GOAL:- Situational awareness to keep on track GOAL:- information & processes to better respond
Incidents
GOAL:- connecting BOTH people AND systems to drive collaboration
Intelligent Operations
Better Collaboration and Response

• Situational awareness • Analytics • Smarter response
Foresight examples: • Cave Man • Agricultural Revolution • Industrial Revolution • Digital Revolution • Environmental Revolution
What is it that drives the ability to change the system?
Foresight
Some Examples of the
Digital Agenda enabling improvements
in CO2 reduction
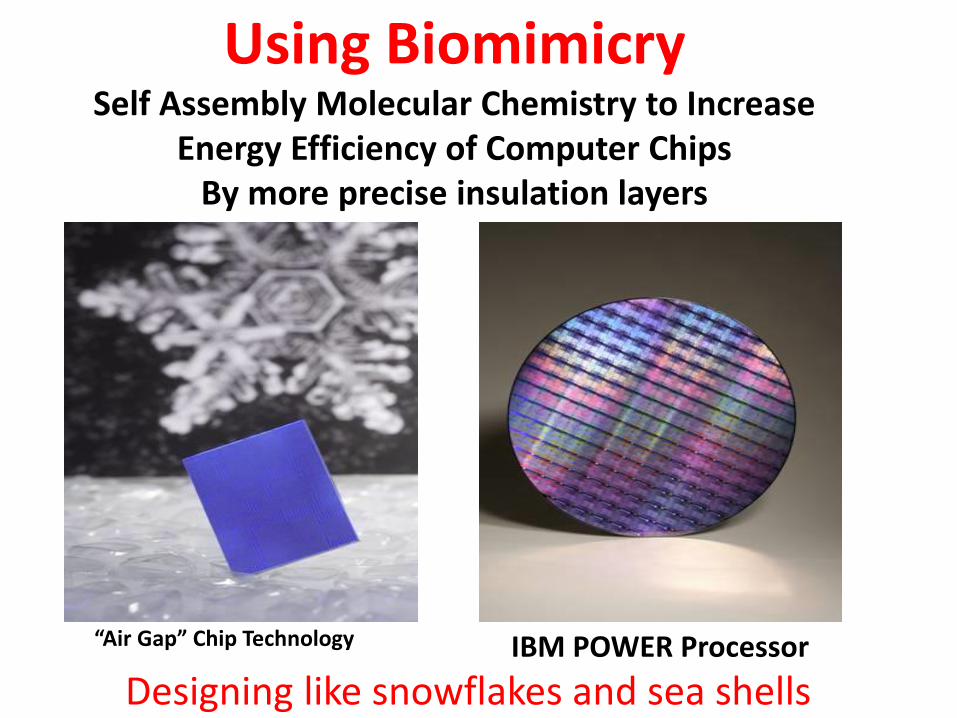
Using Biomimicry Self Assembly Molecular Chemistry to Increase
Energy Efficiency of Computer Chips By more precise insulation layers
IBM POWER Processor
“Air Gap” Chip Technology
Designing like snowflakes and sea shells

IBM & Airlight Energy
Solar Concentrator: IBM Zurich:

IBM & Airlight Energy
Poly-generation: Electricity, Heat, Cooling

Solar Concentrator = Sun x 2000 • Simple Materials: concrete structure, Plastic foil film mirrors • High efficiency solar cells • Supercomputer Cooling Output = 50% overall system efficiency 12 kwatts of electrical power 20 kwatts of heat (on a sunny day) Hot Water at over 85 DegC
http://www.ted.com/watch/ted-institute/ted-ibm/gianluca-ambrosetti-solving-the-energy-crisis-one-sunflower-at-a-time

Visualising Sustainability
Data Visualisation
Insight and change happen here
with people in the system
Collaboration
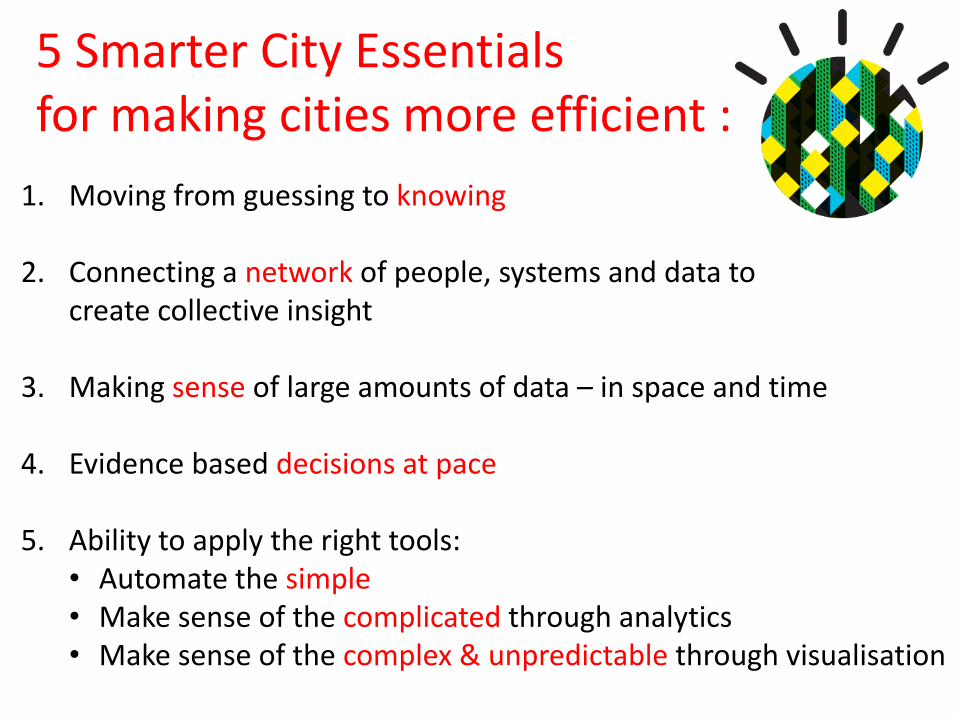
1. Moving from guessing to knowing
2. Connecting a network of people, systems and data to create collective insight
3. Making sense of large amounts of data – in space and time
4. Evidence based decisions at pace
5. Ability to apply the right tools: • Automate the simple • Make sense of the complicated through analytics • Make sense of the complex & unpredictable through visualisation
5 Smarter City Essentials for making cities more efficient :
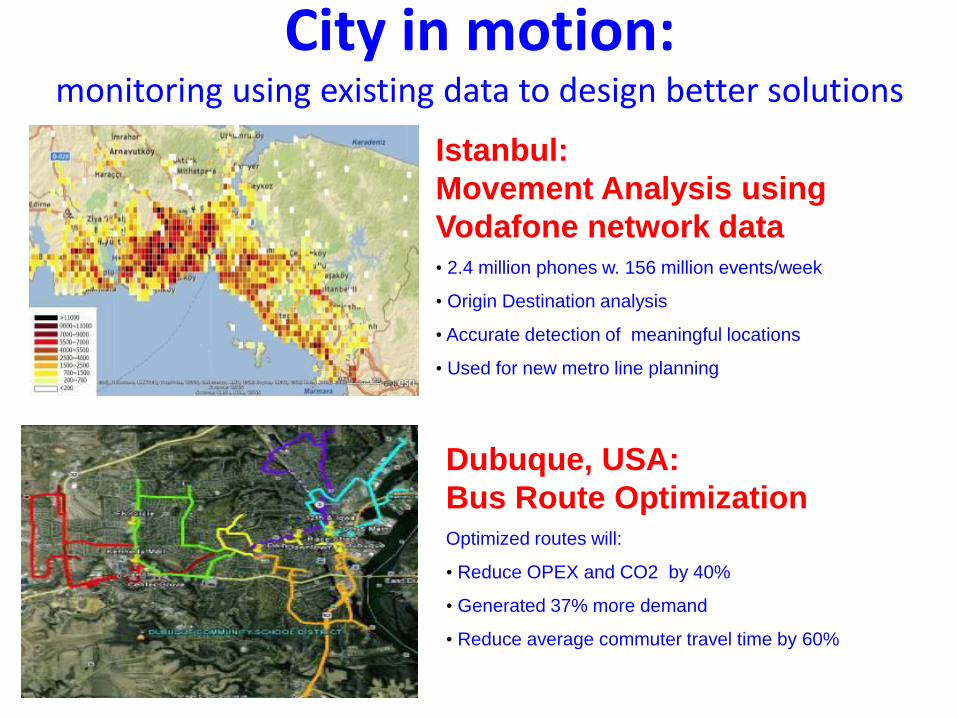
City in motion: monitoring using existing data to design better solutions
Istanbul:
Movement Analysis using
Vodafone network data • 2.4 million phones w. 156 million events/week
• Origin Destination analysis
• Accurate detection of meaningful locations
• Used for new metro line planning
Dubuque, USA:
Bus Route Optimization Optimized routes will:
• Reduce OPEX and CO2 by 40%
• Generated 37% more demand
• Reduce average commuter travel time by 60%

Seeing the Whole System: Dublin Bus Network
Public Transport Awareness Tool
used by citizens and planners
‘Open Data’ + ‘Big Data’

http://www.smartplanet.com/blog/business-brains/predictive-analytics-at-work-predicting-traffic-jams-before-they-occur/10543
Smarter transport: Singapore, San Francisco and Lyon
One hour ahead, 85% accuracy

Peterborough Bedford Manchester
Out of city 90 000
Tonnes
Bedford Manchester
In to city Tonnes
Peterborough
Flow of Regulated Commercial Waste
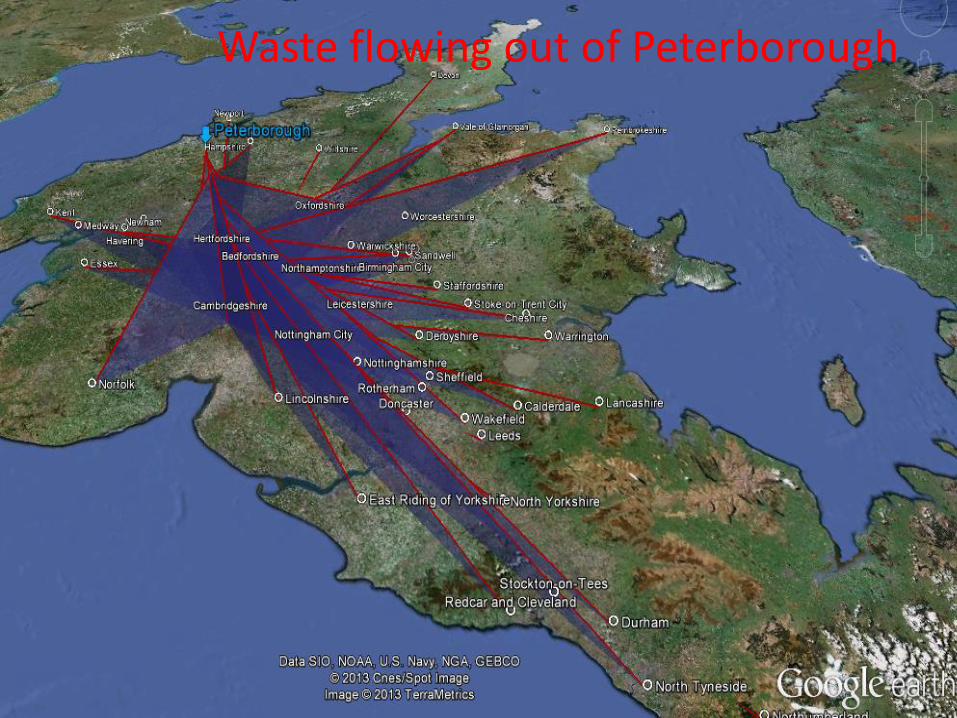
Waste flowing out of Peterborough

Waste flowing into Peterborough

Hydro Electric: Situational Awareness, Analytics & Smarter Response Creating alternatives to coal fired power generation

Understanding the impact on the river flow
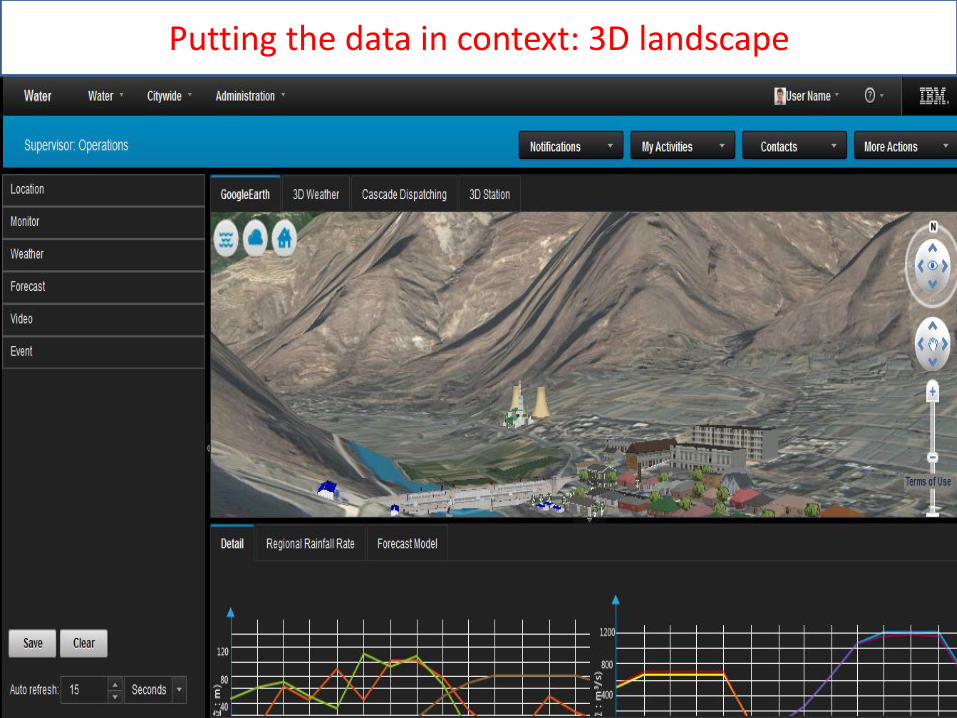
Putting the data in context: 3D landscape
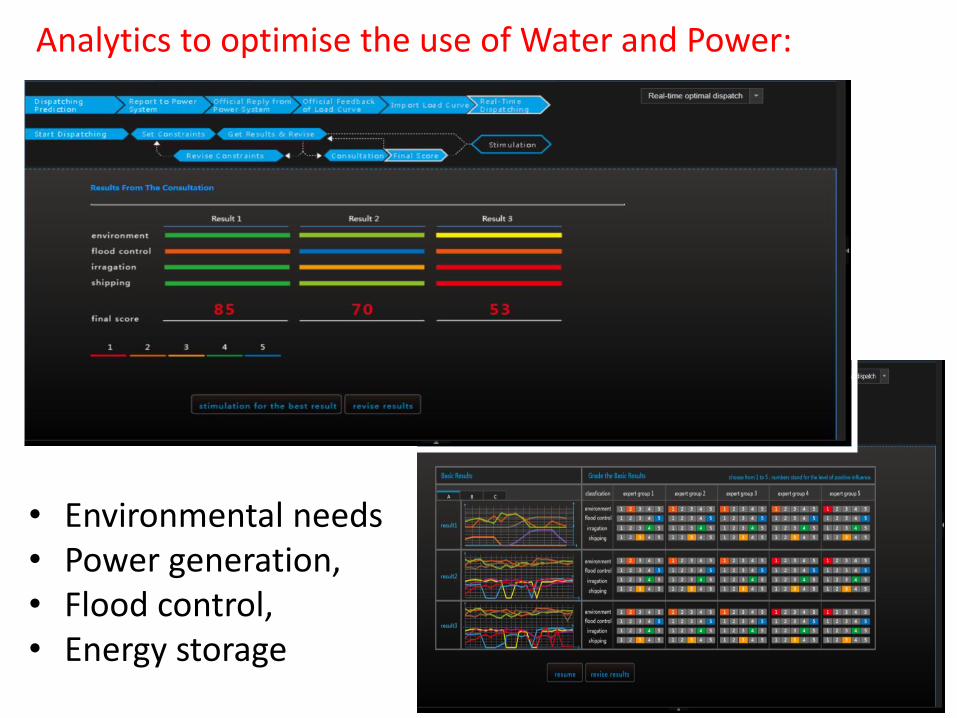
Analytics to optimise the use of Water and Power:
• Environmental needs • Power generation, • Flood control, • Energy storage

Using open data about public building
Jump to Google Earth
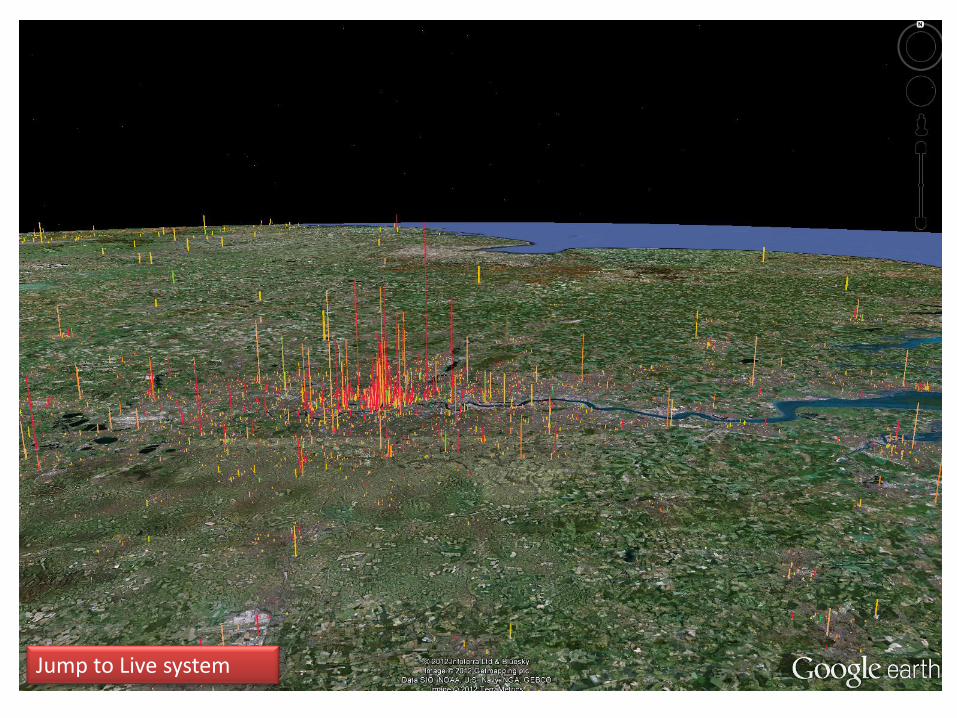
Jump to Live system
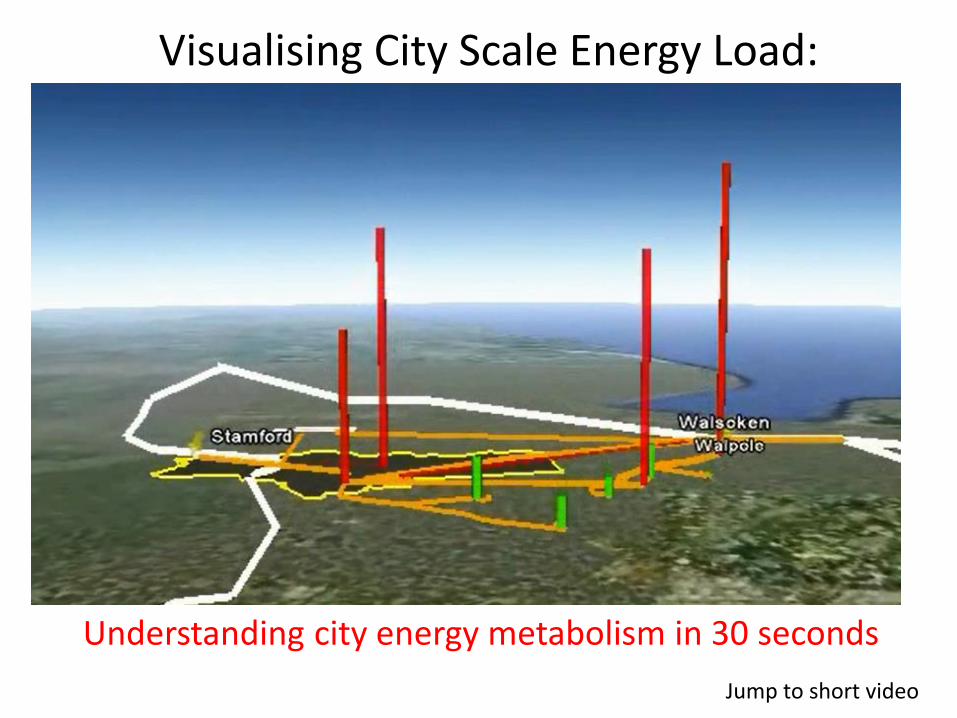
Understanding city energy metabolism in 30 seconds
Visualising City Scale Energy Load:
Jump to short video
IoT: Internet of Things
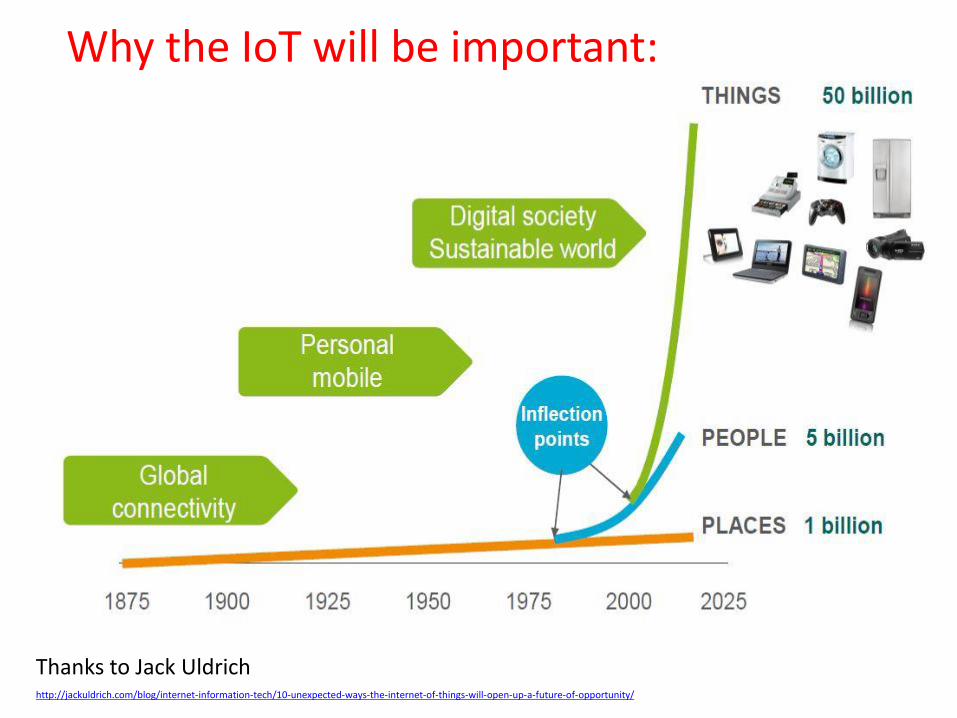
Why the IoT will be important:
http://jackuldrich.com/blog/internet-information-tech/10-unexpected-ways-the-internet-of-things-will-open-up-a-future-of-opportunity/
Thanks to Jack Uldrich

Fine Scale Environmental Sensing
High density data to create new insights (3D)
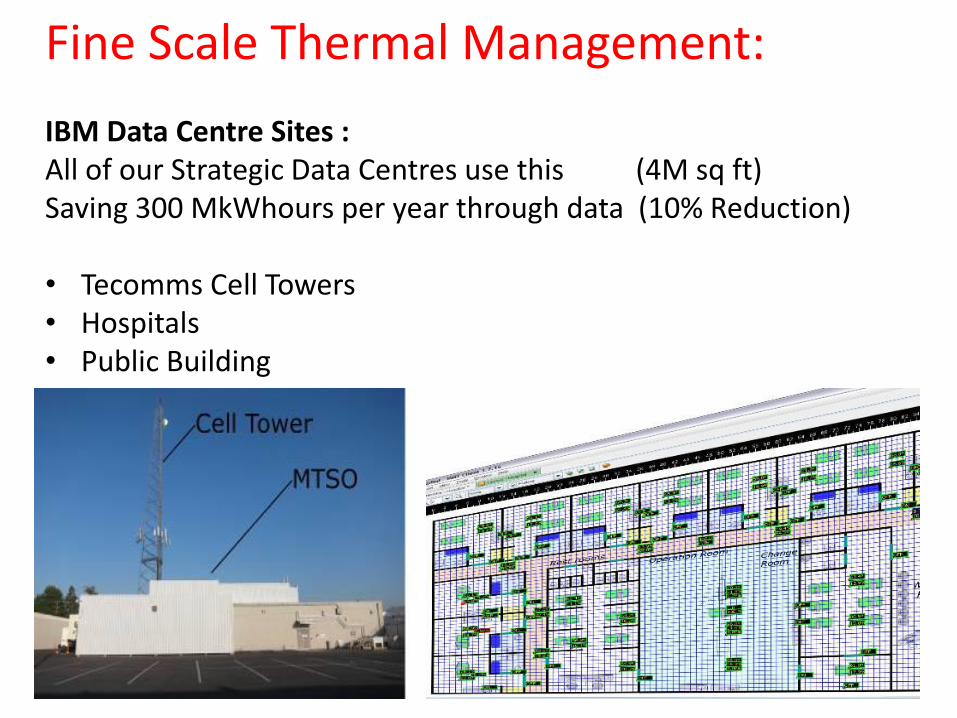
Fine Scale Thermal Management: IBM Data Centre Sites : All of our Strategic Data Centres use this (4M sq ft) Saving 300 MkWhours per year through data (10% Reduction)
• Tecomms Cell Towers • Hospitals • Public Building
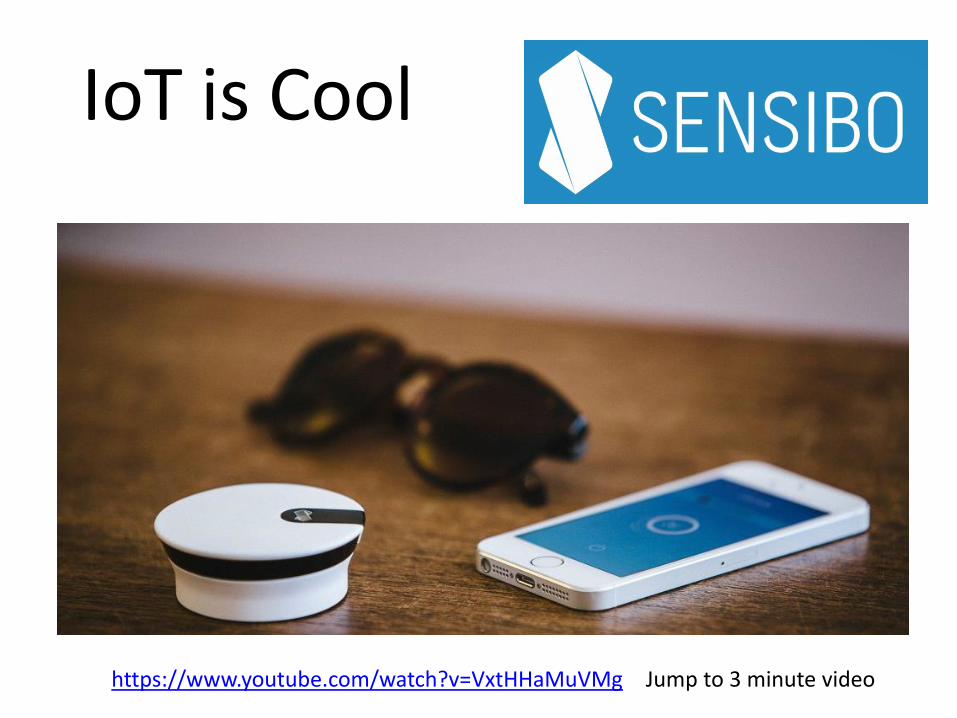
https://www.youtube.com/watch?v=VxtHHaMuVMg Jump to 3 minute video
IoT is Cool
What is needed in the future?
Data by itself doesn’t do anything
without some creativity…
this is where you come in.

Principles in Information Science will be of use:
1. Whole system design (not sub)
2. Caching (clever use of read ahead)
3. Pipelining (fine scale priority management)
4. Real-time awareness (always monitoring and optimising)
5. Distributed inputs (creating systemic resilience)
6. The importance of storage in the system
7. Keeping things pure / Design for disassembly
A B C From Linear To Network
We need to find the ‘Moore’s Law’ for CO2
relentless performance improvement ‘doing more with different’
A
E B
D C

Cognitive Computing:
People Compute power
Automation People Compute
power Programming
• Natural Language • Unstructured data • Confidence levels • Feedback by design
Computing is Changing: How could this be used to reduce CO2?
Programming:
Imagine: Doing 10,000 weeks of reading
in 15 seconds and understanding all the relationships !
Ingest Learn Test
Experience

Jump to One Example: • Watson Debater
• Watson Analytics • Watson Discovery • Watson Engagement Advisor • Watson Healthcare • Watson API

Replace Energy, Resources and CO2
With Information and Design
The grand challenge is to…
In summary:
“Digital Changes Everything” that’s when

44
Thank-you Ian Abbott-Donnelly
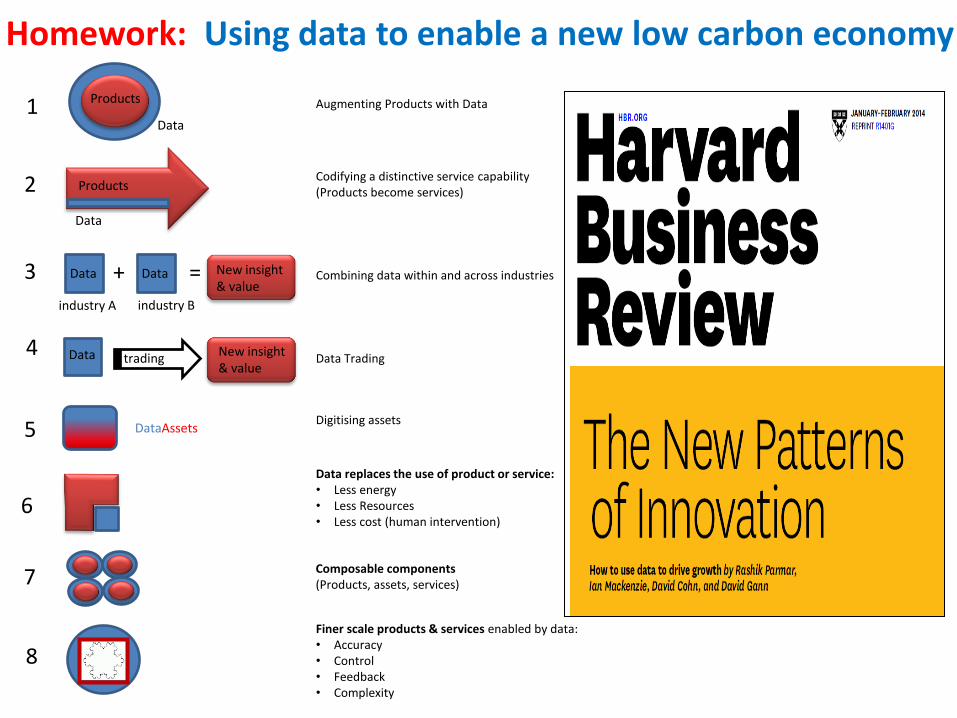
Augmenting Products with Data
Products
Data
Codifying a distinctive service capability (Products become services)
+ industry B
industry A
New insight & value
= Combining data within and across industries
New insight & value
trading Data Trading
DataAssets Digitising assets
Data replaces the use of product or service: • Less energy • Less Resources • Less cost (human intervention)
Data
Products
Composable components (Products, assets, services)
Finer scale products & services enabled by data: • Accuracy • Control • Feedback • Complexity
Data
Data Data
Homework: Using data to enable a new low carbon economy
1
2
3
4
7
6
5
8

Foresight creating a network of benefits Where projects in one domain create multiple benefits in other domains
Energy Management
Pipe Failure Prediction
Distributed incident management
Leakage management
Customer Portal
Situational Awareness
Meter data analytics
External Data
Weather Impact and
recovery
Understanding the system dynamics
using data
Example from Water Utility
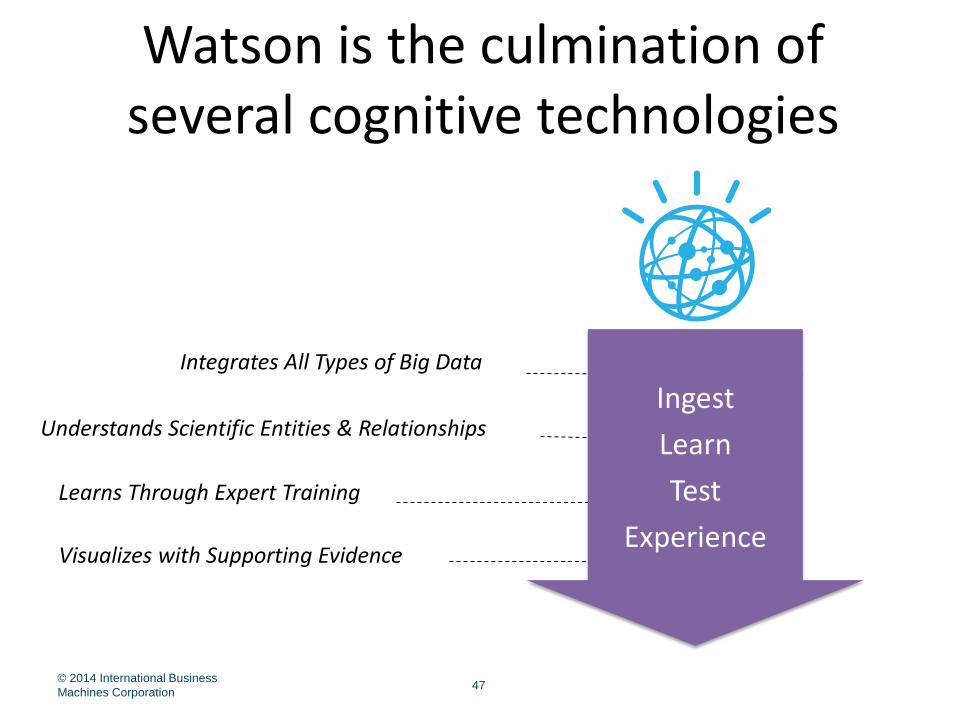
Watson is the culmination of several cognitive technologies
© 2014 International Business
Machines Corporation 47
Visualizes with Supporting Evidence
Learns Through Expert Training
Understands Scientific Entities & Relationships
Integrates All Types of Big Data
Ingest
Learn
Test
Experience

Watson enables insights by connecting and analyzing hundreds of internal and external data sources in minutes rather than weeks
© 2014 International Business
Machines Corporation 48
Learn
Test
Experience
Ingest
16M+ patents from
US, Europe, WIPO
23M+ abstracts
100+ journals
50+ books
11,000+ drug labels
20,000+ genes
12M+ chemical
structures Watson Corpus
Over 1TB of data
Over 40m
documents
Over 100m entities
and relationships
Internal Data
In vitro tests
In vivo studies
Compounds
Toxicology reports
Clinical trial data
Lab notes
Other
Available External Data
Chemical database
Public genomics
Medical textbooks
Medline
Other journals
FDA drugs/labels
Patents
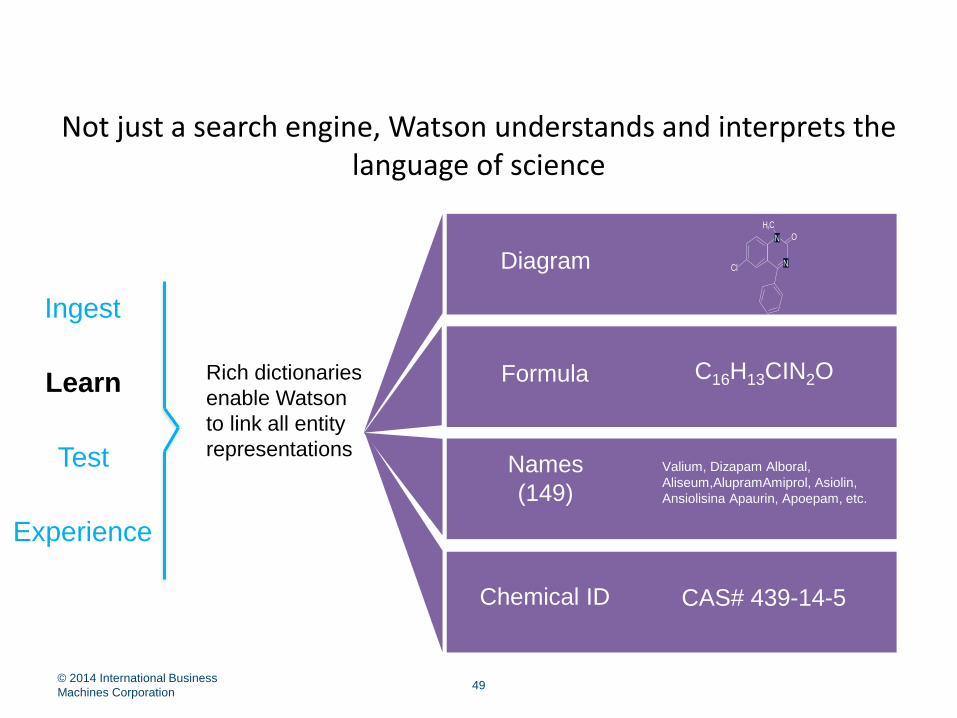
Not just a search engine, Watson understands and interprets the language of science
© 2014 International Business
Machines Corporation 49
Learn
Test
Experience
Ingest
Diagram
Formula
Names
(149)
Chemical ID
Valium, Dizapam Alboral,
Aliseum,AlupramAmiprol, Asiolin,
Ansiolisina Apaurin, Apoepam, etc.
CAS# 439-14-5
C16H13CIN2O Rich dictionaries
enable Watson
to link all entity
representations
H C3
O
CI N
N
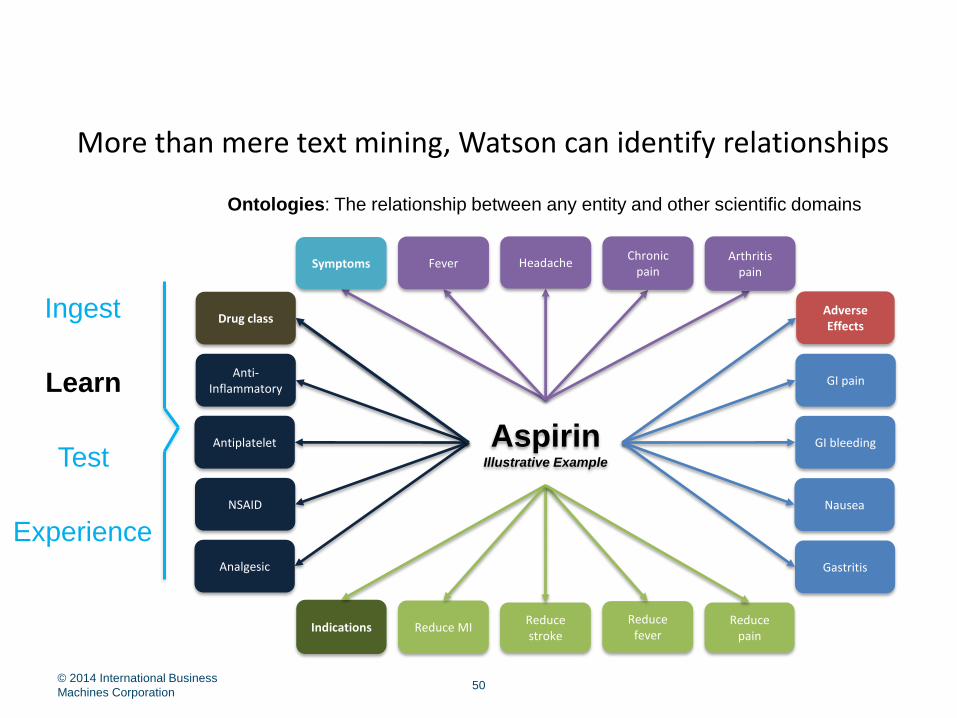
More than mere text mining, Watson can identify relationships
© 2014 International Business
Machines Corporation 50
Learn
Test
Experience
Ingest
Symptoms Arthritis
pain Chronic
pain Fever Headache
Drug class
Antiplatelet
NSAID
Analgesic
Adverse Effects
GI pain
Gastritis
GI bleeding
Nausea
Indications Reduce MI Reduce stroke
Reduce fever
Reduce pain
Anti-Inflammatory
Aspirin Illustrative Example
Ontologies: The relationship between any entity and other scientific domains

Annotators allow Watson to read and extract appropriate information
© 2014 International Business
Machines Corporation 51
Learn
Test
Experience
Ingest
…doxorubicin results in extracellular signal-regulated kinase (ERK)2 activation, which in turn phosphorylates p53 on a previously uncharacterized site, Thr55…
Extracts Preposition Recognizes preposition location on Thr55
Extracts Entities ERK2 = Protein, P53 = Protein, Thr55 = Amino Acid
Extracts Verb Maps to domain of Post Translational Modification
Recognizes subject / object relationships
Extracts Entities ERK2 = Protein, P53 = Protein, Thr55 = Amino Acid
Extracts Entities ERK2 = Protein, P53 = Protein, Thr55 = Amino Acid
ERK2
phosphorylates
p53
on
Thr55

Machine learning enables Watson to teach itself over time
© 2014 International Business
Machines Corporation 52
Learn
Test
Experience
Ingest
Aspirin
GI Pain
Valium
Depression
Annotator
Logic
Watson Applies
Annotators to Text
Watson Creates
Knowledge Graph
• Aspirin is an antiplatelet indicated to
reduce the risk of myocardial
infarction
• Known side effects include
Gastrointestinal (GI) pain, GI upset,
ulcers, GI bleeding, and nausea
• Valium or Diazepam is a
benzodiazepine derivative, indicated
for the treatment of anxiety, muscle
spasms
• Valium may cause depression,
suicidal ideation, hyperactivity,
agitation, aggression, hostility…
• Drug = entity
• Side effect = entity
association cause
• Cause = relating verb
• Rule = 1 drug to 1
side effect

Machine learning also enables Watson to learn from experts
© 2014 International Business
Machines Corporation 53
Learn
Test
Experience
Ingest
Aspirin
GI Pain
Valium
Depression
Watson Creates
Knowledge Graph
Drugs can
have
more than
one side
effect
Expert
Interventio
n
Watson Applies Annotators &
Refines Knowledge Graph
Aspirin
GI Pain
GI Upset
Nausea
Ulcers
GI Bleed
Depression
Valium
Agitation
Aggression
Hostility
Hyperactivity

Beyond mere algorithms, Watson evaluates supporting evidence
© 2014 International Business
Machines Corporation 54
Learn
Test
Experience
Ingest • Quantity
• Proximity
• Relationship
• Domain Truths/
Business Rules
What genes
contribute to
developing
colon cancer?
Search
Corpus
Extract
Evidence
Score &
Weigh Question
• Side Effects
• Lab Notes
• Genes
• Publications
• Drugs
• Animal Models
• Clinical Trial
Data

The Result: Watson enables breakthrough insights after analyzing thousands of articles and other corpus data in minutes
© 2014 International Business
Machines Corporation 55
Learn
Test
Experience
Ingest
Gene Network
csnk1dros1 pdlim7
prkcg
aurka
nrgn
cdc20ugcg
hist1h1c
ca2
dach1
prb3
ccnb11
ppm1d
tp53inp1
mms
tpt1csnk2a1
mapk1
plk1
csnk1g2
ppp2r4
cdk7
gfm1
mapk14
mdm2hipk4
arl2
mapkapk2
cdk1
dyrk2
mapk8
chek1
tceal1
h2afx
brca1
jun
card16
atm
atr
stat3
cdk5
plk3
cdk9
mapk10chek2
ep300mapk9
nuak1mgst1
pdik1lptch1
tgm2
cdc25c
ccne1dnm1l
krt20kat2b
bbc3
stk11
nr1h2
cdk2
chmp1a
aldh1l1
slco6a1
e2f1
prrt2 csnk1a1tmprss11d
ephb2bard1
ptk2b
agt
cdkn2a
ccn2a
ptgs2
hdac6vhl
tbppin1
sgsm3
dyrk1aprkdc
des
dusp26
tp53
60534927591476718347480Proto-Oncogene Proteins
141062882603331334542169757Phosphorylation
19045070423056756308401Cell Cycle
75224756202167488821588076Cell Line
4106135439013003642528911125571728Humans
8943133032023216123305620060Apoptosis
137131016023957713092515820178Mice
27206382254401022216311004235507Animals
439241028910736465036465Tumor Suppressor Protein p53
2230471239721062969612327Aged
3942162138117609900130313252Mutation
268225416411321262984714728Middle Aged
623391893366485163922215559Signal Transduction
750
0
0
0
chek1
1745
255
0
198
cdk2MeSH Name Total pik3ca p53 braf chek2 epha2
Adult 12112 763 10291 928 144 47
Phosphatidylinositol 3-Kinases 11066 10726 0 271 0 0
Immunohistochemistry 10127 710 8930 309 38 57
Protein-Serine-Threonine Kinases 7413 2076 2600 162 1287 0
High
Affinity
Moderate
Affinity
Some
Affinity
no
Affinity
• Select entities from two different ontologies (i.e.
disease/gene)
• Visualize co-occurrence
• Use statistics to spot the intersections
• Drill down to see the evidence
• Select two or more genes of interest
• See network of relationships
• Show strength, nature & proximity of the relationship
• Colored vectors indicate the nature of the interaction
• Hover over connections to see the evidence
Co-occurrence Table