EDGE EFFECTS ON THE FLOW CHARACTERISTICS IN A 90° TEE JUNCTION
45
* Corresponding author FE05-1268 Pinho 1 EDGE EFFECTS ON THE FLOW CHARACTERISTICS IN A 90° TEE JUNCTION N. P. Costa 1 , R. Maia 1 , F. T. Pinho 2,3* , M. F. Proença 1 1 Departamento de Engenharia Civil, Faculdade de Engenharia da Universidade do Porto Rua Dr. Roberto Frias, 4200-465 Porto, Portugal, [email protected] , [email protected] , [email protected] 2 Centro de Estudos de Fenómenos de Transporte, Faculdade de Engenharia da Universidade do Porto, Rua Dr. Roberto Frias, 4200- 465 Porto, Portugal, [email protected] 3 Universidade do Minho, Largo do Paço, 4704- 553 Braga, Portugal, [email protected] 6 th May 2006 Abstract Measurements of pressure drop were carried out for the flow of a Newtonian fluid in 90° tee junctions with sharp and round corners. Rounding the corners reduced the energy losses by between 10 and 20%, depending on the flow rate ratio, due to the reduction in the branching flow loss coefficient, whereas the straight flow basically remained unaffected. The corresponding detailed measu rements of mean and turbulent velocities for a Reynolds number of 31,000 and flowrate ratio of 50% showed that rounding the corner lead to an increase in turbulence in the branch pipe. The increased turbulence diffused momentum more efficiently thus reducing the length of the recirculation by 25% with its width and strength also decreasing in magnitude. The overall effect of the increased dissipation due to turbulence and reduced dissipation due to mean flow irr eversibilities in the recirculation was a decrease in the corresponding loss coefficient.
-
Upload
fabian-n-zapata -
Category
Documents
-
view
217 -
download
0
Transcript of EDGE EFFECTS ON THE FLOW CHARACTERISTICS IN A 90° TEE JUNCTION
8/12/2019 EDGE EFFECTS ON THE FLOW CHARACTERISTICS IN A 90° TEE JUNCTION
http://slidepdf.com/reader/full/edge-effects-on-the-flow-characteristics-in-a-90-tee-junction 1/44
* Corresponding author
FE05-1268 Pinho 1
EDGE EFFECTS ON THE FLOW CHARACTERISTICS IN A 90° TEE JUNCTION
N. P. Costa1, R. Maia1, F. T. Pinho2,3*, M. F. Proença1
1Departamento de Engenharia Civil, Faculdade de Engenharia da Universidade do Porto
Rua Dr. Roberto Frias, 4200-465 Porto, Portugal, [email protected], [email protected],
2Centro de Estudos de Fenómenos de Transporte, Faculdade de Engenharia da Universidade
do Porto, Rua Dr. Roberto Frias, 4200- 465 Porto, Portugal, [email protected]
3Universidade do Minho, Largo do Paço, 4704- 553 Braga, Portugal, [email protected]
6th May 2006
Abstract
Measurements of pressure drop were carried out for the flow of a Newtonian fluid in 90°
tee junctions with sharp and round corners. Rounding the corners reduced the energy losses
by between 10 and 20%, depending on the flow rate ratio, due to the reduction in the
branching flow loss coefficient, whereas the straight flow basically remained unaffected. The
corresponding detailed measurements of mean and turbulent velocities for a Reynolds number
of 31,000 and flowrate ratio of 50% showed that rounding the corner lead to an increase in
turbulence in the branch pipe. The increased turbulence diffused momentum more efficiently
thus reducing the length of the recirculation by 25% with its width and strength also
decreasing in magnitude. The overall effect of the increased dissipation due to turbulence and
reduced dissipation due to mean flow irreversibilities in the recirculation was a decrease in the
corresponding loss coefficient.

8/12/2019 EDGE EFFECTS ON THE FLOW CHARACTERISTICS IN A 90° TEE JUNCTION
http://slidepdf.com/reader/full/edge-effects-on-the-flow-characteristics-in-a-90-tee-junction 2/44
FE05-1268 Pinho 2
1. INTRODUCTION
Tee junctions are frequently present in industrial systems and water distribution networks
where there is the need to separate or merge flows. Disturbances from a condition of straight
fully-developed flow, such as those created by fittings and accessories, dissipate extra energy
[1], which is directly proportional to the intensity of the disturbance. Since 90° tee junctions
are very disturbing accessories that lead to separated and reverse flows they account for large
energy losses if present in large quantities, hence improvements are welcome to reduce the
energy bill.
Rounding the corner can help reduce pressure losses, but the separating point becomes
dependent on outlet flowrate ratio, outlet to inlet pipe diameter ratio, pipe roughness and flow
regime. The extent and magnitude of these changes are still poorly understood and
documented and constitute the motivation for the present study. Here, the diverging turbulent
Newtonian flow in a 90° tee junction with sharp corners is experimentally investigated in
detail and its flow characteristics are compared with those pertaining to a similar junction with
rounded corners.
The amount of available information on 90° T-junction flows is rather limited or old and
consequently less accurate. The flow is highly complex and three-dimensional and is not
accessible to any simplified theoretical analysis. The first series of systematic experimental
work in this geometry was carried out in Munich by Vogel [2], who investigated the division
and merging of flows in non-symmetric bifurcations, analysing the effects of branch pipe
diameter and edge radius. Gardel [3,4] included the effects of area ratio, branch angle and
curvature of the junction and derived semi-empirical expressions for the local loss
coefficients.
In the 1960s various researchers attempted to justify theoretically the semi-empirical
formulae [5]. A theoretical definition of the streamlines and wall pressure distribution in the

8/12/2019 EDGE EFFECTS ON THE FLOW CHARACTERISTICS IN A 90° TEE JUNCTION
http://slidepdf.com/reader/full/edge-effects-on-the-flow-characteristics-in-a-90-tee-junction 3/44
FE05-1268 Pinho 3
90° tee was carried out by Iwanami et al [6] based on potential flow theory to help understand
the mechanisms of pressure loss. They considered the straight pressure loss similar to that in a
sudden enlargement whereas the branch pressure loss was modeled as the sum of the loss in a
contraction followed by a sudden enlargement. Other investigations in the nineteen sixties and
seventies were aimed at confirming and extending results of previous research [7].
More recently, Maia [7] concluded that the traditional pressure field characterization was
no longer enough to improve the design of pipe accessories, but required a deeper knowledge
of the relationship between flow geometry, pressure field and flow kinematics. Sierra
Espinosa et al [8,9] investigated round-edge tees and compared a limited set of measurements
with simulations by the standard k ! " model, the renormalisation group theory (RNG) k ! "
model and the standard Reynolds stress (RSM) turbulence models. These models were able to
predict the mean flow qualitatively, but the comparisons involving the standard k ! " and
RNG models were poor except on the approach flow. Downstream of the T-junction, the RSM
could not predict well the mean flow as it overpredicted significantly the extent of the
recirculation region in the branch pipe, but it reproduced well the anisotropy of the Reynolds
stress tensor. However, careful inspection shows that none of these models did a good job.
Recently, Páal et al [10] used an RSM and the shear stress transport (SST) k !" model of
Menter [11] to calculate the flow in a 90° tee junction with sharp edges; they were able to
predict the mean flow reasonably well, but k was significantly under-predicted. The good
performance of the SST model was due to its improved ability to deal with separated and
rapidly strained flows.
Systematic investigations on the effects of rounding the corner were initially carried out by
Boldy [12] and Ito and Imai [13], which became the basis of the standard data on energy loss
coefficients for tee junctions of the BHRA- British Hydromechanics Research Association
[14].

8/12/2019 EDGE EFFECTS ON THE FLOW CHARACTERISTICS IN A 90° TEE JUNCTION
http://slidepdf.com/reader/full/edge-effects-on-the-flow-characteristics-in-a-90-tee-junction 4/44
FE05-1268 Pinho 4
Today, there is renewed interest on tee junction flows because of the usefulness of
diverging flows as separating devices for multi-phase systems found in chemical and power
plants [15-17] and the presence of a large number of bifurcations in living organisms even
though here the bifurcation angle is less severe [21-25]. In general, in two-phase flow
bifurcations there is phase separation with dramatic effects on the pressure differences, and
this strongly depends on the geometry, its orientation and type of fluid. Expressions for
pressure drop were developed, commonly based on single-phase loss coefficients, taking into
account the effects of branch orientation, flow direction (horizontal or vertical, upward or
downward) and its interaction with phase separation [15-17]. More recent research developed
split models for annular gas/ liquid separation and measured in detail such flows and in
particular the position of the interface [18,19]. Numerical methods have also been developed
to deal with gas-liquid and liquid-liquid phase separation in T-junctions; Issa and Oliveira
[20] used a pressure-volume fraction velocity correction scheme in a conventional
seggregated two fluid approach finite volume method.
In living organisms, bifurcations are present in the respiratory and the circulatory system.
Here, the approach flow is never fully-developed, the pipe is tapered, the flow is time-
dependent and the angle of bifurcation is usually well below 90°. These investigations are
usually in the laminar flow regime [21], very often transient [22], fluids are non-Newtonian
[23] and geometries have similarities to true arteries [24], i.e., consecutive junctions in tapered
ducts and transient flow. Less often, but equally important, are investigations in convergent
flow as carried out by Ravensbergen et al [25], amongst others.
The present contribution is aimed at experimentally characterizing and comparing the
flows in two similar tees having different edges at the junction: one has a sharp-edged
connection between the branch pipe and the main straight pipes whereas the second tee has
round edges.

8/12/2019 EDGE EFFECTS ON THE FLOW CHARACTERISTICS IN A 90° TEE JUNCTION
http://slidepdf.com/reader/full/edge-effects-on-the-flow-characteristics-in-a-90-tee-junction 5/44
FE05-1268 Pinho 5
2. TEST RIG AND INSTRUMENTATION
The experiments were carried out in the closed loop rig schematically shown in Fig. 1. The
test section was made of two parts: the three 2m long pipes (pipe test section) and the
corresponding extension forming the tee junction test section. The pipe test sections were
manufactured from drawn tube with internal diameters of 30.8 mm ± 45 µm. To reduce
optical refraction of laser beams, during the laser-Doppler anemometry measurements, the tee
test section was carefully machined from rectangular blocks of acrylic. It comprised the
bifurcation piece and the three adjoining straight pipes, each of these with 19 to 26 diameters
of overall length for the straight and branch pipes, respectively.
For the sharp-edge tee bifurcation the pipes were drilled from a single block of acrylic to
diameters of 30.1 mm± 20 µm. The round-edge tee, which had a ratio of edge radius of
curvature to pipe diameter equal to 0.1, was manufactured from two blocks of acrylic using a
high precision CAD-CAM system. Then, the two halves were closed and the internal pipe was
carefully polished to remove any internal steps/ seams. The internal diameters were checked
by means of precision gauges and found to be equal to 30.06 mm ± 10 µm. Fig. 2-a)
compares the geometries of the sharp (left side) and round-edge (right side) tees, whereas Fig.
2-b) shows the coordinate system, the location of some measuring planes and the terminology
used throughout this work. The square outer cross-sections of both tees and of the leading
pipes minimized refraction of laser beams.
The water flow was continuous and was driven by a volumetric Mohno pump supplied by a
constant head tank. A variable speed controller operated the pump and three valves controlled
the flow distribution to the two outflow pipes. Pulsation dampeners were also located after the
pump to ensure that the flow was continuous. For the detailed velocity measurements the inlet
pipe Reynolds number was equal to 32,000 and the flowrate partition to the straight and
branch outlet pipes was 50%/50%. For the pressure measurements the inlet Reynolds number

8/12/2019 EDGE EFFECTS ON THE FLOW CHARACTERISTICS IN A 90° TEE JUNCTION
http://slidepdf.com/reader/full/edge-effects-on-the-flow-characteristics-in-a-90-tee-junction 6/44
FE05-1268 Pinho 6
varied from 5,000 to 32,000 while the volumetric flowrate ratio Q1 Q
3 was varied from 0 to 1
(branch flow rate over inlet flow rate).
The flow rates were monitored by three magnetic flowmeters, one in each pipe, and the
temperature of the water was monitored by means of a PTC100 sensor located in the open
tank. The water temperature variation during each test run was within the sensor uncertainty
of ± 0.5°C, because of the large volume of water in the rig, but varied along the year. Its
influence on the viscosity was taken into account to maintain the inlet flow conditions. The
95% confidence level uncertainties of the flowrate measurements varied between 2.5% and
0.6% at low and high flowrates, respectively.
Pressure measurements were carried out along the pipes to obtain the loss coefficients for
the straight and branched flows. On each pipe there were seven measuring planes in the 2 m
nearer to the bifurcation and in each of these measuring planes there were four pressure taps
uniformly distributed around the perimeter of the pipe and connected to each other. The
pressure from each pressure section was connected to a differential pressure transducer via a
valve switchboard. The differential pressure transducer was a Rosemount, model 3051C, and
was interfaced with a computer via an AD converter. The uncertainties of the pressure
differences were of 6.7% at Re= 15,000, decreasing to 1.2% at Re= 40,000. These
uncertainties were estimated following the square root of the sum of squares procedure
explained in detail in Coleman and Steele [26]. Here, the total relative uncertainty ( E ! p
! p )
was calculated from the total systematic ( B ! p
) and precision (P ! p
) uncertainties following
equation (1).
E ! p
! p=
B ! p
! p
!
"#$
%&
2
+
P ! p
! p
!
"#$
%&
2
(1)
The total systematic uncertainties included contributions from the fossilized uncertainty of the
transducer, its resolution and the fossilized total uncertainty from the calibration procedure.

8/12/2019 EDGE EFFECTS ON THE FLOW CHARACTERISTICS IN A 90° TEE JUNCTION
http://slidepdf.com/reader/full/edge-effects-on-the-flow-characteristics-in-a-90-tee-junction 7/44
FE05-1268 Pinho 7
During calibration, the pressure transducer ports could be switched to measure the pressure
difference between two independently filled water columns, their heights measured by
electrodes positioned using two verniers. The precision uncertainty was given by
P ! p = t
S ! p
N (2)
where S ! p is the standard deviation of the sample of N readings ( N = 1000 pressure readings)
and t = 2 since the sample was larger than 10 (as recommended by Coleman and Steele [26]).
More details of the uncertainty analysis are given in Costa [27].
Mean and turbulent velocity measurements in the pipes and tees were carried out by means
of laser-Doppler anemometry. The LDA used was a miniaturized fiber optics system from
INVENT, model DFLDA, similar to that described in detail by Stieglmeier and Tropea [28],
with a 120 mm front lens mounted onto the 30 mm diameter probe (probe S30). Scattered
light was collected by a photodiode in the forward- and backscatter modes, depending on
optical access. In particular, in the T-junction test section the measurements could only be
done in backscatter mode, because of the size of the supports of the ducts and the bulky
receiving optical unit. The main characteristics of the anemometer are listed in Table 1.
Table 1- Main characteristics of the Laser-Doppler system
(More characteristics in Table 1 of Stieglmeier and Tropea [28])
Laser wavelength
Laser power
Laser diameter
Measured half-angle of beams in air
Size of measuring volume in water (e-2)
minor axis
820 nm
100 mW
3.5 mm
3.81°
37 µm

8/12/2019 EDGE EFFECTS ON THE FLOW CHARACTERISTICS IN A 90° TEE JUNCTION
http://slidepdf.com/reader/full/edge-effects-on-the-flow-characteristics-in-a-90-tee-junction 8/44
FE05-1268 Pinho 8
major axis
Fringe spacing in air
Frequency shift
550 µm
6.31 µm
1.0 MHz
The signal from the photodiode was processed by a TSI 1990 C counter, which contained
the filters required to remove the pedestal. It operated in the single measurement per burst
mode, frequency validation was set at 1% and 16 signal cycles were used for each valid
measurement. The counter was interfaced with a computer via a DOSTEK 1400A card, which
provided the statistical quantities. To measure the three components of the velocity vector
with a 1D LDA we followed standard procedures. For all velocity components Snell's law
[29] was taken into account to quantify the effects of curvature of the pipe walls in positioning
the LDA measuring volume, in the value of the LDA conversion factors and in determining
the orientation of the velocity component being measured at the control volume. For the
streamwise velocity the plane of laser beams was diametric and the control volume was
traversed radially along the laser light direction from wall to wall. To measure the tangential
and radial velocity components the plane containing the laser beams was perpendicular to the
pipe axis. The control volume was traversed radially along the laser light direction to measure
the tangential velocity. Radial traversing the control volume along the direction perpendicular
to the direction of the LDA measured a combination of the radial and tangential velocity
components that required post-processing.
The maximum uncertainties in the streamwise mean and rms velocities at a 95%
confidence level are of 0.9% and 2.5% in low turbulence regions and of 1.5% and 5.5% in
high turbulence regions close to walls, respectively. The uncertainty in the measurements of
the cross-stream mean and rms velocity components is 1.4% and 6.0% in low and high
turbulence regions, respectively. To estimate the uncertainties in the LDA measurements we
followed Durst et al [30] and Albrecht et al [29], and took into account the specificities of the
8/12/2019 EDGE EFFECTS ON THE FLOW CHARACTERISTICS IN A 90° TEE JUNCTION
http://slidepdf.com/reader/full/edge-effects-on-the-flow-characteristics-in-a-90-tee-junction 9/44
FE05-1268 Pinho 9
system used, which are described in detail by Stieglmeier and Tropea [28]. The total
uncertainties of the mean and rms velocities were estimated on the basis of following
contributions: statistics (5000 data samples), clock accuracy and number of fringe effects,
averaging process, beam alignment relative to geometry, effect of small scale fluctuations and
velocity gradient broadening. No corrections to gradient broadening were applied to the
measured data and the broadening due to the number of fringes was always well below 0.4%,
because the number of static fringes was 6, the number of periods in signal processing was 16,
the fringe spacing was 6.31 µm, the counter used had a clock frequency of 500 MHz, the shift
frequency was 1 MHz and the velocities measured corresponded to Doppler frequencies less
than 0.3 MHz. Measurements could be performed to within 200 µm of the wall.
The anemometer was mounted on a milling machine with movement in the three
coordinate directions and the positional uncertainty was ± 100 µm in all three directions.
3. EXPERIMENTAL RESULTS AND DISCUSSION
3.1. Sharp-edge tee
3.1.1. Pressure-field characterisation
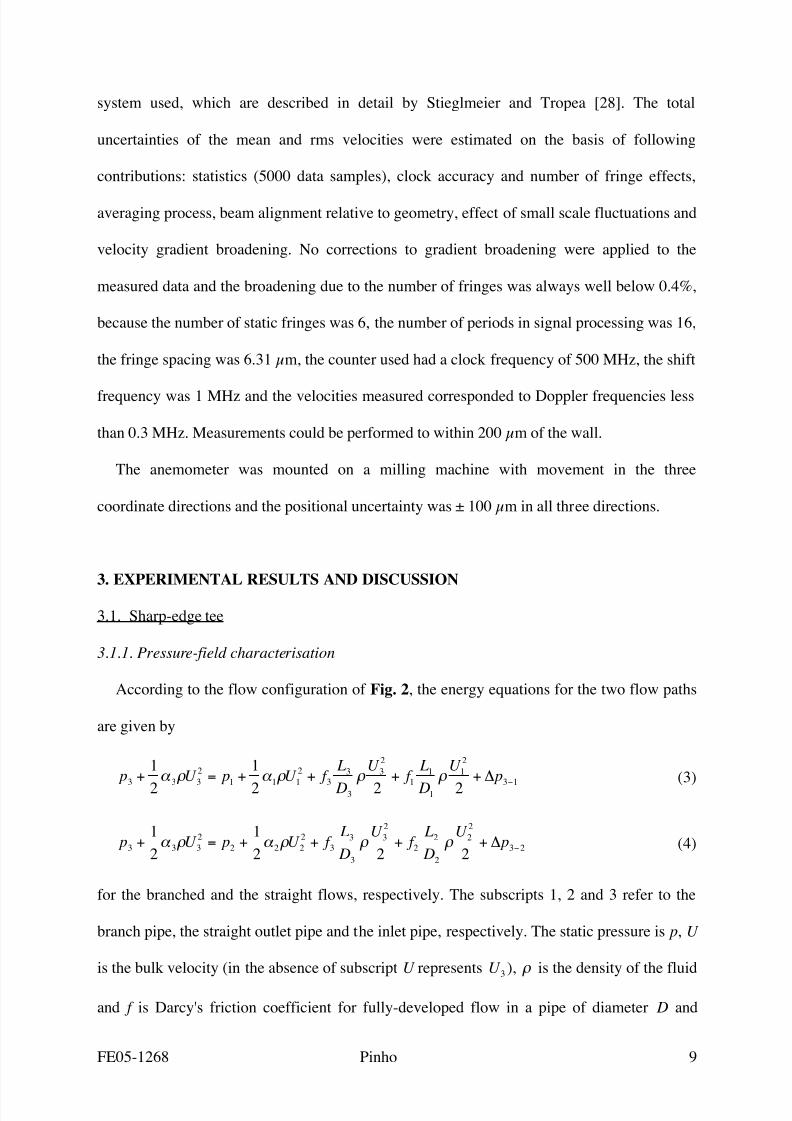
According to the flow configuration of Fig. 2, the energy equations for the two flow paths
are given by
p3 +
1
2
! 3" U
3
2= p
1 +
1
2
! 1" U
1
2+ f
3
L3
D3
" U
3
2
2
+ f 1
L1
D1
" U
1
2
2
+ # p3$1 (3)
p3 +
1
2!
3" U
3
2= p
2 +
1
2!
2" U
2
2+ f
3
L3
D3
" U
3
2
2+ f
2
L2
D2
" U
2
2
2+ # p
3$2 (4)
for the branched and the straight flows, respectively. The subscripts 1, 2 and 3 refer to the
branch pipe, the straight outlet pipe and the inlet pipe, respectively. The static pressure is p, U
is the bulk velocity (in the absence of subscript U represents U 3), ! is the density of the fluid
and f is Darcy's friction coefficient for fully-developed flow in a pipe of diameter D and

8/12/2019 EDGE EFFECTS ON THE FLOW CHARACTERISTICS IN A 90° TEE JUNCTION
http://slidepdf.com/reader/full/edge-effects-on-the-flow-characteristics-in-a-90-tee-junction 10/44
FE05-1268 Pinho 10
length L. The length of a pipe is measured from the position of the pressure tap to the
intersection of the three pipes. The pressure losses associated with the tee are given by ! p3" j
in the trajectory from pipe 3 to pipe j . The energy shape factors (! ) are taken to be 1, the
usual engineering practice in calculations when the flow is turbulent. From the pressure
measurements taken along the straight pipes, in regions of fully-developed flow, the values of
the Darcy friction factors were determined for each pipe. The pressure losses in the tee were
subsequently evaluated from the measured pressure differences and application of Eqs. (3)
and (4). The corresponding local loss coefficients are defined as
K 31 ! " p
3#1
1
2 $ U
3
2 (5)
K 32 ! " p
3#2
1
2 $ U
3
2 (6)
It is important to note at this stage that the inlet Reynolds numbers ( Re3) of the measured
flows are low for a turbulent flow. In contrast, some data from the literature shown in Figs. 3
to 5, pertain to high Reynolds number flows where the loss coefficients are already
independent of Reynolds number.
For these experimental conditions, Figs. 3 and 4 present the variations of coefficients K 31
and K 32 with inlet pipe Reynolds number and flow rate partition and compare the
measurements with data from the literature. Looking first at our measurements in Figs. 3-a)
and 4-a), it is clear that at high Reynolds numbers both coefficients are independent of Re,
whereas at low Reynolds numbers K 31 decreases and K
32 increases with Re. The variation of
both coefficients with flow rate ratio, shown in Figs. 3-b) and 4-b), is non-monotonic, with
minimum values of K 31 at Q1 Q
3 ! 0.4 and of K 32 at Q
1 Q
3 ! 0.2. The variations in the
magnitude of K 32 in relation to Re and Q1 Q
3 are stronger than the variations in K 31, but
only in relative terms.

8/12/2019 EDGE EFFECTS ON THE FLOW CHARACTERISTICS IN A 90° TEE JUNCTION
http://slidepdf.com/reader/full/edge-effects-on-the-flow-characteristics-in-a-90-tee-junction 11/44
FE05-1268 Pinho 11
Comparisons with the literature are shown in Figs. 3-b) and 4-b); they are reasonably good
considering the experimental uncertainties, differences in Reynolds number, variations in the
geometry and in inlet flow conditions. In particular, for our measurements at a Reynolds
number of 32,000 and a flow rate ratio of 50%, the values of K 31 and K 32 are equal to 0.86
and 0.036, respectively. This is the flow condition at which the mean and turbulent velocity
fields, presented in the next two subsections, were investigated in detail.
3.1.2. Inlet flow field
We start by presenting radial profiles of the mean and rms velocities in the inlet pipe. In
Fig. 5 (a) wall coordinates are used whereas Figs. 5(b)-(d) and 6 show plots in physical
coordinates. In particular, data for two upstream sections are presented (-10D and-5D) and in
Fig. 5 they are also compared with classical data from the literature [31-33]. More recent
literature data [34, 35] concentrate on the near wall region and pertain to very low flow
Reynolds numbers, and they also agree with the classical data away from the near wall region.
Given our set-up and LDA system, the classical data are adequate for these comparisons. The
axial mean velocity in wall coordinates in Fig. 5 (a) compares well with the log-law and the
experimental data. The corresponding data in physical coordinates shown in Fig. 6, at a
Reynolds number of 35,000, are also consistent with the literature and the ratio between the
centreline and bulk velocities, slightly exceeding 1.2, was also expected.
In terms of turbulence data, the profiles of the rms velocities are also in good agreement
with the literature. Near the wall the measured data exceed the literature values, because they
were not corrected for mean gradient broadening effects. In conclusion, the inlet flow is well
developed upstream the bifurcation both in terms of mean and turbulent flow.
3.1.3. Mean flow field

8/12/2019 EDGE EFFECTS ON THE FLOW CHARACTERISTICS IN A 90° TEE JUNCTION
http://slidepdf.com/reader/full/edge-effects-on-the-flow-characteristics-in-a-90-tee-junction 12/44
FE05-1268 Pinho 12
Fig. 7 presents radial profiles of the axial mean and rms velocities inside the bifurcation
region to illustrate the distortion of the flow at the inlet (-1D) and inside (-0.5D) the
bifurcation. Here and elsewhere, the data were normalized by the inlet pipe bulk velocity
(U =U 3). The distortion in the axial velocity is maintained between-1D and –0.5D, while part
of the fluid goes into the branch pipe. The slightly increased turbulence at –0.5D could be
associated with the small flow deceleration in the region. The flow remains symmetric in the
z- direction as we can see from the profile of the axial mean velocity taken vertically at -1D.
The mean flow is best understood with the vector plot of the mean velocity in the x-y
horizontal diametric plane of Fig. 8. In the inlet and main outlet pipes u is the streamwise
velocity and v is the cross-stream velocity; in the branch pipe the role of these two velocity
components change. In referring to measuring stations, a prime designates the branch pipe,
and negative values identify stations inside the bifurcating regions (c.f. Fig. 2: 0D and 0'D
represent the entrance to the outlet and branch pipes, respectively).
On approaching the beginning of the bifurcation (-1.0D) the flow in the inlet pipe deviates
towards the inside wall. At the middle of the bifurcation (-0.5D) the maximum normalised
streamwise velocity has dropped only to about 0.9, indicating that in the first half of the
junction the main flow does not deviate significantly towards the side branch (see also Fig. 7),
because the recirculation zone at the edge of the upstream wall of the branch pipe blocks the
passage of fluid, which goes into the branch pipe only at the downstream half of the junction.
This can also be seen in the radial profiles of the streamwise velocity in the branch pipe of
Fig. 9. Here, it is clear that the recirculation bubble becomes wider than the radius of the
branch pipe, starting from the upstream wall (c.f. profiles from 0.25’D to 1.5’D).
The recirculation bubble in the branch pipe is about 2.0’D long, its width remains fairly
constant and the maximum streamwise velocities occur between 1.1’D and 1.5'D. The shape
of the recirculating region at its end is rather strange; at 2.0'D the flow near the upstream wall
is already positive but there is still a small negative velocity near the pipe axis showing that

8/12/2019 EDGE EFFECTS ON THE FLOW CHARACTERISTICS IN A 90° TEE JUNCTION
http://slidepdf.com/reader/full/edge-effects-on-the-flow-characteristics-in-a-90-tee-junction 13/44
FE05-1268 Pinho 13
the recirculation has detached from the wall to form a bubble in the centre of the pipe. This
pattern is similar to that measured by Maia [7] under laminar flow conditions, even though
here the flow is turbulent. Close inspection of the vectors inside the recirculating region show
also that the fluid is moving away from the wall, and continuity requires that an inflow into
the wall region must take place. This leads to a strong 3D flow with the w velocity component
feeding fluid into this region from above and below the horizontal diametric plane. Some
measurements of w were carried out in this region and confirm this finding as shown in Fig.
10. Here, “radial” profiles of the vertical velocity (w) measured 10 mm above and 10 mm
below the diametric horizontal plane are plotted. Negative values of r correspond to the
vicinity of the upstream wall where strong jets are seen feeding fluid into the recirculation.
Velocities w are positive below the diametric plane and vice-versa.
Because the flow deviation into the branch mostly takes place near the end of the
bifurcation, the shape of the streamwise velocity profile at the beginning of the straight outlet
pipe (plane 0.0D), shown in Fig. 11 (circles), is almost symmetric. However, downstream of
the entrance to the outlet straight pipe the streamwise velocity profiles become quickly
distorted due to the large values of v U in combination with the sudden appearance of the
wall, leading to profiles of u U strongly skewed towards the inside wall. Flow redevelopment
in the straight outlet pipe takes a while to be noticed: at 2.0D the fluid is already accelerating
at the outside wall but at 5.0D the profile is still distorted.
Cross-stream velocities in the horizontal direction in the main and branch pipes (v and u,
respectively) are very low everywhere (not exceeding 5% of inlet bulk velocity) except at the
entrance to the pipes where the flow tends to be aligned at 45º relative to both the x and y axis
and attains values of 15% of the inlet bulk velocity.
In the vertical plane the flow remains symmetric as can be assessed by some radial profiles
of the streamwise velocity taken in a vertical cross-stream direction and plotted as crosses in
Fig. 11. Compared with the horizontal profiles of Fig. 11 the evolution of u/U is quite
8/12/2019 EDGE EFFECTS ON THE FLOW CHARACTERISTICS IN A 90° TEE JUNCTION
http://slidepdf.com/reader/full/edge-effects-on-the-flow-characteristics-in-a-90-tee-junction 14/44
FE05-1268 Pinho 14
different. While the velocity at the center of the pipe quickly decreases on going downstream,
near the upper and bottom walls it increases and the profile remains symmetric, an indication
of the strong three-dimensional character of the flow. In contrast, in the horizontal plane the
streamwise velocity profiles are asymmetric and the peak velocity is observed to remain near
the inside wall for a long time (c.f. circles in Fig. 11). It is also worth mentioning that for this
flowrate ratio (50%) no flow separation was observed in the main outlet pipe.
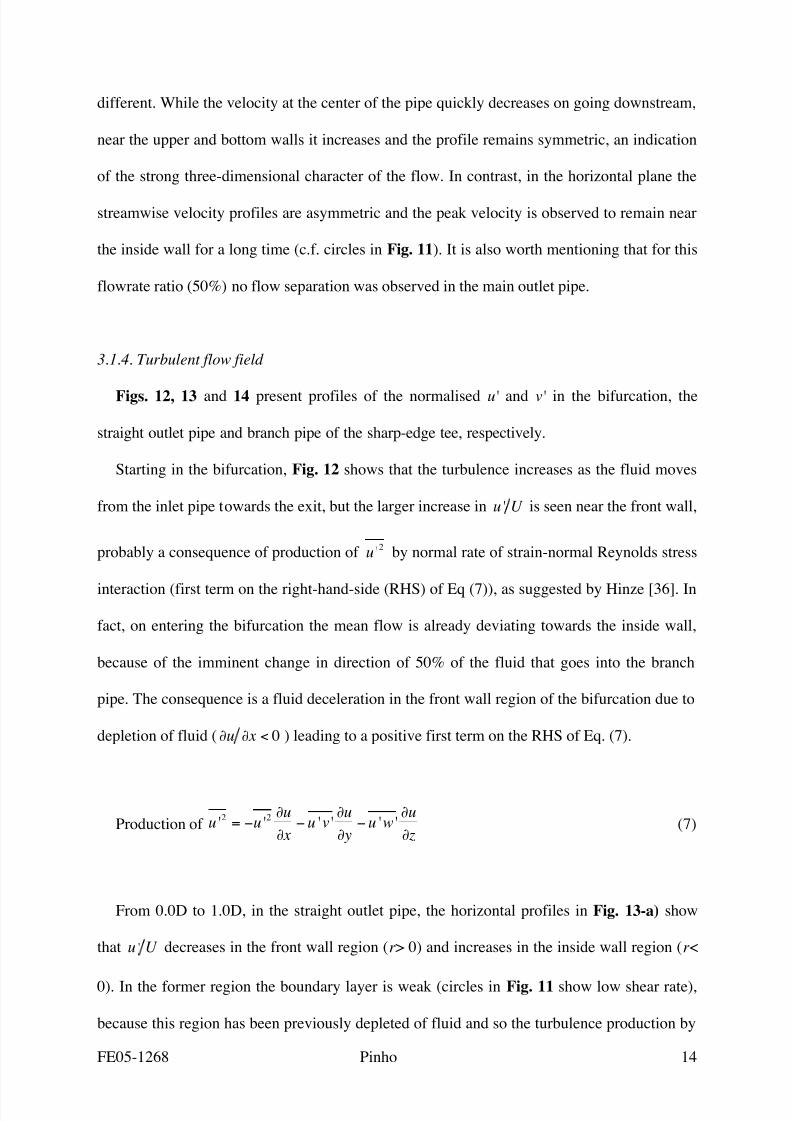
3.1.4. Turbulent flow field
Figs. 12, 13 and 14 present profiles of the normalised u' and v' in the bifurcation, the
straight outlet pipe and branch pipe of the sharp-edge tee, respectively.
Starting in the bifurcation, Fig. 12 shows that the turbulence increases as the fluid moves
from the inlet pipe towards the exit, but the larger increase in u ' U is seen near the front wall,
probably a consequence of production of u '2 by normal rate of strain-normal Reynolds stress
interaction (first term on the right-hand-side (RHS) of Eq (7)), as suggested by Hinze [36]. In
fact, on entering the bifurcation the mean flow is already deviating towards the inside wall,
because of the imminent change in direction of 50% of the fluid that goes into the branch
pipe. The consequence is a fluid deceleration in the front wall region of the bifurcation due to
depletion of fluid (!u ! x < 0 ) leading to a positive first term on the RHS of Eq. (7).
Production of u '2= !u '
2 "u
" x! u 'v '
"u
" y! u 'w '
"u
" z (7)
From 0.0D to 1.0D, in the straight outlet pipe, the horizontal profiles in Fig. 13-a) show
that u ' U decreases in the front wall region (r> 0) and increases in the inside wall region (r<
0). In the former region the boundary layer is weak (circles in Fig. 11 show low shear rate),
because this region has been previously depleted of fluid and so the turbulence production by

8/12/2019 EDGE EFFECTS ON THE FLOW CHARACTERISTICS IN A 90° TEE JUNCTION
http://slidepdf.com/reader/full/edge-effects-on-the-flow-characteristics-in-a-90-tee-junction 15/44
FE05-1268 Pinho 15
shear velocity gradient and shear Reynolds stress interaction (second term on RHS of
equation 7) will be smaller than at the equivalent region in the inlet pipe. Also, fluid with
lower turbulence is being advected from the inside wall region of the outlet pipe into the front
wall region, thus decreasing turbulence by fluid mixing as well as by fluid acceleration in the
front wall region ( !u ! x > 0 implies !u '2"u " x < 0 in Eq. 7). Conversely, in the inside wall
region turbulence increases for the opposite reasons. Since we can not measure the Reynolds
shear stresses in a pipe with a 1D LDA system (unless a refractive index matching technique
is used), the two shear contributions to Eq (7) could not be quantified and the above
interpretation is merely qualitative, but nevertheless it is in agreement with the specialized
literature [36, 37].
In the outlet pipe, the profiles of rms velocities are symmetric along the vertical cross-
stream direction and also show decreasing turbulence near the walls on moving downstream.
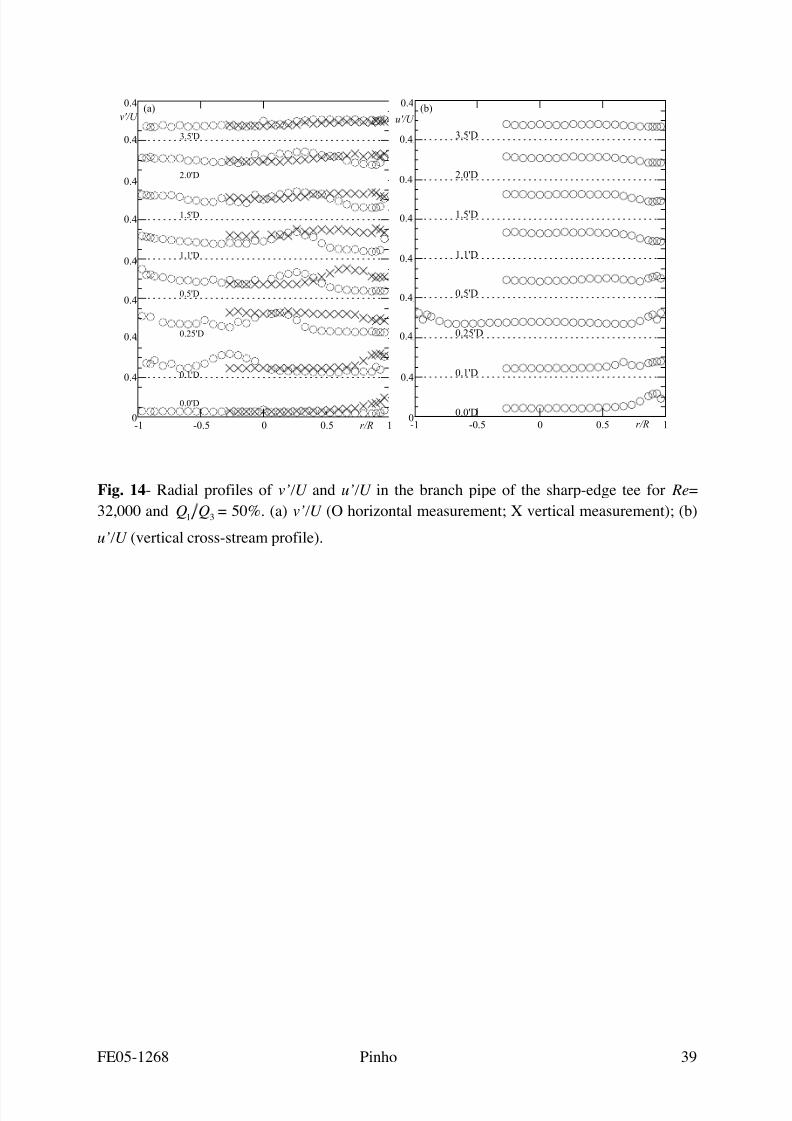
To analyze the turbulence in the branch pipe it is convenient to write down the expression
for the production of the corresponding streamwise normal Reynolds stress, in Eq. (8).
Production of v '2= !u 'v '
"v
" x! v '
2 "v
" y! v 'w '
"v
" z (8)
As seen in Fig. 9, there is a very strong shear layer in the center of the branch pipe,
between the attached recirculating region and the jet along the downstream wall of the tee.
Here, there will be production of v '2 by shear interactions (first term on the right-hand-side
(RHS) of Eq. 8) and consequently there is a maximum in the profiles of v'/U near the pipe
center (at r/R!-0.25, + 0.1 and +0.2 in stations x= 0.1’D, 0.25’D, 0.5’D and until 1.5’D)
shown in the horizontal radial plots in Fig. 14-a).
Large streamwise mean velocity gradients !v ! y are found along the downstream wall of
the branch pipe due to the strong wall jet (initially positive (fluid acceleration), later negative

8/12/2019 EDGE EFFECTS ON THE FLOW CHARACTERISTICS IN A 90° TEE JUNCTION
http://slidepdf.com/reader/full/edge-effects-on-the-flow-characteristics-in-a-90-tee-junction 16/44

8/12/2019 EDGE EFFECTS ON THE FLOW CHARACTERISTICS IN A 90° TEE JUNCTION
http://slidepdf.com/reader/full/edge-effects-on-the-flow-characteristics-in-a-90-tee-junction 17/44
FE05-1268 Pinho 17
seen in Figs. 3 and 4 for the sharp edge tee, but now taking lower numerical values especially
for coefficient K 31
on account of the less severe conditions due to a round edge.
Careful inspection of these figures and direct comparison between Figs. 3 and 15 show that
rounding the corner reduces the pressure loss for the branched flow especially at high flow
rate ratios, i.e., when a higher proportion of fluid is forced to go through the branch pipe: for
Q1 Q
3= 1 and Re > 15,000 there is a reduction in K
31 from about 1.1 to 0.9, whereas at
Q1 Q
3= 0.4, when K
31 goes through a minimum, the decrease is from 0.85 to about 0.75 and
at Q1 Q
3= 0.2 the difference is even smaller. This agrees with the literature, although more
pronounced effects may be found there for more rounded corners. As a matter of fact our
measurements pertain to a less rounded corner than those of Maia [7], but correspond to
Reynolds numbers of the same magnitude (27,000 against our 30,000) leading to higher
values for the loss coefficients: at Q1 Q
3= 0.8 we measured K
31! 0.8 against a value of
around 0.52 measured by Maia [7].
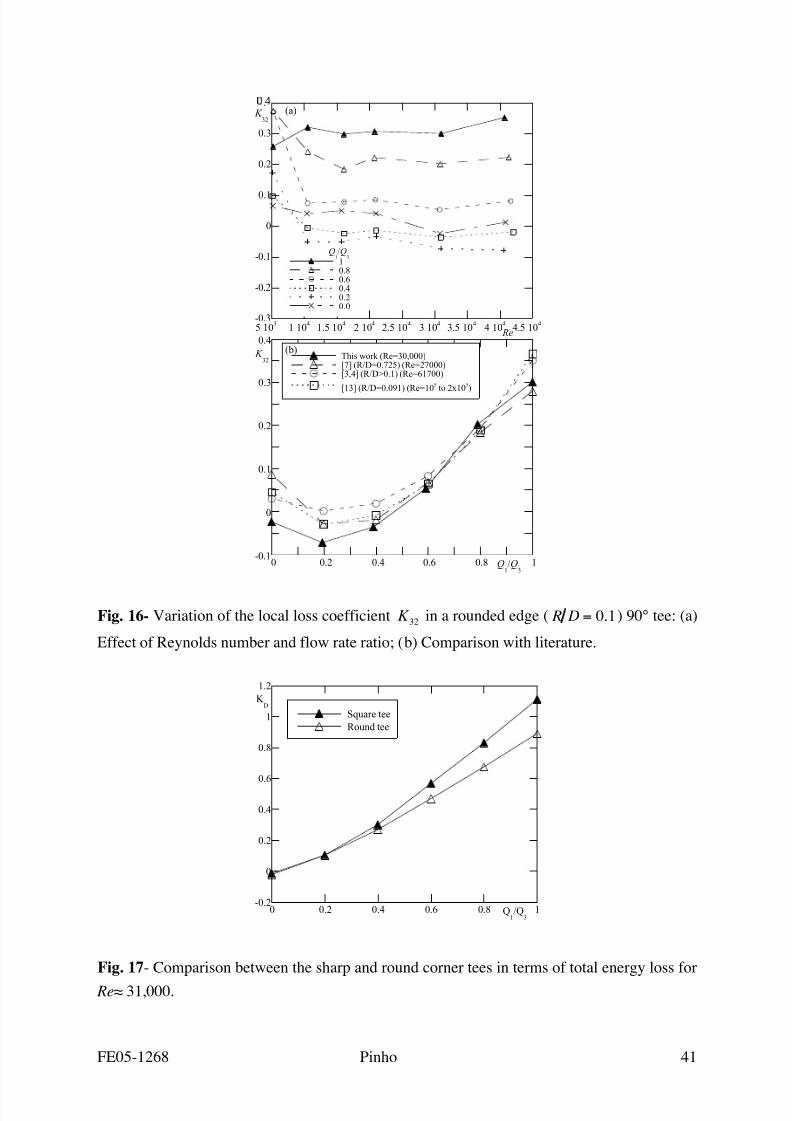
At low Reynolds number, the variation of K 32 with the Reynolds number is opposite to
that seen for the sharp tee: whereas K 32
increases with Re for the sharp tee, it decreases for
the round tee. At high Reynolds numbers the straight flow is basically unperturbed by the
shape of the corner and the differences in K 32
are within experimental uncertainty, as shown
by a direct comparison between Figs. 4-b) and 16-b) for Re! 31,000. However, as the
Reynolds number is reduced the pressure loss becomes lower for the sharp edge tee, i.e, there
is no advantage in rounding the corner as far as K 32
is concerned. This has also been seen by
Maia [7] at a Reynolds number of 26,000 (with a smoother edge curvature), who also stated
that the curves for K 32
in the literature are considered universal, i.e. independent of R/D,
when the Reynolds number is high.
The comparison between the round and sharp-edge tees should not be made simply by
looking at individual flow paths and loss coefficients. Rounding the corner affects differently

8/12/2019 EDGE EFFECTS ON THE FLOW CHARACTERISTICS IN A 90° TEE JUNCTION
http://slidepdf.com/reader/full/edge-effects-on-the-flow-characteristics-in-a-90-tee-junction 18/44
FE05-1268 Pinho 18
the two local loss coefficients, therefore it is advantageous to compare the performance of
both tees by looking at the total energy loss. This is achieved defining a total loss coefficient
(K D
) accounting for all the energy dissipated in the tee as
K D =Q
1
Q3
K 31 +
Q2
Q3
K 32
(9)
For both tees, the variation of K D
with the flow rate ratio at a constant Reynolds number
of around 31,000 is shown in Fig. 17 from where it becomes clear the advantage of the round-
edge tee. At low flow rate ratios there is basically no difference, but for Q1 Q
3 of around 0.4
the difference is already of 10% and rising to 20% at higher flow partitions.
3.2.2. Mean flow field
The general features of the mean flow are similar to those seen with the sharp edge tee, the
few differences requiring a detailed inspection of the mean flow field. Starting at the
bifurcation region, profiles of the stream-wise mean velocity at -1D and -0.5D are plotted in
Fig. 18; at the inside wall region the velocities are consistently higher by 5 to 10% than for
the sharp edge tee (compare with Fig. 7), because the flow enters more easily into the branch
pipe when the corner is round. Detailed inspection of the vector plot in Fig. 19 show also
important differences relative to the flow in the sharp edge tee inside the branch pipe of Fig.
8: for the round tee at 1.5’D the velocity vectors inside the recirculation are less negative
whereas at 2.0’D they are already positive, suggesting a shorter recirculation than for the
sharp tee.
The radial profiles of the streamwise velocity inside the branch pipe plotted in Fig. 20 are
directly comparable to those for the sharp tee in Fig. 9. They confirm that for the round tee the
attached recirculation ends at around 1.5'D (for the sharp tee that happens at around 2.0'D),
8/12/2019 EDGE EFFECTS ON THE FLOW CHARACTERISTICS IN A 90° TEE JUNCTION
http://slidepdf.com/reader/full/edge-effects-on-the-flow-characteristics-in-a-90-tee-junction 19/44
FE05-1268 Pinho 19
even though there is still a recirculation separated from the wall in the centre of the pipe, the
velocity in the downstream wall jet peaks at 1.1’D, rather than at 1.5’D as in the sharp tee, and
the velocities within the recirculation are less negative than for the sharp tee. Flow
redevelopment is also quicker with the round tee (c.f. the profile at 5.0’D which is almost
flat), i.e., the main effect of rounding the edge is to reduce the length, width and strength of
the separated flow region. A decrease in recirculation length has also been observed in the
limited experiments of Sierra-Espinosa et al [9] in a similar flow situation, but with a different
edge curvature, and these findings are consistent with the lower energy loss measured for the
flow going into the branch (lower K 31) when the corner is rounded.
Regarding the flow in the straight outlet pipe, the radial profiles of streamline mean
velocity in Fig. 21 pertain to the round-edge tee and are to be compared with the
corresponding profiles for the sharp tee of Fig. 11. The velocity profiles are almost identical
and differences seen in profiles of the cross-stream velocity (not shown) are within
experimental uncertainty. As already mentioned, the flow is symmetric relative to the mid-
plane of the tee and this is well shown in the radial profiles of streamwise velocity taken
vertically and plotted as crosses in Fig. 21.
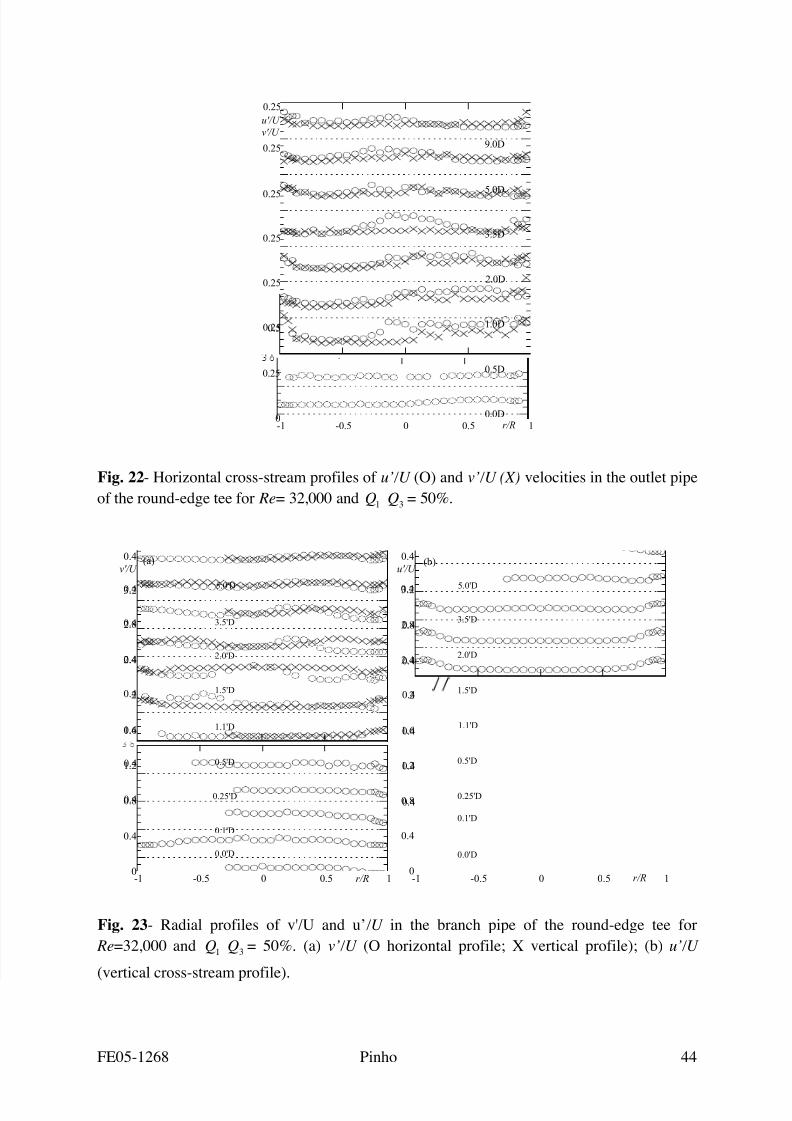
3.2.3. Turbulent flow field
For the round tee the profiles of u ' U and v ' U are always higher than for the sharp tee,
but in varying degrees. Inside the bifurcation region the differences are insignificant since
they are within experimental uncertainty. For the straight outlet pipe the turbulence data are
plotted in Fig. 22 and although the differences relative to the sharp tee data in Fig. 13 are
larger than in the bifurcation region, these differences in rms velocities are too close to the
measurement uncertainty and clearly insufficient to have a measurable impact on the mean
flow, and by consequence on the loss coefficient K 32
at this medium/ high Reynolds number.
8/12/2019 EDGE EFFECTS ON THE FLOW CHARACTERISTICS IN A 90° TEE JUNCTION
http://slidepdf.com/reader/full/edge-effects-on-the-flow-characteristics-in-a-90-tee-junction 20/44
FE05-1268 Pinho 20
In the branch pipe the mean flow showed a shorter recirculation for the round edge tee and
the rms velocities in Fig. 23, and their comparison with the corresponding results for the sharp
tee of Fig. 14, are consistent with these findings. Looking at the turbulence profiles, and
especially at the streamwise component ( v ' U ), the following sequence of events is observed:
at the beginning of the branch pipe (0.0’D to 0.5’D) the levels of turbulence in both the square
and round tees are similar. At 1.1’D the turbulence in the region -0.5 # r/R < 1 for the round
tee is clearly higher than for the sharp tee. At this plane (1.1'D) the peak velocities in the
downstream wall jet were also seen for the round tee geometry (in Section 3.2.2). The higher
turbulence enhances flow mixing and reduces the size of the recirculating flow, as is typical in
other situations with separated flow such as in sudden expansion flows [38]. At 1.5’D the
levels of turbulence in the region -1 < r/R # + 0.5 are similar for both geometries, but higher
elsewhere for the round tee. Note that the length of the attached recirculation for the round tee
is around 1.5’D and that for the sharp tee is 2.0'D. Henceforth, the flow along the upstream
wall becomes attached for the round tee and the turbulence decreases on going downstream
during flow redevelopment, whereas for the sharp tee turbulence continues to increase until
2.0'D, when the recirculation region separates from the upstream wall. This is obvious when
comparing the profiles measured at 2.0’D, where the round tee has everywhere a lower
turbulence than the sharp tee, and also further downstream at 3.5’D.
The recirculation in the branch pipe is the main flow characteristic responsible for the
dissipation of energy in the tee, hence its decrease in size and strength, due to the higher levels
of turbulence in the branch pipe, has a positive effect in the reported reduction of K 31
.
CONCLUSIONS
Detailed measurements of pressure variation, mean and turbulent velocities were carried
out for the flow of water in two 90° tee junctions with sharp and rounded edges. The detailed
mean and turbulent velocity fields were measured for a flow rate ratio of 50% and inlet

8/12/2019 EDGE EFFECTS ON THE FLOW CHARACTERISTICS IN A 90° TEE JUNCTION
http://slidepdf.com/reader/full/edge-effects-on-the-flow-characteristics-in-a-90-tee-junction 21/44
FE05-1268 Pinho 21
Reynolds numbers of 32,000 and 30,000, respectively. In both geometries, the loss coefficient
of the branched flow was higher than for the straight flow, as expected, because of flow
separation in the branch pipe and the absence of separation in the main outlet duct. Rounding
the edge of the junction (r/R= 0.1) lead to higher turbulence in the branch pipe which resulted
in a shorter, thinner and weaker recirculation bubble region, thus reducing the loss coefficient
of the branched flow.
Rounding the corner also did not affect the characteristics of the flow going into the outlet
straight pipe at Re! 31,000, expressing the current behavior of common turbulent flows.
Moreover, the increase in dissipation in the branched flow coefficient and in terms of the total
energy loss ( K D
) is enough to justify that the rounded tee is obviously more efficient for all
the investigated Reynolds numbers.
ACKNOWLEDGEMENTS
The authors are grateful to JNICT who funded this work through project
PBIC/C/CEG/2440/95 and are also thankful to A. Schulte who carried out some of the initial
measurements and helped to set-up the rig.
Nomenclature
BT
systematic uncertainty of variable T
D1, D
2, D
3 diameters of pipes 1, 2 and 3
E T
total uncertainty of variable T
f 1, f
2, f
3 Darcy friction factor for fully-developed pipe flow in pipes 1, 2 and 3
k turbulent kinetic energy
K 31
loss coefficient in tee flow from the inlet to the branch pipe, equation (5)
K 32
loss coefficient in tee flow from the inlet to the straight outlet pipe, equation (6)

8/12/2019 EDGE EFFECTS ON THE FLOW CHARACTERISTICS IN A 90° TEE JUNCTION
http://slidepdf.com/reader/full/edge-effects-on-the-flow-characteristics-in-a-90-tee-junction 22/44
FE05-1268 Pinho 22
K D
total loss coefficient of bifurcation, equation (9)
L1, L
2, L
3 lengths of pipes 1, 2 and 3
p pressure
PT
precision uncertainty of variable T
Q1,Q
2,Q
3 flowrate in pipes 1, 2 and 3
Re Reynolds number based on inlet pipe diameter and bulk velocity
u local mean (time-aveage) velocity in x direction (streamwise direction for inlet
and straight outlet pipes and radial direction, at horizontal diametric plane, for
branch pipe)
u' local rms velocity in x direction (streamwise direction for inlet and straight
outlet pipes and radial direction, at horizontal diametric plane, for branch pipe)
u '2
normal Reynolds stress in x direction
U bulk velocity
v local mean (time-average) velocity in y direction (radial direction at horizontal
diametric plane for the inlet and straight outlet pipes and streamwise direction
for branch pipe)
v' local rms velocity in y direction (radial direction at horizontal diametric plane
for the inlet and straight outlet pipes and streamwise direction for branch pipe)
v '2
normal Reynolds stress in y direction
w local mean velocity in z direction
w' local rms velocity in z direction
w '2 normal Reynolds stress in z direction
Greek
! energy shape factor
8/12/2019 EDGE EFFECTS ON THE FLOW CHARACTERISTICS IN A 90° TEE JUNCTION
http://slidepdf.com/reader/full/edge-effects-on-the-flow-characteristics-in-a-90-tee-junction 23/44
FE05-1268 Pinho 23
! rate of dissipation of k
! p pressure difference
! fluid density
Subscripts
1 refers to outlet branch pipe
2 refers to outlet straight pipe
3 refers to inlet pipe
REFERENCES
[1] White, F. M. 1999. Fluid Mechanics. 4th edition, Mc-Graw-Hill.
[2] Vogel, G. 1926, 1928. Investigation of the loss in right-angled pipe branches. Mitt.
Hydraulischen Instituts der Tech. Hoschul. Munchen, n. 1, 75-90 (1926), n. 2, 61-64
(1928) (Translation by Voetsch, C. Technical Memorandum n. 299, US Bureau of
Reclamation, 1932)
[3] Gardel, A. 1957. Les pertes de charge dansles écoulements au travers de branchements en
Té. Bulletin Technique de la Suisse Romande, 9 (4), 123-130
[4] Gardel, A. 1957. Les pertes de charge dansles écoulements au travers de branchements en
Té. Bulletin Technique de la Suisse Romande, 10 (5), 143-148.
[5] Katz, S. 1967. Mechanical potencial drops at a fluid branch. Trans ASME , paper 67, 732-
736.
[6] Iwanami, S., Suu, T. and Kato, H. 1969. Study on flow characteristics in right-angled pipe
fittings. Bull. of the Japan Soc. Mech. Eng., 12, n. 53, 1041-1050.
[7] Maia, R. J. 1992. Numerical and experimental investigations of the effect of local losses in
piping systems. Methods and Techniques for its systematic investigation. The specific case
8/12/2019 EDGE EFFECTS ON THE FLOW CHARACTERISTICS IN A 90° TEE JUNCTION
http://slidepdf.com/reader/full/edge-effects-on-the-flow-characteristics-in-a-90-tee-junction 24/44
FE05-1268 Pinho 24
of the flow in a 90° Tee junction (in Portuguese). PhD thesis, University of Porto,
Portugal.
[8] Sierra- Espinosa, F. Z., Bates, C. J. and O’Doherty, T. 2000a. Turbulent flow in a 90° pipe
junction. Part 1: Decay of fluctuations upstream the flow bifurcation. Computers and
Fluids, 29, 197-213.
[9] Sierra- Espinosa, F. Z., Bates, C. J. and O’Doherty, T. 2000b. Turbulent flow in a 90° pipe
junction. Part 2: Reverse flow at the branch exit. Computers and Fluids, 29, 215-233.
[10] Páal, G., Maia, R. and Pinho, F. T. 2003. Numerical predictions of turbulent flow in a 90°
tee junction. Proc. 12th Int. Conf. on Modeling Fluid Flow.Budapest, Hungary, 3rd-6th
September, paper IFO-31, pp. 573-580.
[11] Menter, F. 1994. Two-equation eddy viscosity turbulence models for engineering, AIAAJ ,
32, 1598-1605.
[12] Boldy, A. P. 1970. Performance of dividing and combining Tees. BHRA Technical
Report 1061.
[13] Ito, H. and Imai, K. 1973. Energy losses at 90° pipe junctions. Journal of The
Hydraulics Division, Proceedings of ASCE, 99, HY9
[14] Miller, D. S. 1986. Internal Flow Systems. BHRA Fluid Engineering, 3rd edition.
[15] Katsaounis, A., Aust, E., Fürst, H. D. and Schultheiss, G. F. 1983. Pressure drop in Tee-
junctions with liquids and gas-liquids. Proc. 21st National Heat Transfer Conference,
Seattle, pp 139-146.
[16] Reimann, J. and Seeger, W. 1986. Two-phase flow in a Tee-junction with a horizontal
inlet, Part II: pressure differences. Int. J. Multiphase Flow, 12, 587- 608.
[17] Seeger, W., Reimann, J. and Müller, U. 1985. Phase-separation in a T-junction with a
horizontal inlet, 2nd In. Conference on multi-phase flow, paper A2, London.
[18] Azzopardi, B. J. and Rea, S. 1999. Modeling the split of horizontal annular flow at a T-
junction. Chem. Eng. Res. Des., 77 (A8), 713-720.

8/12/2019 EDGE EFFECTS ON THE FLOW CHARACTERISTICS IN A 90° TEE JUNCTION
http://slidepdf.com/reader/full/edge-effects-on-the-flow-characteristics-in-a-90-tee-junction 25/44
FE05-1268 Pinho 25
[19] Azzopardi, B. J. and Rea, S. 2001. The split of horizontal stratified flow at a large
diameter T-junction. Chem. Eng. Res. Des., 79 (A4), 470-476.
[20] Issa, R. I. and Oliveira, P. J. 1994. Numerical prediction of phase separation in two-phase
flow through T- junctions. Computers and Fluids, 23, 347-372.
[21] Carr, R. T. and Kotha, S. L. 1995. Separation surfaces for laminar flow in branching
tubes - effect of Reynolds number and geometry. Journal of Biomechanical Engineering,
117, 442-447.
[22] Khodadadi, J. M. 1990. Wall pressure and shear stress variations in a 90° bifurcation
during pulsatile laminar flow. J. Fluids Eng., 113, 111-115.
[23] Moravec, S. and Liepsch, D. 1983. Flow investigations in a model of a three-dimensional
human artery with Newtonian and non-Newtonian fluids- Part I", Biorheology, 20, 745-
759.
[24] Rindt CCM and van Steenhoven AA 1996. Unsteady flow in a rigid 3-D model of the
carotid artery bifurcation. ASME J. Biomechanical Eng., 118, 90-96.
[25] Ravensbergen, J., Krijger, J. K. B., Hillen, B. and Hoogstraten, H. W. 1995. Merging
flows in an arterial confluence: the vertebro-basilar junction. J. Fluid Mech., 304, 119-141.
[26] Coleman, H. W. and Steele, W. G. 1999. Experimentation and uncertainty analysis for
engineers. 2nd edition, John Wiley and Sons., New York.
[27] Costa, NFP. 2003. Pressure losses in tee-junctions: the 60° bifurcation. (in Portuguese),
MSc Thesis, FEUP, University of Porto
[28] Stieglmeier, M. and Tropea, C. 1992. A miniaturized, mobile laser-Doppler anemometer.
Applied Optics, 31 (21) 4096-4105.
[29] Albrecht, H. E., Borys, M., Damaschke, N. and Tropea, C. 2003. Laser-Doppler and
Phase-Doppler measurement techniques. Springer- Verlag, Berlin.
[30] Durst, F., Melling, A. and Whitelaw, J. H. 1981. Principles and practice of laser-
Doppler anemometry. 2nd edition, Academic Press, London.
8/12/2019 EDGE EFFECTS ON THE FLOW CHARACTERISTICS IN A 90° TEE JUNCTION
http://slidepdf.com/reader/full/edge-effects-on-the-flow-characteristics-in-a-90-tee-junction 26/44
FE05-1268 Pinho 26
[31] Laufer, J 1954. The structure of turbulence in fully developed pipe flow. National
Bureau of Standards Report 1154.
[32] Lawn, CJ 1971. The determination of the rate of dissipation in turbulent pipe flow. J.
Fluid Mech., 48, 477.
[33] Townes HW, Gow JL, Powe RE and Weber N 1972, Turbulent flow in smooth and rough
pipes. J. Basic Eng., 94, 353.
[34] Wei T and Willmarth WW 1989. Reynolds number effects on the structure of a turbulent
channel flow. J. Fluid Mech., 204, 57-95.
[35] Durst F, Jovanovic J and Sender J 1995. LDA measurements in the near wall region of a
turbulent flow. J. Fluid Mech., 295, 305-335.
[36] Hinze, J.O. 1975. Turbulence. 2nd edition, MacGraw-Hill, New York.
[37] Heitor, M. V., Taylor, A. M. K. P. and Whitelaw, J. H. 1987. The interaction of
turbulence and pressure-gradients in a baffle-stabilized premixed flame. J. Fluid Mech.,
181, 387-413.
[38] Castro, O. S. and Pinho, F. T. 1995. Turbulent Expansion Flow of Low Molecular
Weight Shear- Thinning Solutions. Experiments in Fluids, 20,42-55.
8/12/2019 EDGE EFFECTS ON THE FLOW CHARACTERISTICS IN A 90° TEE JUNCTION
http://slidepdf.com/reader/full/edge-effects-on-the-flow-characteristics-in-a-90-tee-junction 27/44
FE05-1268 Pinho 27
List of Figures
Fig. 1- Schematic representation of the experimental set-up: (1) Tee test section (flow field
characterization), (2) Pipe test section (pressure field characterization), (3) Flowmeter, (4)
Tank, (5) Pump, (6) Valve, (7) Pulsation dampener.
Fig. 2- Test section drawings and co-ordinate system: a) Bifurcation piece: comparison
between sharp-edge tee (left) and rounded-edge tee (right). Dimensions in [mm]; b)
Coordinate system, position of some diametric measuring planes and terminology.
Fig. 3- Variation of the local loss coefficient K 31
in a sharp edge 90° tee: (a) Effect of
Reynolds number and flow rate ratio; (b) Comparison with literature.
Fig. 4- Variation of the local loss coefficient K 32
in a sharp edge 90° tee: (a) Effect of
Reynolds number and flow rate ratio; (b) Comparison with literature.
Fig. 5- Comparison between the literature and measured velocity profiles upstream of the tee
junction (-10D and –5D): (a) axial velocity (in wall coordinates); (b) axial rms velocity; (c)
radial rms velocity; (d) tangential rms velocity.
Fig. 6- Radial profiles of the normalized axial mean flow upstream of the tee junction (-10D
and –5D) at Re= 35,000.
Fig. 7- Radial profiles of mean (closed symbols) and rms axial velocity (open symbols) in the
bifurcation region of the sharp-edge tee: -1D (O), -0.5 D( $); Vertical cross-stream profile
at –1D (X).
Fig. 8- Vector plot of the mean velocity in the horizontal diametric plane x-y of the bifurcation
of the sharp-edge tee for Re= 32,000 and Q1 Q
3= 50%. The scale vector corresponds to
u/U = 1.
Fig. 9- Radial profiles of streamwise velocity in the branch pipe of the sharp-edge tee for Re=
32,000 and Q1 Q
3= 50%.
8/12/2019 EDGE EFFECTS ON THE FLOW CHARACTERISTICS IN A 90° TEE JUNCTION
http://slidepdf.com/reader/full/edge-effects-on-the-flow-characteristics-in-a-90-tee-junction 28/44
FE05-1268 Pinho 28
Fig. 10- “Radial” profiles of w U (O,!) and w ' U (x,+) measured 10 mm above (O,x) and
10 mm below (!,+) the diametric horizontal plane at 2.0’D for the sharp edge tee flow at
Re= 32,000 and Q1 Q
3= 50%.
Fig. 11- Radial profiles of streamwise velocity in the outlet pipe of sharp edge tee for
Re=32,000 and Q1 Q
3= 50%: O Measurements in horizontal plane; X Measurements in
vertical plane (Full and half profiles).
Fig. 12- Radial profiles of u’/U in the junction region of the sharp-edge tee for Re= 32,000
and Q1 Q
3= 50%, measured between the axis and the front wall.
Fig. 13- Radial profiles of u’/U and v’/U in the outlet straight pipe of the sharp-edge tee for
Re= 32,000 and Q1 Q
3= 50%. (a) u’/U (O: horizontal cross-stream profile; X: vertical
cross-stream profile); (b) v’/U (vertical cross-stream profile).
Fig. 14- Radial profiles of v’/U and u’/U in the branch pipe of the sharp-edge tee for Re=
32,000 and Q1 Q
3= 50%. (a) v’/U (O horizontal measurement; X vertical measurement);
(b) u’/U (vertical cross-stream profile).
Fig. 15- Variation of the local loss coefficient K 31
in a rounded edge ( R D = 0.1) 90° tee: (a)
Effect of Reynolds number and flow rate ratio; (b) Comparison with literature.
Fig. 16- Variation of the local loss coefficient K 32
in a rounded edge ( R D = 0.1) 90° tee: (a)
Effect of Reynolds number and flow rate ratio; (b) Comparison with literature.
Fig. 17- Comparison between the sharp and round corner tees in terms of total energy loss for
Re! 31,000.
Fig. 18- Radial profiles of mean axial velocity in the bifurcation region of the round tee for
Re= 32,000 and Q1 Q
3= 50%: -1D (O), -0.5 D( $); Vertical cross-stream profile at –1D
(X).
Fig. 19- Vector plot of the mean velocity in the horizontal diametric plane x-y of the rounded
corner tee junction for Re= 32,000 and Q1 Q
3= 50%. Vector scale corresponds to u/U = 1.

8/12/2019 EDGE EFFECTS ON THE FLOW CHARACTERISTICS IN A 90° TEE JUNCTION
http://slidepdf.com/reader/full/edge-effects-on-the-flow-characteristics-in-a-90-tee-junction 29/44
FE05-1268 Pinho 29
Fig. 20- Radial profiles of the longitudinal velocity in the branch pipe of the round edge tee
flow for Re= 32,000 and Q1 Q
3= 50%.
Fig. 21- Radial profiles of streamwise velocity in the outlet pipe of the round-edge tee for Re=
32,000 and Q1 Q
3= 50%: O measurements in horizontal plane; X measurements in vertical
plane.
Fig. 22- Horizontal cross-stream profiles of u’/U (O) and v’/U (X) velocities in the outlet pipe
of the round-edge tee for Re= 32,000 and Q1 Q
3= 50%.
Fig. 23- Radial profiles of v'/U and u’ /U in the branch pipe of the round-edge tee for
Re=32,000 and Q1 Q
3= 50%. (a) v’/U (O horizontal profile; X vertical profile); (b) u’/U
(vertical cross-stream profile).

8/12/2019 EDGE EFFECTS ON THE FLOW CHARACTERISTICS IN A 90° TEE JUNCTION
http://slidepdf.com/reader/full/edge-effects-on-the-flow-characteristics-in-a-90-tee-junction 30/44
FE05-1268 Pinho 30
List of TablesTable 1- Main characteristics of the Laser-Doppler system (More characteristics in Table 1 of
Stieglmeier and Tropea [28]).

8/12/2019 EDGE EFFECTS ON THE FLOW CHARACTERISTICS IN A 90° TEE JUNCTION
http://slidepdf.com/reader/full/edge-effects-on-the-flow-characteristics-in-a-90-tee-junction 31/44
FE05-1268 Pinho 31
Fig. 1- Schematic representation of the experimental set-up: (1) Tee test section (flow field
characterization), (2) Pipe test section (pressure field characterization), (3) Flowmeter, (4)
Tank, (5) Pump, (6) Valve, (7) Pulsation dampener.
Fig. 2- Test section drawings and co-ordinate system: a) Bifurcation piece: comparison
between sharp-edge tee (left) and rounded-edge tee (right). Dimensions in [mm]; b)
Coordinate system, position of some diametric measuring planes and terminology.

8/12/2019 EDGE EFFECTS ON THE FLOW CHARACTERISTICS IN A 90° TEE JUNCTION
http://slidepdf.com/reader/full/edge-effects-on-the-flow-characteristics-in-a-90-tee-junction 32/44
FE05-1268 Pinho 32
0.5
0.6
0.7
0.8
0.9
1
1.1
1.2
1.3
1.4
5 103
1 104
1.5 104
2 104
2.5 104
3 104
3.5 104
10.80.60.40.2
K 31
Re
Q1/Q
3
(a)
0.5
0.6
0.7
0.8
0.9
1
1.1
1.2
1.3
1.4
0 0.2 0.4 0.6 0.8 1
This work (Re=32,000)
[7] (Re=25000)[3,4] (Re=61700)
[13] (Re=105 to 2x10
5)
[12] (Re=0.75 to 1x10⁶)
K 31
Q1
/Q3
(b)
Fig. 3- Variation of the local loss coefficient K 31
in a sharp edge 90° tee: (a) Effect of
Reynolds number and flow rate ratio; (b) Comparison with literature.

8/12/2019 EDGE EFFECTS ON THE FLOW CHARACTERISTICS IN A 90° TEE JUNCTION
http://slidepdf.com/reader/full/edge-effects-on-the-flow-characteristics-in-a-90-tee-junction 33/44
FE05-1268 Pinho 33
-0.3
-0.2
-0.1
0
0.1
0.2
0.3
0.4
5 103
1 104
1.5 104
2 104
2.5 104
3 104
3.5 104
0.80.60.40.20.0
K 32
Re
Q1/Q
3
(a)
-0.1
0
0.1
0.2
0.3
0.4
0 0.2 0.4 0.6 0.8 1
This work (Re=32,000)[7] (Re=25000)[3,4] (Re=61700)[13] (Re=105 to 2x10⁵)
K 32
Q1/Q
3
(b)
Fig. 4- Variation of the local loss coefficient K 32
in a sharp edge 90° tee: (a) Effect of
Reynolds number and flow rate ratio; (b) Comparison with literature.

8/12/2019 EDGE EFFECTS ON THE FLOW CHARACTERISTICS IN A 90° TEE JUNCTION
http://slidepdf.com/reader/full/edge-effects-on-the-flow-characteristics-in-a-90-tee-junction 34/44
FE05-1268 Pinho 34
0
5
10
15
20
25
30
100
101
102
103
104
[31] (Re=50,000)[31] (Re=500,000)[32] (Re=90,000)[33] (Re=250,000)-10D (Re=35,000)-5D (Re=35,000)
u+
y+
(a)
u+=y+u+
=
1
0.41
ln y+
+ 5.5
0
0.5
1
1.5
2
2.5
3
0 0.2 0.4 0.6 0.8 1
u' +
r / R
(b)
0
0.5
1
1.5
2
0 0.2 0.4 0.6 0.8 1
v' +
r/R
(c)
0
0.5
1
1.5
2
0 0.2 0.4 0.6 0.8 1
w' +
r/R
(d)
Fig. 5- Comparison between the literature and measured velocity profiles upstream of the tee
junction (-10D and –5D): (a) axial velocity (in wall coordinates); (b) axial rms velocity; (c)
radial rms velocity; (d) tangential rms velocity.

8/12/2019 EDGE EFFECTS ON THE FLOW CHARACTERISTICS IN A 90° TEE JUNCTION
http://slidepdf.com/reader/full/edge-effects-on-the-flow-characteristics-in-a-90-tee-junction 35/44
FE05-1268 Pinho 35
0
0.2
0.4
0.6
0.8
1
1.2
-1 -0.5 0 0.5 1
-10D
-5D
u/U
r / R
Fig. 6- Radial profiles of the normalized axial mean flow upstream of the tee junction (-10Dand –5D) at Re= 35,000.
0
0.2
0.4
0.6
0.8
1
1.2
-1 -0.5 0 0.5 1
u/U
r/R
Fig. 7- Radial profiles of mean (closed symbols) and rms axial velocity (open symbols) in the
bifurcation region of the sharp-edge tee: -1D (O), -0.5 D( $); Vertical cross-stream profile at –
1D (X).

8/12/2019 EDGE EFFECTS ON THE FLOW CHARACTERISTICS IN A 90° TEE JUNCTION
http://slidepdf.com/reader/full/edge-effects-on-the-flow-characteristics-in-a-90-tee-junction 36/44
FE05-1268 Pinho 36
Fig. 8- Vector plot of the mean velocity in the horizontal diametric plane x-y of thebifurcation of the sharp-edge tee for Re= 32,000 and Q
1 Q
3= 50%. The scale vector
corresponds to u/U = 1.
-1 -0.5 0 0.5 10
1
2
3
4
5
v/U
r/R
0.0'D
0.1'D
0.25'D
0.5'D
1.1'D
1.5'D
2.0'D
3.5'D
5.0'D
1
1
1
1
Fig. 9- Radial profiles of streamwise velocity in the branch pipe of the sharp-edge tee for Re=
32,000 and Q1 Q
3= 50%.

8/12/2019 EDGE EFFECTS ON THE FLOW CHARACTERISTICS IN A 90° TEE JUNCTION
http://slidepdf.com/reader/full/edge-effects-on-the-flow-characteristics-in-a-90-tee-junction 37/44
FE05-1268 Pinho 37
-0.3
-0.2
-0.1
0
0.1
0.2
0.3
0
0.05
0.1
0.15
0.2
0.25
-1 -0.5 0 0.5 1
w/U w'/U
r/R
Fig. 10- “Radial” profiles of w U (O,!) and w ' U (x,+) measured 10 mm above (O,x) and
10 mm below (!,+) the diametric horizontal plane at 2.0’D for the sharp edge tee flow at Re=
32,000 and Q1 Q
3= 50%.
u/U
1
1
1
1
0
1
2
3
4
-1 -0.5 0 0.5 1r/R
0.0D
1.0D
2.0D
3.0D
5.0D
Fig. 11- Radial profiles of streamwise velocity in the outlet pipe of sharp edge tee for
Re=32,000 and Q1 Q
3= 50%: O Measurements in horizontal plane; X Measurements in
vertical plane (Full and half profiles).

8/12/2019 EDGE EFFECTS ON THE FLOW CHARACTERISTICS IN A 90° TEE JUNCTION
http://slidepdf.com/reader/full/edge-effects-on-the-flow-characteristics-in-a-90-tee-junction 38/44
FE05-1268 Pinho 38
0.0
0.050
0.10
0.15
0.20
0.25
0 0.2 0.4 0.6 0.8 1
-1D
-0.5D
0.0D
u'/U
r/R
0.05
Fig. 12- Radial profiles of u’/U in the junction region of the sharp-edge tee for Re= 32,000
and Q1 Q
3= 50%, measured between the axis and the front wall.
0
0.25
0.5
0.75
1
.
-1 -0.5 0 0.5 1r/R
u'/U
0.25
0.25
0.25
0.25
0.0D
1.0D
2.0D
3.0D
5.0D
(a)
0
0.25
0.5
0.75
1
.
-1 -0.5 0 0.5 1r/R
0.25
0.25
0.25
0.25
v'/U
0.0D
1.0D
2.0D
3.0D
5.0D
(b)
Fig. 13- Radial profiles of u’/U and v’/U in the outlet straight pipe of the sharp-edge tee for
Re= 32,000 and Q1 Q
3= 50%. (a) u’/U (O: horizontal cross-stream profile; X: vertical cross-
stream profile); (b) v’/U (vertical cross-stream profile).
8/12/2019 EDGE EFFECTS ON THE FLOW CHARACTERISTICS IN A 90° TEE JUNCTION
http://slidepdf.com/reader/full/edge-effects-on-the-flow-characteristics-in-a-90-tee-junction 39/44
FE05-1268 Pinho 39
0.1'D
0.25'D
0.0'D
0.5'D
1.1'D
1.5'D
2.0'D
3.5'D
0
0.4
0.8
1.2
1.6
2
2.4
2.8
.
-1 -0.5 0 0.5 1
r/R
0.4
0.4
0.4
0.4
0.4
0.4
0.4
v'/U (a)
0
0.4
0.8
1.2
1.6
2
2.4
2.8
.
-1 -0.5 0 0.5 1r/R
0.1'D
0.25'D
0.0'D
0.5'D
1.1'D
1.5'D
2.0'D
3.5'D
0.4
0.4
0.4
0.4
0.4
0.4
0.4(b)
u'/U
Fig. 14- Radial profiles of v’/U and u’/U in the branch pipe of the sharp-edge tee for Re=
32,000 and Q1 Q
3= 50%. (a) v’/U (O horizontal measurement; X vertical measurement); (b)
u’/U (vertical cross-stream profile).

8/12/2019 EDGE EFFECTS ON THE FLOW CHARACTERISTICS IN A 90° TEE JUNCTION
http://slidepdf.com/reader/full/edge-effects-on-the-flow-characteristics-in-a-90-tee-junction 40/44
FE05-1268 Pinho 40
0.5
0.6
0.7
0.8
0.9
1
1.1
1.2
1.3
1.4
5 103
1 104
1.5 104
2 104
2.5 104
3 104
3.5 104
4 104
4.5 104
10.80.60.40.20.0
K 31
Re
(a)Q
1/Q
3
0.5
0.6
0.7
0.8
0.9
1
1.1
1.2
1.3
1.4
0 0.2 0.4 0.6 0.8 1
This work (Re=30,000)[7] (R/D=0.725) (Re=27000)[3,4] (R/D>0.1) (Re=61700)
[13] (R/D=0.091) (Re=105 to 2x10⁵)
K 31
Q1/Q
3
(b)
Fig. 15- Variation of the local loss coefficient K 31
in a rounded edge ( R D = 0.1) 90° tee: (a)
Effect of Reynolds number and flow rate ratio; (b) Comparison with literature.
8/12/2019 EDGE EFFECTS ON THE FLOW CHARACTERISTICS IN A 90° TEE JUNCTION
http://slidepdf.com/reader/full/edge-effects-on-the-flow-characteristics-in-a-90-tee-junction 41/44
FE05-1268 Pinho 41
-0.3
-0.2
-0.1
0
0.1
0.2
0.3
.
5 103
1 104
1.5 104
2 104
2.5 104
3 104
3.5 104
4 104
4.5 104
10.80.60.40.20.0
K 32
Re
Q1/Q
3
(a)
-0.1
0
0.1
0.2
0.3
0.4
0 0.2 0.4 0.6 0.8 1
This work (Re=30,000)[7] (R/D=0.725) (Re=27000)[3,4] (R/D>0.1) (Re=61700)
[13] (R/D=0.091) (Re=105 to 2x10
5)
K 32
Q1/Q
3
(b)
Fig. 16- Variation of the local loss coefficient K 32
in a rounded edge ( R D = 0.1) 90° tee: (a)
Effect of Reynolds number and flow rate ratio; (b) Comparison with literature.
-0.2
0
0.2
0.4
0.6
0.8
1
1.2
0 0.2 0.4 0.6 0.8 1
Square tee
Round tee
K D
Q1/Q
3
Fig. 17- Comparison between the sharp and round corner tees in terms of total energy loss for
Re! 31,000.

8/12/2019 EDGE EFFECTS ON THE FLOW CHARACTERISTICS IN A 90° TEE JUNCTION
http://slidepdf.com/reader/full/edge-effects-on-the-flow-characteristics-in-a-90-tee-junction 42/44
FE05-1268 Pinho 42
0.0
0.20
0.40
0.60
0.80
1.0
1.2
1.4
-1 -0.5 0 0.5 1
-1D-0.5D-1D (ver)
u/U
r/R
Fig. 18- Radial profiles of mean axial velocity in the bifurcation region of the round tee for
Re= 32,000 and Q1 Q
3 = 50%: -1D (O), -0.5 D( $); Vertical cross-stream profile at –1D (X).
Fig. 19- Vector plot of the mean velocity in the horizontal diametric plane x-y of the rounded
corner tee junction for Re= 32,000 and Q1 Q
3= 50%. Vector scale corresponds to u/U = 1.

8/12/2019 EDGE EFFECTS ON THE FLOW CHARACTERISTICS IN A 90° TEE JUNCTION
http://slidepdf.com/reader/full/edge-effects-on-the-flow-characteristics-in-a-90-tee-junction 43/44
FE05-1268 Pinho 43
0
1
2
3
4
5
-1 -0.5 0 0.5 1r/R
v/U
1
1
1
1
0.0'D
0.1'D
0.25'D
0.5'D
1.1'D
1.5'D
2.0'D
3.5'D
5.0'D
Fig. 20- Radial profiles of the longitudinal velocity in the branch pipe of the round edge tee
flow for Re= 32,000 and Q1 Q
3= 50%.
0
1
2
3
4
5
6
-1 -0.5 0 0.5 1r/R
1
1
1
1
1
0.0D
0.5D
1.0D
2.0D
3.5D
5.0D
9.0D
u/U
Fig. 21- Radial profiles of streamwise velocity in the outlet pipe of the round-edge tee for Re=
32,000 and Q1 Q
3= 50%: O measurements in horizontal plane; X measurements in vertical
plane.
8/12/2019 EDGE EFFECTS ON THE FLOW CHARACTERISTICS IN A 90° TEE JUNCTION
http://slidepdf.com/reader/full/edge-effects-on-the-flow-characteristics-in-a-90-tee-junction 44/44
0
0.25
0.5
0.75
1
1.25
1.5
1.75
-1 -0.5 0 0.5 1r/R
0.25
0.25
0.25
0.25
0.25
0.25
0.0D
0.5D
1.0D
2.0D
3.5D
5.0D
9.0D
u'/U
v'/U
Fig. 22- Horizontal cross-stream profiles of u’/U (O) and v’/U (X) velocities in the outlet pipe
of the round-edge tee for Re= 32,000 and Q1 Q
3= 50%.
0
0.4
0.8
1.2
1.6
2
2.4
2.8
3.2
.
-1 -0.5 0 0.5 1
r/R
0.4
0.4
0.4
0.4
0.4
0.4
0.4
0.4
0.0'D
0.1'D
0.25'D
0.5'D
1.1'D
1.5'D
2.0'D
3.5'D
5.0'D
v'/U (a)
0
0.4
0.8
1.2
1.6
2
2.4
2.8
3.2
.
-1 -0.5 0 0.5 1r/R
0.4
0.4
0.4
0.4
0.4
0.4
0.4
0.4
u'/U (b)
0.0'D
0.1'D
0.25'D
0.5'D
1.1'D
1.5'D
2.0'D
3.5'D
5.0'D
Fig. 23- Radial profiles of v'/U and u’ /U in the branch pipe of the round-edge tee for
Re=32,000 and Q1 Q
3= 50%. (a) v’/U (O horizontal profile; X vertical profile); (b) u’/U