EDCON HOLDINGS (PROPRIETARY) LIMITED … HOLDINGS (PROPRIETARY) LIMITED (“EDCON”) CONSOLIDATED...
30
19 November 2009 This notice is important and requires your immediate attention. EDCON HOLDINGS (PROPRIETARY) LIMITED (“EDCON”) CONSOLIDATED CONDENSED INTERIM FINANCIAL STATEMENTS FOR THE SIX- MONTH PERIOD ENDED 26 SEPTEMBER 2009
Transcript of EDCON HOLDINGS (PROPRIETARY) LIMITED … HOLDINGS (PROPRIETARY) LIMITED (“EDCON”) CONSOLIDATED...

19 November 2009
This notice is important and requires your immediate attention.
EDCON HOLDINGS (PROPRIETARY) LIMITED (“EDCON”) CONSOLIDATED CONDENSED INTERIM FINANCIAL STATEMENTS FOR
THE SIX- MONTH PERIOD ENDED 26 SEPTEMBER 2009

1
SUMMARY OF FINANCIAL AND OTHER DATA The following unaudited historical financial data relates to the three-month period ended 27 September
2008 and the three-month period ended 26 September 2009. Unless the context requires otherwise,
references in this notice to (i) “second quarter 2009” and “second quarter 2010” shall mean the
13-week period ended 27 September 2008 and the 13-week period ended 26 September 2009,
respectively, (ii) “fiscal 2009” and “fiscal 2010” shall mean the 52-week period ended 28 March 2009
and the 53-week period ending 3 April 2010, respectively, and (iii) “year-to-date 2009” and “year-to-date
2010” shall mean the 26-week period ended 27 September 2008 and the 26-week period ended 26
September 2009, respectively.
We present below certain financial data to show the effect of certain aspects of the Transactions, as
defined in the offering memorandum in relation to the €1,180 million senior secured floating rate notes
due 2014 and the €630 million senior floating rate notes due 2015 (together the “Floating Rate Notes”)
dated 14 June 2007 (the “Offering Memorandum”).

2
Second Quarter
(in millions) (unaudited)
Year-To-Date (in millions) (unaudited)
2009(1) 2010(1) 2009(1) 2010(1)
Comprehensive income data Revenues R 5 365 R 5 052 R 11 141 R 11 000 Retail sales 4 746 4 466 9 935 9 768 Cost of sales (2 992) (2 868) (6 177) (6 252)Gross profit 1 754 1 598 3 758 3 516 Other income 116 120 226 242 Store costs (883) (925) (1 774) (1 883)Other operating costs (598) (580) (1 247) (1 149)Additional depreciation and amortisation(3) (126) (173) (251) (349)Retail trading profit 263 40 712 377 Net income/(expense) from credit 68 (45) 115 (49) Equity accounted earnings of joint venture 71 94 135 196 Trading profit 402 89 962 524 Fees incurred – securitisation (25) (25) Gain on buy-back of senior floating rate notes (2) 1 375 Net fair value movement on notes and associated derivatives (882) (298) (711) 145Profit/(loss) before financing costs (482) (234) 1 626 644Net financing costs (702) (630) (1 484) (1 355)Taxation 364 693 172 664(Loss)/profit for the period R (820) R (171) R 314 R (47) Other financial data EBITDA(4) R (246) R 75 R 2 091 R 1 255 Adjusted EBITDA (4) 627 386 1 416 1 123 Operating lease expense 311 348 619 690 Adjusted EBITDAR 938 734 2 035 1 813 Capital expenditure 162 104 298 213 Depreciation and amortisation 236 309 465 611
Select operating data Number of stores 1 153 1 244 1 153 1 244 Same store sales growth (%) 5 (9) 3 (5) Average retail space (in ‘000 sqm) 1 229 1 309 1 225 1 304 Number of customer credit accounts (in ‘000s) 4 059 4 183 4 059 4 183
Year-To-Date (in millions) (unaudited)
2009(1) 2010(1)
Financial position data Working capital R 3 772 R 3 924 Total assets 34 254 31 332 Total debt at unhedged rates 20 103 19 135 Total net debt including cash and derivatives 19 047 20 578 Total shareholders’ funds including shareholder’s loan 7 236 6 241

3
Second Quarter
(in millions) (unaudited)
Year-To-Date (in millions) (unaudited)
2009(1) 2010(1) 2009(1) 2010(1)
Cash flow data Operating cash inflow before changes in working capital R 626 R 395 R 1 408 R 1 118 Working capital movement (298) 541 (147) 882 Cash generated from operating activities 328 936 1 261 2 000 Net cash invested (161) (104) (297) (213)Net cash inflow/(outflow) from financing activities 307 (240) 218 (360)Increase in cash and cash equivalents 8 113 45 170 _____________________________
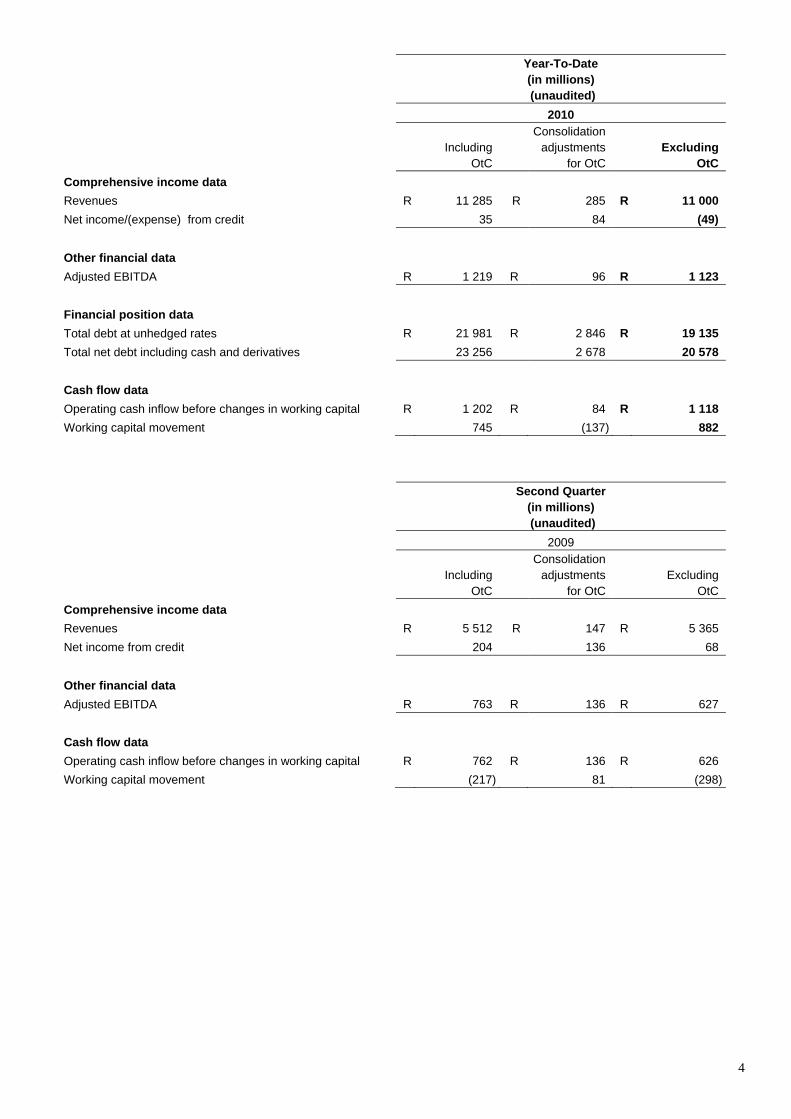
1) All figures presented in the summary financial statements above exclude the impact of consolidating OntheCards Investments Limited (“OtC”) and OntheCards Investment II (Proprietary) Limited (“OtC II”). Refer to note 2 below for a reconciliation of key line items.
2) The following tables reconcile financial information which is presented in the Consolidated Financial Statements attached hereto
which consolidate OtC and OtC II, to the tables presented in the summary financial statements above. Refer to note 5 in the Consolidated Financial Statements for the impact of consolidating OtC and OtC II.
Second Quarter
(in millions) (unaudited)
2010
Including OtC
Consolidation adjustments
for OtC Excluding
OtC Comprehensive income data Revenues R 5 196 R 144 R 5 052 Net (expense)/income from credit (20) 25 (45) Other financial data Adjusted EBITDA R 423 R 37 R 386 Cash flow data
Operating cash inflow before changes in working capital R 420 R 25 R 395 Working capital movement 378 (163) 541
4
Year-To-Date (in millions) (unaudited)
2010
Including OtC
Consolidation adjustments
for OtC Excluding
OtC Comprehensive income data Revenues R 11 285 R 285 R 11 000 Net income/(expense) from credit 35 84 (49) Other financial data Adjusted EBITDA R 1 219 R 96 R 1 123 Financial position data
Total debt at unhedged rates R 21 981 R 2 846 R 19 135 Total net debt including cash and derivatives 23 256 2 678 20 578 Cash flow data
Operating cash inflow before changes in working capital R 1 202 R 84 R 1 118 Working capital movement 745 (137) 882
Second Quarter
(in millions) (unaudited)
2009
Including OtC
Consolidation adjustments
for OtC Excluding
OtC Comprehensive income data Revenues R 5 512 R 147 R 5 365 Net income from credit 204 136 68 Other financial data Adjusted EBITDA R 763 R 136 R 627 Cash flow data
Operating cash inflow before changes in working capital R 762 R 136 R 626 Working capital movement (217) 81 (298)
5
Year-To-Date (in millions) (unaudited)
2009
Including OtC
Consolidation adjustments
for OtC Excluding
OtC Comprehensive income data Revenues R 11 395 R 254 R 11 141 Net income from credit 298 183 115 Financial position data Adjusted EBITDA R 1 599 R 183 R 1 416 Balance sheet data
Total debt at unhedged rates R 22 563 R 2 460 R 20 103 Total net debt including cash and derivatives 21 412 2 365 19 047 Cash flow data
Operating cash inflow before changes in working capital R 1 591 R 183 R 1 408 Working capital movement (43) 104 (147)
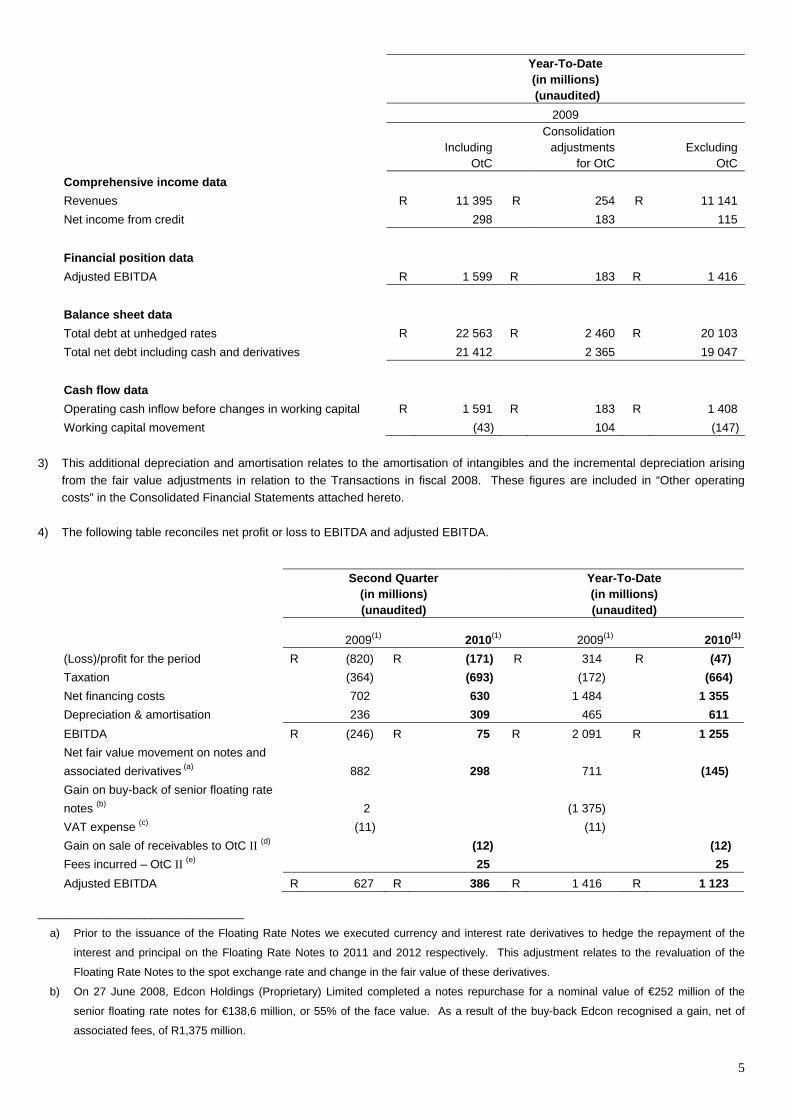
3) This additional depreciation and amortisation relates to the amortisation of intangibles and the incremental depreciation arising
from the fair value adjustments in relation to the Transactions in fiscal 2008. These figures are included in “Other operating costs” in the Consolidated Financial Statements attached hereto.
4) The following table reconciles net profit or loss to EBITDA and adjusted EBITDA.
Second Quarter
(in millions) (unaudited)
Year-To-Date (in millions) (unaudited)
2009(1) 2010(1) 2009(1) 2010(1)
(Loss)/profit for the period R (820) R (171) R 314 R (47) Taxation (364) (693) (172) (664) Net financing costs 702 630 1 484 1 355 Depreciation & amortisation 236 309 465 611 EBITDA R (246) R 75 R 2 091 R 1 255 Net fair value movement on notes and associated derivatives (a) 882 298 711 (145) Gain on buy-back of senior floating rate notes (b) 2 (1 375) VAT expense (c) (11) (11) Gain on sale of receivables to OtC II (d) (12) (12) Fees incurred – OtC II (e) 25 25 Adjusted EBITDA R 627 R 386 R 1 416 R 1 123
_______________________________
a) Prior to the issuance of the Floating Rate Notes we executed currency and interest rate derivatives to hedge the repayment of the
interest and principal on the Floating Rate Notes to 2011 and 2012 respectively. This adjustment relates to the revaluation of the
Floating Rate Notes to the spot exchange rate and change in the fair value of these derivatives.
b) On 27 June 2008, Edcon Holdings (Proprietary) Limited completed a notes repurchase for a nominal value of €252 million of the
senior floating rate notes for €138,6 million, or 55% of the face value. As a result of the buy-back Edcon recognised a gain, net of
associated fees, of R1,375 million.

6
c) This adjustment relates to a reversal of VAT input charges claimed from the South African Revenue Service (SARS) in fiscal 2009 of
R11 million.
d) This adjustment relates to the reversal of a net gain of R12 million on the sale of R543 million receivables to OtC II.
e) This adjustment reflects the one-time professional fees incurred by Edcon in relation to the securitisation of accounts receivables to
OtC II.

7
MANAGEMENT DISCUSSION AND ANALYSIS
Retail sales In anticipation of the difficult economic climate that has unfolded in South Africa, management took aggressive steps to reduce risk, improve cash flow and position Edcon for the rebound forecast for 2010. The measures for reducing risk included restricting growth of the debtors’ book for higher risk consumers, increasing the bad debt provision and eliminating the use of credit for food, cellular airtime and Discom purchases. Initiatives to improve cash flow included, reducing orders of less productive stock, clearing prior and slow moving stock, opening less space than we planned and deferring IT spend. Additionally, stringent controls for corporate overheads and payroll have been implemented. The consequence of these aggressive steps coupled with new cellular RICA legislation and enduring poor performance from ladieswear and home textiles have seen sales decrease by 5.9% from the second quarter 2009. However, stocks are down on the second quarter 2009 and with the significant reduction of low margin sales the change of mix will improve the quality of sales in the months ahead. Same store sales (stores open for the full period in the current year and in the prior year) were down 9.1% on the prior period. Credit sales accounted for 49% of total retail sales in the second quarter 2010, down from 52% in the second quarter 2009 due to the credit tightening. In Edgars retail sales in the second quarter 2010 decreased by 4.2% from the second quarter 2009 primarily due to negative growth from cellular products, ladieswear and homeware. CNA’s retail sales in the second quarter 2010 decreased 2.1% from the second quarter 2009, driven by negative growth in cellular products. Retail sales in the discount division decreased by 8.9% from the second quarter 2009 to the second quarter 2010 due mainly to negative growth in ladieswear, cosmetics, cellular products and food. Gross profit Gross profit decreased by R156 million, or 8.9%, from R1,754 million in the second quarter 2009 to R1,598 million in the second quarter 2010 primarily due to conservative markdown activity in Edgars and the discount division. Gross profit as a percentage of retail sales decreased from 37.0% in the second quarter 2009 to 35.8% in the second quarter 2010. Edgars decreased its gross profit as a percentage of retail sales from 41.8% in the second quarter 2009 to 40.3% in the second quarter 2010, due to the increased markdowns in ladieswear and menswear. Gross profit as a percentage of retail sales in CNA increased from 32.1% in the second quarter 2009 to 32.5% in the second quarter 2010 primarily because of a change in product mix, with a reduced contribution from lower margin cellular products. In the discount division, gross profit margin decreased from 31.7% in the second quarter 2009 to 30.3% in the second quarter 2010 due to the higher markdowns in ladieswear and footwear. Store costs Store costs increased by R42 million, or 4.8%, from R883 million in the second quarter 2009 to R925 million in the second quarter 2010 primarily as a result of (i) the addition of 6.5% to average retail space from the second quarter 2009 to the second quarter 2010, and (ii) wage, rent and utilities increases for our existing stores. This inflation was largely offset by productivity improvements in the stores.
8
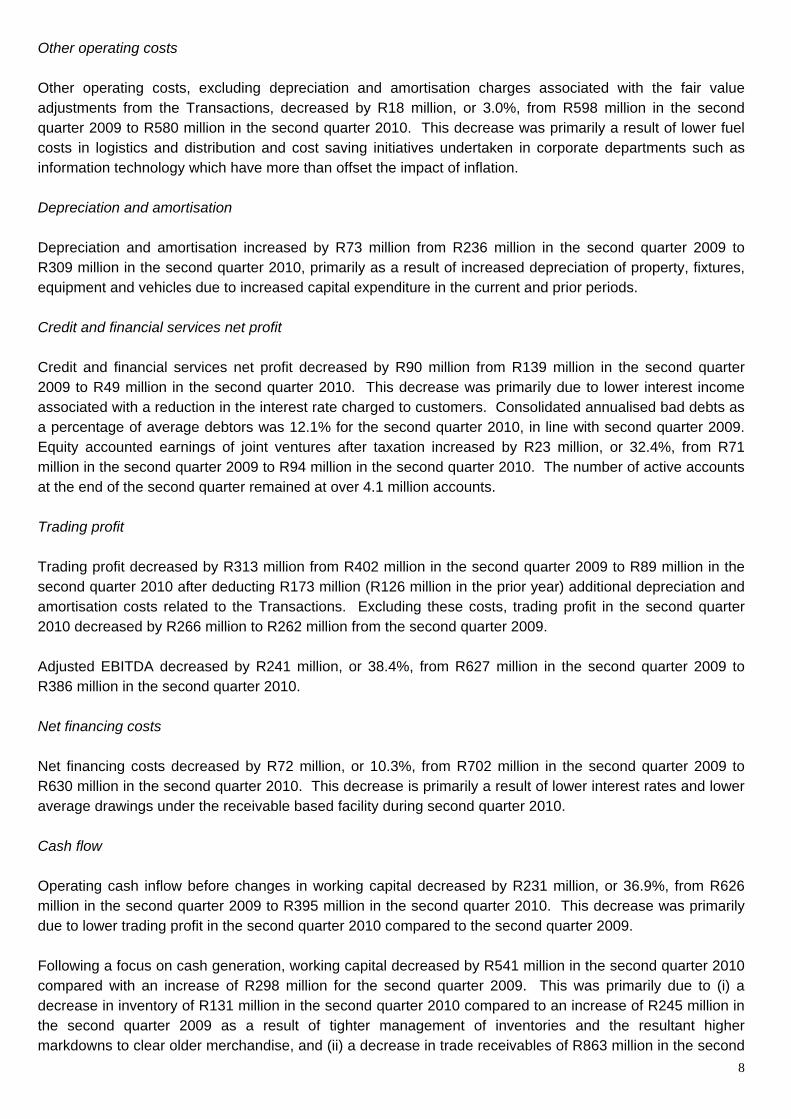
Other operating costs Other operating costs, excluding depreciation and amortisation charges associated with the fair value adjustments from the Transactions, decreased by R18 million, or 3.0%, from R598 million in the second quarter 2009 to R580 million in the second quarter 2010. This decrease was primarily a result of lower fuel costs in logistics and distribution and cost saving initiatives undertaken in corporate departments such as information technology which have more than offset the impact of inflation. Depreciation and amortisation Depreciation and amortisation increased by R73 million from R236 million in the second quarter 2009 to R309 million in the second quarter 2010, primarily as a result of increased depreciation of property, fixtures, equipment and vehicles due to increased capital expenditure in the current and prior periods. Credit and financial services net profit Credit and financial services net profit decreased by R90 million from R139 million in the second quarter 2009 to R49 million in the second quarter 2010. This decrease was primarily due to lower interest income associated with a reduction in the interest rate charged to customers. Consolidated annualised bad debts as a percentage of average debtors was 12.1% for the second quarter 2010, in line with second quarter 2009. Equity accounted earnings of joint ventures after taxation increased by R23 million, or 32.4%, from R71 million in the second quarter 2009 to R94 million in the second quarter 2010. The number of active accounts at the end of the second quarter remained at over 4.1 million accounts. Trading profit Trading profit decreased by R313 million from R402 million in the second quarter 2009 to R89 million in the second quarter 2010 after deducting R173 million (R126 million in the prior year) additional depreciation and amortisation costs related to the Transactions. Excluding these costs, trading profit in the second quarter 2010 decreased by R266 million to R262 million from the second quarter 2009. Adjusted EBITDA decreased by R241 million, or 38.4%, from R627 million in the second quarter 2009 to R386 million in the second quarter 2010. Net financing costs Net financing costs decreased by R72 million, or 10.3%, from R702 million in the second quarter 2009 to R630 million in the second quarter 2010. This decrease is primarily a result of lower interest rates and lower average drawings under the receivable based facility during second quarter 2010. Cash flow Operating cash inflow before changes in working capital decreased by R231 million, or 36.9%, from R626 million in the second quarter 2009 to R395 million in the second quarter 2010. This decrease was primarily due to lower trading profit in the second quarter 2010 compared to the second quarter 2009. Following a focus on cash generation, working capital decreased by R541 million in the second quarter 2010 compared with an increase of R298 million for the second quarter 2009. This was primarily due to (i) a decrease in inventory of R131 million in the second quarter 2010 compared to an increase of R245 million in the second quarter 2009 as a result of tighter management of inventories and the resultant higher markdowns to clear older merchandise, and (ii) a decrease in trade receivables of R863 million in the second

9
quarter 2010 compared to an increase in trade receivables of R44 million in the second quarter 2009 due to tightening of credit granting for higher risk customers as well the suspension of sales of certain product categories on credit in the second quarter 2010, offset by a decrease in payables of R517 million in the second quarter 2010 compared to a decrease of R56 million in the second quarter 2009 due to lower purchases of merchandise in the second quarter 2010. Cash generated from operating activities rose by R608 million, or 185.4%, from R328 million in the second quarter 2009 to R936 million in the second quarter 2010. Capital expenditure was R104 million in the second quarter 2010 compared with R162 million in the second quarter 2009. During the second quarter 2010 we have opened 15 new stores which, combined with store refurbishments, resulted in investments in store fixtures of R47 million. In addition, in the second quarter 2010 we invested R57 million in information technology infrastructure compared with R86 million in the second quarter 2009. Liquidity and capital resources At 26 September 2009 our total net debt including cash and derivatives (excluding OtC) of R20,578 million consisted of (i) the fair value of the Floating Rate Notes of R16,689 million, (ii) borrowings under the revolving credit facility of R1,975 million, (iii) borrowings under the borrowing base facility of R471 million, (iv) net derivatives of R1,969 million, less (v) cash and cash equivalents of R526 million. In addition, OtC and OtC II net debt of R2,678 million consisted of (i) borrowing under the receivables backed facility of R1,846 million, (ii) receivables-backed notes of R1,000 million, less (iii) cash and cash equivalents of R168 million. At 26 September 2009, the total facility available under the revolving credit facility was R3,500 million. The total facility available under the borrowing base facility was R3,555 million, although this may increase to R5,537 million if commitments under the OtC securitisation are transferred to our borrowing base facility. During the second quarter of 2010 the maximum utilisation of the revolving credit facility and the borrowing base facility was R2,655 million and R816 million (R3,415 million including OtC) respectively. We believe that operating cash flows and amounts available under the revolving credit facility and the borrowing base facility will be sufficient to fund our debt service obligations and operations, including capital expenditure and contractual commitments, in the foreseeable future. OntheCards Investments II (Proprietary) Limited In August 2009, OtC II raised R1 billion through the issuance of a combination of one year (R445 million) and three year (R555 million) receivable-backed notes listed on the Bond Exchange of South Africa. OtC II used the proceeds from this issuance, together with a subordinated loan from Edcon of R515 million, to acquire accounts receivable of R543 million and R1,010 million from Edcon and OtC respectively. Edcon has consolidated OtC II and the results thereof are included in note 5 in the Consolidated Financial Statements attached hereto.

10
CRITICAL ACCOUNTING POLICIES AND USE OF ESTIMATES In preparing our group financial statements, our management has historically been required to make estimates and assumptions that affect reported income, expenses, assets, liabilities and disclosure of contingent assets and liabilities. Actual results in the future could differ from these estimates, and this may be material to our financial statements. Significant estimates and judgments made relate to an allowance for doubtful debts, allowances for slow-moving inventory, residual values, useful lives and depreciation methods, classification of leases, estimating the fair value of derivatives including credit valuation adjustments to reflect non-performance risk, pension fund and employee obligations and asset impairment tests. Revenue recognition Revenue comprises retail sales of merchandise, manufacturing sales, club fees, financial services income, equity accounted earnings of joint ventures, dividends, and interest and finance charges accrued to Edcon. Revenue from all sales of merchandise, net of returns, is brought to account when delivery takes place to the customer. Revenue from manufacturing and other operations is recognised when the sale transactions giving rise to such revenue are concluded. Finance charges on arrear account balances are accrued on a time proportion basis, recognising the effective yield on the underlying assets. Dividends are recognised when the right to receive payment is established. Interest received is recognised using the effective interest rate method. Club fees are recognised as incurred. Trade and other receivables Trade and other receivables are initially recognised at fair value. Subsequent to initial measurement, receivables are recognised at amortised cost less an allowance for doubtful debts. A provision for impairment is made when there is objective evidence (such as default or delinquency of interest and the principal) that Edcon will not be able to collect all amounts due under the original terms of the trade receivable transactions. Bad debts incurred are recognised in profit or loss as incurred. Delinquent accounts are impaired by applying Edcon’s impairment policy recognising both contractual and ages of accounts. Age refers to the number of months since a qualifying payment was received. The process for estimating impairment considers all credit exposures, not only those of low credit quality and estimated on the basis of historical loss experience, adjusted on the basis of current observable data, to reflect the effects of current conditions. Edcon assesses whether objective evidence of impairment exists individually for receivables that are individually significant, and individually or collectively for receivables that are not individually significant. If it is determined that no objective evidence of impairment exists for an individually assessed receivable, whether significant or not, the receivable is included in a group of receivables with similar credit risk characteristics and that group of receivables is collectively assessed for impairment. Receivables that are individually assessed for impairment and for which an impairment loss is, or continues to be recognised, are not included in a collective assessment of impairment. If in a subsequent period, the amount of the impairment loss decreases and the decrease can be related objectively to an event occurring after the impairment was recognised, the previously recognised impairment loss is reversed. Any subsequent reversal of an impairment loss is recognised in profit or loss; to the extent the carrying value of the receivable does not exceed its cost at the reversal date. Leases Leases are classified as finance leases where substantially all the risks and rewards associated with ownership of an asset are transferred from the lessor to Edcon as lessee. The determination of whether an arrangement is a lease, or contains a lease, is based on the substance of the arrangement at inception date

11
and whether the fulfilment of the arrangement is dependent on the use of a specific asset or assets or the arrangement conveys a right to use the asset. Assets subject to finance leases are capitalised at the lower of the fair value of the asset, and the present value of the minimum lease payments, with the related lease obligation recognised at the same value. Capitalised leased assets are depreciated over the shorter of the lease term and the estimated useful life if Edcon does not obtain ownership thereof. Finance lease payments are allocated, using the effective interest rate method, between the lease finance cost, which is included in financing costs, and the capital repayment, which reduces the liability to the lessor. Operating leases are those leases which do not fall within the scope of the above definition. Operating lease rentals with fixed escalation clauses are charged against trading profit on a straight-line basis over the term of the lease. In the event of a sub-lease, lease rentals received are included in profit or loss on a straight-line basis. Inventory Retail trading inventories are valued at the lower of cost, using the weighted average cost, and net realisable value, less an allowance for slow-moving items. Net realisable value is the estimated selling price in the ordinary course of business less necessary costs to make the sale. In the case of own manufactured inventories, cost includes the total cost of manufacture, based on normal production facility capacity, and excludes financing costs. Work-in-progress is valued at actual cost, including direct material costs, labour costs and manufacturing overheads. Factory raw materials and consumable stores are valued at average cost, less an allowance for slow-moving items. The allowance for slow-moving inventory is made with reference to an inventory age analysis. All inventory older than 18 months is provided for in full as it is not readily disposable. All store inventories are physically verified at least twice a year through the performance of inventory counts and shortages identified are written off immediately. Stores, which have a history of high inventory losses, are subject to more frequent inventory counts. An allowance is made, based on historical trends of inventory losses, for losses incurred between the last physical count and the balance sheet date. Financial instruments Financial instruments recognised on the balance sheet include derivative instruments, held-to-maturity investments, trade and other receivables, cash and cash equivalents, trade and other payables and financial liabilities. Financial instruments are initially measured at fair value, including transaction costs, except those at fair value directly through profit or loss, when Edcon becomes a party to contractual arrangements. Edcon uses derivative financial instruments such as foreign currency contracts and interest rate swaps to manage the financial risks associated with their underlying business activities and the financing of those activities. Edcon does not undertake any trading activity in derivative financial instruments. The fair value of forward exchange contracts is calculated by reference to current forward exchange rates for contracts with similar maturity profiles. The fair value of interest rate swap contracts is determined by reference to market values for similar instruments.
12
We incorporate credit risk valuation adjustments to appropriately reflect both our own non-performance risk and the respective counterparty’s non-performance risk in the fair value measurements. The significant inputs to the overall valuations are based on market observable data or information derived from or corroborated by market observable data, including transactions, broker or dealer quotations, or alternative pricing sources with reasonable levels of price transparency. Where models are used the selection of a particular model to value a derivative depends upon the contractual terms of, end specific risks inherent in the instrument as well as the availability of pricing information in the market. Edcon uses similar models to value similar instruments. Valuation models require a variety of inputs including contractual terms, market prices, yield curves and credit curves. The credit risk valuation adjustments are calculated by determining the current net exposure of each derivative (excluding potential future exposure) and then discounting the estimated cash flows at a rate, adjusted with each counterparty’s credit spread to the applicable exposure. The inputs utilised by Edcon for its own credit spread are based on estimated fair market spreads for entities with similar credit ratings. For counterparties with publicly available credit information, the credit spreads over the benchmark rate used in the calculations represent implied credit default swap spreads obtained from a third party credit data provider. In adjusting the fair value of derivative contracts for the effect of non-performance risk, Edcon has not considered the impact of netting and any applicable credit enhancements such as, collateral postings, thresholds, mutual puts and guarantees. Edcon additionally actively monitors counterparty credit ratings for any significant changes. For the purposes of hedge accounting, hedges are classified as either fair value hedges where they hedge the exposure to changes in the fair value of a recognised asset or liability; or cash flow hedges where they hedge exposure to variability in cash flows that is either attributable to a particular risk associated with a recognised asset or liability or a forecast transaction. In relation to cash flow hedges which meet the conditions for special hedge accounting, the portion of the gain or loss on the hedging instrument that is determined to be an effective hedge is recognised directly in equity and the ineffective portion is recognised in net profit or loss. For cash flow hedges, the gains or losses that are recognised in equity are transferred to profit or loss in the same period in which the hedged item affects the net profit or loss, for example when the future sale actually occurs. For derivatives that do not qualify for special hedge accounting, any gains or losses arising from changes in fair value are taken directly to profit or loss for the period. Hedge accounting is discontinued when the hedging instrument expires or is sold, terminated or exercised, or no longer qualifies for special hedge accounting. At that point in time, any cumulative gain or loss on the hedging instrument recognised in equity is kept in equity until the forecast transaction occurs. If a hedged transaction is no longer expected to occur, the net cumulative gain or loss recognised in equity is transferred to profit or loss for the period.

13
Goodwill Goodwill is initially measured at cost and represents the excess of the purchase consideration over the fair value of Edcon’s share of the net fair value of the identifiable assets, liabilities and contingent liabilities of the acquired entity at the date of acquisition. Following initial recognition, goodwill is measured at cost, less any accumulated impairment losses. Goodwill is reviewed for impairment annually, or more frequently, if events or changes in circumstances indicate that the carrying value may be impaired.
If on acquiring an entity, Edcon’s share of the net fair value of the identifiable assets, liabilities and contingent liabilities of the acquired entity exceeds the purchase consideration, this excess/(discount) is recognised in profit or loss immediately.
As at the acquisition date, any goodwill acquired is allocated to each of the cash-generating units expected to benefit from the acquisition. Impairment is determined by assessing the recoverable amount of the cash-generating unit, to which the goodwill relates. Where the recoverable amount of the cash-generating unit is less than the carrying amount, an impairment loss is recognised. Where goodwill forms part of a cash-generating unit and part of the operation within that unit is disposed of, the goodwill associated with the operation disposed of, is included in the carrying amount of the operation when determining the gain or loss on disposal of that operation. Goodwill disposed of in this circumstance is measured on the basis of the relative values of the operation disposed of and the portion of the cash-generating unit which is retained. Other intangible assets Where payments are made for the acquisition of intangible assets with a finite useful life, the amounts are capitalised at cost and amortised on a straight-line basis over their anticipated useful lives. Intangible assets acquired through the acquisition of an entity are recognised at fair value. The useful life of intangible assets with a finite life is estimated to be between five and fifteen years. Amortisation is charged on those assets with finite lives and the expense is taken to the income statement and included in other operating costs. The amortisation period and the amortisation method for an intangible asset with a finite useful life is reviewed at least at each financial period-end and assessed for indicators of impairment. Annually, intangible assets with an indefinite useful life are reviewed for impairment or changes in estimated future benefits, either individually or at the cash-generating unit level. Such intangible assets are not amortised and the useful life is reviewed annually to determine whether indefinite life assessment continues to be appropriate. If not, the change from indefinite to finite will be made on a prospective basis. If such indications exist, an analysis is performed to assess whether the carrying amount of intangible assets is fully recoverable. An impairment is made if the carrying amount exceeds the recoverable amount. Useful lives are also examined on an annual basis and adjustments, where applicable, are made on a prospective basis. Intangible assets are derecognised on disposal or when no future economic benefits are expected through use of the intangible assets. Gains or losses arising from derecognition of an intangible asset are measured as the difference between the net disposal proceeds and the carrying amount of the intangible asset and are recognised in profit or loss when the intangible asset is derecognised. No valuation is made of internally developed and maintained intangible assets. Expenditure incurred to maintain brand names is charged in full to profit or loss as incurred.

14
Consolidated Financial Statements
Edcon Holdings (Proprietary) Limited
15
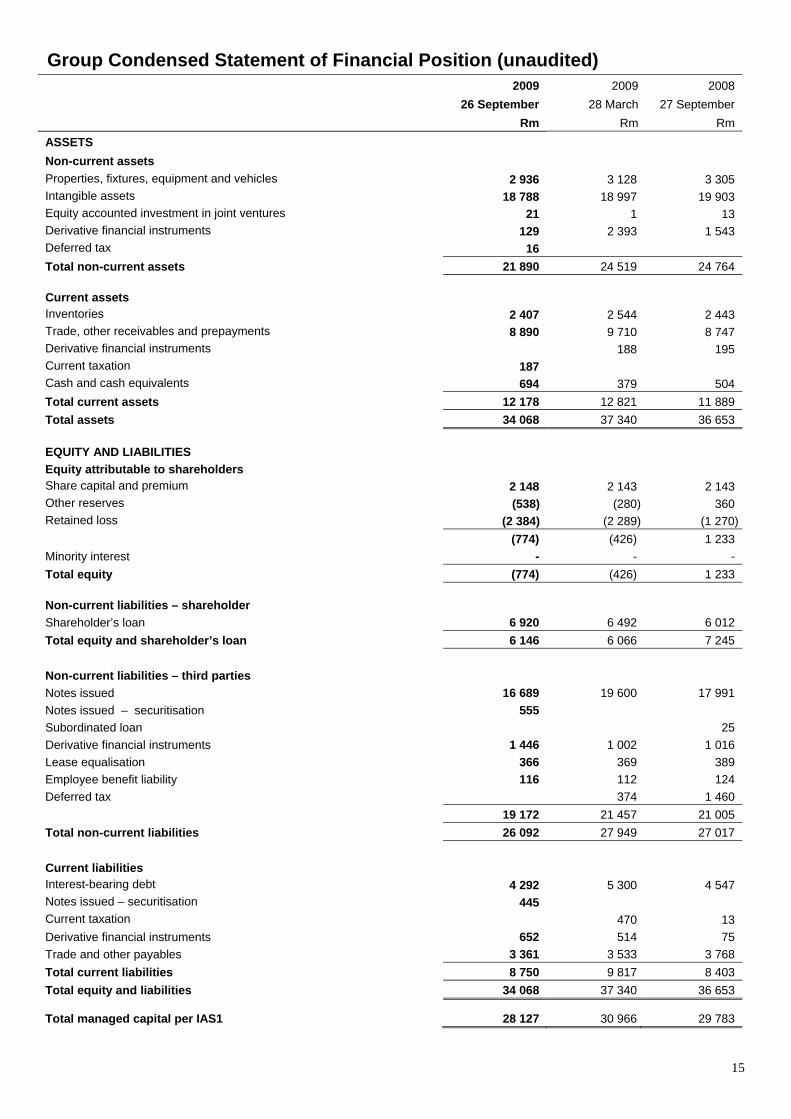
Group Condensed Statement of Financial Position (unaudited) 2009
26 September Rm
2009 28 March
Rm
2008 27 September
Rm ASSETS
Non-current assets Properties, fixtures, equipment and vehicles 2 936 3 128 3 305 Intangible assets 18 788 18 997 19 903 Equity accounted investment in joint ventures 21 1 13 Derivative financial instruments 129 2 393 1 543 Deferred tax 16 Total non-current assets 21 890 24 519 24 764
Current assets
Inventories 2 407 2 544 2 443 Trade, other receivables and prepayments 8 890 9 710 8 747 Derivative financial instruments 188 195 Current taxation 187 Cash and cash equivalents 694 379 504 Total current assets 12 178 12 821 11 889 Total assets 34 068 37 340 36 653
EQUITY AND LIABILITIES
Equity attributable to shareholders Share capital and premium 2 148 2 143 2 143 Other reserves (538) (280) 360 Retained loss (2 384) (2 289) (1 270) (774) (426) 1 233 Minority interest - - - Total equity (774) (426) 1 233
Non-current liabilities – shareholder
Shareholder’s loan 6 920 6 492 6 012 Total equity and shareholder’s loan 6 146 6 066 7 245 Non-current liabilities – third parties
Notes issued 16 689 19 600 17 991 Notes issued – securitisation 555 Subordinated loan 25 Derivative financial instruments 1 446 1 002 1 016 Lease equalisation 366 369 389 Employee benefit liability 116 112 124 Deferred tax 374 1 460 19 172 21 457 21 005 Total non-current liabilities 26 092 27 949 27 017 Current liabilities
Interest-bearing debt 4 292 5 300 4 547 Notes issued – securitisation 445 Current taxation 470 13 Derivative financial instruments 652 514 75 Trade and other payables 3 361 3 533 3 768 Total current liabilities 8 750 9 817 8 403 Total equity and liabilities 34 068 37 340 36 653
Total managed capital per IAS1 28 127 30 966 29 783

16
Group Condensed Quarterly Statement of Comprehensive Income (unaudited)
2009 13 weeks to
26 September Rm
2008 13 weeks to
27 September Rm
Total revenues 5 196 5 512
Revenue - retail sales 4 466 4 746
Cost of sales (2 868) (2 992)
Gross profit 1 598 1 754
Other income 120 116
Store costs (925) (883)
Other operating costs (753) (724)
Retail trading profit 40 263
Income from credit 510 573
Expenses from credit (530) (369)
Equity accounted earnings of joint venture 94 71
Trading profit 114 538
Fees incurred – OtC II (25)
Expense incurred on buy-back of senior floating rate notes (2)
Derivative expense (598) (2 031)
Foreign exchange gain 300 1 149
Loss before net financing costs (209) (346) Interest received 6 5 Loss before financing costs (203) (341)
Financing costs (705) (798)
Loss before taxation (908) (1 139)
Taxation 705 351
LOSS FOR THE PERIOD Other comprehensive income after tax:
(203) (788)
Exchange differences on translating foreign operations (7) (2) Cash flow hedges (26) (469) Other 2 (1) Other comprehensive income for the year, net of tax (31) (472) TOTAL COMPREHENSIVE INCOME FOR THE PERIOD (234) (1 260) Profit attributable to: Owners of the parent (203) (788) Minority interest - - Total comprehensive income attributable to: Owners of the parent (234) (1 260) Minority interest -

17
Group Condensed Half-year Statement of Comprehensive Income (unaudited)
Note
2009 26 weeks to
26 September Rm
2008 26 weeks to
27 September Rm
Total revenues 3 11 285 11 395 Revenue - retail sales
9 768
9 935 Cost of sales (6 252) (6 177)
Gross profit 3 516 3 758
Other income 242 226
Store costs (1 883) (1 774)
Other operating costs (1 498) (1 498)
Retail trading profit 377 712
Income from credit 4.1 1 069 1 085
Expenses from credit 4.2 (1 034) (787)
Equity accounted earnings of joint venture 196 135
Trading profit 608 1 145
Fees incurred – OtC II (25)
Gain on buy-back of senior floating rate notes 1 375
Derivative expense (2 786) (2 436)
Foreign exchange gain 2 931 1 725
Profit before net financing costs 728 1 809
Interest received 10 14
Profit before financing costs 738 1 823
Financing costs (1 508) (1 671)
(Loss)/profit before taxation (770) 152
Taxation 680 169
(LOSS)/PROFIT FOR THE PERIOD Other comprehensive income after tax:
(90) 321
Exchange difference on translating foreign operations (28) (12)Cash flow hedges (230) (464)Other (2)Other comprehensive income for the year, net of tax (258) (478)TOTAL COMPREHENSIVE INCOME FOR THE PERIOD (348) (157) Profit attributable to:
Owners of the parent (90) 322 Minority interest - (1) Total comprehensive income attributable to: Owners of the parent (348) (157)Minority interest - -

18
Group Condensed Statements of Changes in Equity (unaudited)
Share capital
and premium
Rm
Trans-lation of foreign
operations Rm
Cash flow hedges
Rm
Re-valuation
surplus RM
Retained loss RM
Total Rm
Minority Interest
Rm
Total equity
Rm AT 27 SEPTEMBER 2008
Opening balance at 30 March 2008 2 143 31 782 23
(1 590) 1 389 1 1 390 Total comprehensive
income for the period (12) (464) 320 (156) (1) (157)Balance at 27 September 2008 2 143 19 318 23 (1 270) 1 233 - 1 233 AT 26 SEPTEMBER 2009 Opening balance at 29 March 2009 2 143 28 (331) 23 (2 289) (426) - (426) Issue of share capital 5 5 5 Dividends (5) (5) (5) Total comprehensive
income for the period (28) (230) - (90) (348) - (348) Balance at 26 September 2009 2 148 - (561) 23 (2 384) (774) - (774)

19
Group Condensed Quarterly Statement of Cash Flows (unaudited)
2009 13 weeks to
26 September Rm
200813 weeks to
27 SeptemberRm
Cash retained from operating activities
Loss before net financing costs (209) (346)Depreciation 203 131 Amortisation 106 105 Gain on buy-back of senior floating rate notes 2 Foreign exchange gain (300) (1 149)Derivative expense 598 2 031 Other non-cash items 22 (12)Operating cash inflow/(outflow) before changes in working capital
420
762
Working capital movement 378 (217)Inventories 131 (245)Trade accounts receivable 728 40 Other debtors 69 73 Accounts payable (550) (85)
Cash generated from operating activities 798 545 Interest received 6 5
Financing costs paid (536) (568)
Taxation paid (2) 6
Net cash retained/(utilised) 266 (12)
Cash utilised in investment activities Net investment in fixtures, equipment and vehicles (104) (161) Net cash invested (104) (161)
Cash effects of financing activities
Notes issued – securitisation 1 000
Buy-back of senior floating rate notes (3)
Increase in interest bearing debt (881) 196 Net cash inflow from financing activities 119 193
Increase in cash and cash equivalents 281 20 Cash and cash equivalents at the beginning of the period 414 484 Currency adjustments (1) - Cash and cash equivalents at the end of the period
694 504

20
Group Condensed Half-year Statement of Cash Flows (unaudited)
2009 26 weeks to
26 September Rm
200826 weeks to
27 SeptemberRm
Cash retained from operating activities
(Loss)/Profit before net financing costs 728 1 809 Depreciation 402 256 Amortisation 209 209 Gain on buy-back of senior floating rate notes (1 375)Foreign exchange gain (2 931) (1 725)Derivative expense 2 786 2 436 Other non-cash items 8 (19)
Operating cash inflow before changes in working capital 1 202 1 591
Working capital movement 745 (43)Inventories 122 (296)Trade accounts receivable 754 38 Other debtors 42 (74)Accounts payable (173) 289
Cash generated from operating activities
1 947 1 548
Interest received 10 14 Financing costs paid (1 121) (1 157)Taxation paid (277) (167)
Net cash retained 559 238
Cash utilised in investment activities
Net investment in fixtures, equipment and vehicles (213) (297) Net cash invested
(213) (297)
Cash effects of financing activities
Notes issued – securitisation 1 000 Buy-back of senior floating rate notes (1 761)Proceeds from derivatives 1 793 Increase in interest bearing debt (1 008) 40 Net cash (outflow)/inflow from financing activities
(8) 72
Increase in cash and cash equivalents 338 13 Cash and cash equivalents at the beginning of the period 379 492 Currency adjustments (23) (1)
Cash and cash equivalents at the end of the period
694 504

21
Notes to the Financial Statements (unaudited) Basis of Accounting Edcon Holdings (Proprietary) Limited’s consolidated financial statements (Financial Statements) are prepared in accordance with International Financial Reporting Standards (IFRS) and stated in Rands (R). These Financial Statements are presented in accordance with IAS 34 Interim Financial Reporting. Accordingly, certain information and note disclosures normally included in the annual financial statements have been condensed or omitted. These Financial Statements have not been audited or reviewed by an auditor. In the opinion of management, all adjustments necessary for a fair presentation of the financial position, results of operations and cash flows for the interim periods have been made. In preparing these Financial Statements, the same accounting principles and methods of computation are applied as in the consolidated Financial Statements of Edcon Holdings (Proprietary) Limited on 28 March 2009 and for the period then ended except as noted below. These Financial Statements should be read in conjunction with the audited Financial Statements as at and for the period ended 28 March 2009 as included in the 2009 audited Group Annual Financial Statements of Edcon Holdings (Proprietary) Limited. Operating Segments IFRS 8, Operating Segments was issued in November 2006 and became effective for financial years on or after 1 January 2009. The standard specifies how an entity should report information about its operating segments in interim reports. The effect of implementing this Standard has impacted the identification of operating segments. Edgars and CNA are now considered to be two distinct operating segments, whereas previously they were combined and reported under the Department Stores Division. Additionally, information presented in note 2 introduces a management reporting approach to measuring the results of reportable operating segments and the amounts reported for each segment are consistent with internal management reports. Total assets by segment have not been disclosed as there has been no material change since the last annual financial statements. The comparative results in note 2 have been restated in accordance with IFRS 8. Presentation of Financial Statements IAS 1 was revised and became effective for financial periods beginning on or after 1 January 2009. The Standard separates owner and non-owner changes in equity, introduces a Statement of Comprehensive Income to replace the Income Statement and what was previously termed the Balance Sheet is now known as the Statement of Financial Position.

22
Notes to the Financial Statements (unaudited) continued Presentation of Financial Statements continued As a result of implementing this Standard, this interim financial report presents a Statement of Financial Position, a single Statement of Comprehensive Income which, presents all items of income and expense recognised in profit or loss together with all other items of recognised income and expense and, a Statement of Changes in Equity which only includes details of transactions with owners. The comparative period has been appropriately restated and presented on the same basis.
Other new accounting standards adopted The Group has adopted the following new and amended accounting standards and interpretations which have not had a material effect on the financial position, financial results or cash flows of the Group. • IFRIC 13, Customer Loyalty Programmes • IFRS 2, Share-based Payments – Vesting Conditions and Cancellations • IFRS 3, Business Combinations and IAS 27, Consolidated and Separate Financial Statements • IAS 23, Borrowing Costs • Amendment to IAS 32 and IAS 1, Puttable Financial Instruments • IFRIC 16, Hedges of Net Investment and a Foreign Operation • Improvements to IFRS’s (annual improvements Project 2007) OntheCards Investments II (Proprietary) Limited In August 2009, OntheCards Investments II (Proprietary) Limited (OtC II) raised R1 billion through the issuance of a combination of one year (R445 million) and three year (R555 million) receivable-backed notes listed on the Bond Exchange of South Africa. OtC II used the proceeds from this issuance, together with a subordinated loan from Edcon of R515 million, to acquire accounts receivable of R543 million and R1,010 million from Edcon and OtC respectively. Edcon has consolidated OntheCards Investments II (Proprietary) Limited and the results thereof included in note 5. Going concern The going concern assumption has been considered after including the Shareholder’s loan in the assessment. To the extent required to maintain the solvency of the Group, the Shareholder’s loan agreement is subordinated to the claims of all of the creditors of the Group.

23
Notes to the Financial Statements (unaudited) continued 2009
26 weeks to 26 September
Rm
2008 26 weeks to
27 September Rm
2. SEGMENTAL RESULTS
2.1 Revenues
Edgars 5 189 5 248
CNA 772 771
Discount Division 4 030 4 121
Manufacturing 19 21
Credit and Financial Services 1 265 1 220
Group Services 10 14
11 285 11 395
2.2 Retail sales
Edgars 5 082 5 151
CNA 772 771
Discount Division 3 914 4 013
9 768 9 935
2.3 Number of stores
Edgars 272 257
CNA 210 205
Discount Division 762 691
1 244 1 153
2.4 Segment result - operating profit/(loss)
Edgars 1 049 1 239
CNA 32 49
Discount Division 388 539
Manufacturing (7) (5)
Credit and Financial Services 231 433
Group Services1 (965) (446) 728 1 809
1 Included in the allocation to the Group Services segment is corporate overheads, derivative expense, unrealised foreign
exchange gain, gain on buy-back of senior floating rate notes and amortisation of intangible assets and additional depreciation as a result of the Transactions.
24
Notes to the Financial Statements (unaudited) continued 2009
26 weeks to 26 September
Rm
2008 26 weeks to
27 September Rm
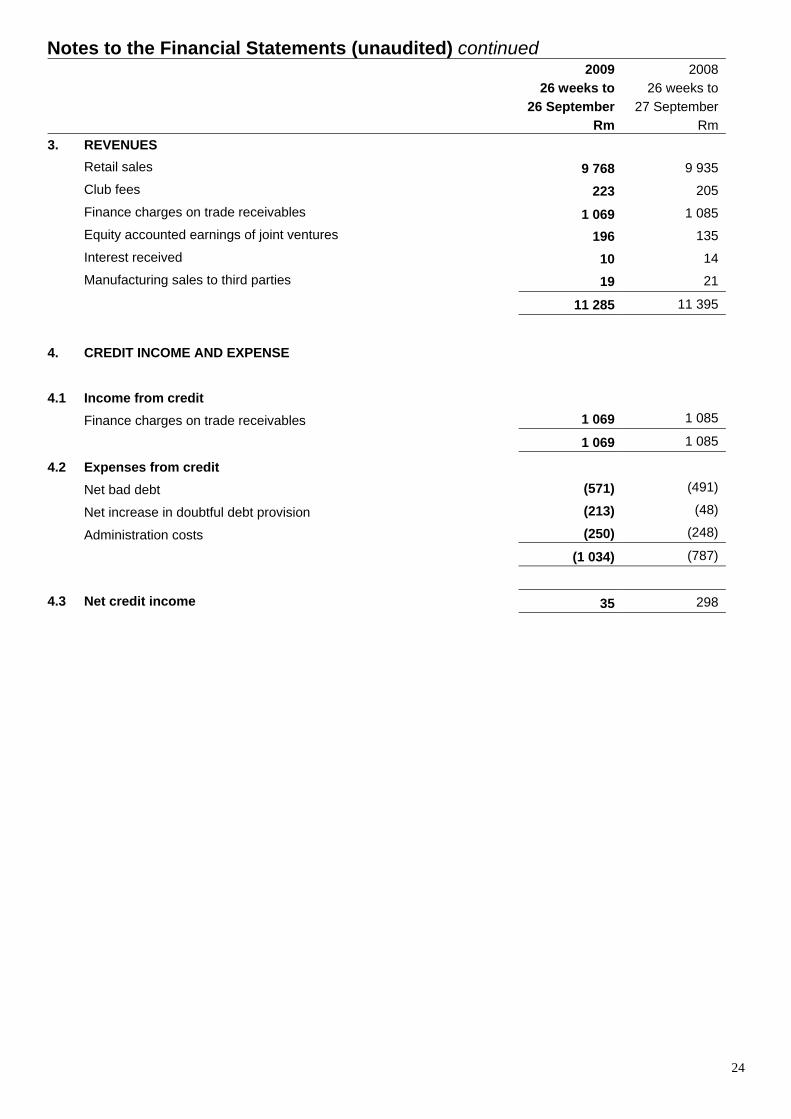
3. REVENUES Retail sales 9 768 9 935 Club fees 223 205 Finance charges on trade receivables 1 069 1 085 Equity accounted earnings of joint ventures 196 135 Interest received 10 14 Manufacturing sales to third parties 19 21 11 285 11 395
4. CREDIT INCOME AND EXPENSE
4.1 Income from credit
Finance charges on trade receivables 1 069 1 085
1 069 1 085
4.2 Expenses from credit
Net bad debt (571) (491)
Net increase in doubtful debt provision (213) (48)
Administration costs (250) (248)
(1 034) (787)
4.3 Net credit income 35 298
25
Notes to the Financial Statements (unaudited) continued 2009
13 weeks to 26 September
Rm
2008 13 weeks to
27 September Rm
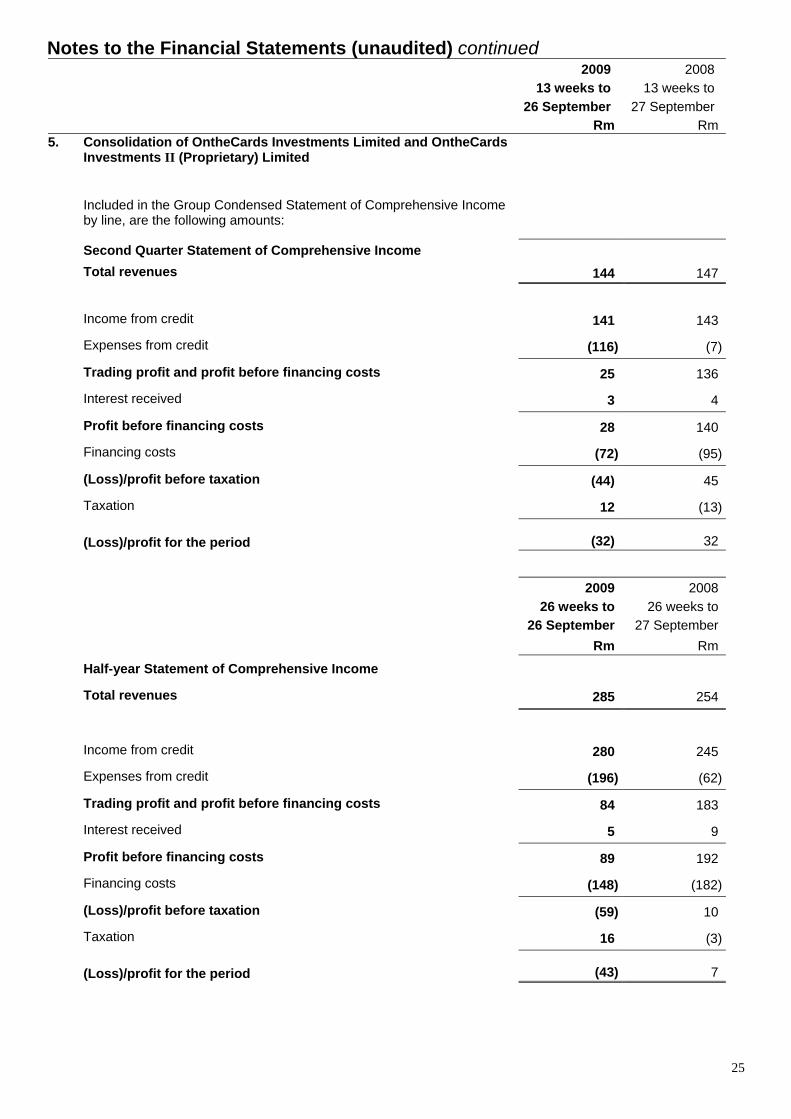
5.
Consolidation of OntheCards Investments Limited and OntheCards Investments II (Proprietary) Limited
Included in the Group Condensed Statement of Comprehensive Income by line, are the following amounts:
Second Quarter Statement of Comprehensive Income Total revenues 144 147
Income from credit 141 143
Expenses from credit (116) (7)
Trading profit and profit before financing costs 25 136
Interest received 3 4
Profit before financing costs 28 140
Financing costs (72) (95)
(Loss)/profit before taxation (44) 45
Taxation 12 (13)
(Loss)/profit for the period (32) 32
2009 26 weeks to
26 September Rm
2008 26 weeks to
27 September Rm
Half-year Statement of Comprehensive Income
Total revenues 285 254
Income from credit 280 245
Expenses from credit (196) (62)
Trading profit and profit before financing costs 84 183
Interest received 5 9
Profit before financing costs 89 192
Financing costs (148) (182)
(Loss)/profit before taxation (59) 10
Taxation 16 (3)
(Loss)/profit for the period (43) 7
26
Notes to the Financial Statements (unaudited) continued 2009
26 September Rm
2009 28 March
Rm
2008 27 September
Rm
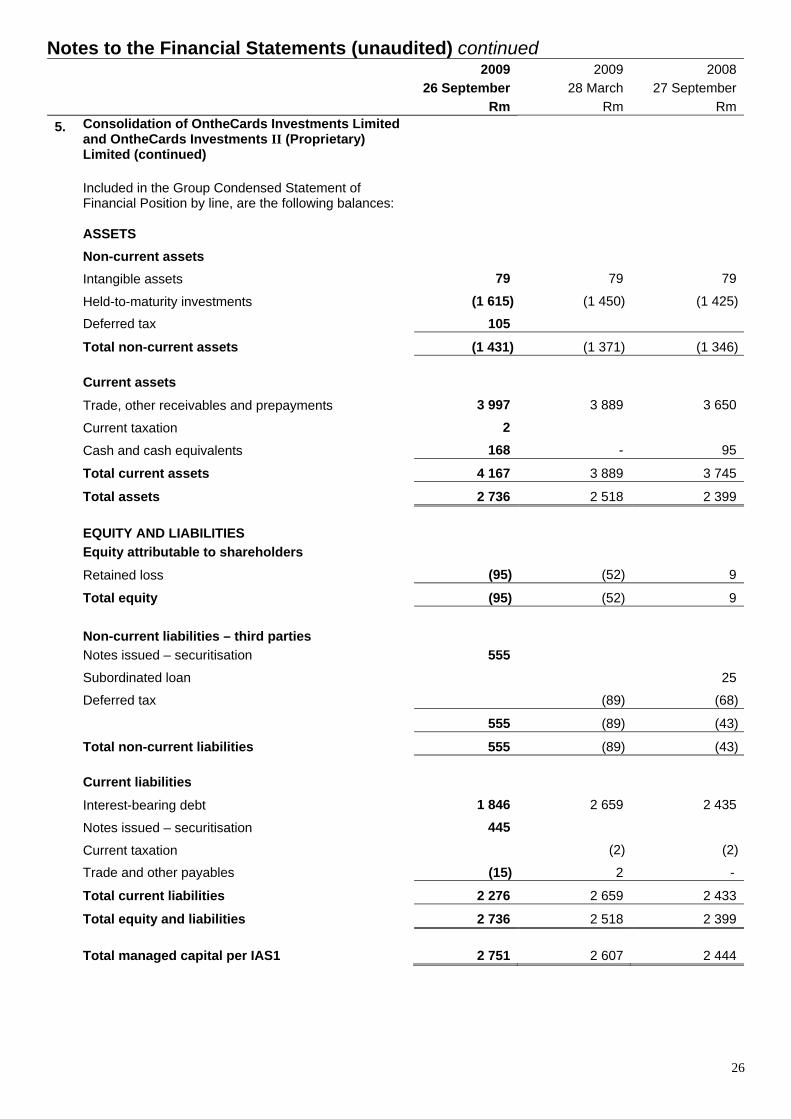
5.
Consolidation of OntheCards Investments Limited and OntheCards Investments II (Proprietary) Limited (continued)
Included in the Group Condensed Statement of Financial Position by line, are the following balances:
ASSETS
Non-current assets Intangible assets 79 79 79 Held-to-maturity investments (1 615) (1 450) (1 425) Deferred tax 105 Total non-current assets (1 431) (1 371) (1 346)
Current assets Trade, other receivables and prepayments 3 997 3 889 3 650 Current taxation 2 Cash and cash equivalents 168 - 95 Total current assets 4 167 3 889 3 745 Total assets 2 736 2 518 2 399
EQUITY AND LIABILITIES Equity attributable to shareholders Retained loss (95) (52) 9 Total equity (95) (52) 9 Non-current liabilities – third parties Notes issued – securitisation 555 Subordinated loan 25 Deferred tax (89) (68) 555 (89) (43) Total non-current liabilities 555 (89) (43)
Current liabilities Interest-bearing debt 1 846 2 659 2 435 Notes issued – securitisation 445 Current taxation (2) (2) Trade and other payables (15) 2 - Total current liabilities 2 276 2 659 2 433 Total equity and liabilities 2 736 2 518 2 399
Total managed capital per IAS1 2 751 2 607 2 444

27
Notes to the Financial Statements (unaudited) continued .
2009 13 weeks to
26 September Rm
2008 13 weeks to
27 September Rm
5.
Consolidation of OntheCards Investments Limited and OntheCards Investments II (Proprietary) Limited (continued)
Included in the Group Condensed Statement of Cash Flows by line, are the following amounts:
Second Quarter Statements of Cash Flows
Profit before net financing costs 25 136
Operating cash (outflow)/inflow before changes in working capital
25 136
Working capital movement (155) 81
Trade accounts receivable (135) 84
Other debtors 5 26
Accounts payable (25) (29)
Cash (utilised)/generated from operating activities
(130) 217
Interest received 3 4
Financing costs paid (64) (95)
Taxation paid - -
Net cash (utilised)/retained (191) 126
Cash effects of financing activities
Increase in held-to-maturity investments 165
Notes issued – securitisation 1 000
Decrease in interest bearing debt (806) (114)
Net cash inflow/(outflow) from financing activities
359 (114)
Increase in cash and cash equivalents
168 12
Cash and cash equivalents at the beginning of the period
- 83
Cash and cash equivalents at the end of the period
168 95

28
Notes to the Financial Statements (unaudited) continued .
2009 26 weeks to
26 September Rm
2008 26 weeks to
29 September Rm
5.
Consolidation of OntheCards Investments Limited and OntheCards II (Proprietary) Limited (continued)
Half-year of Statement of Cash Flows
Profit before net financing costs 84 183
Operating cash (outflow)/inflow before changes in working capital
84 183
Working capital movement (137) 104 Trade accounts receivable (107) 148 Other debtors (1) (42) Accounts payable (29) (2)
Cash (utilised)/generated from operating activities
(53) 287 Interest received 5 9 Financing costs paid (136) (182) Taxation paid - -
Net cash (utilised)/retained (184) 114
Cash effects of financing activities
Increase in held-to-maturity investments 165 Notes issued – securitisation 1 000 Decrease in interest bearing debt (813) (146)
Net cash inflow/(outflow) from financing activities
352 (146)
Increase/(decrease) in cash and cash equivalents
168 (32)
Cash and cash equivalents at the beginning of the period
- 127 Cash and cash equivalents at the end of the period 168 95

29
Corporate Information
Edcon Holdings (Proprietary) Limited Incorporated in the Republic of South Africa Registration number 2006/036903/07 Non-executive directors DM Poler* (Chairman), EB Berk*, SM Zide*, ZB Ebrahim Executive directors SM Ross* (Managing Director and Chief Executive Officer), U Ferndale *USA Group Secretary CM Vikisi Registered office Edgardale, 1 Press Avenue Crown Mines, Johannesburg 2092 Telephone: +27 11 495-6000 Fax: +27 11 837-5019 Postal address PO Box 100, Crown Mines 2025 Auditors Ernst & Young Inc. Wanderers Office Park 52 Corlett Drive, Illovo 2196 PO Box 2322, Johannesburg 2000 Telephone: +27 11 772-3000 Fax: +27 11 772-4000
Listing Agent, Trustee, Registrar, Transfer Agent and Principal Paying Agent The Bank of New York 1 Canada Square London E14 SAL United Kingdom Tracy Sheridan, Listing Executive – The Bank of New York Mellon Corporation Corporate Trust Services Phone +353 1 542 6991 Fax +353 1 542 6 999 [email protected]