Ecosystem Services Mapping as a Framework for Integrated Natural Resource Management
19
Photo: David Brazier/IWMI Photo :Tom van Cakenberghe/IWMI Ecosystem services mapping as a framework for integrated natural resource management Dr. Chris Dickens 15 th June 2015
-
Upload
international-water-management-institute-iwmi -
Category
Environment
-
view
218 -
download
2
Transcript of Ecosystem Services Mapping as a Framework for Integrated Natural Resource Management

Pho
to:
Dav
id B
razi
er/I
WM
IP
hoto
:To
m v
an C
aken
berg
he/I
WM
I
Ecosystem services mapping as a framework
for integrated natural resource management
Dr. Chris Dickens
15th June 2015

Pho
to:
Dav
id B
razi
er/I
WM
IP
hoto
:To
m v
an C
aken
berg
he/I
WM
I
South African
Key legislation governing natural resources
Compendium of Environmental Law (2006):
67 Acts and 500 pages in 2006!

Pho
to:
Dav
id B
razi
er/I
WM
IP
hoto
:To
m v
an C
aken
berg
he/I
WM
I
The Status Quo – An Unsustainable Future?
The 2006 South Africa Environmental Outlook (SAEO) document acknowledged that the “comprehensive and generally sound environmental regulatory regime is in place” and that “there has been a steady increase in the budget allocation for environmental management at both the national and provincial levels”.
Yet…..:
National Spatial Biodiversity Assessment (NSBA): Terrestrial systems, 34% of all 440 ecosystems are threatened
Rivers - 82% of the main river signatures classified as threatened, 44% are critically endangered.

Pho
to:
Dav
id B
razi
er/I
WM
IP
hoto
:To
m v
an C
aken
berg
he/I
WM
I
The Status Quo – An Unsustainable Future?
Failure is due to:• No holistic approach• No acknowledgement of the value of natural resources in development
planning• Poor coordination• Increased delegation of responsibility to the local level, without the necessary
capacity and support

Meso-scale management
Social simulation and complex systems
Ecosystem services approach
Matching interventions with economic incentives
Scenario analysis
1
4
5
2
3
The Afromaison Approach

Pho
to:
Dav
id B
razi
er/I
WM
IP
hoto
:To
m v
an C
aken
berg
he/I
WM
I
Understanding the value of natural systems
Ecosystem services emerge as useful mechanism for integration of natural
systems, people and economy
Environmental
Quality
Social WellBeing
Economic
Prosperity
Governance
Figure 11: Sustainability model in South Africa

Water regulating services: Supply
/7

Water regulating services: Demand
/8

Water regulating services: Prioritisation
/9

Optimise resources: Remedial intervention
/10
Low supplyHigh demand

Optimise resources: Preservation
/11
High supply High demand

Pho
to:
Dav
id B
razi
er/I
WM
IP
hoto
:To
m v
an C
aken
berg
he/I
WM
I

Pho
to:
Dav
id B
razi
er/I
WM
IP
hoto
:To
m v
an C
aken
berg
he/I
WM
I
Economic instruments
• multiple groups of instruments. • Price based instruments (7)• Rights based instruments (2)• Legal, voluntary and information based
instruments (5)
DRIVERS IMPACT MANAGEMENT ACTION ECONOMIC /Other INSTRUMENT

Pho
to:
Dav
id B
razi
er/I
WM
IP
hoto
:To
m v
an C
aken
berg
he/I
WM
I
Indicators of INRM• Linked to key issues related to the drivers and symptoms of change in NR• e.g. grass cover, soil runoff etc• also Governance indicators – e.g. participation in governance
INRM SUCCESS INDICATORS
System Criteria Indicator Target Measure Data Source & Method
Natural Systems
Water Resource
Quality
Capacity of large storage impoundments.
Decrease in the rate of reduction in dam capacity
Rate of decline in dam capacity measured as % of total capacity/per year. Change measured at frequency of 5 years (annual too small a period to note changes).
Hydrographic survey undertaken by DWA Directorate: Spatial and Land Information Management (Reference: http://www.dwaf.gov.za/bi/services.htm)
Turbidity levels
Decrease in annual average turbidity levels.
Change in average annual turbidity levels (NTU). Change measured at 5 yearly interval (annual too short a period to account for natural variation)
Measurement at inflow points to large dams using a clarity tube and measured in cm. Undertaken by DWA officials as part of daily management (this may be too onerous). Alternatively, a local resident living at the inflow is employed to take record.

Effective stakeholder consultation

Pho
to:
Dav
id B
razi
er/I
WM
IP
hoto
:To
m v
an C
aken
berg
he/I
WM
I
Effective stakeholder consultation
Pho
to:
Dav
id B
razi
er/I
WM
IP
hoto
:To
m v
an C
aken
berg
he/I
WM
I
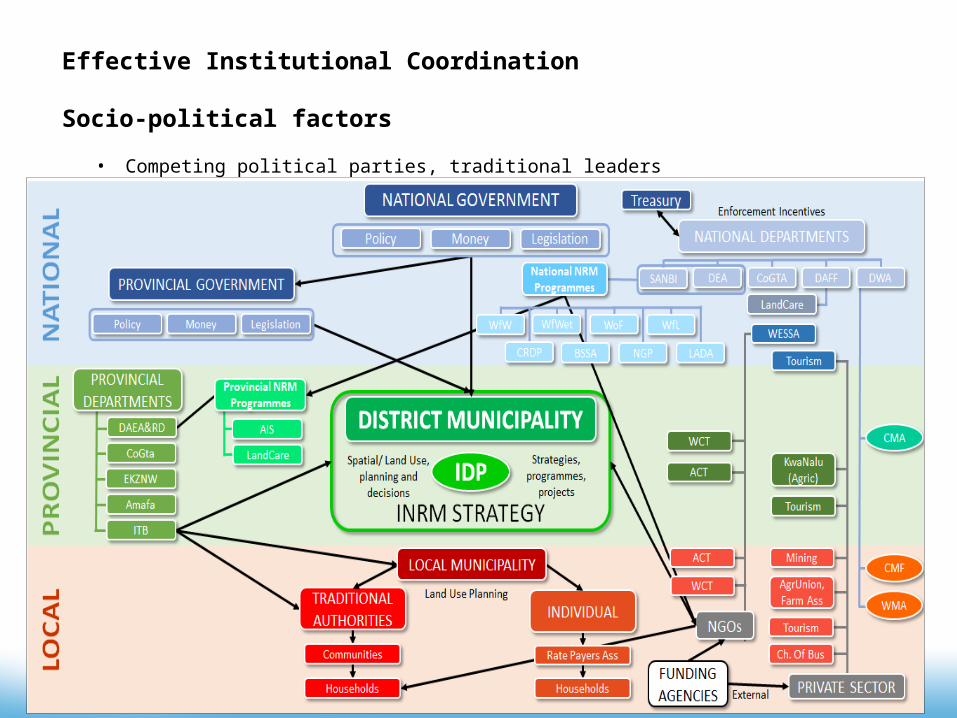
Effective Institutional Coordination
Socio-political factors
• Competing political parties, traditional leaders

Pho
to:
Dav
id B
razi
er/I
WM
IP
hoto
:To
m v
an C
aken
berg
he/I
WM
I
Appropriate Institutional Structure - proposed
Figure 1 Proposed institutional structure for INRM at the District scale

Pho
to:
Dav
id B
razi
er/I
WM
IP
hoto
:To
m v
an C
aken
berg
he/I
WM
I
The End!