
Economy. PolItIcs. scIEncE. Riester Pension, Vacation, Health
32
DIW Economic Bulletin ECONOMY. POLITICS. SCIENCE. 2012 2 Riester Pension, Vacation, Health Insurance: Work-related Social Benefits in Germany REPORT by Kornelia Hagen and Axel Kleinlein Ten Years of the Riester Pension Scheme: No Reason to Celebrate 3 NTERVIEW with Kornelia Hagen »Poor Products at the Expense of Pension Policy Holders« 14 REPORT by Peter Eibich, Hendrik Schmitz and Nicolas Ziebarth Add-On Premiums Increase Price Transparency— More Policy Holders Switch Health Plans 15 REPORT by Daniel D. Schnitzlein Extent and Effects of Employees in Germany Forgoing Vacation Time 25
Transcript of Economy. PolItIcs. scIEncE. Riester Pension, Vacation, Health

DIW Economic BulletinEconomy. PolItIcs. scIEncE.
20122
Riester Pension, Vacation, Health Insurance: Work-related Social Benefits in Germany
REPoRt by Kornelia Hagen and Axel Kleinlein
Ten Years of the Riester Pension Scheme: No Reason to Celebrate 3ntERvIEW with Kornelia Hagen
»Poor Products at the Expense of Pension Policy Holders« 14
REPoRt by Peter Eibich, Hendrik Schmitz and Nicolas Ziebarth
Add-On Premiums Increase Price Transparency— More Policy Holders Switch Health Plans 15REPoRt by Daniel D. Schnitzlein
Extent and Effects of Employees in Germany Forgoing Vacation Time 25

DIW Economic Bulletin 2.2012
Publishers Prof. Dr. Pio Baake Prof. Dr. Tilman Brück Prof. Dr. Christian Dreger Dr. Ferdinand Fichtner Prof. Dr. Martin Gornig Prof. Dr. Peter Haan Prof. Dr. Claudia Kemfert Karsten Neuhoff, Ph. D. Prof. Dr. Jürgen Schupp Prof. Dr. C. Katharina Spieß Prof. Dr. Gert G. Wagner Prof. Georg Weizsäcker, Ph. D.
Editors in chief Dr. Kurt Geppert Nicole Walter
Editorial staff Renate Bogdanovic Miriam Hauft Dr. Richard Ochmann Wolf-Peter Schill Lana Stille
Editorial manager Alfred Gutzler
Press office Renate Bogdanovic Tel. +49 - 30 - 89789 - 249 Nicole Walter Tel. +49 - 30 - 89789 - 252 presse @ diw.de
Sales and distribution DIW Berlin
Reprint and further distribution—inclu-ding extracts—with complete reference and consignment of a specimen copy to DIW Berlin’s Communications Depart-ment ([email protected]) only.
Printed on 100% recycled paper.
DIW Berlin—Deutsches Institut für Wirtschaftsforschung e. V. Mohrenstraße 58, 10117 Berlin T + 49 30 897 89 – 0 F + 49 30 897 89 – 200
Volume 2, No 2 3 February, 2012 ISSN 2192-7219

tEn yEaRs of thE RIEstER PEnsIon schEmE: no REason to cElEbRatE
3DIW Economic Bulletin 2.2012
Since their introduction, the Riester pension scheme and the indi-vidual Riester products have become less beneficial to savers. Con-tracts concluded today will often lead to lower returns compared to contracts concluded in 2001. From a social perspective, meaning pension benefits in relation to individual saving contributions plus state subsidy, overall returns on all insurance-based products are very low. This is due to the general decline in returns on the capital market and, in particular, to a series of government-mandated cer-tification and calculation rules. Urgently needed structural reforms include the abolition of exchange costs, standardized cost informa-tion, certification with regards to content instead of formal certifica-tion and the regulation of calculation methods. In addition, limiting the number of products is also recommended.
Given the shortcomings of the Riester system, there is good reason to fundamentally rethink old-age pension provision policy. In doing so, a targeted reduction or even elimination of extra public funding ought not to be taboo. The tax saved could be used to strengthen the pay-as-you-go state pension scheme.
In 2001, the pension system was fundamentally refor-med.1 This was associated with a paradigm shift that led to a major social experiment: the »partial privatiza-tion« of the pension system. Legislation encourages in-dividual pension plans if capital stocks are established as a certified Riester pension product during the employ-ment phase. In order to receive the subsidy, both savers and providers of Riester products must meet a series of conditions. Savers must currently deposit four percent of their annual gross income liable for contributions into a capital stock to obtain the full subsidy.2 Savings contributions and state supplements are not funneled into a state-managed »public pension fund« but rather into individual and formally certified pension products. These products are offered by private financial institu-tions, such as banks, investment companies, and insu-rance companies which are regulated by the Federal Fi-nancial Supervisory Authority.3
Nearly 15 million people signed a Riester contract (Tab-le 1) between the introduction of the Riester pension to mid-2011.4 Ten years after the introduction of govern-ment subsidized Riester products, this still represents only about 40 percent of estimated potential Riester sa-
1 See German Federal Parliament (Deutscher Bundestag): Retirement Savings Act (Altersvermögensgesetz – AVmG)). Berlin, Federal Law Gazette (BGBl) Part I, no. 31, (2001): 1310-1343.
2 At the same time, an individual‘s claim from the general state pension is then reduced by this percentage. Findings on the state and development of subsidies for Riester pensions are regularly published by the Centre for Retirement Savings (Zulagenstelle für Altersvermögen), see Stolz, U., and C. Rieckhoff, „Beitragsjahr 2007: Zulagenförderung nochmals um mehr als ein Viertel gestiegen,“ RVaktuell, no. 11, (2010): 355-362.
3 Concerning the certification of pension plans and annuity contracts, certification criteria and providers are contained in the Pensions Certification Act (Alterszertifizierungsgesetz, AltZertG).
4 See various press releases from the BMAS, for example, „Boom bei Riester-Rente ist gutes Signal,“ February 5, 2010, and, more recently, „Fast 15 Millionen Riester Vertragsabschlüsse,“ August 25, 2011. www.bmas.de/DE/Service/Presse/Pressemitteilungen/riester-rente-zweites-quartal-2011.html.
Ten Years of the Riester Pension Scheme: No Reason to Celebrateby Kornelia hagen and axel Kleinlein

DIW Economic Bulletin 2.20124
tEn yEaRs of thE RIEstER PEnsIon schEmE: no REason to cElEbRatE
vers.5 Corresponding forecasts that more people would take advantage of the supplements did not come to fru-ition.6
Riester products have been heavily criticized since their introduction ten years ago. Among other things, there has been criticism regarding the lack of transparency and comprehensibility of the offers, high and uncertain
5 The number of possible Riester savers is estimated at 37.5 to 42 million people, see Fassbauer, S., and N. Toutaouvi, „Die Anzahl ders förderberech-tigten Personenkreises der Riester-Rente – eine Annäherung,“ Deutsche Rentenversicherung 64, no. 6 (2009): 478–486.
6 For further details showing that due to the number of contracts concluded, it cannot be considered a success, see Hagen, K., and L.A. Reisch, „Riesterrente: Politik ohne Marktbeobachtung,“ Wochenbericht des DIW Berlin, no. 8 (2010). Some time ago, DIW Berlin found that, based on data from the Socio-Economic Panel (SOEP), less than ten percent of the younger generation are in favor of a pension plan dominated by self-governing, privately organized pension plans, and over a third of this group of respondents indicated that they believe the responsibility for pensions plans lies with the state, see Schwarze, J., and G.G. Wagner, „Alterssicherung: Gesunkene Zufriedenheit und Skepsis gegenüber privater Vorsorge,“ Wochenbericht des DIW Berlin, no. 22 (2004).
costs, a lack of product choice, and inadequate subsidy targeting and windfall gains of high-income earners.7
7 There have been a series of studies looking at and raising critical objections to the different aspects of Riester pensions and related products. From the abundance of literature, there are several recent studies, for example, see Braun, R., and U. Pfeiffer, Riesterrente: Wer nutzt sie und warum? Typisierung der Sparer und Auswirkungen auf die Vermögensbildung, Deutsches Institut für Altersvorsorge, 2011; Geyer, J., and V. Steiner, „Zahl der Riester-Renten steigt sprunghaft: aber Geringverdiener halten sich noch zurück,“ Wochenbericht des DIW, no. 32 (2009); Lamping, W., and M. Tepe, „Vom Können und Wollen der privaten Altersvorsorge. Eine empirische Analyse zur Inanspruchnahme der Riester-Rente auf Basis des Sozio-oekonomischen Panels,“ Zeitschrift für Sozialreform 4 (2009): 409–430; Logeay, C., V. Meinhardt, K. Rietzler, and R. Zwiener, „Gesamtwirtschaftliche Folgen des kapitalgedeckten Rentensystems. Zwischen Illusion und Wirklichkeit,“ IMK Report 43; Oehler, A. with the collaboration of D. Kohlert, Alles Riester? Die Umsetzung der Förderidee in der Praxis. Stärken und Schwächen, Risiken und Chancen der staatlich geförderten kapitalgedeckten privaten Altersvorsorge von abhängig Beschäftigten (ohne Beamte) im Kontext der umlagefinanzierten gesetzlichen Rentenversicherung (2009). Study commissioned by the Consumer Association (Verbraucherzentrale Dachverband); Schröder, C., Riester-Rente: Verbreitung, Mobilisierungseffekte und Renditen, WISO Diskurs, Friedrich-Ebert-Stiftung, 2011. In addition to scientific studies, the Federal Consumer Association (Vzbv) published a statement about Riester pensions, see. Vzbv, „Vorschläge zur Stärkung der Altersvorsorge im Allgemeinen und der Riester-Förderung im Speziellen,“ (2011). Position paper by the Federal Consumer Association. In addition, independent product tests are regularly carried out on Riester pensions. Of the numerous test publications, some good examples are provided by Stiftung Warentest: Stiftung Warentest, „Beratung zur Altersvorsorge: Desaströs,“ no. 5 (2011); Stiftung Warentest, „Etwas Rente ist sicher,“ „Riester-Rentenversicherungen“ (2010): 10, 29–33; Stiftung Warentest, „Spezial Altersvorsorge“ (2008): 55–59; Stiftung Warentest, „Rätselstunde für Riester-Sparer,“ Riester-Jahresmitteilungen. no. 8 (2008): 29–35, and the latest tests by Ökotest. „Jahrbuch. Rente, Geld, Versicherungen. Mehr als 2000 Tarife im Test,“ Der große ÖKO-TEST Finanzratgeber, (2011): 26–41.
Table 1
number of Riester contractsNet Year-End Portfolios
Insurance-like contracts Riester contracts1 total Annual change in percent
For information:
Outgoings from insurance contracts2
Outgoings from insurance contracts in percent
2001 1 400 000 1 400 000 – – –2002 3 047 000 3 370 500 140.8 85 000 2.72003 3 486 000 3 924 440 16.4 99 000 2.72004 3 660 500 4 189 500 6.8 180 000 4.72005 4 796 900 5 630 900 34.4 145 000 2.92006 6 468 000 8 050 000 43.0 179 000 2.72007 8 355 000 10 757 000 33.6 259 000 3.12008 9 185 000 12 147 000 12.9 480 000 5.02009 9 794 000 13 253 000 9.1 – –2010 10 380 000 14 397 000 8.6 – –
For information:30.06.2011 10 555 000 14 798 000 – – –
1 Insurance contracts, bank savings contracts, fund contracts, Homeowner Riester, two/three-pot hybrid funds, "variable annuities," "unit-linked with profits."2 Annual reports from top national associations of the insurance industry to the Federal Ministry of Labor and Social Affairs (Bundesministerium für Arbeit und Sozia-les, BMAS).Source: BMAS, calculations by DIW Berlin.
© DIW Berlin 2012
Almost 15 million people have concluded a Riester contract—that is just 40 percent of the estimated potential.

5DIW Economic Bulletin 2.2012
tEn yEaRs of thE RIEstER PEnsIon schEmE: no REason to cElEbRatE
The following identifies problems resulting from the structure of Riester products and changes to certifica-tion, as well as regulatory and insurance law provisions implemented between 2001 and 2011.8
8 The results presented here are based largely on a study by Kleinlein, A., Zehn Jahre „Riester-Rente“ – Bestandsaufnahme und Effizienzanalyse“ (2011) conducted on behalf of the Friedrich-Ebert-Stiftung (FES). The study was designed in cooperation with DIW Berlin‘s Department of Competition and Consumers. The processing of and calculations used in the study are the sole responsibility of the author. The report presented here, in particular its conclusions, are the responsibility of DIW Berlin. Coinciding with the German version of this report, published in the Wochenbericht of the DIW in November 2011, a study by Axel Kleinlein entitled „10 Jahre Riester – Bestandsaufnahme und Effizienzanalyse“ was published as part of the WISO Diskurs der FES series.
state certification criteria lead to shortcomings
The state’s legal and structural standards for Riester contracts are governed by the Pensions Certification Act (AltZertG) 2001 (Table 2). Some of the most sig-nificant changes to the certification criteria are high-lighted below.9
9 In addition to the certification provisions discussed here, there are other significant changes that have caused specific problems. One change relates to the fact that savers can withdraw up to 30 percent of the saved capital at the beginning of the pay-out phase. This is accompanied by uncertainty about the amount of the current pension benefits. Another problem relates to securing the longevity of non-insurance-based products. The contractual options for the „pension from 85“ are still far from certain. The Federal Ministry of Finance (BMF) recently referred to this problematic situation and suggested that additional information requirements should be introduced at the end of savings period or at the beginning of the pay-out phase.
Table 2
certification criteria for Riester Products
Initial situation in 2001according to the Pensions Certification Act1 Changes to certification criteria up to 2011
Contributions in the savings phase Saving must occur through regular payments Deleted
Commencement of benefits Payment earliest from 60th birthday; except for earlier retirement
Civil servants included in funding Introduction of unisex tariff Payout from 62nd birthday
Capital preservation/Nominal value promise
At least the paid-in capital contributions plus allowances must be available at the beginning of the payout phase.
Pension payments/benefit payments
Payments in the payout phase must remain the same or increase.
Up to 30 percent of the accumulated capital can be paid out at the beginning of the payout phase without affecting allo-wances. With savings plans, the "pension from 85" can begin before the 85th birthday.
"Annuity"/"pension from 85" With non-insurance-like contracts, the payout phase must occur until the death of the insured.
Certification criteria moved to "pension payment"
Provision for surviving dependents must be possible Certification criteria moved to "start of benefits."
Eligible products Private pension funds, bank savings plans, fund savings plans
Introduction of "Homeowner Riester" Deletion of product catalogue
Distribution of acquisition and distribution costs
With insurance-like products: allocation of acquisition and distribution costs over at least ten years Non-insurance-like products: advance charging of costs distributed over ten years
Allocation of acquisition and distribution costs over a mini-mum of five years
Annual disclosure requirements during the term of the contract
Information on use of contributions, the amount of saved capital, retained acquisition and distribution costs, adminis-trative costs, earned income, ethical, social, and ecological orientation of the capital investment Withdrawal of certifica-tion and levying of fine possible.
Review of information requirements is no longer a criterion for certification. Breach of notification requirements may only be penalized by fines of up to €2,500. In case of a complaint by the saver, the certification authority does not have to get involved.
Suspension, change of provider/product, termination in the savings phase
Payout of capital must be possible for a self-occupied property.
Assignment/pledge to third party Not possible Deleted
1 Riester products are certified according to the Pensions Certification Act (AltZertG), the certification criteria contained in paragraph 1 of the AltzertG. Paragraphs 2-6 pertain to the act of certification by the certification authority, paragraph 7 of the AltZertG deals with the information providers are required to give to customers, are paragraphs 8 to 14 concern other regulations, such as fees for certification.
Sources: Hagen, Reisch 2010, FES 2011, and DIW Berlin.© DIW Berlin 2012
The Pensions Certification Act sets the legal stipulations for certifying Riester products.

DIW Economic Bulletin 2.20126
tEn yEaRs of thE RIEstER PEnsIon schEmE: no REason to cElEbRatE
ons may drop temporarily, this regulation all but nulli-fies the principle of exchange law for individual savers because any exchange would make no economic sense since it results in a reduction of capital value below the value of the saved capital. But even for savers with gu-aranteed products, which have a guaranteed value du-ring the savings period, there is only a limited oppor-tunity for switching to a different contractor, due to ca-pital preservation fixed to a certain date. Because as a rule, the new provider will again charge acquisition costs. This basic problem for savers with already high savings premiums is further exacerbated by the fact that the acquisition costs when switching are often charged at a fixed percentage rate of four percent of the capital to be transferred. Thus, the cost of switching a contract increases, the higher the payments on the Riester con-tract already are.12
By specifying capital preservation, the legislation has actually restricted an important market mechanism because a functioning exchange law normally prevents poor quality providers from remaining in the market-place, for example, those supplying inadequate informa-tion or selling expensive products.
Contractual Disclosure Requirements: Total Expense Ratio May Give False Picture of Cost Burden
Some scientific studies, consumer organizations, and independent product tests have confirmed that Riester products are not sufficiently transparent.13 The focus of criticism here is on legal disclosure obligations contai-
12 In contrast to the acquisition costs charged by new providers, many providers of pension insurance or bank savings products only charge between 100 and 150 euros to cancel existing contracts. The legislature has also limited the distribution of costs for insurance-like products to at least five years. When the Riester pension was introduced, it was still ten years. Since these costs reduce the net investment sum, it now takes longer for the contract value to correspond to the amount of capital paid in. This also restricts changing providers. On this issue, see „Die Lücke schließen,“ Finanztest, no. 10 (2002): 72–87. In the case of fund offers, the initially permissible advance charging of costs, in which all acquisition costs could be charged right at the beginning of the contract for all contractually agreed savings contributions, was prohibited. However, as a result of case law, the advanced charging of costs may still be spread over five years. It is remarkable to note that non-supplemented fund contracts have a higher level of consumer protection in this regard than the supplemented Riester fund savings plans. But investors are not obliged to inform their clients about it.
13 Finanztest and Ökotest have conducted various Riester product tests, see „Etwas Rente ist sicher,“ Finanztest no. 10 (2010): 29-33; and Ökotest „Reise ins Labyrinth,“ no. 6 (2011): 76-81. Various scientific studies have also dealt with this topic, see, for example, Center for European Economic Research (ZEW) in cooperation with IFF Hamburg and Infas, "Transparenz von privaten Riester- und Basisrentenprodukten. Abschlussbericht (2011)". This report was commissioned by the Federal Ministry of Finance. The results from another report commissioned by the same ministry on the development of transparency measures for Riester products are still awaited.
Introduction of Unisex Tariff Leads to Insurance Company Surpluses
The Riester pension was initially conceived with gen-der-based tariffs. From a socio-political standpoint, this was highly undesirable. Riester contracts concluded af-ter 2005 may no longer differentiate by gender when cal-culating pension benefits.10 The aim of this regulation was to produce a gender-neutral calculation. The statu-tory provisions for calculating gender-independent ta-riffs were implemented by the insurance companies in such a way that, in addition to the »normal« longevity risk, they also incorporated a »the insured is a woman« criterion as a longevity risk. This resulted in a greater longevity risk compared to earlier calculations. Conse-quently, overall premium levels are considerably higher than “average” premiums for men and women.
As a result, the implementation of the unisex tariff led to a significant increase in the premiums required for men to achieve a “target pension”, while the premiums for women were only reduced slightly, or the old tariff was retained. For insurance companies, the higher premi-ums lead to additional mortality gains arising from the increased probability of men dying sooner than shown by the calculations in the new unisex table. In addition, a new regulation on »profit participation« results in a greater share of these additional mortality gains going to the insurers.11
Capital Preservation Only at Beginning of Payout Phase Restricts Provider and Product Changes
Another certification criterion for Riester products is capital preservation at the beginning of the payout pha-se according to the Pensions Certification Act. Since the value of fund savings plans or unit-linked pensi-
10 The unisex tariff for all types of insurance is mandatory; this applies to all eligible pension schemes and, therefore, also to the Riester pension. This regulation is based on Directive 2004/113/EC of the Council of the European Union dated December 13, 2004 on implementing the principle of equal treatment of men and women in accessing and supplying goods and services. This Directive was incorporated into German law through the General Act on Equal Treatment (Allgemeine Gleichbehandlungsgesetz, AGG), as Article 1 of the Act to implement European Directives relating to the principle of equal treatment (Implementation Act) dated August 14, 2006, Federal Law Gazette (Bundesgesetzblatt) I, 1897.
11 From an actuarial perspective, the gender criterion for calculating insurance and supply contracts is an objective and risk-specific differentiating factor. From the perspective of actuaries, the application of gender-independent factors means a lack of accuracy in calculating insurance and supply contracts, and these changes will lead to there being winners and losers, and it will be more expensive overall. See German Actuarial Association (Deutsche Aktuarvereinigung), „Unisex-Tarife: Konsequenzen des EUGH-Urteils aus aktuarieller Sicht,“ press release dated April 28, 2011. https://aktuar.de/php/evewa2.php?d=1321091955&menu=01060130.
7DIW Economic Bulletin 2.2012
tEn yEaRs of thE RIEstER PEnsIon schEmE: no REason to cElEbRatE
sion product based solely on economic efficiency. Howe-ver, it is known from behavioral and information econo-mics that savers are not fully informed. They often make decisions not based on rational considerations. Learning from disclosure obligations would require at least simp-le information architecture.19 However, to date, policy-makers have not managed to move beyond the discus-sion stage on possible transparency measures.
certification-Independent calculation bases and Profit Participation
In addition to certification criteria, yields from Riester products are characterized by product calculations and profit participation. The bases of calculation are the gu-aranteed interest rate, assumed mortality, and the costs. Calculation factors and profit participation are based in particular on regulatory and insurance law provisions (Table 3). Providers do have a certain amount of scope in calculating Riester products with regard to what as-sumptions they want to make about mortality rates and what version of the mortality table they want to use to calculate their insurance premiums. Each company cal-culates the costs individually.
Guaranteed Interest Has Dropped by Almost a Third
The guaranteed interest rate depends on developments in the financial markets.20 When the Riester pension was introduced, the guaranteed interest rate was 3.25 percent. It has dropped to 2.25 percent since and will fall again at the beginning of 2012. New contracts will only assu-re a guaranteed interest rate of 1.75 percent.21
19 Since financial and Riester products are credence and contract goods, the quality of such goods cannot be determined at all or only to a very limited extent. In addition, savers display systematic anomalies as economic behavioral experiments show. See Hagen, K., and L.A. Reisch, „Riesterrente: Politik ohne Marktbeobachtung.“
20 The basis for this is the actuarial reserve stipulation (Deckungsrückstel-lungsverordnung, DeckRV) which in turn is based on the Insurance Supervision Act (Versicherungsaufsichtsgesetz, VAG). In addition to setting a maximum interest rate, it also stipulates that the zillmerization rate related to total premiums may not exceed four percent and that the calculation must be cautious.
21 This is why insurers were encouraging savers to conclude a life insurance policy before the end of 2011. However, the German Association of the Insured (Bund der Versicherten, BdV) is warning consumers to make their decision to conclude a contract dependent on the guaranteed interest rate. A number of providers are already promising less than the guaranteed interest on the savings portion, see BdV press release, „BdV warnt vor übereilten Abschlüssen“ dated October 31, 2011. www.bundderversicherten.de/news/705/BdV-warnt-vor-uebereiltem-Abschluss
ned in the Pensions Certification Act, and in particular, the reporting of costs.14 The compliance with disclosu-re and cost transparency regulations was a mandatory and fail-safe criterion criteria when the Riester pension was introduced. A violation may have led to the certifi-cate being withdrawn or a fine being levied. But both were removed from the list of certification criteria. To-day, a violation of information and transparency obliga-tions would only have minor consequences for the con-tract provider. A fine may be levied as a result of consu-mer complaints, of which there are plenty. There have, however, been no penalties issued by the certification authority to date.15
There have been discussions for some time now on the introduction of standardized, mandatory information to improve the cost transparency of Riester products.16 The German Insurance Association (Gesamtverband der Versicherungswirtschaft, GDV) and Allianz Lebensver-sicherung, among others, have been suggesting a cost indicator, the “total expense ratio.”17 It should be no-ted, however, that the information content of this indi-cator can be misleading.18 This is because the amount of losses of returns (total cost ratio) is calculated pri-or to the agreed term of the savings agreement. But if a contract offers variations in terms of the start of the pension and savers take up this option, there will be a difference in the calculated and the actual start of the pension. This leads to an underestimation of the cost burden. As a result, savers may take an economic de-cision to their own detriment despite being fully infor-med by the provider.
It is obvious that rationally choosing a Riester pension requires a consumer to be very well-informed with abo-ve-average knowledge and able to rationally choose a pen-
14 Transparency should also come from product tests. Moreover, in recent years, in addition to certification regulations, a pre-contractual, non-standar-dized product sheet and consultation records have been introduced for financial products in general.
15 For complaints about Riester products, see Hagen, K., and L. Reisch, „Riesterrente: Politik ohne Marktbeobachtung.“
16 See BMF, „Transparenz von privaten Riester- und Basisrentenprodukten,“ Monatsbericht digital, September 2010. www.bundesfinanzministerium.de/nn_17844/DE/BMF__Startseite/Publikationen/Monatsbericht__des__BMF/2010/09/analysen-und-berichte/b03/node.html?__nnn=true
17 See GDV total expense ratio, for example, GDV, „GDV empfiehlt umfassende „Preis-Leistungs-Darstellung“ in der Lebensversicherung,“ GDV press release dated January 19, 2011. www.gdv.de/Presse/ Pressemeldungen_2011_Uebersichtsseite/inhaltsseite28180.html. The total expense ratio specifies the average reduction in yield per annum that savers can expect during the savings period, assuming a fixed interest rate before costs, (reduction in yield). Therefore, in principle, it is a „reduction in yield.“ Another cost indicator is the cost ratio, which indicates the reduction in performance due to scheduled costs.
18 See Kleinlein, A., „Die Kostenquote der Versicherer kann Verbraucher in die Irre führen,“ Versicherungswirtschaft 7 (2011): 457.

DIW Economic Bulletin 2.20128
tEn yEaRs of thE RIEstER PEnsIon schEmE: no REason to cElEbRatE
Life Insurers Calculate with Very High Life Expectancy
Insurers use mortality tables to calculate what is known as the longevity risk. These tables are used to estimate the number of deaths in a fictitious collective in a con-tract year.22 The number of survivors per contract year and the resulting pension benefits are calculated on the basis of the mortality table.
There are various mortality tables, such as multiple va-riants from the German Actuarial Society (Deutsche Aktuarvereinigung, DAV), the Federal Statistical Office (Statistisches Bundesamt), and mortality tables specific to companies. The tables differ in figures on life expec-tancies and they consider different specific risks. The in-dividual insurers are not obligated to use any particular mortality table for their calculations. The relevant super-visory authority, BaFin, only recommends that insurers use a mortality table which, in the view of the superviso-ry authority, represents an appropriate calculation basis. It is not transparent for the insured as to which morta-lity table is used for the product calculation.
Until 2004, the supervisory authority recommended the mortality table compiled by DAV, DAV94R, which dif-ferentiated according to gender. Currently, a new stan-
22 There are various types of mortality tables. Insurance industry products are often calculated on the basis of period mortality tables. These tables monitor the mortality of living generations living simultaneously in a manageable period of time. In addition, there are generation mortality tables. Here, mortality rates depend on age, gender, and also the year of birth. This allows the increased life expectancy of people born later to be taken into account. Pensions are calculated according to generation mortality tables. Sometimes insured mortality tables are also used which take into account that the mortality rates of the insured group differ from the mortality rates of the general population as a whole, due to self-selection or health checks.
dard work, DAV04R, that takes a unisex mortality tab-le into account is being recommended.
All DAV works share that they overstate the longevity risk to safeguard their calculations. They all calculate their products with a particularly low mortality rate and very high life expectancy.23 In addition, individuals who have had pensions in the past (with particularly high contract volumes) and had a longer life expectancy than people without pensions (selection effects) and who are above average in terms of socio-economic criteria, are weigh-ted more favorably.24 Also, the life expectancy of people with very high contract volumes is weighted more hea-vily than the life expectancy of other people.
In the Federal Statistical Office‘s mortality table, no special risks are taken into account, but instead it me-rely considers the »pure« mortality rate by year of birth and gender (generation mortality tables).25 The morta-lity rate is therefore much lower and life expectancy is much higher than in the DAV works.
An example of life expectancy using the different mor-tality tables shows that, according to the current mor-tality table, insurers make pension calculations with a life expectancy of between 3.5 and eleven years higher
23 The life expectancy depends on the age of the insured: the older a person, the higher the life expectancy.
24 See „Herleitung der DAV-Sterbetafel 2004 R für Rentenversicherungen,“ Blätter der DGVFM, vol. XXVII, no. 2, October 2005 by the DAV‘s sub-working group on pension mortality (DAV Unterarbeitsgruppe Rentensterblichkeit), 263 f. Appendix 3 „Abhängigkeit der Sterblichkeit von der Höhe der versicherten Rente“; Himmelreicher, „Die fernere Lebenserwartung von Rentnern und Pensionären im Vergleich,“ WSI Mitteilungen 5 (2008): 274 ff.
25 See Federal Statistical Office (2006): „Generationensterbetafeln für Deutschland. Modellrechnungen für die Geburtsjahrgänge 1871–2004.“ This table is a generation mortality table, as opposed to period mortality tables.
Table 3
basis of calculations and Riester Profit Distribution
Broad parameters Starting position in 2001 Changes up to 2011
Guaranteed (maximum) interest on pension-type products
3.25 percent according to the Actuarial Reserve Stipulation
2.25 percent (from January 1, 2007) 1.75 percent (from January 1, 2012)
Mortality table German Association of Actuaries, DAV94R From January 1, 2005: DAV04R with higher life expectancies and unisex mortality table
Costs No standard guidelines, company-specific costs
Profit shares for savers At least 90 percent Interest earnings: at least 90 percent Mortality/risk profits: at least 75 percent Costs gains: at least 50 percent
Sources: FES 2011, DIW Berlin 2011.© DIW Berlin 2012
Since its introduction, the calculation regulations for Riester products have changed to the disadvantage of savers.

9DIW Economic Bulletin 2.2012
tEn yEaRs of thE RIEstER PEnsIon schEmE: no REason to cElEbRatE
decreased in importance due to recent economic deve-lopments in the financial market.28 In regard to cost sur-pluses, which have always played a rather minor role, providers may no longer withhold just ten percent, but a maximum of 50 percent. As a result, revenue oppor-tunities for insurers from these profits have increased five-fold due to this single legal regulation.
For mortality risk and profits, whose percentage of total profits has been increasing for years now, savers are only legally guaranteed a minimum participation of just 75 percent. The share of these profits that the insurer may keep thereby increases from ten to 25 percent. The dis-tribution changes also retrospectively affect contracts concluded before the redistribution (2002-2004). The-re is a tendency to calculating as follows: the higher the calculated life expectancy, the higher the mortality pro-fits. Younger policy holders benefit most in terms of the percentages of profits paid out to the savers.29
28 This new distribution of profits is regulated in the Minimum Funding Regulation (Mindestzuführungsverordnung, MindZV), in force since 2008, concerning minimum premium refunds for life insurance policies.
29 It should also be noted that the altered mortality table has already been accompanied by higher premiums compared to the years prior to 2005, but that mortality rate profits are not distributed until decades later. It is also relevant to note that for contracts concluded up until 2004, the rate hikes from the introduction of the unisex tariff valid until 2025 are part of the profits not available to policy holders for pension benefits because these profits are used to finance the unisex tariff for the old contracts.
than the Federal Statistical Office, depending on gen-der, age, and the year in which the contract was conclu-ded. As a result, it is significantly more expensive to purchase annuity than it would be if the Federal Statis-tical Office‘s mortality table were applied.
A comparison of life expectancies in the different mor-tality tables for a female aged 35 who concluded a Ries-ter contract in 2001 (2011) clearly shows the consequen-ces of using this mortality table as a basis of calculati-on (Table 4). According to the Federal Statistical Office‘s mortality table, the model female saver would have a life expectancy of 87.04 (88.21) years. If the contract conclu-ded with conditions of 2001 (2011) were calculated on the basis of the currently recommended mortality tab-le, the premium for the Riester contract would be cal-culated with an increased life expectancy of almost five (9.5) years. In principle, a higher life expectancy makes the contract premiums more expensive.
Profit Participation Has Been Changed in Favor of Insurers
As a result of the careful calculation methods, for examp-le the high life expectancy, life insurers will normally generate excess profits from both classic life insuran-ces and insurance-like pension contracts.26 Generally, there are three different sources. Net interest income is generated by the insurer getting a higher interest rate on the customers‘ capital than the guaranteed interest rate. Cost surpluses are achieved if the insurer actually has to spend less than the calculated cost schedule. Risk and mortality profits occur when the insured person dies earlier than assumed in the calculation.
When the Riester pensions were first introduced, super-visory regulations stipulated that 90 percent of all profits and surpluses had to be distributed to policy holders.27 Since 2005, however, savers‘ participation in 90 percent of profits only applies to net interest income, which has
26 Profit participation affects virtually all supplemented contracts, since almost all Riester contracts, with the exception of the Homeowner Riester, must flow into a private pension by the time the saver is 85 years old at the latest. Guaranteed pensions at the beginning of retirement will be increased through profit participation up to the beginning of retirement. Profits allocated to the contract during the pension term increase the pension as of the next pension reference year. Comparative analyses of the course of the pension with and without mortality profits were implemented for different pension offers in product testing, see the many product tests by Ökotest, for example, Ökotest, „Rieser-Rente-Reinfall statt Rendite,“ (2010).
27 But it is at the sole discretion of the various providers as to when funds from these profits are actually credited to the individual pension contracts. In practice and in general, profits are first placed in a reserve for premium refunds (Rückstellung für Beitragsgewähr, RfB). In addition, there is scope for the insurers to allocate high or low profits to certain contracts.
Table 4
life Expectancies according to various mortality tablesIn years
StatBAMathConcepts
20111
DAV standard calculation table
(DAV04R)
Contract beginning in 2001 at the age of 35 years
Women 87.04 88.68 91.93
Men 81.50 82.47 85.12
Contract beginning in 2011 at the age of 35 years
Women 88.21 89.87 97.65
Men 82.75 83.73 93.49
1 The mortality table from MathConcepts considers elements of both the DAV and StatBA tables.
Sources: Federal Statistical Office 2006, MathConcepts, German Actuarial Association, FES 2011, calculations by DIW Berlin..
© DIW Berlin 2012
Men and women live longer according to life insurers than according to the Federal Statistical Office.

DIW Economic Bulletin 2.201210
tEn yEaRs of thE RIEstER PEnsIon schEmE: no REason to cElEbRatE
contributions plus the subsidies received as an annui-ty, then she/he has to live 78.4 (76.8) years, an age that women (men) can quite realistically reach. If profits are also added to the contract, the target age to be attained is reduced by a further three years (Table 5).
However, the woman must reach 90 years of age if she wants to achieve a target return of 2.5 percent. She would have to live to be an impossible 128 years old in order to get a return of 5 percent interest on her saved capital in this otherwise equal variant. If such female savers also received a profit on their Riester savings, the target age would be reduced yet again. In order to achieve an in-terest rate of 2.5 or five percent in this case, the woman (man) would now have to live to 82 or 92 (79.7/87.1) ye-ars of age.31 If an adjustment for inf lation is also taken into account for the model person, the target age incre-ases slightly in almost every variation.
The choice of mortality table and the differences in life expectancy have a very significant and stronger effect on yields from the Riester contract than a reduction in the guaranteed interest rate, and this is irrespective of whether the guaranteed yield or the guaranteed annuity takes surpluses into account. Profitability in both cases deteriorated after applying the DAV04R mortality table. The choice of mortality table for women has a similar effect to lowering the guaranteed interest rate. But with men, the use of mortality tables increases the age requi-red to achieve a particular yield, not only in the case of a guaranteed annuity, but also taking into account profit participation. It can be deduced from this that the int-roduction of the new mortality table has led to a greater reduction in profitability for men than for women.
The introduction of the unisex table compared to a DAV04R gender-specific table has resulted in dimini-shed target yields for women, but has increased them for men.32 This means that the age needed to achieve a certain yield slightly increases for women, but notice-ably increases for men. For example, based on a gender-dependent tariff, a model woman (man) who concludes a contract at the age of 35 would have to become 78.4 (76.8) years old to achieve a zero rate of return. If the unisex tariff introduced later had applied in 2001, the target age for women would have decreased moderate-ly, but for men it would have increased noticeably. The reason for this is that the unisex mortality table is not
31 As a reminder: the life expectancy for this group of women (men) in the DAV mortality table is almost 92 (a good 85), and only 87 (81.5) at the State Statistical Office.
32 It can also be observed that a number of insurance providers do not base their calculations on the unisex tariff, but solely according to the female mortality rate.
Worthwhile Riester yields only Possible for Policy holders who live up to an old age
Taking into account the certification criteria, the calcu-lation parameters, and the profit participation, a yield indicator was calculated for several »model Riester per-sons« (Box 1).30 The following example considers a Ries-ter saver aged 35 years who concluded a pension con-tract in 2001 (variant with no adjustment for inf lation). If a woman (man) in this model group wants to recei-ve a yield of zero, that is, receive only her (his) Riester
30 Other possible yield indicators are the annuity rate, the return on savings at the start of benefits/pension (return on savings), the bond yield (profitability analysis including costs of drawing the pension), and the share of funds for the „pension from 85.“ Here, the annuity rate determines how much pension savers will receive from an offer if they have saved, for example, 100,000 euros, by the time they retire. The savings rate of return indicates how high the interest rate on a savings account needs to be for the saver to have saved as much as in the original offer by the time they retire. The bond yield shows how much yield can be expected if the pension is paid in for as long as the average life expectancy. The cost effects of drawing the pension are also taken into account. The share of funds for the „pension from 85“ determines for Riester contracts with a payout plan up to 85 years of age how much saved capital has to be reserved at the start of retirement for a saver to be able to receive a „pension from 85“ against a one-off payment.
Box 1
yield Indicator: "age for a target yield"
This indicator calculates how old a saver needs to be to achieve a certain target yield. Here, the internal interest on cash flow from funds paid into the Riester contract and funds paid out to savers as a pension constitute the yield. This indicator is intuitive for savers. The target age for a desired yield of zero is based on the age savers need to reach to recupe-rate at least the money they pay in, plus subsidies without interest. It is calculated as the sum of total contributions paid in and allowances, divided by the guaranteed monthly pension amount. Since individual contributions and allowances are added, this calculation reflects the social perspective of the Riester pension.
The target age can also to be calculated for additio-nal yields. Here, the precise age at which the internal interest rate on cash flow generates the desired yield is calculated according to the paying in period of the savings phase, the amounts paid in, and the payout dates. If inflation is also taken into account, the target age is exactly the age savers need to reach in order for them not to make any losses due to inflation.

11DIW Economic Bulletin 2.2012
tEn yEaRs of thE RIEstER PEnsIon schEmE: no REason to cElEbRatE
life expectancy of the saver is unattainable, or only at-tainable in rare cases.
Summary: For average savers, contracts concluded in 2011 generate lower yields and lower pension benefits than those concluded with conditions of 2001. This de-terioration can be attributed to government changes in product calculation, to the guaranteed interest rate, and even more so to the mortality table and the unisex ta-riff used, as well as new product structures. The analy-sis also shows that the profitability of contracts conclu-ded by 50-year-olds is lower than for contracts conclu-ded by 35-year-old savers.34
34 This basic trend can also be shown with other profitability indicators; Kleinlein, A., „Die Kostenquote.“ In addition, a gender-specific analysis shows that the pension yields of men have decreased compared to women, that almost three times more saved capital is reserved for the „pension from 85“ as with contracts concluded in 2001, and therefore only limited funds are available for payouts up to 85.
compiled like an average mortality table for men and wo-men, but is geared towards women. Based on the regu-lations from 2011, the respective target ages of women and men increase significantly, since overall higher life expectancies have been assumed.
Product tests show that new products are calculated on the basis of mortality tables with maximum life expec-tancy, and savers are not credited with sums that savers with classic products still receive.33 Irrespective of new product packages, both tariffs mean that target ages will have to increase significantly in order for certain target yields to be achieved. This is more evident in men than in women. Consequently, calculations for new product offers show that they are only profitable, from a socie-tal point of view, with one profit participation and if the
33 For example, with variable „annuities“ tariffs, in which no risk or cost gains are normally provided for, or restrictions in profit participation with classic tariffs, such as the classic Riester pension from Allianz Lebensversicherung, see Ökotest „Reise ins Labyrinth“ (2011).
Table 5
Riester yields Indicator for Insurance-like ProductsRequired Age at Death in Years
Expected yield
2001 (gender-dependent tariff) 2011 (unisex tariff)
Female saver Male saver Saver Saver
Classic product New product
Without salary developmentsGuaranteed benefits variant
0 percent 78.4 76.8 84.2 86.92.5 percent 90.0 85.8 109.8 124.55 percent 127.9 105.5 not achievable
Annuity with profit participation variant0 percent 75.4 74.3 77.1 78.82.5 percent 82.0 79.7 84.8 88.45 percent 91.8 87.1 96.2 104.1
With salary developments (adjustment for inflation: 2.5 percent) Guaranteed benefits variant
0 percent 79.2 77.4 85.0 87.92.5 percent 90.4 86.2 109.4 123.95 percent 124.5 104.3 not achievable
Annuity with profit participation variant0 percent 76.2 74.9 77.9 79.82.5 percent 82.7 80.3 85.5 89.35 percent 92.0 87.3 96.4 104.4
Model persons: saver: contract concluded at 35 years of age; annual income: 30,000 euros; children: two; marital status: married; total premium: 1,200 euros consistent-ly (without Riester scale); end of contract: at 67 years.Model assumptions for calculation parameters: average cost burden: 12.5 percent, including acquisition costs amounting to 4 percent; total interest after profit partici-pation: 4.5 percent; inflationary adjustment: 2.5 percent; guaranteed interest rate for 2001 (2011): 3.25 (2.25) percent; distribution of profits in 2001 (2011): 90 (net interest income: 90 percent; risk profits: 75 percent, cost surpluses: 50 percent); mortality table: modified mortality table from MathConcepts.Source: Kleinlein/FES 2011, calculations by DIW Berlin..
© DIW Berlin 2012
Profitable Riester requires long life.

DIW Economic Bulletin 2.201212
tEn yEaRs of thE RIEstER PEnsIon schEmE: no REason to cElEbRatE
conclusions: »Riester« Is often no better than Putting money in your Piggy bank
Ten years ago—when the Riester pension and its pro-ducts were introduced—an assessment of the oppor-tunities and risks of funded and private pension plans concluded that the problems of a declining population would not be solved simply by changing the financing procedure. (Box 2).35 In particular, it was believed that the risk of a funded pension scheme lay in the f luctua-tions of return on investment, that is, the dependency of pensions on the development of the financial market. In particular, funded pension plans were deemed ris-
35 See Kirner, E., V. Meinhardt, and, G.G. Wagner, „Probleme der Altersvorsor-ge allein durch Änderung des Finanzierungsverfahrens nicht zu lösen,“ Wochenbericht des DIW Berlin, no. 30 (2000).
ky, especially for pensions in the lower income bracket. There was concern that the lack of socio-political orien-tation would be disadvantageous to the Riester system. Risk diversification was seen as a particularly good op-tion for funded pension plans.
It was recommended that the government develop crite-ria for good pension plans in conjunction with the pro-viders. There were calls for the products to be identified with a seal of quality, for policy changes to be possible in principle, and for the administration to be good and inexpensive. The government is asked to check if fede-ral regulation might be appropriate.36
36 See Leinert, J., and G.G. Wagner, „Riester-Rente kann entscheidend verbessert werden,“ Frankfurter Allgemeine Zeitung, July 18, 2003.
Going beyond the comprehensive regulation of Riester products, the question arises as to whether an additional funded pension scheme is at all useful. Two main arguments were presented in favor of the Riester pension scheme: firstly, the interest will lead to higher pension benefits for individual savers than the pay-as-you-go system, and secondly, a funded pension scheme is less susceptible to demography than the pay-as-you-go system.
However, Riester pensions show how funded pension schemes can be susceptible to short-term financial mar-ket developments. With the reduction in guaranteed interest rate, the effective interest rate of four percent originally targeted for Riester products has become very uncertain. It is not possible to calculate a target yield for individual retirement age, and therefore for individuals, from profit participation. It is precisely the underlying uncertainty in any capital cover system that makes them very risky for pensions in the lower income bracket. Funded pension schemes are only useful inso-far as the targeted basic protection for old age is fully secured by government pay-as-you-go funding.
The second argument—the alleged greater indepen-dence from an ageing society—is not true in this simple form. The increase in life expectancy, resulting in increased premiums for the pay-as-you-go scheme (or re-duced pensions), also leads to longer pension durations in the funded pension scheme and, therefore, to lower effective pension payments with the same premiums.
In addition, there are also potential yield problems with an aging society, such as the decline in prices of investment properties in areas where populations are shrinking considerably.
If these arguments are socio-politically weighted, it turns out that a decrease in yield from funded pension products is very risky for policy holders in the lower in-come bracket. In the upper income bracket, a voluntary mixture of pay-as-you-go and funded pensions is a way to hedge against the problems of a particular form of pension using a mixed portfolio. But since it is not clear if this really works, this is not to be recommended from a socio-political point of view for the lower income bra-cket so as to prevent low income or poverty in old age.
If legislation on pension policies were to be reconside-red and the conclusion drawn that the funding of new Riester contracts should be abandoned, this would not automatically mean that public funds already expended on the Riester contracts would simply disappear, that is, they would be saved. If the Riester pension were to be abandoned, the money saved could also be targeted into the state pension system thereby creating scope, for example, to protect low-wage earners and lower income groups with a minimum government pension.1
1 Meinhardt, V., and M. Grabka, (2009) discuss an example of how the pension system could be restructured: "Grundstruktur eines universellen Alterssicherungssystems mit Mindestrente," Diskussionspapier des Gesprächskreises Sozialpolitik der Friedrich-Ebert-Stiftung.
Box 2
basic considerations for a funded Pension scheme

13DIW Economic Bulletin 2.2012
tEn yEaRs of thE RIEstER PEnsIon schEmE: no REason to cElEbRatE
The general opportunities and threats of funded pen-sion schemes are largely the same today as they were then. However, specific pension products have deve-loped differently than was desired at that time. From a consumer protection perspective, the f laws in Riester products need to be exposed. The structure of Riester products gives the impression of a ragtag mix of state, private, and market. The certification and calculation of the Riester products are, in fact, extensively constructed with a view to protecting the interests of the insurer. For many people, the Riester products are not transparent and from a societal point of view, only generate a wor-thwhile yield if the saver lives to a ripe old age. But for many Riester savers, the yield is no higher than if they had put their savings in a piggy bank. This is socially and politically unacceptable for consumers because pen-sion schemes are a vital commodity and the »Riester« is a product on which taxpayers’ money is spent.
On the positive side, at least the legislation has paved the way for minor measures to create transparency and to improve the accessibility of information. The Federal Ministry of Finance is also currently discussing compi-ling a positive list of allowable cost components. In ad-dition, a mandatory, standardized, and transparent re-presentation of costs has often been suggested but is not yet a finished instrument. The proposal by consu-mer advocates to test standardized product information for its comprehensibility to consumers prior to its intro-duction has not yet been addressed.
It is also a failure of those responsible for the Riester scheme that Riester savers sometimes still incur very high costs if they are dissatisfied with their provider and want to switch. This failure needs to be remedied as soon as possible.
It is somewhat confusing that the government does not specify legally binding calculation methods for state-funded pension products. This pertains to the mortali-ty tables and profit participation, giving rise to the ques-tion why the insurer should be given a share in these profits at all.
Given the proven shortcomings of Riester products and in respect to the critical findings of many other experts, also concerning other aspects of the Riester scheme not outlined here, minor measures are simply not suffici-ent. In light of these findings, a fundamental rethink of Riester products is needed.
There is also a need for restrictions on the number of supplemented products. It might be appropriate to crea-te a positive list with a few recommended, comparatively profitable, low-cost yet safe products. This would require
a certification process that evaluates content and classi-fies products according to risk categories or profiles. An alternative method of certification would be a selection of products through public tender. The Swedish model of government products demonstrates an even better re-gulation option. For individual citizens, the advantage of a positive list or a government product would be that the pension benefits would come from a single source and the costs would certainly be no higher and the yield no less than for products from private insurers. This would negate the need to choose from a vast range of products. If no such fundamental improvements are made, the-re is a good argument for abandoning publicly funded, private and capital-based Riester products.
Kornelia Hagen is a Senior Research Associate in the Department of Competi-tion and Consumer | [email protected]
At the time of writing, Axel Kleinlein was an independent actuary, on the board of the German Association of the Insured since 1 November 2011 | [email protected]
JEL: D18, D82, D91, E21, H55 Keywords: Private pension provision, Riester scheme, funding principle, Welfare State
Article first published as “Zehn Jahre Riester-Rente: kein Grund zum Feiern”, in: DIW Wochenbericht Nr. 47/2011

DIW Economic Bulletin 2.201214
IntERvIEW
Ms. Hagen, it is ten years now since the Riester pension 1. scheme was first introduced. Since then, have those who have concluded a Riester contract made the right decis-ion? I will try to answer this question using the example of a 35-year-old woman who concluded a contract in 2001 and plans to pay her Riester contributions up until her 67th birthday. This woman will have to reach the age of at least 78 in order to get back out of her savings agreement what she paid in. I would not say this is a good investment, but it is probably safer than any speculative investments.
What is the situation with contracts concluded today?2. People with the same background as this 35-year-old I gave as an example who decide to conclude a Riester contract today get a significantly worse deal. It always depends on how it is calculated; under certain circum-stances, the woman has to reach the age of about 90 just to get back the amount she has paid in herself including the premiums granted by the state. It is not even a matter of some kind of surpluses or additional interest that she generates.
What is the explanation for this?3. There are several factors. On the one hand, since the Riester pension was introduced, the guaranteed interest rate has dropped from 3.25 percent to 2.25 percent. The much more significant factor within the Riester pension scheme structure is, however, that life insurers base the calculati-ons for their products on very high life expectancies.
What are the biggest problems with the system?4. The biggest problem is the basis used for the calculations, which is not transparent enough. No lay person knows
what life expectancy the life insurers actually use for their calculations. There are no legal provisions concer-ning these calculations. That is a very important part of it. There are other issues, for instance, the distribution of the surplus funds, which has been changed to the disadvantage of the savers. When crucial decisions had to be taken, the government stepped back and said it was a matter of the insurance industry, although there are regulations and provisions in place. This is difficult to comprehend because, of course, when public funding is being used, the government should also set specific guidelines.
Ultimately, is it those who sell Riester products who 5. benefit most from this structure? The insurers would, of course, say this is not the case. The basic problem is, however, that we are dealing with a product that has to be profitable for the private sector. It is understandable that companies want to make a profit, but this is incom-patible with the social components. Insofar, I would say, yes, I assume the providers have generated a good profit from Riester products so far.
Should we keep the system of subsidized personal and 6. funded pension scheme at all? As they are at present, the products are poor and to the disadvantage of those who are saving and want to make sure they have some provision for their old age. In my view, something needs to be done about it. The matter will probably have to be given further consideration: for example, to decide whe-ther the Riester pension should be turned into a state product with very high regulatory measures, or whether subsidies should be dispensed with altogether. It is my understanding, that the products should not continue to exist in their current form and the public sector should put the money from Riester subsidies into the statutory pension insurance in a way that is more precisely targe-ted, particularly for individuals in lower income brackets.
Interview by Erich Wittenberg.
Kornelia Hagen, Senior Research Associ-ate, Competition and Consumers Depart-ment at DIW Berlin
SIX qUESTIONS TO KORNELIA HAGEN
» Poor Products at the Expense of Pension Policy Holders«
aDD-on PREmIums IncREasE PRIcE tRansPaREncy—moRE PolIcy holDERs sWItch hEalth Plans*
15DIW Economic Bulletin 2.2012
The German Act to Strengthen Competition within the Statutory Health Insurance System1 stipulated the estab-lishment of the central health care fund which came into effect on January 1, 2009. One of the key objectives of the reform was to foster more price transparency among the, at the time, 200 SHI providers or sickness funds in Germany.2 The aim of this move was to increase price competition between the sickness funds which, in spite of the introduction of free choice among sickness funds in 1996, barely existed. From 2000 to 2009, only five percent of policy holders switched sickness funds each year.3 This is astonishing as, during this period, signi-ficant price differences already existed between the dif-ferent sickness funds. A sample of universally accessib-le sickness funds shows that, in 2008, contribution ra-tes ranged from 13.4 to 17.4 percent4 (Table 1). Based on the average gross monthly wage which was 2,550 euros5 at the time, for policy holders this equated to a price dif-ference of up to 51 euros per month.6 Individuals whose income reached the contribution assessment threshold could even have saved up to 72 euros per month by swit-ching from the most expensive to the least expensive health plan. People’s reluctance to switch health plans during that period is even more surprising if we bear in mind that approximately 95 percent of insurance be-nefits were classified as mandatory benefits by Volume
1 Act to Strengthen Competition within the Statutory Health Insurance System (GKV-Wettbewerbsstärkungsgesetz, GKV-WSG), BGBl. I No. 11, 30/03/2007, available online at: www.bgbl.de
2 Federal Health Monitoring (Gesundheitsberichterstattung des Bundes) (2011), available online at: www.gbe-bund.de
3 Schmitz, Hendrik and Nicolas R. Ziebarth, In absolute or relative terms? How framing prices affects the consumer price sensitivity of health plan choice. SOEPpaper 423 (2011), DIW Berlin, available online at: www.diw.de/en/diw_02.c.298577.en/soeppapers.html
4 Including special premiums. Only those sickness funds with nationwide coverage are considered.
5 Federal Statistical Office (Statistisches Bundesamt), Federal Ministry of Labour and Social Affairs (BMAS), German Statutory Pension Insurance Scheme (Deutsche Rentenversicherung Bund), available online at: www.forschung.deutsche-rentenversicherung.de
6 By switching, the employer could also save an additional 51 euros.
The German health care reform implemented in 2009 led to a con-siderable increase in price transparency within the statutory health insurance (SHI) (Gesetzliche Krankenversicherung, GKV) system and also made it more consumer-friendly which, in turn, has encoura-ged policy holders to react to price hikes by switching to a different health insurance fund ("sickness fund”). In 2009, the government es-tablished a central "health care fund” (Gesundheitsfond) which stan-dardized contribution rates. Price differences between the sickness funds are now listed separately on the policy holder‘s bill as add-on or reimbursed premiums. It is above all these add-on premiums that gave policy holders a clear price signal. According to SOEP repre-sentative survey data, in 2010 this resulted in one in ten individuals affected by add-on premiums switching health plans. Aggregated sickness fund level data show that the add-on premiums introduced by the DAK and KKH-Allianz resulted in a 7.5 percent average annu-al loss of members.
However, at the beginning of 2011, a generous increase in the uni-form contribution rate for all sickness funds and the extravagant filling of the health care fund with the additional reserves means that in 2012, it is likely that no sickness fund will have to charge add-on premiums thus thwarting any price transparency previously achieved by the add-on premiums. As of 2013 the situation could change again as a result of increasing health care spending and a downturn in the economy. However, the government should not count on this happening, and instead should introduce new incen-tives to strengthen price competition, for example by capping the health care fund‘s payments to the sickness funds.
Add-On Premiums Increase Price Transparency—More Policy Holders Switch Health Plans*by Peter Eibich, hendrik schmitz and nicolas Ziebarth
* The authors would like to thank all mentioned health insurance funds for providing the data. Special thanks goes to Tobias Schmidt and the German Federal (Social) Insurance Office, Ann Marini and the National Association of Statutory Health Insurance Funds (GKV-Spitzenverband), and the BKK Federal Association (BKK-Bundesverband) for information and advice.

DIW Economic Bulletin 2.201216
aDD-on PREmIums IncREasE PRIcE tRansPaREncy—moRE PolIcy holDERs sWItch hEalth Plans*
share. Last but not least, the employer contributes di-rectly to the sickness fund, which further limits the po-licy holder’s price consciousness.
2009 Reform: framing Price Differences in absolute values Promotes competition on the health Insurance market
With the establishment of the central health care fund in January 2009, the government introduced a uni-form contribution rate for all those within the SHI sys-tem. Since 2009, the newly-created health care fund has pooled all contributions collected as a result of this standardized contribution rate. Sickness funds, in turn, no longer collect contributions directly from the emplo-yer. Instead, the central health care fund redistributes the monies to the sickness funds according to a standar-dized premium per insured individual. “Standardized” means that a risk structure equalization (RSA) formula is applied which equalizes the different risk profiles in the pools of policy holders between the sickness funds (SGB V, Sections 265–273). In other words: the sickness funds with a large number of sick policy holders recei-
5 of the German Social Insurance Code (SGB V). This means that variations in the cost of health plans were, for the most part, pure price differences, ref lecting very little difference in benefits.
The primary reason behind the reluctance to switch health plans was the lack of price transparency. The fra-ming of price differences as contribution rate differen-ces in percentage points made it even more difficult for the policy holder to compare the prices of the different sickness funds. Box 1 illustrates the arithmetic steps that were required to calculate the monthly price difference between sickness fund A, with a 15 percent contributi-on rate, and sickness fund B, with a 14 percent contri-bution rate. Based on the 2008 average gross monthly wage, a difference of one contribution point was equal to a monthly saving, for the employee, of 12.76 euros.
In order to calculate this figure, firstly the policy hol-der would have had to know their exact gross monthly wage. Secondly, they would also have needed informati-on about the current contribution assessment threshold up to which contributions have to be paid. Moreover, the contribution rate is based not only on the employee’s share of the policy premium, but also on the employer’s
Table 1
overview of maximum contribution Rate Differences between sickness funds in 2008¹
Sickness fundContribution
rate in percent
Employee contri-bution per month
in euros²
Policy hol-ders
Coverage Notes
City BKK 17.4 233.51 207,000 15 federal states Closed on 01/07/2011AOK im Saarland 16.7 224.58 230,000 1 federal state
AOK Mecklenburg-Vorpommern 16.7 224.58 487,995 1 federal state Merged with AOK Nordost on 01/01/2011AOK Berlin 16.7 224.58 712,000 1 federal state Merged with AOK Nordost on 01/01/2011Gemeinsame BKK Köln 16.6 223.30 40,000 Countrywide Merged with mhplus BKK on 01/01/2011BKK BVM 16.6 223.30 70,657 Countrywide Merged with Schwenninger BKK on
01/01/2009… … … … …… ... … … …
… … ... ... …BIG direkt gesund 13.4 182.47 338,000 CountrywideBKK der Thüringer Energieversorgung 13.3 181.19 98,874 2 federal statesIKK Thüringen 13.2 179.92 230,000 3 federal states Merged with IKK Classic on 01/01/2010IKK Südwest Direkt 13.2 179.92 500,000 3 federal statesBKK MEM 13.1 178.64 2,100 1 federal stateIKK Sachsen 12.7 173.54 690,000 3 federal states Merged with IKK Classic on 01/01/2010
1 Does not include ”closed” company health insurance funds (BKK).2 Compared with the average income in 2008 of 2,552 euros.3 Information refers partially to different points in time.4 Members as at 01/01/2008. Number of policy holders not available.Sources: Focus, The National Association of Statutory Health Insurance Funds (GKV-Spitzenverband), information from the sickness funds, company annual reports, press releases, German Research Foundation Ranking (dfg-Ranking) 8/11.
© DIW Berlin 2012
In 2008, switching sickness funds saved policy holders large sums of money.

17DIW Economic Bulletin 2.2012
aDD-on PREmIums IncREasE PRIcE tRansPaREncy—moRE PolIcy holDERs sWItch hEalth Plans*
ve a higher payout from the health care fund than those with an above average share of healthy members.
The leveling of the premium price differences and the payment of average contributions by the health care fund led to a redefinition of the sickness funds’ premi-um autonomy. If the transfers received from the health care fund do not cover the sickness fund’s costs, they are obliged to charge “add-on premiums” on their mem-bers’ invoices expressed as a monthly euro value. Con-versely, sickness funds generating a surplus can now also reimburse their members’ premiums. This makes it far easier for the policy holder to identify price diffe-rences between the sickness funds.
The increase in competition on the health insurance market resulting from the introduction of the health care fund and add-on premiums has put sickness funds un-der greater pressure to economize more efficiently and to keep health plan prices low either by avoiding add-on premiums or through premium reimbursements. This contributes to an increase in internal efficiency reserves.
Moreover, the concentration of sickness funds has also increased due to mergers and even the closure of indi-vidual funds.7 The total number of sickness funds has fallen from 241 in 2007 to 153 in 2012.8 Voluntary mer-gers of sickness funds can contribute to a better mix of risks, particularly for smaller sickness funds, and lead to synergy effects by dismantling duplicate administ-rative machinery.
all add-on Premiums likely to be abolished in 2012
It is anticipated that, in 2012, all sickness funds will do entirely without add-on premiums or will abolish these during the course of the year. When this article went to print in December 2011, eleven health insurance com-panies were still charging add-on premiums of between 6.50 and 15 euros per month (Table 2). This included two of the biggest German sickness funds—DAK and KKH-Allianz with 6 million and 1.9 million members respectively. On the other hand, there are currently 7 sickness funds reimbursing their members’ premiums at a rate of between 2.50 and 10 euros per month. Ad-mittedly, this includes very small and less well-known
7 Examples are City BKK on July 1, 2011 or the BKK for health professionals on December 31, 2011.
8 The National Association of Statutory Health Insurance Funds (Spitzenverband der Gesetzlichen Krankenkassen) (2011), available online at: www.gkv-spitzenverband.de/Presse_Zahlen_und_Grafiken.gkvnet
Box 1
calculation of monthly health Insurance contributions based on contribution Rates
Sickness fund A: contribution rate 15 percent
Average gross wage 2008a: 2,552 euros
Contribution assessment basis threshold 2008b: 3,600 euros
Employee share of contribution ratec: (15–0.9)/2 + 0.9 = 7.95
Monthly health insurance contribution: 7.95 percent*2,552 euros = 202.88 euros
Sickness fund B: contribution rate 14 percent
Average gross wage 2008a: 2,552 euros
Contribution assessment basis threshold 2008b: 3,600 euros
Employee share of contribution rate: (14–0.9)/2 + 0.9 = 7.45
Monthly health insurance contribution: 7.45 percent*2,552 euros = 190.12 euros
Saving with sickness fund B vs. A: 202.88 euros – 190.12 euros = 12.76 per month 12.76 euros*12 = 153.12 euros per year
Conclusion:
By switching from sickness fund A to fund B, the em-ployee could save 12.76 euros per month. Moreover, the employer would also save 11.96 euros per month which he could pay out to the employee in the form of a wage increase.
a Federal Statistical Office (Statistisches Bundesamt), Federal Ministry of Labour and Social Affairs (Bundesministerium für Arbeit und Soziales), German Statutory Pension Insurance Scheme (Deutsche Rentenversiche-rung Bund)b Federal Ministry of Finance (Bundesministerium der Finanzen).c Since July 1, 2005 employees have had to pay a special premium of 0.9 percent. (Act to Adjust the Financing of Dentures (Gesetz zur Anpassung der Finanzierung von Zahnersatz), December 15, 2004).

DIW Economic Bulletin 2.201218
aDD-on PREmIums IncREasE PRIcE tRansPaREncy—moRE PolIcy holDERs sWItch hEalth Plans*
the reform—on the contrary. Whereas the maximum monthly price range in 2008 was approximately 50 eu-ros per month for an average earner, this figure is cur-rently 20 euros.10 There are 135 sickness funds whose members are currently being charged the same percen-tage point contribution rate of 15.5 percent and no add-on premiums. They constitute more than 90 percent of all SHI policy-holders.11
10 Restricted to sickness funds with nationwide coverage.
11 This figure is based on the approximately eight million statutory health insurance policy holders paying add-on premiums (approximately 75 percent of the total 10.5 million people insured with sickness funds charging add-on premiums) as well as the total number of 69.9 million statutory health insurance policy holders (Federal Health Monitoring 2011, www.gbe-bund.de).
funds, two of which only operate in certain federal sta-tes and three of which are “closed” i.e., only accept em-ployees from specific companies. Currently, there are a total of approximately 10.5 million people who are insured with sickness funds charging add-on premi-ums. The funds reimbursing premiums encompass over 500,000 members.9
The price differences between the 153 sickness funds currently operating have not increased as a result of
9 It should be noted that this does not mean that 10.5 million statutory health insurance policy holders pay add-on premiums. The number of policy holders also includes, for example, non-contributory co-insured family members, who do not have to pay add-on premiums. The DAK currently has 4.7 million ‘paying’ members and KKH-Allianz 1.4 million.
In the media debate regarding add-on premiums and the workings of the health care fund, it is frequently pointed out that the sickness funds charging add-on premiums were being hastily abandoned by healthy policy holders in particular, which only serves to exacerbate these funds' difficulties. However, this argument primarily criticizes an allegedly flawed risk structure equalization scheme (RSA) and not the add-on premiums themselves. If the RSA were to function effectively, increased switching of young and healthy policy holders would not be a problem, as it is precisely policy holders' health status that the RSA is supposed to balance through redistribution among the sickness funds.
The RSA was introduced in 1994 with a view to implementing free choice between sickness funds (1996). Until 2002, the scheme only equalized outcome medical consumption differences based on age, gender and disability status. In 2002, the equalization factors were extended to include policy holders participating in disease management programs and a risk pool was established to compensate sickness funds for policy holders with very high medical expenses. With the int-roduction of the health care fund, the RSA underwent another reform. The risk pool was abolished and, based on expert recommendations, replaced with a “morbidi-ty-oriented risk structure equalization scheme” (Morbi-
RSA) which balances differences in claims according to 80 defined diseases1.
A recent comprehensive evaluation report by the Sci-entific Advisory Council for the Risk Structure Equali-zation Scheme at the German Federal Social Insurance Office provides the reformed Morbi-RSA with a positive review stating that the new structure has increased the accuracy of the allocation of funds. On the other hand, the report also states that there is probably (still) a marked surplus for healthy policy holders created by transfers from the health care fund, and rejects reform proposals for a reduction in the number of diseases covered by the RSA.2
A more accurate and effective RSA is an essential prerequisite for fair competition between sickness funds irrespective of how price differences are framed. Hence, the discussion regarding the further development of the RSA should be decoupled from the fundamental debate about the health care fund and the add-on premiums.
1 See IGES, Lauterbach, K.W., and J. Wasem, Klassifikationsmodelle für Versicherte im Risikostrukturausgleich (2004), report commissioned by the Federal Ministry of Health and Social Security, available online at: www.iges.de/publikationen/gutachten__berichte/rsa_gutachten/e5166/infoboxContent5168/EndberichtRSA-Gutachten_ger.pdf.
2 Scientific Advisory Council for the Further Development of the Risk Structure Equalization Scheme at the German Federal Social Insurance Office, Evaluationsbericht zum Jahresausgleich 2009 im Risikostrukturaus-gleich (2011), available online at: www.mm.wiwi.uni-due.de/fileadmin/fileupload/BWL-MEDMAN/Aktuelle_Meldungen/Gutachten_mit_Anlagen.pdf.
Box 2
Debate on the further Development of the Risk structure Equalization scheme "morbi-Rsa”

19DIW Economic Bulletin 2.2012
aDD-on PREmIums IncREasE PRIcE tRansPaREncy—moRE PolIcy holDERs sWItch hEalth Plans*
ture of policy holders or in administration costs that led to contribution rate differences (Box 2).
One of the government’s primary objectives—to promo-te price transparency—has been achieved by the reform. At least this applies to price differences between sick-
Sickness funds charging add-on premiums were already systematically levying higher contributions before the reform. Conversely, those sickness funds which are cur-rently reimbursing premiums were already charging lo-wer contributions in 2008. This can be seen as an indi-cation that it was above all the differences in the struc-
Table 2
overview of sickness funds with add-on Premium and Premium Reimbursement
Sickness fundAdd-on premium
/premium
Amount in euros/month¹
Introduced DiscardedContribution rate in 2008 in percent³
Employee contribu-tion per month in
euros (2008)
Number of policy
holders (as at: 2010)
Coverage Notes
BKK Hoesch Add-on premium 15.00 01/01/2011 5 15.8 213.09 99,415 10 federal states Possibly discarding add-on premium in 2012
City BKK Add-on premium 15.00 01/04/2010 01/07/2011 17.4 233.51 168,000 Countrywide Closed on 01/07/2011BKK für Heilberufe Add-on premium 10.00 01/01/2011 01/01/2012 16.2 218.20 185,000 Countrywide Closed on 01/01/2012BKK Westfalen-Lippe Add-on premium 12.00 01/02/2010 30/09/2010 15.7 211.82 27,355 Countrywide Merged with BKK Vor Ort on
01/10/2010DAK Add-on premium 8.00 01/02/2010 31/03/2012² 15.4 207.99 6,049,941 Countrywide Merged with DAK-Gesundheit
on 01/01/2012 KKH-Allianz Add-on premium 8.00 01/03/2010 01/03/2012² 14.8 200.33 1,900,057 CountrywideDeutsche BKK Add-on premium 8.00 01/02/2010 4 15.1 204.16 916,765 Countrywide Plans to discard add-on
premium in 2012 BKK Gesundheit Add-on premium 8.00 01/02/2010 31/03/2012² 14.9 201.61 1,200,000 Countrywide Merged with DAK-Gesundheit
on 01/01/2012 BKK Phoenix Add-on premium 8.00 01/01/2010 4 16.3 219.47 10,663 Countrywide Plans to discard add-on
premium in 2012 Novitas BKK Add-on premium 8.00 01/07/2010 31/12/2010 15.4 207.99 450,000 CountrywideEsso BKK Add-on premium 8.00 01/04/2010 31/12/2010 14.5 196.50 26,000 CountrywideBKK Publik Add-on premium 8.00 01/01/2011 – 15.5 209.26 6,849 3 federal statesBKK Axel Springer Add-on premium 8.00 01/01/2010 31/03/2012² 16.5 222.02 12,142 Closed Merged with DAK-Gesundheit
on 01/01/2012 BKK Merck Add-on premium 8.00 01/04/2010 4 14.3 193.95 28,000 Closede.on BKK Add-on premium 8.00 01/03/2010 30/06/2011 14.5 196.50 8,900 ClosedBKK advita Add-on premium 6.50 01/07/2011 4 15.7 211.82 43,000 Countrywide Plans to discard add-on
premium in 2012
Gemeinsame BKK Köln
Add-on premium 1 percent of income
01/09/2009 31/12/2010 16.6 223.30 29,414 Countrywide Merged with mhplus BKK on 01/01/2011
Total 11,161,501Total 12/2011 10,451,832
BKK A.T.U. Premium 2.50 01/01/2011 – 14.4 195.23 100,223 Countrywidehkk Premium 5.00 01/01/2009 – 14.1 191.40 325,511 CountrywideBKK Wirtschaft und Finanzen
Premium 5.00 01/01/2011 – 14.4 195.23 10,000 12 federal states
BKK PWC Premium 5.00 01/01/2011 – 14.1 191.40 17,091 ClosedBKK ALP Plus Premium 5.83 01/07/2009 30/03/2010 14.8 200.33 107,773 CountrywideG+V BKK Premium 6.00 01/10/2009 – 12.2 167.16 1,000 2 federal statesIKK Südwest Premium 8.33 01/01/2009 01/01/2010 13.8 187.57 680,000 3 federal statesBKK Groz-Beckert Premium 8.33 01/01/2009 – 13.1 178.64 6,280 ClosedBKK Würth Premium 10.00 01/01/2009 – 13.5 183.74 12,432 Closed Premium payment not yet
officially set for 2011 Total 1,260,310Total 12/2011 472,537
1 As at: 15/12/2011. Premium and add-on premium levels have varied in previous years.2 Discard is yet to be approved by the German Federal (Social) Insurance Office.3 Including a special premium of 0.9 percent in compliance with Section 249, Subsection 1 SGB V.4 Planned to be discarded in 2012, pending approval by German Federal (Social) Insurance Office.5 Significant reduction or discard planned for 2012. Sources: German Federal (Social) Insurance Office (Bundesversicherungsamt), National Association of Statutory Health Insurance Funds (GKV-Spitzenverband), information from the sickness funds, company annual reports.
© DIW Berlin 2012
Almost all sickness funds plan to discard the add-on premiums again in 2012.

DIW Economic Bulletin 2.201220
aDD-on PREmIums IncREasE PRIcE tRansPaREncy—moRE PolIcy holDERs sWItch hEalth Plans*
people insured with the hkk, the biggest German sick-ness fund currently reimbursing contributions.
Even before the establishment of the health care fund and the transition to the new price framing system, there were significant differences in the market per-formance of the different sickness funds. This meant that the growth in membership of the TK and the hkk was consistently higher than that of the DAK and KKH-Allianz.
The DAK and KKH-Allianz introduced add-on premi-ums respectively in February and March 2010. In a com-parison of the average annual figures between 2009 and 2010, the DAK and KKH-Allianz lost a significant number of members: DAK –3.7 percent and KKH-Alli-anz –6.5 percent.13 Conversely, the hkk, which was reim-bursing premiums, gained, on balance, 4.2 percent new members. BARMER-GEK also recorded similar increa-ses in members during this period, whereas TK did not experience any further growth.
13 It should be noted that this data only refers to 2010. More recent reports, according to which the DAK has, to date, lost up to ten percent of its members, do not contradict this information.
ness funds. The employee’s share of the overall contri-bution rate, which is currently 15.5 percent of the gross wage up to the contribution assessment threshold, will continue to be shown only on the employee’s payslip. The following empirical analyses demonstrate that the add-on premiums are a significant incentive to switch health plans.
add-on Premiums significantly Increase Willingness to switch health Plans
The figure shows the development of the number of peo-ple insured with five selected sickness funds, which, to-gether, cover a market share of 30 percent of all policy holders.12 Two of these sickness funds charged add-on premiums of 8 euros per month as of February or March 2010 (DAK and KKH-Allianz); the other two PHI com-panies refrained from doing this (BARMER-GEK, TK). The figure also shows the development of the number of
12 Within the framework of this analysis it was not possible to obtain data on the other important market-players such as the number of people insured with the Allgemeine Ortskrankenkasse, (AOK) or with the Betriebskrankenkassen (BKK).
Figure
Development of the number of People Insured with selected sickness funds from 2004 to 2010 Difference in number of policy holders compared with previous year, in percent (based on approximate annual averages)
-6
-4
-2
0
2
4
2004 2005 2006 2007 2008 2009 2010
DAK (add-on premium)
KKH (add-on premium)
hkk(premium)
TK Barmer
Notes: in order to ensure comparability over the years, mergers are excluded from the calculation of the num-ber of policy holders. The calculation assumes that, after the merger, the switching rates are the same for both merger parties. The number of people insured with hkk was, in part, measured on different appointed dates over the course of a year and is, therefore, only conditionally comparable over time.Sources: annual company reports from the sickness funds, personal inquiries, graph by DIW Berlin.
© DIW Berlin 2012
DAK and KKH-Allianz lost a large number of members after increasing their add-on premi-um.
Table 3
Impact of contribution Rates, add-on Premiums and Premium Reimbursements on the Development of the number of Policy holders In percent
Change in number of policy holders
Contribution rate in percentage points –3.82**
Add-on premium –7.61**
Premium reimbursement 0.71
Consideration of time effects Yes
R2 0.87
Number of cases 35
Error probabilities: ***under 1 percent, **under 5 percent, *under 10 percent. The dependent variable is the change in the number of policy holders in percent. OLS estimates, standard errors are clustered at the level of the sickness fund.The regression also controls for persistent differences between sickness funds with add-on premiums and premiums on the one hand and the other two sickness funds on the other hand. The data source is the same as for Figure 1, i.e., it is based on annual averages of the number of people insured with the respective sickness funds. Sources: DAK, KKH, BARMER, TK, hkk annual reports, Federal Statistical Office, written information, calculations by DIW Berlin.
© DIW Berlin 2012
Many policy holders cancel their insurance when they have to pay an add-on premium.

21DIW Economic Bulletin 2.2012
aDD-on PREmIums IncREasE PRIcE tRansPaREncy—moRE PolIcy holDERs sWItch hEalth Plans*
only refer to a short-term effect from 2009 to 2010.16 The mid to long-term effects for individual sickness funds are likely to be less significant as policy holders only had extraordinary rights to cancel their contracts and switch funds within two months of the introduc-tion of the add-on premium.
The significance of the selective aggregate sickness fund data can be verified using estimates based on represen-tative survey data from the Socio-Economic Panel Stu-dy (SOEP)17.
Individual-level switching Probability Doubles Due to add-on Premium
Based on SOEP data, an extensive research study was conducted by the authors of this work. The study con-firms the aforementioned findings and conclusions:18 before the introduction of the health care fund and add-on premiums—when price differences were still ex-pressed as percentage point contribution rate differen-ces—the individual-level switching probability was five percent. This means that, on average, five percent of all paying SHI members switched their health plans eve-ry year. Due to the new legal requirement of sickness funds to express the price differences between health plans in absolute euro values, the individual-level swit-ching probability for members paying an add-on pre-mium doubled to more than ten percent. After the re-form, members of sickness funds which were not char-ging add-on premiums had a switching probability of only 3.5 percent. This is not surprising as the prices for this group no longer differ.19
If the actual subsequent health plan switch is related to the preceding price increases, the difference becomes even more apparent. This can be shown by analyzing tho-se being charged add-on premiums: before the reform, with a monthly increase of ten euros (veiled by the price
16 Moreover, the add-on premium effect was slightly underestimated because the calculations were based on the average number of policy holders in 2010 whereas the DAK and KKH-Allianz only introduced the add-on premium on 1/2/2010 and 1/3/2010 respectively (Table 2).
17 The Socio-Economic Panel Study (SOEP) is a longitudinal study that has been carried out annually, sampling the same households and individuals, since 1984. The SOEP gathers information on, inter alia, employment, income, health and choice of sickness fund. See Wagner, G.G., J.R. Frick, and J. Schupp, "The German Socio-Economic Panel Study (SOEP) – Scope, Evolution and Enhan-cements,” Schmollers Jahrbuch, 127 (1) (2007), 139–169.
18 Hendrik Schmitz and Nicolas R. Ziebarth (2011): "In absolute or relative terms?”How framing prices affects the consumer price sensitivity of health plan choice. SOEPpaper 423 (2011), DIW Berlin, available online at: www.diw.de/en/diw_02.c.298577.en/soeppapers.html
19 The switching probability of members of sickness funds who have to pay an add-on were reimbursed part of their premium was not analyzed. The number of observations is too low.
Table 3 shows the results of a simple statistical analysis. The basic data is the same as for Figure 1. However, Ta-ble 3 considers the overall market trend of the five sick-ness funds since 2004; time effects14 are excluded.
Before the 2009 reform, a 1 percentage point increase in the contribution rate brought about the loss of an ave-rage of 4 percent of members (Line 1, Table 3).
As a result of the introduction of the add-on premium, both of the selected sickness funds, DAK and KKH-Al-lianz, lost, on average, 7.5 percent of their members re-lative to other sickness funds and to market trends (Line 2, Table 3). The effect of the hkk’s premium reimburse-ments is, at 0.7 percent, positive, but from a statistical point of view no different from zero.
Reform significantly Increases consumer Price sensitivity and achieves Key objective
Although, even before the introduction of the health care fund, increases in insurance contributions led to significant losses in members, and, although the sick-ness funds selected for this study also experienced dif-ferent growth trends before the health care reform, the following is evident: by increasing price transparency, the reform increased the willingness to switch health plans. Whereas before the introduction of the health care fund a monthly contribution rate increase of 1 percenta-ge point or 13 euros15 led to a 4 percent loss of members among the 5 sample sickness funds, after the introduc-tion of an add-on premium of 8 euros, the loss of mem-bers increased to more than 7.5 percent per month. Re-latively speaking, the effect is three times larger: pre-viously an increase in contribution rates of 1 euro per month led to a 0.3 percent loss in members, today, the same increase results in an almost 1 percent loss. Price competition has increased dramatically.
When interpreting these figures, it must be borne in mind that they are based on a limited number of obser-vations and do not represent all SHI companies. The statements refer exclusively to the five selected sick-ness funds and, regarding the add-on premium, they
14 Time effects are systematic unobserved annual effects which have the same impact on all sickness funds. In our case study it could, for example, have been the case that all the sickness funds analyzed here launched special advertising campaigns in one specific year. This would have led to an observed increase in members for all sickness funds which would, however, be statistically excluded.
15 Based on the average gross wage.

DIW Economic Bulletin 2.201222
aDD-on PREmIums IncREasE PRIcE tRansPaREncy—moRE PolIcy holDERs sWItch hEalth Plans*
framing system) the individual-level switching probabi-lity increased by one percentage point. After the reform, this figure increased by six times in comparison. With
The public debate frequently gives the impression that add-on premiums are socially unacceptable and have a disproportionately negative impact on poor households, in particular. In order to allay this criticism, up until 2010 a hardship provision existed which limited the maximum add-on premium to one percent of monthly income. Income testing was not a requirement for add-on premiums of up to eight euros per month, however, which explains why the majority of add-on premiums are eight euros per month. However, this rule had two undesirable effects. The hardship provision was at the expense of the individual sickness fund which was not able to charge more than one percent of income even if it had greater financial requirements. Moreover, the regulation reduced the policy holder's incentive to switch to a less expensive sickness fund regardless of add-on premiums.
The GKV-FinG rescinded the hardship provision on 1/1/2011. Sickness funds were permitted to charge unlimited add-on premiums. When the average add-on premium exceeds two percent of the individual's assessable income, the policy holder is eligible for tax-financed social compensation. They then receive the difference between the average add-on premium and the two-percent-threshold with their salary or pension payment i.e., their income-dependent contribution is reduced by this difference. The average add-on premi-um is calculated according to Section 272a, Subsection 1 of the GKV-FinG “based on the difference between the sickness funds' estimated annual expenditure and the health care fund's estimated annual income [...].” Further, Subsection 2 states that: “After analyzing the results presented by of the Council of Experts, the Federal Ministry of Health shall determine the average add-on premium for the subsequent year in euros with the consent of the Federal Ministry of Finance [Bundes-ministerium der Finanzen].”
The New Social Compensation Scheme is Incentive-Compatible
As a result of the reform, the social compensation scheme was restructured to increase its incentive com-
patibility. As policy holders who receive tax-financed social compensation still have to pay the full add-on premium, it is worth them switching to sickness funds which charge a small or no add-on premium. This is a very unproblematic process and does not conflict with the social acceptability of the add-on premiums. Those insured by sickness funds which only charge a small (or no) add-on premium can even receive social compensa-tion which is higher than the add-on premium itself. On the whole, from the point of view of incentive compati-bility, the reform can certainly be regarded as success-ful. However, the new social compensation scheme is occasionally criticized as being too bureaucratic.
As the health care fund's income for both 2011 and 2012 exceeds the estimated expenditure of the sickness funds, the current average add-on premium is zero eu-ros. No social compensation is planned for 2012 either as the health care fund's income is enough to cover forecast sickness fund expenditure in its entirety.
Example:
Policy holder I: Policy holder II:
Income: 1,000 euros
Income: 600 euros
2-percent threshold1: 20 euros 2-percent threshold: 12 euros
Add-on premium charged by sickness fund A:
25 euros Add-on premium char-ged by sickness fund B:
6 euros
Share of income: 2.50 % Share of income: 1.00%
1 Based on income subject to health insurance contributions.
Scenario A: average add-on premium of 0 euros Result: no social subsidy is awarded.
Scenario B: average add-on premium of 20 euros Result: policy holder I receives no social subsidy but could save 19 euros by switching to sickness fund B. Policy holder II receives an eight-euro reimbursement. subsidy with their salary or pension payment, indepen-dent of the actual add-on premium charged.
Box 3
further Development of the social compensation scheme by the shI financing act 2010
a ten euro higher monthly contribution, the switching probability increased by six percentage points.
23DIW Economic Bulletin 2.2012
aDD-on PREmIums IncREasE PRIcE tRansPaREncy—moRE PolIcy holDERs sWItch hEalth Plans*
sickness funds listed in Table 2 intend to drop the add-on premium again during the course of 2012.23 From a competition point of view, however, it would be preferab-le if there were greater price differentiation between the sickness funds. The government would be able to achie-ve this by capping transfers from the health care fund to the sickness funds at 95 or 98 percent, for example.24 Planned transfers for 2012 amount to 185 billion euros, five percent less would be equal to 9.25 billion euros or 15 euros per member per month. This would, however, be a politically brave step as the increasing reserves in the health care fund are already now inciting envy.25 As it is undisputed that SHI expenditure will, however, con-tinue to increase in the future, the growing fund reser-ves are, at most, a short-term phenomenon.
The GKV-FinG explicitly states that future increases in expenditure may only be covered by add-on premiums and not by increasing the uniform contribution rate or through higher tax subsidies. However, due to the bad
23 This is primarily due to the good financial position of the SHI sickness funds, which is, for the most part, the result of a specific effect: the health care fund allocates monthly advance payments to the individual sickness funds. These are based on the total SHI expenditure estimate which is carried out in the fall of the previous year by the Council of Experts (Schätzerkreis) of the German Federal (Social) Insurance Office. In the previous year, the Council of Experts forecast an increase in statutory health insurance expenditure of 4.3 percent. However, in reality the increase was only 2.8 percent. This means that the individual sickness funds are currently receiving more money from the health care fund than they actually need to cover their expenditure. The overestimated development of statutory health insurance expenditure can be traced back to the German Government‘s pharmaceuticals austerity package (Act on the Reform of the Market for Medicinal Products (Gesetz zur Neuordnung des Arzneimittelmarktes, AMNOG)). Pharmaceutical expenditure dropped by 6.3 percent in the first two quarters of 2011 for the first time in many years. German Ministry of Health (Bundesministerium für Gesundheit, BMG (2011)): press release of 05/09/2011, www.bmg.bund.de/ministerium/presse/pressemitteilungen/2011-03/gkv-finanzentwicklung-1-halbjahr-2011.html)
24 The 0.3 percent point reduction in the premium pricestandardized contribution rate which is currently being discussed would not necessarily lead to more add-on premiums, as the health care fund would still have sufficient reserves to completely cover all sickness funds‘ expenditure. Moreover, this would strengthen the impression that the Government behaves inconsistently, as the overall contribution rate was only codified in Volume 5 of the German Social Insurance Code (SGB V) at the beginning of the year. If the fund were to have a sudden deficit due to an economic slowdown, demands for a further increase in the contribution rate would doubtless not fall on deaf ears.
25 See "Krankenkassen sitzen auf 10 Milliarden Euro,” Handelsblatt, September 15, 2011.
At the same time, representative SOEP data also shows that it is primarily the young, healthy and childless po-licy holders who have an above average rate of switching health plans. This is a predictable result of non-contri-butory family insurance as the costs of an increased pre-mium price work out less per person in this case. A pos-sible explanation as to why older people are less likely to switch health plans could be higher switching costs due to more limited internet access. Alternative expla-nations refer to habitual effects or brand loyalty resul-ting from longstanding membership.
Dubious Premium Price Increases at the beginning of 2011
On January 1, 2011 in the course of the implementation of the Statutory Health Insurance Financing Act (GKV-FinG), the overall uniform contribution rate was incre-ased again to 15.5 percent after having been temporari-ly reduced to 14.9 percent on July 1, 2009. The official argument given by the German Government to justify the increase, which came into effect at the beginning of 2011, was that the standardized contribution rate was supposedly only previously cut as part of the economic stimulus package.20 However, this is only half the truth as the initial standardized contribution rate which was fixed at 15.5 percent on January 1, 2009 was heavily cri-ticized as being too high. With the increase to 15.5 per-cent on January 1, 2011 the German government obvi-ously wanted to buy some peace on the health care front until the next General Elections in 2013 and counter-act the threat from various sickness funds to introdu-ce add-on premiums. Moreover, this helped the govern-ment avoid having to pilot the new social compensati-on scheme (Box 3).
The fear is that the generous contribution rate increa-se has thwarted an effective instrument for fostering competition between sickness funds.21 The big funds charging add-on premiums such as DAK or KKH-Alli-anz have already announced that they are going to dis-card the premium again in spring 2012.22 Almost all the
20 See The Federal Ministry of Health (Bundesministerium für Gesundheit, BMG), available online at: www.bmg.bund.de/krankenversicherung/gesundheitsreform/zusatzbeitrag.html
21 If the contribution rate were not to be increased by 0.6 percentage points, the health care fund would still have recorded a surplus of approximately two billion euros at the end of 2011 year end due to the stable economic situation and the unexpectedly low sickness fund transfersexpenditures. Moreover, the law has stipulated a three billion euro minimum reserve as well as two billion euros for tax-financed social compensation from 2012 to 2014. Federal Ministry of Health (Bundesministerium für Gesundheit, BMG (2011)): press release of 05/09/2011.
22 However, this is yet to be approved by the German Federal (Social) Insurance Office (Bundesversicherungsamt, BVA).

DIW Economic Bulletin 2.201224
aDD-on PREmIums IncREasE PRIcE tRansPaREncy—moRE PolIcy holDERs sWItch hEalth Plans*
reputation of the health care fund and its add-on premi-ums, this announcement has little credence.26
If the government does not have the courage to cap sick-ness fund transfers, it should at least urge the financi-ally strong sickness funds to make more use of the pre-mium reimbursement instrument. At year end, some sickness funds had pooled reserves of more than three billion euros.
conclusion
The primary goal of the health care reform implemented by the Grand Coalition and effective as of 2009 was to make the price differences between the sickness funds more transparent and, thus, more consumer-friendly. This aimed to increase the policy holders’ willingness to switch health plans and, thus, foster competition bet-ween the sickness funds. This goal was achieved. The standardization of contribution rates led to price diffe-rences between health plans being expressed in abso-lute euro values as add-on and reimbursed premiums. This resulted in a strong increase in the willingness to switch health plans of those policy holders who were being charged add-on premiums. This, in turn, led to both big PHI funds, which had been charging add-on premiums since spring 2010, losing approximately 7.5 percent of their members. Add-on premiums doubled the switching probability of those affected from five to ten percent.
The health care fund refom works by making it much easier for the policy holder to identify the price signal for the add-on premium than with the previous contri-bution rate differences. This, in turn, significantly in-creases their willingness to switch health plans. This should also lead to an increase in price competition and efficiency. There exists still potential to decrease costs and increase efficiency maintaining quality of care; for example in efficiency reserves for the sickness funds. One way of ensuring this would be to reduce adminis-
26 Moreover, there are, at least in part, inconsistencies between these government statements and the current wording of the SGB V. It implies that total sickness fund expenditure will be equalized in compliance with the health care fund‘s provisions. This would mean that the fund‘s ability to cover all health care expenditure in the long-term is (significantly) below 100 percent. Simultaneously, a minimum reserve (Section 271, 2), reserves for tax-financed social compensation, and tax subsidies (Sections 221, 221a, 221b) are stipulated by law. Section 271, Subsection 3 states: “If the liquidity reserve is not sufficient to carry out all transfers, the Government shall provide the health care fund with an interest-free liquidity loan to the sum of the missing amount. The loan shall be paid back during the given fiscal year. Repayment by year end shall be ensured using appropriate measures.” It remains unclear what is meant by “appropriate measures”.
trative costs , where there is potential for savings, wit-hout impairing the funds’ performance.27
Regrettably, the health care fund and add-on premiums have a rather negative public image and are either vili-fied as “bureaucratic monsters” or a step on the slippery slope into ”GDR-style state-controlled socialized medici-ne”. In response, the government should be defending its chosen path with greater conviction and, moreover, should refrain from further hampering the add-on pre-mium instrument with more increases in the overall contribution rate. In order to prevent the competition bet-ween insurance companies coming to a halt, the govern-ment should ensure that, in 2012 and in the more dis-tant future, a significant price differentiation is main-tained between the sickness funds. This can be made possible through greater premium reimbursements by the most financially strong sickness funds.
Efficiency in the market reserves could be further incre-ased if there were greater differences between the sick-ness funds in terms of the range of benefits offered. If, for example—in a strictly legally regulated way—the funds had the option of selective contracting – entering into contracts with individual hospitals covering specific services –, they would be able to pass on the efficiency pressure exerted by the health care fund to the service provider. The sickness funds would then, for example, have the option of sending their policy holders who have been waiting for operations for some time, selectively to those hospitals providing the best quality or most effici-ent care.28 The present price competition could then de-velop into a real quality competition—to the benefit of the policy holder. The willingness of the policy holders to select the sickness fund that is most suited to them is essential to successful competition. Policy holders have proven over the last two years that they are increasingly prepared to do this.
Peter Eibich is a Student Assistant at the SOEP | [email protected]
Dr. Hendrik Schmitz is a Junior Professor at the University of Duisburg-Essen and a researcher at the Rhine-Westphalia Institute for Economic Research (RWI) | [email protected]
Dr. Nicolas R. Ziebarth is an Assistant Professor at Cornell University and Research Affiliate at DIW Berlin | [email protected]
JEL: H51, I11, I18 Keywords: Health insurance, price framing, health plan switching, SOEP
Article first published as “Zusatzbeiträge erhöhen die Preistransparenz: mehr Versicherte wechseln die Krankenkasse”, in: DIW Wochenbericht Nr. 51/2011
27 See RWI and ADMED, Einsparpotenziale bei den Verwaltungskosten gesetzlicher Krankenversicherungen (2010). The authors estimate that the sickness funds have a possible administrative cost saving potential of a total of 1.4 billion euros per annum.
28 Of course, emergencies must be legally codified exceptions and, particularly in rural regions, the accessibility of the hospital must be guaranteed.

ExtEnt anD EffEcts of EmPloyEEs In GERmany foRGoInG vacatIon tImE
25DIW Economic Bulletin 2.2012
The collective pay agreement in the West German iron and steel industry of January 1979 laid the foundations for extending vacation entitlement of persons in full-time employment to 30 working days. Since January 1982, this regulation has applied to all age groups in the industry.1 Now, 30 years after the full implementa-tion of the new vacation regulation, the negotiated six weeks’ vacation entitlement is no longer an exception,2 but the norm for almost all persons in paid employment in Germany covered by collective agreements.3 What is now taken for granted by employees in Germany—six weeks of paid vacation, plus six to ten public holidays per year4—is the exception rather than the rule in inter-national standards. Consequently, at regular intervals, we see headlines such as “Germans Take Eight Weeks Off”5 and it results in Germans being called “world champion vacationers” or their country an “amusement park.” Yet, although the actual vacation entitlement of German employees is high compared to international standards, it does not necessarily follow that this entit-lement is also in fact used.6
In order to answer the question to what extent emplo-yees in Germany take their vacation entitlement, as part
1 See Section 14, Manteltarifvertrag für die Arbeiter, Angestellten und Auszubildenden, Eisen- und Stahlindustrie Nordrhein-Westfalen (collective agreement for blue and white-collar workers and trainees in the iron and steel industry in North Rhine-Westphalia) of 6 January 1979.
2 For most employees, the number of days of paid vacation is regulated according to industry in the relevant collective agreements and it is 30 days for most industries. See Table 3.3 in: Statistisches Taschenbuch Tarifpolitik 2011, Dusseldorf: WSI-Tarifarchiv, 2011.
3 In accordance with the German Federal Vacation Act, each employee working five days a week is entitled to 20 working days of annual leave. This is the equivalent of four working weeks‘ vacation. However, this stipulation is only a minimum requirement.
4 The exact number of statutory public holidays is both calendar based and varies between different regions.
5 IW-dienst, no. 43 (October 27, 2011), 6.
6 The employer is also free to grant employees more vacation. Conversely, the employee normally decides whether to actually use the vacation entitlement.
Around 37 percent of those in paid full-time employment in Germa-ny did not claim their full vacation entitlement last year. The number of vacation days actually taken by each employee was on average three days less than the full entitlement. This equates to around twelve percent of the overall volume of vacation entitlement not being used. This figure is corroborated by data from the German Socio-Economic Panel Study (SOEP) collected by DIW Berlin together with the survey institute TNS Infratest Sozialforschung.
It has been found that younger employees use less of their vacation than older ones. Moreover, employees working for smaller compa-nies and persons who have joined a company more recently in parti-cular do not take their full vacation entitlement. Not taking vacation is linked to short-term increases in income. There is, however, also evidence that it affects quality of life.
Extent and Effects of Employees in Germany Forgoing Vacation Timeby Daniel D. schnitzlein

DIW Economic Bulletin 2.201226
ExtEnt anD EffEcts of EmPloyEEs In GERmany foRGoInG vacatIon tImE
of the population survey Socio-Economic Panel Study (SOEP), in the years 2000, 2005, and 2010, DIW Berlin, in cooperation with TNS Infratest, asked participants in the study detailed questions about their annual leave in the previous year (Box 1). As part of this report, detailed information about vacation entitlement and taking paid vacation in the relevant previous year is evaluated, that is, for the years 1999, 2004, and 2009.7
vacation Entitlement Reported by Employees below collective agreement average
The group of all persons in paid employment reported a vacation entitlement of only around 28 days for the year 2009. Approximately three percent of all employees re-ported they had not had any vacation entitlement at all. For full-time employees, the average vacation entitle-ment was around 29 days in all three years. Since em-ployees whose employment relationship did not begin until after January 1 have only pro rata entitlement to an-nual leave, their actual average vacation is somewhat lo-wer than the average entitlement of 30 days according to the collective agreement (Section A in Table 1). Although the same legal provisions and collective labor agreement
7 For a previous analysis of vacation taken by employees in Germany, see Saborowski, C., J. Schupp, and G.G. Wagner, „Urlaub in Deutschland: Erwerbstätige nutzen ihren Urlaubsanspruch oftmals nicht aus,“ Wochenbericht des DIW Berlin, no. 15 /(2004): 171–176.
regulations formally apply to part-time employees as to full-time employees, the lower vacation entitlement of around 25 days in 1999 and 2009 and just under 24 days in 2004 can be explained by the fact that part-time employees often not only have reduced working hours, but also work fewer days per week.8 This then leads to a proportional reduction of the vacation entitlement. Ap-prentices report approximately 26 days vacation entit-lement. Although in most cases they are employed full-time, in many collective agreements the vacation entit-lement varies according to age and is normally lower for younger people than for other employees.
As is to be expected, no major shifts in vacation entit-lement in the last ten years are evident from the sur-vey data. The lack of vacation entitlement is more com-mon among part-time than full-time employees. While around one percent of those working full-time report ha-ving no vacation entitlement at all, the corresponding figure for part-time employees was around eleven per-cent for 1999 and nine percent for 2009.
8 It should also be taken into account that marginally employed or temporary workers often have no entitlement to paid vacation.
Table 1
Paid vacation by Employment form
1999 2004 2009
A: Average paid vacation by employment form (in days)Full-time employees 29.1 29.0 29.0Part-time employees 24.9 23.8 25.0
Trainees, apprentices 25.8 26.1 25.8Total 28.2 27.8 28.0
B: Share of employees with no paid vacation in percentFull-time employees 1.0 1.0 0.9Part-time employees 11.4 11.9 9.0Trainees, apprentices 2.7 2.7 2.6Total 2.9 3.2 2.7
Statistics on persons in paid employment for the years 1999, 2004, and 2009. The self-employed, freelancers, teachers, and those in marginal or irregular em-ployment are not included. Data are weighted for each year using extrapolation factors.Source: SOEPv27, calculations by DIW Berlin.
© DIW Berlin 2012
Full-time employees have around 29 days of paid vacation on average.
Table 2
vacation taken by Employment form
1999 2004 2009
A: Number of days of vacation takenFull-time employees 25.9 25.7 25.9Part-time employees 21.6 20.7 22.1Trainees, apprentices 19.1 19.0 19.6Total 24.8 24.3 24.8
B: Average number of unused vacation daysFull-time employees 3.2 3.3 3.1Part-time employees 3.2 3.0 3.0Trainees, apprentices 6.8 7.1 6.2Total 3.4 3.5 3.2
C: Share of employees with unused vacation days in percentFull-time employees 33.6 36.5 36.8Part-time employees 28.7 31.2 31.6Trainees, apprentices 44.8 50.5 45.6Total 33.4 36.3 36.2
Statistics on persons in paid employment for the years 1999, 2004, and 2009. The self-employed, freelancers, teachers, and those in marginal or irregular em-ployment are not included. Data are weighted for each year using extrapolation factors. Source: SOEPv27, calculations by DIW Berlin.
© DIW Berlin 2012
Full-time and part-time employees have about three days of unused vacation per year on average.

27DIW Economic Bulletin 2.2012
ExtEnt anD EffEcts of EmPloyEEs In GERmany foRGoInG vacatIon tImE
full vacation Entitlement not used
Patterns of taking vacation also remained largely cons-tant over the period observed at 25 days for all paid em-ployees in 2009. Extrapolated figures show that around twelve percent of employees’ overall vacation entitle-ment was not used.9
9 Saborowski et al., „Urlaub in Deutschland“ report that seven percent of the overall vacation entitlement for 1999 was not used. The difference in these figures is essentially explained by a stronger focus on those in paid employment (not including teachers) in the present report.
Those in full-time employment take just under 26 days of vacation on average. Part-time employees f luctuate between just under 21 and 22 days of vacation, while ap-prentices take approximately 19 days of vacation on ave-rage in all three years (Section A in Table 2). Looking at the balance of vacation entitlement and vacation ac-tually taken, it can be seen that full-time and part-time employees have just over three unused days of vacation on average per year, while apprentices have seven days of unused vacation on average by the end of the year (Section B in Table 2). Accordingly, at 45 to 50 percent, the share of apprentices with a positive balance of vaca-
As part of the longitudinal German Socio-Economic Panel Study (SOEP), in cooperation with the survey TNS Infratest Sozialforschung, DIW Berlin has collected data on the social and economic situation of private households for West Germany since 1984 and for East Germany since 1990. Currently, over 20,000 adults in over 11,000 households are surveyed annually.1 Next to a set of core questions that are repeated every year, a number of additional questions on selected topics are included each year. Within this framework, questions on vacation entitlement and use of this were asked in 2000, 2005, und 2010. The responses to these questi-ons form the basis for the present analysis. The relevant selected questions are as follows:
2000:2
How many days of vacation did you take last year? Count •
work days only. If you don't know the exact number, please
estimate!
Possible answers: number of days/Haven't taken any •
vacation time
How many vacation days can you take according to your •
contract?
Possible answers: number of days/I have no contractually •
specified vacation time
1 Wagner, G.G., J. Göbel, P. Krause, R. Pischner, and I. Sieber, "Das Sozio-oekonomische Panel (SOEP): Multidisziplinäres Haushaltspanel und Kohortenstudie für Deutschland – Eine Einführung (für neue Datennutzer) mit einem Ausblick (für erfahrene Anwender)," AStA Wirtschafts- und Sozialstatistisches Archiv, no. 2, 2008.
2 For the full English version of the individual questionnaire for 2000, see http://www.diw.de/documents/dokumentenarchiv/17/diw_01.c.38991.de/fr_personen_e.409829.pdf.
2005/2010:3
How many paid vacation days do you receive per year?•
Possible answers: number of days/I don't get any paid •
vacation
How many days of paid vacation did you take last year? If •
you don't know exactly, please estimate!
Possible answers: number of days/I didn't get any paid •
vacation
The unused vacation days are calculated in the report as the difference between the specified vacation entitlement and the reported number of vacation days actually taken. If this difference is greater than zero, full vacation entitlement has not been used.
Only data of persons in paid employment are evaluated in the analyses because in contrast to the self-employed and freelancers, they have a clearly defined vacation entitlement. Also, data of teachers were not considered in the analyses, since for this group we cannot rule out frequent misinterpretations of vacation entitlement or vacation time and school holidays. Moreover, teachers are not free to choose when they take vacations but are tied to the school holidays.
3 For the full English version of the individual questionnaire for 2005, see http://www.diw.de/documents/dokumentenarchiv/17/diw_01.c.42702.de/personen_en_2005.pdf. For the full English version of the individual questionnaire for 2010, see http://www.diw.de/documents/dokumentenarchiv/17/diw_01.c.369775.de/soepfrabo_personen_2010_en.pdf.
Box 1
Questions on Paid vacation in the Previous year

DIW Economic Bulletin 2.201228
ExtEnt anD EffEcts of EmPloyEEs In GERmany foRGoInG vacatIon tImE
tion entitlement and vacation days is significantly gre-ater than in the other two groups. As regards full-time employees, 37 percent of respondents have unused va-cation days from 2009.
vacation Entitlement Increases with occupational status
Both entitlement to leave and the number of days actu-ally taken vary with occupational status. For instance, an unskilled worker has a vacation entitlement of 25.3 days in 2009, while a supervisor has a vacation entitle-ment of 29.1 days (Table 3). The highest vacation entit-lement in all three observation years is recorded by seni-or civil servants with around 31 days in 1999 and 2004,
and 32 days in 2009.10 Those who have the lowest entit-lement to vacation throughout are trainees and interns with around 19 days in 2009. Since interns in particu-lar frequently only have short-term employment relati-onships, they often have no vacation entitlement at all. Overall, it can be seen for all years that a higher occu-pational status is also linked to a higher entitlement to annual leave (Table 3). Regarding the number of unused vacation days, the correlation is no longer clear, howe-ver, and there are no distinct patterns related to speci-fic occupations (Table 3).
younger Employees or those new to a company most likely not to take vacation
Table 4 shows a breakdown—according to different so-cio-demographic characteristics—of the number of days of unused vacation that can either be carried over to the next year or expire. There are clear differences between the various age groups. While 15 to 24-year-olds have the highest rate of unused vacation days, the oldest emplo-yees (group aged 55 or over) have the fewest days of un-used vacation (Table 4). These findings are confirmed by the high number of unused days of vacation in the group of apprentices. A possible explanation for this behavior is that younger people in particular see their presence at work as an investment in their human capital and consequently take less vacation than older employees.11 Clear differences can also be seen for the various cate-gories of length of service with the company (Table 4).12 Those who have been with a company for less than six months have the highest number of days of unused va-cation. This is not surprising since many companies do not allow vacation to be taken during the probationary period. For employees with up to a year of service with the company, the level of unused leave is still similar. Here, too, it may be assumed that employees see their
10 This may be, inter alia, because they are entitled to additional paid leave as well as their vacation entitlement.
11 For an investment decision to be made, the costs of the investment must be weighed up against the gains. In this case, the costs consist of forgoing a day of vacation, while the gains are a higher income in the future. Since the gains from the human capital investment depend on the number of years still to be worked, the overall gains from the investment are higher for younger people than for older employees. For a similar mechanism with regard to unpaid additional work/overtime, see Pannenberg, M., „Long-Term Effects of Unpaid Overtime: Evidence for West-Germany,“ Scottish Journal of Political Economy, no. 52 (2) (2005): 177–193.
12 Respondents are asked about length of service with a company at the time of interview, while questions about annual leave refer to the previous year. Therefore, it cannot be ruled out that individual respondents who have been with a company for less than one year are reporting unused vacation days from their previous employment. However, over half of the interviews take place in the first quarter of a year. (See TNS Infratest Sozialforschung, „SOEP 2010 – Me-thodenbericht zum Befragungsjahr 2010 (Welle 27) des Sozio-oekonomischen Panels,“ SOEP Survey Papers, no. 75, series B. (2011) DIW Berlin.
Table 3
number of Days of Paid vacation and Days taken by Profession
1999 2004 2009
Paid vacation
Unused days
Paid vacation
Unused days
Paid vacation
Unused days
Industrial/technical apprentices 26.1 7.0 26.3 7.7 25.0 6.2Commercial trainees 25.7 6.7 26.8 6.9 27.2 6.3Unpaid trainees, interns 20.2 3.6 14.2 5.3 (18.7) (4.6)
Unskilled workers 23.4 4.1 22.7 3.4 25.3 5.9Semi-skilled workers 27.6 3.7 27.9 3.3 26.8 2.5Trained and skilled workers 28.5 2.6 28.3 3.0 28.2 3.1Supervisors and team leaders 29.3 3.4 29.4 3.2 29.1 3.2Master craftsmen, site managers 28.4 3.9 28.4 5.2 26.8 3.6Industrial master craftsmen and factory supervisors
29.1 4.0 29.9 1.8 30.8 1.8
Salaried employees without qualifications 24.9 3.0 23.8 2.7 23.4 4.0Salaried employees in low-qualified positions 28.1 3.5 27.1 3.0 27.7 2.9Salaried employees in qualified positions 28.8 2.9 28.4 2.9 28.7 2.5Salaried employees in highly qualified positions, managers 29.6 3.3 29.3 4.0 29.0 3.4Salaried employees with extensive management responsibilities 30.4 7.5 27.5 5.2 28.7 4.6
Civil servants in the sub-clerical or clerical service class 29.6 2.7 29.6 2.3 29.0 2.1Civil servants in the executive or administrative class 29.8 2.3 30.1 2.9 30.2 3.4Senior civil servants 30.9 1.6 30.7 3.6 32.0 5.2
Statistics on persons in paid employment for the years 1999, 2004, and 2009. The self-employed, freelan-cers, teachers, and those in marginal or irregular employment are not included. Data are weighted for each year using extrapolation factors. Values in brackets are based on fewer than 30 observations. Source: SOEPv27, calculations by DIW Berlin.
© DIW Berlin 2012
The higher the occupational status, the higher the vacation entitlement normally is.
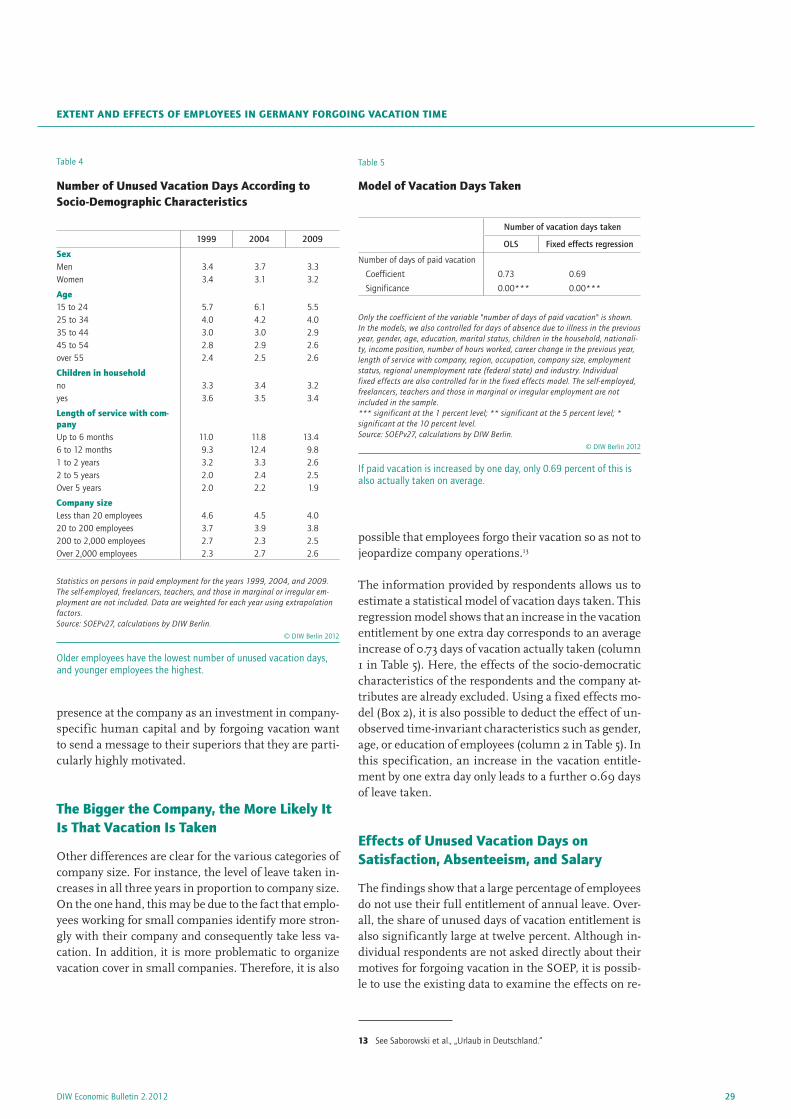
29DIW Economic Bulletin 2.2012
ExtEnt anD EffEcts of EmPloyEEs In GERmany foRGoInG vacatIon tImE
presence at the company as an investment in company-specific human capital and by forgoing vacation want to send a message to their superiors that they are parti-cularly highly motivated.
the bigger the company, the more likely It Is that vacation Is taken
Other differences are clear for the various categories of company size. For instance, the level of leave taken in-creases in all three years in proportion to company size. On the one hand, this may be due to the fact that emplo-yees working for small companies identify more stron-gly with their company and consequently take less va-cation. In addition, it is more problematic to organize vacation cover in small companies. Therefore, it is also
possible that employees forgo their vacation so as not to jeopardize company operations.13
The information provided by respondents allows us to estimate a statistical model of vacation days taken. This regression model shows that an increase in the vacation entitlement by one extra day corresponds to an average increase of 0.73 days of vacation actually taken (column 1 in Table 5). Here, the effects of the socio-democratic characteristics of the respondents and the company at-tributes are already excluded. Using a fixed effects mo-del (Box 2), it is also possible to deduct the effect of un-observed time-invariant characteristics such as gender, age, or education of employees (column 2 in Table 5). In this specification, an increase in the vacation entitle-ment by one extra day only leads to a further 0.69 days of leave taken.
Effects of unused vacation Days on satisfaction, absenteeism, and salary
The findings show that a large percentage of employees do not use their full entitlement of annual leave. Over-all, the share of unused days of vacation entitlement is also significantly large at twelve percent. Although in-dividual respondents are not asked directly about their motives for forgoing vacation in the SOEP, it is possib-le to use the existing data to examine the effects on re-
13 See Saborowski et al., „Urlaub in Deutschland.“
Table 4
number of unused vacation Days according to socio-Demographic characteristics
1999 2004 2009
sexMen 3.4 3.7 3.3Women 3.4 3.1 3.2
age15 to 24 5.7 6.1 5.525 to 34 4.0 4.2 4.035 to 44 3.0 3.0 2.945 to 54 2.8 2.9 2.6over 55 2.4 2.5 2.6
children in householdno 3.3 3.4 3.2yes 3.6 3.5 3.4
length of service with com-panyUp to 6 months 11.0 11.8 13.46 to 12 months 9.3 12.4 9.81 to 2 years 3.2 3.3 2.62 to 5 years 2.0 2.4 2.5Over 5 years 2.0 2.2 1.9
company sizeLess than 20 employees 4.6 4.5 4.020 to 200 employees 3.7 3.9 3.8200 to 2,000 employees 2.7 2.3 2.5Over 2,000 employees 2.3 2.7 2.6
Statistics on persons in paid employment for the years 1999, 2004, and 2009. The self-employed, freelancers, teachers, and those in marginal or irregular em-ployment are not included. Data are weighted for each year using extrapolation factors.Source: SOEPv27, calculations by DIW Berlin.
© DIW Berlin 2012
Older employees have the lowest number of unused vacation days, and younger employees the highest.
Table 5
model of vacation Days taken
Number of vacation days taken
OLS Fixed effects regression
Number of days of paid vacation
Coefficient 0.73 0.69
Significance 0.00*** 0.00***
Only the coefficient of the variable "number of days of paid vacation" is shown. In the models, we also controlled for days of absence due to illness in the previous year, gender, age, education, marital status, children in the household, nationali-ty, income position, number of hours worked, career change in the previous year, length of service with company, region, occupation, company size, employment status, regional unemployment rate (federal state) and industry. Individual fixed effects are also controlled for in the fixed effects model. The self-employed, freelancers, teachers and those in marginal or irregular employment are not included in the sample.*** significant at the 1 percent level; ** significant at the 5 percent level; * significant at the 10 percent level. Source: SOEPv27, calculations by DIW Berlin.
© DIW Berlin 2012
If paid vacation is increased by one day, only 0.69 percent of this is also actually taken on average.

DIW Economic Bulletin 2.201230
ExtEnt anD EffEcts of EmPloyEEs In GERmany foRGoInG vacatIon tImE
spondents of not making full use of vacation entitle-ment (Table 6).
For the groups who did not take their full vacation en-titlement in the previous year, no significant differen-ces can be seen (value in the significance column, indi-cating the statistical error probability, in Table 6 is less than 0.1) in their life satisfaction or job satisfaction (li-nes 1 and 2 in Table 6). A clear significantly negative effect on the level of satisfaction with leisure time and thus a loss of subjective well-being is evident, however (line 4 in Table 6). This proves that not taking vacation days is a matter of an individual optimization phenome-non, whereby money and career are exchanged against leisure time.
taking less leave: bad for health, Good for Income
Since the main aim of a vacation is for the employee to relax and regenerate his or her capacity to work, possi-ble effects on the individual’s health are examined. For
instance, those who did not use their annual vacation in the previous year also record significantly more ab-sences (line 5 in Table 6). The direction of the effect is not clear, however. On the one hand, it is possible that not taking vacation has a negative impact on health and this leads to a higher number of absences from work. On the other hand, it may also be due to an employee suffe-ring from prolonged illness, which in turn leads both to a higher number of absences and—as a result of these absences—to not taking full vacation entitlement. The data can, however, also be used to show that even with statistical control for the state of health, not taking all leave in the previous year has a robust negative effect on employees’ subjective satisfaction with their own health (line 3 in Table 6).14 However, a positive effect can also be seen: those who did not take all their vacation in the previous year earned 0.39 euros per hour more in the following year, compared to those who did take their va-cation (line 6 in Table 6). This supports the explanation that forgoing vacation may be seen as a human capital
14 The number of days of absence in the previous year has already been controlled for in this model.
In econometric models, particularly if these are based on cross-sectional data (data for only one observation per unit of analysis), the problem frequently arises that it is not possible to observe important characteristics of the analytical units (for example, individuals). In many contexts, it may happen that these unobserved charac-teristics distort the estimated effects of the observable characteristics.
A classic example from labor economics is that the effect of schooling on the current income is estima-ted. One unobserved characteristic of respondents is general intelligence, independent of knowledge gained at school. It may be assumed that respondents' general intelligence correlates positively with their income and their level of schooling. If a model is now estimated without taking into account this factor, the real effect of schooling is overestimated, since this also includes components of the effects of intelligence independent of schooling in this example. In the present report, a non-observable factor is respondents' work ethics ("motivation at work"), which most probably affects earnings, for instance.
A possible methodological solution to this problem is to use longitudinal data (repeat surveys of the same units, here: individuals) such as the German Socio-Economic Panel Study (SOEP). Fixed effects models can be estimated using these datasets.1 The advantage of these models is that information is available for several observation times for the same unit. Within the frame-work of this model, it is possible to control for time-invariant unobserved characteristics of respondents, that is, the effects of unobserved characteristics that do not change over time ("fixed effects"). The general work ethics as a form of personality trait may be a fixed effect. Although the effects of these characteristics cannot be directly identified, the effects of the obser-vable characteristics can be estimated without bias, since the invariable fixed effects for several observation times of an analytical unit can be controlled for by taking into consideration the temporary differences of the dependent variables. The fixed effects are averaged out.
1 For details of the method used, see Baltagi, B.H., Econometric Analysis of Panel Data. 3rd ed. Chichester: John Wiley and Sons, 2011.
Box 2
fixed Effects model

31DIW Economic Bulletin 2.2012
ExtEnt anD EffEcts of EmPloyEEs In GERmany foRGoInG vacatIon tImE
investment. For the purposes of classifying the size of this effect, it is possible to make a comparison with the average gross hourly earnings of the respondents. For the group examined here, this was 14.1 euros in 2010. Thus, 0.39 euros corresponds to 2.8 percent of the ave-rage hourly earnings.15
conclusion
Analyses of the SOEP survey data confirm the gene-rally high vacation entitlement of German employees. At the same time, it has been found that up to 37 per-cent of people in full-time employment do not take their full annual leave. Particularly younger people, emplo-yees in smaller companies, and those who have joined a company more recently do not use their full vacation entitlement. The consequences of not making full use of leave are, on the one hand, a significant deterioration of satisfaction with leisure time and health, combined with an increase in absences from work due to illness
15 Here, too, the effects of the socio-demographic characteristics of the respondents, company attributes, and time-invariant characteristics of the respondents (for example, work ethics, skills) are already controlled for in all models (see note below Table 6).
and, on the other hand, a significant salary increase. The findings lead us to conclude that even if not taking vacation in the short term is linked to better career pro-spects and higher earnings, it also has the effect of im-pairing quality of life.
Daniel D. Schnitzlein is a Research Associate at the longitudinal German Socio-Economic Panel Study (SOEP) at DIW Berlin | [email protected]
JEL: J63, J22, J24 Keywords: Vacation, SOEP, labor supply
Article first published as “Umfang und Folgen der Nichtinanspruchnahme von Urlaub in Deutschland”, in: DIW Wochenbericht Nr. 51/52/2011
Table 6
Effects of not taking vacationFindings from the Fixed Effects Regressions
Vacation not Taken in the Previous Year
Coefficient Significance
Life satisfaction –0.05 0.12
Job satisfaction –0.01 0.85
Health satisfaction –0.06 0.09*
Leisure time satisfaction –0.14 0.00***
Absence (in days) 5.82 0.00***
Hourly wage1 0.39 0.03**
Only the coefficient of the variable "vacation not taken last year" is shown. In the models, we also controlled for days of absence due to illness in the previous year, gender, age, education, marital status, children in the household, nationality, income position, number of hours worked, career change in the previous year, length of service with company, region, occupation, company size, employment status, regional unemployment rate (federal state), industry, and individual fixed effects. Exceptions: the number of days of absence is not controlled for in the model used to explain absenteeism and the income position is not controlled for in the model used to explain hourly earnings. The self-employed, free-lancers, teachers and those in marginal or irregular employment are not included in the sample.*** significant at the 1 percent level; ** significant at the 5 percent level; * significant at the 10 percent level.1 Only those with hourly earnings of over 3.5 euros (at 2010 levels) are taken into account in the income regression. Source: SOEPv27; calculations by DIW Berlin.
© DIW Berlin 2012
Not taking annual leave has a negative effect on the quality of life, but a positive effect on hourly earnings.

DIW Economic Bulletin 2.201232
DIW bERlIn PublIcatIons
Discussion Papers Nr. 1186/2012 Carlos P. Barros, Guglielmo Maria Caporale, Luis A. Gil-Alana
Long Memory in German Energy Price Indices
This study examines the long-memory properties of German energy price indices (specifically, import and export prices, as well as producer and consumer prices) for hard coal, lignite, mi-neral oil and natural gas adopting a fractional integration modelling framework. The analysis is undertaken using monthly data from January 2000 to August 2011. The results suggest nonstationary long memory in the series (with orders of integration equal to or higher than 1) when breaks are not allowed for. However, endogenous break tests indicate a single break in all series except for producer prices for lignite for which two breaks are detected. When such breaks are taken into account, and with autocorrelated disturbances, evidence of mean reversi-
on is found in practically all cases.
JEL-Classification: C32, E30 Keywords:Energy prices, Germany, fractional integration, persistence, breaks and outliers www.diw.de/publikationen/diskussionspapiere
Discussion Papers
Long Memory in German Energy Price Indices
Carlos P. Barros, Guglielmo Maria Caporale and Luis A. Gil–Alana
1186
Deutsches Institut für Wirtschaftsforschung 2012