ECONOMICS AND VALUATION OF BIODIVERSITY
279
ECONOMICS AND VALUATION OF BIODIVERSITY Thematic Working Group Report December-2002 Theme Co-ordinator Prof. Gopal K Kadekodi Research Professor Centre for Multi-Disciplinary Development Research, Dharwad Secretariat Centre for Multi-Disciplinary Development Research, Dharwad National Co-ordinator: Dr.Ashish Kothari Kalpavriksh Pune National Biodiversity Strategy and Action Plan
Transcript of ECONOMICS AND VALUATION OF BIODIVERSITY

ECONOMICS AND VALUATION OF BIODIVERSITY
Thematic Working Group Report
December-2002
Theme Co-ordinatorProf. Gopal K Kadekodi
Research ProfessorCentre for Multi-Disciplinary Development Research, Dharwad
SecretariatCentre for Multi-Disciplinary Development Research, Dharwad
National Co-ordinator:Dr.Ashish Kothari
KalpavrikshPune
National Biodiversity Strategy and Action Plan

ECONOMICS AND VALUATION OF BIODIVERSITYTHEMATIC WORKING GROUP REPORT
i. Table of Contentsii. Abbreviations and Acronymsiii. Executive Summary
1. THE THEMATIC GROUP IN ACTION :
1. Introduction2. Construction of the Group3. Method of Functioning of the Group
2. BRIEF DESCRIPTION OF THE THEME
1. About the Theme2.Contribution to NBSAP Policy Formulation Process
3. ECONOMICS OF BIODIVERSITY: ITS RELEVANCE IN POLICIES AND ACTIONS
1. What is Economics of Biodiversity?2. Economic Reforms and Structural Adjustment Programme (SAP) in India3. World Trade Organisation (WTO) and Biodiversity Conservation4. The Role of the Corporate Sector5. Market Based Instruments in India6. Links with External Donor Agencies7. Monetisation and Pricing of Biodiversity Products and Services8. Links with Livelihood and Life Styles9. Strategy and Action on Economic Aspects10. From Economics to Valuation.
4. VALUING BIODIVERSITY
1. Why do we have to Value Biodiversity?2. Ethics and eco-systems3. Valuation should begin from eco-system functions4. What is the Value of Biodiversity5. Methods of Valuation: A Tour6. Economics Incentives, Methods and Instruments for Valuation7. Economics and Valuation : A summary of Select Indian Case Studies8. Beyond Valuation9. Strategy and Action Plan on Valuation
5. LESSON FROM ON GOING STUDIES ON VALUATION OF BIODIVERSITY
1. Experience of Wetland Valuation Studies – Worldwide2. Experience on Valuation of Forest Resources : A Case Study of Himachal Pradesh
Forest Accounting.3. Marine Biodiversity: Economics and Valuation4. Economics of Sacred Groves
6. ISSUES IN ECONOMIC MANAGEMENT OF BIODIVERSITY
1. Introduction2. Treatment of Indian Medical System3. Stakeholder Analysis4. Restructuring Joint Forest Management5. Animals and Forgotten Biodiversity
7. GAPS IN ECONOMIC APPROCAH TO BIODIVERITY CONSERVATION
1. Preamble2. Missing the Stakeholders in a market approach3. Missing perfect methods of ecological valuation4. Gap between Research and Practice5. Crossing the boundaries
8. ACTION PLAN AND STRATEGIES FOR NBSAP
1. Action towards bridging the gaps and setting the NBSAP process going2. On the external front : WTO, IPRs and TRIPs3. Actions on Government Budget Allocation4. Sharing the Responsibility on Resource Allocation5. Action Oriented Role for the Corporate Sector6. Action at the Fiscal and Monetary Policy Levels : on Market based Instruments7. Action on Pricing Policies8. Strategy and Action Plan on Valuation9. Action/Strategies on Natural Resources Accounting10. Strategy / Action on Indian Medicinal Systems11. Strategy / Action regarding Joint Forest Management12. Strategy and Action Plan for Marine Biodiversity Conservation13. Strategy and Action Programme for Stakeholders: NGOs, Donors, Financial
institutions, and Academia
AbbreviationsAIJ :Activities Implemented JointlyAnGR: Animal Genetic ResourcesASDP: Adjusted State Domestic Product AUSAID: Australian Agency for International DevelopmentBCPP: Biodiversity Conservation and Prioritization PlanBOD: Biological Oxygen DemandBPL: Below Poverty LineBPM: Ballarpur Paper MillsBV: Bequest ValueCBA: Cost Benefit AnalysisCBD: Convention on Bio-DiversityC&I: Criteria and IndicatorCISMHE: Centre for Indian Studies on Mountain and Himalayan EcologyCOD: Chemical Oxygen DemandCPR: Common Property ResourcesCR: Contingent RankingCSE: Centre for Science and EnvironmentCVM: Contingent Valuation MethodDANIDA: Danish International Development AgencyDC: Damage CostDFID: Development Fund for International DevelopmentDFO: Divisional Forest OfficerDUV: Direct Use ValueEEC: European Economic CommissionEIA: Environmental Impact Assessment ENDP: Environmentally Adjusted Net Domestic ProductESDP: Environmentally Adjusted State Domestic ProductETS: EU: European UnionEV: Existence ValueFAIDA: Food and Agricultural Integrated Development Action FAO: Food and Agriculture OrganisationFD: Forest DepartmentFDES: Framework for the Development of Environmental StatisticsFPC: Forest Protection CommitteeGDP: Gross Domestic ProductGEF: Global Environmental FacilityGIS: Geographical Information SystemGTZGW: Giga WattsHFD: Haryana Forest DepartmentHH: HouseholdHP: Himachal PradeshHRMS: Hill Resource Management SchoolICRISAT: International Council for Research in Semi-Arid TropicsIIHR

ILRIIOC: Indian Oil CorporationIPR: Intellectual Property RightsITC: Indian Tobacco CompanyITDGITCM: Individual Travel Cost MethodIUCN: International Union for Conservation of Nature IUV: Indirect Use ValueIVI: Importance Value IndexJFM: Joint Forest managementJVSKFWKM: KilometerM: Metric CubeMBI: Market Based InstrumentsMNC: Multi-national CorporationsMoEF: Ministry of Environment and ForestsMPI: Market Price IndexMPTDC: Madhya Pradesh Tourism Development CorporationMSY: Maximum Sustainable YieldMT: Metric tonneNAEDB: National Afforestation and Eco-Development Board NBSAP: National Biodiversity Strategy and Action PlanNCA: Net Cropped AreaNCT: National Capital TerritoryNDP: Net Domestic ProductNGO: Non-Governmental OrganisationNPV: Net Present ValueNSDP: Net State Domestic ProductNTFP: Non-Timber Forest ProductNWDB: National Wastelands Development BoardNUV: Non-Use ValueOECD: Organisation of Economic Cooperation and DevelopmentOECF:OV: Option ValuePE: Preventive ExpenditurePV: Present ValueR&D: Research and DevelopmentRLC: Relocation CostRPC: Replacement CostRSC: Restoration CostSA: Stakeholder AnalysisSAP: Structural Adjustment ProgrammeSC/ST: Schedule caste and schedule tribesSDP: State Domestic ProductSEEA: System of Environmental and Economic AccountsSIDA: Swedish International Development AgencySM: Simulated Market
SNA: System of National AccountsTCM: Travel Cost MethodTD: Tourism Department TERI: Tata Energy Research InstituteTEV: Total Economic ValueTVS: TV SundaramUK: United KingdomUS: United StatesUSA: United States of AmericaUNDP: United Nations Development ProgrammeUNSTAT: United Nations StatisticsUV: Use ValueVFC: Village Protection CommitteeWRI: World Resources InstituteWWF: World Wildlife FundWUA: Water Users’ AssociationWTA: Willingness to AcceptWTP: Willingness to PayZTCM: Zonal Travel Cost Method
LOCAL TERMS USED IN THE REPORTChapters
Three Four Five Six Five

RampatreMohuvaKaranjiSingli-mingliDhupAmlaAnarKathaArya Vaidya Pharmacy Ltd.AdivasiTendu leafMahuva flowerKadikalPungam kernelsPoochakaiChikakaiAnolaChironjiOppageJanapara vigyana samstheBhabbarPatta Balwadi
KenduSalDhirKhair(kil)SalarBelSishamKheraFirDeodarOakSainAxe hewn (karries)DimdimasSide slabs (passellas)HakaresRound ballisLogs geltusKhair billetsKailChilKokatSimbolNeejaPopularSirseKikarGoldmoreMulberyTalaabsHaigadTaraiBhiga
Trapa Malbar kinoFir/spruceBank oakMohru oakKarsuMapleKatha (acacia katechu)Chil (pinus roxbughis)Deodar (cedrus deodar)Venchur
AyurvedicPanchayatCenchuriyia and sutanChakriya vikas pranali
EXECUTIVE SUMMARY OF BSAP ON ECONOMIC VALUE OF BIODIVERSITY
1. Brief introduction about biodiversity theme
1.1 Constitution of the GroupThe Thematic Working Group on Economics and Valuation of Biodiversity (TWGEVB) was constituted as part of the NBSAP process in India. It had nine regular members; several special invitees joined the Group from time to time. They included coordinators of several other Thematic and Regional Groups and TPCG Members, and two external advisors who are linked to this Thematic Group.
1.2 Functioning of the Group The Group carried out extensive literature search and reviewed the methodologies of valuation. It held consultations with a large section of scientists, researchers, policy makers and representatives of corporate sector etc. Since the report should have an Action Plan, a case study approach is adopted. For this purpose, several case studies are invited from among the practitioners and researchers from India and abroad.
1.3 Links between the GroupsThe thematic Group on Economics and Valuation had direct links with several other Thematic Working Groups, the major ones are Livelihood and Life Styles, Domesticated Biodiversity, Wild Animals, Wild Plants, Terrestrial Ecosystems, Natural Aquatic Ecosystems, Micro-organisms, Access, Benefit Sharing, and Education and Training.
2. Brief Description of major biodiversity related issues of the theme 2.1: What is Economics of Biodiversity?
The discipline of economics is commonly understood to deal with production, consumption, generation of wealth and welfare to humankind. Hence valuation is part of its methodology. Biodiversity is enabled by a number of resources, renewable and non-renewable ones. But attributes of biological diversity are often seen as secondary as they have no immediate productive values; and their loss or gain are seen to represent no immediate costs or benefits. What is new in this Economics of Biodiversity then? Essentially, it is introducing the appropriate economic methods and tools to deal with natural and biodiversity resources and to redress some of the new concerns in the emerging world today. Three major concerns are dealt under this theme.
¬ First, the effects of structural adjustment (SAP) and economic reforms process that India has launched since 1991: The major ones that affect biodiversity at large are:
o Resource allocation on biodiversity related activities (such as forestry and wild life protection, eco-development and restoration, advocacy, research, training and so on);
o The growth of MNC’s in the pharmaceutical and drug sector overshadowing Indian medicinal system;
o liberalisation affecting the export and import of biodiversity linked products; hence a new domain of pricing mechanisms;
o Structural change in domestic food processing (from traditional to modern food processing as an industry); changes in quality and styles of life; and
o Growth of corporate culture.
¬ The second concern is about the ‘break away state’ in the relationship between biodiversity and economics or between ecology and economics. Apart from economic functions, natural and biological resources also contribute in several other ways to the ecology, briefly termed as ecological functions. As part of NBSAP, they need to be valued together. Furthermore, in decision-making regarding the management of natural resources, the values that communities and individuals put to biodiversity on cultural, livelihood, survival and spiritual aspects of life need to be accounted for.
¬ Thirdly, in every society, there are many stakeholders who are involved in production, distribution and consumption. When it comes to biodiversity, they are local communities, small business dealers, state agencies, corporate sector, tourists, multi-national corporations, scientists, exporters and importers, and many more. The relationship between different stakeholders can also be asymmetric, depending upon the political and money powers, and other social relations. Thus the concern is identification, prioritisation and budgeting for stakeholders.
3.0On Going Initiatives as part of the NBSAP Process
The Working Group basically addressed to these three basic concerns of the NBSAP process in India. The major steps or initiatives from this Working Group are summarised below:
3.1: Budget allocation: In the central and state government budget presentations in India, there are no exclusive financial resource allocations under the heading ‘biodiversity’. However, both at the central and state government levels, several budgetary allocations are made which have indirect and to some extent direct bearings upon biodiversity. Such budgetary methods have no positive influence on biodiversity conservation. The state biodiversity resources in India has been severely affected by the Economic Reforms Process, as evident from the falling rate budget allocations on biodiversity conservation.
3.2: WTO and Biodiversity ConservationThe WTO Final Act contains the following four major agreements, which have relevance to environment and trade. They are:
• Agreement on Agriculture• Agreement on trade related aspects of Intellectual property rights (TRIPS)• Agreements on Subsidies and Countervailing Measures, and• Agreement on Technical Barriers to Trade (e.g., SPS).
Among them, the most relevant Agreements directed for biodiversity conservation are on Agriculture, Intellectual Property Rights (IPRs), and on Sanitary and

Phyto-Sanitary (SPS). The 1988 New Policy on Seed Development (NPSD) liberalised import of high quality seeds, which in conjunction with the general economic liberalisation regime has opened the Indian seed market to foreign seed producers. The ostensible strategy of the NPSD can affect the farmers in India. TRIPs Agreement of GATT 1994 provides much stricter patent protection to the intellectual properties related to trade; but Indian farmers are not given sufficient information, education and time to get on to this new culture. 3.3: A Barriers to forest products trade
In recent years there has been a proliferation of additional policies and regulations that have the potential of becoming new barriers to the forest products trade. These barriers include:
1. Export restrictions by developing countries to encourage domestic processing of tropical timber for export;
2. Environmental and trade restrictions on production and exports in developing countries that affects international trade patterns;
3. Quantitative restrictions on imports of unsustainably produced timber products, and4. The use of eco-labelling and green certification as import barriers.
3.4: Command and Control Methods:
Pollutions affect the biodiversity resources very adversely. In India the Central and State Pollution Control Boards are established after 1986 Environment Protection Act, to stop and reverse the process through technically established (and not society based) environmental standards (e.g., MINAS). Such command-and-controls (CAC) instruments are in the form of fines, penalties and threats of legal action for closure of the factories and imprisonment of the owners who violate the environmental laws and regulations. They have not worked at all, despite of several orders from Supreme and High Courts.
3.5: Market Based Instruments in India
Market based instruments such as tax-standards approach or incentives for establishing combined effluent treatment plants, introduction of user charges or prices, deposit refund schemes, incentives for relocation etc., are being introduced, but rather too slowly.The price based instruments are in the form of taxes and subsidies to deal with
detrimental and beneficial environmental externalities in production and consumption. The pricing system for most of the biodiversity products does not function well. Under the NBSAP process, for several reasons, it is intended to bring transparency and ‘rights to information’ on the margins between the collectors’ price and the market price:
o For the collectors and local communities it should be an empowerment and income avenue,
o Even the local communities should realize its true worth or value, o The gains from the natural resource extraction and use should by and large be based on
in-situ distributional benefits,o It should be corrective for sustainable rates extractions (based on the concept of
carrying capacity), proper use of land and water resources and ecological conservation.
3.6: Key Gaps in Economics of Valuation of Biodiversity

The first revelation was the fact that even the economic valuation are not being carried out on biodiversity resources, leave the issue of ecological valuations apart. After surveying a large number of existing case studies the Group reached to the conclusion that there is a need to fill this gap very significantly. Specifically the areas to be addressed are:
• Valuation of wetlands, marine and coastal resources
• Valuation of Water and budgeting of water resources
• Valuation of Forest as a biodiversity resource: Redefining JFM
• Teaching of the techniques of valuation: Gap between research and practice
• Data base on biodiversity resources
• Redefining Community based strategies such as stake holder analysis
• Specifically addressing to the issue of medicinal plants and domesticated animals
• Introducing multi-disciplinarily in valuation approaches
4. Proposed Strategy and Action Plans
4.1: On Budget Allocation:
Government Budget allocation for the Ministry of Environment and Forests is at present a mixed bag. It be related to biodiversity areas and activities, and not based on anthropogenic activities. In order to work out the specific rates of resource allocation for various components, an Expert Group may have to go in to these. The degree of criticality of these areas, the livelihood dependency on them, the long term sustainability of those resources etc., will have to be used as the relevant criteria. Budget allocation can be based on (i) research and development, (ii) for protection and conservation, (iii) for promotion and awareness, (iv) for short term and long term planning etc.
Till such time a formula is worked out, the present Thematic Working Group recommends maintaining a 3% share of total revenue expenditure and another 3% share in capital expenditure exclusively for natural resource development in the states. At the MoEF level, at least 6% of GDP be allocated for all activities including biodiversity, and 3% exclusively fro forestry and wildlife preservation, but addressed to biodiversity.
4.2: Sharing the Responsibility on Resource MobilisationThe responsibility of resource mobilization is not only with the government abut also
lies with the corporate sector, external donor sector and public at large This sharing mechanism also need to be fully understood and worked out at least once in five years. There is the need to introduce proper market based instruments to budget and regulate the use of biodiversity related resources. Specifically in the area of water resource management, use of forest resources and marine resources, the types of market based instruments would differ. Separate studies are required to be carried out on this issue of appropriate instruments, to look in to who gains and who loses from such market based instruments.
4.3:Action and strategy regarding WTO-GATT matters 1. A share of profits made from the new variety goes, on behalf of the communities, into a
National Gene Fund. The Gene Fund should be the recipient of all revenues payable to the farming communities under various heads. The use of the money should not be restricted to conservation or for maintaining ex situ collections only. 2. The attempt at global standardization and uniformity by way of TRIPs agreement is in conflict with the main thrust of the Rio Earth Summit of 1992 that set out the conditions for sustainable development. These two reveal two contrasting types of international approaches and norms. While the 1992 Earth Summit and the 1993 convention on bio-diversity (CBD) focused on ‘diversity’ as being fundamental to sustain life and development, TRIPs and WTO are pushing for ‘conformity’ to international standardized norms on patents, services, labour, investment and what not, irrespective of their history, ecology, level of economic development, etc. The areas of intellectual property that the TRIPs agreement cover are: copy right and related rights; trademarks including service marks; geographical indications including appellations of origin; industrial designs; patents including the protection of new varieties of plants; the layout-designs of integrated circuits and undisclosed knowledge including trade secrets and test data. There is the need for perfect transparency in the patent and TRIP regulations down to the farmer levels.
4.4: Action Oriented Role for the Corporate sectorA key entry point for corporate sector is through NBSAP where its knowledge and
expertise can be utilized effectively. It should form part of its legitimate interests in its representation to the government on polices and programs, guidelines and other management supports. It should also respect and support the livelihoods and rights of communities dependent on biodiversity, and promote cultural diversity and values relevant to biodiversity. In fact, the companies may develop a formal biodiversity policy or incorporate biodiversity into its existing environmental policies. They should keep abreast of the discussions and developments relating to national guidelines for incentive measures, biosafety, equitable benefit-sharing, intellectual property rights, monitoring of biodiversity indicators and other related topics.
Several action components are proposed to achieve these.
¬ Act together with the farmers on at least two counts. First, they will have to get to the business of investing on ’seed development and supply of infrastructure’; second, they should enter in to a clearly defined ‘ buy back system, ensuring the right price.
¬ Interact closely with the state and central governments to pickup the threads hand in hand to promote biodiversity conservation. Financial resource pooling is one such approach. This is a matter of sharing responsibility in financing biodiversity conservation between the corporate sector state and central government, a process initiated by CII already.
¬ Develop in-house biodiversity policies and strategies to manage the biological resources the company affects and also respect the concerns of local communities and other stakeholders. Methods for education and training to instill a biodiversity conscious culture within company management should be explored.
¬ Share information, knowledge and practices with the local communities to develop a herbal based drug sector.
¬ Adopt measures, which ensure sustainable use of biological resources. The measures

may be explored for the moral responsibility of corporate sector going beyond monetary and material consideration such as respecting the sanctity of critical natural habitats and threatened species.
¬ Create awareness regarding the need for appropriate intellectual rights regimes, respecting the knowledge, innovations and practices of indigenous and local communities and ensuring that collection and use of biological and genetic resources is done within a framework/guidelines of such respect.
¬ Engage in active partnership amongst corporate sector, research institutions and biodiversity conservation organizations as well as with the general public and with local communities for the management of important species and ecosystems.
¬ Instituting incentives and awards for members of the corporate sector who adhere to a definition of "progressive" in terms of being biodiversity-friendly and respectful of local community livelihood rights.
4.5 : Action on pricing policies
Under the NBSAP process it is intended to reduce the gaps and margins between the collectors’ and the market price on biodiversity related resources. A direct approach of transactions from farmer to consumer should be developed (as is being done in Karnataka state). Other measures required are:
o The local collectors and communities should be the price setters, and they should be educated to realize its true worth or value,
o The gains from the natural resource extraction and use should by and large be based on in-situ distributional benefits,
o It should be corrective for sustainable extraction rates (based on the concept of carrying capacity), proper use of land and water resources and ecological conservation.
4.6 Strategy and Action Plan on Valuation
The major recommendations for the NBSAP process based on the experience with the methodology of Valuation are:Studies on economic valuation of various ecological functions of biodiversity should be
encouraged. There should be more research on methodologies for estimating non-use values.
The economic benefits of biodiversity enjoyed by the private sector companies including MNCs require special attention and there should be some mechanism to capture a portion of these benefits for investing biodiversity conservation programmes.
A Social Science based research institution be identified by MoEF, which can undertake studies on valuation on a continual basis, almost on the lines of EIA for project clearance. It should initiate to bring out a publication on rapid and cost effective valuation methodologies for valuing biodiversity.
Some of the specific actions required in valuation are: • For assessing ecological losses, the structure of the forest ecosystem is to be estimated
by three main ecological attributes viz. Importance value Index (IVI), population dynamics and species diversity, where as the functioning of the ecosystem is to be ascertained with the help of bio mass studies, litter fall and transfer of mineral within the various biotic and abiotic compartments of the ecosystem.
• All the forest types, as classified by Champion and Seth, the major ecological
function(s) and appropriate methodology of valuation be identified and demonstrated.• Specific attempts be made to bridge the data gaps on all types of biodiversity resources.• Precisely developed model studies of ecological valuation be developed (to explain the
problems of double counting, problems of benefit transfer methods, contingent valuation method, cost benefit analysis etc.).
4.7 Action/Strategies on Natural Resource Accounting. The progress on this at the national scale is very much limited. Some of the lessons fro
the on-going exercises are listed here for further actions.¬ The data base requirements for Natural Resource Accounting are quite high. Central
Statistical Organisation should have a separate wing to collect the necessary data exclusively for natural resource accountings.
¬ More and more studies on valuation be built-in the NBSAP process to address to aspects such as depletion, degradation, preservation, inter-generational values, dose-responses etc.
¬ Environmental economists and statisticians should continue to demonstrate the possibilities to adjust the domestic products for all the natural resource related issues, some of which may not directly appear in the traditional income accountings (e.g., biodiversity).
4.8: Strategy/ Actions on Indian medicinal systems
Under the NBSAP process, special attention must be given to develop Indian medicinal system. Several newer directions of actions and strategies are required for this:.
• Regular assessment of demand from the Ayurvedic and cosmetic sectors;• A comprehensive study needs to be undertaken on the economic impact of
ayurvedic industry on biodiversity conservation (using green accounting principles).• A forum to bring together industry, Forest Department, NGOs and others needs to
be established. They should deliberate upon the matters such as rates of extraction, federating on processing standards and management, pricing system etc.
• Finally, the legislation should distinguish different intermediaries and collectors of medicinal plants from forests. Sale of such products by cooperatives such as Girijan Co-operatives and other federations should not be equated with private contractors and middlemen of drug companies. Accordingly, ‘prior intimation’ provision of clause 7 of the proposed Biodiversity Legislation Bill should not apply to the former. Furthermore, the question of them being subjected to producing ‘legally procured certificates’ prior to transacting the raw materials to the Ayurvedic industry directly be examined again.
4.8: Strategy/Action regarding Joint Forest managementConsidering that JFM already covers over 13 percent of the recorded forest area of the
country and the area is likely to increase even more in the future, attempt should be made to include biodiversity conservation as one of the explicit objectives of the JFM programme. Some of the major actions needed are:
• There is the need to explore the link between biodiversity conservation and long term sustainability and community linkages of JFM.

• For this, the JFM Cell in MoEF should be restructured. There are a large number of studies on the performance of JFMs all over the country. Therefore, the National JFM Network and News Letter should carry the messages on biodiversity related issues and findings. Training programmes on alternative economic valuation methods should be organised for the officials of the Forest Department as well as NGOs active in the field of JFM.
• At the time of JFM micro-plan preparation, biodiversity conservation strategy should also be included in the micro-plan. Instead of using the standard Cost-Benefit Analysis, Stakeholder and Multi-criterion Analysis are to be introduced in the NBSAP process.

CHAPTER ONE
THE THEMATIC GROUP IN ACTION
1. Constitution of the Group
The Thematic Working Group on Economics and Valuation of Biodiversity
(TWGEVB) was constituted as part of the NBSAP process in India. Based on a request from
TPCG, Prof. Gopal K. Kadekodi agreed to be the Co-coordinator of this thematic working
group. The Group was constituted after taking into account of the suggestions made by TPCG.
The originally constituted group co-opted additional members as and when felt the need. Prof.
Kirit Parikh and Prof. Jyoti Parikh are invited as Advisors to the TWG. The Members
constituting the Group as on November 2001 are as follows:
Dr. Ashish Kothari: TPCG Representative for the GroupProf. Gopal K. Kadekodi: CoordinatorDr. Ramachandra Bhatta: MemberProf. Kanchan Chopra: MemberProf. A. Damodaran: MemberDr. Joydeep Gupta: MemberDr. J. B. Lal : MemberDr. T.R. Manoharan: MemberDr. M.K. Pandit: MemberDr. Sushil Saigal: Member
Advisors: Prof. K.S. Parikh and Prof. Jyoti Parikh
Addresses of the members are given in Annex ii
2. Method of Functioning of the Group
The Group adopted the following major course for it’s functioning:
• A Secretariat of the Working Group was set up at Centre for Multi-Disciplinary
Development Research, Dharwad. They coordinated the entire activity of the Working
Group, including maintaining liaison with Kalpavriksh and BCIL.
• Regular meetings once in every three months: Five meetings held in the course of one
and half years. They were held primarily in New Delhi and Bangalore and Goa.
• The Group invariably invited additional participants to each of the meetings. Among
them are coordinators of several Thematic and Regional Groups and TPCG Members,
who are linked to this thematic group.
• The Group also held consultations with a large section of scientists, researchers, policy
makers and representatives of corporate sector etc. A list of them is presented in Annex
iii.
• The Group also carried out extensive literature search and review on the methodologies
of valuation. They are reflected in the large Bibliography presented at the end of the
report, along with the major web-sites browsed.
• Since the report should have an Action Plan, a case study approach is used. For this
purpose, several case studies are invited from among the researchers from India and
abroad.
• The thematic Group on Economics and Valuation had direct links with several other
Thematic Working Groups. The other major Working Groups closely linked with this
TWG are Livelihood and Life Styles; Access and Benefit Sharing; Education;
Terrestrial Biodiversity; and Agri-Biodiversity. Constant interaction with these groups
were maintained by (a) inviting them to the deliberations of the Group, (b) exchanging
the documents with them, (c) requesting them on specific inputs.
• Constant link was maintained with TPCG Coordinator Dr. Ashish Kothari, who also
happens to be the representative of TPCG on the TWGEVB for all links.
• Participated in the annual NBSAP meetings held at New Delhi and made presentations
on the activities and progress of the Working Group.

CHAPTER TWO
BRIEF DESCRIPTION OF THE THEME
2.1: About the Theme
The theme to be addressed by this Working Group, is, in some sense, wrongly titled.
NBSAP in India has labelled it as Economics and Valuation of Biodiversity. Let it be clear at
the outset that Valuation also involves economics. Otherwise, the discipline of economics is
commonly understood to deal with production, consumption, generation of wealth and welfare
to humankind. This is enabled by a number of resources, renewable and non-renewable ones.
Biodiversity is defined as the totality of genes, different taxa and ecosystems in a region of the
world where each organism has its own function in the natural scheme of things but all are
dependent on each other for their survival. In this context, elements of biological diversity are
often seen as secondary as they have no immediate productive value; and their loss is seen to
represent no immediate cost. However, basic economics has much to contribute to the
understanding of biodiversity concerns and conservation, as was the case with land (dealt by
David Ricardo, or his student T.R. Malthus).
What is new in this Economics of Biodiversity then? Essentially, it is introducing the
appropriate economic theories, methods and tools to deal with natural resources and to redress
some of the new concerns in the emerging world today. Three major concerns are dealt under
this theme.
• First, with the process of structural adjustment (SAP) and economic reforms process that India has launched since 1991, various economic changes have taken place in the country. The major ones that affect biodiversity at large are:
o Resource allocation on biodiversity related activities (such as forestry and wild life protection, eco-development and restoration, advocacy, research, training and so on);
o The growth of MNC’s in the pharmaceutical and drug sector overshadowing Indian medicinal system;
o liberalisation affecting the export and import of biodiversity linked products;
o Structural change in domestic food processing (from traditional to modern food processing as an industry);
o Growth of corporate culture;o and many more.
• The second concern is about the ‘break away state’ in the relationship between biodiversity and economics or between ecology and economics. The recent SAP and Economic Reforms processes all over the world have brought challenges to economists and ecologists to think differently to develop means of integrating concerns about biodiversity into the calculation of economic wealth/well-being of a nation. Apart from economic functions, natural and biological resources also contribute in several other ways to the ecology, briefly termed as ecological functions. Both need to be valued together. Furthermore, in decision-making regarding the management of natural resources, the values that communities and individuals put to biodiversity on cultural, livelihood, survival and spiritual aspects of life need to be accounted for. Such an integrated approach rarely finds a place in the usual economic systems. Numerous methods of Valuation and Natural Resource Accounting have been evolved by now. The existing methods of valuation are to be tested, improved, put on the ground and used for redressing the adverse effects of SAP.
• Thirdly, in every society, there are many agents who play the game of production, distribution and consumption. When it comes to biodiversity, it is extremely difficult to define the stakeholders in any unique manner. They are local communities, small business dealers, state agencies, corporate sector, tourists, multi-national corporations, scientists, exporters and importers, and many more. The relationship between different stakeholders can also be asymmetric, depending upon the political and money powers, and other social relations. Thus the concern is identification of the orderings of stakeholders, based on certain economic concepts (such as Game theory).
The Working Group basically addressed to these three basic concerns of the NBSAP
process in India. The details of the theme, in terms of individual issues are listed in Annex 1.
2.2: Contribution to NBSAP Process
The theme of Economics and Valuation has been identified as one of the many other
themes to be addresses for the NBSAP process. This is not the place to define or redefine the
aims and objectives of NBSAP process. But, with the overall aim of a Strategy and Action
Plan on Biodiversity, the need to work within an integrated framework with most other
thematic groups was felt. The links between various thematic groups was discussed among the
Coordinators of all the Groups in a meeting held at New Delhi early in the NBSAP process.
The other major thematic groups with whom TWGEVB kept close links are:

• Livelihood and Life styles
• Access and Benefit Sharing
• Agri-biodiversity
• Environmental Education
Table 2.1 shows the possible links between an elaborated list of thematic working groups.
Table 2.1: Linkage between Economic and Valuation and other Thematic Working Groups
Thematic Group Types of linkagesLivelihood and Life styles Livelihood value of biodiversityDomesticated biodiversity Valuation of agro-biodiversityWild animals Valuation of wild speciesWild plant Plant use valuesTerrestrial ecosystems Valuation of ecosystemsNatural aquatic ecosystems Valuation of eco-systemsMicro-organisms Valuation of micro-organismsPolicies, Laws etc. Macro-economicsAccess benefit sharing etc. Valuation and IPRsEducation, Training etc. Educational component on economics and
valuation
Apart from these linkages between the thematic working groups, constant links were also
established with regional and sub-regional working groups as well.
The specific issues on which the TWGEVB interacted and contributed to their
deliberations are on identification of livelihood linkages between biodiversity changes, the
effects of changing life styles on biodiversity status in the country, the role of WTO, various
protocols and international conventions on Indian biodiversity status, effects of various IPRs
and growth of globalisation upon the status of biodiversity, relevance of domesticated animals
and agricultural species and traditional knowledge, training and educational needs of different
sections of the society and developing teaching materials.
Many of these have closer links with the various components discussed in Section 2.1.

NBSAP process is participatory. There are again, a large number of stakeholders in the
process. It is part of the process to carry them along and make them responsible to act towards
the process. Who are these stakeholders for the theme of Economics and Valuation of
biodiversity? They are policy makers and development administrators in the government,
researchers, teachers, NGOs, corporate sector, enlightened politicians, donor agencies and so
on.
Accordingly, the following are identified as the major steps or contributions from this
Working group towards this target group:
• Training and educating in basic economics and valuation techniques;
• Developing case studies to demonstrate the valuation methods step by step;
• Carrying the methodology up to policy level (e.g., strategy of budget allocation,
mandatory green accounting, compulsory EIS, participatory approach, widening the
stakeholder groups); and
• linking with the BCPP process.

C H A P T E R - T H R E E
ECONOMICS OF BIODIVERSITY
3.1: What is Economics of Biodiversity ?
It is said that Economics is what economists do. But the same can not be said about
economics of biodiversity. It is beyond what ecologists and specialists in biodiversity do.
Rather when ecology ends, economics begins. In traditional view of biodiversity, it is an
‘umbrella term covering the totality of species, genes and eco-systems’ (MacNeely et al.,1988).
Norton (1988) calls biodiversity as ‘every thing there is’. Just as human beings are identified by
races, biodiversity is a collection of species as natural communities. They are generally
identified by location (just as human races) as texa. The major link between them is through
energy and food chains or web.
The oldest economic link between biodiversity and human existence was through a
system of free services that they provide. With the advent of economic thinking as distinct from
free services, other notions of value of biodiversity and their links with human society emerged.
The relevance of economics today is towards conservation of natural resource; develop
methods towards its use up to the carrying capacity. Natural resources are wealth of the
nations. It is considered as a natural capital or wealth of nations. But traditionally they are taken
as the free gift of nature. Karl Marx thought that till it is extracted by the use of labour, the in-
situ value of coal is zero. Ricardo based on the assumption of indestructible quality of land in
developing the theory of rent. This notion of free gift together with traditional (and often
constitutional ) rights on natural resources have made the development and use of these
resources on economic principles very complex. However, the traditional economics grew out
of Ricardo, in the grab of neo-classical economics to introduce natural resources as ‘natural
capital’, in a competitive form with ‘man-made capital’ and other resources. This led to the
conception that natural resources can be subjected to modifications (depletion, degradation,
attrition or regeneration) with human interference based on the principle of utility maximization
(Swanson, 1992). Theory of value that emerged then follows the principle of ‘willingness to
pay’ (Freeman, 1993, Norton, 1988). Recent theories of economics however, have propagated
the theme of ‘keeping natural resources in tact’ (Boulding, 1971;Pearce,1992). This revelation

of biodiversity as a wealth of nation may have to evolve some now processes of conservation
and preservation of biodiversity. That is the direction of modern Ecological Economics (Aleiz,
2000).
It is equally complex from the point of ecological theories. How much do we know
about the ecology, ecological systems and ecological functions? As will be elaborated later,
even the traditional ecological theories do not provide all the answers till such time the links
between different ecological services and functions are well understood. Furthermore, the
understanding of social norms, conventions, traditions, beliefs and culture are equally import,
which brings additional plurality to the complexity of conserving natural resources. The
disciplines of sociology and social anthropology are also aiming at some convergent solutions
towards the complexity of natural resources.
The natural and biological resources have strong links with the entire habitat, generally
in both directions. For instance, forests provide a service such as nutritional recycling, which
in turn promotes forest growth. Such two-way direct linkages are generally rare in other man-
made capital. Secondly, more often, natural resources do not have well developed markets to
provide information on demands, supply and prices. Therefore, quite often conventional
economic principles breakdown when applied to these resources. Similarly, economics has to
enter in to a discourse on the social behaviour and conflicts between different social groups (to
be designated as stakeholders). Natural resource economics or economics of biodiversity has
brought in new theories and methodologies. Just to cite a few are, concepts of opportunity
costs, shifting from static to dynamics, neoclassical models being replaced by game theory,
going beyond revealed preference to stated preference and so on.
The application of such new economic thoughts and concepts to the challenges that
natural resources pose is the Economics of Biodiversity.
3.2: Economic Reforms and Structural Adjustment Programme (SAP) in India
3.2.1: What are the aspects of SAP that are relevant for biodiversity conservation?
One can identify at least three different aspects of SAP and economic reforms in India

that have direct relevance to biodiversity conservation (or degradation). They are:
I. Emergence of new market and management methods for biodiversity resources;
II. From domestic or local linkage to international linkage via export orientation;
III. The role of the state diminishing in biodiversity conservation;
This report is not the place to talk more about SAP and economic reforms (in any detail). But the direct and indirect effects of the economic reforms process on biodiversity action plan are relevant. Of these, the first two are briefly dealt in this section, addressing to the third in the next section (also bit more elaborately).
Certainly, with the economic reforms process, newer market avenues have arrived for biodiversity resource related products. For instance, in the recent years one notices significant switching from consumption of raw food and vegetable to processed foods and vegetables in India. Being a tropical country, fresh vegetables and cereals are available in India on a day-to-day basis. Therefore, habitually Indians are used to cook fresh vegetables and cereals. But with the changing economic scene, partly due to development in general and partly due to effects of economic reforms (e.g., coming of MNC’s in food processing, government having set up a separate ministry of Food Processing away from Ministry of Agriculture), a concept of home meal replacement is coming in. The upper middle class Indians (with a large percentage families of both husband and wife working out side of home) on average have been switching on to processed foods. The Food and Agriculture Integrated Development Action Report (FAIDA) estimates the processed food market to be of the order of Rs. 22504 billion. Clearly, the mushrooming of food processing industries both by the national companies and MNC are round the corner. Also mention can be made about the significant shift from traditional medicinal system to more and more processed medicinal system (but still the base being herbal and medicinal plants). More about this will be dealt in Section 6.1.
Added to this is the major shift in the trend of Indian exports of products based on natural resource extraction, having implications to biodiversity. Take the case of exports of culture shrimps from India, as shown in Table 3.1. Nearly 50% of culture shrimps produced in the country are exported. The external market prices have been playing havoc in the sense that, though the export quantity of these exotic species have not been rising faster, the income from such activities have been going up significantly. In a study on the ecology of Chilika lake, Kadekodi and Gulati (1999) show that the ratio of prices of shrimp and crab in the export trade market is 3-4 times higher than the local collector’s prices.
Table 3.1:Share of Cultured shrimps to the total export of shrimps from India
Year
Total Quantity o f S h r i m p Exports (MT)
To t a l Va l u e (Rs. million)
P e r c e n t a g e o f Culture Shrimp Exports
P e r c e n t a g e p f Value of Culture Shrimp Exports
1988-89 56,835 4703.3 33 48.78
1989-90 57,819 4633.1 33.72 59.57
1990-91 62,395 6633.2 36.98 56.77
1991-92 76,107 9761.6 34.16 55.81
1992-93 74,393 11802.6 41.06 64.93
1993-94 86,541 17707.3 47.14 72.79
1994-95 1,01,751 25102.7 52.92 74.35
1995-96 90,000 24290.0 50.96 63.05
1996-97 1,05,429 27017.9 43.57 60.81
1997-98 1,00,000 31213.5 43.04 66.83
1998-99 1,02,484 33349.1 52.00 74.49
Source: Marine Products Export Development Authority, 1999.

Another case to cite is on exports of spices from India. Recent trends in export of
biodiversity related product such as spices can be viewed from Table 3.2.
Table 3.2:Export of various spices from IndiaYear Quantity (000’ Metric
tonne)Value (Rs. Million)
1995-96 203.40 8044.301996-97 225.30 12307.181997-98 242.07 14668.191998-99(Provisional) 231.39 17580.221999-00 (Estimated) 208.83 18610.28
As can be seen from the table, in the recent years the export of spices has been quite steady and
its value is increasing at an alarming rate of about 25%.
3.2.2: Macro view on government resource allocation on biodiversity conservation
When it comes to natural resource management and biodiversity conservation, what has
been the role of the state in the process of economic reforms in India? Has it got any link with
the conservation objectives? Has the government reduced the resource allocation for this sector
as a result of economic reforms process in India? These questions can be analyzed by looking
at the budgetary allocations by the central and state governments.
In the central and state government budget presentations in India, there are no exclusive
financial resource allocations under the heading ‘biodiversity’. However, both at the central and
state government levels, several budgetary allocations are made which have indirect and to
some extent direct bearings upon biodiversity. The Ministry of Environment and Forests
(MoEF) uses the following major heads, which can be considered as relevant for looking at the
implications for biodiversity conservation. They are:
I. Ecology and Environment
II. Forestry and wildlife

III. Grand total for MoEF
Each of the broad headings has been further disaggregated in to several sub-headings.
In Table 3.3 the details of these budget allocations under various sub-headings from 1986-87 to
1998-99 are summarily shown. In order to make meaningful comparison over time, the actual
budget allocations have been converted in to constant 1993-94 prices. The same table also
shows the aggregate Gross Domestic Product (GDP) of India for each of those years. In the
most recent year of 1998-99 for which data is shown, the allocation for Ecology and
Environment was Rs 198 crores, where as the same for Forestry and Wildlife was Rs 185 crores
(both in constant 1993-94 prices).
Among many alternative ways of looking at these allocations, two specific indicators
may be most relevant here. First: to take a look at the budget allocation as compared to the
GDP; second, to compare them on per unit of ‘appropriate land, geographical area or
biodiversity resource’. The first indicator is a reflection on resource allocation linking it to
welfare, with GDP as the overall or catchall welfare indicator (typically known in Economics
as ‘investment output ratio’ or incremental capita-output ratio). But more appropriate will be to
consider resource allocation per ‘appropriate land or biodiversity resource’. For this, the
following categories of land or land use may be most relevant for biodiversity assessment.
They are:
(a) Wetlands, (b)Coral reefs, (c)Protected forests, (d) Water bodies, (e) Cultivated land,
(f) Glacier mountain areas and (h) Biosphere reserves
Interestingly enough, till date, in the debate and actions regarding environment and
ecology, a concept of ‘appropriate geographical area’ has not been developed. When it comes to
biodiversity, the above mentioned land categories have direct links with biodiversity resources.
The rough estimated land areas on these are shown in Box 3.1.

Box 3.1: Relevant Land Resource for Linking with Budget Allocations
Land Category appropriate for Biodiversity
Land Area
Wetlands (including mangroves) 3.90 million ha (of which mangroves of 0.48 million ha)
Coral reefs 2329.90 sq. kms.Protected forest areas 15.60 million haTiger Reserve area 33050 sq. kms.Biosphere Reserves 49485 sq. kms.River lengths (12 major ones) 13087 kms.Area under lakes and reservoirs 0,021 million sq. kms.Area under rivers and streams 0.084 million sq. kms.Cultivated land 123.10 million haSnow and glacier areas 55788.49 sq. kmsTotal coastal length 7515 kms.Total sandy area (1988-89) 0.56 million sq. kms.
Apart from these, the following major aspects of biodiversity can also be considered in
making the allocation of resources. After all, under the plans, resource allocations are normally
done on the basis of population. Then why not also on the basis of biodiversity?
Box 3.2: Population of Biodiversity
Aspects of Biodiversity Their magnitudes
Total number of plant species (1998) 45,000
Total threatened species (1997) 583
Total animal species (1998) 81,000
Total threatened vertebrates (1997) 158

Tiger population (1993) 3750
No. of Biospheres 12
At present budget allocation for conservation of biodiversity are being made both at the
central and state governmental levels. The consolidated budget allocations from fourteen major
Indian states are analyzed here for the period 1986-87 to 1999-2000. Since the states maintain
the budget accounts under two categories as Revenue expenditures and Capital Expenditures,
the allocations can be looked into accordingly. Among many, they contain only a few items,
which fit some what closer to biodiversity conservation. They are shown in Box 3.3. The items
of allocations under revenue and capital expenditure categories differ marginally. Furthermore,
the states maintain these accounts under two separate groupings as Development and Non-
development Expenditures. Being quite insignificant and having much less relevance to the
analysis of resource allocation for biodiversity conservation, the latter category is not analysed
here. What should be the appropriate indicator to analyse the state level resource allocation on
biodiversity conservation? They are best analysed by comparing them with the corresponding
total budget allocation for all sectors taken together.
All these indicators of budgetary allocations are shown in Table 3.3 as well as Figure
3.1 to 3.5. From the graphical analysis as well as the Tables presented here, it is revealing that:
I. At the national level:
II. The MoEF’s budget allocations to Ecology and Environment have been going down,
more conspicuously from 1991-92 onwards. It is also showing quite a bit of
fluctuations, suggesting lower considerations on sustainability of budget allocations in
the long run.
III. The allocations on Forestry and Wildlife also have been going down, but at much lesser
pace till 1995-96. But in the most recent years of 1996-97 onwards they have dropped
very significantly.
IV. At the States level:
A. The Revenue development expenditures on biodiversity related activities (as a ratio of

Total Revenue Expenditure on all sectors taken together) have been declining, but at a
much lesser rate, declining from 2.99 percent in 1986-87 to 2.20 percent by 1998-99.
B. The Capital development expenditures on biodiversity related activities (as a ratio of
Total Capital Expenditures on all sectors taken together) have shown a sudden decline
from 2.27 percent in 1986-87 to 1.81 by 1994-95, but have shown a reverse trend from
1995 on wards, retaining an average around 2.5 percent.
C. Among the states, as far as revenue expenditures are concerned, except for states such
as Karnataka, Kerala, Madhya Pradesh and Orissa, all other states have registered fast
declining rates of resource allocations.
D. Similarly, as far as capital expenditures are concerned, most states have very low rates
of allocations (except perhaps Maharashtra, Gujarat, Kerala, Tamil Nadu); besides they
have been invariably declining.
Box 3.3: Categories of budget allocations considered
for state level biodiversity activities
Developmental Budget Headings
Items considered
Revenue Expenditure Soil and water conservation; Fisheries; Forestry and Wildlife; Plantations
Capital Expenditure Crop Husbandry; Soil and Water conservation; Fisheries; Forestry and Wildlife; Plantations
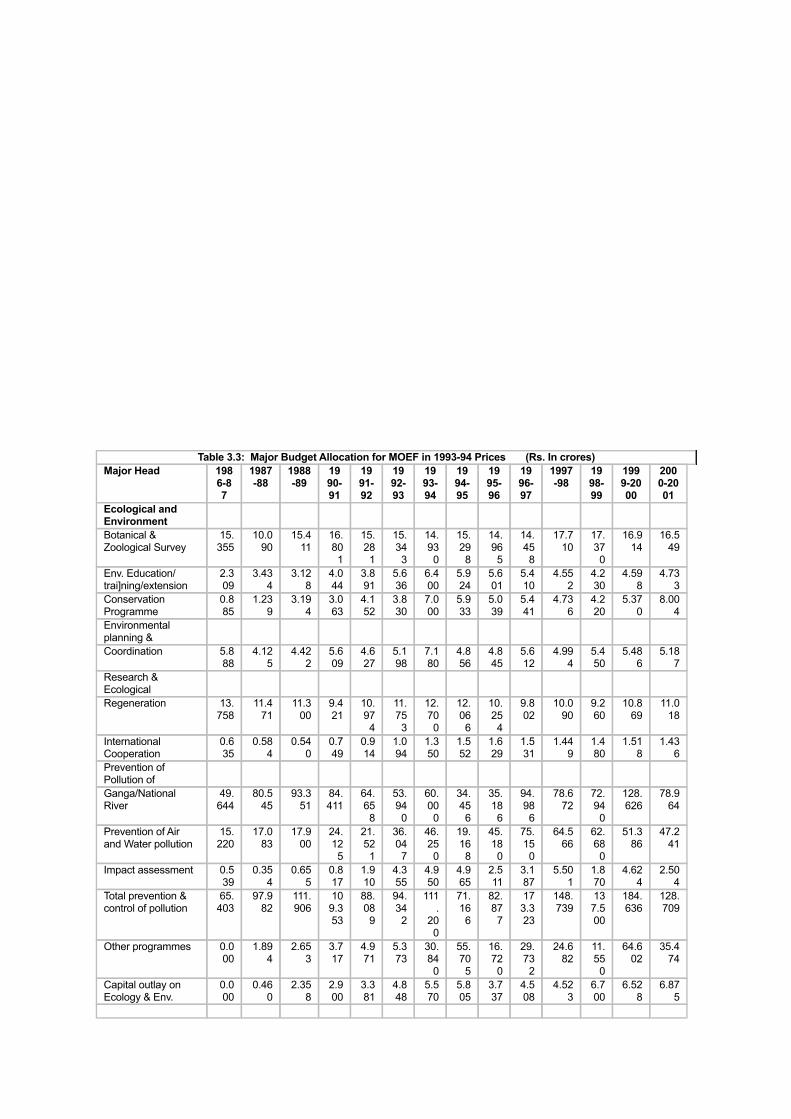
Table 3.3: Major Budget Allocation for MOEF in 1993-94 Prices (Rs. In crores)Major Head 198
6-87
1987-88
1988-89
1990-91
1991-92
1992-93
1993-94
1994-95
1995-96
1996-97
1997-98
1998-99
1999-2000
2000-2001
Ecological and Environment
Botanical & Zoological Survey
15.355
10.090
15.411
16.801
15.281
15.343
14.930
15.298
14.965
14.458
17.710
17.370
16.914
16.549
Env. Education/trai]ning/extension
2.309
3.434
3.128
4.044
3.891
5.636
6.400
5.924
5.601
5.410
4.552
4.230
4.598
4.733
Conservation Programme
0.885
1.239
3.194
3.063
4.152
3.830
7.000
5.933
5.039
5.441
4.736
4.220
5.370
8.004
Environmental planning &
Coordination 5.888
4.125
4.422
5.609
4.627
5.198
7.180
4.856
4.845
5.612
4.994
5.450
5.486
5.187
Research & Ecological
Regeneration 13.758
11.471
11.300
9.421
10.974
11.753
12.700
12.066
10.254
9.802
10.090
9.260
10.869
11.018
International Cooperation
0.635
0.584
0.540
0.749
0.914
1.094
1.350
1.552
1.629
1.531
1.449
1.480
1.518
1.436
Prevention of Pollution of
Ganga/National River
49.644
80.545
93.351
84.411
64.658
53.940
60.000
34.456
35.186
94.986
78.672
72.940
128.626
78.964
Prevention of Air and Water pollution
15.220
17.083
17.900
24.125
21.521
36.047
46.250
19.168
45.180
75.150
64.566
62.680
51.386
47.241
Impact assessment 0.539
0.354
0.655
0.817
1.910
4.355
4.950
4.965
2.511
3.187
5.501
1.870
4.624
2.504
Total prevention & control of pollution
65.403
97.982
111.906
109.353
88.089
94.342
111.
200
71.166
82.877
173.323
148.739
137.500
184.636
128.709
Other programmes 0.000
1.894
2.653
3.717
4.971
5.373
30.840
55.705
16.720
29.732
24.682
11.550
64.602
35.474
Capital outlay on Ecology & Env.
0.000
0.460
2.358
2.900
3.381
4.848
5.570
5.805
3.737
4.508
4.523
6.700
6.528
6.875

Total-Ecology and Environment
104.
426
135.351
154.913
155.657
136.280
147.417
197.170
178.304
145.667
249.817
221.475
197.810
300.521
254.816
Forestry and Wildlife
Research 4.810
11.489
14.494
16.079
28.841
30.072
35.070
43.510
48.665
53.517
49.835
57.630
52.833
37.321
Education and training
13.392
8.037
7.403
8.877
6.086
7.135
8.030
8.844
7.457
7.765
7.987
9.690
9.673
8.379
Survey and utilisation of Forest
Resources 5.157
5.682
5.241
4.221
3.168
4.049
9.950
9.073
10.035
3.521
4.391
4.890
4.759
4.794
Forest conservation &Develop.
Regresstion 6.446
4.072
7.042
5.882
6.228
8.777
6.900
5.203
6.004
5.791
5.589
8.300
8.875
6.507
Wildlife 14.989
18.729
16.885
28.496
31.629
20.103
25.560
27.254
26.176
24.710
383347.0
00
43.010
68.564
49.979
NWDB/NAEDB 100.
981
106.798
13.348
103.458
144.133
116.
174
98.030
94.907
88.117
69.810
55.049
50.320
62.319
60.469
Capital outlay on Forestry & Wildlife
0.000
0.690
2.457
3.000
2.930
1.379
1.650
Total-Forestry & Wildlife
146.
700
156.506
165.657
176.310
223.526
210.000
198.750
201.899
197.010
173.012
172.406
184.500
216.966
179.854
Grand Total 254.
474
295.008
323.649
335.126
362.795
360.440
398.980
383.288
345.902
426.242
397.977
386.760
521.886
439.414
GDP at factor cost at 1993-94 prices
500354
.000
521962.0
00
577550.0
00
650462.000
655764.000
690261.000
732874.000
861064.000
926412.000
998978.000
1049191.000
111220.000
Source : RBI Bulletin, various issuing; Expenditure Budgets of MoEF
Table 3.4: A Macro Picture of Budget Allocations on Biodiversity Conservation
YEAR AT THE NATIONAL LEVEL;MOEF AT THE ALL STATES LEVEL ($$)
Ratio of Total MOEF Annual Budgetary Allocation/ GDP (%)
Ratio of Forestry +Wildlife Budgetary Allocation/ GDP(%) (*)
Ratio of Ecology +Env. Budgetary Allocation/GDP (%) (**)
Ratio of Revenue Expenditure on Env. +Forest+ Ecology/Total Revenue Expenditure (%)(***)
Ratio of Capital Expenditure on Env. +Ecology+ Forestry/Total Capital Expenditure (****)
1986-87
5.1 2.9 2.1 2.99 2.27
1987-88
5.7 3.0 2.6 3.03 2.90
1988-89
5.5$ 2.9$ 2.5$ 2.81 1.95

1989-90
5.3$ 2.8$ 2.4$ 2.66 1.65
1990-91
5.2 2.7 2.4 2.60 1.56
1991-92
5.5 3.4 2.1 2.16 1.70
1992-93
5.2 3.0 2.1 1.93 2.06
1993-94
5.4 2.7 2.7 2.30 1.77
1994-95
4.5 2.3 2.1 2.17 1.81
1995-96
3.7 2.1 1.6 2.20 2.49
1996-97
4.3 1.7 2.5 2.08 2.84
1997-98
3.8 1.6 2.1 2.01 1.93
1998-99
3.5 1.7 1.8 2.20 2.10
Notes: 1. All computations are in constant 1993-94 prices.
2. (*):Forestry +Wildlife Budget=Research on forestry and wildlife +Education and training +Survey and utilization of forest resources +Forest conservation, development and regeneration + Wildlife +NWDB +NAEBD +Capital outlays on forestry and wildlife
3. (**):Ecology and Environment= Botanical and Zoological Survey +Env. Education, training and extension +Conservation programme +Env. Planning and coordination +Research in Ecological Regeneration +International cooperation +Prevention of pollution in Ganga +Prevention of air and water pollution +EIA +Other programmes +Capital outlays on Ecology and Env.
4. (***): Soil and water conservation +Fisheries +Forestry and wildlife +Plantations5. (****): Crop husbandry +Soil and water conservation +Fisheries +Forestry and
wildlife +Plantations6. ($): These are indirectly estimated values, in absence of actual7. ($$):The All states’ revenue and capital expenditures are invariably the ‘Actual’, but
in few years they are Revised estimates (rather than actual estimates). Moreover, these ratios are computed the most important fourteen states only.
The fact that the role of the state in the management of biodiversity resources has been
severely affected by the Economic Reforms Process is evident from the macro-budgetary
analysis. The objectives of the states, in the past also has been, by and large, revenue from
natural resources, as can be seen from the Table 3.5. Other than minerals (including crude oil
and gas), one of the most revenue raising resource at the state levels has been forest. Most of

the forest rich states have used this as an economic instrument of raising revenues. States such
as Andhra Pradesh, Arunachal Pradesh, Kerala, Madhya Pradesh, Orissa and Punjab continue to
raise lot more revenue from forests than the investments on that sector.
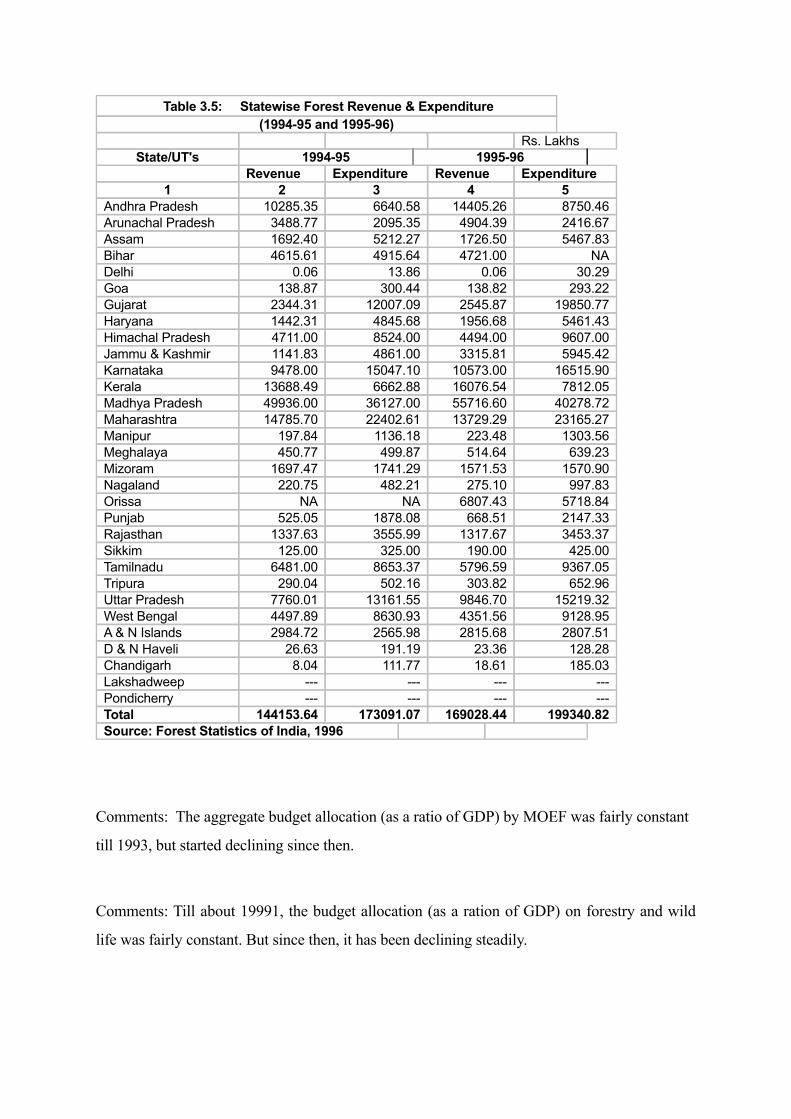
Table 3.5: Statewise Forest Revenue & Expenditure(1994-95 and 1995-96)
Rs. LakhsState/UT's 1994-95 1995-96
Revenue Expenditure Revenue Expenditure1 2 3 4 5
Andhra Pradesh 10285.35 6640.58 14405.26 8750.46Arunachal Pradesh 3488.77 2095.35 4904.39 2416.67Assam 1692.40 5212.27 1726.50 5467.83Bihar 4615.61 4915.64 4721.00 NADelhi 0.06 13.86 0.06 30.29Goa 138.87 300.44 138.82 293.22Gujarat 2344.31 12007.09 2545.87 19850.77Haryana 1442.31 4845.68 1956.68 5461.43Himachal Pradesh 4711.00 8524.00 4494.00 9607.00Jammu & Kashmir 1141.83 4861.00 3315.81 5945.42Karnataka 9478.00 15047.10 10573.00 16515.90Kerala 13688.49 6662.88 16076.54 7812.05Madhya Pradesh 49936.00 36127.00 55716.60 40278.72Maharashtra 14785.70 22402.61 13729.29 23165.27Manipur 197.84 1136.18 223.48 1303.56Meghalaya 450.77 499.87 514.64 639.23Mizoram 1697.47 1741.29 1571.53 1570.90Nagaland 220.75 482.21 275.10 997.83Orissa NA NA 6807.43 5718.84Punjab 525.05 1878.08 668.51 2147.33Rajasthan 1337.63 3555.99 1317.67 3453.37Sikkim 125.00 325.00 190.00 425.00Tamilnadu 6481.00 8653.37 5796.59 9367.05Tripura 290.04 502.16 303.82 652.96Uttar Pradesh 7760.01 13161.55 9846.70 15219.32West Bengal 4497.89 8630.93 4351.56 9128.95A & N Islands 2984.72 2565.98 2815.68 2807.51D & N Haveli 26.63 191.19 23.36 128.28Chandigarh 8.04 111.77 18.61 185.03Lakshadweep --- --- --- ---Pondicherry --- --- --- ---Total 144153.64 173091.07 169028.44 199340.82Source: Forest Statistics of India, 1996
Comments: The aggregate budget allocation (as a ratio of GDP) by MOEF was fairly constant
till 1993, but started declining since then.
Comments: Till about 19991, the budget allocation (as a ration of GDP) on forestry and wild
life was fairly constant. But since then, it has been declining steadily.

Comments: On ecology and environmental heads, the allocations have been fairly constant,
though fluctuating from year to year.
Comments: Till about 1992, the state revenue budget allocations were steadily declining.
They have remained fairly constant since then.
Comments: The capital expenditures by the states do not seem to follow any rational pattern of
resource allocation.

3.3: World Trade Organisation (WTO) and Biodiversity Conservation
The WTO was established on January 1, 1995 and the implementation of the Uruguay
Round results began from the same date. India became an initial member of the WTO, just as it
was an original signatory of the General Agreement. It was an active member of the GATT but
had not made significant contributions, except in rhetoric, towards trade liberalization. Prior to
1995, India’s exports had benefited from progressive reduction of tariff levels in the developed
countries ( Bagchi, 2001).
General Agreement on Trade and Tariff (GATT in 1947 as well as in the latter
modification in 1994 ) calls for protecting human and nature interests alike. Article XX of
GATT reads as:
Subject to the requirement that such measures are not applied in a manner which would constitute a means of arbitrary or unjustifiable discrimination between countries where the same conditions prevail, or a disguised restriction on international trade, nothing in this Agreement shall be construed to prevent the adoption or enforcement by any contracting party of measures:…. (b) necessary to protect human, animal or plant life or health; (g) relating to the conservation of exhaustible natural resources if such measures are made effective in conjunction with restrictions on domestic production or consumption.
WTO also reiterated this stand in its Preamble concerning the establishment of the WTO
as:“Expanding the production and trade in goods and services, while allowing for optimal use of the world’s resources in accordance with the objective of sustainable development, seeking both to protect and preserve the environment and enhance the means for doing so in a manner consistent with their respective needs and concerns at different levels of economic development.” (Preamble in the Final Act of the Uruguay Round, 1994, p.9)
WTO had constituted the Committee on Trade and Environment (CTE) aiming at
discussing the interface between of trade and environment. In the WTO, the mandates given
to the General Agreement on Trade in Services (GATS) and agreement on trade in goods
are:
I. To find out the relationship between trade measure and environmental measures in promoting sustainable development, and the need for rules to enhance that positive interaction.
II. The relationship between the multilateral trading system and trade measures
used for environmental purposes, including multilateral environmental agreements.
III. The relationship between the multilateral trading system and environmental measures with significant effects on trade
IV. The environmental effects of trade liberalization, and V. The relationship between the dispute settlement mechanism of the WTO and
those found in multilateral environmental agreements.
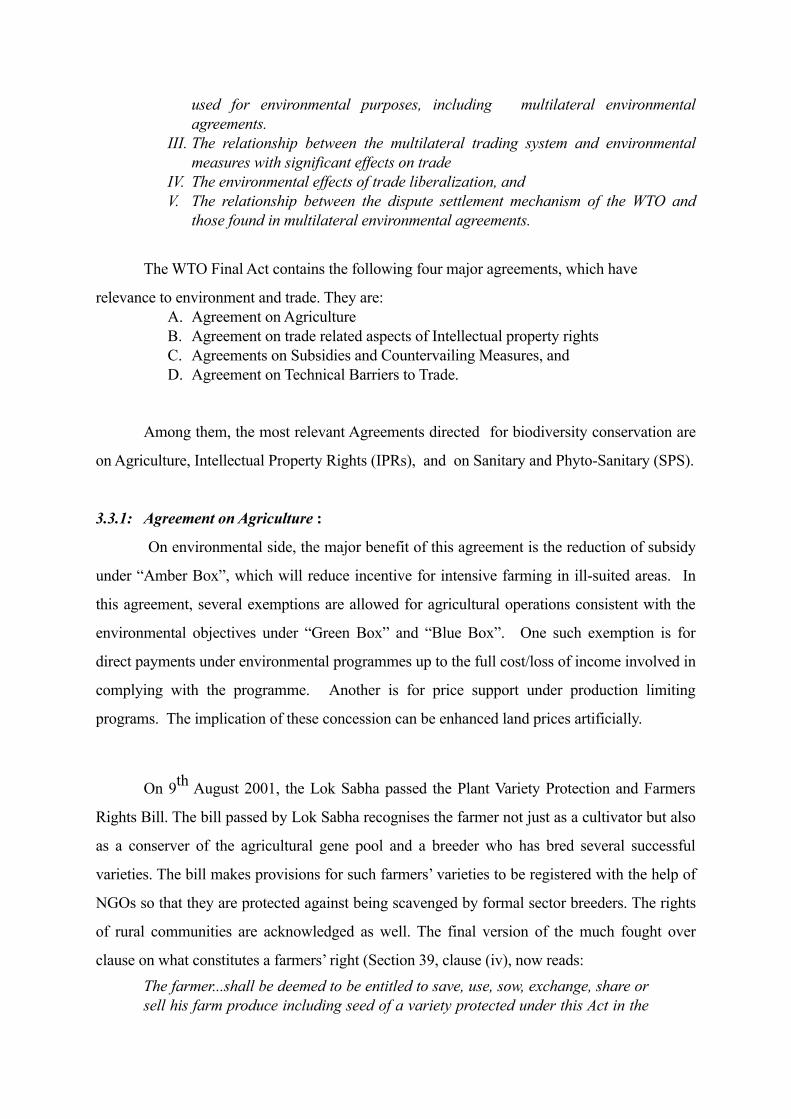
The WTO Final Act contains the following four major agreements, which have
relevance to environment and trade. They are:A. Agreement on AgricultureB. Agreement on trade related aspects of Intellectual property rightsC. Agreements on Subsidies and Countervailing Measures, andD. Agreement on Technical Barriers to Trade.
Among them, the most relevant Agreements directed for biodiversity conservation are
on Agriculture, Intellectual Property Rights (IPRs), and on Sanitary and Phyto-Sanitary (SPS).
3.3.1: Agreement on Agriculture :
On environmental side, the major benefit of this agreement is the reduction of subsidy
under “Amber Box”, which will reduce incentive for intensive farming in ill-suited areas. In
this agreement, several exemptions are allowed for agricultural operations consistent with the
environmental objectives under “Green Box” and “Blue Box”. One such exemption is for
direct payments under environmental programmes up to the full cost/loss of income involved in
complying with the programme. Another is for price support under production limiting
programs. The implication of these concession can be enhanced land prices artificially.
On 9th August 2001, the Lok Sabha passed the Plant Variety Protection and Farmers
Rights Bill. The bill passed by Lok Sabha recognises the farmer not just as a cultivator but also
as a conserver of the agricultural gene pool and a breeder who has bred several successful
varieties. The bill makes provisions for such farmers’ varieties to be registered with the help of
NGOs so that they are protected against being scavenged by formal sector breeders. The rights
of rural communities are acknowledged as well. The final version of the much fought over
clause on what constitutes a farmers’ right (Section 39, clause (iv), now reads: The farmer...shall be deemed to be entitled to save, use, sow, exchange, share or sell his farm produce including seed of a variety protected under this Act in the
same manner as he was entitled before the coming into force of this Act;
Provided that the farmer shall not be entitled to sell branded seed of a variety protected under this Act. Explanation: for the purpose of clause (iii) branded seed means any seed put in a package or any other container and labeled in a manner indicating that such seed is of a variety protected under this Act.
This formulation allows the farmer to sell seed in the way he has always done, with the
restriction that this seed cannot be branded with the breeder’s registered name. In this way, both
farmers’ and breeders’ rights are protected. The breeder is rewarded for his innovation by
having control of the commercial market place but without being able to threaten the farmers’
ability to independently engage in his livelihood, and supporting the livelihood of other farmers
( Sahai, 2001).
3.3.1.1: Farmers’ Rights The agreement also provides legal rights to the farmers to sell seeds (not save, not
exchange, but sell). In India, the farming community is the largest seed producer, providing
about 87 per cent of the country’s annual requirement of over 60 lakh tonnes. There are also
provisions for acknowledging the role of rural communities as contributors of land races and
farmer varieties in the breeding of new plant varieties. Breeders wanting to use farmers’
varieties for creating Essentially Derived Varieties (EDVs) cannot do so without the express
permission of the farmers involved in the conservation of such varieties. This way it protects
the farming community.
According to Sahai (2001) any person or governmental or non-governmental agency is
entitled to register a community’s claim and have it duly recorded at a notified centre. This
intervention enables the registration of farmer varieties as sources of germplasm, even if the
people themselves cannot do this themselves due to illiteracy or lack of awareness. If the claim
on behalf of the community is found to be genuine, a procedure is initiated for benefit sharing
so that a share of profits made from the new variety goes, on behalf of the communities, into a
National Gene Fund. But it is very much poorly, even incompletely, written. The Gene Fund
should be the recipient of all revenues payable to the farming communities under various
heads. The use of the money should not be restricted to conservation or for maintaining ex situ
collections. That would mean that the revenue generated from the use of farmer varieties would
partly be used to maintain the National Gene Bank in Delhi.

3.3.2: Biosafety Guidelines:
India does not have a biosafety legislation. However a mechanism has been set up
under the department of biotechnology based on a three-tier mechanism to look into safety
aspects of transgenic plants. These relate to: (1) the Institutional Bio-Safety Committee (IBSC)
whose clearance is a must for any research institute undertaking transgenic research; (2) the
Review Committee on Genetic Manipulation (RCGM), a national committee with mandate to
monitor national research in India in GMOs; and (3) a genetic engineering approval committee
based in the Ministry of Environment and Forests with authority to approve commercial use of
Genetically Modified Organisms and re-combinant DNA products. These safeguards apart, the
establishment of two transgenic containment facilities by the ICAR and the department of
biotechnology in 1999, could provide operational infrastructure for biosafety. (Damodaran,
1999).
The 1988 New Policy on Seed Development (NPSD) liberalised import of high quality
seeds, which in conjunction with the general economic liberalisation regime has opened the
Indian seed market to foreign seed producers. The ostensible strategy of the NPSD can affect
the farmers in India as they are exposed to quality seeds from a wide variety of sources
including international sources. However transgenic plants and seeds bring about problems in
the form of sanitary and phyto-sanitary related diseases and pests (Damodaran, 1999); and it
can also affect the growth and sustenance of indigeneous varieties.
3.3.3: The Agreement on trade related intellectual property rights (IPRs:
TRIPs Agreement of GATT 1994 provides much stricter patent protection to the
intellectual properties that is related to trade. Intellectual property right (IPR) is a right on new
inventions and is recognized by laws relating to copyright, trademark or patent. The patent right
endows its holder a time-bound monopoly on the given product. During this specified time
period no one else can produce the patented product without his permission. The patent-holder
can exercise his right in a number of ways. He can sell, transfer, lease, gift or otherwise dispose
of his intellectual property. Such rights continue only during the patent period; at the end of
which anyone can produce it without his permission ( Dasgupta, 1999).
3.4.3.1: Patents in India
Patent legislation has a long history in India. Beginning in 1856, the Indian patent law
has been revised a number of times (Keyala, 1999). The Indian Patent Act of 1970, recognizes
patent rights for a period of seven to fourteen years. In Indian patent legislation a distinction is
made between ‘product’ patent and ‘process’ patent. The Indian Patent Law of 1970 allowed
process patent but not product patent, for food, medicine, agro-chemicals, etc. ‘Process’ means,
say for a medicine, the combination of various ingredients – chemicals, medicinal plants, herbs
and other biological products and so on – in specified proportions, and by using a technique or
a way of combining those, that makes the production of such medicine possible. Even in areas
where patent is permitted, the government is empowered to reject patent application in national
interest. Further, to prevent acquiring patent rights solely with the objective of keeping the
rivals out, the government retains power to reject patent and/or to make patented products
compulsorily available to users ( Dasgupta, 1999).
It is, therefore, possible for an Indian pharmaceutical company to buy a ‘process’ of
making a particular medicine, in exchange of royalty paid to the patent-holder in a foreign
country, but then to produce the medicine by using cheap, local material. This way life saving
drugs can be sold in India at a price that is one-twentieth of their price in the developed
countries (Dasgupta, 1999).
Whereas life forms are not patentable under the 1970 law, after it is amended in line
with the TRIPs agreement, by 2005 AD, it would have to provide patent protection for the plant
and animal varieties or to take recourse to a sui generis system that would serve more or less
the same objective (Schott ,1994).
3.3.4: Agreements on Sanitary and Phyto-Sanitary (SPS) Measures
As far as SPS Agreement is concerned, it has the following features:
Broadly defined, the sanitary measures are those related to human or animal health, while
health of the plant is dealt by the phyto-sanitary measures. The protection of fish and wild
fauna, forest and wild flora are included and the protection of the environment per se and
animal welfare excluded. This is strange indeed! The SPS Agreement again narrows down the
definition into a very limited range of solutions. SPS can take place in many forms viz.,
requiring products to come from disease free areas, inspection of products, specific treatment or
processing of products, setting of allowable maximum levels of pesticide residues or permitted
use of only certain addition in food, quarantine requirements, import ban etc. Though the
measures use outside of the territory, but its very objective is to protect health within the
territory of the importing country.
Though basic objective of the SPS agreement is to address environmental concern by
setting appropriate standards, it is emerging as major NTBs in restricting trade. This is because
of its technical complexity and particularly deceptive barrier, which is difficult to challenge.
SPS is getting more protectionist under WTO. A WTO member, who is not a party to
International Plant Protection Convention (1951) is affected by trade provisions of the Multi-
lateral Economic Agreements (MEA) through SPS. It says “parties are required to regulate
very strictly the import and export of plant and plant products, by means, where necessary of
prohibitions, inspections, and destruction of consignment:” (Article 6).
3.3.5: Issue of Biopiracy
A major issue concerns patent rights on seed varieties. Under the TRIPs agreement,
plant varieties are expected to be protected in one of the following three ways – by patents, by a
sui generis system, or by a combination of the two (Dasgupta, 1998).
Recently Biplav Dasgupta (1999) has gone into this issue in great detail. His arguments
are summarised in the following paragraphs.
Many multinational agri-business and pharmaceutical firms are descending on India
and other countries that are economically poor but rich in biological wealth, and are scouting
the countryside, forests and bushes for plant varieties. These MNCs are taking selected
specimen out of the country, by means legal or illegal, and then, after some tinkering and cross-
breeding with other varieties, produce new varieties that they are claiming to be unique and
distinct, and then patenting those in their own countries. Once patented such varieties become
the private property of the patent-holder until the time when the patent right expires. Under
Exclusive Marketing Rights (EMR), if the amendment discussed above is passed, the patent-
holders of a product patented anywhere in the world would drive out indigenous competitors
from the Indian market.
This process of stealing and plundering the biological wealth of the third world

countries, which accounts for nearly two-thirds of the total, by the multinational firms
originating in the west, has come to be known as ‘biopiracy’. The countries rich in biological
wealth and poor in economic terms account for top ranks in terms of mammal, bird and plant
varieties. India figures eighth in rank in terms of both mammal and bird species, but no
developed country figures among the first eight (Swanson, 1997).
The most talked about case of biopiracy has been the patenting of neem tree, which is a
part of the Indian folk culture and whose medicinal and other properties had been known to the
Indian people from time immemorial. The irony of such patenting is that patented products,
processed by the foreign companies, would now have to be purchased by Indians who are used
to getting those free in nature (Shiva and Holla-Bhar, 1993). Similar patent rights have been
claimed on other medicinal plants – e g, haldi, salal, dudhi, gulmendhi, bagbherenda, karela,
amla, jar amla, anar (pomegranate), rangoon ki bel, castor, vilayeti sisham, chamkura (Shiva,
1997) , whose properties had been known to Indians, as in the case of neem, from time
immemorial. However, in case of haldi, another highly important plant with medicinal
properties, the US medical school was forced to revoke patent on its use for healing wounds, in
1987, after Indian protest.
Recently Ricetec, a Texan seed breeding company, collected some specimen of the
Basmati rice plants from India and Pakistan, then cross-bred those with some high-yielding
varieties, and claimed that it had produced a new rice variety. This company is making two
contradictory claims: first, what they have produced is unique, non-obvious and of practical
use, and distinct from Indian and Pakistani Basmati, which justified their patent application,
and second, their variety is an exact replica of Basmati when it comes to taste; one eating their
Basmati rice would not know the difference between the two. However, the claim that the
Ricetec Basmati is novel can only sustain on the ground that it can now be grown outside India
and Pakistan.
The developed countries demand that all germplasms be recognised as a public
resource and a part of the heritage of the mankind. That would give them the right to collect
germplasm in the wild or as landrace varieties without compensation on the ground that these
belong to the ‘common heritage of mankind’. But, after improving the variety through research
and experimentation, they do not hesitate to sell these against payment to countries including
those from which such germplasm had been originally collected (Lesser, 1991). This attitude of

developed countries has led the less developed countries to make two specific demands: first,
that the companies collecting those germplasms should pay to the local communities to which
they belong, and, second, in line with the 1993 convention on biodiversity, these should be
treated as coming under the sovereign right of a nation and not as something ‘international’ and
belonging to nobody in particular.
The major difficulty here is that the US courts insist on documentary evidences of such
‘prior art’ that is difficult to find in a society where ‘oral tradition’ dominates. Another solution
to the problem of biopiracy that suggests itself is to patent the Indian plant varieties in India
itself, before it is done by anyone else and thus save them from poaching.
3.3.6: Implications of Uruguay Round for the Forest Product Trade
The Uruguay Round Agreement signed in Marrakesh, Morocco, in April 1994, has a
number of implications for trade in forest products. Canada, United States, European Union
and several other major importers agreed tariff elimination for pulp and paper items. Using the
1986 level of tariffs as base rate, these countries will have reduced tariffs by the year 2000 and
phase them out completely out by 2004. In case of furniture some major importers such as
European Union, Japan and United States have agreed to eliminate tariffs completely over the
next eight to ten years. Most of the other countries have agreed to reduce tariffs for solid wood
products and furniture, or at least to declare bound rates (Barbier, 1998).
As a result of the Uruguay Round Agreement on a trade-weighted basis forest products
have the highest percentage of all imports (85 percent) without duty in developed country
import markets – almost double the proportion of imports of all industrial goods that have zero
tariffs. The major contribution of the Uruguay Round has been to reduce the degree of tariff
escalation faced by forest products in developed country markets. For solid wood products,
tariff escalation for wood-based panels has been reduced by 30 percent, semi-manufactures 50
percent and wood articles 67 percent (Barbier, 1998).
The implications of the Uruguay Round for non-tariff barriers faced by forest products
are less clear. However two special agreements – the Agreement on the application of Sanitary
and Phyto-sanitary (SPS) Measures and the Agreement on Technical Barrier to Trade (TBT) –

do provide the basis for tackling certain non-tariff measures that have been used as trade barrier
against forest products. The SPS agreement could increase the use of inspection, quarantine and
treatment of imported forest products as prohibitory measures beyond what is necessary to
protect domestic human, animal and plant population from pests or diseases. The TBT
agreement could limit the use of technical regulations on forest products as non-tariff restriction
rather than for legitimate purpose of protecting human healthy and safety, preventing
environmental degradation and ensuring adequate product quality and design standards
(Barbier, 1998).
3.3.6.1: New Barriers to Forest Products Trade
In recent years there has been a proliferation of additional policies and regulations that have
the potential of becoming new barriers to the forest products trade. These barriers include:
I. Export restrictions by developing countries to encourage domestic processing of
tropical timber for export;
II. Environmental and trade restrictions on production and exports in developing countries
that affects international trade patterns;
III. Quantitative restrictions on imports of unsustainably produced timber products, and
IV. The use of eco-labelling and green certification as import barriers.
Many developed countries are beginning to employ variety of environmental
regulations in their forest industries – both alone and in conjunction with export restriction-that
may have significant trade implications (Barbier, 1994). The developed nations also under
pressure to adopt quantitative restrictions to limit the import of unsustainably produced forest
products or to impose countervailing duties on imported products that benefit from an
environmental export subsidy- unsustainable forest management that leads to lower harvesting
costs and thus lower export product prices. (Barbier, 1998)
3.4: The Role of the Corporate Sector
3.4.1: Why the corporate sector is important in biodiversity conservation?
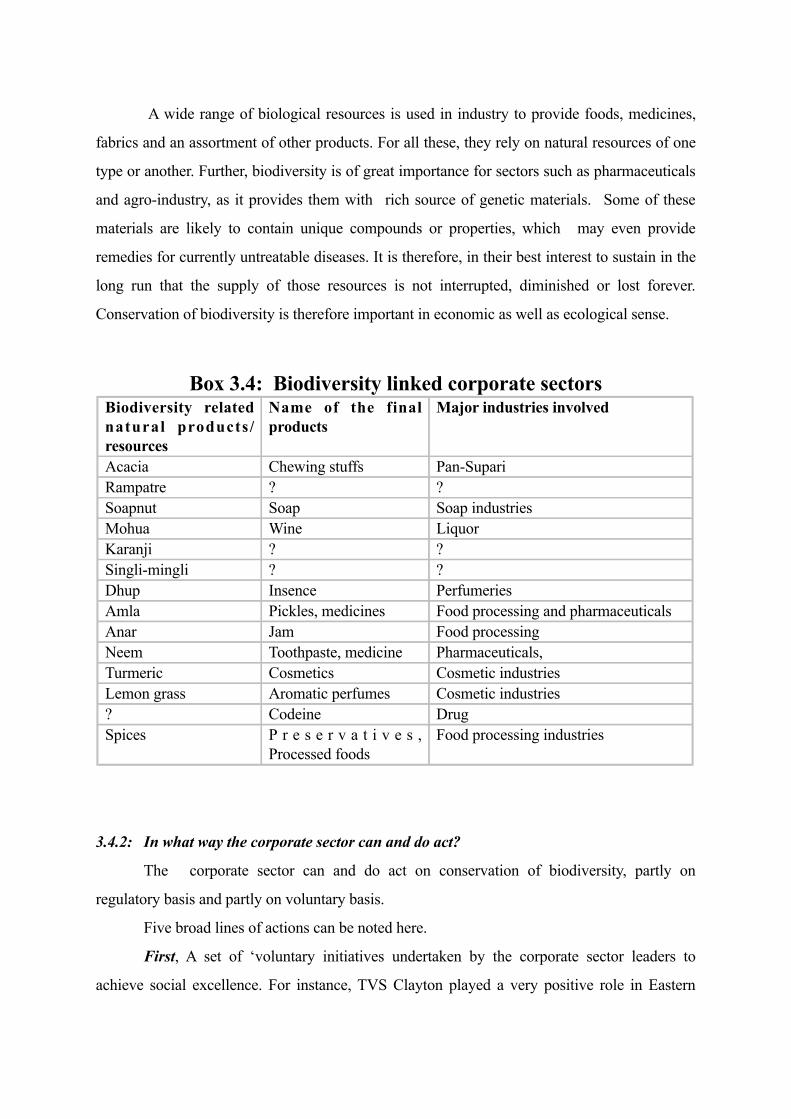
A wide range of biological resources is used in industry to provide foods, medicines,
fabrics and an assortment of other products. For all these, they rely on natural resources of one
type or another. Further, biodiversity is of great importance for sectors such as pharmaceuticals
and agro-industry, as it provides them with rich source of genetic materials. Some of these
materials are likely to contain unique compounds or properties, which may even provide
remedies for currently untreatable diseases. It is therefore, in their best interest to sustain in the
long run that the supply of those resources is not interrupted, diminished or lost forever.
Conservation of biodiversity is therefore important in economic as well as ecological sense.
Box 3.4: Biodiversity linked corporate sectorsBiodiversity related natural products/resources
Name of the final products
Major industries involved
Acacia Chewing stuffs Pan-SupariRampatre ? ?Soapnut Soap Soap industriesMohua Wine LiquorKaranji ? ?Singli-mingli ? ?Dhup Insence PerfumeriesAmla Pickles, medicines Food processing and pharmaceuticalsAnar Jam Food processingNeem Toothpaste, medicine Pharmaceuticals,Turmeric Cosmetics Cosmetic industriesLemon grass Aromatic perfumes Cosmetic industries? Codeine DrugSpices P r e s e r v a t i v e s ,
Processed foods Food processing industries
3.4.2: In what way the corporate sector can and do act?
The corporate sector can and do act on conservation of biodiversity, partly on
regulatory basis and partly on voluntary basis.
Five broad lines of actions can be noted here.
First, A set of ‘voluntary initiatives undertaken by the corporate sector leaders to
achieve social excellence. For instance, TVS Clayton played a very positive role in Eastern

Ghats of Tamil Nadu, by indulging in participation on JFM and eco-development. A summary
version of the involvement is presented in Box 3.4.

Box 3.5: Corporate sector in Joint Forest Management in Tamil Nadu:
The Case of TVS Clayton_____________________________________________________________________________________________________________________________________________________________________________
The Srinivasan Services Trust (SST), an organization initiated by Sundaram Clayton Limited and TVS-Suzuki Limited, has recently taken up an endeavour to facilitate sustainable forest management in Tamil Nadu. It is a pioneering attempt, which could well serve as model for other corporate sectors. The efforts are currently concentrated at Padavedu-Renugondapuram in Tiruvannamalai district and at Thirukkurungudi in Tirunelveli district. SST's interventions in forest regeneration, in areas under either the JFM or eco-development project, fall into three main categories: community development, alternative income generation and empowerment of women.
SST’s ActivitiesI. Involvement in Eco-development in Thirukkurungudi in Tirunelveli district:
This village is located in the neighbourhood of the Kalakad-Mundanthurai Tiger Reserve
(KMTR), one of the two protected areas selected for bio-diversity conservation through
FREEP's (Forestry Research Education and Extension Project) pilot eco-development
project funded by World Bank.
II. Involvement in JFM in Padavedu-Renugondapuram in the Santhavasal Range in Tiruvannamalai district :Situated on the fringe of the Eastern Ghats, Padavedu-Renugondapuram is one of the 1000 villages where the TNFD is implementing the JFM programme under the Japan Bank of International Cooperation (JBIC) assisted Tamil Nadu Afforestation Programme (TAP).
III. Developing social fencing-the story of Vattakulam village
Nearly 15 years ago, 29 professional woodcutter and grazer families settled at Vattakulam village in Thirukkurungudi panchayat. the SST provided 37 bags of cements to complete the construction of a road; with the constant persuasion by SST personnel with the District Collector, 29 families of Vattakulem were also given the patta by the administration in January 2001.
Recently, the SST constructed a new concrete room for the balwadi centre, which can accommodate 30 children below three years age. One teacher and an assistant have been appointed to look after the children in the absence of their mothers. While the salary of the teacher is paid by the SST community pays the salary of the assistant. The SST has already approached the Integrated Child Development Scheme (ICDS) for providing a mid-day meal to these children.
I. Development of the agro-ecology of the village
Around 460 saplings have been planted at Renugondapuram for avenue plantation. The pitting and planting cost of avenue trees has been borne by the forest department while the cost of Rs 15000 for tree guards has been borne by the SST group.
Confederation of Indian Industries (CII) has recently initiated a scheme in which both
the public and private sectors work towards re-greening of degraded private/revenue and forest
lands. The proposal is under consideration by the government.
Second, Mandatory compliance by companies to put in an ‘Environmental Accounting
framework’. There are two dimensions to this. One, companies having to do Environmental
Impact Assessment on a compulsory basis. The Ministry of Environment and Forestry has
identified 29 sectors/ industries to get EIA clearance before seeking approval for setting up
factories requiring natural resource based resources and adding to environmental pollution and
waste. Second, companies to undertaking ‘Environmental Auditing’ as part of their general
financial auditing. Centre for Science and Environment had developed a Green Rating Scale
on the basis of possible Environmental Auditing for the companies in India. For a sector such
as Paper and Pulp, they have arrived at Green Ratings for a large number of companies as
reproduced in Box 3.6 . According to CSE, only three companies are just about above average
rating.

Box 3.6: GREEN RATINGS: The Indian Pulp and Paper Sector* With a score of 42.75 per cent, J K Paper Mills takes the lead in environmental performance, followed by Andhra Pradesh Paper Mills Ltd with 38.50 per cent. Both these mills have been given three leaves rating. The best company would have received five leaves rating, but sadly no one deserved it. At least, not yet. Mukerian Paper Mills and Amrit Paper Mills are the tailenders but with a neck and neck race between the poor performers.
Company Score Rank
J K Paper Mills, Orissa 42.75 1
Andhra Pradesh Paper Mills Ltd, Andhra Pradesh 38.50 2
Sinar Mas Pulp & Paper (India) Ltd, Maharashtra 37.40 #
BILT-Ballarpur Unit, Maharashtra 33.44 3
Hindustan Newsprint Ltd, Kerala 33.30 4
South India Viscose Industries Ltd, Tamil Nadu 31.73 5
Pudumjee Pulp & Paper Mills Ltd, Maharashtra 31.44 6
Tamil Nadu Newsprint & Papers Ltd, Tamil Nadu 31.40 7
ITC-Bhadrachalam Paperboards Ltd, Andhra Pradesh 31.15 8
Century Pulp & Paper, Uttar Pradesh 31.07 9
Nagaon Paper Mills, Assam 28.70 10
Seshasayee Paper & Boards Ltd, Tamil Nadu 28.20 11
West Coast Paper Mills Ltd, Karnataka 27.67 12
BILT-Asthi Unit, Maharashtra 27.10 13
BILT-Yamunanagar Unit, Haryana 25.70 14
Central Pulp Mills Ltd, Gujarat 25.35 15
Star Paper Mills Ltd, Uttar Pradesh 24.76 16
Shree Vindhya Paper Mills Ltd, Maharashtra 24.70 17
BILT-Sewa Unit, Orissa 23.75 18
Orient Paper Mills, Madhya Pradesh 22.10 19
Mysore Paper Mills Ltd, Karnataka 21.60 20
Cachar Paper Mills, Assam 21.43 21
Rama Newsprint & Papers Ltd, Gujarat 21.10 22
BILT-Chaudwar Unit, Orissa 21.06 23

Third, there are environmental regulations on companies on pollution and disposal of
waste etc. For instance, the Central Pollution Control Board has identified 18 categories of
major polluting industries for priority action. In addition, they have listed 64 types of polluting
industries/industrial activities as “Red Category”. The stipulated control measures to reduce the
extent of pollution and disposal of hazardous waste and chemicals require the industry to
comply with the regulations. For instance the 1974 Water Act and 1981 Air Act and 1986
Environment Protection Acts empower the state and central pollution control boards to design
and implement all such regulations.
Fourth, the corporate sector may even indulge in several voluntary measures on
environmental conservation and preservation to portray their concern about the society, but
also achieving ‘Market Access’ and to get Forest Stewardship Council’s Certificate. Examples
of several large companies (e.g., Asia Brown Boveri) providing tree covers on urban and
metropolitan cities (say on road side, in parks etc.); fertilizer companies (e.g., Coromandel
Fertilizers) taking up green belt plantations on large scale; steel plants like Tata Steel talking of
maintaining parks in Jamshedpur; ICI recycling solvents; Bayer India and Gujarat Ambuja
Cements undertaking recycling of waste water etc., are visible examples.
Finally, by now about thirteen major industries have joined hands to form a Corporate
Round Table on Development of Strategies for the Environment (CoRE), under the overall
guidance of Tata Energy Research Institute. This CoRE has identified for itself the following
activities as part of corporate responsibility. They are:
I. Green-belt Development
II. Development of Eco-villages
III. Hazardous waste inventory and management
IV. Tissue culture application in Afforestation activities
V. Biotechnological methods to reduce pollution
In all the above situations or modalities, companies do show the implied costs in the
usual on financial auditing. But showing them exclusively as Environmental Audit, in addition
to Financial Audit will be useful. On similar lines, Energy Audit can also be introduced.
3.4.3: What has been the progress so far?
Despite the resource dependency, the corporate sector has not so far actively involved
itself in biodiversity conservation process on a large scale. More often one comes across of the
largely negative impact in terms of over-exploitation (e.g. of medicinal plants), habitat
destruction by diversion and pollution, displacement of rural livelihoods based on bio-
resources, and so on. As society becomes increasingly aware of the critical need to protect the
natural environment, public intolerance on the rate of over-exploitation is on the increase.
Sooner or later, the corporate sector has to move towards more responsible and just modes of
functioning. Further, a number of national actions are following up the Convention on
Biological Diversity, launched in 1992 and ratified by most countries of the world including
India. Amongst these are the proposed Biological Diversity Bill, and the ongoing National
Biodiversity Strategy and Action Plan. These and other moves will affect several business
sectors involving the use of biological sources.
3.4.3.1:Likely effects of recent moves
Some of the areas, where the effects are likely to be felt are as follows:
Restrictions on long-term access to, and availability of, biological resources
Restrictions on land and water access for exploration and development: Water and Land Acts of
1974, amended in 1988.
More stringent requirements for environmental impact assessments
Restrictions on trade in products determined to be “biodiversity unfriendly”, including
threatened species: Anti-dumping laws, Export ban on animal hides and skins (reference to
Response of the Government on starred question 151 in Lok Sabha on 06-03-2000)
Voluntary and legislative measures to protect biodiversity: Public interest litigation rights
Liability for not protecting biodiversity
Strict codes for ensuring safety in biotechnology
Public support to “biodiversity friendly” products. Green labeling and rating
3.4.3.2:Sectoral responsibilities
Although biodiversity has a broad impact on all business operations, it is an essential
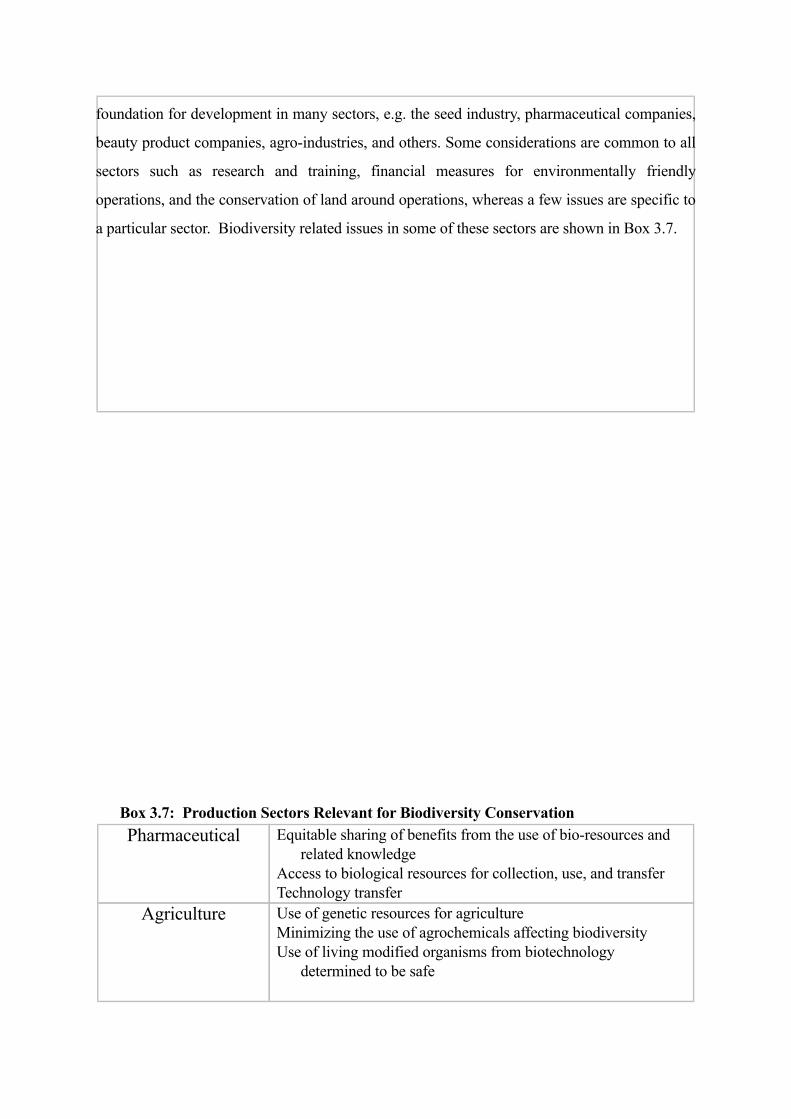
foundation for development in many sectors, e.g. the seed industry, pharmaceutical companies,
beauty product companies, agro-industries, and others. Some considerations are common to all
sectors such as research and training, financial measures for environmentally friendly
operations, and the conservation of land around operations, whereas a few issues are specific to
a particular sector. Biodiversity related issues in some of these sectors are shown in Box 3.7.
Box 3.7: Production Sectors Relevant for Biodiversity ConservationPharmaceutical Equitable sharing of benefits from the use of bio-resources and
related knowledgeAccess to biological resources for collection, use, and transferTechnology transfer
Agriculture Use of genetic resources for agricultureMinimizing the use of agrochemicals affecting biodiversityUse of living modified organisms from biotechnology
determined to be safe

Forestry Use a diversity of native species, rather than monocultures and exotics, in afforestation
Avoidance of chemicalsLinking industries with farmers, for provision of raw materials in
ways that are sustainable and do not displace small farmers or food-producing lands
R&D for non-wood alternatives to reduce demand on forestsFishery Sustainable use of marine resources and ‘mariculture’ practices.
Priority to small-scale fisherfolk over large-scale commercial ventures.
Petroleum Access to land, marine and coastal areasDetailed environmental impact assessments (EIAs)
Manufacture/Retail Public interest in biodiversity-friendly products.Appropriate technology transferPollution control measures in manufacturing processBoost to small-scale biodiversity enterprises
3.5: Market Based Instruments in India
Pollutions affect the biodiversity resources very adversely. In the state of
environmental management, traditionally only the non-market policy instruments are talked
about. They include command-and-controls (CAC). The CAC instruments are in the form of
fines, penalties and threats of legal action for closure of the factories and imprisonment of the
owners who violate the environmental laws and regulations. In India the Central and State
Pollution Control Boards are established after 1986 Environment Protection Act, to do this job.
They can be used either for facilitating the use of specific technologies for the environment
management or for the realisation of specific environmental standards. However, in most
countries it is found that often the cost of imposing and implementing compliance are generally
higher. Also their effectiveness is not certain.
Alternative to these are the Market Based Economic instruments. They can be divided
in to three categories: price based instruments, quantity based instruments and hybrid
instruments. Together with supply-demand forces of the market they achieve efficiency even
with the presence of environmental externalities like air and water pollution.
The price based instruments are in the form of taxes and subsidies to deal with

detrimental and beneficial environmental externalities in production and consumption.
Instances are pollution taxes on a polluting commodity either through its production (paper,
leather, electricity etc.) or consumption (cigarette, packed food etc.) or on a polluting input
(fuel inputs, chemicals etc.). Also, there can be subsidies on the commodities the production of
which generate environmental benefits (e.g., neighbor’s rose garden giving one the free benefit
of beauty).
An alternative to the price based method is the quantity approach. Here, the permissible
total pollution load in a region or area is first established. Then, a system of tradable pollution
rights is introduced. Tradable permits are issued to the concerned producers, who have the
rights to sell the extra pollution allowances if their individual emissions are lower than the
minimum limit, or they have to buy the extra permits from others. In any case the total
emissions would not have gone beyond the quantity established on a minimum tolerance basis.
In practice, neither the economic instruments alone nor the command and control
measures alone feasible. A hybrid approach is feasible. Fixation of pollution standards (e.g.,
MINAS) apriori by Pollution Control Boards and using either pollution tax or marketable
permits instrument to induce the polluter industry to meet those standards is a hybrid method
using regulatory and economic instruments.
A community based method is yet another alternative. Under this approach, producers
can pool their pollution loads and share to establish a combined effluent treatment plant
(CETP) and manage the pollution complying with the regulations at the minimum cost. This
type of CETP has been established by now in the textile, leather sectors in India (e.g., in Tirpur
for textiles, in several places in Tamil Nadu for tanneries).
In India at present, no major innovations on the market based or the hybrid approach
are implemented. The community approach however has been introduced on an experimental
basis in sectors such as textile, chemicals, and leather manufacturing. It is time that a separate
Working Group is established to go into the feasibilities of the various market based
approaches, sector by sector, and come up with recommendations on their introductions and
action plans.

3.6: Links with External Donor Agencies
3.6.1: Externally-aided projects under implementation and in the pipeline
India always had a number of bilateral donor agency development aid for biodiversity
conservation. In the early phase of their involvement, the Social Forestry was the focus. With
very limited involvement of the people of the region wherever the projects were introduced,
very little success was realized. With the lessons form Social Forestry, the door agencies took
up Joint Forest and Eco-Development Programmes in India. Some of the recent trend in these
biodiversity conservation activities are summarised in Table 3.5.
Table 3.5: Involvement of Donor Agencies in Biodiversity Conservation/RestorationA. Projects under implementation
Sl. No. Name of Project Funding Agency
Project Cost (in million Rupees)
Duration of the project
in years
Physical target
(000 ha.)
1. Maharashtra Forestry Project
World Bank
4315.1 8 369
2. Andhra Pradesh forestry Project
World Bank
3539.2 6 355
3. Tamil Nadu Afforestation Project
OECF (Japan)
4992.0 6 405
4. Capacity Building Project for participatory Management
SIDA (Sweden)
85.0 2 19
5. Dungarpur Integrated Wastelands Development Project
SIDA (Sweden
282.1 7 47
6. Rehabilitation of Common Lands in Aravali’s
EEC 481.5 10 33

7. Afforestation & Pasture Development along in Indira Gandhi Canal
OECF (Japan)
1075.0 10 61.5
8. Afforestation of Aravali Hills
OECF (Japan)
1766.9 7 115
9. Western Ghat forestry Project
DFID (U.K)
842.0 7 61
10. Forestry and Eco -development Project in Changer
GTZ (Germany
187.0 5 11
11 Forestry Project Kullu- Mandi
DFID (U.K)
139.2 6 7
12. Uttar Pradesh Research Project
World Bank
2720.0 4 160
13. Madhya Pradesh Forestry Project
World Bank
2459.4 5 235
14. Rajasthan Forestry Project
OECF (Japan)
1391.8 5 55
15. Integrated Gujarat Forestry Development Project
OECF (Japan)
6085 6 230
16. Eastern Karnataka Afforestation Project
OECF (Japan)
5655.4 6 171
17. Punjab Afforestation Project
OECF (Japan)
4420* 8 59
18. Kerala Forestry Project
World Bank
1830 4 54
19. Capacity Building Project for Rehabilitation of Degraded forests through Land Scape Participatory Programme
AUSAID(Australia)
11.7 3
Grand Total 42,278.3 2447Note: Invariably these are the projects funded in the 90’s*Loan amount has been provided for four years only in the first phase.
Comment:The average plantation cost of external agencies funded projects is about Rs. 16911.32 / ha. as compared to Rs. 4806.00 / ha. for social forestry projects by the external agencies in the 80’s.
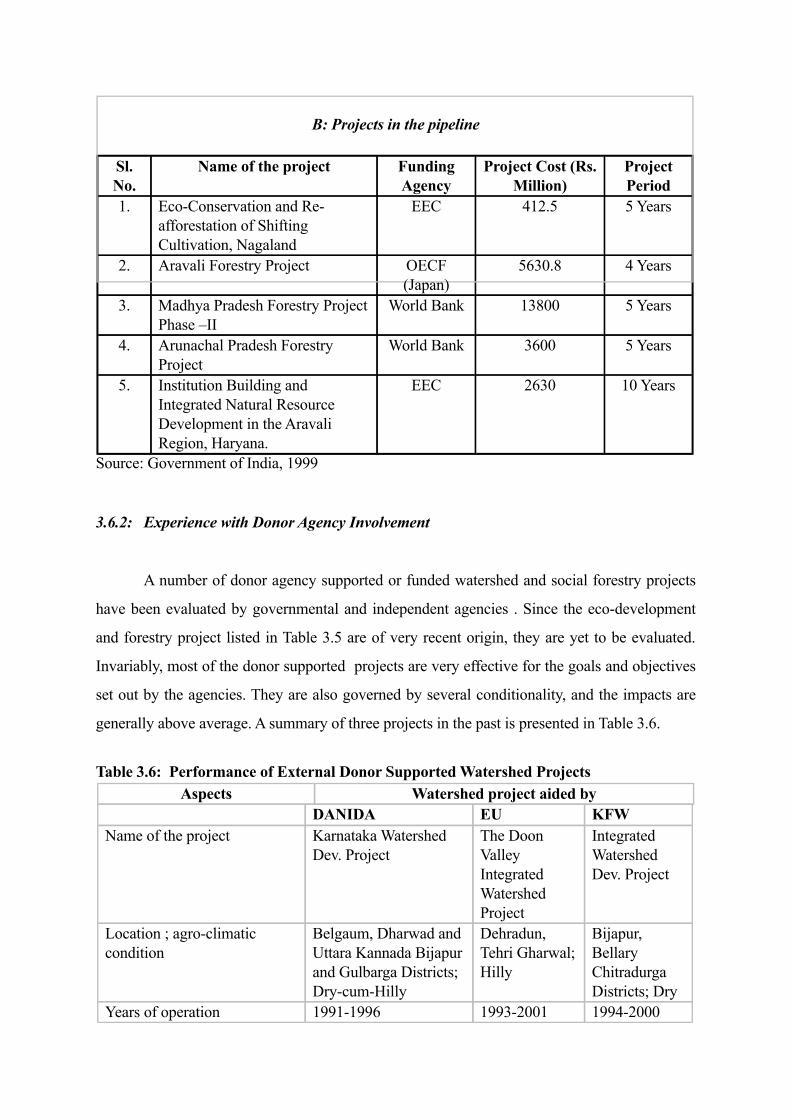
B: Projects in the pipeline
Sl. No.
Name of the project Funding Agency
Project Cost (Rs. Million)
Project Period
1. Eco-Conservation and Re-afforestation of Shifting Cultivation, Nagaland
EEC 412.5 5 Years
2. Aravali Forestry Project OECF(Japan)
5630.8 4 Years
3. Madhya Pradesh Forestry Project Phase –II
World Bank 13800 5 Years
4. Arunachal Pradesh Forestry Project
World Bank 3600 5 Years
5. Institution Building and Integrated Natural Resource Development in the Aravali Region, Haryana.
EEC 2630 10 Years
Source: Government of India, 1999
3.6.2: Experience with Donor Agency Involvement
A number of donor agency supported or funded watershed and social forestry projects
have been evaluated by governmental and independent agencies . Since the eco-development
and forestry project listed in Table 3.5 are of very recent origin, they are yet to be evaluated.
Invariably, most of the donor supported projects are very effective for the goals and objectives
set out by the agencies. They are also governed by several conditionality, and the impacts are
generally above average. A summary of three projects in the past is presented in Table 3.6.
Table 3.6: Performance of External Donor Supported Watershed ProjectsAspects Watershed project aided by
DANIDA EU KFWName of the project Karnataka Watershed
Dev. ProjectThe Doon Valley Integrated Watershed Project
Integrated Watershed Dev. Project
Location ; agro-climatic condition
Belgaum, Dharwad and Uttara Kannada Bijapur and Gulbarga Districts; Dry-cum-Hilly
Dehradun, Tehri Gharwal; Hilly
Bijapur, Bellary Chitradurga Districts; Dry
Years of operation 1991-1996 1993-2001 1994-2000
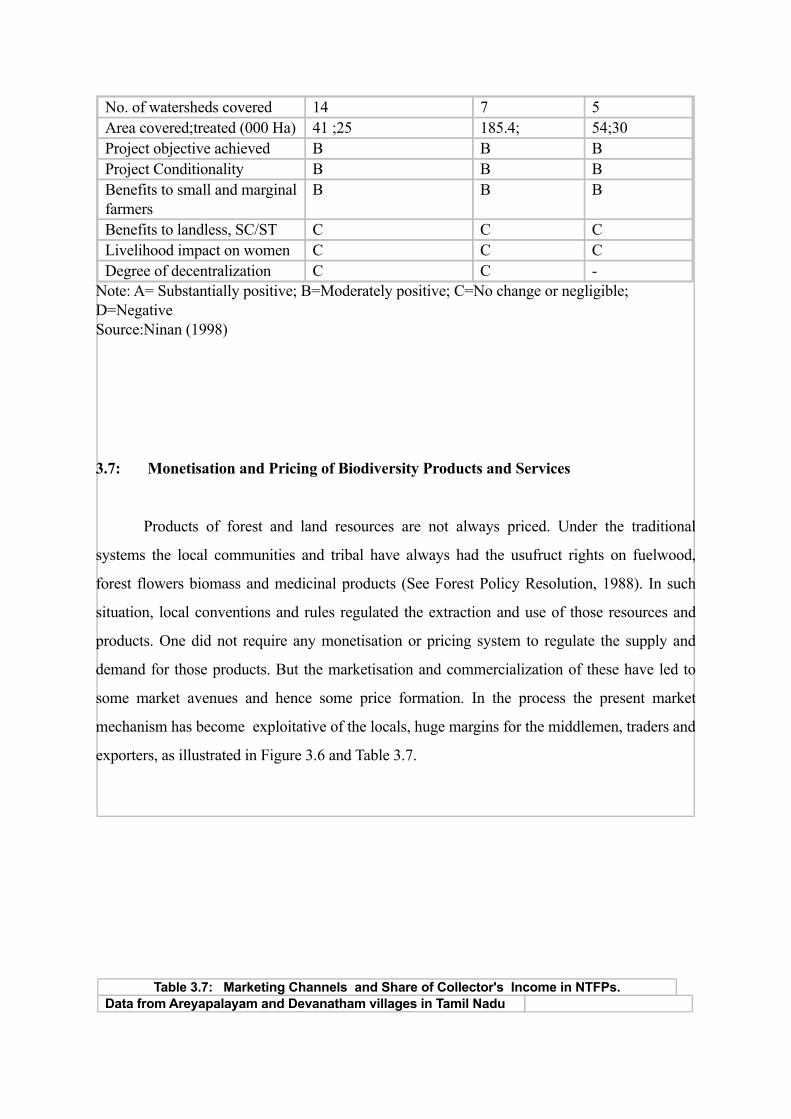
No. of watersheds covered 14 7 5Area covered;treated (000 Ha) 41 ;25 185.4; 54;30Project objective achieved B B BProject Conditionality B B BBenefits to small and marginal farmers
B B B
Benefits to landless, SC/ST C C CLivelihood impact on women C C CDegree of decentralization C C -
Note: A= Substantially positive; B=Moderately positive; C=No change or negligible; D=NegativeSource:Ninan (1998)
3.7: Monetisation and Pricing of Biodiversity Products and Services
Products of forest and land resources are not always priced. Under the traditional
systems the local communities and tribal have always had the usufruct rights on fuelwood,
forest flowers biomass and medicinal products (See Forest Policy Resolution, 1988). In such
situation, local conventions and rules regulated the extraction and use of those resources and
products. One did not require any monetisation or pricing system to regulate the supply and
demand for those products. But the marketisation and commercialization of these have led to
some market avenues and hence some price formation. In the process the present market
mechanism has become exploitative of the locals, huge margins for the middlemen, traders and
exporters, as illustrated in Figure 3.6 and Table 3.7.
Table 3.7: Marketing Channels and Share of Collector's Income in NTFPs.Data from Areyapalayam and Devanatham villages in Tamil Nadu
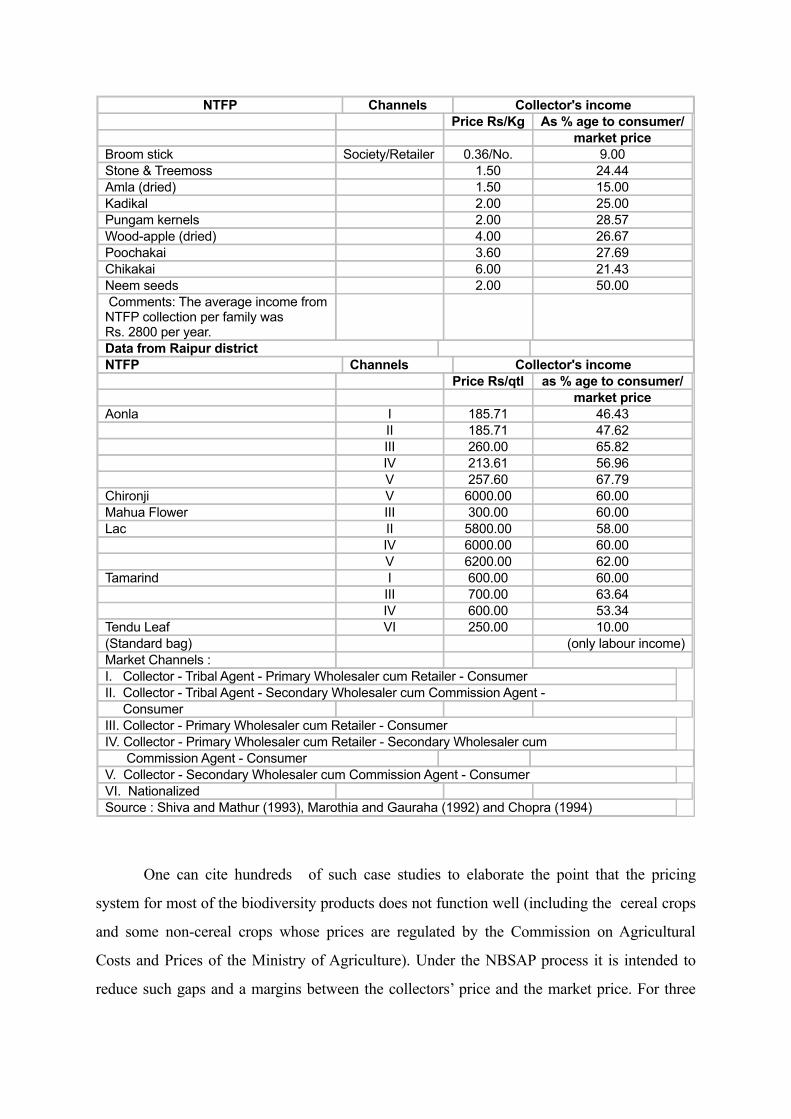
NTFP Channels Collector's income Price Rs/Kg As % age to consumer/ market priceBroom stick Society/Retailer 0.36/No. 9.00Stone & Treemoss 1.50 24.44Amla (dried) 1.50 15.00Kadikal 2.00 25.00Pungam kernels 2.00 28.57Wood-apple (dried) 4.00 26.67Poochakai 3.60 27.69Chikakai 6.00 21.43Neem seeds 2.00 50.00 Comments: The average income fromNTFP collection per family wasRs. 2800 per year.
Data from Raipur district NTFP Channels Collector's income Price Rs/qtl as % age to consumer/ market priceAonla I 185.71 46.43 II 185.71 47.62 III 260.00 65.82 IV 213.61 56.96 V 257.60 67.79Chironji V 6000.00 60.00Mahua Flower III 300.00 60.00Lac II 5800.00 58.00 IV 6000.00 60.00 V 6200.00 62.00Tamarind I 600.00 60.00 III 700.00 63.64 IV 600.00 53.34Tendu Leaf VI 250.00 10.00(Standard bag) (only labour income)Market Channels : I. Collector - Tribal Agent - Primary Wholesaler cum Retailer - ConsumerII. Collector - Tribal Agent - Secondary Wholesaler cum Commission Agent - Consumer III. Collector - Primary Wholesaler cum Retailer - ConsumerIV. Collector - Primary Wholesaler cum Retailer - Secondary Wholesaler cum Commission Agent - Consumer V. Collector - Secondary Wholesaler cum Commission Agent - ConsumerVI. Nationalized Source : Shiva and Mathur (1993), Marothia and Gauraha (1992) and Chopra (1994)
One can cite hundreds of such case studies to elaborate the point that the pricing
system for most of the biodiversity products does not function well (including the cereal crops
and some non-cereal crops whose prices are regulated by the Commission on Agricultural
Costs and Prices of the Ministry of Agriculture). Under the NBSAP process it is intended to
reduce such gaps and a margins between the collectors’ price and the market price. For three
reasons: I. First, for the collectors and local communities it should be an empowerment and
income avenue,II. Second, even the local communities should realize its true worth or value, III. Third, the gains from the natural resource extraction and use should by and large be
based on in-situ distributional benefits,IV. Fourth, it should be corrective for sustainable rates extractions (based on the concept of
carrying capacity), proper use of land and water resources and ecological conservation.
3.8: Links with Livelihood and Life Styles
As much as proper monetisation and pricing is important for conserving biodiversity
resources, their links with livelihood and emerging life styles of the people should be looked in
to in the NBSAP process. Two major statements can be made here. First, even at this stage of
SAP and Economic Reforms in India, considerable degree of dependency of the local
communities on the common property resources exist (Kadekodi, 2001). Second, the life styles
of urban and semi-urban communities have been shifting considerably towards using the
biodiversity related products, but more and more in processed forms. As stated elsewhere
(Section 3.2.1), food processing has emerged as a major industry in India, in addition to, of
course, cosmetics and pharmaceuticals based on herbal and medicinal plants.
A number of case studies elaborate these two points. According to the World Resources
Institute (1990), nearly 500 million people in India depend upon on non-timber forest products
(NTFP) for their livelihood. NTFP collection generates about 1063 million man-days of
employment in India (Khare, 1989). In other words, common property resources provide a
significant component of income and growth of the masses. According to him at the national
scale, about 50% of income of about 20-30 % of rural population comes from NTFPs. At the
micro-level, Saxena et al (1997) have identified income from an NTFP product such as oppage
collection as Rs. 250 per day during June-September in Uttara Kannada district of Karnataka.
Janapara Vigyana Samsthe, an NGO have estimated the NTFP links in Uttara Kannada as
shown in Table 3.8.
Table 3.8: NTFP-Livelihood Linkages

Income from NTFPs
Income from NTFP for Siddi & SC community
Number of economically significant NTFPs
Av. No. hours spent on NTFP collection
Yellapur 31% 78% 30 4 per dayHaliyal 24% 40% 29 4 per day
The famous Sukhomajri-Nada Hill Resources Management Society’s data reveals a
very fascinating picture of livelihood linkages of the local communities with bhabbar grass
protection and rope making activity by the communities (Kadekodi, 2001). Almost all the
families of Nada village are engaged in rope making from bhabbar grass. The summary of the
livelihood support computations are: I. Imputed wage income from bhabbar harvesting= Rs. 543 to 747 per hectareImputed wage income from bhabbar grass activity up to rope making= Rs. 12281 to
Rs. 13585 per hectare. I. Imputed wage income from bhabbar grass harvesting and rope making = Rs. 12281 to 13585 per hectare
II. Net income from rope making (after allowing for capital charges, cost of bhabbar as input etc.)=Rs. 391.86 per quintal of rope
III. Net income from rope making per hectare of bhabbar grass activity=Rs. 18 to 19 thousand.
IV. Even if one family has access to one hectare of forest area, it would give sufficient income for a family for over 6 months.
Talking of livelihood and equity, there is a revealing linkage between CPR and the poor.
The poor people in India highly depend upon the products of CPR significantly. Good
examples are collection of fuelwood, fodder and non-timber forest products, water. According
to Jodha (1986) about 30% of landless labor and small farmers in Rajasthan consume only CPR
food items. In Madhya Pradesh this dependency is 50%. In Rajasthan about 42% of household
income is from CPR only. According to him, about 80% of rural poor depend on CPRs for food
and almost 100% for fuel, fodder and fibre.
Because of its nature as direct or home-grown or collected consumption and income in
kind, CPR products enjoyed by the rural poor do not show up in their incomes and livelihood
status. But if one accounts for these, it amounts to a significant portion of their incomes and
consumptions, thereby making their livelihood income respectable. Among the rural population
therefore, the actual disparity in consumption is much less than as being reflected in the official
statistics of income and consumption. This fact is also revealed through various NSS surveys
on consumer expenditures. This fact is very significantly shown by Jodha (1994). To quote
him:
“Certain inferences can be drawn from this Table [Reproduced here as Table 3.9]. The rural poor receive the bulk of their fuel supplies and fodder from the commons, which make them important sources of employment and income, especially when other opportunities are nonexistent. Income from common lands is likely to be significantly underestimated. Nevertheless, products of the commons account for 14 to 23 percent of household income …..More importantly, if incomes from the commons is included in total household income, the gap between rich and the poor groups is reduced.”
Jodha (1994), p. 341
Table 3.9: Livelihood Linkages with Common Property ResourcesGini coefficient on
incomeNo. of Househ
old fromg
Districts by income
Annual
% income All All sources except
and villages
categoriesb
Fuelc
Animal
Employmente
incomef
From sources
CPRs(%)

by state (%) grazing
Days (Rs) CPRs
Andhra Poor 84 - 139 534 17 0.41 0.50Pradesh (1,2)
Others 13 - 35 62 1 0.41 0.50
Gujarat (2.4)
Poor 66 82 196 774 18 0.33 0.45
Others 8 14 80 185 1 0.33 0.45Karnataka Poor - 83 185 649 20 - -(1,2) Others - 29 34 170 3 - -Madhya Poor 74 79 183 733 22 0.34 0.44Pradesh (2,4)
Others 32 34 52 386 2 0.34 0.44
Maharashtra
Poor 75 69 128 557 14 0.40 0.48
(3,6) Others 12 27 43 177 1 0.40 0.48Rajasthan Poor 71 84 165 770 23 - -(2,4) Others 23 38 61 413 2 - -Tamil Nadu Poor - - 137 738 22 - -(1,2) Others - - 31 164 2 - -Source: Jodha 1986a. CPRs include community pasture, village forests, waste land, watershed drainage, river and stream banks, and other common lands. Data indicate average area per village.b. The number of sample households from each village varied from 20 to 36 in different districts. "Poor" house-Holds are defined as agricultural laborers and small farmers (< 2 ha dry land equivalent). "Others" includes largeFarm households only.c. Fuel gathered from CPRs as proportion of total fuel used during three seasons covering the whole year.d. Grazing days per animal unit on CPRs as a percentage of total grazing days per animal unit.e. Total employment from CPR product collection.f. Income derived mainly from CPR product collection. The estimation procedure underestimated the actual Income derived form CPRs.g. A higher Gini coefficient indicates a higher degree of income inequalities. Calculations are based on income Data for 1983-84 from a panel of households covered under ICRISAT's village level studies The panel of 40 households from each village included 10 households from each of the categories,Namely large, medium, and small farm households and laborer households.
Statistics apart, for NBSAP process, the significance of the livelihood linkage should be
completely understood. The dependency on such biodiversity resources is partly to supplement
the income, and partly they play the role of risk aversion under various exigencies such as
floods, draughts and calamities. That is why the local communities always maintained all such
resources as sacred.
3.9: Strategy and Action on Economic Aspects
3.9.1:On Budget Allocation:
Government Budget allocation for the Ministry of Environment and Forests is at
present a mixed bag. It be related to biodiversity areas and activities, and not based on
anthropogenic activities. O For this purpose, the identification of biodiversity related areas as
shown in Box 3.1 can be used. In order to work out the specific rates of resource allocation for
various components, an Expert Group may have to go in to these. The degree of criticality of
these areas, the livelihood dependency on them, the long term sustainability of those resources
etc. will have to be used as the relevant criteria. Budget allocation can be based on (i) research
and development, (ii) for protection and conservation, (iii) for promotion and awareness, (iv)
for short term and long term planning etc.
Till such time a formula is worked out, the present Thematic Working Group
recommends maintaining a 3% share of total revenue expenditure and another 3% share in
capital expenditure exclusively for natural resource development in the states. At the MoEF
level, at least 6% of GDP be allocated for all activities including biodiversity, and 3%
exclusively fro forestry and wildlife preservation.
3.9.2: Sharing the Responsibility on Resource Mobilisation
The responsibility of resource mobilization is not only with the government abut also
lies with the corporate sector, external donor sector and public at large This sharing mechanism
also need to be fully understood and worked out at least once in five years. The same Expert
Group also can look this in to. Finally, there is the question of introducing proper market based
instruments to regulate the use of biodiversity related resources. Specifically in the area of
water resource management, use of forest resources and marine resources, the types of market
based instruments would differ. Separate studies are required to be carried out on this issue of
appropriate instruments, to look in to who gains and who loses from such market based
instruments.
3.9.3: Action and strategy regarding WTO-GATT matters
1. A share of profits made from the new variety goes, on behalf of the communities, into a
National Gene Fund. But it is very much poorly, even incompletely, written [Section 46 (2) d].
The Gene Fund should be the recipient of all revenues payable to the farming communities
under various heads. The use of the money should not be restricted to conservation or for
maintaining ex situ collections. That would mean that the revenue generated from the use of
farmer varieties would partly be used to maintain the National Gene Bank in Delhi (Sahai,
2001).
2. The attempt at global standardization and uniformity by way of TRIPs agreement is in
conflict with the main thrust of the Rio Earth Summit of 1992 that set out the conditions for
sustainable development. These two reveal two contrasting types of international approaches
and norms. While the 1992 Earth Summit and the 1993 convention on bio-diversity (CBD)
focused on ‘diversity’ as being fundamental to sustain life and development, TRIPs and WTO
are pushing for ‘conformity’ to international standardized norms on patents, services, labour,
investment and what not, irrespective of their history, ecology, level of economic development,
etc. The areas of intellectual property that the TRIPs agreement covers are: copy right and
related rights; trademarks including service marks; geographical indications including
appellations of origin; industrial designs; patents including the protection of new varieties of
plants; the layout-designs of integrated circuits and undisclosed knowledge including trade
secrets and test data ( Dasgupta, 1999).There is the need for perfect transparency in the patent
and TRIP regulations down to the farmer levels.
3.9.4: Action Oriented Role for the Corporate sector
Keeping in view the above, it is vital that the corporate sector should actively
participate in biodiversity conservation initiatives by accepting responsible roles in
implementing and managing various conservation and sustainable use programmes. A key
entry point for corporate sector is through the country’s national biodiversity planning process

where its knowledge and expertise can be utilized effectively. It would also help corporate
sector as its legitimate interests would be represented in the development of government
polices and programs, guidelines and other management tools. Conservation of biodiversity
should be at the heart of the company’s management strategy. This means, it should help to try
to retain natural areas wherever possible, to restore degraded areas and to harvest resources
sustainably. It should also respect and support the livelihoods and rights of communities
dependent on biodiversity, and promote cultural diversity and values relevant to biodiversity. In
fact, the companies may develop a formal biodiversity policy or incorporate biodiversity into
its existing environmental policies. A stress on labour-intensive methods would be one step in
this. Biodiversity strategy and policies of individual companies should reflect or recognize the
national biodiversity strategy, and should adhere strictly to existing and proposed laws on
wildlife and biodiversity. They should keep abreast of the discussions and developments
relating to national guidelines for incentive measures, biosafety, equitable benefit-sharing,
intellectual property rights, monitoring of biodiversity indicators and other related topics.
In light of the above, it is proposed that corporate sector may be involved in a two-way
process in the NBSAP: to provide inputs into the process, and to learn from it to imbibe and
integrate biodiversity concerns into corporate attitudes, programmes and policies. This can be
attained in one or the other ways listed below:
I. As part of the action plan, the corporate sector will have to act together with the farmers
on at least two counts. First, they will have to get to the business of investing on ’seed
development and supply of infrastructure’; second, they should enter in to a clearly
defined ‘ buy back system, ensuring the right price.
II. They should interact closely with the state and central governments to pickup the
threads hand in hand to promote biodiversity conservation. Financial resource pooling
is one such approach. This is a matter of sharing responsibility in financing biodiversity
conservation between the corporate sector state and central government, a process
initiated by CII already.
III. Corporate sector can develop in-house biodiversity policies and strategies to manage
the biological resources the company affects and also respect the concerns of local
communities and other stakeholders. Methods for education and training to instill a
biodiversity conscious culture within company management should be explored. An
example is that of TVS Suzuki cited earlier.
IV. They can share information, knowledge and practices with the local communities
(lessons from examples such as the benefit-sharing arrangement between the Kani tribe,
the Tropical Botanic Garden Research Institute, and the Arya Vaidya Pharmacy Ltd, to
develop a herbal drug based on adivasi knowledge, can be learnt from).
V. They should adopt measures, which ensure sustainable use of biological resources.
The measures may be explored for the moral responsibility of corporate sector going
beyond monetary and material consideration such as respecting the sanctity of critical
natural habitats and threatened species.
VI. They should create awareness regarding the need for appropriate intellectual rights
regimes, respecting the knowledge, innovations and practices of indigenous and local
communities and ensuring that collection and use of biological and genetic resources is
done within a framework/guidelines of such respect.
VII. Engage in active partnership amongst corporate sector, research institutions and
biodiversity conservation organizations as well as with the general public and with local
communities for the management of important species and ecosystems. In this, the
corporate sector needs to accept the guidance of biodiversity specialists and local
communities. The research collaborations should be encouraged to have appropriate
financial agreements, training of/by scientists, and transfer of appropriate technologies.
VIII. Instituting incentives and awards for members of the corporate sector who
adhere to a definition of "progressive" in terms of being biodiversity-friendly and
respectful of local community livelihood rights.
3.10: From Economics to Valuation
Biodiversity is not only an ecological and intrinsic entity but it has to exist amidst a
social fabric. The intrinsic value of biodiversity (values in themselves and, nominally, unrelated
to human use) may be unique for all societies. But different societies look at them differently
from social perspectives, depending upon their social values and relevance. Value to a society
depends upon on many things, besides its ecological significance. Biological resources
therefore can have, apart from an intrinsic value, another values, to be loosely called as

Economic value.
Intrinsic values are relevant to conservation decisions, but they generally cannot be
measured (Pearce and Moran, 1994). Therefore, at this stage it is important to note that
biodiversity valuation normally entails measuring the economic value of biological resources,
not holistically the intrinsic value of biodiversity. However, valuing biodiversity should further
be extended to get some idea of people’s preferences (willingness to pay) for 'intrinsic values'.
As a result, biodiversity valuation focuses on biological resources such as forests, wetlands,
mangroves, water bodies and marine habitats (undisturbed or sustainably managed) that
maintain current or potential human uses. Such a focus is more tractable for an action oriented
process such as NBSAP. It is equally important to note that biological resources are also subject
to human preferences, which places them firmly within the purview of economic analysis.
Valuation can also do several other things. Firstly, it is a tool that can be used to
gauge the performance of this so call biodiversity sector in the overall economic settings.
Secondly, it can enable the policy makers to design and correct the kinds of interventions
required. Thirdly, it brings in transparency among the various stakeholders. Needless to claim
that it can add to sustainability of the resources.

C H A P T E R - F O U R
VALUING BIODIVERSITY
4.1: Why do we have to value biodiversity?
It is already stated in Section 3.10 about the need for valuation of biodiversity
resources. The argument is further strengthened here. The starting point is that there can
be a difference between value and price. Value of a commodity is a complex entity
based on some theory, some philosophy and concepts of rationality. The theory can be
utilitarian or intrinsic. The philosophy can be existence (say, right to exist). The
rationality can be equity (say, inter and intra-generational). For various reasons this
value is not always revealed by people. Price of a commodity (or service) on the other
hand, reflects a balance between what a buyer or a consumer is ‘willing to pay’ and a
seller is ‘willing to accept’. This is commonly (or some times loosely ) called supply-
demand analysis. This is based on an assumption of existence of a market. When it
comes to biodiversity resources, many have no market; hence they may not have a price.
But they may still have a value. In the absence of a market, the governments of the
nations may fix a price administratively. Such a price also may not reflect the value.
Typical examples of such a situation can be with the price of kerosene fixed by the
government, but not reflecting its value. Most of the biodiversity linked resources have
significant divergence between value and price. Under certain special conditions, the
value can also be equal to price, and vice-versa.
Therefore, when it comes to natural and biodiversity resources, economic values as
measured conventionally using market prices are inadequate in themselves in that they
fail to reflect environmental impacts and the true costs. This is basically due of the fact
that markets are imperfect and externalities arising out of the use of a resource are not
captured in the market price, undervaluing a resource below what its price should be.
There are at least six reasons for valuing biodiversity resources separately.
¬ First, there is the situation of missing market. In the absence of market, values of goods and services are not revealed. For instance, there are no markets for eco-system services such as nutritional cycle, watershed functions, temperature
control, soil conservation etc. ¬ Second, even if there are markets, they do not do their job well. For instance,
market may be a regulated one. There may be restrictions on one’s entry into it either to buy or sell. An example of entry barrier is ‘the State Forest Trading Corporations’ having the exclusive rights to sell forest products. An example of regulated market is kendu leaves prices fixed by the cooperatives in Madhya Pradesh. One may say that there is a market for carbon sequestration. But the so called ‘market for carbon trading” is very restricted and regulated by international politics and relations. Various possible cases of market failures are shown in Box 4.1.
¬ Third, for most biodiversity goods and services, it is essential to understand and appreciate its alternatives and alternative uses. For instance, alternative to fuelwood can be kerosene. Alternative uses of bhabbar grass (a biodiversity produce for sure) can be for making ropes or pulp making in a paper mill. Because of this, alternative value or opportunity costs are also relevant.
¬ Fourth, uncertainty involving demand and supply of natural resources, especially in the future. Most economic markets capture, at best the current preferences of the buyers and sellers. But when it comes to biodiversity resources, there are several types of uncertainties about the future demands and supplies. Therefore, valuation beyond the present is also necessary as an option.
¬ Fifth, government may like to use the valuation as against the restricted, administered or operating market prices for designing biodiversity conservation programmes (including inviting external donor agencies and corporate sectors and for negotiating carbon credits and so on).
¬ Finally, in order to arrive at natural resource accounting, for methods such as Net Present Value methods, valuation is a must.
Box 4.1: Types of Market Failure
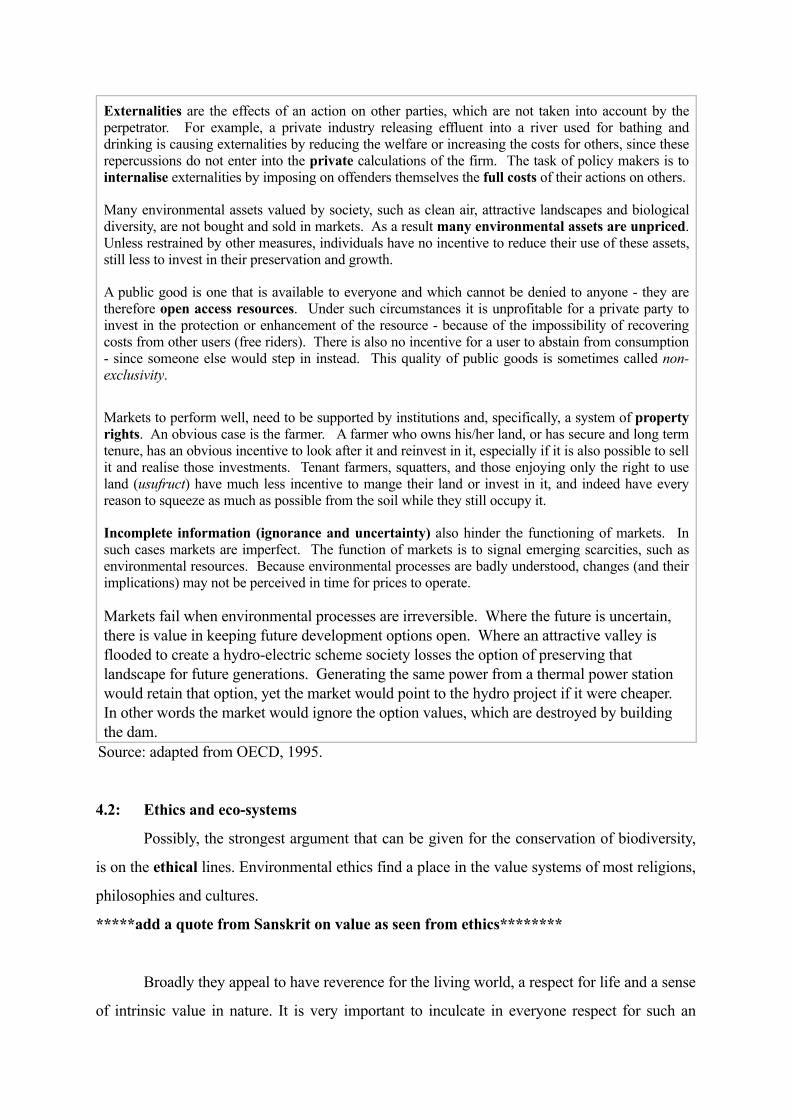
Externalities are the effects of an action on other parties, which are not taken into account by the perpetrator. For example, a private industry releasing effluent into a river used for bathing and drinking is causing externalities by reducing the welfare or increasing the costs for others, since these repercussions do not enter into the private calculations of the firm. The task of policy makers is to internalise externalities by imposing on offenders themselves the full costs of their actions on others.
Many environmental assets valued by society, such as clean air, attractive landscapes and biological diversity, are not bought and sold in markets. As a result many environmental assets are unpriced. Unless restrained by other measures, individuals have no incentive to reduce their use of these assets, still less to invest in their preservation and growth.
A public good is one that is available to everyone and which cannot be denied to anyone - they are therefore open access resources. Under such circumstances it is unprofitable for a private party to invest in the protection or enhancement of the resource - because of the impossibility of recovering costs from other users (free riders). There is also no incentive for a user to abstain from consumption - since someone else would step in instead. This quality of public goods is sometimes called non-exclusivity.
Markets to perform well, need to be supported by institutions and, specifically, a system of property rights. An obvious case is the farmer. A farmer who owns his/her land, or has secure and long term tenure, has an obvious incentive to look after it and reinvest in it, especially if it is also possible to sell it and realise those investments. Tenant farmers, squatters, and those enjoying only the right to use land (usufruct) have much less incentive to mange their land or invest in it, and indeed have every reason to squeeze as much as possible from the soil while they still occupy it.
Incomplete information (ignorance and uncertainty) also hinder the functioning of markets. In such cases markets are imperfect. The function of markets is to signal emerging scarcities, such as environmental resources. Because environmental processes are badly understood, changes (and their implications) may not be perceived in time for prices to operate.
Markets fail when environmental processes are irreversible. Where the future is uncertain, there is value in keeping future development options open. Where an attractive valley is flooded to create a hydro-electric scheme society losses the option of preserving that landscape for future generations. Generating the same power from a thermal power station would retain that option, yet the market would point to the hydro project if it were cheaper. In other words the market would ignore the option values, which are destroyed by building the dam.
Source: adapted from OECD, 1995.
4.2: Ethics and eco-systems
Possibly, the strongest argument that can be given for the conservation of biodiversity,
is on the ethical lines. Environmental ethics find a place in the value systems of most religions,
philosophies and cultures.
*****add a quote from Sanskrit on value as seen from ethics********
Broadly they appeal to have reverence for the living world, a respect for life and a sense
of intrinsic value in nature. It is very important to inculcate in everyone respect for such an

intrinsic value of biodiversity. The ethical arguments can be elaborated as follows :
♣ Each species has a right to exist. Each species has value for its own sake, an intrinsic value unrelated to human needs.
♣ All species are inter-dependent. Species interact in many complex ways in a natural community. Extinction of one species is likely to destabilise the entire community and cause the extinction of other species.
♣ Humans must live within the same ecological limitations as other species do. Technology has enabled us to break free of environmental limitations imposed on us as a species, but perhaps only temporarily. We need to recognise the need for a more sustainable lifestyle, which will reduce our impacts on other species. To that end, the supply-demand approach to valuation is deficient.
♣ People must take responsibility for their actions. Most people ignore the effects of their actions on the environment and on other species and fellow human beings. Ecological degradation including species extinctions deprives future generations of their right to inherit a wholesome earth to live in. Though economists internalise this aspect through an analysis of externality, it is not covering the changes in intrinsic and existence values as much as option values of the future of biodiversity.
♣ Resources should not be wasted. Though all efforts, including technological and policy initiatives, should be directed towards using natural resources in the most efficient manner possible, there is an ethical angle to it also.
*******quote from Sanskrit on waste*******♣ A respect for human life and human diversity is compatible with a respect for
biological diversity. It is important for all of us to appreciate the complexity and diversity of human culture as this will enable the appreciation of the diversity of the natural world and also to respect this diversity.
♣ Nature has spiritual and aesthetic values that transcend economic value. Numerous writers, poets, artists and philosophers have been inspired by nature. A loss of biodiversity will reduce the ability of people to experience nature and to be inspired by it.
Against this background, the development of methods to value specifically for
biodiversity is to be judged and put to action under NBSAP.
4.3: Valuation should begin from ecosystem functions

4.3.1: What have Ecosystem functions got to do with valuation?
It is the ethical principles laid above that lead us to take the course of eco-system
approach to valuation of biodiversity. One of the most basic problems with which we are faced
today is where to begin from, when it comes to valuation of biodiversity, particularly in
monetary terms. Closest to existence, intrinsic and option values of biodiversity is the approach
of eco-system functions that biological resources perform and their valuation as non-use values.
Most of the existing methodologies begin and end up from valuation of environmental goods
and services that they provide attributing them through demand-supply interactions. These, at
best capture the use values. But when it comes to ecosystems, even the demand and supply
curves themselves are non-existent. Therefore, there is little understanding on the
methodologies of valuation among economists and ecologists (Markandya & Costanza, 1993).
Attempts have been on to develop methodologies using ecosystem approach to
resource accounting and valuation (Pandit, 1997). The ecosystem approach (see Fig. 4.1)
envisages preparing physical accounts of biological resources by quantifying the various
natural ecosystem services, which directly or indirectly enter the market economy, yet no
organism figures individually. This can help us avoid the apprehensions that both ecologists
and economists have in general about the value of an individual plant or animal species. Some
of these, if not all, could be monetarily accounted for. However many others can not be. In such
a methodology one may require to go for indirect valuation techniques such as shadow pricing,
opportunity costs, willingness to pay (WTP), willingness to accept (WTA), travel cost method,
etc. (Mitchell & Carson, 1989; see also Pearce & Moran, 1994). But it is understood that only
the ecosystem as a whole that needs to be valued, and not by segments, parts or bit by bit.
The logical approach is to assign value to the ecosystem uses/functions as a whole,
rather than its individual components that constitute it. In the process, the constituents will
automatically get reflected and accounted for. By adopting this approach conservation becomes
not only justifiable, but also economically viable. With the tools of information technology
available, data can be obtained and processed at much higher speeds and with greater accuracy
than ever before. For instance, we can collect data on forests, forest types, their density classes
and other land-uses using the combination of remotely sensed data and geographic information
system (GIS) coupled with most important ground truthing. These technologies allow us to

make data available in various formats at local, area, regional, district or state level, which
otherwise took years to complete and was not even dependable. With the availability of this
data on digital format and also at phenomenally high resolutions, land based resource
inventorisation has become much easy.

A Simplified Version of Anthropogenic Pressures on Terrestrial and Forest Ecosystem and their Natural Functions
PR Leaf litter GrazingE FodderS Grasses LoppingS Fruit/seedsU Agri. Expans. R Forest firesES Stream hydrology Urbanisation
N Assimilation Soil protection/ A Interception formation/rejuvenation
T Regeneration Habitat structuring
U
R Fauna fish
A
L Micro-climate
Food for downstream Food for wildlife/birds Diversity
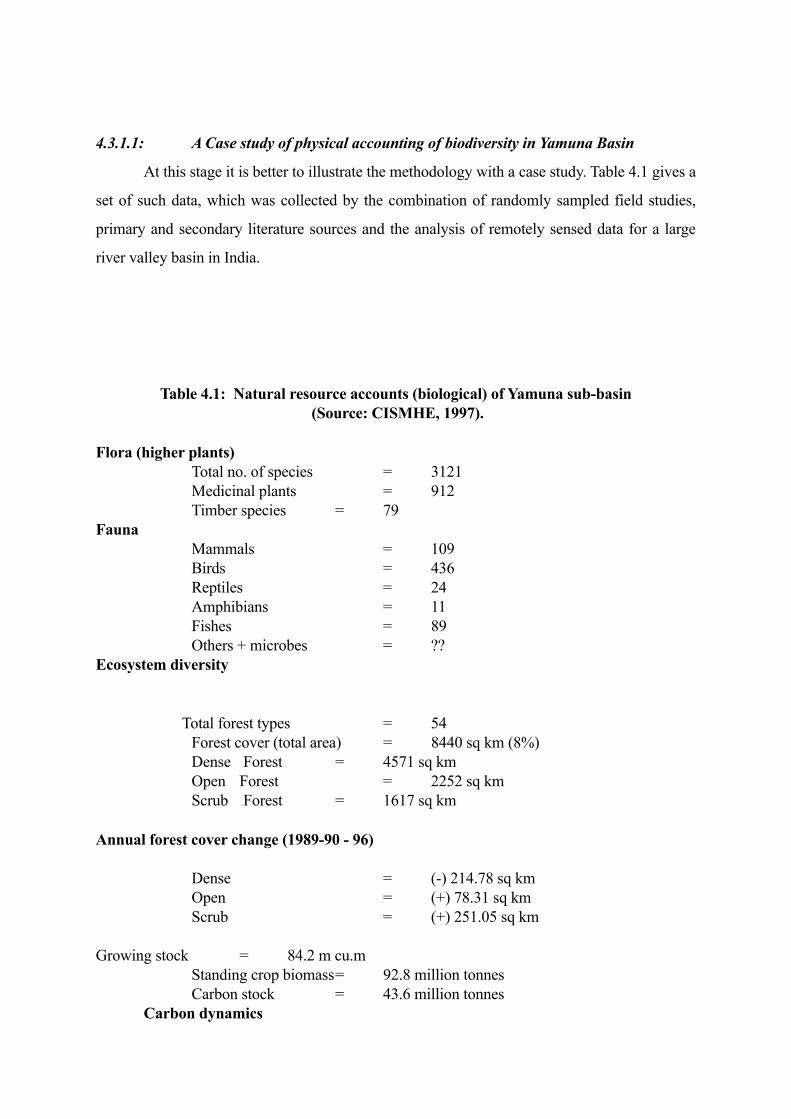
4.3.1.1: A Case study of physical accounting of biodiversity in Yamuna Basin
At this stage it is better to illustrate the methodology with a case study. Table 4.1 gives a
set of such data, which was collected by the combination of randomly sampled field studies,
primary and secondary literature sources and the analysis of remotely sensed data for a large
river valley basin in India.
Table 4.1: Natural resource accounts (biological) of Yamuna sub-basin (Source: CISMHE, 1997).
Flora (higher plants)Total no. of species = 3121Medicinal plants = 912Timber species = 79
FaunaMammals = 109Birds = 436Reptiles = 24Amphibians = 11Fishes = 89Others + microbes = ??
Ecosystem diversity
Total forest types = 54Forest cover (total area) = 8440 sq km (8%)Dense Forest = 4571 sq kmOpen Forest = 2252 sq kmScrub Forest = 1617 sq km
Annual forest cover change (1989-90 - 96)
Dense = (-) 214.78 sq km Open = (+) 78.31 sq kmScrub = (+) 251.05 sq km
Growing stock = 84.2 m cu.mStanding crop biomass= 92.8 million tonnesCarbon stock = 43.6 million tonnes
Carbon dynamics

Net carbon production = 2.72 million tonnes/yearNet release = 1.13 million tonnes/yearNet accumulation = 1.27 million tonnes/year(excluding losses to soil)
O2 dynamicsTotal production (1996) = 6.52 million tonnes/year
Soil loss*Forest areas = 0.44 million tonnes/yearAgriculture lands = 5.97 million tonnes/yearMiscellaneous land use = 15.17 million tonnes/yearTotal = 21.58 million tonnes/year and
*Calculated on the basis of existing literature on the subject as: Open forests = 380 kg/ha; Degraded / Scrub = 2340 kg/ha; and Agriculture fields = > 2340 kg/ha
Following from this example, a rough format for physical accounting for renewable and
non-renewable natural resources can be suggested fro NBSAP process.
Box 4.2: Physical Accounting of Non-renewable resources
Year-wise Values in physical units
Opening StockAdditions
Growth (natural)/Exploration Regeneration / Recovery
Reductions
Harvesting / Mining Degeneration/Erosion Damage / Waste in Extraction Natural Damage
Net ChangeClosing Stock
Box 4.2: Physical Accounting of Degradable ResourcesValue/Year-wise
Additions (by pollutant) SOx/ BOD
NOx/ COD
PMx/ Metals
Exposure of Popln. (dose-response)

By concentration By time period of exposureExtent of Degradation
4.3.2: Action needed to get physical accounts of biodiversity
Exercises similar to the one summarized in Table 4.1 could be started at regional levels.
As the technologies and methodologies get more accurate and easy to adopt more ecosystem
functions could be brought in the process of valuation. At present we may like to have district-
level or state-level data on the following parameters for the purpose of accounting and
valuation: • Taxonomic and ecosystem diversity (animals, plants and lower organisms, if possible)
• Forest types and forest density classes, forest cover and annual change• Standing crop biomass (primary productivity)• Carbon sequestration • Oxygen production• Assimilative capacity of forests/vegetation• Forest cover and correlation with hydrology and flood control• Forest cover and prevention of soil loss• Other direct benefits (fuel wood, grasses, timber, first resource, fisheries in aquatic
ecosystems) to the users of biological resources in a natural ecosystem
Next to recording of the inventory of biodiversity is assessing its changes as a step
towards valuing them. For instance, the role of vegetation in temperature regulation can be
directly converted in to services by knowing as to what degrees does a particular vegetation
cover in an area alter temperatures during summers or winters. This can then reflect in the
amount of electricity saved in a region/area for heating or cooling as the case may be. Such
exercises are available and have been successfully conducted in the USA (Botkin & Beveridge ,
1997). Some authors have reported that in Los Angeles city with average increase in
temperature by 5 o F since 1940 additional demand for electricity rose by 1.5GW and there are
estimates that to mitigate the result of heat island effect it would cost US additional burden of $
1 billion per year (Akbari et al., 1992). Rowntree at al., (1982) have demonstrated that proper
planting of vegetation in urban areas can save electricity consumption up to 24% in semi-arid
areas. Let us demonstrate the same with a case study from India.
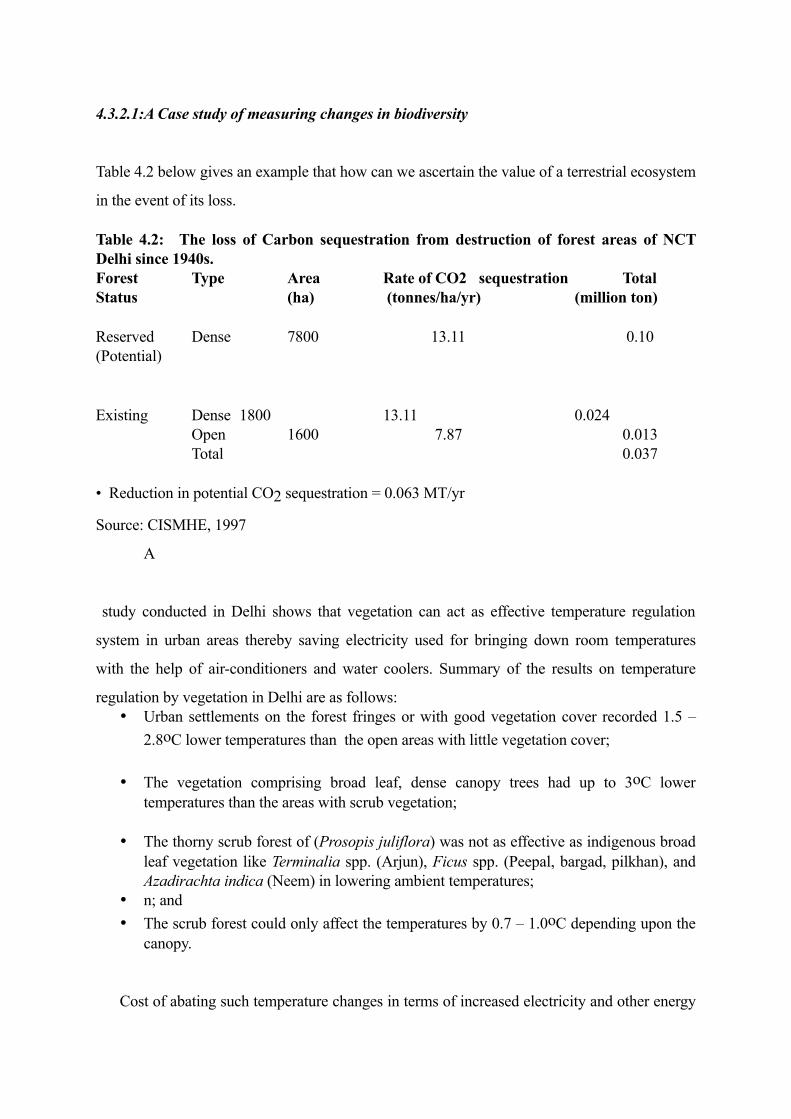
4.3.2.1:A Case study of measuring changes in biodiversity
Table 4.2 below gives an example that how can we ascertain the value of a terrestrial ecosystem
in the event of its loss.
Table 4.2: The loss of Carbon sequestration from destruction of forest areas of NCT Delhi since 1940s. Forest Type Area Rate of CO2 sequestration TotalStatus (ha) (tonnes/ha/yr) (million ton)
Reserved Dense 7800 13.11 0.10(Potential)
Existing Dense 1800 13.11 0.024Open 1600 7.87 0.013Total 0.037
• Reduction in potential CO2 sequestration = 0.063 MT/yr
Source: CISMHE, 1997
A
study conducted in Delhi shows that vegetation can act as effective temperature regulation
system in urban areas thereby saving electricity used for bringing down room temperatures
with the help of air-conditioners and water coolers. Summary of the results on temperature
regulation by vegetation in Delhi are as follows: • Urban settlements on the forest fringes or with good vegetation cover recorded 1.5 –
2.8oC lower temperatures than the open areas with little vegetation cover;
• The vegetation comprising broad leaf, dense canopy trees had up to 3oC lower temperatures than the areas with scrub vegetation;
• The thorny scrub forest of (Prosopis juliflora) was not as effective as indigenous broad leaf vegetation like Terminalia spp. (Arjun), Ficus spp. (Peepal, bargad, pilkhan), and Azadirachta indica (Neem) in lowering ambient temperatures;
• n; and • The scrub forest could only affect the temperatures by 0.7 – 1.0oC depending upon the
canopy.
Cost of abating such temperature changes in terms of increased electricity and other energy

costs can be computed.
By now it is clear that such an inventory of physical stocks and the changes there in
such physical information in itself is typically insufficient to promote biodiversity conservation
policy agenda. It is here that the recognition that biodiversity and biological resources have
economic value can be the basis of a compelling case for conservation action. Economic
value information can therefore be considered as an important addition to the stocktaking
process. Such values can be more easily integrated with other development activities.
4.4: What is the value of biodiversity?
There has been a great debate (perhaps it is a softer word for battle) among economists
and ecologists about the best possible mode of valuing a particular resource. Going by the
complexity of valuing biodiversity, as stated in Section 3.10 and 4.1, what we need are practical
solutions so that a beginning is made at least in incorporating environmental and ecological
resources in the system of national accounts. Ecologists on the one hand need to realize that if
ecological theory is extended into an unending dialogue no body is to gain anything from the
war of attrition. There is everything to loose, for the process of development will not stop and
wait for ecological discipline to set its house in order. In absence of proper valuation of
biodiversity, ecologists may be faced with a situation where we end up with more depauperate
ecosystems; lesser diversity and the worst fears of a doom may come true. Instead of
expressing strong opinions that economists cannot and should not value biodiversity, ecologists
must strengthen them with such data that may be useful in initiating the exercise of evaluation.
That is why we need action oriented valuation methods, however imperfect they are.
That brings us to theories of valuation. Keeping the Figure 4.1 and Box 4.1 and 4.2 in mind, there are basically three approaches to valuation under which we can classify the different techniques that have been evolved by economists and ecologists :
Market valuation of natural resource stocks and use: Under this category, market prices
play an all-important role in the determination of the value of the resource in question.
Maintenance cost of natural asset depletion and quality degradation: Costs that are
required to maintain the resource in question in their pristine state, as they should be in

their natural form shall be termed as Maintenance cost. The methods of valuation under
this can be divided into (a) objective valuation technique, and (b) subjective valuation
technique. Techniques under this category can be broadly categorised as ‘replacement
or repair cost’, or ‘treatment or pollution abatement cost’ approaches.
Contingent and related valuations of welfare effects and environmental degradation:
This involves valuing a resource by putting a monetary value on the response of the
people affected by the change in the state of the resource. It may even include untreated
or un-noticed resources. This category involves methods like ‘loss of earnings’ or
contingent valuation approach.
It should be borne in mind that all the valuation techniques can not be used simultaneously for imputing monetary value of a resource. Application of the appropriate method will depend upon :
o the type of the resource,o the nature of degradation and extent of depletion, o the data available on the extent of degradation or depletion,o the market price of the product in various economic activities,o the cost involved in the process of regeneration of the resource, o the rent accruing in similar economic activities, o the exposure of population to pollutants,o the treatment cost of upgrading a resource for different economic activities,o the stakeholders involved,o and many more
In the case of natural and biological resources a concept of Total Economic Value
(TEV) is developed after a great deal of discussion and exchange of ideas among the pundits.
Basically, it is understood that these resources provide several Use values and Non-use values
to enhance human welfare and provide sustainability to all species. Conceptually, it is the sum
of Use values (UV) and Non-use values (NUV) which constitutes the Total Economic Value.
Some further elaboration of these is given below.
Use Values (UV)
Natural resources provide a variety of goods and services to the users for their current
or future benefits or welfare. Hence they are said to have use values. Examples are, use of
fuelwood from forests, water from rivers or underground, NTFPs from forests and so on. The
current use (consumption) of these goods and services can be either direct or indirect.
Accordingly, the use values can be further broadly classified into three groups: direct, indirect
and option values.
Direct Use Values (DUV)
Direct use value can be either consumptive or non-consumptive. They refer to the
current use (consumption) of the resources and services provided, directly by natural and
biological resources. Examples are use of timber and non-timber forest products (NTFPs) and
services. Forests provide fuelwood, fodder, medicinal plants, fruits, poles, etc., to the people
particularly local communities and thereby generate direct consumptive use values. Recreation
(e.g., tourism to wildlife sanctuaries or Himalayan glaciers, mountains) etc., are examples of
direct non-consumptive use values, i.e., pertaining to those outside of the locals. While
viewing elephants in wild is the best example of direct non-consumptive use, hunting elephants
for ivory is, on the other hand, is a direct consumptive use.
Of all types of values, atlest when it comes to forest and water resources in India
perhaps the direct consumptive use value dominates, This is because of water being basic to
living and forest dependency being quite high. In many parts of the world wild foods constitute
still over 40% of the peoples’ consumption, and about 80% of medicines come from plants and
animals.
An alternative to ‘consumptive use value’ is the ‘productive use value’. It constitutes
values of products that are harvested from the wild and sold in commercial markets, at both the
national and international levels. Thy include construction timber, fuelwood, fish and other
marine products, medicinal plants, fibres, rattan, honey, bees wax, natural dyes, natural
perfumes, plant gums, resins and many others. Wild species are also periodically collected for
use in scientific and medicinal research and agricultural breeding. Most of these products are
typically undervalued as the ‘collector’s remuneration’ alone is treated as its productive use
value, and not its final market price. See Section 3.6 for examples of divergence between
collector’s price and market prices.
Indirect Use Values (IUV)
Indirect use values generally are referred to the ecological functions that natural
resource environments provide, but without harvesting, depletion or degradation. It can be
broadly classified into three groups: watershed values, ecosystem services and evolutionary
processes. Watershed values include flood control, regulation of stream flows, recharging of
ground water, effect of upstream or downstream etc.; the ecosystem services include fixing of
nitrogen, assimilation of waste, carbon sequestration, gene pool etc.; and evolutionary
processes include global live support, cultural and aesthetic concerns, biodiversity preservation
etc.
Natural environments and landscapes have been the inspiration for many works of art
and literature. Traditional communities everywhere continue to find their closest cultural and
spiritual links in nature. The peace and solitude offered by these environments have enabled
even many 'modern' people to seek spiritual enlightenment and solace. Many species serve as
early warning systems of environmental quality. Lichens are a good indicator of air quality and
molluscs of water quality. By careful monitoring we can take the required actions to prevent the
pollution from endangering human life. Increasingly natural environments are also used for a
variety of recreational activities such a hiking and wildlife watching. These activities are also
the basis for a fairly large industry. Genuine eco-tourism is increasingly proving to be a good
earner for developing countries and there are many examples where revenue generated from
eco-tourism has served to protect critical habitats and populations of endangered species, apart
from boosting the local economy.
The educational and scientific values of natural landscapes are enormous. The
extinction of species and destruction of habitats will limit our efforts to explore nature and
understand its implications for the human knowledge and scientific system.
Option Value (OV)
Option value (OV) relates to the welfare benefits of conserving natural assets including
biodiversity for being able to use them in the future, irrespective of their current use. It refers to
the benefits received by retaining the option of using a resource (say a river basin) in the future
by protecting or preserving it today, when its future demand and supply is uncertain. Take the

example of Silent valley. The people of that region of Kerala can perhaps vote (or willing to
pay or an option ) to say whether to postpone the setting up of a hydel power plant. The option
value here is the amount that individuals would be willing to pay to postpone the decision on
building a dam and power plant, or any other future use.
Option value is one of the most compelling reasons advocated for biodiversity
conservation all over the world. The argument for keeping options open is often couched in
terms of the precautionary principle. For lack of perfect information, caution is needed in the
use of plant and animal genetic material for drug and agricultural development. There are also
uncertainties related to the prospecting processes, e.g., the probability of discovering a useful
compound, research and development costs and market prices.
Non-use Values (NUV)
Non-use values (NUV) are entirely different from use values and are generated without
any direct link with the use of natural resource under question. An example can be the kinds of
values people of a southern state, say Kerala, will put for the Himalayan mountains. These
values are often revealed through people’s perceptions and concerns towards conservation,
culture, aesthetics and so on. For instance, Existence values (EV) and Bequest values (BV) are
the two significant non-use values of forests. Option value and quasi option value are generally
considered as future use values (Dixon and Sherman, 1990)
Bequest Value (BV)
The bequest value originates when people are willing to pay to conserve a resource for
the use of future generations. By doing so, these people do not have an intention to ‘use’ the
benefits during their own life span, but are bequesting those benefits for the future generations
(Swanson and Barbier, 1992).
Existence Value (EV)
Existence value is a concept associated with peoples’ willingness to pay simply for the
pleasure they derive from knowing that a natural area is preserved or particular species of flora
and fauna are retained irrespective of any plans they may have to hunt, observe or otherwise
use these resources (Swanson and Barbier, 1992). People’s willingness to pay for the
preservation of endangered species is an example of existence value. Weisbrod (1964) first introduced the term 'existence value'. It indicates that people value
existence of things like unspoiled wilderness as a 'passive use value' similar in kind to, and directly
comparable with, the value from active use of wilderness area for tourism, logging and so on. The 'non-
use value' highlights the distinction between the 'use value' by visiting an area for recreation and the
values expressing willingness to pay for preservation of an area they will never visit. Thus, existence
value is the individual derives from the knowledge that the site exists, even if he/she never plans to visit
it. According to John V. Krutilla (1967), existence value is the value derived from the sheer
contemplation of the existence of ecosystem, apart from any direct or indirect uses of goods and services
they provide. This
can include a pure biodiversity component, the appreciation for the variation or richness in the
ecosystem. This is based on the contemplation of the ecosystem as a whole (entirety, ensemble)
vs. appreciation for each of its members individually.
Quiggin, J. (1998) has subdivided the existence value into subcategories, (i) psychic or vicarious
consumption, (ii) option value (iii), altruism, (iv) bequest value, (v) intrinsic value and (vi) stewardship
value. Option value, is the value obtained from keeping the option of taking advantage of a site use
value at a later date (similar to an insurance policy). Quasi-option value is due to the possibility that
even though a site appears un-important now, information received later may help us to re-evaluate it.
There are two types of values attached to altruisim, the paternalistic and the non-paternalistic.
Altruism is paternalistic if an individual A has positive willingness to pay for changes in B’s
consumption, irrespective of what B thinks. This implies that A makes judgements about what is good
for B, irrespective of what B things. Thus individual A pays to B, but individual A decides what is good
to individual B.
Altruism is non-paternalistic if A has positive willingness to pay for consumption of B, because it
makes B better off in B’s own judgement. Thus individual A pays to B and individual B decides to use
the payment considering what is good/bad for himself. Stewardship value reflects a concern towards
preservation of a resource in a manner to empathize with the posterity.

With these definitions, therefore, the Total Economic Value can be expressed as:
TEV = UV+NUV = (DUV+IUV+OV) + (BV+EV)
The above classification helps the analyst to estimate the total economic value of
natural and biological resources. However, when some of the goods and services may fall in
more than one category, attention is required to avoid double counting. Therefore,
classification of goods and services into the above framework is an important aspect in
estimating TEV. An illustration of TEV is presented in Box 4.3.
Box 4.3: Total Economic Value of Biodiversity ResourcesUse Values Non Use Values
(1)Direct Value
(2)Indirect Value
(3)Option Value
Sustainable timber;Non timber forest products;Recreation and tourism;Medicine;Plant genetics;Education;Human habitat
Watershed protection;Nutrient cycling;Air pollution reduction;Micro climatic functions;Carbon store;Biodiversity
Future use as per (1) and (2)
Existence value:Cultural heritageBiodiversity
Source: Pearce and Moran (1994)
4.5: Methods of Valuation: A Tour
For the NBSAP process introducing the actual methods of valuation is not an easy task.
Some basic conceptual starter is any way needed. This will be followed by brief descriptions
of the various methods, descriptions of the steps involved in carrying out the exercises (along
with introducing model questionnaires to elicit information to derive biodiversity values as
defined in Section 4.4).
4.5.1: Some basic Economics
Whenever market exists for any natural or environmental resource, the prices as revealed
from the market can be an indicator of the value of those resources. The basic economic
concept behind the market based values is the ‘Willingness to pay’ by the demanders, who
reveal their preferences based on their income and other considerations (Samuelson, 1948).
Examples are timber prices, mineral prices or water prices (wherever water market exists).
Willingness to pay does not necessarily mean the actual price, which an individual (or a society
with some special characteristics) will be willing to pay for the current rate of its purchase. It all
depends upon the shape of the demand curve (or the preferences).
As shown in Figure 4.2, the amount of money income BC (i.e., willing to give up an income
from M0 to M1 ) which an individual is willing to pay in order to enjoy E0 –E1 of an
environmental good or facility, but staying at the same old preference curve U0 is the estimate
of maximum marginal willingness to pay for a marginal environmental gain. This is the
Hicksian compensated consumer surplus (Hanemann, 1991; Shogren et al, 1994). Similarly,
GF can be argued to be the estimate of willingness to accept a marginally lower environmental
good or service. It can be further shown that only under a perfect substitution situation between
income and environmental good, the WTP and WTA would be equal for the same level of
marginal environmental change. With lesser and lesser degree of substitution, the two would
differ, which is perhaps is the real life situation in India and elsewhere.
What does one do if there is no market for a particular use of the resource under
question? But the resource may have alternative uses with revealed market prices or may have
alternative resources to substitute for. Examples are market for fuelwood may not exist for
household consumption, but it exists for industrial uses. Or there are substitutes such as
kerosene for fuelwood in household uses. Then, other methods are possible. Methods such as

opportunity or replacement costs basically draw upon market data and information on prices
and values for such alternative, replacement or substitute. Surrogate prices are hypothetical
market prices taken from such goods and services, which are close substitutes for those
resources. A good example can be value of herbal medicinal plants can be the prices of non-
herbal chemical based products such as synthetic creams or perfumes.
What if there are many substitutes, or replacements possibilities? Economic theory can
also provide information on values for resources having many alternatives or substitutes. The
shadow prices are supposed to reflect the optimal values of resources, by taking in to account
all those alternatives and their combinations. These can be derived only from an empirical
model of optimisation of consumption or welfare, in which the resources enter as inputs. It may
be possible to derive the shadow price of water or minerals in a model of production based on
such resources.
How to go about valuing resources for which there are no markets and no surrogates
either? It is here that alternative user or non-user based methods are to be devised. The users
or non-users of such resources may have to be brought to a homogeneous situation in which
they may agree to pay for the use or existence of the resource. Or at least state or reveal the
preferences on such natural resources assuming artificially created market situation. If an
individual is then made to state her or his preferences, it only reflects a statement of value;
hence it is a stated preference method. Contingent valuation method is one such method. With
all the developments in valuation methods, it is still not easy to assign values to biodiversity
especially in terms of monetary values as the role played by the various species are many,
complex, and often hidden or insufficiently understood by humans.
4.5.2: Valuation Techniques
The actual methods of estimating values will have to follow the above mentioned
conceptual framework, as well as the empirical feasibility. Three different approaches can be
mentioned here.

Figure 4.3: Conceptual Representation of Total Economic Value
Market approach: Productivity change, opportunity cost, replacement cost, shadow
price etc.
• Surrogate market approach: Property value or hedonic prices, travel cost method, etc.
• Artificial market or stated preference approach: Contingent value method, bidding
games etc.
The different valuation techniques in common uses are listed below. They can be
categorised as:
Market Valuation of Natural Resource Stocks and Changes1.1. Depreciation Method1.2. User Cost Method1.3. Avoidance Cost Approach1.4. Market Price or Consumer Surplus Approach
1.5. Opportunity Cost or Substitution Approach 1.6. Shadow Price Approach
2.1. Maintenance costing of natural asset: Objective Valuation Method2.1.1.The Replacement/Relocation/Restoration Cost Approach2.1.2.The Change in Productivity Method2.1.3.The Welfare Method
2.2. Maintenance costing of natural asset: Subjective Valuation Method2.2.1.The Hedonic Price Method2.2.2.The Travel Cost Approach2.2.3.The Property Value Approach2.2.4.The Production Function Approach
3. Contingent Valuation Technique
These valuation techniques are elaborated to make the NBSAP process more
communicative, transparent and purposive.

1. Market Valuation of Natural Resource Stocks and Changes
Market valuation methods are used when market prices are available for natural
resources. Among them, the depletion of natural capital is of some special interest, but not quite
relevant for biodiversity resources (which may have degradation, if not depletion in short time
period). There are primarily two methods for valuing such depleting resources:
1.1: The Depreciation Method or the Net Price Method utilizes economic techniques
similar to those used to value the decline in productivity of fixed capital in valuing national
capital depreciation. Standard calculations of national income impute and subtract fixed capital
depreciation from GDP to arrive at NDP. Similarly, the economic value of natural capital
depletion is subtracted from NDP in estimating environmentally adjusted net domestic product
(ENDP). The net price method is based on the Hotelling (1931) rent assumptions, which claims
that in a perfectly competitive market, the price of a natural resource rises at the rate of interest
of alternative investment, offsetting the discount rate. According to Hotelling, the rent defined
as the difference between the price of the resource and the marginal cost of extraction, would
reflect the unit value of the natural resource stock.
Various steps involved in this method are:
Step 1: Estimate the marginal cost (different from average cost) of extraction of using the
resource. This requires some economic model of production (with scale effects etc.);
Step 2: Get the Competitive market price of the resource.
Step 3: If the resource extraction is over a long period of time, then work out he discounted
sum of the difference between the price and marginal cost as the net price of the resource. The
choice if the discount rate is crucial here.
This method is more appropriate for depleting natural resource such as coal, cure oil etc.
For an illustration of the method, see Section 4.8.1 for a case study from Goa.

1.2:The User Cost Method (proposed by El Serafy, 1989) is an alternative method to
Depreciation method. The user cost approach does not address the valuation of the stock or
reserve but focuses on potential income that can be generated from the extraction (sales). The
basic idea here is to convert a time bound stream of net receipts from the sales of an exhaustible
resource into a permanent income stream (X) by investing a part of the receipt, i.e., the user
cost allowance (R-X) over the life time of the resource. Only the remaining amount X of the
receipts should be considered “true income”. This method thus takes into account the
exhaustible nature of natural resources in valuation. This method is illustrated in Section 4.8.1
with a case study from Goa on mineral resources.
1.3: The Avoidance Cost Approach: This approach is used for assessing quality changes in
the natural assets by estimating the cost of avoiding such changes. This method is used mainly
for valuing degradation of environmental resources. For instance, if a wetland protects adjacent
property from flooding, the flood protection benefit is the cost of avoiding the damage to the
property by the owner by alternative methods. In the case of water and air pollution, the price
is estimated on the basis of what it would cost to reduce such pollution to acceptable levels.
Some time these are referred to as Defensive expenditure approach, or substitute cost method.
The computation of cost of avoidance may require sample surveys (among the households
or affected people) to establish an average damage or avoidance cost.
1.4: The Market Price or Consumer Surplus Approach is relevant only in the situations
of well-developed markets. Only with a good market survey on a variety of consumers it may
be possible to deduce the demand curve and hence estimate the average consumer surplus or
‘willingness to pay’. For most biodiversity resources, such markets do not exist. In such cases
simple market price approach may be used. The consumer surplus approach has already been
explained in Section 4.5.1. None-the-less, both the methods are best understood with
illustrations.
Box 4.4: Valuation of Environmental Products Using Market Prices
For environmental products that have a market price, their monetary value may be estimated as follows:
Total Value = Unit Market Price * Quantity
Where: Market Prices are corrected for any known market and policy failures (e.g., externalities, taxes and subsidies).Harvesting and transport costs are deducted from the gross value in order to derive the net value of a product. Account is taken of seasonal changes in market prices Quantity harvested is based on maximum sustainable yield (MSY) Market price analysis will tend to underestimate value since it does not account for consumer surplus.
Box 4.5: Valuation of Timber Through Markets: Case Study from Himachal Pradesh

Market mechanism for timber in India be understood before examining and interpreting market prices of timber.
In India forest coupes are generally disposed of through auctions. The price is determined not for any individual tree but for the whole group of trees within a forest coupe. Prior to auctioning, a variety of logging operations are involved. The logging operation includes felling, delimbing, topping, cross cutting, debarking, fashioning and transporting. The wood is then graded, arranged in lots and auctioned after determining the cubic content of the material in each lot. The following categories of timber are commonly distinguished between in the pricing process:
(1) logs, which are round woods having a mid girth of 45 cms with any length.(2) poles are also round woods but they have a midgirth of 25 to 45 cms and a length
of 3 m and over.(3) posts have length of 2 m to 3 in and a mid girth of less than 45 cms.(4) the rest, classified as twigs and braches and sold as firewood for preparing a rab.
The important timber species, which are prevalent in the Himachal region, are sal, dhir, khair (kil), salar, bel, sisham, khekra, oak, fir, deodar etc. The forest auction division in the southern part of Himachal Pradesh is Sawra. Chopal Rampur and Shimla in Shimla circle, and Solan and Nahan in Nahan in Nahan Circle. The important marketing centres in South zone are Turuwall (Poanta Sahib), Parvano, Badi, Dhantu, and Badhoria.
Table 4.3 shows the specie wise average price per cubic meter (after taking in to account other characteristics as size, length, girth, pole etc.) for two years. The different classes of timber are sawn timber, Axe Hewn (karries), dimdimas, side slabs (passellas), hakares, round ballis, logs geltus, khair billets, pulpwood etc. The highest price, recorded for deodar timber is Rs. 11780 per cubic meter during the period 1995-96. The other species in order of per unit value are kail, fir, chil, sal, shisham and Sain, with per unit prices of Rs. 6839, Rs. 4666, Rs. 3481, Rs. 3272, Rs. 2846, and Rs. 2702. respectively during the same year. However, the prices for sal, shisham and sain at Rs. 5192, Rs. 3908 and Rs. 2821 per cubic meter, respectively are higher during the previous year, namely 1994-95. The prices of the remaining species in 1994-95 are lower than those prevailing in 1995-96.
Table 4.3: Prices of Important Timber Species in South Zone of Himachal Pradesh (Rs. Per cu.m)
Species1994-951995-96
Deodar950211780
Kail54426839

Source: Chopra and Kadekodi (1997)
Box 4.6: Demonstration of Consumer surplus Approach: Gain from fishing in Chilika Lake after deweeding the lake
Chilika is a well-known brakish water eusterine wetland in Orissa state. As compared to the polluted weed infected situation, with deweeding the catch of fish would have gone up. The consumer surplus in the catch and sale of fish from the lake is different in the two situations. The incremental consumer surplus between the two situations is the net value of deweeding operation in the lake (and not the cost of deweeding).The steps involved in the computation this value are illustrated with a straight-line demand curve.Step 1: After de-weeding: the price of fish= Rs. 50 per kg; amount of catch per fisherman=20 kg per day; price at no catch =Rs. 100. Therefore consumer surplus= Rs (100-50)*20kg/2=Rs.500 per fisherman per day.Step 2: Before de-weeding: Price of fish Rs. 75 per kg; catch per fisherman=15 kg per day; Consumer surplus= Rs (100-75)*16 kg/2=Rs 200 per fisherman per day.Step 3: Net consumer surplus =Difference between the two consumer surpluses=Rs.500-Rs. 200=Rs. 300 per fisherman per day.Step 4: Total consumer surplus= Total number of fishermen (=1500)* Consumer surplus per fisherman (Rs. 300)=Rs. 450,000 per day.
**************************************************
The value of deweeding operation is Rs. 450,000 per day. But the actual cost of deweeding
may be quite different! May be Rs. 10,000.
1.5: The Opportunity Cost or Substitution Approach Biological resources may have alternative use and relevance. For instance, a waterfall in
a forest may mean only water to some, aesthetic beauty for some one else, yet may be a source
for hydro-electricity generation for some one else. Hence there are alternative uses or
perceptions and hence alternative values. Only when, all the alternative values are looked in to,
the true value of the resources is properly understood. Secondly, only some biodiversity
resources do have alternatives. An example is dung manure (a biodiversity produce) to be
replaced by chemical fertilizer in agriculture. Then, the value of the biodiversity resource will
have to note of the value of the alternative substitute resource. Once again, a case study is more
illustrative.

Box 4.7: Value of manure in terms of equivalent chemical fertilizerConsider the situation of Sukhomajri, the famous watershed experiment carried in the early 80’s in lower Shivaliks hills in Haryana state. Under an integrated watershed programme, the villagers of Sukhomajri (and later on many other villages) took to stall feeding the cattle, thereby reducing the pressure on forest slopes. This activity alone enabled them to collect dung at their door step, usable as manure for their crop cultivation. Stall-feeding has reversed the process of forest degradation. What is the value of stall-feeding then? It is evaluated in terms of the amount of chemical fertilizer saved in maintaining the crop agriculture. That is the value of the substitute for manure. The computation follows as:♣ The equivalence of manure per cattle per year is 30 kg of nitrogenous and 4 kg of
phosphate fertilizer.♣ As compared to the pre-watershed (and stall feeding) situation, the amount of dung
collected has doubled (as per the survey in the villages).♣ This is equivalent to 17 kg of fertilizer per year (15 kg of nitrogeneous+ 2 kg of
phorsherous fertilizer), per animal per year.♣ Going by the market price of fertilizer, the value of this fertilizer saved is Rs. 37.40
Summary based on :Chopra et al., 1990
1.6: Shadow Price Approach
In this method, essentially an optimizing model of alternative technical, social and
ecological options is set up. With an objective or welfare function then the model tries to
identify the best options of resources uses, technology, social institutions etc., to be adopted. In
doing so, the optimum value of various resources to be used or released is revealed. They are
called the shadow prices. There are no known good studies in the shadow price estimates of

biodiversity resources from India. But consider this hypothetical case of clearing a forest area:
The options can be listed as: ♣ 20 year clear cut Total harvestable area is cut over 20-year period, once only cut ♣ 30 year clear cut Total harvestable area is cut over 30-year period, once only cut ♣ 30 year clear cut / 80% selective cut 80% of total harvestable area (192,000 ha) is cut
in perpetuity in 30-year rotation ♣ 30 year rotation/ 40% selective cut 40% of harvestable area (96,000 ha) is cut in
perpetuity on 30-year rotation ♣ 30 year rotation / 25% selective cut 25% of total harvestable area (60,000 ha) is cut in
perpetuity on 30-year rotation ♣ Cutting ban Entire mangrove area is maintained in natural state
Under such a mix of alternatives, the optimum method can be deduced using a suitable welfare function (say value of local users benefits). Then the shadow price of forest resource can be deduced from such a model.
2.1: Maintenance costing of natural asset: Objective Valuation Method
The Maintenance Cost Valuation Methods are those, which involves valuing resources with the objective of maintaining them in their pristine state. Objective Valuation Methods primarily are about valuation of physical changes in the quality and quantity of resources by valuing physical damage caused by offending economic activities. There are three major categories of these methods.
2.1.1: The Replacement Method or the Maintenance Cost Method: According to this
method the value of a natural resource is determined by the restoration cost of produced and
non-produced natural assets. This method defines cost of a natural resource as the cost that
would be incurred to maintain the original level of the resource at the beginning. For example,
the replacement cost of ground water resources would be equal to the cost of recharge of this
water to its original level. This approach has been widely used in the literature mainly for
renewable natural resources. For instance, restoration cost of a forest compartment whenever,
some replacement or alterations are to be done in forest areas is a common example in mining
areas.
2.1.2: The Change in Productivity Method: This method estimates the environmental costs
in terms of loss of production arising from depletion of water resources is likely to reduce
productivity in crop cultivation by (a) reducing the area under cultivation, (b) changing
cropping pattern or (c) reduction in the yields. Or, degradation of land is likely to reduce yield
per hectare in the similar way. Other applications can be on measuring the costs of soil erosion
based on crop lose, or water pollution based on fish stock damage. The technique is most
appropriate when the environmental change directly causes an increase or decrease in the
output of a good (or service), which is marketed.
The steps involved in this approach are: (i) Identification of the physical effect of the
change in environmental quality on the economic activity concerned; This may require
specifying a production function between the output and the inputs, including natural resources.
(ii) estimating what difference this physical effect will have in terms of output or costs; and,
(iii) estimating the market value of this change in output. The application is limited whenever
there are difficulties in identifying the physical effects; presence of distorted and missing markets or,
in situations where the environmental change has a sizeable impact on market making a more complex
view of market structure necessary.
2.1.2.1 : A Case study on productivity based valuation of agricultural land
In valuing agricultural land we want to value it as a productive asset. Land is used to
produce agricultural output, to grow crops on it. Value of land here refers to productive asset
for agricultural purposes only.
When it comes to land, other values that can also be considered are emotional, and
cultural or religious, and other externality values (e.g., land may be precious to a person
because it has belonged to his ancestors or is associated with family history). Sometimes a
piece of land may provide other services. It may be a part of a beautiful landscape and when
we change its use we may alter the beauty of the landscape. When we change its use, it may
alter erosion or sedimentation on other lands. Such aesthetic or environmental (dis)services
provided by a piece of land are external to the piece. If sufficient data exists, these can also be
valued. But in the case study presented here they are not included.

If land were actively traded and land markets are efficient, then the market would
determine the loss in the value of soil due to degradation such as salination, water-logging or
erosion. Unfortunately, agricultural land is hardly traded in India, and cannot provide
information about the loss in value of its soil. It is, therefore, necessary to develop alternative
method to value changes in soil quality. A farmer would like to know the trade offs between
intensive cultivation and resulting soil degradation that would reduce their future yields. He
may like to know the value of degradation of his land without going to market. Or policy
makers would like to know these trade offs before promoting a new agricultural technology. It
may also be in the society’s interest to induce farmers to change land use and one should know
how much the change is worth.
Apart from using market prices, a number of other approaches are possible to value
changes in soil quality. The productivity approach estimates the present value of the loss is
production now and in future. This is a physical linkage approach and Box 4.8 illustrates it.

Box 4.8: Valuing Agricultural Land for India
The approach is illustrated with an application to the state of Haryana in India. Farm land information on soil quality parameters was collected by a survey, which covered 21,500 farm households across India for two consecutive years – 1975-76 and 1976-77. The survey collected information on the following soil parameters for each farm.
• Soil type (sand, lawn, light clay, heavy clay).• Soil colour (red, black, grey and yellow)• Soil depth (< 1 foot, 1-3 feet, > 3 feet).• Soil solemnity (nil, moderate, high).• Surface drainage (good, moderate, poor)• Rate of percolation (high, moderate, low).
Along with this, the survey also asked the respondents to rank their land quality. This was used as the dependent variable. The following functional form was estimated using above data for each state (See Parikh and Ghosh (1995)).
Soil Quality Index = + iQi iWhere Qi is the dummy for the different soil quality parameters. Parikh and Ghosh show that the state level average soil quality is given by
gstate = + iAi iwhere Ai is the proportion of area under each type of soil quality parameters.
The following exercise demonstrates the use of the above function in estimating changes in land value. For this exercise, the Indian State of Haryana was chosen as an example
The estimated coefficient (I’s and the proportion of area under each attribute in the state are given below. The table also shows how the area under different soil quality classes change over the year in a hypothetical situation. We have assumed that 10% additional land becomes highly saline and 10% additional land gets eroded. The table below is constitutes a physical account of soil quality change.
Box 4.9: Physical Accounts of Agricultural Land
Percentage of Cultivable area under different CategoriesPhysical and Coefficient Year t Year t+1Chemical Property Intercept 2.344

Soil Texture Sand -0.074 17.9 17.9Loan -0.017 68.3 68.3Light clay -0.007 13.5 13.5Heavy clay 0 0.3 0.3 Soil Colour Red 0.006 24.7 24.7Black -0.000317 1.9 1.9Grey -0.085 69.7 69.7Yellow 0 3.7 3.7 Soil Depth < 1 foot -0.069 29.8 39.81-3 feet 0 27.7 27.7> 3 feet 0.009 42.5 32.5 Salinity Nil 0.032 67.9 57.9Medium 0 31.5 31.5High -0.079 0.6 10.6 Drainage Good 0.132 79.1 79.1Medium 0 19.5 19.5Poor 0.65 4.1 4.1 Percolation Fast 0.364 40.1 40.1Medium 0 57 57Slow 0.268 2.4 2.4g(Q) 12.505 12.266Percentage change in g(Q) -1.91
Box 4.10: Productivity Linked Value of Land

Economic Value Accounts of Agricultural Land in Haryana in a Hypothetical situation in which additional 10% of the state’s land is eroded and additional 10% becomes highly saline.
Net cultivable land = 3792000 hectaresValue added in agriculture in 1995 = 59722.2 Rs. MillionNet cropped area (NCA) = 3575000 hectaresNet productivity (value added)Per unit NCA = 16705.50 Rs.Net present value (NPV) of aUnit hectare in 1995 = 183760.50 Rs.(Using 10% discount rate)Initial value of total land = 183760.50 x 3792 = 697 Rs. Billion.Depreciation due to change in Productivity = 697 x 1.91/100 = 13 Rs. Billion.Final value of total land = 69.7 x (1-0.0191) = 684 Rs. Billion.Value of land after accounting for Change in productivity = 180250.67 Rs./haLand value has gone down due to soil erosion.
Summary based on: Parikh (2001)
2.1.3: The Welfare Method: One major impact of environmental depletion and degradation is
on health and welfare of people in terms of increased sickness (morbidity) and increased
premature death (mortality). For example, lack of adequate water supply or non-potable
drinking water may lead to increased incidence of water borne diseases or in some cases to
premature deaths. The cost of morbidity can be computed by estimating the medical expenses –
expenses on medicines, admission etc., for the patients. This cost will also include (a) loss of
wages of the patients, (b) loss of wages of the attending persons to the patent as well as (c) the
cost of discomfort and dis-utility. These can be estimated through a primary survey (the last is
difficult to measure one can use contingent valuation here). The value of premature death can
be computed based on the value of a statistical life, as determined by either a human capital
approach or by a willingness to pay approach. The former method values on individual’s life
according to the net present value of his/her productivity. The willingness to pay approach
measures the value which society places on an individual as distinct from an individual’s wage
earning capacity. The first approach tends to give a lower value than the second approach.
The total welfare cost can be computed by adding the cost of morbidity and the cost of

morbidity. This cost should be treated as defensive expenditure and should be subtracted from
the GDP. The method of linking morbidity and mortality status (as a result of environmental
degradation to socio-economic status, causes of the events and possible remedies and policy
instruments is generally called as a Dose-Response Analysis. Box 4.11 summarises one such
case study from the city of Mumbai.
Box 4.11: Estimating Health Effects of Environmental ChangesIt was found from a study of Chembur area of Mumbai that due to severe air pollution,
several health related effects are observed. The major ones are: cough and dyspnea. They result in loss of work, hospitalization and even mortality. Using the field level (cross section of 300 households) data collected by Dr. S.R. Kamat of KEM Hospital, several dose response logit models were estimated (Jyoti Parikh, 2001). The chance (probability of occurrence) of cough and dyspnea are related to total expenditure (on curing), sex of the individual, habit of smoking, degree of exposure etc. Mortality is related to population, slum characteristics, hospital wards and emission of SO2. Using such models, and the data on costs of curing and abatements, loss of work, and loss of income due to death etc., the cost of occurrence, abatement, and cost of loss of life are estimated. The costs include medical expenses, hospital charges, transport costs, accommodation costs, and loss of work, loss of income from the productive life etc. It was then found that for an increase of 10 units of SO2 the number of excess death projected is 325. The implication of this is a loss of income to the family. This is estimated using a Human Capital approach to be of the order of Rs. 383433 per life. It will be worth noting that under Workers’ Compensation Act the average compensation is Rs. 213144, a gross under valued effects of health effects due to air pollution. Likewise, the annual average expenditure on account of asthma and bronchitis are estimated to range from Rs. 83 (mild attach) to Rs. 5885 (severe attach). Such dose response models can therefore are useful to value to health effects of environmental changes. Source: Jyoti Parikh (2001)
2.2. Maintenance costing of natural asset: Subjective Valuation Method
Subjective Valuation Methods measure possible environmental value as expressed or revealed in real or hypothetical markets. These methods can be broadly divided into Surrogate Market Valuation and Contingent Valuation.
2.2.1: Surrogate Market Valuation approaches use information relating to market goods to
infer the value of an associated non-market good. The different valuation techniques used here

are:
(A) The Hedonic Price Method: Next to Option value this is another important method
relevant for biodiversity conservation. This method is based on the assumption that the value of
a resource is related to net benefits derived from it. In other words, it uses a related market
approach and direct observations are used to value an environmental amenity. The basic
premise is that consumers can reveal their choice of consumption of environmental goods,
through their choice of related market goods and services (typically property prices or wages).
A person may choose a home where air/environment is good, and may pay more for this
environment (for example, fresh air, vicinity of parks/rivers etc.). The Hedonic price method
employs statistical techniques to isolate-environmental values, which contribute to an observed
difference in product prices.
Various steps involved in this method are:• Identify a well-functioning market in the first place.• Compare market values for identical properties (in terms of rooms, size etc) and see
whether the presence or absence of the favourable environmental attribute is reflected in any price difference.
• Observations on many properties with and without the identified attribute to be valued. Need to have detailed descriptions of properties in order to rule out the effect of structural differences as opposed to the environmental attribute sought.
• Establish a statistical relationship - define the hedonic price function to show how price changes with the environmental attribute holding other things constant;P = P (S, N, E); where P = property price, S = Structural characteristic of housing, N = neighbourhood characteristics (e.g. safety, transport, employment), E= environmental factor.
• From information on the price function calculate the marginal WTP for the environmental factor or slope of the WTP curve that gives us the additional marginal WTP for an increase or decrease in environmental attribute E.
• Finally it is also worth mentioning that the method has some interface with the valuation of plant genetic resources for agriculture. The steps for conducting this research are similar to the property example although the data requirements are just as onerous. The following description summarises the only available research in this area as described by Evanson and Gollin (1998). The steps allow the direct estimation of the contribution of germplasm of original landraces to rice productivity
o For a crop – e.g., rice, divide gains in output into gains from yield and gains from increased area under cultivation
o Disaggregate rice yield gains into gains attributable to varietal improvement, other technological advances and other sources of change
o Assume varietal improvement is dependent on stocks of advanced crossing

material from different sources and other research resources o The stocks of advanced material depend on the existence of traditional landraces
and wild species. o Link productivity to original germplasm, its origins and ownershipo Note finally that the data requirements are onerous. In short detailed
information is required on the productivity of all factor inputs in all the above stages
The method is demonstrated with a case study from India.

Box 4.12: A Case study of Bhoj Wetland of BhopalBhoj wetland is large lake, commonly known to the people of Bhopal as a pride
recreation lake. But due to increasing pollution of the lake, not only the tourist and aesthetic value of the lake is reducing; it is also affecting the property prices around the lake, particularly in the Upper lake area. The changing property price is a reflection on the value of pollution effects on the lake.
This was studied in two steps. In the first step attitudes of the people were studied as to what are the factors that people consider to be important while buying a piece of property. In the second step property prices in different areas of the city were obtained and ranked and correlated with the parameters of neighbourhood, proximity to markets, ease of access, the environment, housing density and presence and absence of lake (preferred to be clean).
Major factors people normally use in buying property in the city of Bhopal are shown in Table 4.4 (as composite relative indices).
Table 4.4: Ranking Of Various Factors Considered while Buying Property
S. No:FactorScores
1.Drinking Water0.99
2.Safety0.94
3. SchoolQuality of ConstructionHospital0.880.87 0.87
6.Age of House0.85
7.ParkMarket Air Pollution

(B): The Travel Cost Approach: The Travel Cost Method (TCM) is typically used to capture
the recreational value of sites, such as national parks and sanctuaries. Sometimes, though less
often, it has also been applied to problems like finding the value of collected forest products
(not routed through the markets) for villagers, by examining the travel and time costs involved
in collecting them. In general, the method can be used in the following situations:o Changes is access costs for a recreation site;o elimination of an existing recreation site;o Addition of a new recreation site; o changes in environmental quality at a recreational site.
Here the expenditure incurred on visiting a site is treated as a revelation of consumer’s
preference for the environmental services provided by it, and derives the value placed on
these services. The basic philosophy is to use the cost of travel as surrogate for the
willingness to pay for using the recreation site. Travel costs would include actual
transportation costs, fees paid at hotels and at times the opportunity cost of travel time spent
on journey. It is most commonly used for assessing the value of national parks meant for
preservation of flora and fauna.
The method is based on the assumption that that people’s preferences for the
environment can be ‘revealed’ indirectly by examining their behaviour in markets that are
linked to the environment. It is assumed that travel costs to a site can be regarded as a proxy
for the value of the non-market asset.
The travel cost method focuses on estimating the following demand function:
V = f (TC;X); where V = number of visits to the park, TC = travel cost to reach the park, X = vector of the relevant socio-economic variables.
Two Variations of the Travel Cost Method:
There are two approaches commonly used. – the Zonal Travel Cost Method (ZTCM)
and the Individual Travel Cost Method (ITCM). Let us examine the difference between the two
approaches.

Box 4.13: Two methods comparedS . No.
Point of comparison ZTCM ITCM
1 Unit of observation The zone The individual visitor2 The dependent variable The visitation rate The number of visits made
by each visitor per period3 The nature of the
independent variablesOnly those characteristics which can be described at the zonal level are included
I n d i v i d u a l - s p e c i f i c characteristics can be included
4 S a m p l e s i z e requirements
The sample size should be large, so that several zones can be constructed
S a m p l e s i z e c a n b e relatively smaller
The choice of which of the two methods to use will depend upon the situation at hand. If
the site is one that offers a unique recreation experience, then, typically, visitors will come from
even far-away regions to visit it. However, visitors who come from longer distances are
generally not able or willing to visit the site more than once or twice in a year. In such a
situation, if we were to use the ITCM approach, then the dependent variable (the number of
visits made by each respondent), would not exhibit sufficient variation to make regression
analysis possible. In that case, it is advisable to use the ZTCM. Note that a fairly large sample
size is needed to make zoning feasible.
Various steps involved in a TCM study are:
Divide the visitors in to different distance or population zones as locals, domestic, foreigners and so on and treat them additively separable.
If necessary (depending upon the site), mark out geographical zones as wildlife area, water bodies, flora area and so on.
Obtain visitation rates for each distance or population zone, by sampled questionnaire method.Estimate travel costs on the basis of (a) entry fees (EF), (b) time spent in the area (T) (c)
various travel costs (TC), (d) boarding and lodging costs (e) socio-economic status of the visitor (social status, education (ED), income (INC), age, interest in and perception about environment (PE), etc.). Costs should include: direct expenses incurred by visitor getting to and from the site; the opportunity cost of time spent traveling (say, income foregone) at the site; and any entry fees and other incidental expenses.
Statistically derive or construct a demand curve; estimate consumer surplus; estimate benefits of environmental improvement at the site:An example of the demand curve : Vi = a + bTCi + c INCi + dEDi +e PEi +fSTCi +……… where: V = the number of visits to the site; TC = total travel cost per visit; INC =

individuals income; ED = respondents educational level; STC = the travel cost to substitute sites; i = the respondent as a visitor or geographical zone or both; a, b, c, d etc., are the coefficients to be estimated.The Consumer Surplus (CS) is the estimate of the Willingness to pay for zone i is estimated as:
TmaxCS i = Vi TCi ; where i= geographical zone i.
Tmin
For the whole site, the sum of the consumer surpluses over all zones will be the total value.
A case study from a sacred lake from Sikkim will be useful here.

Box 4.14: Valuing eco-tourism in a sacred lake of the Sikkim Himalaya, India

Sacred lakes of the Himalayan region attract visitors and pilgrims from all over the world for their aesthetic, cultural and spiritual importance, The Sikkim Himalaya has more than 150 lakes at different altitudes and most are considered sacred. The recreational biodiversity and sacredness values of Khecheopalri, a lake situated in the west district of Sikkim State, India is presented here.
Visitor numbers began to increase in Sikkim in 1990 as a result of a relaxation of regulations that opened a number of new areas to both domestic and foreign tourists. Until 1980, the state hosted only 15454 visitors, but this had increased five-fold by 1990, and reached 143410 in 1998. The number of visitors to Khecheopalri lake has grown rapidly from 16068 in 1997 to 18713 in 1998. In 1998, 7800 visitors arrived at the lake from Sikkim as pilgrims. About 78% of the pilgrims visited the lake for religious purposes, while the majority (85%) of the domestic visitors came for recreation. Most (65%) of the foreign visitors came to the lake for recreation, but 19% came for religious purposes and 16% cited the rich biodiversity of the area as their purpose in visiting. Approximately 56% of foreign visitors, 43% domestic visitors, 35% of local community members and 28% of pilgrims showed some interest in conservation and maintenance of the lake and its surrounding watersheds.
The salient features of the study are:
♣ A sample survey of 360 visitors, consisting of 50 members of the local community, 140 pilgrims, 95 domestic and 75 foreign visitors was carried out.
♣ Only 180 respondents (20 community members, followed by 34 domestic, 51 foreign visitors and 75 pilgrims) showed their willingness-to-pay (WTP) for conservation and protection of the lake, while others refused to participate.
♣ Method of collecting information: (a) a structured questionnaire, (b) random sampling at different times of day and during all days for one week, (c) only adult visitors, who had a defined source of income, were interviewed
♣ Data collected per visitor are: travel cost, number of visits per year, distance travelled from the origin of stay, income, age, sex, education and density
♣ Regression model of visitation rate with travel cost and distance was estimated.
♣ The travel cost for local pilgrims was positively related to visitation rate. TC model was used to calculate the consumer surplus. The estimated consumer surplus for visits to Khecheopalri lake was US$ 661 and US$ 1562 from the first and second consumer surplus, respectively. Recreational/sacredness value per visitor was US$ 3.87 as calculated from the consumer surplus.
♣ The total number of local pilgrims to Khecheopalri lake was 7800 in 1998, the aggregate annual recreational/sacredness value amounted to US$ 430186 for pilgrims. The higher cost of travel and distance of the lake from various zones of Sikkim restricted the visitation rate by pilgrims.

The Property Value Approach: The property value approach or the wage differential
approach assumes that the changes in land or property price due to a change in the
environmental amenity reflects the value attached the amenity. This method evaluates best the
differential advantage obtained from extended residence in certain spatially performed
locations. All the steps involved for Hedonic price method are relevant here.
The Production Function Method: The production function method or the alternative
technology approach is used for valuing indirect ecological function of environmental assets.
The first method views the contribution of a natural resource to economic activities in terms of
substitute inputs. For example, soil conservation may result in saving the amounts spent on
chemical fertilizer. The alternative technology approach can also be classified as a cost based
valuation as the contribution of the natural resource is viewed in terms of the saving effected by
not having to resort to the alternative technology. Soil conservation in upstream forest, for
example, results in a saving in the cost of de-silting of down stream water bodies using
mechanical dredgers.
3. Contingent Valuation Technique
Contingent Valuation Methods are used when markets do not exist for environmental
resources. The valuation is done here in hypothetical markets. The valuation task here is to
determine how much better or worse off individuals will be as a result of a change in an
environmental resource/asset. This is computed by asking how much people are willing to pay
for an environmental benefit (WTP) or how much are they willing to give up to have a
specified environmental quality improvement happen. This method is also used in terms of how
much people are willing to accept as a compensation (WTA) for an environmental resource.
The price that people are willing to pay (a weighted average is computed) is taken as the price,
and valuation of the asset or the resource is done using this price. This approach is used for
valuation of wilderness, as well as of common environmental facilities like forests, common
lands, common water bodies etc.
A particular advantage of CVM over other valuation techniques is that the method can
be designed specifically to identify non-use values. CVM responses of users of a resource
(e.g., park visitors who are currently in a park) are statements of their total economic value.
When CVM is conducted among populations who are or who never have been users, then their
responses can be interpreted as non-use value statements.
Various steps involved in a CVM are:o Preparing the individuals or households in terms of their framework of mind about a
hypothetical market situation to conserve, preserve or promote natural resources, for which they have to pay or spend. They should be fully convinced that there are no markets on such non-consumptive activities, but they are benefiting from such preservation.
o There are two basic alternative approaches to CVM. First, a dichotomous question method, second open-ended question method. In the first instance, either a range or a binary choice is given to the respondents to state their preference. In the later case, they are asked to state their preference out of an open-ended range, say any thing more than Rs 5. Invariably, the open-ended question methods underestimate the WTP.
o Give them an option of choosing from (a) a random set of values reflecting willingness to pay, or (b) an ordered set of values (preferably in a range or band).
o After interacting with them further on the need for conservation and preservation of biodiversity, asking if they would revise their earlier preferred number or value (on WTA),
o Also ascertain if they are willing to pay in labour time, in kind etc. o Collecting various socio-economic attributes about the individuals being interviewed,o Formulating a model (using a regression technique) of linking the WTA with the social-
economic attributes of the individuals.o Simulating the model to arrive at a stable value for WTA (alternatively for the average
individual).
The same technique can be used to assess the Willingness to Accept (WTA) a price or reward to stay away from using the natural resource. This however, is much less likely in biodiversity related resources, as the locals prefer to stay in the vicinity of the resource and continue to use it, rather than being isolated or displaced from it.
The method is demonstrated with a case study form Kumaon region of India
This is a case study on valuing water in the Kumaon mountain region of India. Though it
is a major region as the source of water for the plains of northern India (origination from the
glaciers and rivers such as Kali, Alaknanda, East and west Ramganga, Kosi and Gaula. Kumaon
is always suffering from water scarcity (Kadekodi et al., 2000). Relevance of water varies based
on the altitude and use patterns. In the high altitudes it is mainly for drinking, in the middle
timberlines it is mainly for drinking, livestock rearing and marginally for irrigation, and in the
Tarai region, mainly for irrigation and marginally for drinking. Hence, the value of water would
differ depending upon the nature and extent of demands. This case study will demonstrate a
CVM methodology for eliciting value of water in this region, from the Munsiari glacier to the
Tarai area.
The steps involved in the study are briefly mentioned now:
o Six villages each in three different watershed areas (representing the high altitude glacier region, middle timberline Ramganga region, and Tarai region were selected randomly.
o Village and household level questionnaires were canvassed covering aspects such as (i) Background information about the village, (ii) Awareness of watershed function,(iii) Land ownership, (iv) Water supply, consumption and Quality, (v) Community participation, and (vi) Willingness to pay
o Typical questions asked are: name of the respondent, status within the household, caste, and some information about his/her economic, educational, demographic status, about the infrastructures available in the village and duration of living in the village, perceptions about natural resource endowments (change in forest spread, change in rainfall, cause of changes, effects there after etc.), contingent plans to mitigate drought and floods, agricultural status(ownership status, irrigation facilities, crop yields, capital investments on irrigation etc.), water resources (utilization pattern and sources, consumption per day for irrigation, household and livestock uses, the distance to travel to fetch water in different seasons, the seasonality of scarcity of water, and alternative methods that are adopted in case of deficit or bad quality of water). Questions on community participation in case of water shortage and the preference of the villagers regarding the manner in which such community management can be effected are sought.
o As part of CVM, the details of the presently working agency if any, and who they would prefer to manage the water sources, and the degree of respondent's own participation in the same have been posed to know the interest of the villagers in the management of water resources. Through interactions and questions, after building some idea in the minds of the villagers about the need to improve water supply, questions on 'willingness to pay' have been asked. For this, a statement has been prepared and posed to them:
"Suppose, some agency of the village manages the water system in your village, so that you get sufficient water for irrigation/drinking purposes throughout the year and your crop productivity increases by 20 percent per year. This is an agency elected by the village and responsible for it. To maintain the water system (springs, talaabs, canals, wells etc,) and extraction, the agency needs some capital for installation, and monthly maintenance and running expenditure (labour cost, electricity etc). If so, what are your contributions in terms of money and labour time for construction, maintenance of such water works."

o The respondent's willingness to pay in terms of money and labour time for both irrigation and drinking water facilities as one time payment or regular payments annually (as user charges) are solicited.
o If any household is not willing to pay in terms of money, the reasons are sought. If the income is the constraint for them they have given another option as:(a) possible increase in land productivity up to 20 percent and (b) increase in monthly
income by Rs.100 per family.
o From the above statement some of the villagers who are reluctant to previous statement, showed enthusiasm and expressed their willingness to contribute. Like wise the problems and thoughts of the villagers regarding hardships, willingness to pay and participation in water management are gathered. A structured questionnaire of this type is put in Annexure to this report.
The study revealed that the villagers are willingness to pay for water as:(a) one time payment towards capital investment to development water extraction system on a sustainable basis(b) for maintaining the water system(c) for irrigation purposes and(d) for drinking purposes.
The responses are quite mixed. Some people are not willing to pay at all for one, or some, or all of the above. From the survey it was observed that 23.72 percentage of households were not willing to pay for one reason or other; 64.62 percent were willing pay for drinking water, and 58.33 percent for irrigation; on average 59.61 percent of households expressed their willingness to pay for maintenance only, and not for construction of water harvesting structures. Clearly, those who are not willing to pay could have some reasons. As much as 30 percentage of households reasoned income as the constraint to pay for preservation.Table 4.5 summarily shows the estimates of values.
Table 4.5: Estimated Willingness To Pay for water backed up by ability to pay
Watershed region
Willingness to pay per Year (Rs./HH)
For capital cost1 For maintenance
Irrigation Drinking Water Irrigation Drinking Water
E.Ramganga 50.58 {1.33) 23.94 [7.48] 58.70 24.22Haigad 73.92 {1.49}2 14.39 [7.91]3 70.95 12.85
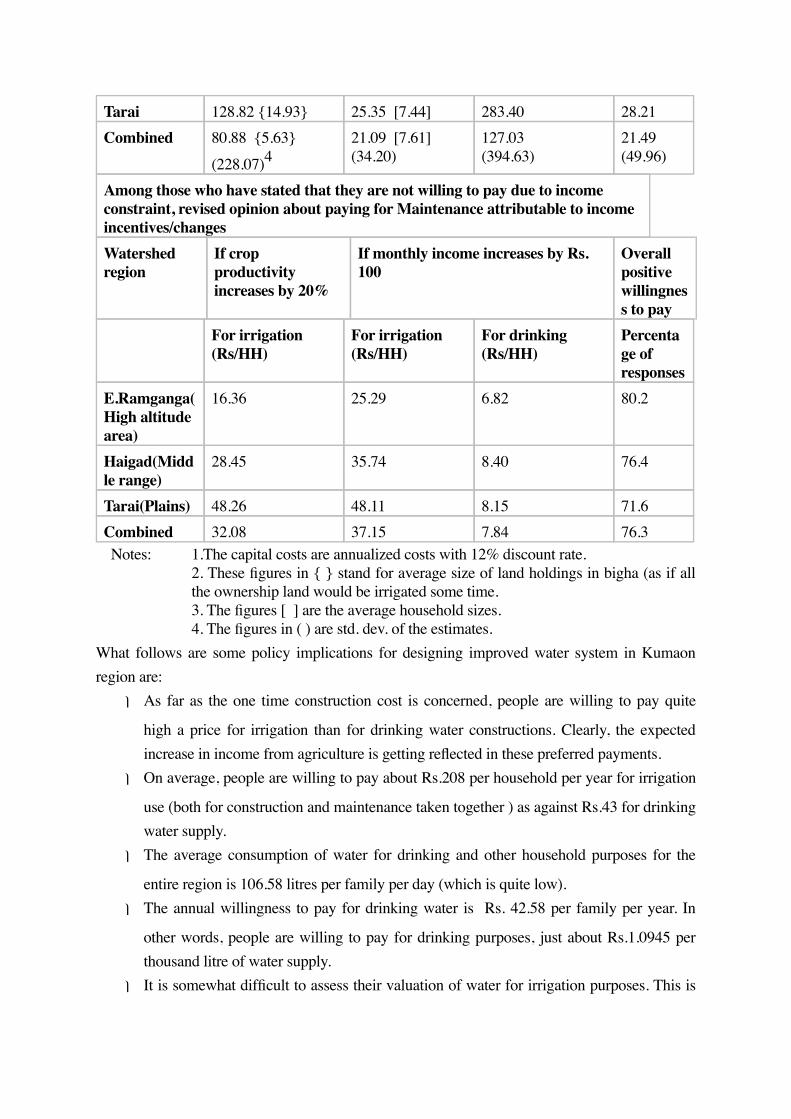
Tarai 128.82 {14.93} 25.35 [7.44] 283.40 28.21Combined 80.88 {5.63}
(228.07)421.09 [7.61](34.20)
127.03(394.63)
21.49(49.96)
Among those who have stated that they are not willing to pay due to income constraint, revised opinion about paying for Maintenance attributable to income incentives/changesWatershed region
If crop productivity increases by 20%
If monthly income increases by Rs.100
Overall positive willingness to pay
For irrigation(Rs/HH)
For irrigation(Rs/HH)
For drinking(Rs/HH)
Percentage of responses
E.Ramganga(High altitude area)
16.36 25.29 6.82 80.2
Haigad(Middle range)
28.45 35.74 8.40 76.4
Tarai(Plains) 48.26 48.11 8.15 71.6Combined 32.08 37.15 7.84 76.3
Notes: 1.The capital costs are annualized costs with 12% discount rate.2. These figures in { } stand for average size of land holdings in bigha (as if all the ownership land would be irrigated some time. 3. The figures [ ] are the average household sizes.
4. The figures in ( ) are std. dev. of the estimates. What follows are some policy implications for designing improved water system in Kumaon region are:⎫ As far as the one time construction cost is concerned, people are willing to pay quite
high a price for irrigation than for drinking water constructions. Clearly, the expected increase in income from agriculture is getting reflected in these preferred payments.
⎫ On average, people are willing to pay about Rs.208 per household per year for irrigation
use (both for construction and maintenance taken together ) as against Rs.43 for drinking water supply.
⎫ The average consumption of water for drinking and other household purposes for the
entire region is 106.58 litres per family per day (which is quite low).⎫ The annual willingness to pay for drinking water is Rs. 42.58 per family per year. In
other words, people are willing to pay for drinking purposes, just about Rs.1.0945 per thousand litre of water supply.
⎫ It is somewhat difficult to assess their valuation of water for irrigation purposes. This is

because the extent of water used in irrigation could not be ascertained through the interview method. But given the fact that the average land considered in their mind as potential for irrigation is known (5.63 bigha), the average willingness per bigha of irrigated land works out to Rs.36.93 per year.
4.5.3: Transferring Benefits Theory and Practice
For the NBSAP process, we may find that it is indeed difficult to actually carry out fresh
case studies on the valuation of biodiversity. This is hardly surprising since environmental
valuation methodology is still developing and most of the existing studies concentrate on
keystone biological resources. It is nearly always the case that even the early studies carried out
so far are demonstrative of the methodology with limitations in terms of the number of
dimensions valued as part of the study. Moreover, new studies are costly and time consuming to
conduct and it certainly would not be advisable for all NBSAP exercises to undertake extensive
valuation programmes that would most likely end up duplicating existing information from
other countries. One short cut to overcome this information gap is to borrow and transfer
valuation/benefit estimates from existing studies to the new or subject study site, an approach
known as benefits transfer. This approach is essentially the second best option when data is
unavailable. Most of the NBSAP economic valuation process is likely to take some form of
benefits transfer and different degrees of rigour can be applied to the transfer process.
There are serious concerns over the legitimacy of transfer of values from one site to
other for various reasons: o The reliability of the original estimate itself is doubtful. This may be an estimate
of WTP per household per year for say, conservation of a species, which is borrowed but totally unreliable;
Box 4.15: Bad Example of Benefit Transfer
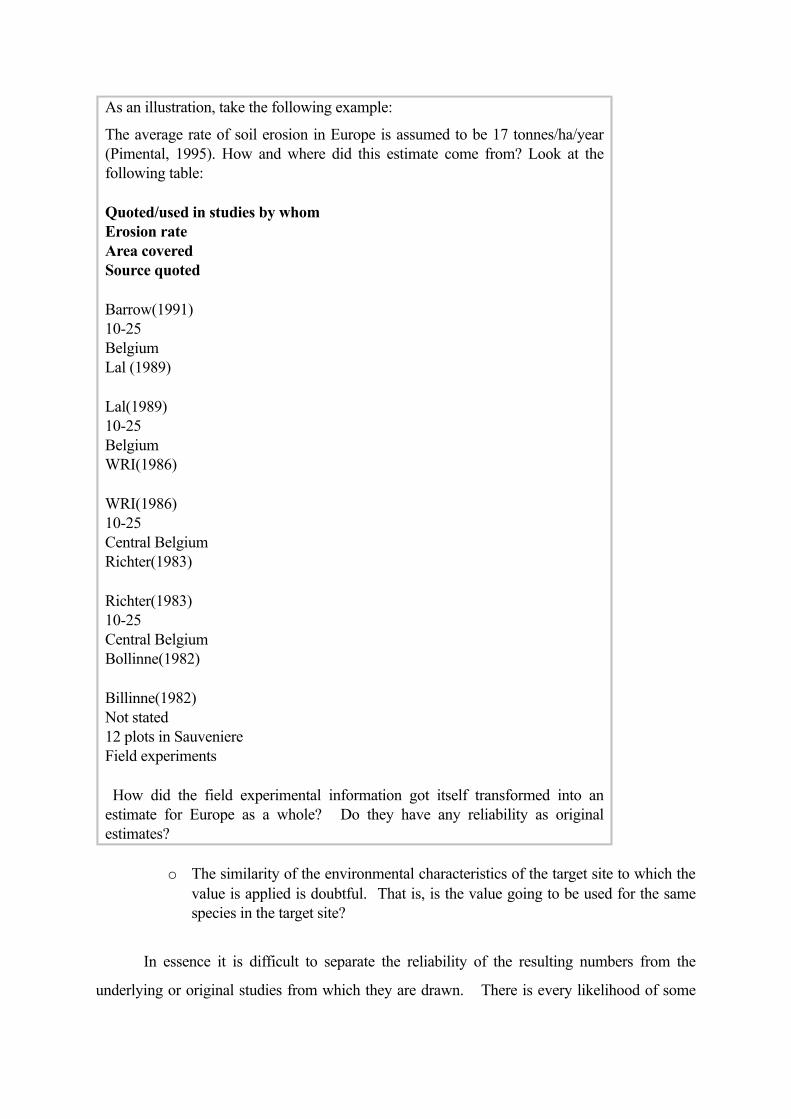
As an illustration, take the following example:
The average rate of soil erosion in Europe is assumed to be 17 tonnes/ha/year (Pimental, 1995). How and where did this estimate come from? Look at the following table:
Quoted/used in studies by whomErosion rateArea coveredSource quoted
Barrow(1991)10-25BelgiumLal (1989)
Lal(1989)10-25BelgiumWRI(1986)
WRI(1986)10-25Central BelgiumRichter(1983)
Richter(1983)10-25Central BelgiumBollinne(1982)
Billinne(1982)Not stated12 plots in SauveniereField experiments
How did the field experimental information got itself transformed into an estimate for Europe as a whole? Do they have any reliability as original estimates?
o The similarity of the environmental characteristics of the target site to which the value is applied is doubtful. That is, is the value going to be used for the same species in the target site?
In essence it is difficult to separate the reliability of the resulting numbers from the
underlying or original studies from which they are drawn. There is every likelihood of some
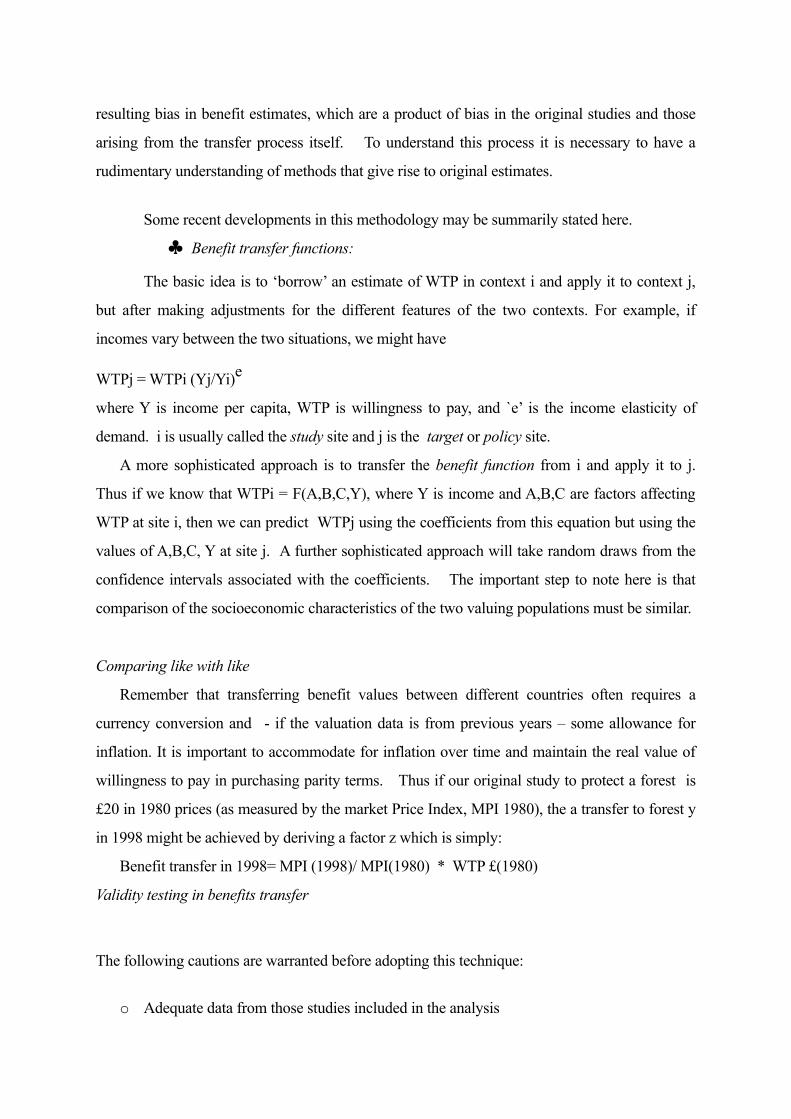
resulting bias in benefit estimates, which are a product of bias in the original studies and those
arising from the transfer process itself. To understand this process it is necessary to have a
rudimentary understanding of methods that give rise to original estimates.
Some recent developments in this methodology may be summarily stated here.
♣ Benefit transfer functions:
The basic idea is to ‘borrow’ an estimate of WTP in context i and apply it to context j,
but after making adjustments for the different features of the two contexts. For example, if
incomes vary between the two situations, we might have
WTPj = WTPi (Yj/Yi)e
where Y is income per capita, WTP is willingness to pay, and `e’ is the income elasticity of
demand. i is usually called the study site and j is the target or policy site.
A more sophisticated approach is to transfer the benefit function from i and apply it to j.
Thus if we know that WTPi = F(A,B,C,Y), where Y is income and A,B,C are factors affecting
WTP at site i, then we can predict WTPj using the coefficients from this equation but using the
values of A,B,C, Y at site j. A further sophisticated approach will take random draws from the
confidence intervals associated with the coefficients. The important step to note here is that
comparison of the socioeconomic characteristics of the two valuing populations must be similar.
Comparing like with like
Remember that transferring benefit values between different countries often requires a
currency conversion and - if the valuation data is from previous years – some allowance for
inflation. It is important to accommodate for inflation over time and maintain the real value of
willingness to pay in purchasing parity terms. Thus if our original study to protect a forest is
£20 in 1980 prices (as measured by the market Price Index, MPI 1980), the a transfer to forest y
in 1998 might be achieved by deriving a factor z which is simply:
Benefit transfer in 1998= MPI (1998)/ MPI(1980) * WTP £(1980)
Validity testing in benefits transfer
The following cautions are warranted before adopting this technique:
o Adequate data from those studies included in the analysis

o Sound economic and statistical techniques in both original study and transfero Studies with regressions of WTP on determining variableso Similar population in the compared siteso Similarity of the environmental good to be valuedo Similar siteso Similar distributions of property rights
4.5.4: Comments on Valuation methods: Towards actionsBrief comments are offered here on the lines of clarification, precaution and limitations of the approaches presented to NBSAP process.
¬ Valuation techniques are not entirely able to capture the exact value of biodiversity and environmental resources. Non-market products of nature, which are largely used by indigenous people, are difficult to value since there does not exist a market for these products. In cases, such as these, there is a strong need to device mechanism for valuing these products that are not marketed.
¬ There does not exist a clear ranking of methods of valuation that are known so far. All methods are not equally relevant for all resources either. Each technique requires a variety of assumptions depending upon the method being applied and of course the resource being considered for valuation. What clearly emerges from the various studies of the use of valuation techniques is that key modeling assumptions do have an important influence on estimates of valuation. The inconsistencies in the maintained assumptions of both direct and indirect methods, as they were applied to each of the problems considered in comparative evaluations, would seem to be sufficient to account for any observed difference between them (Kopp and Smith, 1993).
¬ There is an unresolved methodological puzzles that still remain and relates to the consistency of different valuation techniques. Alternative techniques can be categorised as those that are based on revealed preference and stated preference. Market price based mechanism can be grouped in the first category and CVM and related techniques can be categorised into the second type. A fundamental question is about additivity of revealed preference values to stated preference values to arrive a total economic value. A good example is about additivity of use value of timber (a revealed preference value) to nutritional cycling value (a stated preference value). However, there seems to be some kind of strong correlation between these values as shown in Figure 4.3 for a sample of studies.
Figure 4.4

¬ A further problem that arises while valuing a resource is on additivity of different kinds of values. It is often debated that such kinds of values accruing from a resource constitute a part of the so-called total economic value. Will different values assigned to a particular situation or resource be double counting for total economic value? See the Box 4.16 for an illustration on this. However, on a practical basis, all values accruing from a resource cannot be accounted any way; and hence there seems to be an agreement to add whatever is accountable. But such a state of current knowledge makes this valuation a somewhat hazardous enterprise. So, as has been said before in out discussion on the techniques for valuation, it is the assumption in the methods being applied that account for the difference in the results between two estimates, which might have been arrived at using two different methods. And the choice of a method for valuation is dependent upon the resource in question, the data availability and the judgment of the evaluator. It is the last, which is the cause of all contentions.
Box 4.16: Case of possible Double Counting of Eco-system values
Take as an illustration, the case of eco-system value of coral reefs in an area of 62 million hectares.
The following are independent eco-systems and their estimated values per hectare per year.
Disturbance regulation $2750
Waste treatment $ 58
Biological control $ 5
Food production $ 220
Raw materials $ 27
Total eco-system value $3060
But, independently, there is also an estimate of the Recreation value, based on Travel cost method.
Recreation $3008
TOTAL $6068
Note that the value of eco-system services is just about the same as that of Recreation benefits (based on Travel cost method).
SHOULD THE ECO-SYSTEM VALUE BE ADDED TO THE RECREATION VALUE?
Isn’t true that the recreation value is just about the total of eco-system values? Is it not true that recreation value is due to all those eco-system values? Have we not double counted the eco-system values of the coral reef?
¬ The physical and monetary valuation of a resource is of utmost importance in order to value natural resources. The actual valuation of any resource is contingent upon many aspects. An alternative way to view the problem of environmental degradation and their valuation is to look at them from the perspective of different stakeholders, in terms of :
o the activities of the stakeholders which affect the resource,o the resulting change in the environment as a result of the activities – the
stressors,

o the impacts of the change in the state of the environment impacts receptors due to change in exposure to stressors and
o the response of individuals to impacts.
This method, commonly known as Stake holder analysis is dealt separately in Chapter Seven.
¬ Finally, there is always a question on the valuation methodology vis-à-vis cost-benefit analysis. It can be argued, it is not really so, that they are two alternatives. Rather, they are mutually dependent method. After all, benefits and costs comprise of both the physical attributes and their values. But it is a matter of the NBSAP process to take the exercise well up to cost-benefit analysis or not.
4.6: Economic Incentives, Methods and Instruments for Valuation
Economic incentive measures and instruments aim to reflect the economic values of
biodiversity in sectoral activities that have the greatest impacts on biodiversity. Instruments are
varied and it is difficult to generalise about applicability for a large country such as India. With
many of the mattes related to biodiversity being a state subject, modification may be necessary
for specific instruments to suit the states specifically. Note that the issue of value capture can be
addressed in this section.
Box 4.17 summarises the available instruments and incentive measures commonly used
by economists. They will have to tailored for different states, under NBSAP process
specifically, depending upon the applicability and experience with instruments and incentives.
Box 4.17: Classification of Incentive Measures
Positive Incentives Disincentives Indirect Incentives Removal of PerverseIncentives

• agricultural land set-aside schemes• public or grant-aided land purchase• wetland reserves• oven-ants/conservation easements• cost-sharing/management agreements• species enhancement schemes• customary cultivation of biodiversity• international biodiversity transfers• incentive payments for organic farming• taxation and fiscal measures
• user fees• non-compliance fees• fines for damages• environmental liability• performance bonds• habitat mitigation schemes• marine pollution liability
• individual transfer-able fishing quotas• tradable development rights• property-right mechanisms• species commercialisation• biodiversity prospecting deals• forestry offsets• air emission trading• effluent discharge trading• tradable water entitlements• wetlands mitigation banking• joint implementation• debt-for-nature swaps• international franchise agreements• eco-labeling
• reduction and restructuring of agricultural support harmful to biodiversity• introduction of agricultural conservation compliance measures• reform of public forestry concession pricing, licence fees, reforestation fees, and royalties• full appraisal of forest benefits• discontinuation of below-cost timber sales• reform of tax structures• full cost pricing for water services• appraisal of biodiversity impacts in the transport sector• road pricing• costing of biodiversity loss in energy investment appraisal
Source: Saving Biological Diversity: Economic Incentives OECD (1995)
4.7: Economics and valuation : A summary of select Indian case studies
The purpose of this section is to highlight various ranges of values and methodologies
applied in different valuation studies pertaining to forest and related biodiversity studies in India.
The list is not exhaustive by any means, and more often they are illustrative in nature only. It
will however help the NBSAP process to understand and appreciate the efforts that have gone in
so far and the possibilities to refine the estimates.
In India, attempts to estimate economic values for non-market benefits of bio-diversity
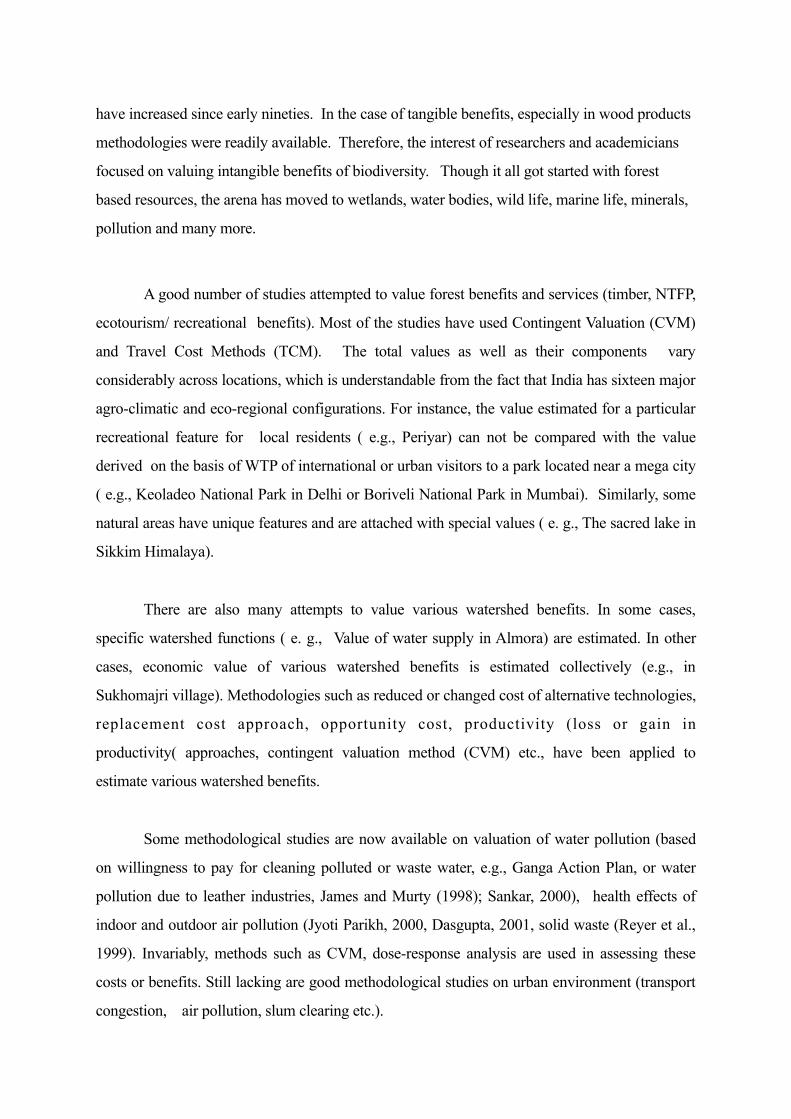
have increased since early nineties. In the case of tangible benefits, especially in wood products
methodologies were readily available. Therefore, the interest of researchers and academicians
focused on valuing intangible benefits of biodiversity. Though it all got started with forest
based resources, the arena has moved to wetlands, water bodies, wild life, marine life, minerals,
pollution and many more.
A good number of studies attempted to value forest benefits and services (timber, NTFP,
ecotourism/ recreational benefits). Most of the studies have used Contingent Valuation (CVM)
and Travel Cost Methods (TCM). The total values as well as their components vary
considerably across locations, which is understandable from the fact that India has sixteen major
agro-climatic and eco-regional configurations. For instance, the value estimated for a particular
recreational feature for local residents ( e.g., Periyar) can not be compared with the value
derived on the basis of WTP of international or urban visitors to a park located near a mega city
( e.g., Keoladeo National Park in Delhi or Boriveli National Park in Mumbai). Similarly, some
natural areas have unique features and are attached with special values ( e. g., The sacred lake in
Sikkim Himalaya).
There are also many attempts to value various watershed benefits. In some cases,
specific watershed functions ( e. g., Value of water supply in Almora) are estimated. In other
cases, economic value of various watershed benefits is estimated collectively (e.g., in
Sukhomajri village). Methodologies such as reduced or changed cost of alternative technologies,
replacement cost approach, opportunity cost, productivity (loss or gain in
productivity( approaches, contingent valuation method (CVM) etc., have been applied to
estimate various watershed benefits.
Some methodological studies are now available on valuation of water pollution (based
on willingness to pay for cleaning polluted or waste water, e.g., Ganga Action Plan, or water
pollution due to leather industries, James and Murty (1998); Sankar, 2000), health effects of
indoor and outdoor air pollution (Jyoti Parikh, 2000, Dasgupta, 2001, solid waste (Reyer et al.,
1999). Invariably, methods such as CVM, dose-response analysis are used in assessing these
costs or benefits. Still lacking are good methodological studies on urban environment (transport
congestion, air pollution, slum clearing etc.).

There are not many studies on ecological valuation of Indian forests. A study by
Kadekodi and Ravindranath (1997) and another by Haripriya (2001) presents estimates of
carbon sink values of Indian forests by analysing the inter-linkages between forestry and other
sectors of the Indian economy. The studies on economic value of nutrient fixing, pollution
control, and other ecological functions as result of biodiversity are limited. However, attempts
have been made to derive these values by applying indirect methods to estimate aggregate
values of forests/ biodiversity in a particular state or region (Verma, 2000).
Several studies that attempted natural resource accounting, have also estimated several
benefits of biodiversity in economic terms (Parikh and Haripriya, 1998; Chopra and Kadekodi,
1997; Verma, 2000).
Attempts to estimate option value and non-use values such as existence value and
bequest value are also seen in some studies (Chopra, 1993). However, the reliability of these
values in the Indian context has not been discussed extensively.
A bird view of select list of major Indian studies on aspects of biodiversity and their
estimated values are shown in Table 4.7.
Table 4.7: Economic value of the components of Natural Resources: SomeSelect Indian Studies
G o o d s a n d s e r v i c e s valued
Annual Value Location Methodology applied
Source
R e c r e a t i o n / Ecotourism
Rs.16197 per ha.(Rs.427.04 per Indian visitorRs.432.04 per foreign visitor)
K e o l a d e o National Park, Bharatpur
Tr a v e l C o s t Method
Chopra (1998)
R e c r e a t i o n /Ecotourism
Rs.20944 per ha.(Rs.519 per Indian visitor and Rs.495 per foreign visitor)
K e o l a d e o National Park
C o n t i n g e n t V a l u a t i o n Method
M u r t h y & M e n k h u a s (1994)
R e c r e a t i o n /Ecotourism & other benefits
Rs.23300 per ha.(Rs.90 per household.(Rs.7.5/month/household);Rs.240 Million/year
B o r i v e l i National Park,Mumbai
C o n t i n g e n t V a l u a t i o n Method
Hadker et .al (1995)

EcotourismRs.676 per ha .(for locals);(Rs3.2 million total per year)
Periyar Tiger Reserve
C o n t i n g e n t V a l u a t i o n Method, Travel cost Method
Manoharan(1996)
Ecotourism Rs 2.95 million total;(Rs.34.68 per visitor)
K a l a k a d u Mundanthurai Tiger Reserve, Tamil Nadu
C o n t i n g e n t V a l u a t i o n Method
Manoharan and Dutt ( 1999)
Ecotour ism/recreational/p i l g r i m a g e /sacred grove
W T P f o r m a i n t e n a n c e a n d preservation of the lake by:Local community= US $ 0.88(Rs.36.08)Local pilgrims = US$ 2.2(Rs90.2)Resident visitors=US$ 2.5(Rs102.5)Non-resident visitors=US$7.2(Rs.295.2)(Aggregate WTP = US $46940 based on total visits per year ( Rs1.92 million)Per hectare value = Rs.1604
Recreat ional v a l u e o f a sacred lake in S i k k i m H i m a l a y a (Khecheopalri lake)
TCM &CVM
Maharana et.al.(2000)
Ecotourism WTP for the management of the park: By foreign tourists: $8.84; by domestic tourists:$1.91; by local community:$6.20 per year. WTP total for annual maintenance works out to $87,777.
Khangchendzonga National Park, Sikkim
CVM Maharana et al. 2000
Wetland Additional value of property around the lake is Rs. 186 per sq. ft.
B h o j L a k e , Bhopal
H e d o n i c pricing
Madhu Verma (2000)
S o i l conservation
Cost of soil erosion:Rs.21583 per hectare
Doon valley Replacement cost approach
K u m a r , P . (2000)
S o i l conservation
Decline in Value of land due to soil degradation is Rs.3510 per hectare.
H a r y a n a a g r i c u l t u r a l land
Produc t iv i ty approach
Kir i t Par ikh (2001)
Urban water pollution
Av. Cost of illness per household per year: Rs. 1094
City of New Delhi
P r o d u c t i o n function
Dasgupta, P. (2001)
Biomass/dung/watershed
Value of additional dung collected due to stall feeding is Rs.34.40 per cattle per year
S u k h o m a j r i village
O p p o r t u n i t y cost
Chopra et al., 1990
Water supply Rs.4745 per hectare Almora Forests I n d i r e c t Methods
C h a t u r v e d i , 1993
Water supply Annual willingness to pay for water: Rs. 109-410 for irrigation purposes; Rs.27-53 for drinking purposes
From glacier to Tarai mountain r e g i o n o f Kumaon valley
C o n t i n g e n t v a l u a t i o n method
Kadekodi, 2000
Ecological functions (use value) for local residents.
Rs.624 per hectare Yamuna Basin C o n t i n g e n t V a l u a t i o n method
C h o p r a a n d Kadekodi, 1997
Carbon store Rs. 1,292 billion for total Indian forests) & Rs.20125 per hectare
Indian Forests Species wise forest inventory data
H a r i p r i y a (1999)
Carbon Store Rs.1.2 lakh per hectare A l l I n d i a forests
B i o m a s s estimation
Kadekodi & Ravindranath (1997)
U r b a n A i r pollution
Statistical value of life affected:Rs.2.87 lakhs per life; Human capital value affected: Rs. 3.83 per life
Mumbai city Dose –response model
Jyot i Parikh (2000)
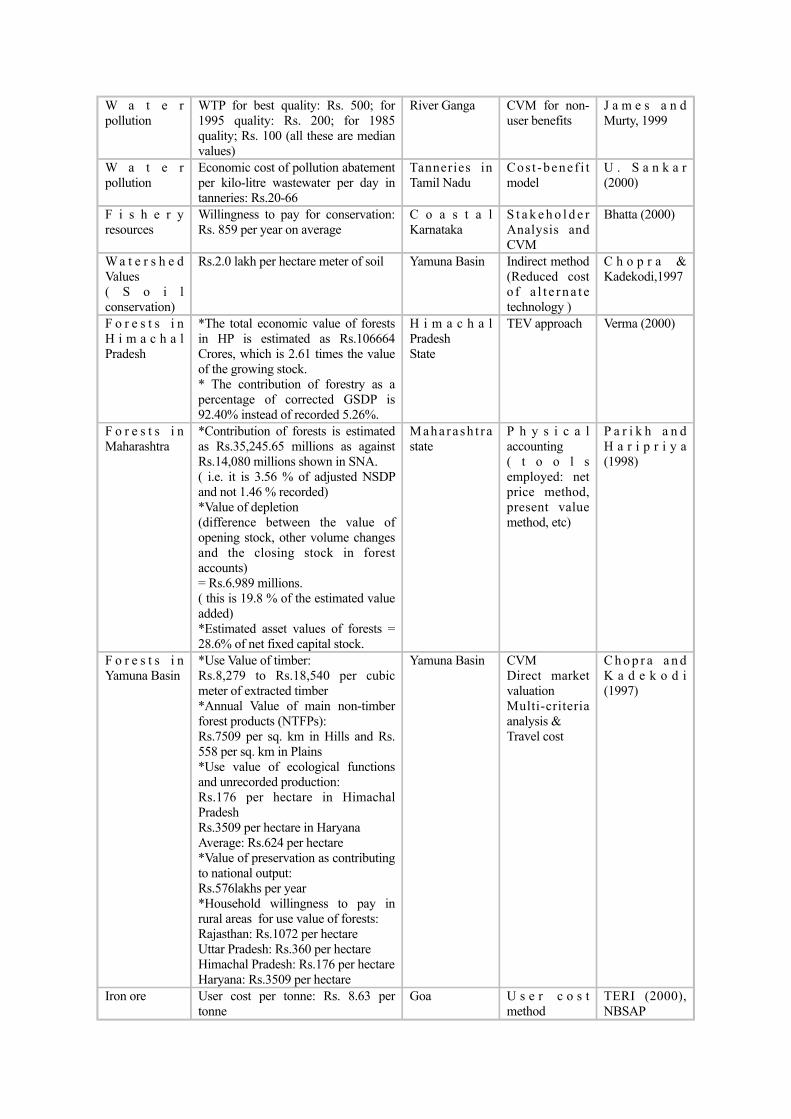
W a t e r pollution
WTP for best quality: Rs. 500; for 1995 quality: Rs. 200; for 1985 quality; Rs. 100 (all these are median values)
River Ganga CVM for non-user benefits
J a m e s a n d Murty, 1999
W a t e r pollution
Economic cost of pollution abatement per kilo-litre wastewater per day in tanneries: Rs.20-66
Tanneries in Tamil Nadu
Cos t -benef i t model
U . S a n k a r (2000)
F i s h e r y resources
Willingness to pay for conservation: Rs. 859 per year on average
C o a s t a l Karnataka
S t a k e h o l d e r Analysis and CVM
Bhatta (2000)
W a t e r s h e d Values( S o i l conservation)
Rs.2.0 lakh per hectare meter of soil Yamuna Basin Indirect method (Reduced cost o f a l t e r n a t e technology )
C h o p r a & Kadekodi,1997
F o r e s t s i n H i m a c h a l Pradesh
*The total economic value of forests in HP is estimated as Rs.106664 Crores, which is 2.61 times the value of the growing stock.* The contribution of forestry as a percentage of corrected GSDP is 92.40% instead of recorded 5.26%.
H i m a c h a l PradeshState
TEV approach Verma (2000)
F o r e s t s i n Maharashtra
*Contribution of forests is estimated as Rs.35,245.65 millions as against Rs.14,080 millions shown in SNA. ( i.e. it is 3.56 % of adjusted NSDP and not 1.46 % recorded)*Value of depletion(difference between the value of opening stock, other volume changes and the closing stock in forest accounts)= Rs.6.989 millions. ( this is 19.8 % of the estimated value added)*Estimated asset values of forests = 28.6% of net fixed capital stock.
Maharash t r a state
P h y s i c a l accounting( t o o l s employed: net price method, present value method, etc)
P a r i k h a n d H a r i p r i y a (1998)
F o r e s t s i n Yamuna Basin
*Use Value of timber:Rs.8,279 to Rs.18,540 per cubic meter of extracted timber*Annual Value of main non-timber forest products (NTFPs):Rs.7509 per sq. km in Hills and Rs.558 per sq. km in Plains*Use value of ecological functions and unrecorded production:Rs.176 per hectare in Himachal PradeshRs.3509 per hectare in HaryanaAverage: Rs.624 per hectare*Value of preservation as contributing to national output:Rs.576lakhs per year *Household willingness to pay in rural areas for use value of forests:Rajasthan: Rs.1072 per hectareUttar Pradesh: Rs.360 per hectareHimachal Pradesh: Rs.176 per hectareHaryana: Rs.3509 per hectare
Yamuna Basin CVMDirect market valuationMulti-criteria analysis &Travel cost
C h o p r a a n d K a d e k o d i (1997)
Iron ore User cost per tonne: Rs. 8.63 per tonne
Goa U s e r c o s t method
TERI (2000), NBSAP

The Ministry of Environment and Forests, Government of India, constituted a
committee in 1998 to workout methodology for quantifying economic value of intangible
benefits of forests. Following are some recommendations of the committee:
Box 4.18: Recommendations of the Committee for Working out Methodology for Quantifying Intangible Benefits of Forests, constituted by the Ministry of Environment
and Forests, Government of India, 1998.
1. The committee after recognising the fact that very little work has been done in economic valuation of intangible benefits of forests, recommends that there is an urgent need to take studies on various aspects of forest valuation.
2. For assessing ecological loss, the committee recommended to analyse the structure and functioning of the forest ecosystem. The structure of the forest ecosystem is to be estimated by three main ecological attributes viz. Importance value Index (IVI), population dynamics and species diversity where as the functioning of the ecosystem is to be ascertained with the help of bio mass studies, litter fall and transfer of mineral within the various biotic and abiotic compartments of the ecosystem.
3. The committee recommends that the methodologies identified for quantifying intangible benefits of forests should be used selectively depending upon the characteristics of the forests to be valued. For this purpose, it recommends that first of all the forest types, as classified by Champion and Seth (1968) be identified. After having identified the forest type, the next step would be to identify the major ecological function(s) the particular forest type is performing at the particular site. Having identified the major ecological function(s) the appropriate methodology is to be selected and applied….
4. It is noticed that total economic value (TEV) which is the sum of use values (UV) and non use values (NUV) shows the true economic value of full range of tangible and intangible benefits of forests. However, appropriate methodologies are not readily available to quantify the benefits of some components of TEV. Similarly, the committee noticed the problem of double counting during the aggregation of various benefit estimates. Therefore, the committee recommends that the quantification of various intangible benefits of forests should primarily based on the major ecological functions of the forests.
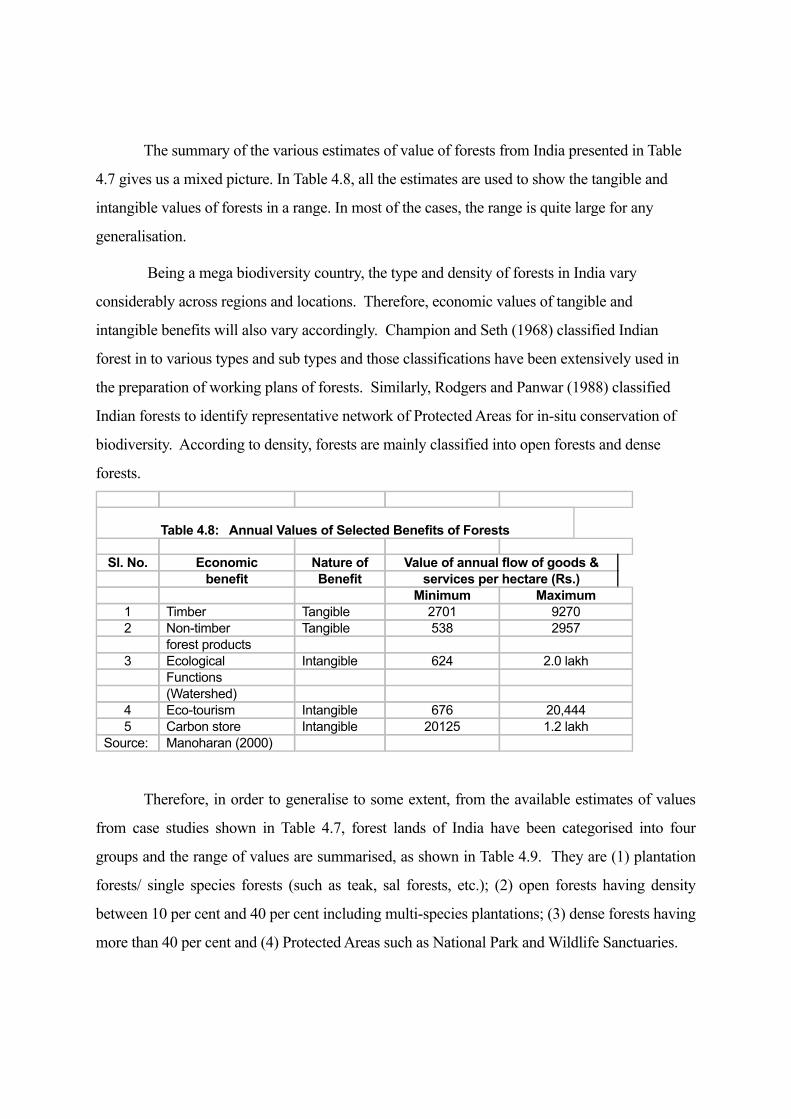
The summary of the various estimates of value of forests from India presented in Table
4.7 gives us a mixed picture. In Table 4.8, all the estimates are used to show the tangible and
intangible values of forests in a range. In most of the cases, the range is quite large for any
generalisation.
Being a mega biodiversity country, the type and density of forests in India vary
considerably across regions and locations. Therefore, economic values of tangible and
intangible benefits will also vary accordingly. Champion and Seth (1968) classified Indian
forest in to various types and sub types and those classifications have been extensively used in
the preparation of working plans of forests. Similarly, Rodgers and Panwar (1988) classified
Indian forests to identify representative network of Protected Areas for in-situ conservation of
biodiversity. According to density, forests are mainly classified into open forests and dense
forests.
Table 4.8: Annual Values of Selected Benefits of Forests
Sl. No. Economic Nature of Value of annual flow of goods & benefit Benefit services per hectare (Rs.)
Minimum Maximum1 Timber Tangible 2701 92702 Non-timber Tangible 538 2957 forest products 3 Ecological Intangible 624 2.0 lakh Functions (Watershed) 4 Eco-tourism Intangible 676 20,4445 Carbon store Intangible 20125 1.2 lakh
Source: Manoharan (2000)
Therefore, in order to generalise to some extent, from the available estimates of values
from case studies shown in Table 4.7, forest lands of India have been categorised into four
groups and the range of values are summarised, as shown in Table 4.9. They are (1) plantation
forests/ single species forests (such as teak, sal forests, etc.); (2) open forests having density
between 10 per cent and 40 per cent including multi-species plantations; (3) dense forests having
more than 40 per cent and (4) Protected Areas such as National Park and Wildlife Sanctuaries.

Table 4.9: Economic values of various kinds of forest land in IndiaSl. No. Nature of forest land Selected economic
Value of annual flow Present value* of
benefitsof goods &
servicesgoods &
services per
per hectare
(Rs.) hectare (Rs.)
Minimum
Maximum
Minimum
Maximum
1Plantations/Single species forest Timber 2701 9270 33660 115525
(teak, sal forests, etc) (crown density < 40%)
2Multispecies plantations/open Timber + NTFP 3239 12227 40365 152375
Forests (crown density 10-40%)
3 Dense forest NTFP + Ecological 21287 322957 265283402475
8 (crown density>40%) Functions + Carbon Store
4 Protected Areas Eco-tourism + 21425 340444 267003424268
5
Ecological Functions +
Carbon Store * As 5% rate for a period of 20 years.Source: Manoharan (2000)
In the case of intangible benefits, the attention has to be paid for the last two categories
of forests, viz. dense forests and protected areas. Estimates show that value of annual flow of
goods and services of dense forests varies from Rs. 21287 per hectare to Rs. 3.2 lakhs per
hectare. In the case of Protected Areas, the value is from Rs. 21425 per hectare to Rs. 3.4 lakhs
per hectare. The present values (PV) of the forest flows have been worked out at 5 per cent rate
of discount for a period of 20 years. The PV of dense forests varies from 2,65 lakhs to 40 lakhs
and that of Protected Area varies from 2.67 lakhs to 42 lakhs. Once again, one finds it difficult
to generalize the forest values.
4.8: Beyond Valuation:
For the NBSAP process, a basic question is about the use of valuation of biodiversity.
Briefly stated, it is relevant for decision and policy making on biodiversity conservation. Two
major uses that can be highlighted are:

¬ Natural resource accounting (as against national income accounting)
¬ Cost benefit analysis of resource development and use.
These will be very briefly dealt here with illustrations from India.
4.8.1: Natural Resource Accounting
With the valuation exercise completed for natural resource stocks and flows, it is then
logical to use these values to integrate the flow of natural and environmental resources in
measuring the welfare of a nation. This branch of enquiry is generally termed as Natural
Resource Accounting.
Natural resources are wealth of a country. Natural Resource Accounting is a revaluation of
the National Income Accounts of a country, adjusting for the values of natural resources used in
various economic activities during the past ‘fiscal year’. Natural resources, as they appear in
nature, get degraded in quality and depleted in stock due to economic and human activity (e.g.,
hazardous chemicals polluting ground water or over-extraction of minerals or forest resources
leading to depletion). They also go through natural decay (such as earth quakes or cyclones) and
regeneration (e.g., in protected areas). They may also have been enhanced due to plan
interventions such as plantations (e.g., social forestry). Therefore, being part of the wealth of the
nation, there is a need to integrate the resource accounting along with the System of National
Accounts (SNA). United Nations Statistical Division (UNSTAT) labelled this as System of
Environmental and Economic Accounting (SEEA). In some sense it is often referred to Green
GDP.
The main objectives of integrated environmental accounting are segregation and elaboration
of all environmental and economic accounting, linkage of physical resource accounts with
monetary environmental accounts and balance sheets, assessments of environmental costs,
benefits and accounting for the maintenance of the tangible wealth. It is, thus, a complete
accounting procedure for environmental assets. Natural resource accounting involves three
steps:
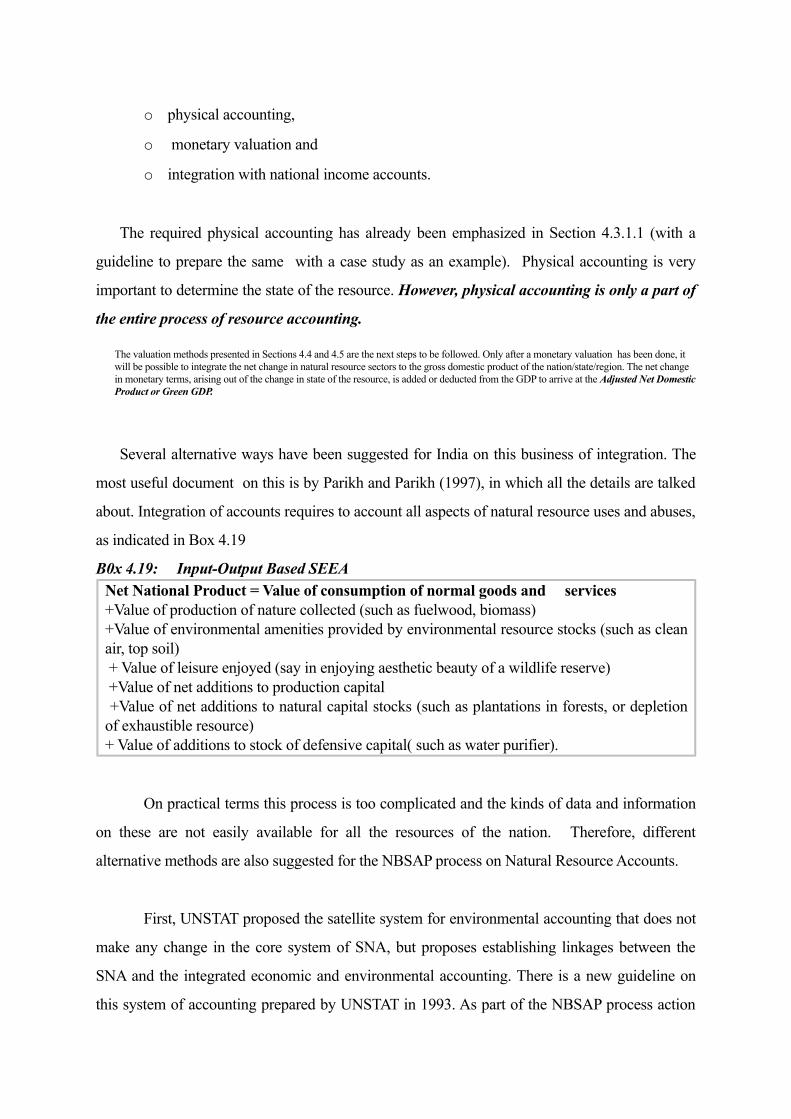
o physical accounting,
o monetary valuation and
o integration with national income accounts.
The required physical accounting has already been emphasized in Section 4.3.1.1 (with a
guideline to prepare the same with a case study as an example). Physical accounting is very
important to determine the state of the resource. However, physical accounting is only a part of
the entire process of resource accounting.
The valuation methods presented in Sections 4.4 and 4.5 are the next steps to be followed. Only after a monetary valuation has been done, it will be possible to integrate the net change in natural resource sectors to the gross domestic product of the nation/state/region. The net change in monetary terms, arising out of the change in state of the resource, is added or deducted from the GDP to arrive at the Adjusted Net Domestic Product or Green GDP.
Several alternative ways have been suggested for India on this business of integration. The
most useful document on this is by Parikh and Parikh (1997), in which all the details are talked
about. Integration of accounts requires to account all aspects of natural resource uses and abuses,
as indicated in Box 4.19
B0x 4.19: Input-Output Based SEEANet National Product = Value of consumption of normal goods and services+Value of production of nature collected (such as fuelwood, biomass)+Value of environmental amenities provided by environmental resource stocks (such as clean air, top soil) + Value of leisure enjoyed (say in enjoying aesthetic beauty of a wildlife reserve) +Value of net additions to production capital +Value of net additions to natural capital stocks (such as plantations in forests, or depletion of exhaustible resource)+ Value of additions to stock of defensive capital( such as water purifier).
On practical terms this process is too complicated and the kinds of data and information
on these are not easily available for all the resources of the nation. Therefore, different
alternative methods are also suggested for the NBSAP process on Natural Resource Accounts.
First, UNSTAT proposed the satellite system for environmental accounting that does not
make any change in the core system of SNA, but proposes establishing linkages between the
SNA and the integrated economic and environmental accounting. There is a new guideline on
this system of accounting prepared by UNSTAT in 1993. As part of the NBSAP process action

plan, this should be incorporated in Indian national income accountings. The values of the
biodiversity resources and their changes can be shown along with the ususal national income
accountings, as a satellite statement. It is essentially a modified income accounting system,
showing environment related sectoral activities separately along with their physical accounts of
flow changes, valuations and possible links to the main SNA. Figure 4.5 demonstrates this.
The second way is to treat natural resources as a separate set of activities (loosely to be
termed as industries) in an Input-Output table (which is an input for national income accounts,
commonly used by the Central Statistical Organisation). Then the outflows from such natural
resource sectors will have been absorbed by other sectors of the economy. For instance, water
production from Water Resource Sector would flow to many industrial sectors, household sector
and of course to agriculture sector as irrigation. But there are many more difficulties in
completing the task of flows form natural resource sectors.
Take forestry as an example for a sector or activity. Even for this sector, the difficulties
in accounting are:o Distinguishing between depreciation and depletion. In the case of depreciation, it
can remain as a notional value judgment. The same can not be said about natural resources when they actually degrade and deplete.
o Secondly, accounting for additions to forest stock is not easy. It takes place both through natural regeneration and plantation.
o Thirdly, the flow from forest stocks is only partially accounted as legal extractions: much of it is not. Then there are several natural phenomena such as forest fires, landslides, earthquakes, floods etc., on account of which there are changes in this natural capital. In short, physical accounting of forest stock and flows is a complex task.
Yet, as an example the valuation of forests from Himachal Pradesh to deduce the
adjusted green accounting is shown in Section 5.3.4 of Chapter Five.
The third way of arriving at the Green GDP is to account for depletion of natural
resources using either the Use Cost method or Depreciation or Net price method (all of which
have been talked about in Section 4.5). It will be useful for the NBSAP process to understand

the method with a case study.
Box 4.20: Case Study on Accounting for Iron Ore Depletion
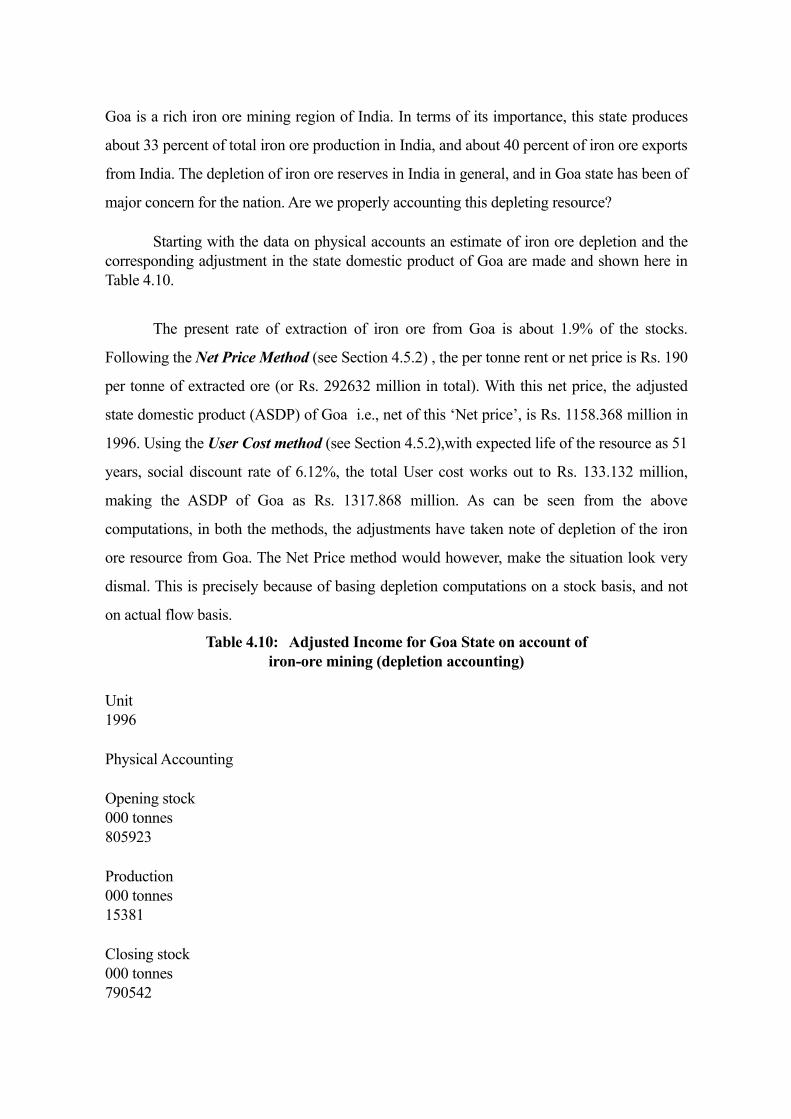
Goa is a rich iron ore mining region of India. In terms of its importance, this state produces
about 33 percent of total iron ore production in India, and about 40 percent of iron ore exports
from India. The depletion of iron ore reserves in India in general, and in Goa state has been of
major concern for the nation. Are we properly accounting this depleting resource?
Starting with the data on physical accounts an estimate of iron ore depletion and the corresponding adjustment in the state domestic product of Goa are made and shown here in Table 4.10.
The present rate of extraction of iron ore from Goa is about 1.9% of the stocks.
Following the Net Price Method (see Section 4.5.2) , the per tonne rent or net price is Rs. 190
per tonne of extracted ore (or Rs. 292632 million in total). With this net price, the adjusted
state domestic product (ASDP) of Goa i.e., net of this ‘Net price’, is Rs. 1158.368 million in
1996. Using the User Cost method (see Section 4.5.2),with expected life of the resource as 51
years, social discount rate of 6.12%, the total User cost works out to Rs. 133.132 million,
making the ASDP of Goa as Rs. 1317.868 million. As can be seen from the above
computations, in both the methods, the adjustments have taken note of depletion of the iron
ore resource from Goa. The Net Price method would however, make the situation look very
dismal. This is precisely because of basing depletion computations on a stock basis, and not
on actual flow basis.
Table 4.10: Adjusted Income for Goa State on account ofiron-ore mining (depletion accounting)
Unit1996
Physical Accounting
Opening stock 000 tonnes805923
Production 000 tonnes15381
Closing stock 000 tonnes790542

Lessons for the NBSAP Process
¬ First, the data base requirements for Natural Resource Accounting are quite high.
Central Statistical Organisation should have a separate wing to collect the necessary
data exclusively for natural resource accountings.
¬ Second, more and more studies on valuation be built-in the NBSAP process to
address to aspects such as depletion, degradation, preservation, inter-generational
values, dose-responses etc.
¬ Third, the National Sample Survey, having engaged in a survey of environmental
status of the economy, together with demographic and health status data from
various other sources can be used to develop some of these parameters.
¬ Fourth, environmental economists and statisticians should continue to demonstrates
the possibilities to adjust the domestic products for all the natural resource related
issues, some of which may not directly appear in the traditional income accountings
(e.g., biodiversity ). Certainly, a long way to go further before a complete SEEA is
available for policy planning for India.
4.8.2: Project evaluation for biodiversity conservation: Cost-Benefit Analysis
An application of valuation is for project designing and evaluation towards biodiversity
conservation. Take the case Eco-development projects in the protected areas as an example, or
developing fishing in a mangrove. Cost Benefit Analysis (CBA) is the most common method of
economic project and policy appraisal. CBA is a decision tool, which judges projects according
to a comparison between their costs (disadvantages) and benefits (advantages). If a project
shows a net benefit, it can be approved, and different projects can be ranked according to the
size of their net benefit.
Since it is a very widely known and used method, no further elaboration of steps
involved for a CBA is presented here. Two basics should be remembered however. One,
fundamental for CBA is to recognize that all costs (direct and indirect) and all benefits (direct
and indirect) are to be valued (using valuation techniques discussed earlier). Second, The
technique is useful only when there are alternatives to be examined (be they ecological,

commercial, technical).
As an example, consider two alternative mangrove management strategies. Option A --
conversion to aquaculture, and Option B -- sustainable traditional use. If the mangrove is to be
cleared for aquaculture (Option A), the direct costs of conversion (e.g., clearing the mangrove
area and setting up ponds) and the foregone benefits (opportunity cost) of the converted
mangrove should be included as part of this option's costs. Without conversion, the mangrove
could have been conserved closer to its natural state through limited and sustainable use (Option
B). Foregone benefits associated with Option A may include the loss of important environmental
functions (e.g., support to near shore fisheries and shoreline stabilisation) and resources (e.g.,
forest products and wildlife).
After accounting for all costs and benefits, they must be discounted so that they can be
compared on an equal footing, allowing for the years in which they occur -- and reducing both
streams to a single figure, namely present value. The CBA rule incorporating time is:
(Bt-Ct) (1+r)-t >0 (3)
where
subscript t refers to time.
B - benefits (including environmental benefits)
C - costs (including environmental costs)
All the costs and benefits are to base on the valuation studied carried out, along with the
usual shadow pricing for other inputs such as labour, man-made capital etc.

4.9: Strategy and Action Plan on Valuation
The following can be some of the major recommendations for the NBSAP process based on
the methodology of Valuation and the experience so far in India.
Studies on economic valuation of various ecological functions of biodiversity should be encouraged. The comparison of values estimated from various sites/areas has to be done with caution.
There should be more research on methodologies for estimating non-use values in India.The MoEF should initiate to bring out a publication on rapid and cost effective valuation
methodologies for valuing biodiversity. The economic benefits of biodiversity enjoyed by the private sector companies including MNCs
require special attention and there should be some mechanism to capture a portion of these benefits for investing biodiversity conservation programmes.
5. A Social Science based research institution be identified by MoEF, which can undertake studies on valuation on a continual basis, almost on the lines of EIA for project clearance.

C H A P T E R - F I V E
LESSONS FROM ON-GOING STUDIES ON VALUATION OF BIODIVERSITY
5.1: Experience of Wetland Valuation studies-worldwide
5.1.1: Relevance of valuation of wetlands in India India has a rich variety of wetland habitats. The total area of wetlands (excluding rivers) in India is 58,286,000ha, or 18.4% of the
country, 70% of which comprises areas under paddy cultivation. A total of 1,193 wetlands, covering an area of about 3,904,543 ha, were recorded in a preliminary inventory coordinated by the Department of Science and Technology, of which 572 were natural (Scott, 1989). Six sites - Chilika Lake (Orissa), Keolaodeo National Park (Bharatpur), Wular lake, Harike Lake, Loktak Lake (in Manipur) and Sambhar Lake have been designated under the Convention of Wetlands of International Importance (Ramsar Convention) as being especially significant waterfowl habitats. The country's wetlands are generally differentiated by region into eight categories (Scott, 1989): the reservoirs of the Deccan Plateau in the south, together with the lagoons and the other wetlands of the southern west coast; the vast saline expanses of Rajasthan, Gujarat and the gulf of Kachch; freshwater lakes and reservoirs from Gujarat eastwards through Rajasthan (Keolaodeo Ghana National park) and Madhya Pradesh; the delta wetlands and lagoons of India's east coast (Chilika Lake); the freshwater marshes of the Gangetic Plain; the floodplain of the Brahmaputra; the marshes and swamps in the hills of north-east India and the Himalayan foothills; the lakes and rivers of the montane region of Kashmir and Ladakh; and the mangroves and other wetlands of the island arcs of the Andamans and Nicobars.
Because of such a large segment of landscape having some significance for its
biodiversity conservation, in this section, special attention is given to elaborate the need to value
such wetlands, the alternative methods of valuing, and experience in applying them all over the
world, so that for the Indian NBSAP, we should be able to arrive the precisely relevant methods.
Some of the major wetland functions relevant for India are summarised in Table 5.1.
Table 5.1Wetland functions, the associated economically valuable goods and services and the names of
variablesthat capture the presence of these in the data
Function Economically valuable good(s)
and/orTechnique(s) typically used to
quantityservice(s) (variable names) the value of the service(s)
Recharge of ground water Increased water quantity
(quantity)Net factor income or replacement cost
Discharge of ground water Increased productivity of downstream
Net factor income, replacement cost or
fisheries (com.fish) travel costWater quality control Reduced costs of water
purificationNet factor income or replacement cost
(quality) Retention, removal and transformation
Reduced costs of water purification
Net factor income or replacement cost
of nutrients (quality) Habitat for aquatic species Improvements in commercial and/
orNet factor income, replacement cost,
recreational fisheries either on or offsite
travel cost or contingent valuation
(com.fish and rec.fish). Nonuse appreciation of the species
(habitat)
Habitat for terrestrial and avian species
Recreational observation and hunting of
Travel cost or contingent valuation
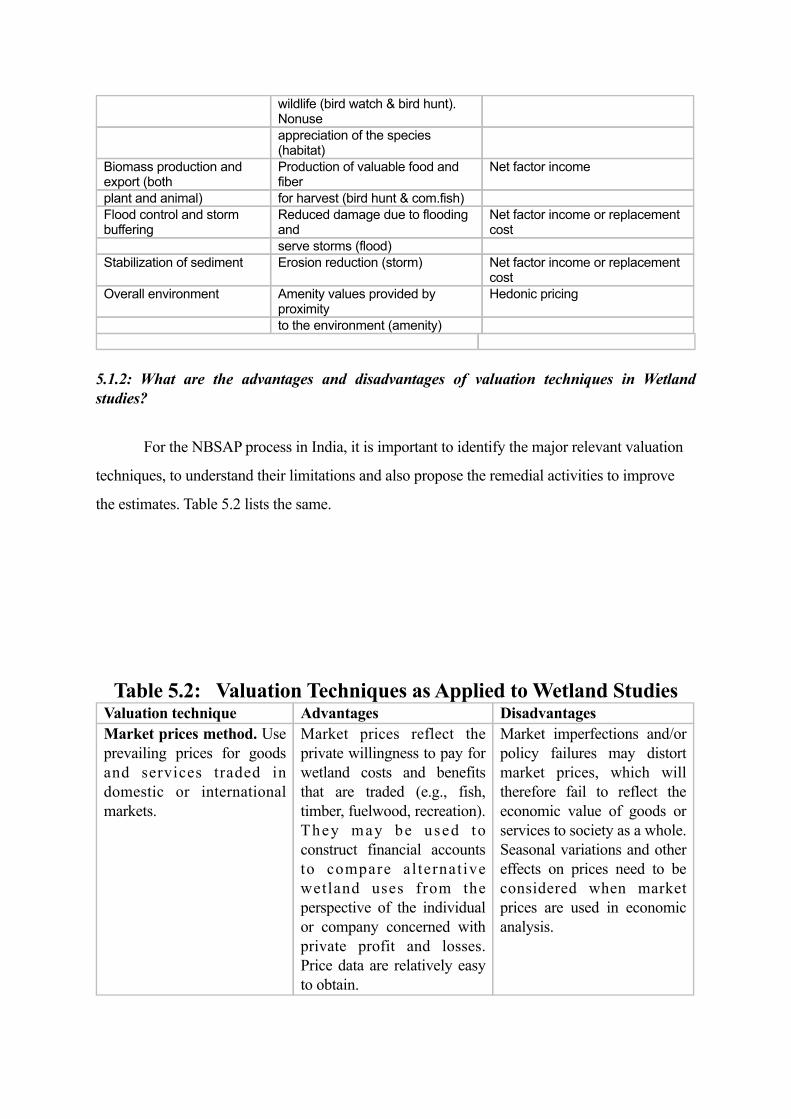
wildlife (bird watch & bird hunt). Nonuse
appreciation of the species (habitat)
Biomass production and export (both
Production of valuable food and fiber
Net factor income
plant and animal) for harvest (bird hunt & com.fish) Flood control and storm buffering
Reduced damage due to flooding and
Net factor income or replacement cost
serve storms (flood) Stabilization of sediment Erosion reduction (storm) Net factor income or replacement
costOverall environment Amenity values provided by
proximityHedonic pricing
to the environment (amenity)
5.1.2: What are the advantages and disadvantages of valuation techniques in Wetland studies?
For the NBSAP process in India, it is important to identify the major relevant valuation
techniques, to understand their limitations and also propose the remedial activities to improve
the estimates. Table 5.2 lists the same.
Table 5.2: Valuation Techniques as Applied to Wetland StudiesValuation technique Advantages DisadvantagesMarket prices method. Use prevailing prices for goods and services traded in domestic or international markets.
Market prices reflect the private willingness to pay for wetland costs and benefits that are traded (e.g., fish, timber, fuelwood, recreation). They may be used to construct financial accounts to compare al ternative wetland uses from the perspective of the individual or company concerned with private profit and losses. Price data are relatively easy to obtain.
Market imperfections and/or policy failures may distort market prices, which will therefore fail to reflect the economic value of goods or services to society as a whole. Seasonal variations and other effects on prices need to be considered when market prices are used in economic analysis.

Efficiency (shadow) prices method. Use of market prices but adjusted for transfer payments, market imperfections and policy d i s to r t i ons . May a l so incorporate distribution weights, where equality concerns are made explicit. Shadow prices may also be calculated for non-marketed goods.
Efficiency prices reflect the true economic value or opportunity cost, to society as a whole, of goods and services that are traded in domestic or international markets (e.g., fish, fuelwood, peat).
Derivation of efficiency prices is complex and may require substantial data. Apparently decision-makers may not accept ‘artificial’ prices.
Hedonic pricing method. T h e v a l u e o f a n environmental amenity (such as a view) is obtained from property or labour markets. The basic assumption is that the observed property value (or wage) reflects a stream of b e n e f i t s ( o r w o r k i n g conditions) and that it is possible to isolate the value o f t h e r e l e v a n t environmental amenity or attribute.
Hedonic pricing has potential for valuing certain wetland func t ions ( e .g . , s to rm protection, groundwater recharge) in terms of their impact on land values, assuming that the wetland functions are fully reflected in land prices.
Application of hedonic pricing to the environmental f unc t i ons o f we t l ands requires that these values are r e f l ec t ed i n su r roga t e markets. The approach may be limited where markets are d i s t o r t ed , cho i ce s a r e constrained by income, i n f o r m a t i o n a b o u t environmental conditions is not widespread and data are scarce.
Travel cost approach. The travel cost approach derives willingness to pay for environmental benefits at a specific location by using information on the amount of money and time that people spend to visit the location.
Widely used to estimate the value of recreational sites including public parks and w i l d l i f e r e s e r v e s i n developed countries. It could b e u s e d t o e s t i m a t e willingness to pay for eco-tourism to tropical wetlands i n s o m e d e v e l o p i n g countries.
Data intensive; restrictive assumptions about consumer b e h a v i o u r ( e . g . , multifunctional trips); results highly sensitive to statistical methods used to specify the demand relationship.

P r o d u c t i o n f u n c t i o n approach. Estimates the value of a non-marketed resource or ecological function in terms of changes in economic activity by modeling the physical contribution of the resource or function to economic output.
Widely used to estimate the impact of wetlands and reef destruction, deforestation and water pollution, etc., on productive activities such as fishing, hunting and farming.
Requires explicit modeling of t h e ‘ d o s e - r e s p o n s e ’ relationship between the resources and some economic output. Application of the a p p r o a c h i s m o s t straightforward in the case of single use systems but becomes more complicated with multiple use systems. Problems may arise from multi-specification of the e c o l o g i c a l - e c o n o m i c re la t ionship or double counting.
Related good method. Uses informat ion about the relation-ship between a non-marketed good or service and a marketed product to infer value. The barter exchange approach relies on actual exchange of non-marketed goods. The direct substitute approach simply assumes that a marketed good can be substituted for a non-marketed good. The indirect substitute approach also relies on a substitute good, but if the latter is not exchanged in the market its value is inferred in terms of a change in economic output (i.e., the direct substitute approach combined with the p r o d u c t i o n f u n c t i o n approach).
These approaches may provide a rough indicator of economic value, subject to data constraints and the degree of similarity or substitutability between related goods.
T h e b a r t e r e x c h a n g e a p p r o a c h r e q u i r e s information on the rate of exchange between two goods. T h e d i r e c t s u b s t i t u t e a p p r o a c h r e q u i r e s information on the degree of substitution between two goods. The indirect substitute a p p r o a c h r e q u i r e s information on the degree of substitution and on the contribution of the substitute good to economic output.
C o n s t r u c t e d m a r k e t techniques. Measure of wil l ingness to pay by directly eliciting consumer preferences.
Directly estimates Hicksian welfare measure - provides best theoretical measure of willingness to pay.
Practical limitations of c o n s t r u c t e d m a r k e t techniques may detract from theoret ical advantages, leading to poor estimates of true willingness to pay.
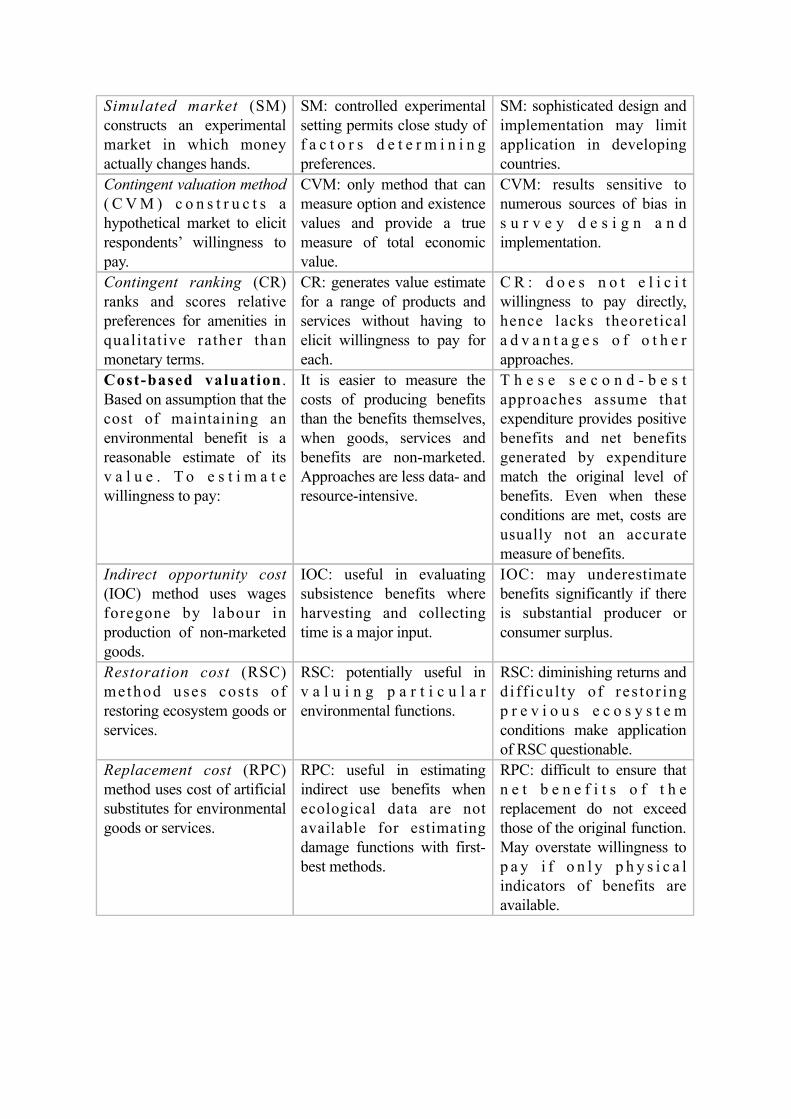
Simulated market (SM) constructs an experimental market in which money actually changes hands.
SM: controlled experimental setting permits close study of f a c t o r s d e t e r m i n i n g preferences.
SM: sophisticated design and implementation may limit application in developing countries.
Contingent valuation method ( C V M ) c o n s t r u c t s a hypothetical market to elicit respondents’ willingness to pay.
CVM: only method that can measure option and existence values and provide a true measure of total economic value.
CVM: results sensitive to numerous sources of bias in s u r v e y d e s i g n a n d implementation.
Contingent ranking (CR) ranks and scores relative preferences for amenities in qualitative rather than monetary terms.
CR: generates value estimate for a range of products and services without having to elicit willingness to pay for each.
C R : d o e s n o t e l i c i t willingness to pay directly, hence lacks theoretical a d v a n t a g e s o f o t h e r approaches.
Cost-based valuation . Based on assumption that the cost of maintaining an environmental benefit is a reasonable estimate of its v a l u e . T o e s t i m a t e willingness to pay:
It is easier to measure the costs of producing benefits than the benefits themselves, when goods, services and benefits are non-marketed. Approaches are less data- and resource-intensive.
T h e s e s e c o n d - b e s t approaches assume that expenditure provides positive benefits and net benefits generated by expenditure match the original level of benefits. Even when these conditions are met, costs are usually not an accurate measure of benefits.
Indirect opportunity cost (IOC) method uses wages foregone by labour in production of non-marketed goods.
IOC: useful in evaluating subsistence benefits where harvesting and collecting time is a major input.
IOC: may underestimate benefits significantly if there is substantial producer or consumer surplus.
Restoration cost (RSC) method uses cos t s o f restoring ecosystem goods or services.
RSC: potentially useful in v a l u i n g p a r t i c u l a r environmental functions.
RSC: diminishing returns and d i ff icu l ty of res tor ing p r e v i o u s e c o s y s t e m conditions make application of RSC questionable.
Replacement cost (RPC) method uses cost of artificial substitutes for environmental goods or services.
RPC: useful in estimating indirect use benefits when ecological data are not available for estimating damage functions with first-best methods.
RPC: difficult to ensure that n e t b e n e f i t s o f t h e replacement do not exceed those of the original function. May overstate willingness to p a y i f o n l y p h y s i c a l indicators of benefits are available.
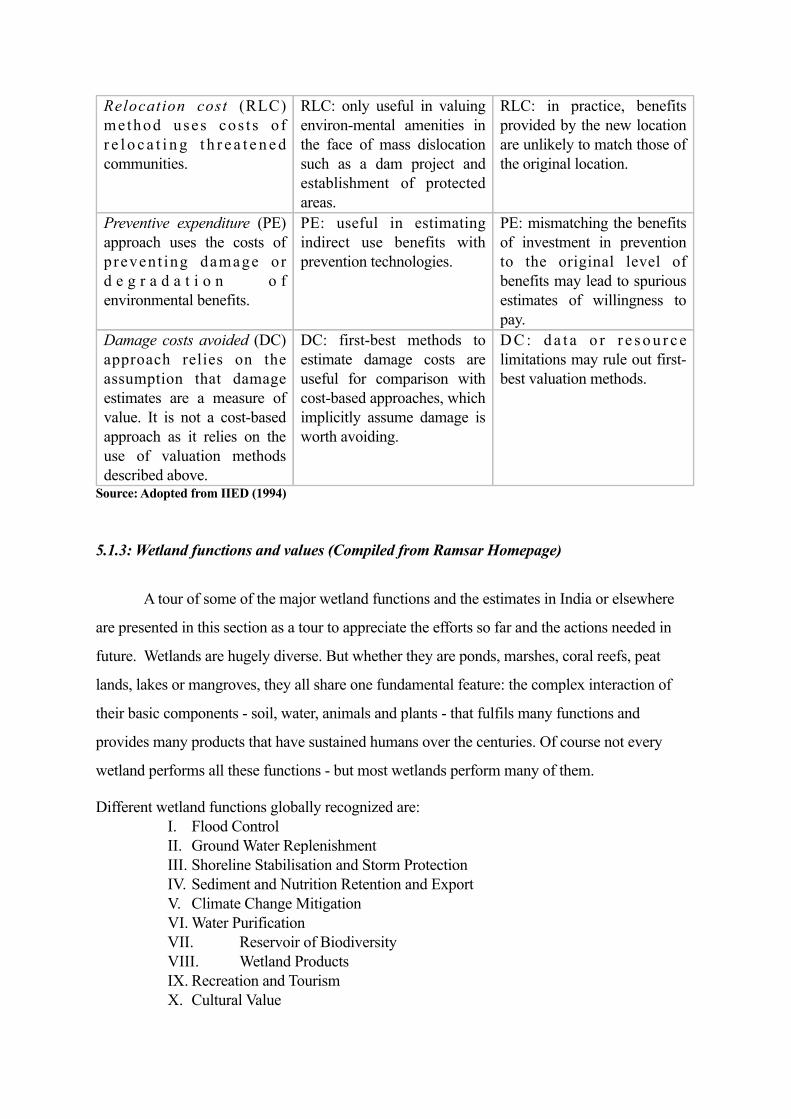
Relocation cost (RLC) method uses cos t s o f r e l o c a t i n g t h r e a t e n e d communities.
RLC: only useful in valuing environ-mental amenities in the face of mass dislocation such as a dam project and establishment of protected areas.
RLC: in practice, benefits provided by the new location are unlikely to match those of the original location.
Preventive expenditure (PE) approach uses the costs of prevent ing damage or d e g r a d a t i o n o f environmental benefits.
PE: useful in estimating indirect use benefits with prevention technologies.
PE: mismatching the benefits of investment in prevention to the original level of benefits may lead to spurious estimates of willingness to pay.
Damage costs avoided (DC) approach relies on the assumption that damage estimates are a measure of value. It is not a cost-based approach as it relies on the use of valuation methods described above.
DC: first-best methods to estimate damage costs are useful for comparison with cost-based approaches, which implicitly assume damage is worth avoiding.
D C : d a t a o r r e s o u r c e limitations may rule out first-best valuation methods.
Source: Adopted from IIED (1994)
5.1.3: Wetland functions and values (Compiled from Ramsar Homepage)
A tour of some of the major wetland functions and the estimates in India or elsewhere
are presented in this section as a tour to appreciate the efforts so far and the actions needed in
future. Wetlands are hugely diverse. But whether they are ponds, marshes, coral reefs, peat
lands, lakes or mangroves, they all share one fundamental feature: the complex interaction of
their basic components - soil, water, animals and plants - that fulfils many functions and
provides many products that have sustained humans over the centuries. Of course not every
wetland performs all these functions - but most wetlands perform many of them.
Different wetland functions globally recognized are:I. Flood ControlII. Ground Water ReplenishmentIII. Shoreline Stabilisation and Storm ProtectionIV. Sediment and Nutrition Retention and ExportV. Climate Change MitigationVI. Water PurificationVII. Reservoir of BiodiversityVIII. Wetland ProductsIX. Recreation and TourismX. Cultural Value

A summary of values on some of these functions are presented below:
5.1.3.1:Value of Flood Control
Indian wetlands are very much prone to floods. Wetlands "hold" heavy rainfalls,
preventing possible flooding downstream. By storing the water in the soil or retaining it in the
surface waters of lakes, marshes, etc., wetlands reduce the need for expensive engineered
structures. Wetland vegetation also plays a role in slowing down the flow of flood water. It is
therefore useful to take a look at the values attached to this important function of wetlands.
A recent study in the USA estimated that 0.4 hectares of wetland can store over 6,000
cubic metres of floodwater. The intact 3,800 hectares of wetlands along part of the main stream
of the Charles River in the USA have been valued at US$ 17 million per year, the estimated cost
of flood damage that would result if they were drained. More readily available are figures on the
cost of flood damage after this function has been lost or seriously eroded by unsustainable
development.
The Chinese have suffered an increasing frequency of devastating floods since the turn
of the last century. Their worst floods occurred in 1998, affecting several rivers including the
Yangtze. The statistics were appalling - 230 million people affected, 20 million people displaced,
over 3,500 killed, 7 million homes destroyed, 15 million farmers suffering loss of their crops;
the estimated total economic losses exceeded US$ 32 billion. Analysis of the causes identified
increasing population as the root problem, fuelling many environmental changes: an increase in
settlements in low-lying areas subject to floods; reclamation of the wetlands around lakes and
rivers for cultivation to feed the growing population, thus reducing their flood absorption
capacity; serious deforestation in the upper reaches of the rivers for further agricultural
production, causing heavy silting in the lower reaches (in lakes, rivers and other wetlands) and
reducing flood absorption capacities in both areas. These problems are mirrored in other
countries. The long-term response to the calamity in China was swift, with plans both to restore
reclaimed land around lakes and rivers to wetland areas and to cease logging in the upper and
middle reaches of rivers, turning many of the loggers to afforestation projects to protect the
watershed.
Such catastrophes may not generate quite the same level of human suffering in India.
But lack of specific studies on the cost of floods and valuation of flood protection functions is
needed, as part of the NBSAP process.
5.1.3.2: Ground Water ReplenishmentAn aquifer is a layer of rock containing water. Underground aquifers store 97% of the
world’s unfrozen freshwater, and they provide drinking water to almost a third of the world’s
people – in Asia alone more than a billion people rely on groundwater for drinking, and in
Europe it is estimated that 65% of public water supplies come from groundwater sources.
The relationship between groundwater and wetlands is rather complicated. Some
wetlands, such as peat lands, lie on top of an impermeable layer of rock or soil, preventing the
passage of water between the aquifer and the wetland. Other wetlands owe their existence to
groundwater that has come to the surface as springs, while still others occur on permeable soils
overlying aquifers, allowing water to recharge the aquifer directly.
5.1.3.3:Shoreline Stabilisation and Storm Protection
India is prone to cyclones, particularly on the eastern coasts starting from Bangladesh to
Andhra Pradesh. Hurricanes, cyclones, storm surges and other coastal weather disturbances can
cause immense damage through flooding and direct destruction of property, not to mention the
loss of human life. The loss of life of over 5000 people in the Andhra Pradesh cyclonic storm in
1997 is priceless. In Bangladesh 40,000 people were drowned in 1985 during one storm surge.
Globally, an estimated 46 million people per year are currently at risk from storm surges.
Salt marshes, mangroves and other forested wetlands act as the frontline defense against
incoming storms. They help minimize the impact of storms by reducing wind action, wave
action and currents, while the roots of the plants help to hold the sediment in place. The 1999
super cyclone of Orissa caused extensive damage in the coastal zone. The large-scale
devastation was clearly due to the near disappearance of mangroves along the coastline under
pressure from growing population and the resettled Bangladesh refugees. Mangroves in the
Sundarban break up storm waves that exceed 4 meters in height, and this has encouraged the
Government of Bangladesh to invest considerable sums of money in re-planting mangroves in
the area to assist in storm protection.
Reforestation is a costly process: in Thailand replanting costs amounted to US$ 946 per
hectare compared to only US$ 189 per hectare for protecting existing mangroves.
The value of intact mangrove swamps in Malaysia for storm protection and flood control alone
has been estimated at US$ 300,000 per kilometer – the cost of replacing them with rock walls.
Shoreline stabilisation is equally important in inland rivers. In the United Kingdom, the loss of
vegetation along riverbanks in eastern England was coasted at US$ 425 per meter of bank – the
cost of maintaining artificial bank reinforcement to prevent erosion.
Coral reefs also deliver storm protection. A recent estimate of the value of coral reefs
found that the cost of destroying just 1 kilometer of reef ranged from US$ 137,000 to almost
US$ 1.2 million over a 25-year period, based on the economic value of storm protection, fishing
and tourism. Despite their crucial role, an estimated one third of the world’s 600,000 square
kilometers of coral reefs have already been destroyed. A recent survey indicates that 58% of the
remaining reefs are at risk from human activities, with over fishing and destructive fishing
practices, as well as coastal development and bleaching associated with climate change,
identified as the major culprits. In the Andaman &Nicobar islands ,there is also some evidence
of roads/coasts being eroded in places where corals have been mined for various purposes.
5.1.3.4:Sediment and Nutrition Retention and Export
Wetlands tend to slow down the force of water, encouraging the deposition of sediments
carried in the water. This is beneficial further downstream where deposition of sediments may
block waterways. Nutrients are often associated with sediments and can be deposited at the same
time. These nutrients, mainly nitrogen and phosphorous from agricultural sources but also from
human wastes and industrial discharges, may accumulate in the sub-soil, be transformed by
chemical and biological processes or be taken up by wetland vegetation which can then be
harvested and effectively removed from the system. This capacity for nutrient retention makes

many wetland ecosystems among the most productive recorded, rivaling intensive agricultural
systems.
Using appropriate valuation techniques can save floodplains. For instance, the rich
Hadejia-Jama’are floodplain in northern Nigeria has long supported tens of thousands of people
through fishing, agriculture, fuelwood and fodder production, livestock and tourism. Plans to
divert some of its water supply for irrigated agriculture led to an assessment of the relative
benefits of the two uses of the floodplain. The intact floodplain was valued at US$ 167 per
hectare, in stark contrast to the US$ 29 per hectare in benefits for the diversion option – a clear
vote for maintaining the natural wetland ecosystem. Valued in another way, the water in the
floodplain was worth US$ 45 per 1,000 cubic meters in contrast to US$ 0.04 for the diverted
water. Of course wetland ecosystems are complex biological and hydrological systems and the
retention of nutrients and sediments is often a seasonal characteristic: at certain times of the year
wetlands function as a "source" rather than a "sink" of sediments and nutrients. In temperate
wetlands, for example, nutrient retention is greatest during the growing season when microbial
activity is highest in the water and when wetland plants are at their most productive.
5.1.3.5: Climate Change Mitigation
Wetlands play at least two critical but contrasting roles in mitigating the effects of
climate change: one in the management of greenhouse gases (especially carbon dioxide) and the
other in physically buffering climate change impacts. Wetlands act as significant carbon sinks
and so the destruction of wetlands will release carbon dioxide, a greenhouse gas, while wetland
restoration and creation will increase the sequestering of carbon.
Wetlands will play a further role as the frontline defenders of coastal and inland areas as
countries deal with the full effects of climate change: increasing frequency of storms, changing
rainfall patterns, rising sea-levels and sea surface temperatures. Wetlands have been identified
as significant storehouses (sinks) of carbon. Using Ramsar’s broad definition of wetlands this
may amount to as much as 40% of global terrestrial carbon. Peat lands and forested wetlands are
particularly important as carbon sinks. Although covering only 3% of the world’s land area, peat
lands are estimated to store over 25% of the soil carbon pool. Although wetlands are known to

play an important role in the global carbon cycle their full role is not yet completely understood.
What is clear is that drainage, conversion to agricultural use and degradation of wetlands will
release large quantities of carbon dioxide (which accounts for at least 60% of the warming
effect) as well as other greenhouse gases contributing to global warming. It is alarming to realise
that the Earth is likely to become warmer during this century than at any other time in the
history of the human species.
The many environmental changes associated with climate change have serious
implications for wetlands – key impacts on wetlands include the effects of sea level rise, rising
temperatures, and changes in precipitation patterns, ocean currents and winds. Compounding
this in certain areas will be the likely increase in tropical storms as well as heavier and more
abundant rainfall bringing increased freshwater and sediment to coastal areas. Changes in the
hydrological cycle will affect inland wetlands too and test their abilities to contend with
increased rainfall in some areas and decreased rainfall in others as well as changes in
groundwater recharge and discharge. Beaches, dunes, estuaries, mangroves and other coastal
wetlands are naturally equipped to adapt to changes in prevailing winds and seas and to sea-level
rises. The predicted changes as a result of climate change will, however, be increasingly rapid
compared to the natural rate of change to which the systems are adapted. Coastal managers will
have to assist wetlands to adapt to these changes – dune restoration and rehabilitation and re-
creation of coastal wetlands will be essential in some countries.
5.1.3.6: Water Purification
Plants and soils in wetlands play a significant role in purifying water. High levels of
nutrients such as phosphorous and nitrogen, commonly associated with agricultural run-off, are
effectively removed by wetlands. This is important in preventing eutrophication further
downstream, a process that leads to rapid plant and algal growth followed by depleted oxygen
levels that affect other species. It can also be important in preventing high concentrations of
these nutrients reaching groundwater supplies or other water sources that may be used for
drinking water. Wetlands can be highly effective in dealing with these high levels of nutrients
In West Bengal, India, 430 members of a Fisherman’s Cooperative harvest one tonne of
fish a day from ponds that receive 23 million liters of polluted water daily from both industrial
and domestic sources. Eichhornia crassipes is used here to remove the heavy metals while other
wetland plants remove grease and oil. Mercury levels, although high in incoming water, cannot
be detected in the outflow, and the wetland plants remove 99.9% of the faecal coliform bacteria.
The value of the purification function of wetlands is significant: New York City recently
found that it could avoid spending US $3-8 billion on new waste water treatment plants (with
US$ 700 million annual operating costs) by investing just US$ 1.5 billion in buying land around
the reservoirs upstate as well as instituting other protective measures to protect the watershed
that will do the job of purifying the water supply for free.
Using this purification capacity of wetlands, Calcutta has pioneered a system of sewage
disposal that is both efficient and environmentally friendly. Built to house one million people,
Calcutta is now home to over 10 million, many living in slums and creating a sanitation
nightmare. But the 8,000-hectare East Calcutta marshes, a patchwork of tree-fringed canals,
vegetable plots, rice paddies and fish ponds, along with the assistance of 20,000 people, daily
transform one third of the city’s sewage and most of its domestic refuse into 20 tonnes of fish
and 150 tonnes of vegetables. Mobilising people and wetlands here dispenses with the need for
costly engineered sewage systems, brings great benefit to many local people, and solves at least
part of the sanitation problem in the city.
5.1.3.7: Reservoir of Biodiversity
Wetlands support spectacular concentrations of wetland-dependent wildlife. Spectacular
statistics aside, wetlands in general are home to a great diversity of species. Although freshwater
ecosystems cover only 1% of the Earth’s surface, they hold more than 40% of the world’s
species and 12% of all animal species. On the marine front, coral reefs are among the most
biologically diverse ecosystems on the planet, rivalling tropical rainforests, the most diverse of
the land ecosystems. Although they cover only 0.2% of the ocean floor, coral reefs may contain
25% of all marine species. The Great Barrier Reef in Australia alone is home to 1,500 species of
fish and 4,000 types of mollusc. Four thousand species of fish and 800 species of reef-building

corals have already been described for reefs, but the total number of species associated with
reefs is quite likely to be more than a million.
The biodiversity in wetlands is also valuable as a reservoir of genes. Rice is a common
wetland plant and the staple diet for over half the world’s population. Wild rice continues to be
an invaluable source of new genetic material for developing disease resistance, yet many
different varieties of rice have disappeared in recent years – leaving us dependent on a shrinking
genetic base. A typical "lifespan" of a commercially-bred crop variety has been estimated at 5-10
years before new genetic material is required to combat pest and disease problems. The value of
such traits on a global scale is counted in the billions of dollars.
Wetland species have also been extensively used in the medical industry. It is estimated
that over 20,000 medicinal plant species are currently in use, some of them from wetlands, and
over 80% of the world’s population depends on traditional medicine for their primary health care
needs. Amphibians are recognised as a particularly threatened group of wetland animals, yet
current research identifies at least some species as a veritable pharmacopoeia: research on a
South American clawed toad has revealed that chemicals in its skin have potential as antibiotics,
fungicides and anti-viral preparations. The blood of horseshoe crabs, a species basically
unchanged for 350 million years, contains a compound used by the pharmaceutical industry to
test the purity of drugs and medical equipment that holds human blood.
In Chilika lake, according to Zoological Survey of India, the total number of fish species
in the lake has come down from 126 in 1920’s to just about 69. Annandale (1921) had recorded
about 53 different species birds were observed on Barakundi island of the lake. Hussain,
Mahapatra and Ali (1984) reported about 151 species of birds regularly visiting the lake during
the winter season. It is predominated by 22 species of ducks and geese, 52 species of plovers and
sandpipers belonging to 8 families, 14 species of gulls and terns, 13 species of eagles and 11
species of herons and egrets. Out of the 151 species, 92 are considered to be resident or local
migrants. Due to severe degradation of the lake ecology, both fish and avifauna species have
come down significantly (Kadekodi, 2000). The estimated lower bound value of these
biodiversity losses have been put as 30 million US dollars.

Our future needs of the global gene pool are uncertain and "extinction is forever", so society
ought to consider conserving biological diversity for its potential future uses as well as for its
present uses. This is essentially an "option value"; losses in diversity represent a reduction in this
value. Perhaps another way of looking at this value is to consider, for example, how much
people and institutions are willing to pay for the conservation of species and ecosystems:
The world’s largest NGO, WWF, has an annual income of US$ 343 million; the largest
proportion of this comes from individual members who pay to conserve wildlife they
may never see.
The Global Environment Facility (GEF) operates the financing mechanism of the
Convention on Biological Diversity (CBD). Since 1991, a total of US$ 2.2 billion from the GEF
Trust Fund and a further US$ 1.3 billion through co-financing have been allocated to
biodiversity activities in 334 projects in 119 countries. Significant sums are being spent
specifically on wetland projects. The Ramsar Bureau is currently involved in three on-going
GEF-funded projects that directly or indirectly conserve wetland biodiversity: a US$ 15.5
million MedWet project (jointly funded by UNDP’s GEF, the French GEF and other sources) to
conserve and manage Mediterranean coastal wetlands in 6 countries; a US$ 627,225 project to
enhance the critical network of wetlands required by migratory waterbirds on the African/
Eurasian flyway; and a US$ 347,400 project to conserve some major wetlands in Iran. It is
envisaged that, through the Bureau’s Joint Work Plan with the CBD, more GEF funding will
become available for wetland projects in the future.
5.1.3.8: Wetland Products
Besides performing the many vital functions and roles described above, wetlands provide a
variety of other benefits to humans in the form of products that can be exploited for human use.
The range is enormous: fruit, fish, shellfish, deer, crocodile and other meats, resins, timber for
building, fuelwood, reeds for thatching and weaving, fodder for animals, etc. Exploitation is
carried out at all levels – subsistence level, cottage industry, and the larger commercial scale – in
all parts of the world.

A good example of wetland product, strongly linked to external market is from Chilika lake.
Currently, the fish and prawn landings from the lake are of the order of 1300 and 282 metric
tones. Of these, almost 80 percent of them are exported (Kadekodi and Gulati, 1999). It should
also be noted that both the landings and hence the quantity exports have been going down,
though not the values of exports. This is mainly due to highly elastic price increase in the
international markets, as compared to the local prices.
The staple diet of 3 billion people, half the world’s population, and about 80% pr Indian
population is rice. Additionally Indian wetlands also have been found to be very productive in
sugarcane.
The mangrove is an amazingly versatile plant from a human perspective. Growing all
over the world in tropical areas, the range of mangrove products used by humans includes thatch
for roofing, fibres for textile and paper-making, timber for construction, fuelwood, medicines
from bark, leaves and fruits, as well as dyes and tannins used to treat leather. In the Bangladesh
portion of the Sundarbans, a 650,000-hectare mangrove forest spanning the border between
India and Bangladesh, exploitation of the wetlands involves a 20-year mangrove cycle
producing 45% of all the timber from state-owned forests and the sole source of newspaper print
in the country. It employs 45,000 people during the peak harvesting season, and a further 10,000
fisherman live in the forest for 3-4 months each year exploiting the abundant fish.
5.1.3.9: Recreation and TourismThe natural beauty as well as the diversity of animal and plant life in many wetlands
makes them ideal locations for tourists. Many of the finest sites are protected as National Parks
or World Heritage Sites in India; many of them are able to generate considerable income from
tourist and recreational uses. The total number of tourists to Chilika lake was about 83,000 in
1983, which swelled to 1,48,000 by 1994. But needless to mention that with the deterioration of
the lake, the tourism rates come down significantly in the recent years. The valuation of
tourism another wetland, namely, from Bhoj lake is shown in Box 5.1
5.1.3.10: Cultural Value
This is a relatively poorly documented function of wetlands, yet there are many

instances where wetlands have significant religious, historical, archaeological or other cultural
values for local communities, representing a part of a nation’s heritage. Some wetlands support
traditional activities that represent part of the history of the nation. For instance, Chilika lake in
Orissa is worshipped as Goddess of Utkal, as seen in the first four lines of a poem Chilika,
written in 1981 by the famous poet Radhanath Ray of Orissa:
“Oh Chilika your body laced
with the garlands of ducks,
You are the luxury blue-watered
lake of the Goddess Utkal,
You are also the charming
treasure of decorations,
And splendourous wealth of
the kingdom Utkal.”
_______Translated by Dr. B. Padhi of Utkal University______
In some cultures wetlands may have deep religious significance for local people. In
Tibet, pre-Buddhist belief identified various lakes as sacred, making them objects of worship as
well as ensuring their protection from pollution and other harm. As Buddhism took over, these
beliefs remained, albeit in a modified form, and certain lakes in Tibet are still sacred to the
people with strict regulations that determine their exploitation.
It may be appropriate for the NBSAP policy formulation to take a look at some
estimates of values for a small wetland in India.
Box 5.1: Multiple values of Bhoj wetland (in India) to multiple stakeholders
Different kinds of values accrue from the Bhoj Wetland to different stakeholders living around as well as away from the lake. The values so estimated using various valuation techniques are summarised in Table 5.1.
Table 5.1: Estimation of Economic Values of Bhoj Wetland (Annual for 1999-2000)
Uses / Impacts Stakeholders Valuation Techniques Value (in Rs) A. Drinking Water Water supplying agencies Supply Cost 9,54,13,962B. Fish Production Fishermen Market Price of Existing Production49,20,000C. Boating Boatmen Income Estimation 24,37,880D. Trapa cultivation Trapa (water chest nut) Cultivators Market Price of Existing Production 50,00,000E Washing of clothes Washer men Income Estimation 36,00,000
F. Secondary Activitiesi.Maize cob sellingii.Sugar cane juice sellingiii.Snacks &cold drink stallsiv.Horse ridesv.MPTDC a. Cafeteria b. Boating
i.Maize Cobb sellersii.Sugarcane juice sellersiii.Individual ownersiv.Individual ownersv.MPTDC
i.Income Estimation
ii.Income Estimation
iii.Income Estimation
iv. Income Estimationv.a.Revenue Generation b.Revenue generation
i.1,44,000
ii. 2,73,600
iii. 2,06,400
5.2: Experience on valuation of forest resources: A case study of Himachal Pradesh Forest Accounting (* with most of the inputs from Madhu Verma)
5.2.1: Do we know all about forest in India?
India possesses a distinct identity, not only because of its geography, history and culture
but also because of the great diversity of its natural ecosystems. The panorama of Indian forests
ranges from evergreen tropical rain forests in the Andaman and Nicobar Islands, the Western
Ghats, and the north-eastern states, to dry alpine scrub high in the Himalaya to the north.
Between the two extremes, the country has semi-evergreen rain forests, deciduous monsoon
forests, thorn forests, subtropical pine forests in the lower montane zone and temperate montane
forests (Lal, 1989).
One of the most important tropical forests classifications was developed for Greater
India (Champion, 1936) and later republished for present-day India (Champion and Seth, 1968).
This approach has proved to have wide application outside India. In it 16 major forests types are
recognised, subdivided into 221 minor types. Structure, physiognomy and floristics are all used
as characters to define the types.
The main areas of tropical forest are found in the Andaman and Nicobar Islands; the
Western Ghats, which fringe the Arabian Sea coastline of peninsular India; and the greater
Assam region in the north-east. Small remnants of rain forest are found in Orissa state. Semi-
evergreen rain forest is more extensive than the evergreen formation partly because evergreen
forests tend to degrade to semi-evergreen with human interference. There are substantial
differences in both the flora and fauna between the three major rain forest regions (IUCN, 1986;
Rodges and Panwar, 1988).
The Western Ghats Monsoon forests occur both on the western (coastal) margins of the
ghats and on the eastern side where there is less rainfall. These forests contain several tree
species of great commercial significance (e.g. Indian rosewood Dalbergia latifolia, Malabar
Kino Pterocarpus marsupium, teak and Terminalia crenulata), but they have now been cleared
from many areas. In the rain forests there is an enormous number of tree species. At least 60
percent of the trees of the upper canopy are of species, which individually contribute not more

than one percent of the total number. Clumps of bamboo occur along streams or in poorly
drained hollows throughout the evergreen and semi-evergreen forests of south-west India,
probably in areas once cleared for shifting agriculture.
The tropical vegetation of north-east India (which includes the states of Assam,
Nagaland, Manipur, Mizoram, Tripura and Meghalaya as well as the plain regions of Arunachal
Pradesh) typically occurs at elevations up to 900 m. It embraces evergreen and semi-evergreen
rain forests, moist deciduous monsoon forests, riparian forests, swamps and grasslands.
Evergreen rain forests are found in the Assam Valley, the foothills of the eastern Himalayas and
the lower parts of the Naga Hills, Meghalaya, Mizoram, and Manipur where the rain fall
exceeds 2300 mm per annum. In the Assam Valley the giant Dipterocarpus macrocarpus and
Shorea assamica occur singly, occasionally attaining a girth of up to 7 m and a height of up to
50 m. The monsoon forests are mainly moist sal Shorea robusta forests, which occur widely in
this region (IUCN, 1991).
The Andamans and Nicobar islands have tropical evergreen rain forests and tropical
semi-evergreen rainforests as well as tropical monsoon moist monsoon forests (IUCN,
1986).The tropical evergreen rain forest is only slightly less grand in stature and rich in species
than on the mainland. The dominant species is Dipterocarpus grandiflorus in hilly areas, while
Dipterocarpus kerrii is dominant on some islands in the southern parts of the archipelago. The
monsoon forests of the Andamans are dominated by Pterocarpus dalbergioides and Terminalia
spp.
5.2.2: Building up value of forests from the bottom:
One always asks a very common question, when it comes to valuation. What is the total
economic value of a forest? In this Section, under NBSAP, a cases study specifically is
presented drawn from Madhu Verma (2000) for the purpose of understanding and appreciating
the question as well as the answer.
As presented in Chapter four, various components of Total Economic Value are
identified first, estimated and used for natural resource accounting, which is the ultimate purpose
of valuation studies on biodiversity. Some of the major non-tangible values or benefits are listed

in Box 5.2.
Box 5.2: Selected economic valuation methods for intangible benefits of Indian forests
Benefits Methodology for economic valuation Direct method Indirect method Direct – Non-consumptive 1. Contingent valuation 1. Travel Cost Method(1) Ecotourism/recreation method (2) Education and Research 2. Experiments (3) Human habitat (4) Other non-consumptive uses Indirect 1. Contingent valuation 1. Change-in-productivity method approach(A) Watershed benefits : 2. Experiments (1) Agriculture productivity 2. Replacement cost(2) Soil conservation approach(3) Recharging of group water (4) Regulation of stream flows (5) Other watershed benefits (A) Ecosystem services 1. Contingent valuation 1. Replacement cost method approach(1) Nitrogen fixing 2. Experiments 2. Indirect estimates(2) Waste assimilation derived from experiments(3) Carbon Store (4) Microclimatic functions (5) Other ecosystem services (C) Evolutionary process Contingent valuation Indirect estimates derived methods from experimental data(1) Global life support (2) Biodiversity Non-use values Contingent valuation methods
5.2.2.1: Valuing Direct Consumptive Benefits from H.P. Forests
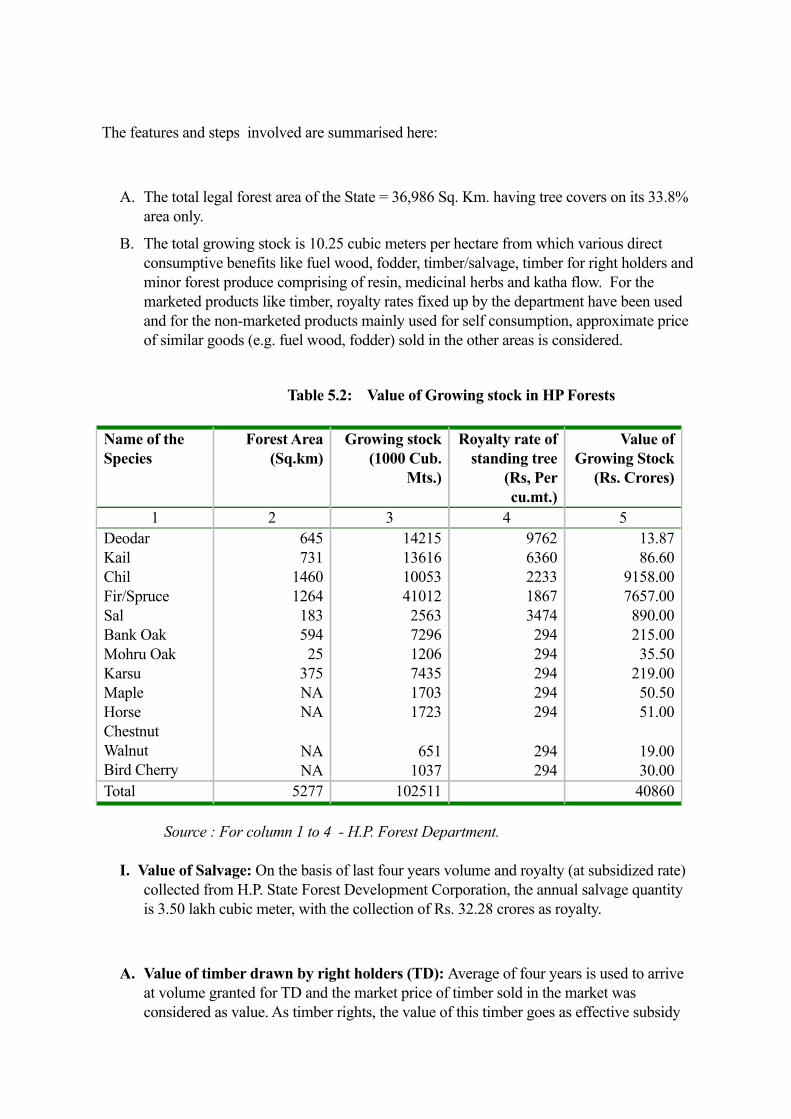
The features and steps involved are summarised here:
A. The total legal forest area of the State = 36,986 Sq. Km. having tree covers on its 33.8% area only.
B. The total growing stock is 10.25 cubic meters per hectare from which various direct consumptive benefits like fuel wood, fodder, timber/salvage, timber for right holders and minor forest produce comprising of resin, medicinal herbs and katha flow. For the marketed products like timber, royalty rates fixed up by the department have been used and for the non-marketed products mainly used for self consumption, approximate price of similar goods (e.g. fuel wood, fodder) sold in the other areas is considered.
Table 5.2: Value of Growing stock in HP Forests
Name of the Species
Forest Area (Sq.km)
Growing stock (1000 Cub.
Mts.)
Royalty rate of standing tree
(Rs, Per cu.mt.)
Value of Growing Stock
(Rs. Crores)
1 2 3 4 5DeodarKailChilFir/SpruceSalBank OakMohru OakKarsuMapleHorseChestnutWalnutBird Cherry
645731
1460126418359425
375NANA
NANA
14215136161005341012256372961206743517031723
6511037
97626360223318673474294294294294294
294294
13.8786.60
9158.007657.00890.00215.0035.50
219.0050.5051.00
19.0030.00
Total 5277 102511 40860
Source : For column 1 to 4 - H.P. Forest Department.
I. Value of Salvage: On the basis of last four years volume and royalty (at subsidized rate) collected from H.P. State Forest Development Corporation, the annual salvage quantity is 3.50 lakh cubic meter, with the collection of Rs. 32.28 crores as royalty.
A. Value of timber drawn by right holders (TD): Average of four years is used to arrive at volume granted for TD and the market price of timber sold in the market was considered as value. As timber rights, the value of this timber goes as effective subsidy
and as such no revenue accrues to the forest department on this account. But this source greatly supports the livelihood of rural communities. The volume extracted annually stands 1.06 lakh cubic metres, having market value of Rs. 60.25 crores, as against the FD’s collection of Rs. 0.29 lakh to 0.45 lakhs. The average rate of T.D. per cubic meter ranged between Rs. 0.37 – 0.34 per cubic meter, which was almost negligible against market rate.
B. Value of fuelwood requirement : Of the total State population of 51.70 lakh, 47 lakh persons(91%) live in rural areas. There are 8.61 lakh households in Rural Himachal Pradesh, which put forward an average demand of 4 tonnes of fuelwood per year per household leading to total requirement of 34.44 lakh tones of fuelwood annually. Of this 20% of wood fuel energy is provided by on farm crop residues, dung and agro-forestry fuelwood and imports from neighbouring states like Punjab, Haryana. If the remaining requirement of 80% (27.6 Lakh Tonnes) is valued at a conservative rate of Rs. 1000 per tonne, the annual fuelwood requirement from forest shall have a value of Rs 276 crores.
C. Value of Grasses & Grazing: Himachal Pradesh is a unique state in the sense that human and cattle population are almost in equal numbers. 14,346 Sq. Kms. of area covering dense forests (9,560 Sq. Km), open forests (2,961 Sq. Km.) and scrub forests (1,825 Sq. Km.) constitutes 38.78% of forest area & 25.76% of geographical area of the state has to provide grazing support to its 51.17 lakh livestock population. This population when converted into sheep units work out to 157.69 lakhs. Each sheep unit requires on an average 2 Kg of fodder everyday and thus put requirement at the tune of 730 Kg per annum per sheep unit of which 584 Kg (80%) is required from the forestry sector as rest is provided by other sources. Thus 92 lakh tonnes of fodder is required from forests, which is rated as Rs. 750 per tonne is worth Rs. 690 crores.
D. Value of Minor Forest Produce : Medicinal herbs are considered as major components of non-timber forest produced. Other NTFPs are Katha (Acacia katechu), Resin extracted from chil (Pinus roxbughis) and cedar oil extracted from the stumps of the Deodar tree (Cedrus deodar). The flora of H.P. consists of around 3300 species of plants. Of these, about 150 species (including few exotic). Are considered to have high medicinal value. About 35 plants products of medicinal value are regularly supplied by the state. About 1161.56 tonnes of NTFPs are extracted annually, which at prevailing royalty rates generate value of Rs. 24.98 crores.
Thus the direct consumptive benefits from the Himachal Pradesh Forest add up
to Rs. 1083 crores per annum as against the annual investment of Rs. 109 Crores in the
forest sector to this estimated value. If we add value of indirect consumptive benefits and
of environmental & ecological functions of forests, the monetary value generated per
hectare of forest area shall considerably increase.
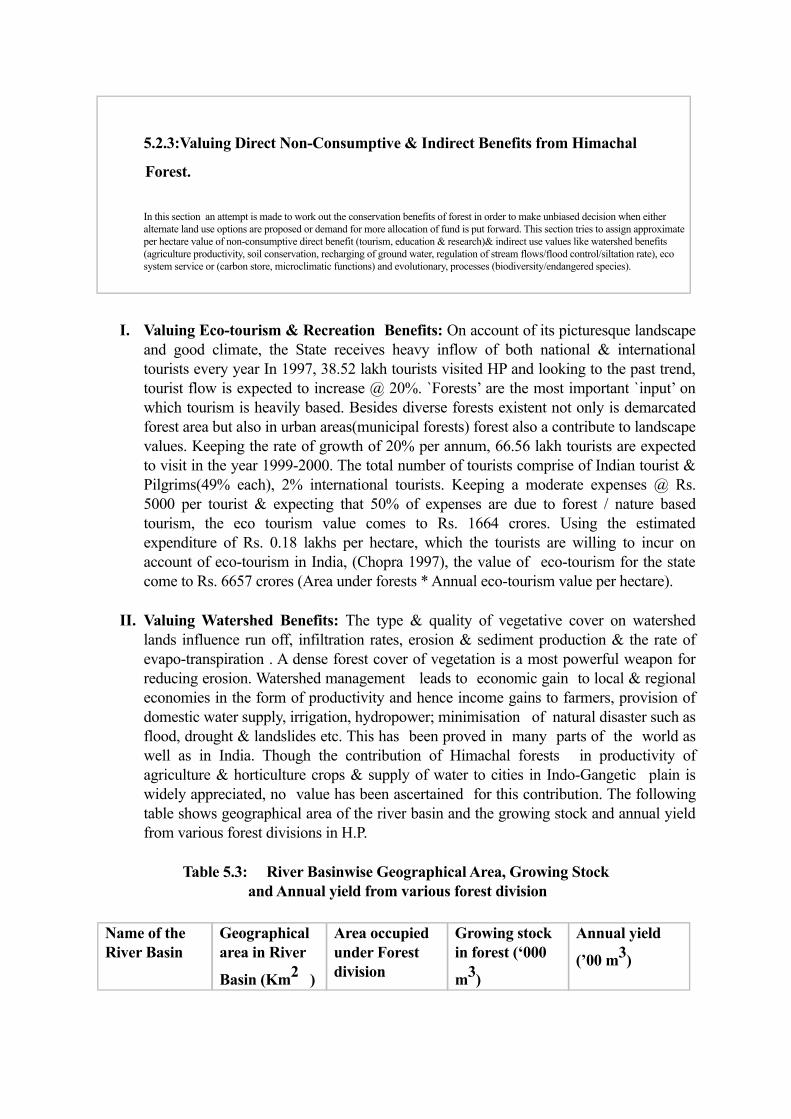
5.2.3:Valuing Direct Non-Consumptive & Indirect Benefits from Himachal
Forest.
In this section an attempt is made to work out the conservation benefits of forest in order to make unbiased decision when either alternate land use options are proposed or demand for more allocation of fund is put forward. This section tries to assign approximate per hectare value of non-consumptive direct benefit (tourism, education & research)& indirect use values like watershed benefits (agriculture productivity, soil conservation, recharging of ground water, regulation of stream flows/flood control/siltation rate), eco system service or (carbon store, microclimatic functions) and evolutionary, processes (biodiversity/endangered species).
I. Valuing Eco-tourism & Recreation Benefits: On account of its picturesque landscape and good climate, the State receives heavy inflow of both national & international tourists every year In 1997, 38.52 lakh tourists visited HP and looking to the past trend, tourist flow is expected to increase @ 20%. `Forests’ are the most important `input’ on which tourism is heavily based. Besides diverse forests existent not only is demarcated forest area but also in urban areas(municipal forests) forest also a contribute to landscape values. Keeping the rate of growth of 20% per annum, 66.56 lakh tourists are expected to visit in the year 1999-2000. The total number of tourists comprise of Indian tourist & Pilgrims(49% each), 2% international tourists. Keeping a moderate expenses @ Rs. 5000 per tourist & expecting that 50% of expenses are due to forest / nature based tourism, the eco tourism value comes to Rs. 1664 crores. Using the estimated expenditure of Rs. 0.18 lakhs per hectare, which the tourists are willing to incur on account of eco-tourism in India, (Chopra 1997), the value of eco-tourism for the state come to Rs. 6657 crores (Area under forests * Annual eco-tourism value per hectare).
II. Valuing Watershed Benefits: The type & quality of vegetative cover on watershed lands influence run off, infiltration rates, erosion & sediment production & the rate of evapo-transpiration . A dense forest cover of vegetation is a most powerful weapon for reducing erosion. Watershed management leads to economic gain to local & regional economies in the form of productivity and hence income gains to farmers, provision of domestic water supply, irrigation, hydropower; minimisation of natural disaster such as flood, drought & landslides etc. This has been proved in many parts of the world as well as in India. Though the contribution of Himachal forests in productivity of agriculture & horticulture crops & supply of water to cities in Indo-Gangetic plain is widely appreciated, no value has been ascertained for this contribution. The following table shows geographical area of the river basin and the growing stock and annual yield from various forest divisions in H.P.
Table 5.3: River Basinwise Geographical Area, Growing Stock and Annual yield from various forest division
Name of the River Basin
Geographical area in River
Basin (Km2 )
Area occupied under Forest division
Growing stock in forest (‘000
m3)
Annual yield
(’00 m3)
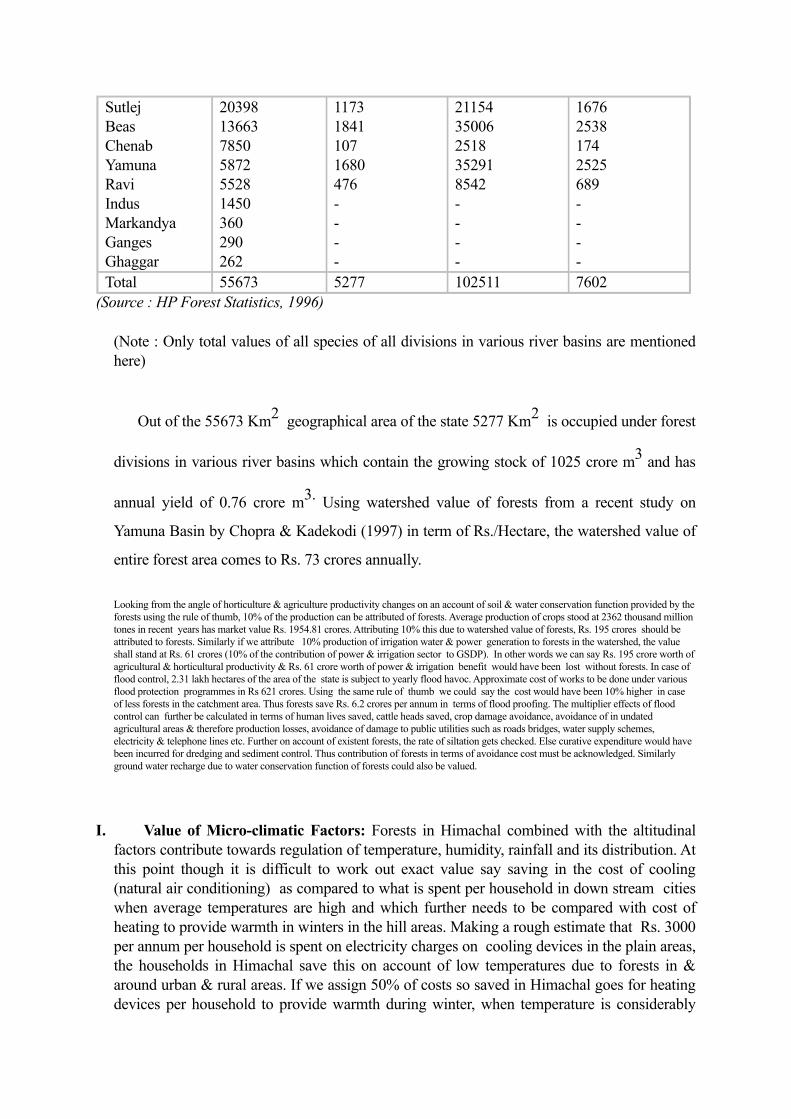
SutlejBeasChenabYamunaRaviIndusMarkandyaGangesGhaggar
20398136637850587255281450360290262
117318411071680476----
21154350062518352918542----
167625381742525689----
Total 55673 5277 102511 7602(Source : HP Forest Statistics, 1996)
(Note : Only total values of all species of all divisions in various river basins are mentioned here)
Out of the 55673 Km2 geographical area of the state 5277 Km2 is occupied under forest
divisions in various river basins which contain the growing stock of 1025 crore m3 and has
annual yield of 0.76 crore m3. Using watershed value of forests from a recent study on
Yamuna Basin by Chopra & Kadekodi (1997) in term of Rs./Hectare, the watershed value of
entire forest area comes to Rs. 73 crores annually.
Looking from the angle of horticulture & agriculture productivity changes on an account of soil & water conservation function provided by the forests using the rule of thumb, 10% of the production can be attributed of forests. Average production of crops stood at 2362 thousand million tones in recent years has market value Rs. 1954.81 crores. Attributing 10% this due to watershed value of forests, Rs. 195 crores should be attributed to forests. Similarly if we attribute 10% production of irrigation water & power generation to forests in the watershed, the value shall stand at Rs. 61 crores (10% of the contribution of power & irrigation sector to GSDP). In other words we can say Rs. 195 crore worth of agricultural & horticultural productivity & Rs. 61 crore worth of power & irrigation benefit would have been lost without forests. In case of flood control, 2.31 lakh hectares of the area of the state is subject to yearly flood havoc. Approximate cost of works to be done under various flood protection programmes in Rs 621 crores. Using the same rule of thumb we could say the cost would have been 10% higher in case of less forests in the catchment area. Thus forests save Rs. 6.2 crores per annum in terms of flood proofing. The multiplier effects of flood control can further be calculated in terms of human lives saved, cattle heads saved, crop damage avoidance, avoidance of in undated agricultural areas & therefore production losses, avoidance of damage to public utilities such as roads bridges, water supply schemes, electricity & telephone lines etc. Further on account of existent forests, the rate of siltation gets checked. Else curative expenditure would have been incurred for dredging and sediment control. Thus contribution of forests in terms of avoidance cost must be acknowledged. Similarly ground water recharge due to water conservation function of forests could also be valued.
I. Value of Micro-climatic Factors: Forests in Himachal combined with the altitudinal factors contribute towards regulation of temperature, humidity, rainfall and its distribution. At this point though it is difficult to work out exact value say saving in the cost of cooling (natural air conditioning) as compared to what is spent per household in down stream cities when average temperatures are high and which further needs to be compared with cost of heating to provide warmth in winters in the hill areas. Making a rough estimate that Rs. 3000 per annum per household is spent on electricity charges on cooling devices in the plain areas, the households in Himachal save this on account of low temperatures due to forests in & around urban & rural areas. If we assign 50% of costs so saved in Himachal goes for heating devices per household to provide warmth during winter, when temperature is considerably

low, (which is not so in case of plains) taking total number of households in Himachal Pradesh (9,69,018), the value accrue to the forest shall be 145.35 crores or we can say household in Himachal worth Rs. 145 crores.
II. Value of Carbon Sink: The Growing stock of 10.25 crore m3 (excluding in the protection circles) provides an excellent sink for CO2 emission & thereby thus influence global climate. Thus it becomes essential to quantify and assess carbon stock & flows in forestry activities though the carbon sink function shall considerably vary with changing density of the growing stock but (Kadekodi & Ravindranath, 1998), taking the area only under dense, open & scrub forests i.e. 14,346 sq. km. ( 14,34,600 hectares) which contain the growing stock & using all India value of Rs. 1.23 lakhs per hectare for carbon store function of forests, the Himachal forest tree cover & scrub forest provide Rs. 17,645 crore worth of carbon sink function. In this case if the forest in agricultural farm land, cantonment and urban areas are also considered, the value of carbon sink shall be even more.
III. Value of Biodiversity: The forest of H.P. are rich in vascular flora which form the conspicuous forest cover 3,295 species constituting 7.32 % of species of the species found in the country are existent in the state. A rare plants Ginkgo biloba, which is a living fossil fuel, is found in the state. It is a conifer having on appearance of broad-leaved tree is native of China. Only two such plants are found in Manali & Kalpa region of the state. The State has six different broad types of forest. As mentioned earlier types of medicinal plants are found in the state. The state has 2 national park & 32 sancturies. The National Park are the representative of the state in terms of species richness both floral & faunal, 20 bird species, 23 animal species, 3 reptile & four vermins are found in the state. Biodiversity values are option value & provide an insight into potential future values of genetic information & organic compounds derived from wild plant & animal species found in tropical forests besides their, `row material’ value for the development of new crops cultivators, pharmaceutical products and pesticides, among other use (Bishop, 1999). The value of bio diversity varies considerably according to its richness. In India it is estimated to be Rs. 0.21 lakh /hectare (Lal, 1992). Extrapolating it to the entire forest area of Himachal Pradesh, (36, 986 sq. km.) it come out be Rs. 7137 crores.
IV. Employment generation through forestry works: Many state and central sector schemes going on in the state’s forestry sector provide employment through construction of roads, paths, buildings, soil conservation works etc. Such schemes on an average generate 48.80 lakh man-days of work which if rate at daily wage rate of Rs. 51/- generates value of Rs. 248 Crores.
5.2.4: Total Economic Value of Forest stock of Himachal Pradesh This section attempts to provide total economic value to the forest stock of Himachal Pradesh in terms of current use values only. Option and existence values are not considered here separately mainly because of two reasons. Firstly to some extent they get covered in the biodiversity and eco-tourism benefits and secondly their close estimation is possible through primary survey using the contingent valuation method, which was beyond the scope of this study. The values in terms of direct consumptive and non-consumptive and indirect one are totalled here to arrive at the total economic value of forest stock of Himachal Pradesh. This study does not attempt to provide accurate monetary values of various benefits as, it is difficult to quantify such benefits specially the intangible in monetary terms without primary survey and more over the rate so used for converting physical contribution into monetary terms, the average values of studies conducted in India have been used. Therefore no precision is being claimed. Rather the effort is to reflect an

approximate total contribution of forestry sector into economic development of the state such that the environmental function of the forests can find appropriate place in the economic planning. Such an integrated and holistic approach for forestry sector shall in turn strengthen socio-economic development process of the state.
The values so generated above are summarized in the following table. For calculating the Rs./Hectare contribution of various benefits, the total geographical area under forests and area under actual tree cover are separately used as denominators to reflect two different values.
Table 5.4: Economic Value of Forests of Himachal Pradesh (On Annual Basis)
Total geographical forest area of H.P. : 36,986 Km2
Area under tree cover & Scrub Forest : 14,346 Km2
Goods/services from Forests
Physical value Monetary value (Rs. Crores)
Rs. Per ha. Value of goods/
services in terms of total geo.
Area of forests
Rs. Per ha. Value of goods/
services in terms of area under tree cover and scrub forest
(1) (2) (3) (4) (5)Total growing stock
10.25 crores
m340860 1.10 lakhs 2.85 lakhs
Economic Value of Direct and Indirect Benefits I. Direct Benefits
A. Direct Consumptive benefits1.Salvage 3.50 lakhs m3 32.00 0.08 thousand 0.22 thousand
2.Timber for right holders
1.06 lakhs m3 60.00 0.16 thousand 0.42 thousand
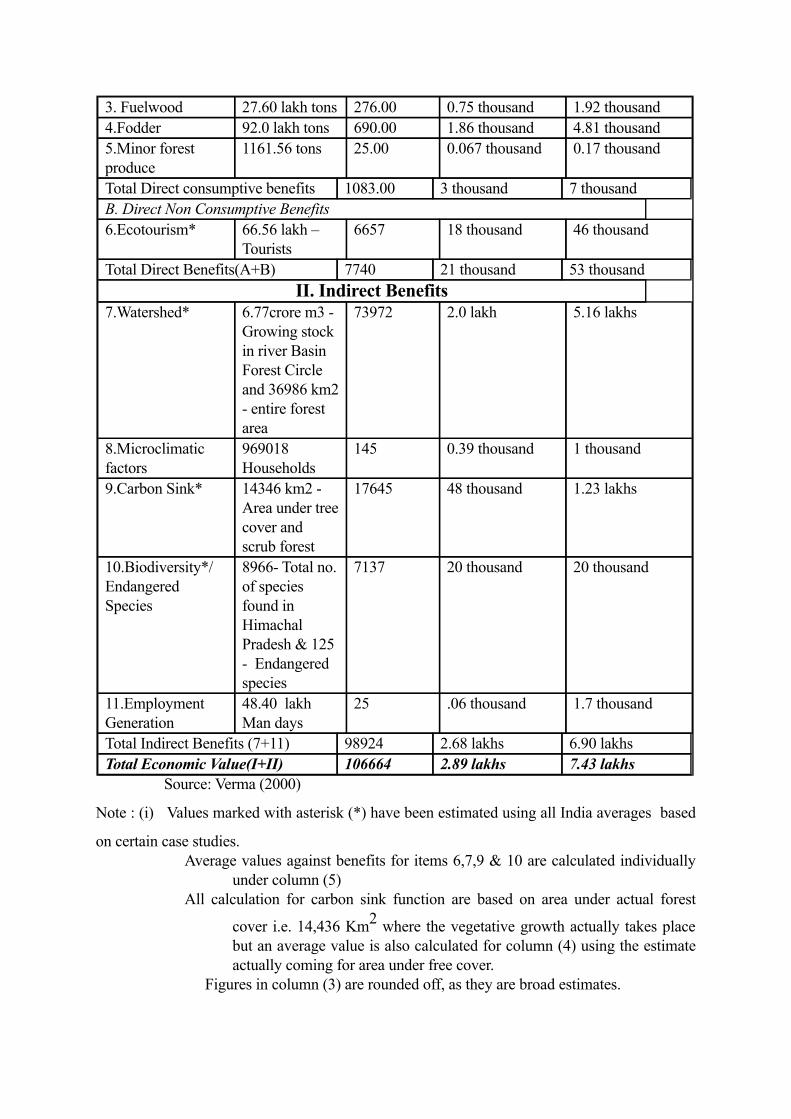
3. Fuelwood 27.60 lakh tons 276.00 0.75 thousand 1.92 thousand4.Fodder 92.0 lakh tons 690.00 1.86 thousand 4.81 thousand5.Minor forest produce
1161.56 tons 25.00 0.067 thousand 0.17 thousand
Total Direct consumptive benefits 1083.00 3 thousand 7 thousandB. Direct Non Consumptive Benefits6.Ecotourism* 66.56 lakh –
Tourists6657 18 thousand 46 thousand
Total Direct Benefits(A+B) 7740 21 thousand 53 thousandII. Indirect Benefits
7.Watershed* 6.77crore m3 - Growing stock in river Basin Forest Circle and 36986 km2 - entire forest area
73972 2.0 lakh 5.16 lakhs
8.Microclimatic factors
969018 Households
145 0.39 thousand 1 thousand
9.Carbon Sink* 14346 km2 - Area under tree cover and scrub forest
17645 48 thousand 1.23 lakhs
10.Biodiversity*/ Endangered Species
8966- Total no. of species found in Himachal Pradesh & 125 - Endangered species
7137 20 thousand 20 thousand
11.Employment Generation
48.40 lakh Man days
25 .06 thousand 1.7 thousand
Total Indirect Benefits (7+11) 98924 2.68 lakhs 6.90 lakhsTotal Economic Value(I+II) 106664 2.89 lakhs 7.43 lakhs
Source: Verma (2000)
Note : (i) Values marked with asterisk (*) have been estimated using all India averages based
on certain case studies.Average values against benefits for items 6,7,9 & 10 are calculated individually
under column (5)All calculation for carbon sink function are based on area under actual forest
cover i.e. 14,436 Km2 where the vegetative growth actually takes place but an average value is also calculated for column (4) using the estimate actually coming for area under free cover.
Figures in column (3) are rounded off, as they are broad estimates.

It is evident from the above table that actual forest cover in Himachal is 14,346
sq.km. generate annual economic value to the tune of Rs. 7.43 lakh/hectare and if the
entire area under legal forests is used as denominator, the value reduces to Rs. 2.89
lakh/hectare. The maximum per hectare value is generated by watershed function
followed by carbon sink, biodiversity, ecotourism (all non-marketed values). Using
these annual benefit values, it is then possible to arrive at the stock value of forests. For
instance, with a ten year forestry planning, assuming the discount rate to be 12 percent,
the total value of forest land in Himachal Pradesh can be said to be Rs. 16.33 lakhs per
hectare ( Rs. Lakhs: 2.89* 5.65, the discount factor).
5.2.5: From Valuation to Natural Resource Accounting
The methodology of Natural Resource Accounting (dealt in Chapter four) is used here
to derive the implication of using forest resources in Himachal Pradesh.
Table 5.5: Natural Resource Accounting for Himachal Pradesh Forest Resource contribution vs. Investment
Value of Growing StockTotal Economic Value of ForestsTotal Expenditure incurred in forest (Annual
Budget)Revenue realised by forests
Rs. 40860 CroreRs. 106664 CroreRs. 109 Crore
Rs. 41 Crore
II. Contribution of Forests to the GSDPTotal GSDPForestry as loggingForestry as % of GSDPTEV of forests of HP (as per current
estimation)Corrected GSDPForestry as % of corrected GSDP
Rs.9258 CroresRs. 487 CroresRs. 5.26 %Rs. 106664 Crores
Rs.115434 Crores92.40%
Note: GSDP= Gross state domestic product
The table shows that total economic value is 2.61 times the value of the growing stock, 980
times the total expenditure incurred in the forestry sector of Himachal Pradesh and 2607
times the revenue realized by the forests annually. This comparison proves gross
underestimation of forestry sector’s contribution in the economy of the state. When the

GSDP of the state is corrected for Total Economic Value calculated through the current
study the contribution of forestry sector increases from 5.26% of GSDP to 92.40 % of
GSDP.
As mentioned earlier the benefits in the form of various values generated by the Himachal
Pradesh forests are not only realised by the local communities but also by people in the state
as a whole neighbouring states (watershed benefits, biodiversity, ecotourism & carbon sink)
& by international communities (biodiversity, ecotourism & carbon sink). It could be seen
from the table in most of the cases, the private costs associated mainly with the forest
department, the social costs (to be borne by rest of the stakeholders) are low & social
benefits in the form of positive externality are very high. There is no compensation paid to
the forest department on account of its multi-stakeholders and multi-sectoral contribution.
This document of 35 pages will replace the original Section 5.3 in the TWG report. It needs to be edited further, for reduction etc. GKK will do that.
5.3:Marine Biodiversity: Economics and Valuation
5.3.1: Introduction
The India's marine environment consists of unique ecosystems known for their aesthetic
beauty and ability to produce numerous commercially important biological species. Spread
along the coastline of 7500 kilometers of the main land and island territories, the marine
ecosystems also are the cultural and economic backbone of many communities that live in the
region. However, the rapid expansion of industrial, urban and other land-based activities on the
coast has threatened the health of some marine ecosystems and led to dramatic decline in
marine biodiversity.
The significance of biodiversity in general and marine biodiversity in particular is
under-appreciated because of the limited understanding of their role. Most studies on
biodiversity often focus on the number of species in an ecosystem (Tilman, 1997). The value
of biodiversity arises not merely from its species richness but also from a large number of its
ecosystem functions. These functions, among others, include its potential for restoring marine
productivity, stability and sustainability. A conservation plan the sole objective of which is to
protect species richness will unlikely stand the test of economic net benefits, when compared to
alternative plans of development and ecosystem conversion. It is ironical but real that
economic considerations often dominate policy discussion. Therefore, it is important to
account for the economic values of the entire range of known marine biodiversity services in
order to articulate more credible justification for conservation plans. The two-fold objectives
of this chapter therefore are to identify the full range of services that marine biodiversity
provides to human society, and to suggest ways to value these services.
While a number of studies have been conducted on the economic valuation of different
attributes of marine ecosystems (Hoagland et al., 1995), no study would examine the economic
value attributable to biodiversity, per se. We make a distinction here between the value of
marine biological resources and the value of biological diversity. The former is a direct
function of the physical quantity or volume of biological stocks. Therefore, conservation plans
designed to enhance only the stock value of biological resource may offer protection to a
limited number of commercially viable species. There have been attempts to estimate the
commercial value of fish stocks based on certain market value of marine products (Polunin and
Roberts, 1993). On the other hand, the latter value arises from species diversity or richness,
which makes a marine ecosystem more stable, productive, ecologically functional, socially
valuable, and aesthetically pleasing. We focus our discussion on the value of biodiversity not
of the biological resources.
5.3.2:Marine Ecosystems and BiodiversityBiodiversity is a key ecological attribute of an ecosystem, and the same varies widely
across ecosystems. It is necessary to identify three types of marine ecosystems that have
special relevance to biodiversity: estuarine, inter-tidal and coral reef. Estuarine system is a
fresh water ecosystem comprising estuary, mangroves and other wetlands rich in microscopic
plant life and abundant in vegetation. They are the rich breeding grounds for larvae of some
commercial species, a broad range of algae, fungi and lichens among others. More than 75
percent of the commercial fish catch in India is dependent on estuaries for part of their life

cycle. India ranks 14th in the list of the world’s major mangrove area and fifth in the Indo-
Pacific regions. India's major mangrove areas include the northern Bay of Bengal and the
Sunder Bans (approximately 690 sq km together), which is the world’s single largest
contiguous block of mangrove forests. India is reported to be having 6700 sq km area under
mangroves, which is 7% of world’s mangrove area. India has about 3.9 crores hectare (3.9
lakhs sq km) of estuarine wet lands (B Sahai, 1993). See Table 5.6 for areas under different
coastal ecosystems in India.
Table 5.6. The areas under various ecosystems along the Indian coastline
Categories (Sq. km.)
Mudflats 22961
Beaches/Spits 1465
Shoals/bars 93
Coral reefs 1270
Mangroves 4121
Marsh vegetation 370
Mudflats with vegetation 6125
Beach vegetation 290
Lagoons/backwaters 2132
Flood-prone areas 3437
Coastal dunes 2509
Reclaimed area 1212
Paleo - beach ridges 434
Paleo-mudflats 6821
Strand plains 1379
Salt-affected area 697
Salt pans 1617
56933

Source: B. Sahai, 1993
The second type of coastal ecosystem is Inter-tidal ecosystems which consist of areas that are inundated by seawater during high tides comprise the inter-tidal ecosystem and the saline zone is home to crustaceans (crabs), molluscs. The third type is coral reef ecosystems in India cover less than 0.2 per cent of the world’s ocean area (Table 5.7). India is reported to have coral reef area of 1270 sq kms mainly in the Gulf of Kuchchh, the Gulf of Mannar and Lakshdeep. Coral reef plays an important role in fisheries and can be 10-100 times as productive per unit area as the open seas. But they harbor a quarter of all marine species and one fifth of the known fish species thriving here. Some species have medicinal value. The utilities from these resources are varied such as medicines, nutrition, cosmetics and other industrial products apart from providing sea transport and tourism.
Table 5.7. Area of the coral reefs along the Indian coast (in sq. km)
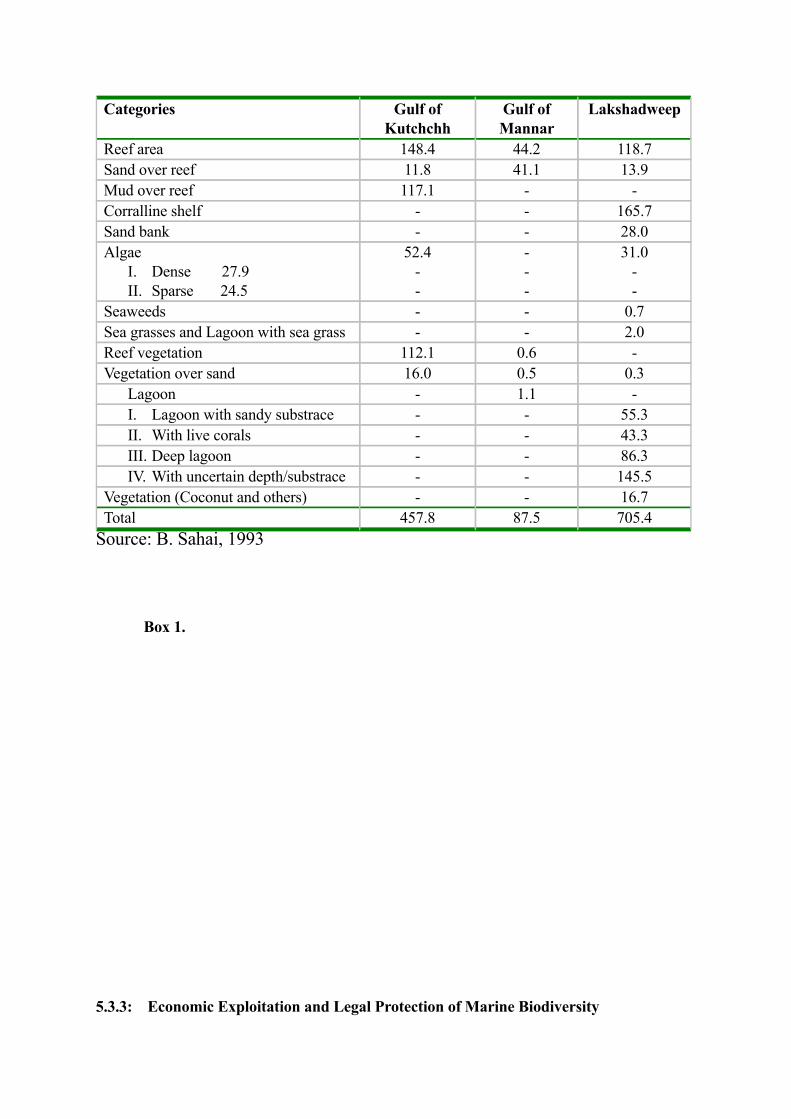
Categories Gulf of Kutchchh
Gulf of Mannar
Lakshadweep
Reef area 148.4 44.2 118.7Sand over reef 11.8 41.1 13.9Mud over reef 117.1 - -Corralline shelf - - 165.7Sand bank - - 28.0Algae
I. Dense 27.9II. Sparse 24.5
52.4--
---
31.0--
Seaweeds - - 0.7Sea grasses and Lagoon with sea grass - - 2.0Reef vegetation 112.1 0.6 -Vegetation over sand 16.0 0.5 0.3
Lagoon - 1.1 -I. Lagoon with sandy substrace - - 55.3II. With live corals - - 43.3III. Deep lagoon - - 86.3IV. With uncertain depth/substrace - - 145.5
Vegetation (Coconut and others) - - 16.7Total 457.8 87.5 705.4
Source: B. Sahai, 1993
Box 1.
5.3.3: Economic Exploitation and Legal Protection of Marine Biodiversity
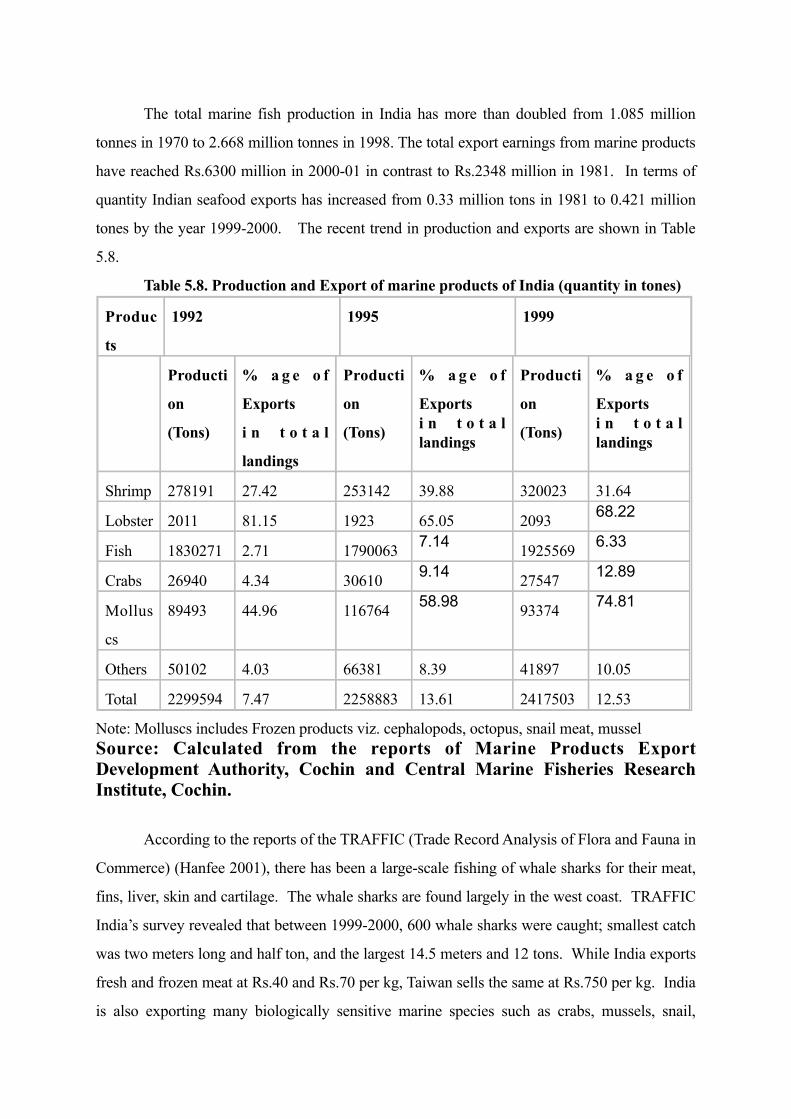
The total marine fish production in India has more than doubled from 1.085 million
tonnes in 1970 to 2.668 million tonnes in 1998. The total export earnings from marine products
have reached Rs.6300 million in 2000-01 in contrast to Rs.2348 million in 1981. In terms of
quantity Indian seafood exports has increased from 0.33 million tons in 1981 to 0.421 million
tones by the year 1999-2000. The recent trend in production and exports are shown in Table
5.8.
Table 5.8. Production and Export of marine products of India (quantity in tones)
Produc
ts
1992 1995 1999
Producti
on
(Tons)
% a g e o f
Exports
i n t o t a l
landings
Producti
on
(Tons)
% a g e o f
Exportsi n t o t a l landings
Producti
on
(Tons)
% a g e o f
Exportsi n t o t a l landings
Shrimp 278191 27.42 253142 39.88 320023 31.64
Lobster 2011 81.15 1923 65.05 2093 68.22
Fish 1830271 2.71 1790063 7.14 1925569 6.33
Crabs 26940 4.34 30610 9.14 27547 12.89
Mollus
cs
89493 44.96 116764 58.98 93374 74.81
Others 50102 4.03 66381 8.39 41897 10.05
Total 2299594 7.47 2258883 13.61 2417503 12.53
Note: Molluscs includes Frozen products viz. cephalopods, octopus, snail meat, musselSource: Calculated from the reports of Marine Products Export Development Authority, Cochin and Central Marine Fisheries Research Institute, Cochin.
According to the reports of the TRAFFIC (Trade Record Analysis of Flora and Fauna in
Commerce) (Hanfee 2001), there has been a large-scale fishing of whale sharks for their meat,
fins, liver, skin and cartilage. The whale sharks are found largely in the west coast. TRAFFIC
India’s survey revealed that between 1999-2000, 600 whale sharks were caught; smallest catch
was two meters long and half ton, and the largest 14.5 meters and 12 tons. While India exports
fresh and frozen meat at Rs.40 and Rs.70 per kg, Taiwan sells the same at Rs.750 per kg. India
is also exporting many biologically sensitive marine species such as crabs, mussels, snail,

seaweed (agar/agar) etc in different product forms. The export of total crabmeat increased from
1844 metric tons (i.e., worth Rs.2283 lakhs) in 1994-95 to 2586 metric tons (i.e., worth Rs.
3350 lakhs) in 1999-2000. The export of shrimp in different product form has increased from
74563 metric tons in 1992-93 to 110564 metric tons in 1999-2000. The export of fresh water
prawn (scampi) has doubled from 102 metric tons in 1995-96 to 217 metric tons in 1999-2000.
With the result many freshwater fish biodiversity has been completely ignored since
commercial aquaculture favors a few high-yielding species. Culturing commercial species
might gradually eliminate all native species.
Similarly, the export of cultured tiger shrimp P. Monodon from coastal wetlands has
increased significantly. Many local fishes such as mullets and pearl spot have to be eliminated
before stocking the shrimp in coastal shrimp farms. These fishes were the staple food of the
local communities. The quantity of cultured shrimp production has increased from 35,500 tons
(i.e., worth Rs.3764 million) in 1990-91 to 82,000 tons (i.e., worth Rs.24918 million) in
1998-99. The contribution of cultured shrimp to total shrimp exports has increased from 36
percent to 56 percent in terms of quantity and in terms of from 52 percent in 1990-91 to 75
percent in 1998-99, respectively. This remarkable growth in cultured shrimp export indicates
point to the potential loss of biodiversity and declining availability of native fishes for local
communities.
International trade in many marine species is prohibited under various Acts and
notifications. The exports of some of the species such as marine turtles, shells, gastropods
(except the giant clams) are banned under the Wildlife Protection Act 1972 (WPA) and the
Convention on International Trade in Endangered Species (CITES). The sea cucumber
(Beche-de-mer) is another commercially important marine species that has very high export
value. In 1982 Government of India put a ban on the export of Beche-de-mer below the size of
7.5 cm. In Andaman and Nichobar Islands fishing for sea cucumber is totally banned. Corals
and associated species like sea-fans and sea-sponges are heavily exploited for their known
sources of bio-active substances with wide application in the pharmaceutical industry.
Especially sea-fans (Gorgonids), which constitute only source of prostoglandins and terpenoids
(Hanfee, 2001). Black corals were listed in CITES Appendix II in 1981 to protect the highly
exploited stony corals. However, control of coral trade is difficult since they are often collected
in offshore areas not directly controlled by the coastal nations. Further, it is difficult to identify
the species origin of final coral products. According to TRAFFIC reports, the species that are
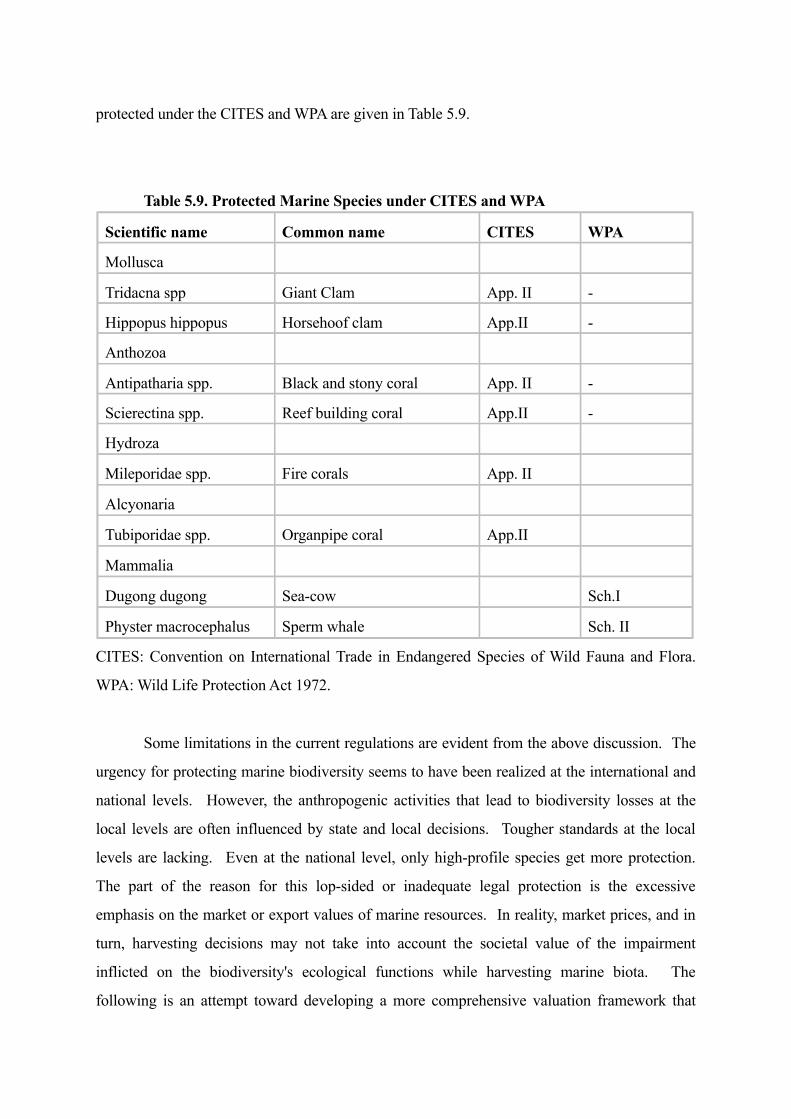
protected under the CITES and WPA are given in Table 5.9.
Table 5.9. Protected Marine Species under CITES and WPA
Scientific name Common name CITES WPA
Mollusca
Tridacna spp Giant Clam App. II -
Hippopus hippopus Horsehoof clam App.II -
Anthozoa
Antipatharia spp. Black and stony coral App. II -
Scierectina spp. Reef building coral App.II -
Hydroza
Mileporidae spp. Fire corals App. II
Alcyonaria
Tubiporidae spp. Organpipe coral App.II
Mammalia
Dugong dugong Sea-cow Sch.I
Physter macrocephalus Sperm whale Sch. II
CITES: Convention on International Trade in Endangered Species of Wild Fauna and Flora.
WPA: Wild Life Protection Act 1972.
Some limitations in the current regulations are evident from the above discussion. The
urgency for protecting marine biodiversity seems to have been realized at the international and
national levels. However, the anthropogenic activities that lead to biodiversity losses at the
local levels are often influenced by state and local decisions. Tougher standards at the local
levels are lacking. Even at the national level, only high-profile species get more protection.
The part of the reason for this lop-sided or inadequate legal protection is the excessive
emphasis on the market or export values of marine resources. In reality, market prices, and in
turn, harvesting decisions may not take into account the societal value of the impairment
inflicted on the biodiversity's ecological functions while harvesting marine biota. The
following is an attempt toward developing a more comprehensive valuation framework that
captures both market and non-market values of marine biodiversity.
5.3.5: Uniqueness of Marine Biodiversity Valuation
In developing a framework for valuation, it is essential to first reflect on some of the
unique attributes of marine biodiversity. These attributes not only influence the scope and
method of valuation, but also the way the biodiversity is used and managed. These attributes
distinguish marine biodiversity from its land-based counterpart. Hoagland et al., 1995 identify
the following important attributes:I. Resource fugitivity: The mobile nature of most marine animals makes it difficult to
define the geographic scope of biodiversity measurement. The specific scale of marine biodiversity, unlike forests or cropland, is less definite.
II. Nature of uses: Use of marine biodiversity is subtler than its land-based counterparts, (e.g., forests, grass, wetlands.) Uses are not direct like agricultural or pharmaceutical uses of plant diversity. Most uses are indirect, non-consumptive, and non-use nature. Also, because of its under-water nature, people do not come in direct contact with marine biodiversity in their day to day life. The lack of familiarity and understanding might greatly influence the economic value that people attach to biodiversity.
III. Open access: Both access to and the uses of marine ecosystems are difficult to control because of the problems in marking boundaries. This presents a problem for enforcement and management.
IV. Public good nature: Certain components of the benefits of marine biodiversity are of public-good nature in the sense that all potential users enjoy these benefits the same at same level without any conflict among them. Some of the benefits are global in nature. Presence of a large external benefit gives little incentive to individual users for protecting the resource. The global nature of its benefits makes valuation less reliable and more cost-prohibitive.
For the NBSAP policy formulation in India, it is important to take a look at marine
biodiversity, for several reasons separately. Some are due to similarities with other resources
and some are due to exclusive characteristics of them.
The Similarities between marine and other resources are:Presence of non-market goods and opportunity costs: A large number of diverse marine
resources are still out of the market framework, specifically the coral reefs.Potential for benefit transfer application: Because of its international in character, the resources
can be viewed from the international perspectives using the benefit transfer methods for valuation.
Resource pricing: Due to its nature as a renewable resource, it calls for a proper understanding of resource pricing under optimal renewability or recyclability.
Issues of geographic scale: Certainly, the resources are of massive scale in their management.
5.3.6: Valuation of marine resourcesOn the questions concerning valuation of marine biodiversity, the major issues are:
Why marine biodiversity valuation is different from valuation of other environmental resources?
What are the contexts or scope of valuation?What are we measuring? i.e. different components or contributions of biodiversity.Different valuation approaches?How can we make use of these valuation results?
Barbier (1993) Suggests 3 Scopes for analyzing value of resources in general.I. Impact analysis: an assessment of the damages inflicted on the resource system from a
specific event (e.g. oil spills)
II. Partial valuation: assessment of alternative resource allocation or policy options
involving marine biodiversity protection
III. Total Valuation: an assessment of the total economic value of the wetland system (e.g.
the total economic value of Karnataka Marine Biodiversity)
The last framework is the most comprehensive one, which is used in this report.
Sources of Benefits from Marine Biodiversity
5.3.7: What are we measuring?Before we approach the “economic valuation,” it is important that we clearly identify
the nature and type of eco-system functions that marine biodiversity makes to humanity and the
ecosystem. They are summarily stated below:
Biodiversity and productivity
There are differences among species in methods of resource capture. Species of more
diversity are capable of fully utilizing their limiting resources. For example, seasonal and time
diversity in species. Some species do well in summer; some in winter, etc. Some are shallow
water living; some are deep water.
With more diversity, it is more likely that one or more species come to dominate the
ecosystem. That leads to an overall increase in the productivity. This is called “sampling
competition” effect.
There is also complementarity in resource use. Different species are able to occupy
different regions of the ecosystem. Regions mean area with different bio-geo-chemical

properties within a given ecosystem (e.g., BOD, pH, zooplankton, temperature, nutrients).
Diverse system will fully utilize the ecosystem.


le 5.9. Yield and Effort at MSY and MEY Level, Cost at MSY, MEY of selected demersal species in Karnataka
Species 1998 Maximum Economic Level
Maximum sustainable level
Yield (tonnes)
Effort (A.F.H.)
Cost(‘000 Rs.)
Yield (tonnes)
Effort (A.F.H
.)
Cost(‘000 Rs.)
Yield (tonnes)
Effort (A.F.H
.)
Cost(‘000 Rs.)
Catfish 123 2510.96
1,274.39
340.94
1329.97
3,532.49
338.02
1512.25
3,502.20
Halibut 2510.96
1346.36
723.28 53.43 2018.90
715.70 53.05 2272.01
710.52
Lizard fishes
9664.01
108218
53,132.21
3834.48
150788.98
52,468.31
3805.74
170048.61
52,075.09
Pomfret 21483.12
3634.35
9,697.49
2640.65
8425.90
23,049.21
2617.72
9588.12
22,849.11
Rays 3634.35
2260.3
4,297.80
544.99
2495.40
6,730.65
540.29
2838.64
6,672.53
Rock 2260.3
52462.13
24,825.36
2114.78
21286.16
29,880.53
2097.05
24169.16
29,630.00
Shark 3914.41
2516.31
7,072.70
758.65
2102.53
9,809.35
752.12
2391.32
9,724.87
Shrimp 2516.31
19719.7
60,747.54
8400.42
19183.22
96,813.71
8327.48
21829.52
95,973.03

Soles 19719.7
22479.4
54,379.59
9428.73
29104.95
93,958.32
9348.36
33081.16
93,157.41
Thread fin breams
15732.56
381152.3
181,512.05
13152.67
141468.14
180,410.27
13042.67
160603.91
178,901.35
Bhat M and Bhatta R. 2001
2. Biodiversity and stability.
Less diverse system means less resistance to disturbance and less resilience after a disturbance.
The extinction probabilities of individual species would very high with low diversity.
Less diverse system may also be readily invaded by less productive exotic species.
3. Biodiversity and global material cycling
Marine biota serves as a vehicle for the transfer of atmospheric CO2 to the sea floor:
Atmospheric CO2 Gets dissolved bicarbonate in rainwater Further absorbed by marine biota
Converted into particulate biocarbonate Stored in skeleton and tissue Become part of
sedimentary rock
I. Nutrient and organic matter transformation
Phytoplankton absorbs inorganic nutrients and organic matter released to oceans through sewer
discharge, industrial pollution and rain water.
II. Detoxification
Microbial community on the ocean floor detoxify petroleum hydrocarbons and break them into
CO2 and water. Microbes need oxygen for this aerobic process since oxygen is the source of
electron.
Beach and sea as a centre for tourism and recreation is a recent phenomenon in our
country. It began with the Hippies during 60s with hand picked centres like Goa, Gokarna
(Karnataka) and Kovalam in Kerala (Routledge, 2000: 26480). In Karnataka, the Government
has identified Mangalore, Someshwar, Ullal, Panambur, Suratkal, Malpe, Bhatkal, Karwar,
Murdeshwara, Kundapur, Honnavar, Gokarna, Kumta and Mulki as coastal tourism centres.
The adverse effects of mass tourism on coastal ecology have many facets: construction of
resorts, highways, destruction of coastal habitats like sand dunes, coastal vegetation,
mangroves for landscaping and recreation, contamination of water bodies from fertilizers and
pesticides, disturbing coastal and marine life by mass human pressure could affect the
livelihood of traditional communities (Routledge, 2000: 26479).
III. Source of tourism, recreation and retirment
IV. Cultural values and future scientific values
A. Basis of many cultures.
B. Cultural information regarding the habits of marine animals and ecosystem forms a
center piece of traditional societies.
C. Enrich body of scientific knowledge.
V. Non-use values: Existence values
Following the environmental use value classification given by Barbier (1989) and
Barton 1994, we can present the above benefits into the following chart.
Economic Contribution of Marine Biodiversity
5.3.8: Methods of Valuation
Now we will briefly present some of the valuation techniques most appropriate for
estimating various benefits of marine biodiversity, and wherever available, we also present the
preliminary estimates of biodiversity in Karnataka and India.
Direct Use Values
We need to remember that we are interested in estimating the value of marine biodiversity
but not the value of the marine ecosystem. If one is interested in the latter, then the
estimation becomes lot simpler. In the latter case, marine ecosystem can be viewed as
“factories” generating fisheries and other consumptive and non-consumptive products and
services. However, we are interested in the contribution of the richness of biodiversity to the
ability of an ecosystem in producing different use and non-use values. Simply put, we are
comparing the economic values of biodiversity-rich and –poor marine ecosystems, but not
the total value of any one given marine ecosystem.

To estimate the contribution of biodiversity, we first need a good definition of
biodiversity itself. Solow and Polasky (1994) have described diversity as the joint dissimilarity
of a set of species. Dissimilarities are based upon the differences between species, known as
distances, in genetic, behavioral, morphological, or other characteristics relevant to
management or valued by society. This variable can be constructed first by defining a set of
characteristics of a benchmark species and then adding up the distances of characteristics of all
individual species in an ecosystem. Obviously, the higher the distance value, the richer the
biodiversity of that system.
The different uses of marine resources that need to be values are summarized in Box 5.6
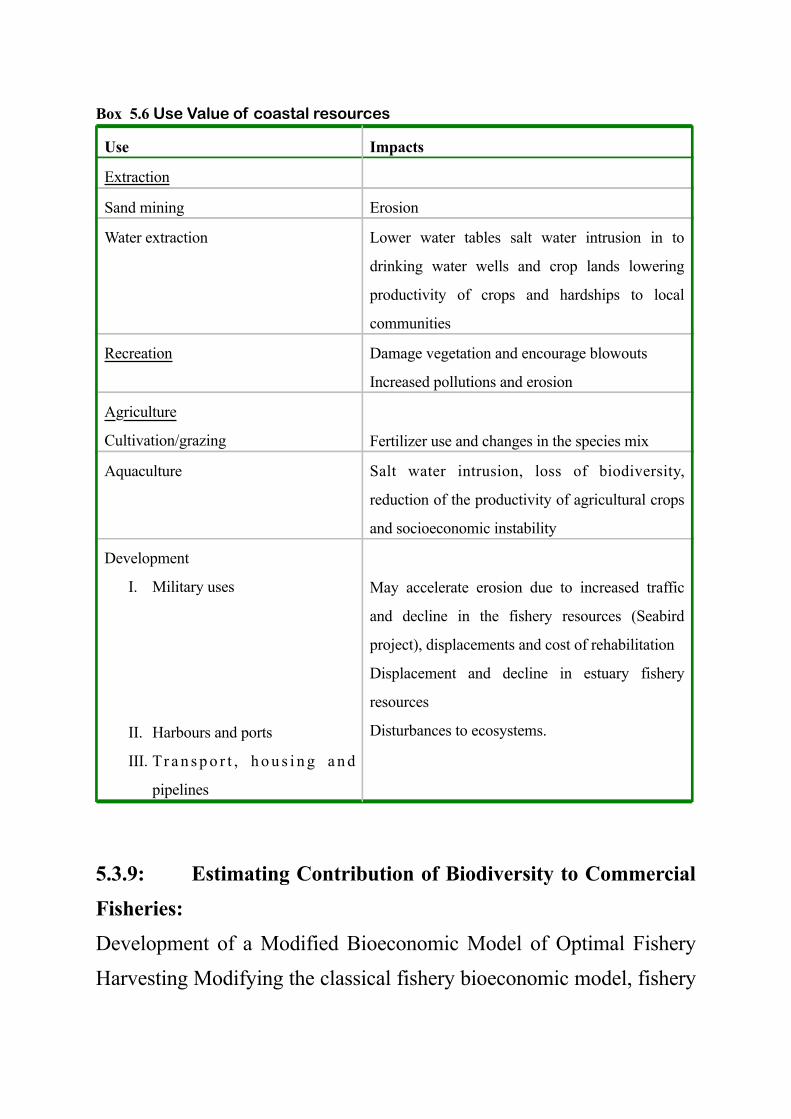
Box 5.6 Use Value of coastal resources
Use Impacts
Extraction
Sand mining Erosion
Water extraction Lower water tables salt water intrusion in to
drinking water wells and crop lands lowering
productivity of crops and hardships to local
communities
Recreation Damage vegetation and encourage blowouts
Increased pollutions and erosion
Agriculture
Cultivation/grazing Fertilizer use and changes in the species mix
Aquaculture Salt water intrusion, loss of biodiversity,
reduction of the productivity of agricultural crops
and socioeconomic instability
Development
I. Military uses
II. Harbours and ports
III. Tr a n s p o r t , h o u s i n g a n d
pipelines
May accelerate erosion due to increased traffic
and decline in the fishery resources (Seabird
project), displacements and cost of rehabilitation
Displacement and decline in estuary fishery
resources
Disturbances to ecosystems.
5.3.9: Estimating Contribution of Biodiversity to Commercial Fisheries: Development of a Modified Bioeconomic Model of Optimal Fishery Harvesting Modifying the classical fishery bioeconomic model, fishery
stock (X) dynamics are represented through an equation of motion,(1)
where X is the fishery stock, H is the fishery production function, E is usual fishery inputs, and
the B is the distance variable representing biodiversity richness. The biodiversity is assumed to
influence both fishery growth and the fishery harvest. Assuming that the effort is uniformly
distributed across space in a given period, the harvest not only depends on the level of effort
but also the level of biodiversity. With larger biodiversity, you are more likely to strike fish
across all sections of a fishing ground.
A fishery manager is assumed to maximize the following objective function subject to
the equation of motion and other usual constraints:
(2)
where P is the periodic net profit from the given fisheries and is dependent on stock; r is
the time rate of preference.
The current value Hamiltonian for problem in (2) is given by:
(3)
Applying the Maximum Principles, the following optimality conditions can be derived:
(4)
From the above conditions, we can derive that the optimal rate of change in the shadow
price of fish stock, lambda-dot, depends not only the time rate of discount and stock but also on
the biodiversity variable.
Intuitively, we can argue that the shadow price of stock will increase with increased
biodiversity. Even though it is difficult to show analytically, one can show numerically derive
the marginal contribution (change in the shadow price) of biodiversity variable to the fish stock.
By integrating lambda variable from zero to a given level of biodiversity variable, one can
estimate the total value of biodiversity of the given ecosystem.
Similarly, one has to find the marginal productivity of biodiversity variable in the case
of other commercial products generated from the marine ecosystem and then estimate the total
value of biodiversity.
5.3.10: A Case Study on the Valuation of Marine Biodiversity

The coastal ecosystem of Karnataka is a 300 km mosaic of monsoon wetlands, beaches and
mountains with up to 2000 meters. The coastal eco-region of the state is separated by Western
Ghats connected by a number of rivers forming estuaries. Coastal wetlands provide enormous
economic benefits; direct and indirect. This coastal region provides fishery and plant products,
water supply to urban and rural population, flood control, erosion buffering, wild life habitat,
recreation and tourism. The combined vast natural resources of both sea and estuaries generate
millions of rupees worth sustainable output, which is significantly being eroded by over
exploitation and ill concerned projects. This has led to serious loss of natural resources
particularly affecting rural people. For example, during the last 15 years more than 17,000
hectares of area and 50,000 people were displaced in coastal region of Karnataka due to
industrial projects such as harbour, refinery, naval base (sea bird) and hydro electricity projects
(Central Water Commission, 1996). Dakshina Kannada coastal eco-region consists of
combined estuaries of Mulki and Pavanje rivers and Nethravathi and Gurpur rivers.
With high density of population (400 sq. km and 1500 per sq. km in Mangalore) the
coastal ecosystem tend to impact closely the livelihoods of local communities living around the
area. The local population both rural and urban is therefore an important stakeholder in the
environmental conservation. Sturrock (1894) has recorded in his Madras District Manual on
South Canara that Pomfret (black and white), seer, mullet and whiting are the favorites at
European tables. All the rivers of the district close to the Western Ghats were with abundant
mahsheer with a length of about 15 lbs and more. The stock would be much larger were it not
for the poisoning and indiscriminate netting. It is important to note that many Hindu castes do
not eat mahsheer as it is considered a sacred fish. Among the backwater fish the most
important and of high value were Lates calcarifer (Cockup), Sillago sihama (whiting) (Kane)
and several species of mullets. The well-known milkfish (Chanos) extensively available in Java
and Philippines was found upto10 feet in the brackish waters of Kundapur. Strurrock (1894)
has recorded that extensive and valuable shellfishes in the backwaters and sea and prawn and
crabs and spiny lobsters are the most important. Extensive edible oyster beds existed in the
backwaters of Kasargod, Mangalore, Mulki and Kundapur.
The coastal eco-region of Karnataka has been the subject of considerable studies. Most
of the studies have concentrated on the diversity of flora and fauna. However, one of the major
studies initiated by Centre for Ecological Sciences of the Indian Institute of Sciences,
Bangalore is a break through in the research studies. A novel experiment to study the
biodiversity was initiated in 1994 when 18 colleges and NGOs joined to form the Western
Ghats Biodiversity Network (Gadgil, 1996). During the 3 years period of 1996-1999 vast
information on the biodiversity was collected. The studies have recorded ongoing changes in
the landscape, its impact on the biodiversity and the socioeconomic forces behind these. It was
observed that there has been an erosion of concern for the conservation of natural resources
(Achar, 1997; Bhat, 1997) among younger generations. The preservation of natural resources
as such does not generate returns and ensures little security. Further, several alternative
economic options have opened up.
The importance of fish in this particular ecosystem led to studies on their composition,
population dynamics and community studies. It has been well documented that the
composition of fish species has been changing over the years. Some of the species such as
fishing cat, otter, and estuarine-crocodiles are now rarely found and are included in Schedule I
(Endangered and highly protected species) of the Wild Life Protection Act (1972). Some of the
grasses grown in tidal rivers of the district are recorded as extinct and induced in IUCN Red
Data Book of Rare and Endangered Plants (Hussain, 1999).
Background of the Study Area and Sampling Methodology
The narrow stretch of 30-80 km land between the Western Ghats and Arabian Sea,
which extends to 150 km of coast line is part of the coastal ecosystem of Dakshina Kannada
district. This area consists of 21 small and major rivers, 550 tanks, wetlands estuaries and
mangrove forests, fallows etc. The mangrove forest of Gangolli is one of the 17 major
mangrove forests. It has been documented that more than 310 different species of marine fish,
55 types of reptiles, 225 types of birds etc. are found in Dakshina Kannada district. In the
coastal waters, estuaries more than 1.5 million tons of shells are collected annually which is
used for producing lime. Annually, 151,000 tons of marine fish is landed in Karnataka.
Various valuation options exist for eliciting conservation and recreational values,
including the travel cost method and the contingent valuation method. In the case of the coastal
and marine ecosystems, a contingent valuation study was undertaken to determine the
willingness-to-pay to conserve the non-market benefits. As the ultimate aim of a cost-benefit
analysis is to assess the full net benefits of investing in coastal environmental improvement, the
study can be considered within the broad framework of a total valuation. However, only the

estimates non-use values are reported here.
Of particular interest is the use of three different question formats to elicit the
willingness-to-pay responses for maintaining the coastal resources in its present condition. All
formats used an increase in taxes as the ‘vehicle’ for collection of the hypothetical payments.
One technique involved an open-ended question, which simply asked the respondent how much
he or she would be prepared to pay annually to conserve the area. A second question format
used and ‘iterative bidding’ approach, providing the respondent with a range of values to
choose from and asking him or her to select one. The third technique is referred to as a
‘dichotomous choice’ format because it involved a yes or no answer to a predetermined figure,
which may be varied from individual to individual. This information is then used to determine
the respondents’ probability of choosing a particular value. Dichotomous choice has become a
more popular format in recent times because of its supposed advantages over other techniques
with respect to bias problems. Results for the three question formats are presented in the
following tables
The contingent valuation survey in this case was aimed at assessing regional residents’
willingness-to-pay for conserving the area by asking whether they would be willing to
contribute amount to the government for the conservation of the area.
The survey covered 500 households selected from urban Mangalore city and
households of 12 villages who are the main stakeholders of the marine ecosystem for various
use and non-use benefits. The respondents were largely males (82%) and only 18% of the
female were represented. The sampling framework did not classify the population based on
gender for interview. The investigators were instructed to meet the available adult member
during the field visit. Among the available member there had been some female members who
opted to meet the investigators. The schedule was canvassed among people representing
different classes of the society and stakeholders. In accordance with the requirements of the
sampling methodology, the field investigators first introduced and explained the concept of
marine ecosystem and also importance of economic growth and development to the
respondents. Each team of investigators explained the impact of development on coastal
ecosystem, current status and the need for the conservation to the respondents before
administering the actual schedule. The schedule had questions with regard to depth of the
current status of environmental awareness and laws relating to the conservation of coastal eco-
regions of the region. After collecting the data through pre-tested questionnaire from 500

households of the urban and rural locations of the Mangalore, the data was post-stratified based
on income classes, occupation, age and education. Thus the total number of households in each
category is not uniform, but represents the total population. An ideal sampling design would
have been a stratified sampling procedure where in the households are selected from each
stratum (example, income class). However, this could not be pursued owing to the absence of
information on the distribution of households across different income classes or occupation or
education. Alternatively, since our primary motive was to make a comparison between
different income classes or occupation, we have resorted to post stratification of the
households. Post-stratification is a valid technique in sample surveys and in some case provide
better estimates than un-stratified samples (Sukhatme and Sukhatme, 1970).
In the present study the sampled households are grouped into six categories based on
their socio-economic profile. In the first group industry and business the average household
size was small with minimum of 4 among nurses and 5 among business people. The
educational qualifications expressed in number of school years shows that this group had
highest average education and have highest household income. The average and maximum
amount willing to pay for coastal ecosystem conservation shows that as education and income
increases their willingness to contribute to clean environment also increases. On the other hand
in the second group (fishing and farming the average and maximum WTP (willing to pay) is
relatively low as their average education and household income is less. The sixth group
consisting of government service personnel has moderate income and education and average
WTP is also moderate.
Among the households who are not willing to pay fourth group (fishery related
business) is highest (49%). This could be due to factors such as low income and low education.
However, 44 percent of the government and service personnel are found to be not willingness
to pay, which indicates that they consider this as an additional burden apart from the tax they
are currently paying. Secondly, since their direct dependence on the ecological services of the
coastal environment is relatively less, a large number of them expressed that they are not
willing to pay for the conservation.
The study reveals the percentage of households willing to pay two times of the original
bid amount out of those who are willing to pay. Among 122 sampled households of the
industry and business group 53 were willing to pay two times with a maximum of Rs.5000 and

an average of RS.1508 per year, which is highest among all the groups. In the 4th group
(workers) only a small fraction (0.82%) have agreed to pay two times, indicating that they can
not sacrifice out of their very low earnings. The percentage of households who are willing to
pay only half of their original bid among the non-WTP group is also brought out by the study.
Again this percentage is maximum in second group (fishing and farming) another low-income
group. This shows that the initial bid amount has quite high and hence they expressed their
non-willingness to pay. But their concern was will revealed when the bid amount was reduced
to half of the original bid.
The classification of households as WTP and non-WTP across income classes shows
that as income increases the percentage of households willing to pay also increases. The
classification of non-WTP households who are willing to pay at least half of the original bid
across the income groups shows that as income increases the percentage of non-WTP
households willing to pay at least half also increases.
The most important reason for WTP was the interest in future generation and a
combination with other reasons. In terms of reasons for highest willing to pay, sustainability
issue was prominent. The reasons for not willing to pay shows that polluter should pay and not
enough income to pay was quoted by 15 percent of the sampled households for each
conclusions of this case study very clearly establishes the relationship between the education,
income and occupation on the one hand and their willingness to pay on the other hand. The
direct dependence of the communities on the coastal resources also makes them to sacrifice,
though with lower income. The assessment of the opinion of the state holders very clearly
establishes that there exists a high non-market value for these coastal resources, which needs to
be quantifies and valued in economic terms to evaluate the costs and benefits from projects.
Any project, which does not consider these non-market values, is likely to under estimate the
costs and over estimate the benefits.
5.3.11:Aquaculture and Biodiversity
Fish production in general and aquaculture production in particular has registered
remarkable growth in recent decades. The total production from aquaculture has increased
from 7,88,310 metric tons in 1987 to 17,68,422 metric tons in 1996, with a substantial growth
of 124 percent. Since natural fishing in coastal waters has reached maximum sustainable yield,
further growth in fishery has to come through commercial aquaculture. Technological progress
in commercial aquaculture has substantially diminished the level of production risks, compared

to traditional fishery or agriculture. This has attracted big corporate companies that can easily
support the high capital demands of aquaculture. Further, India’s coastal and inland
environment offers an amazing diversity of major carps, common carps, finfish, shellfish and
seaweed resources with suitable microclimates for aquaculture production (James, 1999).
Even after two decades of rapid growth in the industry, India has exploited only 10
percent of its aquaculture potential. Farmers, traditional fishers and industries are increasingly
becoming interested in exploiting the full potential of this industry. On the other hand, the
world demand for protein-rich shrimp and other aquaculture products, particularly from the
health-conscious, high-income consumers, has been on the rise. These market trends have put
pressure on the government and the industry for expanding aquaculture production in India.
However, unplanned growth of any industry may not sustain in the long run. At this stage what
we need is a host of well-informed public policies in order to promote production, develop
infrastructure for efficient marketing and distribution infrastructure, promote export growth,
and contribute to food security and nutritional demand.Table. 5.6. Area, production and potential of freshwater aquaculture in various states of India 1998
Sl . No.
State Total area(lakh ha)
% of total area
in India
Covered
Area(000 ha)
% of statearea
covered
Yield(kg / ha /
year)
Potential yield
gap(kg / ha /
year)
Productio
n(000
tones)
Production
Potential
(000 tones)
1 A n d h r a Pradesh
517 18.11 4.12 0.80 3500 1500 14.42 2585
2 Arunachal Pradesh
1 0.04 0.57 56.70 1200 3800 0.68 5
3 Assam 23 0.81 3.16 13.75 1878 3122 5.94 1054 Bihar 95 3.33 23.75 25.00 2174 2826 51.63 4755 Gujarat 71 2.49 41.50 58.45 1225 3775 50.84 3556 Haryana 10 0.35 7.79 77.90 3272 1728 25.49 507 Himachal
Pradesh1 0.04 0.31 31.30 2160 2840 0.68 5
8 Jammu & Kashmir
17 0.60 3.98 23.39 2200 2800 8.75 85
9 Karnataka 414 14.50 31.60 7.63 1515 3485 47.87 176010
Kerala 30 1.05 4.58 15.25 2115 2885 9.68 15
11
M a d h y a Pradesh
119 4.17 71.43 60.03 1730 3270 123.57
585
12
Maharashtra
50 1.74 17.62 35.25 1270 3730 22.38 160
13
Manipur 5 0.18 2.20 44.08 2400 2600 5.29 25
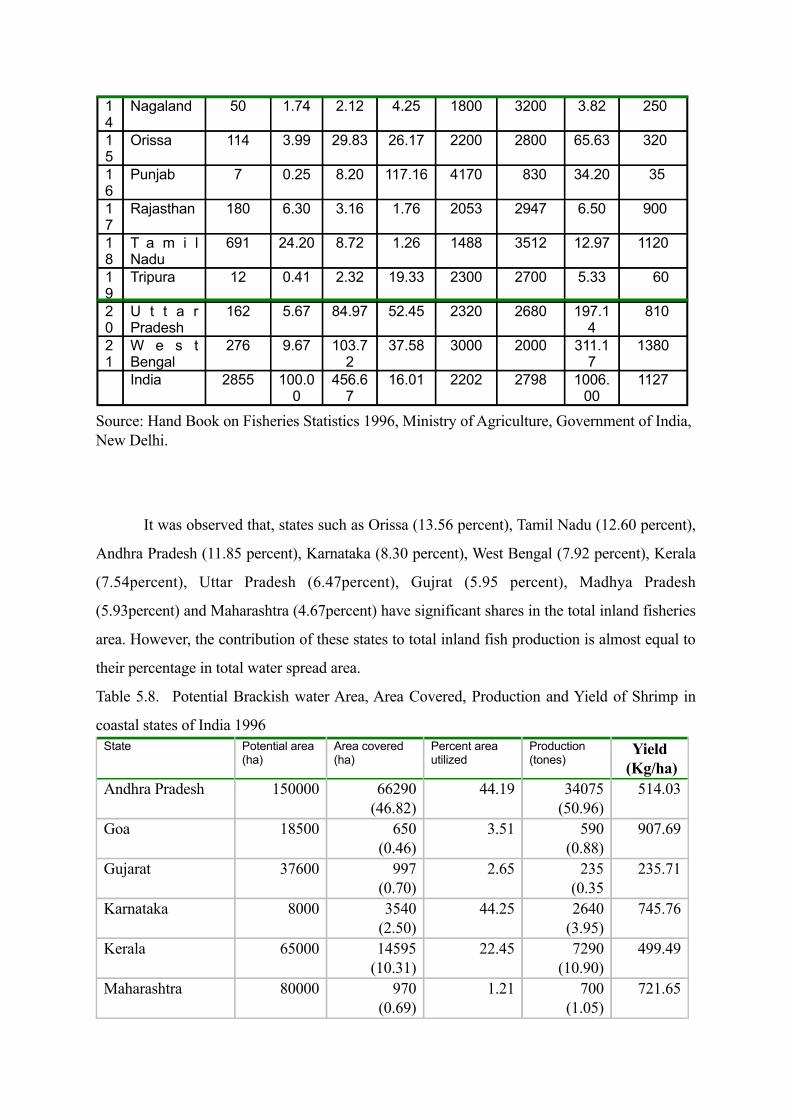
14
Nagaland 50 1.74 2.12 4.25 1800 3200 3.82 250
15
Orissa 114 3.99 29.83 26.17 2200 2800 65.63 320
16
Punjab 7 0.25 8.20 117.16 4170 830 34.20 35
17
Rajasthan 180 6.30 3.16 1.76 2053 2947 6.50 900
18
T a m i l Nadu
691 24.20 8.72 1.26 1488 3512 12.97 1120
19
Tripura 12 0.41 2.32 19.33 2300 2700 5.33 60
20
U t t a r Pradesh
162 5.67 84.97 52.45 2320 2680 197.14
810
21
W e s t Bengal
276 9.67 103.72
37.58 3000 2000 311.17
1380
India 2855 100.00
456.67
16.01 2202 2798 1006.00
1127
Source: Hand Book on Fisheries Statistics 1996, Ministry of Agriculture, Government of India, New Delhi.
It was observed that, states such as Orissa (13.56 percent), Tamil Nadu (12.60 percent),
Andhra Pradesh (11.85 percent), Karnataka (8.30 percent), West Bengal (7.92 percent), Kerala
(7.54percent), Uttar Pradesh (6.47percent), Gujrat (5.95 percent), Madhya Pradesh
(5.93percent) and Maharashtra (4.67percent) have significant shares in the total inland fisheries
area. However, the contribution of these states to total inland fish production is almost equal to
their percentage in total water spread area.
Table 5.8. Potential Brackish water Area, Area Covered, Production and Yield of Shrimp in
coastal states of India 1996State Potential area
(ha)Area covered (ha)
Percent area utilized
Production (tones)
Yield (Kg/ha)
Andhra Pradesh 150000 66290(46.82)
44.19 34075(50.96)
514.03
Goa 18500 650(0.46)
3.51 590(0.88)
907.69
Gujarat 37600 997(0.70)
2.65 235(0.35
235.71
Karnataka 8000 3540(2.50)
44.25 2640(3.95)
745.76
Kerala 65000 14595(10.31)
22.45 7290(10.90)
499.49
Maharashtra 80000 970(0.69)
1.21 700(1.05)
721.65

Orissa 31600 11332(8.00)
35.86 5000(7.48)
441.23
Pondicherry 800 22(0.02)
2.75 20(0.03)
909.09
Tamil Nadu 56000 670(0.47)
1.20 1197(1.79)
1786.57
West Bengal 405000 42525(30.03)
10.50 15121(22.61)
355.58
Total 852500 141591(100.00)
16.61 66868(100.00)
472.26
Figures in parentheses are percent of total
Source: Hand Book on Fisheries Statistics 1996, Ministry of Agriculture, Government of India, New Delhi.
Though aquaculture was expected to relieve the pressure on marine biodiversity, it did not lead
to a relief of pressure. Some intensive methods of aquaculture methods have worsened the
biodiversity loss through the unsustainable demand they create for water, seed and food
resources and also because of wastewater releases. For example in order to produce cultured
shrimp of 1 ton it is estimated that almost equal quantity of wild fish is required in the form of
aqua feed. The fishmeal together with fish oil, have become major ingredients of industrially
produced aqua feeds since they provide the composition of the natural food of carnivorous fish.
Shrimp aqua feed-use mean, increasing competition for fishery resources notably in the form of
fishmeal. The dependence on marine fish catches for producing the aqua feed and shrimp feed
for aquaculture may increase the pressure on wild fish stock and there may be a risk that fish
now used for human consumption will be exploited for fishmeal production (Folke and
Kautsky, 1996). This gives rise to considerable concern regarding trends in ‘biomass fishing’ in
India which involves highly non-selective fishery techniques involving small-mesh sizes for the
single purpose of catching as many marine organisms as possible; after the valued commercial
catches are removed the remaining majority of fish is utilised for fish meal.
Some of the major environmental concerns of aquaculture are:
I. Conversion of mangrove forests and other wetlands to aquaculture farms.
II. Eutrophication of natural waters by effluents from aquaculture operations.
III. Increased sedimentation in natural water bodies as a result of pond effluents and
disposal of pond sediment.

IV. Salaniization of freshwater by pond effluents and seepage into aquifers.
V. Use of potentially toxic and bio accumulative chemicals in production.
VI. Conservation of cropland to aquaculture farms.
VII. Excessive use of resources such as freshwater, feed ingredients,
electricity, Etc.
VIII. Negative effects on native fisheries and biodiversity through habitat
destruction, water pollution, impingement by pumps, uses of wild-caught brood
stock and larvae, and introduction of non-native species.
One issue where there ought to be no conflict between shrimp growers and non-shrimp
growers is that of organic loading, pollution and enrichment. Aquaculture is unique in that
unlike other industries it is also adversely and directly affected by the waste it generates.
Effective waste treatment and pollution abatement can be considered the core of
sustainability. It is as much to the interest of the shrimp culture industry to clean up its own
wastes as it is to the community at large. This should now be increasingly clear to most
growers.
Limiting the stocking density within farms or limiting the number of farms within an area
will no doubt work, however there are three questions that can be raised to such move:
I. How can farms be monitored for compliance with the density limits?
II. How can the number or hectare of farms to be allowed in an area be determined?
III. Is it feasible or even technically possible to determine the carrying capacity in all the
shrimp growing areas?
Imposing limits on stocking density stifles productivity and efficiency. Should we be
content at producing a few hundred kilograms per hectare when potential production can be
several metric tons? There is also insufficient baseline data to compute carrying capacities
of a given area.

Viewed objectively it is not the number of shrimps per se that impacts negatively on the
environment. Instead it is the amount of waste generated by the shrimp stock, which has a
negative impact. If a shrimp farm can successfully manage its waste so that it no longer affects
the environment should it still be punished for exceeding the limits imposed? Just as
governments do not dictate normally dictate the output of manufacturing plants leaving this to
the discretion of the operator who would conceivably base this on plant capacity and market,
then perhaps no limits should be imposed on shrimp stocking density. However the
government, in the name of public health and safety, should have the right to impose standards
on the waste discharges, be it from a manufacturing plant or a shrimp farm.
With such approach any shrimp farm can determine its own stocking density based on
its capacity to manage its wastes. A zero-discharge system is technically possible. What
remains is to show that such systems can also be financially viable. Even if a zero-discharge
system is not yet commercially viable the technology now exists for managing such wastes so
that organic loading and enrichment can be greatly minimized. Waste discharge quality, both
during operation and at harvest, will definitely be easier to monitor than stocking density.
There are ample evidences to believe that the common water bodies have been
shrinking through degradation and encroachment and siltation etc., which is not properly
reflected in the official data. Another threat to fisheries and aquaculture is found to be from
industrial pollution. Both biological oxygen demand (BOD) and total coliform are found to be
on upward trend in many rivers of Karnataka (Nadakarni 1999). As reported by the Central
Pollution Control Board (1997) in Andhra Pradesh out of 2466 million liters per day discharged
as wastewater 2116 million liters are from aquaculture where the growth of aquaculture has
been maximum (CSO, 1998).
On the other hand, the very developmental projects themselves are becoming counter
productive in the management of community ponds. As mentioned earlier, these community
ponds were sources of drinking water, irrigation and washing. They were managed collectively
by the contribution of labour by each and every family irrespective of the income and status.
However, with massive investment in public utility services such as tube-wells, electricity etc.
the importance of these ponds to the villagers declined. With the result these ponds are getting
encroached by the neighboring farmers since the private property rights do not exist, on these
ponds and nobody is taking care of such water bodies.
5.3.12: Role of Corporate Sector

The marine resources provide lot of utilities such as medicinal, nutritional, cosmetics
and industrial products. Many diseases such as tumors, cancer (ovarian, colon etc) are treated
by using sea squirts, sea sponges, jellyfish, chitosan and ocean floor fungil. The extracts from
marine resources such as micro algae, cyaobacteria, krill etc provide nutritional products such
as vitamins and anti-oxidants, vital amino acids, proteins, gelatin and food colours. The
seaweeds and micro algae are being used for manufacturing cosmetics such as toothpaste, gels
lipsticks and lotions. Some of the industrial products such as paper and pulp enzymes,
befouling agents and adhesives are manufactured from the extracts of marine resources such as
sponges, chitosan from crustaceans and molluscans. A handful of corporate firms such as
Shantha Marine Biotechnologies, Parry Nutraceuticals, Global Green (A Thapar group
company) and Max Pharma are in the field of marine biotechnologies. The export market for
Indian nutraceuticals (ranging from human nutrition supplements to food ingredients,
aquaculture and animal feeds) is currently worth Rs.2300 crores, which is estimated to double it
self to Rs.4500 crores by 2003. However, this is only a very small part of the global market,
which is currently estimated to at $500 billion (K S Iyer, 2001).
Table 5.9. Marine biotechnology linked corporate sector
Biodiversity l inked
resources
Utility of the of the final
products
Major industries involved
Sea squirts Tumors, viruses, suppression of
immune responses
Pharmaceutical industries
Encrusting invertebrates Ovarian cancer Pharmaceutical industries
Sea sponges Herpes, simple, cancer, pain,
inflammation
Pharmaceutical industries
Jelly fish Neurological disorders, cancer,
inflammation, anesthesia
Pharmaceutical industries
Chitosan Burns Pharmaceutical industries
Ocean floor fungi Human colon cancer Pharmaceutical industries
Micro algae and fungi Vitamins and anti-oxidants and
vital amino acids, gelatin and
food colours
Nutrition related companies
cyanobacteria Fluorescent tags and tracers Nutrition related companies

Krill apart from fish,
algae, plants
Proteins Nutrition related industries
Seaweed (carrangenan) Toothpaste and gels Cosmetics
P i g m e n t s a n d
cynobacteria
Lipsticks Cosmetics
Sponges Paper and pulp products Industrial products
Chitosan and crustaceans,
fungi
Bio-fouling Industrial products
Molluscans Adhesives Industrial products
The marine organisms produce unique bioactive compounds for their reproduction,
communication and against predation, infection and competition. This genetic material and
chemicals in marine plants, animals and microorganisms constitute an extraordinary resource
for pharmaceuticals, industrial enzymes, agricultural products and bioremediation and so on.
However, there is a need to evolve laws and statutes for the exploration, protection and
sustainable development of marine resources. For example dredging of sea for various
industrial purposes such as construction of ports, thermal power plants and other explorations
severely damage coral reef and marine resources. The restrictions on tapping the wild marine
resources are also required to prevent over harvesting of these resources.
5.3.13: Laws, Regulations and Institutions for conservation of Marine Biodiversity:
Various laws and regulations in India are dealing with aspects of marine biodiversity,
environment protection. These are the Environment (Protection) Act, 1986, the Water
(Prevention and Control Pollution) Act, 1974 as well as the Fisheries Act, 1897, the Wild Life
Protection Act, 1972 and the Forest Conservation Act, 1980. For instance, it appears that under
the Environment (Protection) Act, 1986, effluents discharged by commercial shrimp farms
could be covered by the definition of environmental pollutant, environment pollution and
hazardous substance. The Water (Prevention and Control Pollution) Act 1974 has been enacted
to provide the prevention and control of water pollution and maintaining or restoring of
wholesomeness of water. The term trade effluent under this Act includes “any liquid, gaseous
or solid substance which is discharged from any premises used for carrying on any (industry
operation, or treatment and disposal system), other than domestic sewage”. Shrimp farmers
should obtain from the Pollution Control Boards an authorization to set up any treatment and

disposal system which is likely to discharge sewage or trade effluent into a stream or well or on
land.
In February 1991 the Government enacted the Coastal Zone Regulation Notification. It
applies to “coastal stretches of seas, bays, estuaries, creeks, rivers and backwaters which are
influenced by tidal action”. It is further limited by boundaries, which reduce the regulated core
area to the inte-tidal zone and an adjacent 500-meter wide strip of land from the high tide line.
The seaward line is the low tides line. It regulates a whole series of activities and uses. India’s
Coastal Regulation Zone is a good example of a coastal management law, which is built around
a set of exiting development realities. The core of the regulation is a moratorium on new
construction, such as in ecologically sensitive area, and a prohibition of most development
activities between the Low Tide Level (LTL) and the high tide level (HTL). The formulation of
the rules is complex and sometimes unclear as if the Government did not want to compromise
all economic development activities. The annex to the Notification classifies the inter tidal
zone and the landward area from the High Tide Line into four zoning categories, with fixed
upland and offshore dimensions, and with different corresponding restrictions on construction
and land use. Shrimp culture activities in these categories could either be excluded or
authorized under special terms and conditions. The Karnataka Land Reforms Act amended in
1995 considers aquaculture as an agricultural activity. The crop lands could now be leased out
for aquaculture and the amendments further relaxed the land ceiling, income limits for purchase
of agricultural land etc and thus giving scope for the entry of large enterprises for undertaking
aquaculture activities.
India is the second largest producer of aquaculture products and is one of the major
exporters of fish and fishery products in Asia. There are many other non-market economic
benefits from the marine and aquatic ecosystem. Most of the management schemes designed to
protect aquatic ecosystems suffer from the fact that the short term costs of establishing the
regulations are easily recognized, whereas the costs of not protecting the environmental quality
of the marine ecosystem is not readily quantified (Malone et al. 1993). For example in the
absence of enough scientific information on fishery biology and fishery industry socio-
economic dynamics the state Department of Fisheries can undertakes the task, with the help of
experts and local people, to identify fish breeding areas. Till such time all wetlands and
backwater areas could be declared as fish breeding centres. A notice to the Panchayats could be

issued indicating the reason for declaring areas as such and soliciting their co-operation in
protecting the place. Perhaps the Department of Fisheries could spell out what activities will/
will not be allowed. However, political and hard work is needed to implement such policies. 5.3.14: Legal and organizational Framework For Promoting And Regulating Fisheries Development:
Central Government and State Government
I. The Indian Fisheries Act of 1897 (Government of British India)
II. The wild life (Protection) Act 1972
III. Forest (Conservation) Act, 1980
IV. The Water (Prevention and Control of Pollution) Act 1974 and amendments
V. The Water (Prevention and Control of Pollution) Cess Act of 1977 and amendments
VI. The Air (Prevention and Control of Pollution) Act 1981 and amendments
VII. The Environment (Protection) Act 1986 and its three amendments in 1987
VIII. The Coastal Regulation Zone Notification of 1991 (issued under 6 above)
IX. Environment Impact Assessment Notification 1994 (issued under 6 above)X. Hazardous waste management rules (issued under 6 above)XI. Public Liability Insurance Act and RulesXII. Laws relating to water utilizationXIII. Land and land reforms legislation XIV. Rules and regulations relating to the changes in the land useXV. Agencies involved in charge of land use – their obligationsXVI. Coastal land as common property existing legal control and traditional mechanismsXVII. Land acquisition laws and proceduresXVIII. Territorial Waters, Continental Shelf, Exclusive Economic Zone and other Maritime
Zones Act, 1976.XIX. Marine Fisheries (Regulation) Act, 1986 of Karnataka.XX. Mysore Game and Fish Preservation Regulation 1901 XXI. Karnataka Agricultural produce market (Regulation) Act 1974XXII. The Public Liability Insurance Act, 1991XXIII. National Environment Tribunal Act 1995
Organizational set-upCentral GovernmentI. Union Ministry of Agriculture, Department of Agriculture and Cooperation, Fisheries,
Division.II. Union Ministry of CommerceIII. Union Ministry of Environment, Forests and WildlifeIV. Indian Council of Agricultural Research (ICAR), Fisheries DivisionV. Council of Scientific and Industrial Research

VI. Department of Ocean DevelopmentVII. Department of BiotechnologyIndian Council for Agricultural Research (ICAR) Fisheries InstitutesI. Central Institute of Fisheries EducationII. Central Institute of Brackish water AquacultureIII. Central Marine Fisheries Institute (CMFRI)IV. National Bureau of Fish Genetic ResourcesV. Central Institute of Fisheries TechnologyCouncil for Industrial and Scientific Research (CSIR) InstitutesI. National Institute of OceanographyII. National Environmental Engineering Research InstituteIII. Central Food Technological Research Institute Ministry of Agriculture InstitutesI. Central Institute of Coastal Engineering for FisheryMinistry of Commerce
I. Marine Products Export Development Authority
State GovernmentI. Directorate of FisheriesII. Fish Farmers Development Agency (District Level)III. Brackish water Fish Farmers Development Agency (district level)IV. Karnataka Fisheries Development Corporation V. Karnataka Pollution Control BoardVI. Fisheries College and University Departments
5.3.15: Strategy and Action Plan for Marine Biodiversity Conservation
I. Establishing a regulatory regime for preventing marine pollution: India lacks even the
rudiments of an operational environmental regulatory infrastructure for preventing /
controlling marine pollution. Though the coast Guard is vested with the mandate of
identifying the marine polluters, the efforts are not satisfactory since it is vested with
several other functions.
II. Resource pricing: Input price influences how efficiently a country uses its resources.
The input subsidization especially fuel in the marine fisheries sector is promoting over
fishing and thus undermining sustainability of marine fish production.
III. Eco-labeling programmes can provide effective incentives for producers to reduce
negative environmental impacts. National eco-labeling programmes are now in
operation in India like in many other developed countries. India launched its first eco-
labeling program called “Ecomark” in 1991, followed by South Korea (“Ecomark”) in
1992 and Singapore (“Green Label Singapore”) in 1992. At the international level
beginning with the Earth Summit in 1992, the International Organization for

Standardization (ISO) has been working to develop Environmental Management
System standards called ISO 14000 series. Within this series the ISO 14024 standards,
the outlines rules and procedures for eco labeling. These standards are guidelines
aimed at standardizing requirements for the various world–wide eco labels which
compliment national environmental regulations Grote et al. 1999). Like the ISO the
Global Eco-labeling Network (GEN) is a non-profit association of eco-labeling
organizations from around the world that has been established for developing criteria
for certifying products and services with lower environmental burdens and impacts than
comparable products and services. Financial and technical assistance would help
companies, particularly small and medium enterprises to overcome the cost barrier of
joining eco-labeling schemes. Further, eco-labeling is generally acknowledged by
WTO as being an effective instrument of environmental policy as long as it does not
discriminate between products and countries.
IV. The marine living resource extraction is controlled and promoted by several central and
state ministries. There is a clear absence of intersectional policy integration defined as
internalization of environmental concerns within institutions of development. Rather
than addressing environmental and biodiversity concerns only through an independent
ministry, intersectoral policy integration requires that organizations such as ministries of
industry, agriculture and commerce also should adopt environmental performance goals
as well as strategies to enhance environmental performance. For example the Ministry
of Agriculture deals with food production including fisheries and aquaculture. The
Ministry of Commerce deals with promoting exports of marine products. For policy
integration greater decentralization of authority and management responsibility and
greater dependence on community-based management practices are required. The
fishery resource management plans could be prepared with the participation of local
communities and authorities and in compliance with national commitments to the
Biodiversity Conservation (CBD), the Convention on International Trade on
Endangered Species of Wild Fauna and Flora (CITES) etc. The national ministries
should also take the lead in promoting the adoption of voluntary or mandatory eco
labeling schemes for both harvesting and production.

5.4: Animals as Forgotten Biodiversity
5.4.1: Marketisation and genetical diversity
Genetic erosion of domestic animal diversity has placed 30% of the world’s breeds at
risk of extinction. Livestock keeping by poor families in semi-commercial and subsistence
agriculture is multipurpose. Improved breeds often do not have the attributes required to enable
them to fulfill the multi-faceted roles they are allocated. Domestic animals supply some 30% of
total human requirements for food and agriculture by providing final and intermediate outputs.
In a state such as Rajasthan, the livelihood of over 30% of population depends upon the sheep
and goat livestock. An estimated 90% of the total contribution to food and agriculture
production comes from only 14 of these species (FAO, 1999). In Europe, where currently
nearly two-fifths of existing breeds are at risk, one-third of breeds existing in the early 1900’s
have been already lost. In Africa, 22% of African cattle breeds have become extinct in the last
100 years while 27% are at varying degrees of risk.
5.4.2: The economics of Animal Genetic Resources (AnGR) erosion: A conceptual
framework
AnGR erosion can thus be seen in terms of the replacement (not only by substitution,
but also through cross-breeding and the elimination of livestock because of production system
changes) of the existing slate of domestic animals with a selection from a small range of
specialized improved breeds.
According to the International Livestock Research Institute, the causes of ANGR
erosion often stems from the ‘misguided development policies initiated in the developing
countries (ignoring traditional breed of low input mix and high pastoral production capability)
by introducing high yielding exotic breeds with high input and risk factors (against the
environment in which they have to survive) and also high output capabilities’.
Artuso (1996) argues that establishing economic values for ANGR can contribute to
policy and management decisions, introduction of economic incentives, to identify potential
gainers and losers, and towards biodiversity conservation.
A range of valuation methodologies exists and can be broadly categorized into 3 groups
on the basis of the practical purpose for which they may be conducted. Following the
identification of a given breed being at risk, these methodologies can be applied in order to
justify conservation costs by:
I. Determining the appropriateness of AnGR conservation programme costs (considering environmental values)
II. Determining the actual economic importance of the breed at risk (i.e. consider breed values) and / or
III. Priority setting in AnGR breeding programmes (i.e. consider trait values)
5.4.2.1:Relevant Valuation techniques
The Contingent Valuation Method (CVM), though considered to be the most relevant one,
has never been used for valuation of genetical resources (Pearce and Moran, 1994). In this
mehod, hypothetically then farmers might be asked about their WTA payment for on-farm
maintenance of AnGR, and the general public might be queried on WTP for maintenance on-
farm of in gene banks. In this way an upper bound to the costs that society is willing to confront
for AnGR conservation could be determined.
However, an opportunity cost approach is sued by Brush et al. (1992), using the
concept of option value to the maintenance of on-farm diversity in Peru. Brush and Meng
(1996) propose a cost-effective strategy for crops that could be easily adapted to livestock.
Instead of attempting to justify conservation programme costs on the basis of society’s
willingness to pay for the production losses that can be potentially avoided, they argue that
once the need for conservation of a particular breed has been agreed on, the costs of such a
programme can be minimized by recognizing the factors influencing farmers animal selection
decisions, thereby identifying those households that most value such breeds. Since these are the
households most likely to continue to maintain such breeds they will also be the least costly to
incorporate in to a conservation programme.
5.4.3: Methodologies for determining the actual economic importance of the breed
Econometric estimation of aggregate demand and supply curves can be used in order to

provide a measure of consumer and producer surplus based on the fact that changes in the
traits or the composition of breeds will produce shifts in the estimated functions, which in turn
will bring about a change in consumer and producer surplus (ILRI,1999). Where multiple
demand equations (one for each breed) can be estimated, the substitution effects across breeds
can be explicitly modelled, providing the most comprehensive evaluation of breeds while
capturing substitution effects as well. Cross-sectional household and farm studies can also be
used to construct demand and supply functions.
The existing or potential value of Intellectual Property Rights and / or contracts for
AnGR use and conservation could also be used as an indication of the economic importance of
given breeds.
Brush and Meng (1996) point out that the most direct method of valuing genetic
resources is to privatize them and allow the market to set a price. But there is a danger in this
approach. Note that at present existing genetic resources collected before the CBD entered into
force are treated as public goods. Theoretically privatization would provide compensation to
those who safeguard genetic resources, thus stimulating conservation without public investment
while providing an idea of genetic resource users WTP for conservation. IPRs and patents in
particular, which are being promoted as the appropriate tool for the privatization of genetic
resources. But they fail to reward local people for their important contribution (of Knowledge
and resources) to the product for which industry is awarded patent protection. For example, the
world’s smallest cattle breed, the Vechur, was bred in India and needs only 1.5 kg of feed daily.
It has now been patented in the UK (ITDG,1996)!
Given that the FAO recommends active and sustainable utilization (in-situ
conservation) together with improving the production levels of adaptive breeds, as central to
the better management / conservation of AnGR (Hammond, 1996, FAO, 1997), ensuring that
conservation and their related breeding programmes are maximizing their potential benefits is
important.
Breeding programme evaluation :These approaches are used to evaluate the costs and benefits of breeding programmes and / or the new animal breeds. Cervigni (1993) shows how the benefits of genetic material could be valued assuming (critically) that the yield effects of successive breeding stages and the necessary input cost information can be identified. This would require using the difference between the benefits of an

improved breed (based on price and increased yield) and the costs of all other factors employed in breeding operations (capital, labour, etc.). The value of using alternative inputs / traits could then be compared to see how they affected economic returns.
I. Genetic production function models: In this method focus is on predicting potential future values rather than using actual results of breeding programmes. In this context, existing AnGR are valued by weighting the expected value of the new breed by the probability of this being successfully developed. The expected value reflects the discounted stream of benefits of the new breed over the period in which these benefits are expected to take place (Scarpa, 1999).
5.5: Economics of Sacred Groves (*With most of the inputs from M.G. Chandrakant)
5.5.1: Why Economics of Sacred Groves Important?
Since time immemorial, forests have served the mankind by fulfilling the needs in
various forms such as food, fibre, shelter, medicine, security and so on. Forests are part of a
large eco-system consisting of soil, water, biomass and of course human and animal life. As a
management procedure, different regulatory measures regarding the utilization of forests do
exist corresponding to different types of forests. Examples are Supply or timber forests,
community woodlots, reserve forests, protected forests, village buffer forests and sacred forests
or sacred groves. Most traditional forest-dwelling societies however, link forests, trees, animals,
and other objects associated with forests, to deities and animistic beliefs, thus attaching a sacred
connotation to forests.
The concept here is that forests are the property of the Gods of the villages in which
they are situated. Buchanan (1870) who traveled through Uttara Kannada district of Karnataka
wrote the following:“The forests are the property of the Gods of the villages in which they are situated, and the trees ought not to be cut without having leave from the Gauda or Headman of the village, who here is also the priest to the temple of the village God”
A sacred grove is a patch of vegetation, ranging in extent from a few trees to forty or more
hectares, which is left undisturbed because of its association with some deity. Such a world
view of sacred groves and their characteristic feature of self-organised conservation have
facilitated the conservation of extremely valuable climax vegetations and biodiversity.
Tradition of sacred groves is known in the Western Ghats, spread over parts of Maharashtra
state in the extreme north, Karnataka in the central part and Kerala at the southern-most
position.
A large number of studies on inventories of sacred groves in the Western Ghats
concentrated on their disturbed and undisturbed flora and fauna (Vartak and Gadgil, 1976,
1981; Ghate, 1996; Kumbhojkar et al., 1986). Some have also gone in to the taxonomic
inventories (Vartak et al., 1996). What is equally important is to recognise the anthropological,
cultural, historical and social dimensions of preserving sacred groves (Barman, 1992, 1997).
They have also been studied as a biodiversity preserve and avenue for local participation
(Godbole et al., 1998).
Studies, hitherto, on sacred groves have focused on certain key areas ranging from their
distribution in the country, the biodiversity they help conserve, their transition and management
practices to their prospects in the future (Ramakrishnan et al., 1998). Some of them are
summarized here.
(a) Location and distribution : Sacred groves occur under a variety of ecological
situations across India like plains, hill slopes and hill tops. The existence of sacred groves has
been widely reported from the Western Ghats, spread over Kerala in the south (approximating
240 groves), Karnataka in the central region and Maharashtra (numbering around the same as
in Kerala) in the north. Such studies have also been reported from parts of Rajasthan, Himachal
Pradesh, Uttar Pradesh, in the hilly regions of the states like Bihar (particularly the
Chhotanagpur region), Orissa, Assam, Meghalaya (important being the Cherrapunji region),
Mizoram, Madhya Pradesh ( particularly Bastar region) and Tamil Nadu. A study carried out by
Gadgil and Vartak (1981) presents an inventory of sacred groves in Maharashtra, covering
aspects like district, taluka, nearest village, area and deity of the sacred grove.
(b) Biodiversity data : Sacred groves encompass a large variety of tree and animal
species. The tree species vary from evergreen-semi evergreen, mangroves to deciduous types. A
large number of food plants like mango, jackfruit, cashew, wild palm and a variety of wild
fruits; spices like pepper, nutmeg, curry leaf and cinnamon; a wealth of medicinal plants; and
minor forest produce like honey, mushroom and bamboo shoots. Besides these, a large number
of wild relatives of cultivated plants have also been spotted. Sacred groves also provide shelter
to numerous species of birds like drongos, swallows, flycatchers and orioles; fish species;

mammals like bats, primates and minor mammals; and reptiles like cobras, vipers, kraits and
pythons (primarily in serpent groves). The above-mentioned and innumerable other mobile and
immobile species have been spotted and documented by researchers. Studies of floral, faunal
and wildlife diversity have been made by Gadgil and Vartak (1976, 1981) in the Maharashtra
region of the Western Ghats, Chandrakanth and Nagaraja (1997) in Coorg, and Chandran and
Gadgil (1993) in Uttara Kannada district, besides several other studies.
(c) Human-Forest linkages : The most probable rationale for the close and ‘sacred’
association between mankind and forests in general, and sacred groves in particular, lies in the
short and long term benefits flowing from the forests. Sacred groves serve critical functions
like sheltering rare plants, protection of water sources and being the only remnants of tree
vegetation along the countryside are also the main sources of leaf litter. They are of significant
economic and climatic importance to the people who benefit from them (Golhale, Velankar,
Chandran and Gadgil, 1998).
Most sacred groves have immense watershed value since they favour the existence of
water bodies like ponds, streams, springs, perennial streams or rivers. Such water bodies in turn
play a catalytic role in creating heterogenous vegetational patches which in turn form congenial
habitats for the rich presence of wildlife. Along with water conservation, they reduce erosion,
provide rich humus and are a rich source of medicinal flora (Ramakrishnan et al, 1998).
As refugia, sacred groves help in reducing the chances of extermination of resource
populations. The chances of extended preservation of exploited populations are considerably
higher by providing complete immunity to parts of such populations in the protected habitats.
This same feature of sacred groves also helps in constituting them as store houses of traditional
seed sources. They thus facilitate regeneration and restoration of secondary forests around
them by supplying seeding material. Sacred groves also play the role of a valuable mosaic of
resources, otherwise undisturbed, that serve as an insurance to be exploited only in
emergencies.
Besides these more tangible benefits, religion and culture constitute the over riding
rationale for the existence of sacred groves in India to this date, although in a diluted form.
Most sacred groves are dedicated to certain deities and the biodiversity of the grove is supposed
to be under the protection of the reigning deity of the grove. Traditional folklores also uphold
the existence of these groves (Vartak and Gadgil, 1981).
(d) Management and threats to sacred groves : In the past, sacred groves survived, to a
large extent, due to the existence of certain basic characteristics for their sustainable use. These
include a small number of parties sharing access to the resource, repeated and long-term
interaction between parties sharing access of the resource, equitable distribution of harvests
and reciprocal or kinship relationships between parties. Inspite of being one of the world’s top
12 mega diversity countries with traditions and modern efforts of biodiversity conservation,
India’s biodiversity reserves are being eroded rapidly. This can be attributed to the deficiencies
in the current system of forest utilisation and weakening traditions. One such factor is changing
religious beliefs; for instance, the amalgamation of primitive deities into the pantheon of Hindu
gods, often followed by the construction of temples. A major threat to their survival, which
arose with the state under the British regime taking up control of forests including sacred
groves, still continues. People’s traditional rights over sacred groves have been reduced to
minor concessions or privileges. With depleting resource availability, and curtailed rights and
the transfer of forest resources out of community control, these resources have virtually become
open access resource from being a common property resource. Contract systems and their
exploitation by forest-based industries have only hastened their degradation. An important
factor furthering such degradation is the narrowly focused notion of protected areas, to the
neglect of neighbouring areas because no patch of vegetation can escape the effects of
surrounding environmental conditions. One other factor is the emphasis on the exclusion of
human use and on the use of force, particularly against local tribal and rural populations
depending on the forests for their subsistence needs. A final factor is the preference of modern
scientific knowledge to traditional and tenable folk ecological knowledge.
5.5.2: Valuation of sacred groves
How to value the contributions of sacred groves to the protection of forest ecology? The
starting point for valuing sacred groves is to treat them as having Existence Values (in addition
to Use Values). From an ecological angle, it may be measured in terms of specie distinction,
specie richness, uniqueness, specie representativeness, endangeredness, and rarity.
Measurement of these ecological values is not an easy one. Firstly, they are not obtainable
under any revealed preference ordering. After all, quite often there is no market for them. Not

only that, it is difficult to arrive at the values assigned to them by the people uniquely, as they
also have some uncertainty (i.e., probability) associated with them (Brown and Goldstein,
1984; Polasky and Solow, 1995; Polasky, Solow and Broadus, 1993). This is so, because of
non-uniqueness of values as viewed from the point of existence values. Usually a Contingent
Valuation Method is applied to collect information about peoples’ preference for such existence
values(Common, Reid and Blamey, 1997).
The second methodological issue in estimating Existence value is about the level and
quality of information. For instance, comparative understanding of the floral uniqueness of the
sacred grove in the local area with the surrounding landscapes of similar or different vegetation
may yield, at best, lower bound values for existence values. Local people ascribe certain
functions to the sacred grove patches. They are food, fuel, fibre, religion, culture and so on.
These functions could be utilitarian as well as cultural functions. These functions have roles to
play in the social fabrics of the village and also in designing policies of conserving sacred
groves. But non-locals may also value them, not so much as food, fuel or fibre but as aesthetic
beauty. Many sacred groves including those in Western Ghat region are considered as resources
by local people, but as biodiversity preserve by outsiders. There are no efforts to find parallels
between local importance mentioned by people and regional importance of the grove, may be
because of different socio-economic perceptions of people, unable to express uniquely the
desire on species conservation. There are no efforts to evaluate such forest pockets, where
apart from utilitarian values (by the locals) non-use values (by the outsiders) are equally
important. An important question in methodology is to aggregate these values by the locals and
outsiders, which is basic to understand the ecological aspects of biodiversity preservation.
The third methodological issue is designing forest management policies, taking clues
from the values as viewed by the people. What are the economic incentives to preserve sacred
groves and to develop an environmental education system, in which foresters, local people and
interested NGOs can work together to make sacred groves as a fixed point for sustainable forest
management?
5.5.3: Existence Value of Sacred Groves: A Case study from Kodagu in Karnataka

The term 'existence value', was first introduced by Weisbrod (1964). It is a 'passive use value',
or the utility people attach to the existence of unspoiled wilderness, similar in kind to, and
directly comparable with, the value from active use of wilderness area for tourism, logging and
so on. Existence value is the individual derives from the knowledge that the site exists, even if
he/she never plans to visit it. According to John V. Krutilla (1967), existence value is the
value derived from the sheer contemplation of the existence of ecosystem, apart from any direct
or indirect uses of goods and services they provide. This
can include a pure biodiversity component, the appreciation for the variation or richness in the
ecosystem. This is based on the contemplation of the ecosystem as a whole (entirety, ensemble)
vs. appreciation for each of its members individually.
5.5.3.1: The Story of Devara Kadu
Devara Kadus - sacred groves located in Kodagu district of Karnataka, in the evergreen forests
of western ghats (recognized by united nations as hot spot of biodiversity).
connotes a ‘religious’ definition. Thus, ‘reserve forest’ classification in the Forest Conservation
rules is a secular sanction to the preservation of Devara Kadu.
Devara Kadus of Kodagu are prevedic in origin (3000 BC). They have the deity in sanctum,
temple forest surrounding the deity and the temple tank with size varying from a few trees to
1000 acres or more. The tree types include indigenous trees of all types. In some Devara Kadus
we may also find exotic trees recently planted. Some of the common tree species are Canarium
strictum; Tectona grandis; Artocarpus heterophyllus; Santalum album, Ficus glomerata, Ficus
religiosa, Bambusa spp, and silver oak.
The sacred site is crucial rather than the species. In Kodagu, the first kingdom of Kadamba
Chandravarma is named after the sacred tree Anthocephalus cadamba, as a protector of the
entire kingdom. Inscriptional evidences exist to provide indications of their protection inter alia
the 5th century AD inscription of Madikeri, 1278 AD Nidutha inscription, the 1372 AD Paluru
inscription, the 1840 Irpu inscription.
Sir Brandis the German forester, the first Inspector General of Forests in India
Was impressed by the network of sacred groves in India and

urged a system of forest reserves modeled upon sacred groves.
The precise number and area of sacred groves in this district are not known. According to
one estimate of Dr Kushalappa, Department of Forestry, Forestry College, UAS, Ponnampet, ,
there are
1214 Devara Kadus summing 6300 acres indicating a 42 percent reduction between 1905 and
1980 and
about eighty percent of Devara Kadus are below five acres.. According to another estimate by
Nagaraja and Chandrakanth, Dept of Agri Economics, UAS, Bangalore,
there are 346 Devar Kadus in 4184 acres indicating a 60 percent reduction between 1900 and
1992.
Types of Devara Kadu
The devara kadus have of different types namely: paisari devara kadu, suggi katte, basadi kadu
(maintained by jains earlier), hole devara kadu (preserved by scheduled tribes), palli kadu
(preserved by muslims), mutt kadu (preserved by Veerashaiva religious institutions)
, which all have common property resource characteristics. In the Devara Kadus, there is no
extraction of any kind at any time, an annual devara kadu festival is usually conducted with an
average expenditure of Rs. 15,510. Devotees who come for the festival from all over Kodagu
voluntarily donate an additional Rs. 13,019. The festivals are ritualistic, spiritual, and social,
with a get together of village communities.
According to forest conservation act of 1980 – Devara Kadus are owned by the Forest
Department of the State Government. Since the beginning the
village community takes on the stewardship role and offers social fencing to preserve devara
kadus. Thus, the
strength of village community in conservation determines how sacred groves are conserved
and managed for non-consumptive use and existence values.
How are they managed?

The annual devara kadu festivity is the strong binding force for bringing the village community
together. The
temple committee has priest, a fund raiser (Deva Thakka, Bhandra Thakka and others) raise
funds for the festival. An estimated
annual contribution for the Devara Kadu festival is around Rs. 860 per family. The
expected contribution is only around Rs. 170 per family. The
estimated annual festival expenditure per Devara Kadu is Rs.15510. In the festival the
voluntary donations (hundi contributions) from other devotees is around Rs. 13,019
from other visitors. The
management of Devara Kadu is for non-consumptive use value and existence value as nothing
is extracted and mainly religious, spiritual, aesthetic purposes including ecological functions
are served.
5.5.3.2: Existence value of Devara Kadu
Existence value of Devara Kadu refers to the willingness to pay for preservation of a sacred
grove even when there is no physical access to the sacred grove.
Existence value is the willingness to pay even when direct on site interactions between the user
and the Devara Kadu do not occur. Hence interaction is non-consumptive, indirect and off site.
Since we cannot frame a question asking their willingness to pay for preservation even though
there is no access, since no access to the village community is utopian,
Existence value question can be framed as the willingness to pay for preservation of some
other sacred grove, which a planter does not normally visit. This is an unobtrusive proxy for
existence value of a sacred grove, since the question of non-access to a sacred grove is utopian.
Existence value is thus, cognitive (perceptual, psychological, mental),
independent of current and/or future use, a
non use or passive use value. Whether existence value of Devara Kadu is a paternalistic or non-
paternalistic altruism is to be thoroughly discussed. Existence value is reflected in the fees and
voluntary contributions by members of environmental groups for preservation of Devara Kadu
irrespective of access
Coffee a major crop of Kodagu
In Kodagu, shade coffee (Coffea arabica, Coffea robusta) is the major crop. According to a
study by Muthappa, Dept of Agricultural Economics, UAS, Bangalore (2000),
the Simpson’s index of tree diversity ranged 0.8 - 0.89, for an average size of 41 acres of coffee

(range 6 to 300 acres). An
acre of arabica plantation had 281 trees with a stumpage value of Rs. 7.76 lakhs per acre, while
one acre of robusta plantation had 120 trees with a stumpage value of Rs. 5.72 lakhs per acre.
The coffee plantations had
65 tree species and 78 percent of the trees were commercial species.
The major predicament facing the preservation of devara kadu is the encroachment of sacred
groves. The devara kadu committees (temple committees) are now seeking legal intervention.
The encroachment is
influenced by coffee prices. Thus, it is necessary to examine whether
use values dominate
non-consumptive use and existence value or vice versa through a CVM study, which has been
initiated.
The
Non-recognition of non-consumptive use and non-use values results in exploitation
Other institutions contributing to Existence value
????The ‘Jamma’ land tenure is the ‘birth right’ land responsible for preserving devara kadu.
The Jamma lands cannot be sold.
The kodagu family rituals have linkages with devara kadu. For instance, the ancestral home
(Iyyena mane) and ancestor memorial (Kaimada) have institutional linkages with rituals in
devara kadu, which is a unique characteristic of kodagu family culture. If
jamma lands are made saleable, planters can sell the lands to outsiders, who may have no
institution like devara kadu tradition to preserve and may result in large scale conversion of
devara kadus.
This will obviously weaken the institution of devara kadu and leads to its degeneration. There
is institutional failure to preserve the devara kadu as the sense of belongingness is diluted in
some areas of Kodagu. This is reflected in
the lack of judicial and governmental support to temple committees when cases are filed in
courts. Thus, the
trade off between use and non-use values is already on cards. In Garvale, Thalthare shettalli,
Somvarpet, the devara kadu temple committee has exhibited a strong stewardship role and has
restored the encroached devara kadu from other members of village community by
fencing the devara kadu, by imposing fines on encroachers and recording their names in the

committee meeting proceedings, by
village community’s social boycott of the family functions of encroachers, which are all
features of sound environmental activism.
Despite demographic and commercial pressures over time, in many areas, devara kadus
have been preserved indicating ‘survival value’ over time and ‘existence value’ of the
institution.
In some areas people have placed relatively little emphasis on protecting them because they
have neither understood nor appreciated their value. Here perhaps the
the goods and services flowing from natural ecosystems are greatly undervalued by society.
Estimate of existence value
It was estimated that the average contribution to Devara Kadu preservation located outside their
village was Rs. 1410, which is a close proxy of existence value. In addition, five families
donated Rs. 22,466 for Devara Kadu and did not want their name to be documented anywhere.
The temple committees are now insisting for
declaration of Devara Kadu as ” reserved forest sacred grove” incorporating the religious
component, rather than mere “reserved forest” which incorporates only the secular component.
In addition, the
“jamma” land institution should continue and not be diluted so that the local communities
who have strong institution of conserving sacred groves retain the land
C H A P T E R - S I X
ISSUES IN ECONOMIC MANAGEMENT OF BIODIVERSITY
6.1: Treatment of Indian Medicinal system (*With inputs from Damodaran and Sehgal)
6.1.1: Direct Effects of Economic Reforms Process
Ayurvedic (medicinal plants) industry is an age-old important biodiversity-dependent
industry. It is estimated that around 12,000 ayurvedic drug manufacturing units are present in
the country, half of which are unlicensed. The total turnover of the industry was estimated to
be Rs. 4500 crores in 1998. The domestic market is estimated to be growing annually at 15%.
The exports of ayurvedic formulations are also rising. The exports have increased from Rs. 66
crores in 1986-87 to Rs. 447 crores. The Planning Commission has identified ayurvedic herbs
as a major thrust area for exports and the target is to increase the exports to Rs. 3000 crores by
2005 and 10,000 crores by 2010. This will have serious implications for biodiversity unless
mechanisms are developed to ensure sustainable harvest and utilisation of medicinal plants.
Currently, out of 550-600 medicinal plants used by the ayurvedic industry, 80 percent are
procured from the wild areas and only about 10% are from cultivated areas. The industry is
characterized by long supply chains, strong hold of traders. The primary collectors receive only
a small fraction of the final price.
Recently the Department of Indian Medicinal System within the Ministry of Health and
Family Welfare has made special allocations of Rs. 443.65 lakhs to various states for promoting
17 medicinal plant projects under the Non-timber Forest Produce Scheme for the year
2000-2001. The National Afforestation and Eco Development Board implements these projects.
The scheme provides 100% financial assistance to the states for conservation, development and
increasing non-timber forest produce including medicinal plants. The Department of
Agriculture and Co-operation has also rolled out several schemes for the development of
medicinal plants. The most recent rider on this is the Department of Biotechnology.

6.1.2: Examples of some positive initiative by the ayurvedic industry
More than 25 companies in the private sector are engaged in nursery development,
generation of planting material and seeds, development of agricultural techniques for
cultivation of medicinal plants and also initiating encouraged cultivation of medicinal plants by
contracting them to farmers.
Table 6.1:List of Organizations engaged in cultivation of Medicinal HerbsSN Organization R e g i o n o f
ActivityArea(Acres) ND/FC/EC3 Herbs
1. Agrotech Ltd. H a r i d w a r (UP)
Spread over 6 villages
ND/FC Papaya
2. Alembic Gujarat, West Bengal
2000 ND/EC Vasaka
3. A n n u p u r n a Biotech Ltd.
A n d h r a Pradesh
250 ND/FC Aswagandha, Hyoscymus , Black Musli.,
4. Arya Va idya Shala, Kottakal
Cayvery Basin Spread Over Ec/FC S e n n a , V a k u c h i , S h a t a w a r i , Coscinium
5. B a i d y a n a t h A y u r v e d Bhawan
S i v p u r i , L a l i t p u y , (M.P)
100 ND?FC Aswagandha. Whit Musli , Sarpagandha Priyangu
B a i d y a n a t h A y u r v e d Bhawan
Hajipur
6. B a s i l s A g r o Farms Ltd.
Solan (HP), N u r p u r (Punjab)
50 ND/FC A s p a r a g u s , Basils, Thyme, Parsley, Celery
7. B u r r o u g h s welcome
J a m m u & Kashmir
2500 (Spread Over)
FC/EC P r u r a r i a t u b e r o s a , Digitalis
8. Chemiloids Aswaraope t (Khammam)
700 FC S t r y c h n o s , S a d a b a h a r , T y l o p h o r a astham
9. Cipla Ltd. Karnataka & Coimbatore
2000 FC/EC S e n n a , Sadabahar
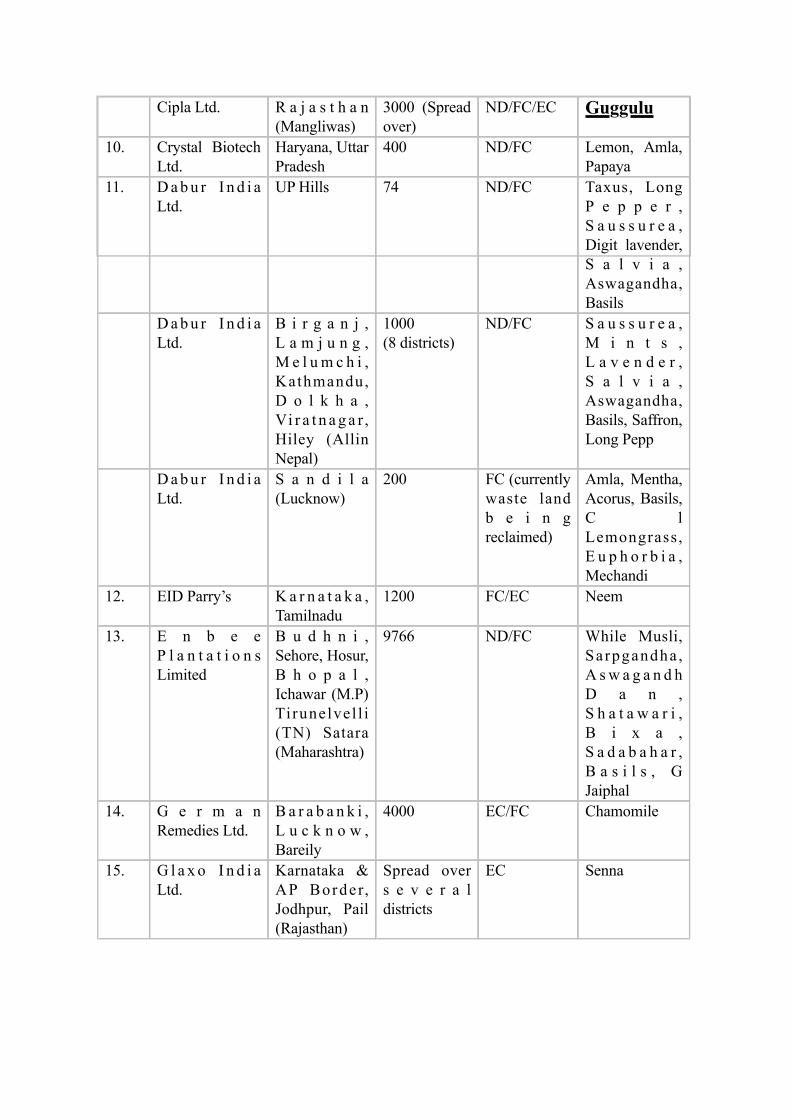
Cipla Ltd. R a j a s t h a n (Mangliwas)
3000 (Spread over)
ND/FC/EC Guggulu
10. Crystal Biotech Ltd.
Haryana, Uttar Pradesh
400 ND/FC Lemon, Amla, Papaya
11. D a b u r I n d i a Ltd.
UP Hills 74 ND/FC Taxus, Long P e p p e r , S a u s s u r e a , Digit lavender, S a l v i a , Aswagandha, Basils
D a b u r I n d i a Ltd.
B i r g a n j , L a m j u n g , M e l u m c h i , Kathmandu, D o l k h a , Vi r a t n a g a r , Hiley (Allin Nepal)
1000 (8 districts)
ND/FC S a u s s u r e a , M i n t s , L a v e n d e r , S a l v i a , Aswagandha, Basils, Saffron, Long Pepp
D a b u r I n d i a Ltd.
S a n d i l a (Lucknow)
200 FC (currently waste land b e i n g reclaimed)
Amla, Mentha, Acorus, Basils, C l Lemongrass, E u p h o r b i a , Mechandi
12. EID Parry’s K a r n a t a k a , Tamilnadu
1200 FC/EC Neem
13. E n b e e P l a n t a t i o n s Limited
B u d h n i , Sehore, Hosur, B h o p a l , Ichawar (M.P) Tirunelvel l i (TN) Satara (Maharashtra)
9766 ND/FC While Musli, Sarpgandha , A s w a g a n d h D a n , S h a t a w a r i , B i x a , S a d a b a h a r , B a s i l s , G Jaiphal
14. G e r m a n Remedies Ltd.
B a r a b a n k i , L u c k n o w , Bareily
4000 EC/FC Chamomile
15. G l a x o I n d i a Ltd.
Karnataka & AP Border, Jodhpur, Pail (Rajasthan)
Spread over s e v e r a l districts
EC Senna
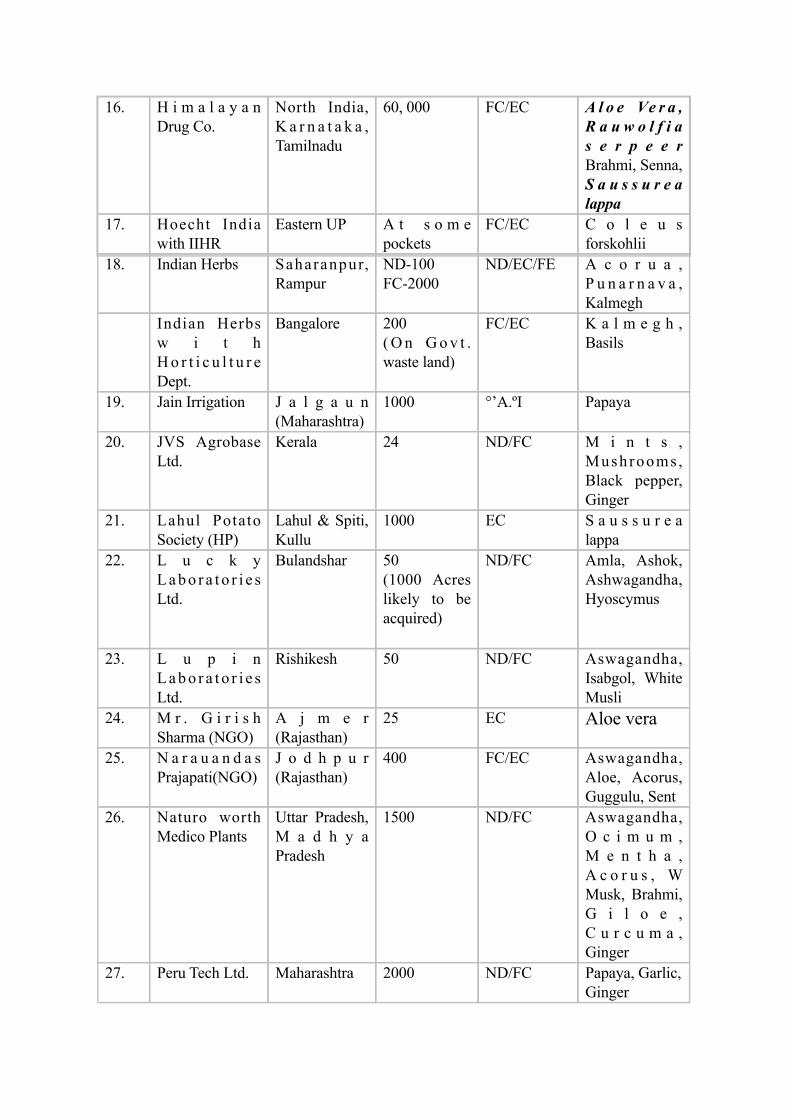
16. H i m a l a y a n Drug Co.
North India, K a r n a t a k a , Tamilnadu
60, 000 FC/EC A l o e Ve r a , R a u w o l f i a s e r p e e r Brahmi, Senna, S a u s s u r e a lappa
17. Hoecht India with IIHR
Eastern UP A t s o m e pockets
FC/EC C o l e u s forskohlii
18. Indian Herbs Saharanpur, Rampur
ND-100 FC-2000
ND/EC/FE A c o r u a , P u n a r n a v a , Kalmegh
Indian Herbs w i t h H o r t i c u l t u r e Dept.
Bangalore 200( O n G o v t . waste land)
FC/EC K a l m e g h , Basils
19. Jain Irrigation J a l g a u n (Maharashtra)
1000 °’A.ºI Papaya
20. JVS Agrobase Ltd.
Kerala 24 ND/FC M i n t s , Mushrooms , Black pepper, Ginger
21. Lahul Potato Society (HP)
Lahul & Spiti, Kullu
1000 EC S a u s s u r e a lappa
22. L u c k y L a b o r a t o r i e s Ltd.
Bulandshar 50(1000 Acres likely to be acquired)
ND/FC Amla, Ashok, Ashwagandha, Hyoscymus
23. L u p i n L a b o r a t o r i e s Ltd.
Rishikesh 50 ND/FC Aswagandha, Isabgol, White Musli
24. M r . G i r i s h Sharma (NGO)
A j m e r (Rajasthan)
25 EC Aloe vera
25. N a r a u a n d a s Prajapati(NGO)
J o d h p u r (Rajasthan)
400 FC/EC Aswagandha, Aloe, Acorus, Guggulu, Sent
26. Naturo worth Medico Plants
Uttar Pradesh, M a d h y a Pradesh
1500 ND/FC Aswagandha, O c i m u m , M e n t h a , A c o r u s , W Musk, Brahmi, G i l o e , C u r c u m a , Ginger
27. Peru Tech Ltd. Maharashtra 2000 ND/FC Papaya, Garlic, Ginger

28. Pepsi Co Punjab/HP 5000 ND/FC Garlic, Ginger, Turmeric
29. Proctor & Gamble
Allover India 100000 EC Mints
30. Save Earth Plantations
Bihar, Haryana
Spreas over several villages
ND/FC/EC Jawa, Lemon, Mints, Aswagandha, Brahmi, us
ND : Nursery Development, FC : Field Cultivation, EC: Encourages Cultivation (including contract cultivation)
6.1.3: Ayurveda in the age of WTO-biodiversity conservation –A case study
The town of Kottakal stands today as the symbol of the Arya Vaidya Shala’s
achievements in healthcare and social work. Ayurveda institutions are changing with the times.
While attempting to keep alive the brand loyalty for its products and services amongst its
traditional clients, these institutions are constantly endeavoring to expand their consumer base
by setting up state-of-the-art factory complexes, advanced centres of learning and well-
equipped nursing homes. The liberalised global trade order exemplified by the World Trade
Organisation agreement is of great purport to these time-tested institutions.
The WTO TRIPS affords a window of opportunity to these enterprises. For instance, the
geographic appellation of the term Kottakal provides a unique opportunity to protect the Arya
Vaidya Shala’s ayurvedic medicines under India’s Geographic Indication of Goods
(Registration and Protection) Act, 1999.
In recent times, the Arya Vaidya Shala has also entered into a MoU with the CSIR for
developing modern standards for its products and processes. The MoU with CSIR would
conceivably strengthen IPR protection for the Vaidya Shala’s new products and enhance the
market share for ayurvedic medicines in the global market place.
In WTO parlance, these measures would be described as market-access facilitation. However,
success of this market-access strategy will depend on the ability of the Arya Vaidya Shala to
sustain its time-tested quest for improving the quality of raw drugs and medicinal plants
through enforcement of strict quality standards and rigorous supply-chain management
systems. Paradoxically, despite the promise heralded by the WTO, ayurvedic centres appear to
be hamstrung. Their unique strength of supply-chain management systems appears to be
weakening in the wake of India’s new forests and biodiversity regulations.

While it is true that the herbal gardens of the ayurvedic pharmacies have contributed to
their raw material supply base, it remains a fact that this cannot substitute the rich reservoirs of
the medicinal plant wealth in the forest areas. Medicinal plants in the wild state are relied upon
for two reasons: (1) the quality of medicinal plant parts (such as roots of Sida rhombifolia)
picked up from the wild is superior in comparison to those “cultivated” off-site, and (2) the
prospects of ex-situ cultivation of medicinal plants by large manufacturers of ayurvedic
medicines is limited in land-scarce Kerala.
Under Clause 7 of India’s draft National Biodiversity Legislation (currently before the
Parliamentary Standing Committee on Science and Technology), a body corporate, association
or organisation registered in India needs to give prior intimation to the State (Government’s)
Biodiversity Board before obtaining any biological resources for commercial utilisation or bio-
survey or bio-utilisation.
The legislation exempts “vaids” and “hakims” from this requirement. Policy-makers
and local communities who have all along felt the adverse effects of erosion of genetic and
biological materials (including medicinal plants and herbs) on account of unscrupulous traders
and other middlemen have rightful reasons to advocate this restriction. Ayurvedic institutions,
on their part, find this clause to be problematic, as it would disrupt the smooth flow of quality
medicinal plants from forests. This, in turn, could severely hamper their ambition of enhancing
their presence in the global medicine markets. Further, those ayurvedic institutions, which are
trusts, cannot be equated with non-public limited companies. They are swadeshi in spirit with
strong traditions of charity work. They have sustained the traditions of ISM. In addition, these
institutions source a large proportion of their raw materials from Girijan Cooperative Societies
and SC/ST federations which are entities set up by state governments to pool non-timber forest
produce collected by tribals and other weaker sectors.
Given the government of India’s positive approach to international promotion of
ayurvedic medicines, it is essential that the core strengths of ayurvedic institutions in relation to
supply-chain management are further enhanced. For this to be achieved, there ought to be
facilitating changes in the proposed National Biodiversity Legislation.
The Biodiversity Legislation should distinguish traditional from non-traditional bio-
utilisation systems and categorise ISMs as traditional bio-utilisation systems. Lastly, the

Biodiversity Legislation should distinguish different intermediaries and collectors of medicinal
plants from forests.
Sale of medicinal plants by Girijan cooperatives and related federations should not be
equated with sales of these raw materials effected by private traders and middlemen.
Accordingly, the “prior intimation” provision of Clause 7 of the proposed Biodiversity Act
should not apply to the former. It should be even considered whether cooperatives and
federations of the state government, which pool non-timber forest produce from tribals, should
ever be subjected to the requirement of producing legally-procured certificates, prior to
transacting raw materials relevant to ISM enterprises.
(Damodaran, 2001)
6.2: Stake holder Analysis (*with main inputs from Sigh and Hegde,2001)
6.2.1: Participatory Approach
The total economic values of forest and natural areas arise from demands placed on
their services by different stakeholders. One can discern at least three broad categories of
stakeholders for bio-diversity services as, the local, the ‘national’ and the ‘global’. A forest
area, if left undisturbed, undergoes a successful process of ecological succession to attain a
state of climax beyond which evolution ceases. This climax stage could represent a high
degree of species, genetic and habitat diversity, or a high quality bio-diversity service. The
problem is that not all the three stakeholders mentioned above, may have the same degree of
interest in a forest ecosystem attaining its optimum bio-diversity potential, as illustrated below: I. A local community, which derives its NTFP’s from a forest area could profit from
its undisturbed and high bio-diversity state. However, their over-extractive consumptive use of staple food items and energy biomass etc., may not have any bearing on the bio-diversity potential.
II. A ‘regional’ or a ‘national’ community, which may have a stake in the watershed functions of a forest area may not per se be interested in optimising the consumptive use values of local communities. Indeed, the regional and national communities could be prioritising development projects such as irrigation and hydel reservoirs (e.g., Sardar Sarovar Project).
III. The global community comprising of pharmaceutical and agro-biotech companies and green philanthropic associations may have a stake in bio-diversity services for their own sake. They may have scant regard for consumptive use values of the locals or watershed functions entailed by the regional and national. Indeed, they would prefer to eliminate these use value and non-use value functions, in case these
values are seen to interrupt the ecological succession towards the climax state.
In other words, stakeholder interests can conflict when it comes to bio-diversity
services. Different stakeholders have different requirements of bio-diversity services.
Generally, each stakeholder desires to maximise her/his requirements even if it is at the cost of
the requirements of other stakeholders. It is this factor, which makes stakeholder management
of bio-diversity services extremely complex.
6.2.2: What is stakeholder analysis?
Stakeholder Analysis (SA) is an approach and procedure for gaining an understanding
of a process or project mainly from the point of view of key stakeholders, an assessment of
their interests, and the ways in which these interests conflict and affect the process and vice-
versa. SA can help in the design and monitoring of biodiversity conservation projects in several
ways:I. Elicit the interests of stakeholders in relation to the problems that the process is
seeking to address (at the identification stage) or the purpose of it (once it is started).
II. Identify conflicts of interests between stakeholders, which will influence assessment of project riskiness before committing funds (for proposed project activities).
III. Help to identify relations between stakeholders, and enable 'coalitions' of process ownership, sponsorship, and co-operation.
IV. To better address the distributional and social impacts of policies and projects. V. Help to assess the appropriate type of participation by different stakeholders, at
successive stages of the process cycle.
Although stakeholder approach is applied to a wide variety of areas in the development
sector, there are several distinctive characteristics of natural resource management that make
SA particularly relevant to the analysis. It can serve as a means of complementing and
strengthening the policy and project assessment procedures, especially in dealing with
stakeholder interests, where the conventional methods such as cost-benefit analysis are
deficient.
6.2.2.1: When is SA required?

Consideration of the interests of different stakeholders would be useful in almost all
policy making and project design contexts. Following are the key conditions where SA is
likely to be particularly crucial (Grumble and Chan, 1995).
Box 6.1: Where and when SA’s are Relevant
When and where Comments and explanations
In the presence of
Externalities
SA would be applicable where the externalities exist. In a way they
internalise them.
When the property
rights are not clear
SA is more applicable to situations where resources (e.g. forests)
are managed as common property rather than are privately owned;
more particularly where traditional institutions regulating
communal use and management are breaking down; and, where
resources are officially owned by the state but function in practices
as de facto open access resources.
Different levels of
stakeholders with
distinct interests
and agenda.
They include broadly, three levels of stakeholders: local, regional
or national and global. In such contexts, not only the interests in
natural resources but also the cognitive frameworks (knowledge
base, decision making criteria, etc.) and economic circumstances
will vary considerably between stakeholders.
Trade-offs to be
made at the policy
level over the use
and management of
resources
In a situation where national policy objectives encourage
conservation, but local people are primarily interested in
consumption or alternative uses, SA would be convenient.
In all such situations with different institutional arrangements, and at different
levels of planning (national, regional, local and project), SA is directly relevant in
the management of biodiversity conservation.
6.2.2.2: How is SA conducted?

The following major steps are involved in any Stakeholder Analysis.
Step 1: Identifying Key Stakeholders and their Interests.
The thumb rule is to relate each stakeholder with either the problems that the biodiversity conservation project is trying to address or the its stated objectives. This is achieved by preparing a table of stakeholders with their level of functioning (such as primary and secondary) to answer the following questions: (1) Who are the potential beneficiaries; (2) Who might be adversely impacted; (3)Who are the vulnerable groups; (4) Who would be the supporters and opponents; (5) What are the relationships among the stakeholders; (6) What are the stakeholders' expectations of the project; (7) What benefits are likely to accrue; (8) What stakeholder interests conflict with project goals; and (9) What resources would the stakeholders be able to and willing to provide.
Step 2: Determining Stakeholder influence and importance
The influence and importance that a stakeholder can have on the project is reflected in
terms of the over-all effect they can have on the project, such as in deciding what decisions are
to be made or in facilitating or hindering its implementation. ‘Influence’ refers to how powerful
a stakeholder is. ‘Importance’ refers to those stakeholders whose problems, needs, and interests
are the priority of the project. If these "important" people are excluded, and are not assisted,
then the project cannot be deemed a "success".
The questions that are relevant here are: (1) What are the relationships between various
stakeholders; (2) Who has power over whom; (3) How are stakeholders organised, and how can
that organisation be influenced or built upon; (4) Who controls the resources; and (5) Who has
control over information.

Step 3: Drawing out assumptions and risks affecting project design and participation
Based on the interests and expectations of stakeholders along with the influence and power
they can wield on the system, one needs to anticipate their responses before hand in order to
construct the framework for the project. This can be achieved by making certain assumptions
about the behaviour of stakeholders.
Step 4: Formulating a stakeholder participation strategy
It is important to define who should participate and in what ways, and which stage of the
project depending upon the interests, influence and importance of stakeholders.
6.2.3: Recent developments on stakeholder approach at the policy levels
In India, bio-diversity services are offered both by forest and non-forest areas including
agricultural ecosystems. However, the basic focus of bio-diversity services in India has
traditionally been on the protected forest areas of the country. The legal foundation for the
protected forest areas has been provided by the Wildlife (Protection) Act 1972. However, with
India signing the Convention on Biological Diversity in 1992 and with the initiation of the
National Bio-diversity Action Plan by the Government of India in 1998 and now with the
introduction of Biodiversity Conservation Bill of 2000 in the Parliament, the focus is steadily
shifting towards bio-diversity services in non-forest ecosystems as well. Equally noticeable is
the shifting trend since 1992 towards multi-diversity services involving national, local and
global stakeholders, which is aided by the provisions of the Bio-diversity Convention. The
Convention highlights three aspects viz, (a) that State have sovereign rights over biological
resources, (b) that traditional dependence of local communities of biological resources are to be
recognised and respected, and finally, (c) that bio-diversity is a common concern of humankind.
These trends of multi-stakeholdership of biodiversity services in turn have had major police
implications on stakeholder management for bio-diversity services in recent times.

6.2.4: Experience with the Strategy of Singular Stakeholder Management in Protected Areas during 1972 to 1992
Something should be said about the conflict that arose in the stakeholder situation
resulting from the enactment of the Wildlife (Protection) Act, 1972. No doubt that the process
of formation of Protected Forest Areas in the form of National Parks and Sanctuaries, has
received a major fillip in India. By 1996, India had a network of 80 National Parks and 441
Wildlife Sanctuaries, which is one of the largest networks of protected areas in the world
(Neena Singh, 1996). The Wildlife Act prohibits destruction, exploitation or removal of
wildlife or habitat within National Park and Sanctuaries except when permitted by the Chief
Wildlife Warden. This provisions of the Act thus emphasises the principle of singularity of
stakeholdership and Government control seeks to bring all bio-diversity services into an
exogenic management of the protected areas by eliminating the stakeholder rights of the local
communities inhabiting the forests declared as protected area. The implicit assumption of the
Wildlife (Protection) Act 1972 is that ‘State takeover’ of a biologically well endowed area is a
pre-requisite for 'protecting, propagating or developing wildlife in the protected area’ or in
other words, for conserving the bio-diversity of the area. In other words, the philosophy of the
Wildlife (Protection) Act 1972 is that the value of bio-diversity services of a National Park or
Sanctuary is inversely related to its stakeholder base.
The Wildlife (Protection) Act 1972 has not met with unqualified success in sustainably
offering its bio-diversity services. The local communities of National Parks and Sanctuaries
whose rights have been taken away under the provisions of Act have rebelled against the
National Park and Sanctuary authorities in many parts of India. For instance the tribals of
Nagarahole have been fighting against the Nagarahole National Park authorities for restoration
of their rights for collection of minor forest produce such as honey and gooseberry from the
Park (Seidensticker et al., 1999). The nomadic Gujjars have resisted attempts to relocate them
from the Rajaji National Park of Uttar Pradesh and demanded their rights to stay inside the
forest areas. In some cases such as that of Buxa Tiger Reserve in West Bengal protests by local
communities have been on the non-unsuitability of alternative livelihood systems proffered by
the Forest Department such as smokeless chullahs etc. All these protests either reflect
opposition to the principle of singularity of stakeholdership or convey the fact of inadequacy

of compensation offered for settled rights (Anon, 1999). In other words, the state of exogenic
management of bio-diversity services has not been successful in the Protected Area of India.
6.2.5: Experience with the Eco-development Strategy of 1990s
In the 1990s, particularly after the Convention on Biological Diversity, the concept of
‘eco-development’ was floated by the Government of India and incorporated in the World Bank
initiated India-Eco-development project, which is being implemented in 7 National Parks in
India. The World Bank project describes eco-development as a strategy, which aims to
conserve bio-diversity by addressing “both the impact of local people on the protected areas
and the impact of protected area on the local people”. According to the World Bank (1996),
eco-development has two main thrusts: ‘improvement of PA management and involvement of
local people’.
A careful reading and analysis of the World Bank definition of eco-development
indicates that ‘eco-development’ is a two edged strategic weapon of stakeholder management in
Protected Forest Areas. At the government level, eco-development has the potential of
improving the compensation principle implicit in the Wildlife (Protection) Act 1972. The
impact of local people on protected area normally arises from their appropriation of
consumptive use value goods from these areas. Similarly, the (reverse) impact of protected
areas on local communities could take the form of damages caused by wildlife on agricultural
land and crops of local communities staying within or in the fringes of these areas. Eco-
development programmes, which seek to provide alternative biomass and livelihood means has
the potential of compensating the local communities for the loss of rights over Protected Areas
adequately and thereby minimising the local community impacts on Protected Areas. This is
something that the Wildlife (Protection) Act had failed to do in the past. If the scope of eco-
development is restricted to the ‘compensation’ aspect, the programme could paradoxically
strengthen the singular stakeholder principle being enforced through the Wildlife (Protection)
Act. Involvement of the local people under ‘eco-development’ could be interpreted to mean the
role of local communities in the design of eco-development programmes aiming at upholding
the compensation/principle.
However, ‘eco-development’ has a progressive face as well. The ‘co-option’ aspect of

eco-development goes beyond the compensation principle for it requires participation of the
local communities in the management of the national park of Sanctuary. In other words, the co-
option aspect of eco-development represents a higher level of providing bio-diversity services
as it leads to multi-stakeholdership or ‘plurality of stakeholders which forms the basic spirit of
the Convention on Bio-diversity and the National Bio-diversity Action Plan. This may require
amendments to Wildlife (Protection) Act 1972, and particularly those provisions of the Acts,
which seek to stop local community activities from collecting Non-timber and other forest
Produce (Ashish Kothari, 1996). Non-realisation of the co-option aspect of eco-development
could therefore be viewed as a major policy for India in the field of bio-diversity services.
For sustainable bio-diversity services, multi-stakeholdership or plurality of
stakeholdership is desirable and inevitable. But the policy makers in India are armed with the
strengths provided by the convention on Biological Diversity 1992 and the National
Biodiversity Action Plan 1998 to pursue a management strategy leaving out the stake holders
particularly from Protected Forest Areas. The proposed National Legislation on Bio-diversity,
to be adopted by the Indian Parliament needs to further enshrine the principle of multi-
stakeholderhip and endogenising the stakeholders in the management of bio-diversity services
in the interests of its sustainability. In practical terms this would mean involvement of local
communities even in the undisturbed core zones of a National Park. Under the circumstances
of such a management system the bureaucracy of National Parks or Sanctuaries will not be
mere executors of a centrally designed and formulated operational plans as at present. Rather
they will operate as a catalyst of multi-stakeholdership principles and institutions designed to
provide sustainable bio-diversity services.
6.2.6: Stakeholders in Joint Forest Management: Some Lessons
In a typical JFM programme a variety of stakeholders are involved at different levels of
functioning. At the conceptual level they can be grouped as:
(1) Resource user groups; (2) Women and JFM; (3) de facto users under open access regime; (4) User industries; (5) Forest Department
and JFM; (6) Panchayats; (7) NGOs; (8) Donor agencies; and (9) Various Departments in State and Central Governments. These are
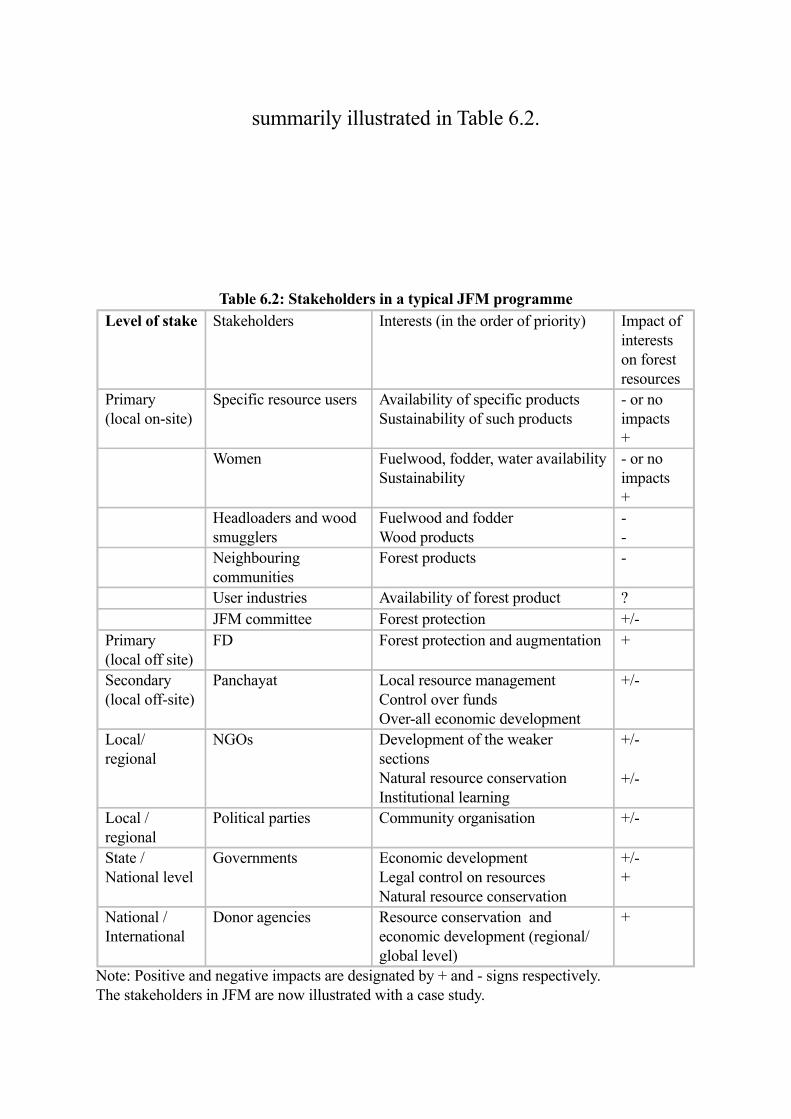
summarily illustrated in Table 6.2.
Table 6.2: Stakeholders in a typical JFM programmeLevel of stake Stakeholders Interests (in the order of priority) Impact of
interests on forest resources
Primary(local on-site)
Specific resource users Availability of specific products Sustainability of such products
- or no impacts+
Women Fuelwood, fodder, water availability Sustainability
- or no impacts+
Headloaders and wood smugglers
Fuelwood and fodderWood products
--
Neighbouring communities
Forest products -
User industries Availability of forest product ?JFM committee Forest protection +/-
Primary (local off site)
FD Forest protection and augmentation +
Secondary (local off-site)
Panchayat Local resource management Control over funds Over-all economic development
+/-
Local/ regional
NGOs Development of the weaker sections Natural resource conservationInstitutional learning
+/-
+/-
Local / regional
Political parties Community organisation +/-
State / National level
Governments Economic developmentLegal control on resources Natural resource conservation
+/-+
National / International
Donor agencies Resource conservation and economic development (regional/ global level)
+
Note: Positive and negative impacts are designated by + and - signs respectively.The stakeholders in JFM are now illustrated with a case study.
6.2.6.1: The case of JFM in Shivalik Hills, Haryana
The seriousness of the problem of land degradation in lower Shivalik hills of Haryana
state came into sharp focus in mid-70s when deforestation in the catchments of Sukhna lake
reaching alarming levels, causing serious problems of soil erosion and siltation (Chopra et al.
1990). A participatory watershed programme was initiated in 1979 in selected villages. Since
the area is very extensively studied and documented, the details of the watershed programme,
local initiatives, progress, management strategies etc., are not presented here. Rather the
specific aspects of stakeholder analysis are addressed here.
The watershed strategy adopted in the region were: (1) Construction of water-
harvesting structures to provide irrigation water to rainfed agriculture; (2) Distribution of water
equally among all the households irrespective of land-ownership, through Water Users'
Association (WUA); and (3) Treatment of and protection of the catchment by constructing silt
detention structures and plantation of trees and grasses.
In a way, it is important to note that some of these villages such as Sukhomajri,
Jattanmajri, Dhamala and Nada had adopted the JFM methodology much before the concept
was even coined in the Ministry of Environment and Forests. Now, after the adoption of JFM
officially, about 80 villages have come under JFM in this region.
The Stakeholder analysis of the HRMS experience is demonstrated briefly in tabular forms (for details, see TP Singh and Ravi Hegde, 2001).
Step 1: The stakeholders are identified along with their interest summarily shown in Table 6.3.
Step 2: Identification of the relative power, influence and importance of the stakeholders are
summarised in Table 6.4.
Step 3: Several assumptions regarding the roles and responses of the stakeholders are made.
Following from the assumptions, Table 6.5 captures the likely project impacts and the
consequent responses of the stakeholders. The striking features are that (a) an apparent match

of interest of most of the stakeholders (shown in Table 6.3), and (b) the likely impacts of the
projects, consistent with their interests and expectations (shown in Table 6.4).
Step 4: The final stage in SA is to formulate a participation strategy for stakeholders as
presented in Table 6.6. The present state of participation and the strategy suggested differ as far
as the link between the HRMS and BPL is concerned. Keeping profitability and sustainability
into consideration, the modifications for the success of JFM are summarily shown in Table 6.7
It can be seen that at the identification stage, the FD should take the initiative and
consult interest groups and the NGO, and forge a partnership with them and the donor agency.
The FD, NGO and the community institution (e.g., HRMS) should begin the project
formulation in consultation with interest groups, Panchayat, BPM (wherever bhabbar is the
major produce, else it is the network of traders) and the donor agency. The over-all
responsibility should be jointly held by the FD and HRMS, and to be assisted by an NGO. At
the implementation stage, the NGO needs to assist the FD and HRMS in implementation,
which would be in partnership with interest groups, donor agency and BPM. The responsibility
of monitoring and internal evaluation would be that of the NGO in partnership with FD and
HRMS, which would consult interest groups, BPM and donor agency.
The above findings could be used either to provide an understanding of the entire
intervention in an ex ante appraisal, or used as basic frame-work for monitoring and evaluation,
and more improved form of JFM. The same approach can be used to other areas where JFM is
still emerging.
6.2.7: What are the likely conflicts in JFM?
There are several conflicts arising in JFM in Shivaliks at various levels; within and between
villages, and within and between societies. The causes of conflicts range from resource
demarcation, benefit sharing, fund-utilisation, financial transparency and so on. Some of
them are major while some minor, but a large number of them have been resolved amicably.
How do the conflicts arise? As the JFM institution matures and becomes more
widespread, the degrees of conflicts are likely to increase. As and when more lucrative range of
NTFPs mature, and the sharing of timber harvests becomes regularised, questions of equity and
distribution of benefits is likely to create new management challenges and conflict resolution
skills (Saxena, et al. 1997; Singh and Varalakshmi, 1998; TERI, 1999). Therefore, conflicts are
liable to increase over resource use between adjoining villages, the landless, non-forest fringe
villages migratory herders, etc. The typical conflict mechanisms in a JFM programme are
depicted in Table 6.8.
There could be largely four general categories of conflicts based on the actors involved
and the relative power they wield: micro-micro, micro-macro, macro-micro or macro-macro
(Conroy et al, 1998 as cited in TERI, 1999). Micro-micro conflicts occur between subgroups of
one protection committee (multiple hamlets, villages, power-groups with in a village, etc.) or
with other communities, but they are more or less on an equal footing. Macro-micro conflicts
arise between stakeholders on an equal footing such as when government agencies like the FD
take decisions that adversely impact micro-level stakeholders such as FPCs. Micro-macro
conflicts arise when the micro-level stakeholders take decisions that go against agreements
worked out with higher level stakeholders (say FD). The failure to ensure protection of a forest
by the participating community would lead to such conflicts. Macro-macro conflicts represent a
difference in objectives between departments, programmes, etc. of the government. For
example, the transfer of ownership rights of NTFPs in scheduled areas to Panchayats might
lead to conflicts between the JFM Programme and Panchayat Raj programme of the
government.
Broadly, there can be two types of approaches that can be applied to stakeholder
interests, conflicts and their resolution. Box 6.3: Conflict Resolution Mechanisms
Round table negotiations Top-down analysisConflict resolution reached through initiative of primary stakeholders, where outsider play a marginal and supportive role
Participation of primary-local stakeholders is minimal.
Table 6.3: Stakeholders in Shivalik JFM
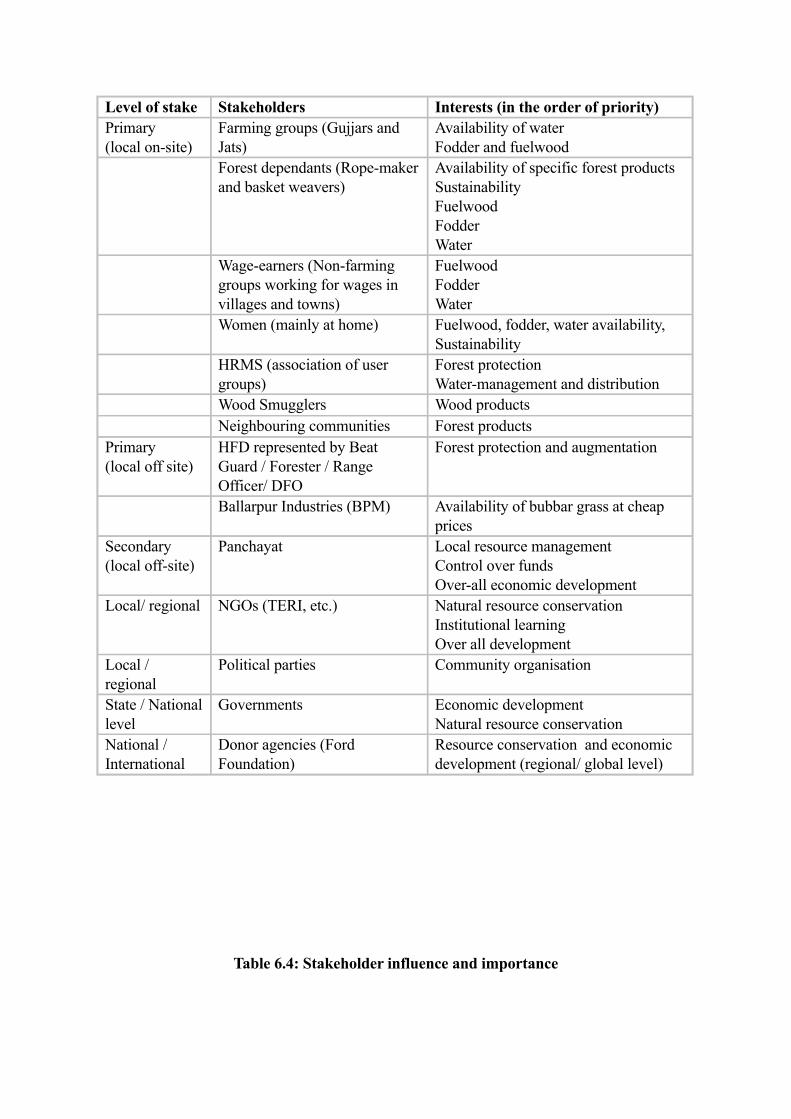
Level of stake Stakeholders Interests (in the order of priority)Primary (local on-site)
Farming groups (Gujjars and Jats)
Availability of waterFodder and fuelwood
Forest dependants (Rope-maker and basket weavers)
Availability of specific forest productsSustainabilityFuelwood Fodder Water
Wage-earners (Non-farming groups working for wages in villages and towns)
FuelwoodFodderWater
Women (mainly at home) Fuelwood, fodder, water availability, Sustainability
HRMS (association of user groups)
Forest protection Water-management and distribution
Wood Smugglers Wood productsNeighbouring communities Forest products
Primary (local off site)
HFD represented by Beat Guard / Forester / Range Officer/ DFO
Forest protection and augmentation
Ballarpur Industries (BPM) Availability of bubbar grass at cheap prices
Secondary (local off-site)
Panchayat Local resource management Control over funds Over-all economic development
Local/ regional NGOs (TERI, etc.) Natural resource conservationInstitutional learningOver all development
Local / regional
Political parties Community organisation
State / National level
Governments Economic development Natural resource conservation
National / International
Donor agencies (Ford Foundation)
Resource conservation and economic development (regional/ global level)
Table 6.4: Stakeholder influence and importance

Level of stake
Stakeholders Degree of influence
Variables affecting the relative power and influence
Degree of importance
Primary (local on-site)
Farming groups High Socio-economic and political statusControl over resources
High
Forest dependants Low Skills HighNon-farming groups Low - HighWomen Low - HighWood Smugglers ?? ?? LowNeighbouring communities
Low ?? Low
BPM High Control over market HighHRMS High Organisation and
leadership (PR Mishra)Control over strategic resources
High
Primary(local off site)
FD represented by Beat Guard / Forester / Range Officer/ DFO
High Authority of leadership Control over strategic resources
High
Secondary (local off-site)
Panchayat ?? Control over resourcesLegal backing
Medium
Local/ regional
NGO High Key knowledgeNegotiating positionPolitical
High (initially)
Local / regional
Political parties ?? Political power Low
State / National level
Governments High Authority Legal powerControl over budget
Low
International
Donor agencies High MonetaryPolitical
High

Table 6.5: Stakeholder responses and rolesLevel of stake
Stakeholders Impact of project Likely response towards project
Resources which would be mobilised by the stakeholders
Primary (local on-site)
Farming groups
Water Fodder and fuelwood
+ Time and effort (individual)
Forest dependants
Bamboo/ BhabbarWaterFodder and Fuelwood
+ Time and effort(individual)
Wage earners Water for saleFodder and FuelwoodIncreased wage (indirectly)
+ Time and effort(individual)
Women WaterFodder and Fuelwood
+ Time and effort(individual)
Wood Smugglers
Non-availability - Nil
Neighbouring communities
Non-availability - Nil
BPM Increased bhabbar availabilityHigher prices for bhabbar
+ / - Uncertain
HRMS Say in resource managementVillage developmentInstitutional learning
+ Time and effort at the community level Monetary (at a later stage)
Primary(local off site)
FD Effective forest conservation and development Job made simple
+ Legal backingMonetary
Secondary (local off-site)
Panchayat Natural resource conservation Village developmentDilution of power and responsibilities
++ -
InstitutionalMonetaryUncertain
Local/ regional
NGOs Natural resource conservation Village development
+ TechnicalLegal
Local / regional
Political parties
Community organization + / - Uncertain
State / National level
Governments Natural resource conservation Village development
+ LegalMonetary

International
Donor agencies
Natural resource conservation Village development
+ MonetaryInstitutional
Note: Positive and negative responses are designated by + and - signs respectively.
Table 6.6: Existing participation matrixType of participation
Who Consult whom Partnership with
Control and Responsibility
Identification FD Interest groups NGO
Interest groupsNGO
FD and HRMS assisted by NGO
Formulation FD and HRMSAssisted by NGO
Interest groups Panchayat
Interest groupsDonor agency
FD and HRMS assisted by NGO
Implementation FD and HRMS facilitated by NGO
NGODonor agency
Interest groupsDonor agency
FD and HRMSFacilitated by NGO
Monitoring and evaluation
NGO Interest groupsHRMSDonor agency
FD and HRMS NGO assisted by FD and HRMS
Table 6.7: Recommended participation matrixType of participation
Who Consult whom Partnership with
Control and Responsibility
Identification FD Interest groups NGO
Interest groups:NGODonor agency
FD and HRMS assisted by NGO
Formulation FD and HRMSAssisted by NGO
Interest groups Panchayat
Interest groupsDonor agencyBPM
FD and HRMS assisted by NGO
Implementation FD and HRMS facilitated by NGO
NGODonor agency
Interest groupsDonor agencyBPM
FD and HRMSFacilitated by NGO
Monitoring and evaluation
NGO Interest groupsHRMSBPM*Donor agency*
FD and HRMS NGO assisted by FD and HRMS
*: These are added to make participation more functional.
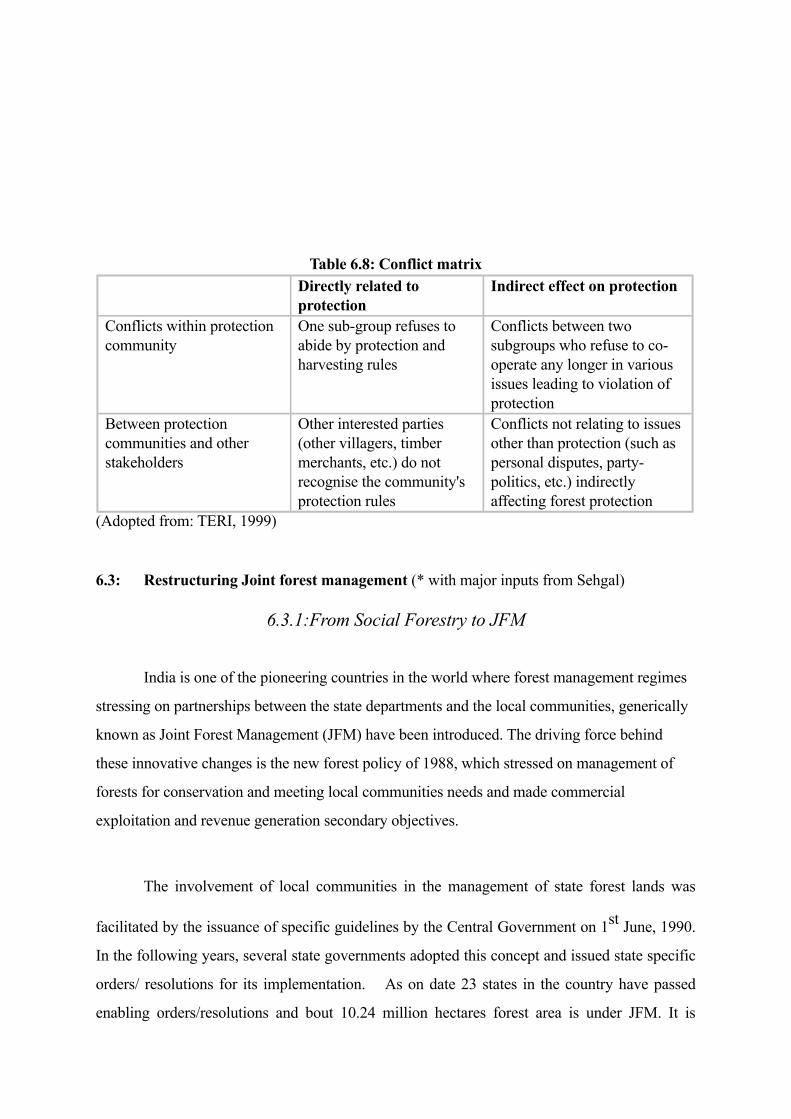
Table 6.8: Conflict matrixDirectly related to protection
Indirect effect on protection
Conflicts within protection community
One sub-group refuses to abide by protection and harvesting rules
Conflicts between two subgroups who refuse to co-operate any longer in various issues leading to violation of protection
Between protection communities and other stakeholders
Other interested parties (other villagers, timber merchants, etc.) do not recognise the community's protection rules
Conflicts not relating to issues other than protection (such as personal disputes, party-politics, etc.) indirectly affecting forest protection
(Adopted from: TERI, 1999)
6.3: Restructuring Joint forest management (* with major inputs from Sehgal)
6.3.1:From Social Forestry to JFM
India is one of the pioneering countries in the world where forest management regimes
stressing on partnerships between the state departments and the local communities, generically
known as Joint Forest Management (JFM) have been introduced. The driving force behind
these innovative changes is the new forest policy of 1988, which stressed on management of
forests for conservation and meeting local communities needs and made commercial
exploitation and revenue generation secondary objectives.
The involvement of local communities in the management of state forest lands was
facilitated by the issuance of specific guidelines by the Central Government on 1st June, 1990.
In the following years, several state governments adopted this concept and issued state specific
orders/ resolutions for its implementation. As on date 23 states in the country have passed
enabling orders/resolutions and bout 10.24 million hectares forest area is under JFM. It is

expected that this figure will continue to rise in the coming years.
The state-wise progress of the JFM programme in different states as on 30th September
2000 is given in Table 6.9:
Table 6.9: Status of JFM in the country
S.No. State Area under JFM (ha.) Number of FPCs1 Andhra Pradesh 1632190.00 65752 Arunachal Pradesh 5285.00 103 Assam 3060.00 1014 Bihar 935065.00 16755 Gujarat 91071.28 7066 Himachal Pradesh 62000.00 2037 Haryana 60733.56 3508 Jammu and Kashmir 79273.00 15999 Karnataka 12800.00 121210 Kerala 4000.00 2111 Madhya Pradesh 5800000.00 1203812 Maharashtra 94727.99 50213 Manipur 1400.00 3514 Mizoram 5870.00 10315 Nagaland 627.00 5516 Orissa 419306.00 370417 Punjab 38991.42 8918 Rajasthan 235634.00 270519 Sikkim 2191.00 9820 Tamil Nadu 224382.00 59921 Tripura 16227.30 15722 Uttara Pradesh 34569.36 19723 West Bengal 490582.00 3431
Total 10249986.41 36165Note: As on 30-09-2000Source: Bahuguna, V.K. 2000. Joint Forest Management Cell. Van Sahyog – JFM Network Newsletter. Vol. 2, Aug.-Oct.
6.3.2: Some new direction needed: Prospects for eco-tourism
The feasibility of sustaining JFM programme through biodiversity conservation linked
benefits (as against fellings) in different parts of the country needs to be explored (e.g., Eco-

tourism initiative in a few FPCs in South-West Bengal – see box below). Emerging
opportunities such as carbon sequestration/trading need to be seriously explored as a way of
sustaining the interest of the community in forest regeneration and protection.
BOX 6.4: Eco-tourism under JFM: Case studyEco-tourism : A new Initiative in South-West Bengal

Eco-tourism has been started as a support activity in two FPCs in Bankura (South) Forest Division – Chenchuriya and Sutan. One of these, Sutan, was visited for a day by the ETS team, the findings of which are briefly summarised.
I. Sutan FPC is located about 60 kms. Away from Bankura town on the Jhilimili road. It comes under the Ranibandh Range of Bankura (South) Forest Division. The FPC has 55 members. The sal forest under the FPC is lush and located on low hills and valleys surrounding the village. The entire forest of the village has now reportedly been put under the Conservation Circle and hence no final felling will be carried out.
II. In order to help people earn some income from the forests, FD has promoted Sutan as an eco-tourism destination. Trekkers’ lodges have been built near the village and an earthen dam built earlier by the FD has been developed for boating and the FD has provided two boats. The FD has also provided some other items such as furniture, utensils and crockery. In all, FD has spent about Rs. 2,50,000 on the development of infrastructure for ecotourism in the village. It has earlier spent about Rs. 40,000 on the construction of the earthen dam.
III. These facilities were opened for public in January 1999. The FD has fixed rent for the Trekkers’ lodge and people can make booking either from the Divisional or the Circle office of the FD. The FD retains the proceeds from the rent. The FPC’s income sources include :
A. Catering;B. Boating;C. Watch and ward services; andD. Local Guidance
I. The FD has fixed the rates for items such as tea, breakfast and main meals. The FPC members supply these items to the tourists at approved rates and make some profit. However, the FPC retains all the income from boating, watch and ward services and local guidance. FPC members are thinking of further enhancing their income by charging parking fee from picnickers and levying entry charge for climbing the Watch Tower that has been constructed by the FD to get a good view of the forest.
II. The FD has introduced the concept of revolving fund and 10 percent of the income eco-tourism is to be kept aside by the FPC into a revolving fund for maintenance of facilities created in the village.
III. The FPC members were in the lodge on a rotational basis as there is not enough work for everyone to be involved. This year ten families have been given the responsibility and next year another ten will take their place. After deducting the 10 percent amount for the revolving fund, the balance is shared between the families working in the lodge and the FPC in the ratio of 80:20.
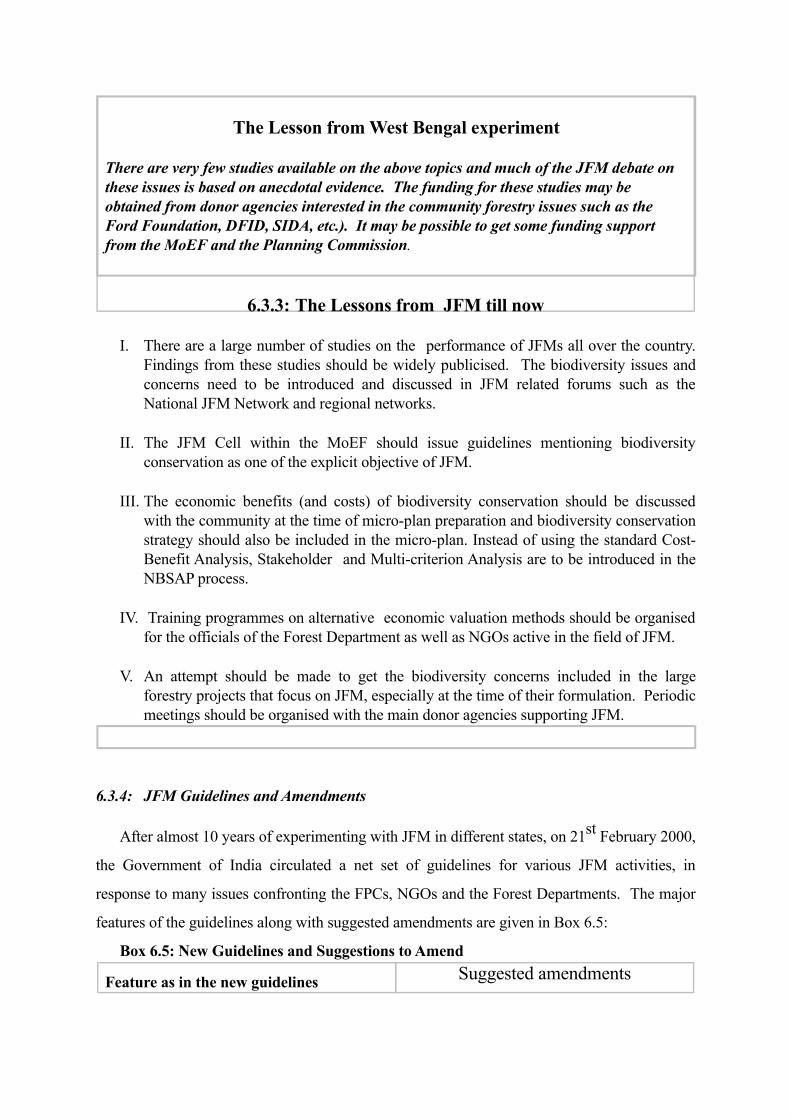
The Lesson from West Bengal experiment
There are very few studies available on the above topics and much of the JFM debate on these issues is based on anecdotal evidence. The funding for these studies may be obtained from donor agencies interested in the community forestry issues such as the Ford Foundation, DFID, SIDA, etc.). It may be possible to get some funding support from the MoEF and the Planning Commission.
6.3.3: The Lessons from JFM till now
I. There are a large number of studies on the performance of JFMs all over the country. Findings from these studies should be widely publicised. The biodiversity issues and concerns need to be introduced and discussed in JFM related forums such as the National JFM Network and regional networks.
II. The JFM Cell within the MoEF should issue guidelines mentioning biodiversity conservation as one of the explicit objective of JFM.
III. The economic benefits (and costs) of biodiversity conservation should be discussed with the community at the time of micro-plan preparation and biodiversity conservation strategy should also be included in the micro-plan. Instead of using the standard Cost-Benefit Analysis, Stakeholder and Multi-criterion Analysis are to be introduced in the NBSAP process.
IV. Training programmes on alternative economic valuation methods should be organised for the officials of the Forest Department as well as NGOs active in the field of JFM.
V. An attempt should be made to get the biodiversity concerns included in the large forestry projects that focus on JFM, especially at the time of their formulation. Periodic meetings should be organised with the main donor agencies supporting JFM.
6.3.4: JFM Guidelines and Amendments
After almost 10 years of experimenting with JFM in different states, on 21st February 2000,
the Government of India circulated a net set of guidelines for various JFM activities, in
response to many issues confronting the FPCs, NGOs and the Forest Departments. The major
features of the guidelines along with suggested amendments are given in Box 6.5:
Box 6.5: New Guidelines and Suggestions to Amend
Feature as in the new guidelines Suggested amendments

Providing legal status to JFM committees: The guidelines stress the necessity for the state governments to register the Village Forest Committees (VFC) under the Societies Registration Act, 1960, to provide legal back up.
VFC’s can also be registered under any local act or rules, but no restriction that they need a clearance from the Conservator of Forests. Instead a MoU should be signed between the forest department and the JFM Committee, clearly empowering the VFC.
Increased participation of women in the programme: Recognising the need to involve all sections of the community, particularly women, it is suggested that the general body should consist of 50% women members, and the Executive Committee, at least 33%.
All the VFC members should be given Identity Cards, to book the offenders. They should be involved in processing of NTFP products and marketing.
Extension of JFM to less degraded areas: Identifying the need to involve people even in less degraded areas, the guidelines suggest that forest areas with >40% crown density could also be brought under JFM. In these areas, the major emphasis will be given to NTFP management and harvesting of timber will be based on the forest working plans. The share of profit from sale proceeds of timber in such forests depends on the involvement of people in forest protection and regeneration.
Some capacity building among the VFC’s is required in understanding the so called Working Plan, life styles and livelihood bas ics , con t ro l o f g raz ing , NTFP management, use of indigeneous knowledge, training in fire prevention, NTFP processing, storage and marketing, even some exposure to GIS based information will be relevant. A seed money on these activities be transferred to the VFC’s.
Micro-plan for JFM areas : Local people, along with forest officials, should prepare the micro-plan in consultation with all the user groups in the village. Adequate importance should be given to each user group, promotion of marketing links and the local industries, based on the production potential of the land and environmental and biodiversity functions.
Training on this must be made compulsory. This be done jointly with the Panchayats, so that the conflicts between them are minimized.
Recognising the self-initiated forest protection groups : The feature gives legitimacy to and recognises the efforts of local self-help groups, which had come into being voluntarily, without any official assistance.
Such members should be given a Green Card of recognizing their role.
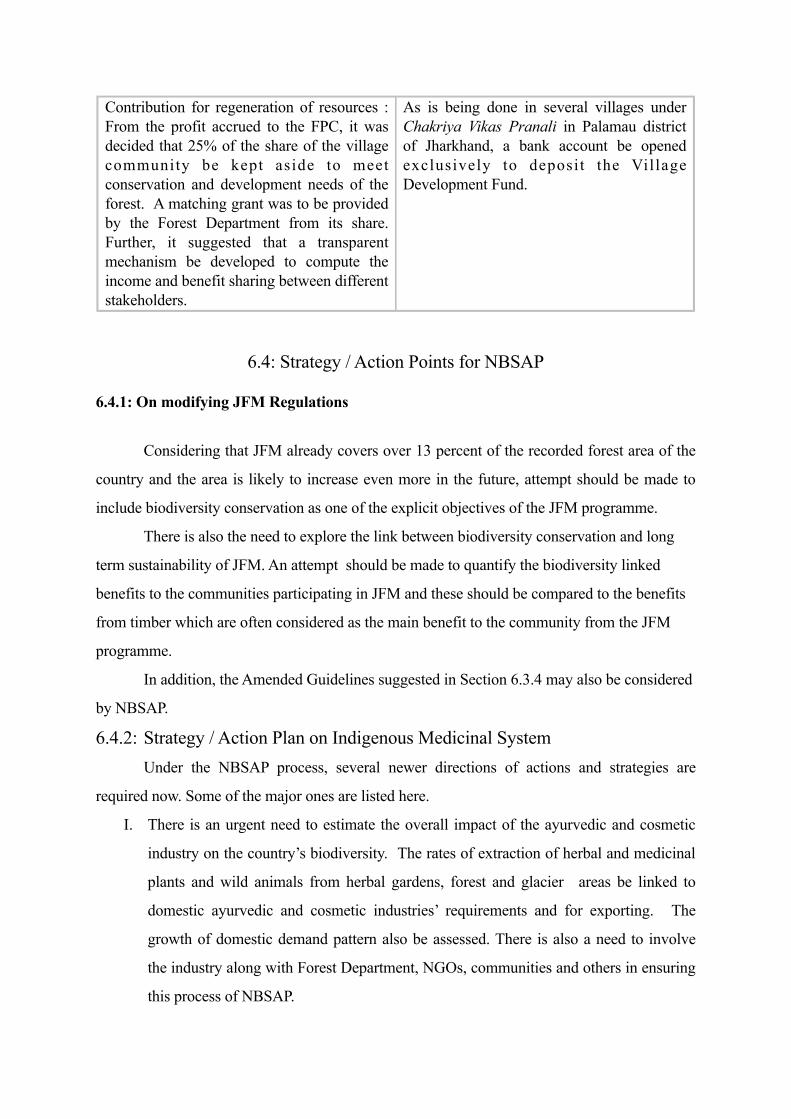
Contribution for regeneration of resources : From the profit accrued to the FPC, it was decided that 25% of the share of the village community be kept aside to meet conservation and development needs of the forest. A matching grant was to be provided by the Forest Department from its share. Further, it suggested that a transparent mechanism be developed to compute the income and benefit sharing between different stakeholders.
As is being done in several villages under Chakriya Vikas Pranali in Palamau district of Jharkhand, a bank account be opened exclusively to deposit the Village Development Fund.
6.4: Strategy / Action Points for NBSAP
6.4.1: On modifying JFM Regulations
Considering that JFM already covers over 13 percent of the recorded forest area of the
country and the area is likely to increase even more in the future, attempt should be made to
include biodiversity conservation as one of the explicit objectives of the JFM programme.
There is also the need to explore the link between biodiversity conservation and long
term sustainability of JFM. An attempt should be made to quantify the biodiversity linked
benefits to the communities participating in JFM and these should be compared to the benefits
from timber which are often considered as the main benefit to the community from the JFM
programme.
In addition, the Amended Guidelines suggested in Section 6.3.4 may also be considered
by NBSAP.
6.4.2: Strategy / Action Plan on Indigenous Medicinal SystemUnder the NBSAP process, several newer directions of actions and strategies are
required now. Some of the major ones are listed here.
I. There is an urgent need to estimate the overall impact of the ayurvedic and cosmetic
industry on the country’s biodiversity. The rates of extraction of herbal and medicinal
plants and wild animals from herbal gardens, forest and glacier areas be linked to
domestic ayurvedic and cosmetic industries’ requirements and for exporting. The
growth of domestic demand pattern also be assessed. There is also a need to involve
the industry along with Forest Department, NGOs, communities and others in ensuring
this process of NBSAP.
II. A comprehensive study needs to be undertaken on the economic impact of ayurvedic
industry on biodiversity conservation (using green accounting principles).
III. A forum to bring together industry, Forest Department, NGOs and others needs to be
established. They should deliberate upon the matters such as rates of extraction,
federating on processing standards and management, pricing system etc.
IV. Ways of encouraging sustainable management, harvest and utilisation of ayurvedic
herbs need to be explored e.g. application of market-based instruments (MBIs) or
Criteria and Indicator (C&I) process for sustainable forest management. At present, the
industry is depending mainly on herbal gardens owned by ayurvedic forms for their
supply of raw materials. But it remains a fact they can not substitute the rich reservoir
of medicinal plants in the forest area. This is because of richness of the forest wild
plants and due to scarcity of land for garden based herbal plantations.
V. The proposed National Biodiversity Legislation should distinguish between
‘corporates’, ‘associates’ and the ‘trusts’ in the matter of access to biological resources.
Secondly, it should distinguish traditional from non-traditional bio-utilisation systems.
Finally, the legislation should distinguish different intermediaries and collectors of
medicinal plants from forests. Sale of such products by cooperatives such as Girijan
Co-operatives and other federations should not be equated with private contractors and
middlemen of drug companies. Accordingly, ‘prior intimation’ provision of clause 7 of
the proposed Biodiversity Legislation Bill should not apply to the former.
Furthermore, the question of them being subjected to producing ‘legally procured
certificates’ prior to transacting the raw materials to the Ayurvedic industry directly be
examined again.C H A P T E R - S E V E N
GAPS IN ECONOMIC APPROACH TO BIODIVERSITY CONSERVATION
7.1: Preamble
The purpose of this chapter is essentially to draw the major limitations in the present
day levels of understandings and applications from economic thinking and approaches. The
gaps are grouped as (i) essentially internal to economic models (such as consistency) and
approaches, (ii) gaps in the levels of understanding about economics among the various stake

holders, and (iii) boundaries of economic approaches requiring multi-disciplinary approaches.
7.2: Missing the stake holders in a market approach
As was discussed in detail in chapter six, the stakeholders in biodiversity conservation
are coming from heterogeneous groups of people and animals. The stakeholders can be broadly
distinguished as beneficiaries and enablers or benevolent citizens. Even among the
beneficiaries the perceptions and stakes are different. The local, regional, national and global
perceptions differ significantly (see chapter six, section 6.2). The enablers’ motivations and
interests are never clearly understood by the beneficiaries and vice-versa (see chapter three,
section 3.6). Hence it is a kind of game that goes on between them (apart from the kinds of
game that goes on between beneficiaries themselves).
At all stages of handling of biodiversity resources, be it at local collections, at the
processing stages in enterprises, or at the export levels, the ‘market’ does not distinguish
between the stakeholders backed up by different perceptions. With pure profit motivation the
exploitation of the locals, traditional breeders, and indigeneous people is obvious. Therefore,
economic models based on ‘market’ approaches are not the best for managing biodiversity
resources. Therefore, at the levels of WTO, national policy making level (say at MoEF level)
and at the corporate sectoral levels some re-thinking has to go on to bridge the gaps in
understanding between the stakeholders.
Take the case of budgetary allocation for biodiversity conservation. This is treated
purely as a state subject, which is conceptually wrong. Corporate sectors can also take part on
this, as much as bilateral donors and multi-national companies under Activities Implemented
Jointly (AIJ) and Clean Development Methods (CDMs). Even the local communities should be
made responsible to own the responsibilities in implementing the budgetary allocations.
Take another example of price formulations and sharing the benefits. This is an
important exercise to be carried out between all the stakeholders, be they the local collectors or
users, regional traders, multinationals and exporters. The government has also to play its
positive role in price negotiations, in setting up of floor prices, in setting up of cooperatives and
training institutions regarding processing and pricing.

One also comes across considerable amount of mis-trust between different
stakeholders: between NGOs and corporate sector; between policy makers and implementers;
between the local and government departments and so on. There is a need to bridge this gap
through joint training camps for all such concerned people.
7.3: Missing perfect methods of ecological valuation
The importance of ecological values has already been stressed in chapter four. To the
extent, the ‘market’ is used as an institution to generate the signals about values, there are some
limitations in valuation of ecological resources. As argued earlier in chapters three and four,
value and price can be two different things. The policy maker is perhaps looking for price and
not value. The people and ecologists in generally are looking for value. Secondly, even if an
enlightened policy maker is interested in values, there are problems of integrating such values
with other economic prices. Some of these problems are highlighted here.
7.3.1: The Institutional Mechanism
One of the greatest problems in valuation of biological resources has been the
availability of data in a format that can be used for analysis and later for the valuation. In fact
most of the problems have arisen because of non-availability of data with economist, which
authenticated and vetted by the ecologists. In this connection what also needs to be mentioned
is the time period required to collect and collate the data on biological systems. However, in
view of the methodology, it is suggested that a number of data types can be made available in a
year's time frame for a region, which will provide a first rate picture of the status of the
biological resources. There are limitations in this process, but at least one can have a reasonably
good idea about ecosystem and its health. Remote sensing data on forests coupled with sampled
ground truthing and Geographic Information System can provide much needed data on forest
types, forest cover, density classes at much faster rates. By using conventional experimental
data and equations productivity data also can be had for the purpose.
It is proposed that such data can be collected at each district or state headquarter
through a properly trained statistical officer, who in turn would supply all the data on land use
and all the above parameters. These Statistical Officers need to undergo training and capacity
building in these areas, which should not be difficult because expertise in generation of data is
available with various institutions in this country.
7.3.2: The Rider
It needs to be mentioned that biodiversity valuation is not even in its infancy and there are
pitfalls and resistance, as always are, in a new subject. Some important points that need to be
borne in mind before the valuation of biological resources is oversimplified. But, it surely
needs to be simplified.
I. There are no uniform processes across board in ecology/biology that can be fitted into a
single equation.
II. Irregularity and specificity of processes and patterns is an integral part of living world;
III. Biodiversity is not a renewable commodity, as very often referred to in literature, as
water is. The death of an individual causes a loss that cannot be renewed by planting
another tree/plant of same type or species;
IV. We must emphasise on the in situ functional aspects of biological diversity as against
the harvested values followed in economics;
V. There is a need to value interactive processes of ecosystems as against individual
contributions, like timber or medicinal plants, etc.;
VI. It must be borne in mind that biological world operates at space time scales varying
between a millionth second to million of years, therefore, species-population
extinctions is not a minor event;
VII.
VIII.
IX.
X. In ecological economics b
iodiversity should be treated as (revenue) productivity instead of conservational liability
and a source of expenditure.

7.4: Gap between research and practice
Economic theory and models are much well developed to deal with a variety of socio-
economic problems. But generally the problems faced are at the stage of their applications.
Take an example of applying Pigovian tax principles for pollution abatement. Given the data
gaps, imperfect information and market situations, extra-market issues such as location,
infancy and nationalism etc., it is some times difficult to apply the optimum tax-subsidy
principles. Then, there are alternative tax-standard approaches or community managed
treatment plants (CETPs) etc. To that extent, other than ‘polluter pay’ principle, ‘polluter
participation’ principle may be practical.
Another issue here is about the gap between research and training. Not all the
developments in the economic spheres are translated in to practice. An example can be that of
cost benefit analysis. Quite often it is mis-understood than understood about the applicability of
this techniques. If applied with all the imputations of social costs and benefits, with shadow
prices etc., it is still a useful tool in decision-making. Most often, only the tangible benefits and
costs are valued, leaving a host of others for guessing. Such a partial analysis of cost-benefit
can be misleading. But proper training for the practitioners of such tools as well as the affected
people will be useful.
One can give many more examples. Take the valuation techniques. Quite often, in the
eager of applying the techniques, one may end up with the problem of double counting
(referred in chapter four). The use of these valuation techniques, avoiding the double counting,
and also working with non-monetised values along with monetised values requires lots of
training of the concerned evaluators.
7.5: Crossing the boundaries:
One major gap in the economic approach is the missing inter-disciplinary approach.
The chapters five and six clearly underline the need for such a collective approach rather than,
any unilaterally taken economic approach. The major reasons for an integrated approach are:
I. It allows for greater scope for appreciating originality in the questions asked and
methodologies to be used, and to allow a more unified research methodology;
II. The accuracy and applicability of such an approach is higher;
III. The assumptions made under economic models can be crossed checked;
IV. The approach is more appealing to policy makers.
But such an inter-disciplinary approach to manage biodiversity is not easy to come by.
The university education system (acting as barriers), the system of journal reporting (restricting
too much to disciplines rather than inter-disciplines), the shyness and hesitations on the part of
scientists and social scientists, all have to change.
CHAPTER EIGHT
ACTION PLAN AND STRATEGIES FOR NBSAP
8.1: Actions towards bridging the gaps and setting the NBSAP process going
This chapter is developed with the intention of high lighting the major steps involved in
the NBSAP process towards the issues raised in this report on Economics and Valuation of
Biodiversity. On the basis of the available methods and tools of environmental economics
(dealt in chapters three and four) and also taking the stock of experience in implementing the
biodiversity conservation and prioritization programme in the country and elsewhere (dealt in
chapters five and six), the action plans developed here are basically addressed to the economic
and social science approaches only. Broadly speaking they can be grouped as:
I. Macro-economic, international, inter-governmental Actions,
II. Sector specific Actions, and
III. Social Actions and Programmes
As far as the gaps mentioned in chapter seven are concerned, they also require specific
action plans and programmes. The specific Actions required in bridging the gaps are:
A. Developing data system to bring the ecological and economic approaches of
valuation together. This has been dealt extensively in Chapter four, section 4.3.
Use of the GIS, and satellite information systems together with greater transparency
in the existing ground level data from the official machineries ( e.g., Forest
departments, Soil conservation departments, Revenue departments) can make it
possible. Central Statistical Organisation apart, other agencies outside of the
government should be made responsible to develop such data banks and
disseminate regularly.
B. When it comes to biodiversity resources, use of appropriate valuation technique
is most important. For this, the users of the biodiversity resources and the promoters
should come together and develop the techniques and parameters of valuation (e.g.,
land productivity, values of soil conservation, watershed development or wetland
development etc., ). This requires a national scheme of research, training, and re-
training for ecologists, social scientists, donor agencies, and policy makers. This
Working Group strongly recommends establishing one such system in any well
established national and regional level institutions.
C. Equally important is to make the whole approach multi-disciplinary, and multiple
agency oriented, bringing all the stakeholders together. This is where, the
government, corporate sector, donor agencies, scientists and social scientists have to
work with the local communities.
With this briefly mentioned broad approaches, the details are mentioned in the
following sections.
8.2: On the external front: WTO, IPRs and TRIPs
As one reads between the lines of the WTO resolutions, there is not much to fear about
any adverse effects of the regulations on Indian Biodiversity conservation. But several
inconsistencies in its implementation need to be looked in to by the NBSAP process.
1. As per the Agreement on Agriculture in WTO, and with the passing of Plant
Variety Protection and Farmers’ Rights Bill in Indian Parliament, a share of profits made from
the new variety goes, on behalf of the communities, into a National Gene Fund. But it is very
much poorly and incompletely written (Section 46 (2) d). The Gene Fund should be the
recipient of all revenues payable to the farming communities under various heads. The use of
the money should not be restricted to conservation or for maintaining ex situ collections. That
would mean that the revenue generated from the use of farmer varieties would partly be used to
maintain the National Gene Bank.
2. The attempt at global standardisation and uniformity by way of TRIPs
agreement is in conflict with the main thrust of the Rio Earth Summit of 1992 that set out the
conditions for sustainable development. These two reveal two contrasting types of international
approaches and norms. While the 1992 Earth Summit and the 1993 convention on bio-diversity
(CBD) focused on ‘diversity’ as being fundamental to sustain life and development, TRIPs and
WTO are pushing for ‘conformity’ to international standardised norms on patents, services,
labour, investment and what not, irrespective of their history, ecology, level of economic
development, etc (WCED, 1990). The areas of intellectual property that the TRIPS agreement
covers are: copy right and related rights; trademarks including service marks; geographical

indications including appellations of origin; industrial designs; patents including the protection
of new varieties of plants; the layout-designs of integrated circuits and undisclosed knowledge
including trade secrets and test data. There is the need for perfect transparency in the patent and
TRIP regulations down to the farmer levels.
8.3: Actions On Government Budget Allocation:
Government Budget allocation for the Ministry of Environment and Forests is at
present a mixed bag. It is at present driven by anthropogenic activities and not by biodiversity
resources, relevant areas and activities. For this purpose, the biodiversity related areas as
shown in Chapter three (Box 3.1) can be used. In order to work out the specific rates of
resource allocation for various components, an Expert Group may have to go in to these. The
degree of criticality of these areas, the livelihood dependency on them, the long term
sustainability of those resources etc., will have to be used as the relevant criteria. Budget
allocation can be based on (i) research and development, (ii) for protection and conservation,
(iii) for promotion and awareness, (iv) for short term and long term planning etc.
Apart from these criteria of biodiversity areas, the number of species of different animal
and plant life can also be considered in making the allocation of resources. After all, under the
plans, resource allocations are normally done on the basis of population. Then why not also on
the basis of biodiversity? In Chapter three (Box 3.2) a broad categorization of such numbers
are shown. These need to be looked in to by an Expert Group to work out the requisite resource
allocations.
Till such time such a formula is worked out, the present Thematic Working Group
recommends maintaining a 3% share of total revenue expenditure and another 3% share in
capital expenditure exclusively for natural resource development in the states. At the MoEF
level, at least 6% of GDP be allocated for all activities including biodiversity, and 3%
exclusively fro forestry and wildlife preservation.
8.4: Sharing the Responsibility on Resource Allocation:

The responsibility of resource mobilization is not only with the government but also lies
with the corporate sector, external donor sector and public at large. This sharing mechanism
also needs to be fully understood and worked out at least once in five years. The same Expert
Group mentioned above also can look in this aspect to. Finally, there is the question of
introducing proper market based instruments to regulate the use of biodiversity related
resources. Specifically in the area of water resource management, use of forest resources, and
marine resources, the types of market-based instruments would differ. Separate studies are
required to be carried out on this issue of appropriate instruments, to look in to who gains and
who loses from such market based instruments.
8.5: Action Oriented Role for the Corporate sector
It is vital that the corporate sector should actively participate in biodiversity
conservation initiatives by accepting responsible roles in implementing and managing various
conservation and sustainable use programmes. A key entry point for corporate sector is through
the country’s national biodiversity planning process where its knowledge and expertise can be
utilized effectively. It would also help corporate sector as its legitimate interests would be
represented in the development of government polices and programs, guidelines and other
management tools. Conservation of biodiversity should be at the heart of the company’s
management strategy. This means, it should help to try to retain natural areas wherever
possible, to restore degraded areas and to harvest resources sustainably. It should also respect
and support the livelihoods and rights of communities dependent on biodiversity, and promote
cultural diversity and values relevant to biodiversity. In fact, the companies may develop a
formal biodiversity policy or incorporate biodiversity into its existing environmental policies. A
stress on labour-intensive methods would be one step in this. Biodiversity strategy and policies
of individual companies should reflect or recognize the national biodiversity strategy, and
should adhere strictly to existing and proposed laws on wildlife and biodiversity. They should
keep abreast of the discussions and developments relating to national guidelines for incentive
measures, biosafety, equitable benefit-sharing, intellectual property rights, monitoring of
biodiversity indicators and other related topics.

In light of the above, it is proposed that corporate sector may be involved in a two-way
process in the NBSAP: to provide inputs into the process, and to learn from it to imbibe and
integrate biodiversity concerns into corporate attitudes, programmes and policies. This can be
attained in one or the other ways listed below:
I. As part of the action plan, the corporate sector will have to act together with the farmers
on at least two counts. First, they will have to get to the business of investing on ’seed
development and supply of infrastructure’; second, they should enter in to a clearly
defined ‘ buy back system, ensuring the right price.
II. They should interact closely with the state and central governments to pickup the
threads hand in hand to promote biodiversity conservation. Financial resource pooling
is one such approach. This is a matter of sharing responsibility in financing biodiversity
conservation between the corporate sector state and central government, a process
initiated by CII already.
III. Corporate sector can develop in-house biodiversity policies and strategies to manage
the biological resources and also respect the concerns of local communities and other
stakeholders. Methods for education and training to instill a biodiversity conscious
culture within company management should be explored. An example is that of TVS
Suzuki cited in Chapter three.
IV. They can share information, knowledge and practices with the local communities
(lessons from examples such as the benefit-sharing arrangement between the Kani tribe,
the Tropical Botanic Garden Research Institute, and the Arya Vaidya Pharmacy Ltd, to
develop a herbal drug based on adivasi knowledge, can be learnt from).
V. They should adopt measures, which ensure sustainable use of biological resources. The
measures may be explored for the moral responsibility of corporate sector going beyond
monetary and material consideration such as respecting the sanctity of critical natural
habitats and threatened species.
VI. They should create awareness regarding the need for appropriate intellectual rights
regimes, respecting the knowledge, innovations and practices of indigenous and local
communities and ensuring that collection and use of biological and genetic resources is
done within a framework/guidelines of such respect.
VII. Engage in active partnership amongst corporate sector, research institutions and

biodiversity conservation organizations as well as with the general public and with local
communities for the management of important species and ecosystems. In this, the
corporate sector needs to accept the guidance of biodiversity specialists and local
communities. The research collaborations should be encouraged to have appropriate
financial agreements, training of/by scientists, and transfer of appropriate technologies.
VIII. Instituting incentives and awards for members of the corporate sector who
adhere to a definition of "progressive" in terms of being biodiversity-friendly and
respectful of local community livelihood rights.
8.6: Action at the Fiscal and monetary Policy levels: On Market based instruments
In practice, neither the economic instruments alone nor the command and control
measures alone feasible in abating environmental degradation. A hybrid approach is feasible.
Fixation of pollution standards (MINAS) apriori by Pollution Control Boards and using either
pollution tax or marketable permits instrument to induce the polluter industry to meet those
standards is a hybrid method using regulatory and economic instruments.
A community based method is yet another alternative. Under this approach, producers
can pool their pollution loads and share to establish a combined effluent treatment plant and
manage the pollution complying with the regulations at a minimum cost. This type of CETP
has been established by now in the textile, leather sectors in certain states in India (e.g., in
Tirpur for textiles, in several places in Tamil Nadu for tanneries).
In India at present, no major innovations on the market based or the hybrid approach
are implemented. The community approach however has been introduced on an experimental
basis in sectors such as textile, chemicals, and leather manufacturing. It is time that a separate
Expert Group is established to go into the feasibilities of the various market based approaches,
sector by sector, and come up with recommendations on their introductions and action plans.
8.7: Action on pricing policies

One can cite hundreds of case studies to elaborate the point that the pricing system for
most of the biodiversity products does not function well (including the cereal crops and some
non-cereal crops whose prices are regulated by the Commission on Agricultural Costs and
Prices of the Ministry of Agriculture). Under the NBSAP process it is intended to reduce such
gaps and margins between the collectors’ price and the market price. One can give four
reasons for this: I. First, for the collectors and local communities it should be an empowerment and
income avenue,II. Second, even the local communities should realize its true worth or value, III. Third, the gains from the natural resource extraction and use should by and large be
based on in-situ distributional benefits,IV. Fourth, it should be corrective for sustainable rates extractions (based on the concept of
carrying capacity), proper use of land and water resources and ecological conservation.
8.8: Strategy and Action Plan on Valuation
The following can be some of the major recommendations for the NBSAP process based on
the methodology of Valuation and the experience widely presented in Chapters four and five).
Studies on economic valuation of various ecological functions of biodiversity should be encouraged. The comparison of values estimated from various sites/areas has to be done with caution. The gap as in this connection is mentioned in Chapter seven.
There should be more research on methodologies for estimating non-use values in India.
The MoEF should initiate to bring out a publication on rapid and cost effective valuation methodologies for valuing biodiversity.
The economic benefits of biodiversity enjoyed by the private sector companies including MNCs require special attention and there should be some mechanism to capture a portion of these benefits for investing biodiversity conservation programmes.
A Social Science based research institution be identified by MoEF, which can undertake studies on valuation on a continual basis, almost on the lines of EIA for project clearance. The institution can also conduct regular training programmes on this and also act as a platform for scientists and social scientists come together regularly to discuss the methodological improvements.
Some of the specific actions required in valuation are:
I. For assessing ecological losses, the structure of the forest ecosystem is to be estimated by three main ecological attributes viz. Importance value Index (IVI), population dynamics and species diversity where as the functioning of the ecosystem is to be ascertained with the help of bio mass studies, litter fall and transfer of mineral within the various biotic and abiotic compartments of the ecosystem.
II. All the forest types, as classified by Champion and Seth (1968) be identified. The major ecological function(s) that a particular forest type is performing at the particular site be identified. Having identified the major ecological function(s) the appropriate methodology of valuation be identified and demonstrated.
III. Specific attempts be made to bridge the data gaps (referred in Chapter seven).
IV. Precisely developed model studies of ecological valuation be developed (to explain the problems of double counting, problems of benefit transfer methods, contingent valuation method, cost benefit analysis etc.).
8.9: Action/Strategies on Natural Resource Accounting.
As presented in Chapter four and five, the progress on this at the national scale is very
much limited. Only for some selected regions ( e.g., Yamuna basin) or states (e.g., Goa)
attempts are made in this direction. The implementation of an NRA at the national and state
levels is the responsibility of respective Statistical organisation and Directorates of Economics
and Statistics. Some of the lessons fro the on-going exercises are listed here for further actions.
I. First, the data base requirements for Natural Resource Accounting are quite high. Central Statistical Organisation should have a separate wing to collect the necessary data exclusively for natural resource accountings.
II. Second, more and more studies on valuation be built-in the NBSAP process to address to aspects such as depletion, degradation, preservation, inter-generational values, dose-responses etc.
III. Third, the National Sample Survey, having engaged in a survey of environmental
status (e.g., common property resources in NSS 50th Round) of the economy, together with demographic and health status data from various other sources can be used to develop some of the parameters for NRA.
IV. Fourth, environmental economists and statisticians should continue to demonstrate the possibilities to adjust the domestic products for all the natural resource related issues, some of which may not directly appear in the traditional income accountings (e.g., biodiversity). Certainly, a long way to go further before a complete SEEA is available for policy planning for India.
8.10: Strategy/ Actions on Indian medicinal systems
******NEW*****
Under the NBSAP process of policy formulation, several newer directions of actions and
strategies are required now. Some of the major ones are listed here.
I. There is an urgent need to estimate the overall impact of the ayurvedic and cosmetic
industry on the country’s biodiversity. The rates of extraction of herbal and medicinal

plants and wild animals from herbal gardens, wetlands, grasslands, forest and glacier
areas be linked to domestic ayurvedic and cosmetic industries’ requirements and for
exporting. The growth of domestic demand pattern also be assessed. There is a need
for mandatory disclosure of sources, quantity, methods of extraction of medicinal
plants by each company, as also the terms under which the local people are employed
for the extraction. Also to involve the industry along with Forest Department, NGOs,
communities and others in ensuring this process of NBSAP policy formulation.
II. A comprehensive study needs to be undertaken on the economic impact of ayurvedic
industry on biodiversity conservation (using green accounting principles).
III. A forum to bring together industry, Forest Department, NGOs and others needs to be
established. They should deliberate upon the matters such as rates of extraction,
federating on processing standards and management, pricing system etc. The National
Medicinal Plants Board or National Bio-resources Board can act as such a forum. The
latter can regulate export of medicinal palnts and products.
IV. Ways of encouraging sustainable management, harvest and utilisation of ayurvedic
herbs need to be explored e.g. application of market-based instruments (MBIs) or
Criteria and Indicator (C&I) process for sustainable forest management. At present, the
industry is depending mainly on herbal gardens owned by aurvedic forms for their
supply of raw materials. But it remains a fact they can not substitute the rich reservoir
of medicinal plants in the forest area. This is because of richness of the forest wild
plants and due to scarcity of land for garden based herbal plantations.
V. The proposed National Biodiversity Legislation should distinguish between
‘corporates’, ‘associates’ and the ‘trusts’ in the matter of access to biological resources.
Secondly, it should distinguish traditional from non-traditional bio-utilisation systems.
Finally, the legislation should distinguish different intermediaries and collectors of
medicinal plants from forests. Sale of such products by cooperatives such as Girijan
Co-operatives and other federations should not be equated with private contractors and
middlemen of drug companies. Accordingly, ‘prior intimation’ provision of clause 7 of
the proposed Biodiversity Legislation Bill should not apply to the former.
Furthermore, the question of them being subjected to producing ‘legally procured
certificates’ prior to transacting the raw materials to the Ayurvedic industry directly be
examined again.

8.11: Strategy/Action regarding Joint Forest management
Considering that JFM already covers over 13 percent of the recorded forest area of the
country and the area is likely to increase even more in the future, attempt should be made to
include biodiversity conservation as one of the explicit objectives of the JFM programme.
Some of the major actions needed are:
I. There is also the need to explore the link between biodiversity conservation and long
term sustainability of JFM. An attempt should be made to quantify the biodiversity
linked benefits to the communities participating in JFM and these should be compared
to the benefits from timber which are often considered as the main benefit to the
community from the JFM programme.II. There are a large number of studies on the performance of JFMs all over the country.
Findings from these studies should be widely publicised. The biodiversity issues and concerns need to be introduced and discussed in JFM related forums such as the National JFM Network and regional networks.
III. The JFM Cell within the MoEF should issue guidelines mentioning biodiversity conservation as one of the explicit objective of JFM.
IV. The economic benefits (and costs) of biodiversity conservation should be discussed with the community at the time of micro-plan preparation and biodiversity conservation strategy should also be included in the micro-plan. Instead of using the standard Cost-Benefit Analysis, Stakeholder and Multi-criterion Analysis are to be introduced in the NBSAP process.
V. Training programmes on alternative economic valuation methods should be organised for the officials of the Forest Department as well as NGOs active in the field of JFM.
VI. An attempt should be made to get the biodiversity concerns included in the large forestry projects that focus on JFM, especially at the time of their formulation. Periodic meetings should be organised with the main donor agencies supporting JFM.
Since a new guideline for JFM is under preparation, possible modifications on the
existing ones are listed.

New Guidelines and Suggestions to Amend
Feature as in the new guidelines Suggested amendmentsProviding legal status to JFM committees: The guidelines stress the necessity for the state governments to register the Village Forest Committees (VFC) under the Societies Registration Act, 1960, to provide legal back up.
VFC’s can also be registered under any local act or rules, but no restriction that they need a clearance from the Conservator of Forests. Instead a MoU should be signed between the forest department and the JFM Committee, clearly empowering the VFC.
Increased participation of women in the programme : Recognising the need to involve all sections of the community, particularly women, it is suggested that the general body should consist of 50% women members, and the Executive Committee, at least 33%.
All the VFC members should be given Identity Cards, to book the offenders. They should be involved in processing of NTFP products and marketing.
Extension of JFM to less degraded areas: Identifying the need to involve people even in less degraded areas, the guidelines suggest that forest areas with >40% crown density could also be brought under JFM. In these areas, the major emphasis will be given to NTFP management and harvesting of timber will be based on the forest working plans. The share of profit from sale proceeds of timber in such forests depends on the involvement of people in forest protection and regeneration.
Some capacity building among the VFC’s is required in understanding the so called Working Plan, life styles and livelihood bas ics , con t ro l o f g raz ing , NTFP management, use of indigeneous knowledge, training in fire prevention, NTFP processing, storage and marketing, even some exposure to GIS based information will be relevant. A seed money on these activities be transferred to the VFC’s.
Micro-plan for JFM areas : Local people, along with forest officials, should prepare the micro-plan in consultation with all the user groups in the village. Adequate importance should be given to each user group, promotion of marketing links and the local industries, based on the production potential of the land and environmental and biodiversity functions.
Training on this must be made compulsory. This be done jointly with the Panchayats, so that the conflicts between them are minimized.
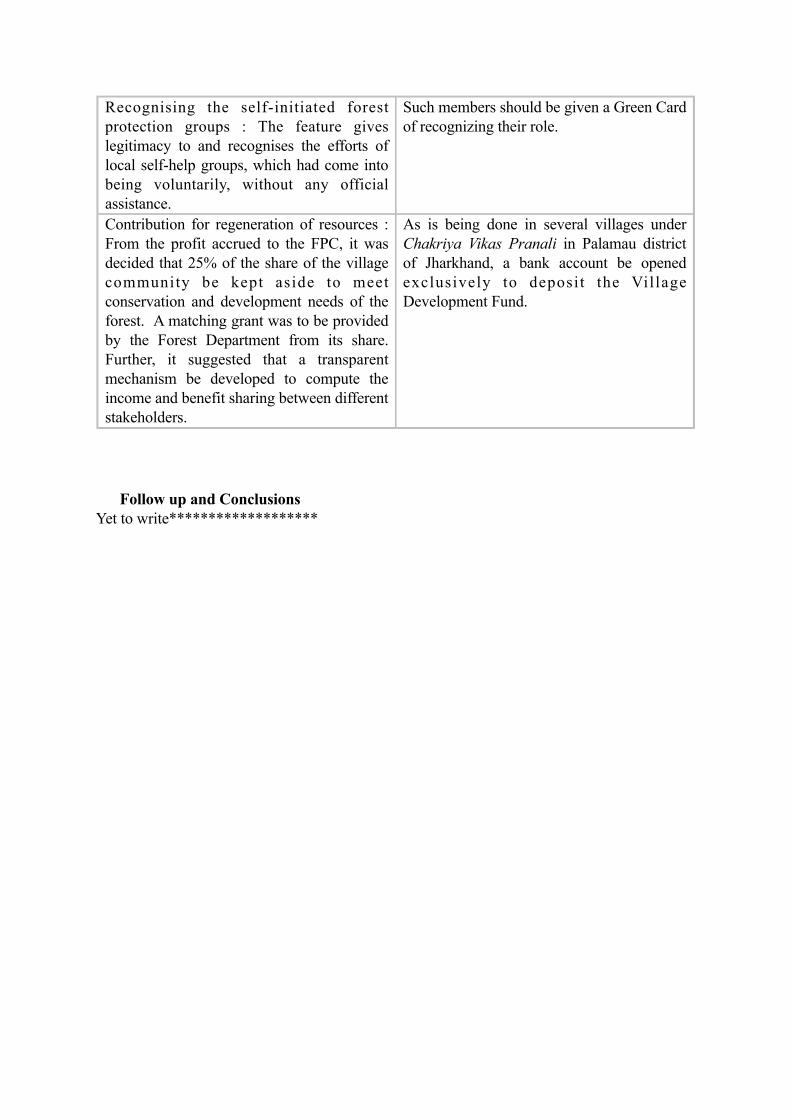
Recognising the self-initiated forest protection groups : The feature gives legitimacy to and recognises the efforts of local self-help groups, which had come into being voluntarily, without any official assistance.
Such members should be given a Green Card of recognizing their role.
Contribution for regeneration of resources : From the profit accrued to the FPC, it was decided that 25% of the share of the village community be kept aside to meet conservation and development needs of the forest. A matching grant was to be provided by the Forest Department from its share. Further, it suggested that a transparent mechanism be developed to compute the income and benefit sharing between different stakeholders.
As is being done in several villages under Chakriya Vikas Pranali in Palamau district of Jharkhand, a bank account be opened exclusively to deposit the Village Development Fund.
Follow up and ConclusionsYet to write*******************

BIBLIOGRAPHY
Achar, K. P.(1997): Documenting Peoples Knowledge and Priorities for Biodiversity and Conservation through People’s Biodiversity Register: A case study of Mala Village Panchayat, Karkala Taluk, Karnataka. W.W.F. – India, New Delhi; KSCST, Bangalore and Bhuvanendra College, Karkala.
Akbari, H., S. David., S. Dorsano, J. Huang and S. Winnett (1992): Cooling Our Communities: A Guidebook on Tree Planting and Light-Coloured Surfacing, US EPA Office of Policy Analysis, US Superintendent of Documents, Washington, D.C.
Adamowicz, W., J. Louviere, and M. Williams (1994): ‘ Combining Revealed and Stated Preference Methods for Valuing Environmental Amenities’, Journal of Environmental Economics and Management, vol. 26, pp. 271-292.
Agarwal, Anil and Sunita Narain (1997): Dying Wisdom: Rise, fall and potential of India’s traditional water harvesting system, Centre for Science and Environment, New Delhi.
Alfsen, K.H. and B. Torstein (1990), 'Norwegian experience in natural resource accounting Development’, Journal of SID 3(4):119-30.
Anderson, R and M. Rockel (1991): ‘Economic valuation of wetlands’, Discussion paper # 065 American Petroleum Institute, Washington, D C.
Ando, A, J. Camm, S. Polasky and A. R. Solow (1998): ‘Species distributions, land values, and efficient conservation’, Science 279, 2126-2128.
Annandale, N. and S. Kemp (1921): The fauna of an island in Chilika Lake. Records of Indian Museum, 22, pp 313-375
Apogee Research, Inc (November 1996): “Monetary Measurement of Environmental Goods and Services: Framework and Summary of Techniques for Corps Planners”, Evaluation of Environmental Investments Research Program.
Appasamy, Paul P. (1993): “Role of Non-Timber Products in a Subsistence Economy: The Case of a Joint Forestry Project in India”, Economic Botany 47(3), pp.258-267.
Appasamy, Paul (2001): ‘Economic Benefit-Cost Analysis of a proposed solid waste resource recovery plant’, in Kadekodi, G. K. Environmental Economics in Practice: case studies from India, Centre fro Multi-Disciplinary Development (CMDR) Monograph, Dharwad.
Aronsoon T, Johansson Per-Olov, and Lofgren Karl-Gustaf. (1997): Welfare Measurement, Sustainability and Green National Accounting: a growth theoretic approach, Cheltenham: Elgar.
Aronsoon, T., Johansson, Per-Olov, and Lofgren, Karl-Gustaf (1992):‘Deforestation and Natural Accounting’, Environmental and Resource Economics, 2(5), 1992, pp. 513-22.

Arrow, K. J. and Fisher, A. C. (1974): ‘Environmental preservation, uncertainty and irreversibility,’ Quarterly Journal of Economics, 88, 312-319.
Artuso, A. (1996): ‘ Creating linkages between valuation, conservation and sustainable development of genetic resources’, Paper prepared for the Symposium on the Economics of Valuation and Conservation of Genetic Resources for Agriculture, Centre for International Studies on Economic Growth, Tor Vergata University, Rome, 13-15 May.
Asian Development Bank, (1996): “Economic Evaluation of Environmental Impacts: A Workbook”, Environment Division, Office of Environment and Social Development. Asian Development Bank. Manila, Philippines.Bagchi, Sanjoy, (January 13, 2001). ‘India and the WTO, Sectarian Interests versus the Public Good’, Economic and Political WeeklyBahuguna, V.K. (2000): Joint Forest Management’, JFM Network Newsletter, vol. 2, August-October. Bann, C., (1997): “The Economic Valuation of Tropical Forest Land Use Options”, In The Economy and Environment Programme for Southeast Asia (EEPSEA).
Barbier, E. B.(1993): ‘Sustainable use of wetlands. Valuing tropical wetland benefits: economic methodologies and applications’. Geographical Journal, 150(1), 22-32Barbier, E.B., (1998), ‘Trade in timber based forest products and the implications of the Uruguay Round’, in. Edward B. Barbier: The Economics of Environment and Development, Selected Essays, Edward Elgar Publishing, UK.Barbier, B. Edward, Mike Acreman and Ducan Knowlder, (Ramsar, 1997): “Economic Valuation of Wetlands: a guide for policy makers and planners”, Ramsarwebsite.
Barbier, E. (1989) and Barton 1994 ****????????????
Barbier, E., R. Costanza and R. Twilley, (1991). “Guidelines for Tropical Wetland Evaluation”, CATIE : Turrialba, Costa Rica. 30 May – 2 June, 1991.
Bartelmus, P. (1989): ‘Environmental Accounting and the system of national accounts’, in Ahmed, Y.J., S. EL Serafy and E. Lutz (Eds.):Environmental Accounting for Sustainable Development, The World Bank. Washington, D.C.
Bateman, I. J. and R.K. Turner, (1993): ‘Valuation of the Environment Methods Techniques : The Contingent Valuation Method’ in R. K. Turner (ed), Sustainable Environmental Economics and Management: Principles and Practice, Belhaven Press, London,.
Bathla, Seema (1999): Externalities Impinging on Participatory Forest Management in India, Policy and Joint Forest Management Series:4, World Wide Fund for Natural (India), New Delhi.
Bennett, J. W, (1984a): ‘Using direct questioning to value the existence benefits of preserved

natural areas,’ Australian Journal of Agricultural Economics, 28(2-3), 136-52.
Bhat, D, 1997. Documenting Peoples Knowledge and Priorities for Biodiversity and Conservation: A case study of Kalase village, Sirsi taluka, Karnataka. Sahydri Parisara Vardhini Yedahalli; Karnataka State Council for Science and Technology, Bangalore and BCPP, W.W.F. – India, New Delhi.
Bhat , M and R. Bhatta (2001): An Economic Analysis of the sustainability of marine fish production in Karnataka. Report submitted to Indira Gandhi Institute of Development Research Mumbai (unpublished). Department of Fisheries Economics, University of Agricultural Sciences, College of Fisheries, Mangalore.
Bharadwaj, V.P. (1996), ‘Value of Biodiversity: An Economic Perspective’, In Pushpangadam, P., K.Ravi and V.Shantosh (Eds.):Conservation and Economic Evaluation of Biodiversity, Vol.2, Oxford & IBH Publishing co. Pvt. ltd., New Delhi and Calcutta.
Bishop, R. C., (1982): ‘Option Value : An Exposition and Extension’, Land Economics, 58 (1) : 1-15.
Bishop, R. C. (1978): ‘Endangered species and uncertainty: The economics of a safe minimum standard,’ American Wildlife Journal of Agricultural Economics, August, 685-691.
Bishop, R. C. and Welsh, M. P. (1992): ‘Existence values in benefit cost analysis and damage assessment,’ Land Economics, 68(4), 405-17.
Blamey, R., M. Common and J. Quiggin (1995): ‘ Respondents to contingent valuation surveys: consumers or citizens?’ Australian Journal of Agricultural Economics, vol. 39 (3), pp.262-288.
Bogahawatte, Cyril, (2000) : “Forestry Policy, Non-Timber Forest Products and The Rural Economy In The Wet Zone Forest in Sri Lanka”, from website www.eepsea.org.
Bohm, P., (1975): ‘Option Demand and Consumer’s Surplus : Comment’, American Economics Review, 65(4)” 733-736.
Botanical Survey of India (1983): ‘Flora and Vegetation of India - An Outline’, Botanical Survey of India, Howrah. 24 pp. Botkin, D.B. and C.E. Beveridge (1997): ‘Cities as environments’, Urban Ecosystems, Vol. 1, pp. 2-19
Boyle, K. J. and Bishop, R. C. (1987): ‘Valuing wildlife in benefit cost analyses: A case study involving endangered species,’ Water Resources Research, 23(5), 943-950.
Boulding, K. ***********

Brandon, Carter and Homman, Kirsten (1995): ‘The Cost of Inaction: Valuing the Economy-wide Cost of Environmental Degradation in India’, The World Bank, Asia Environment Division, Washington, D. C.
Brookshire, S. D., Eubanks, S. L. and Randall, A., (1983): ‘Estimating option prices and existence values for wild life resources’, Land Economics, 59(1)” 1-15.
Brouwer, R. (2000): ‘ Environmental value transfer: state of the art and future prospects’, Ecological Economics, Vol. 32 (1), p. 137-152.
Brown, Gardner and Jon H. Goldstein (1984): A Model for Valuing Endangered Species, Journal of Environmental Economics and Management 11, 303-309.
Brown, G. M. Jr. and Goldstein, J. H. (1984): ‘A model for valuing endangered species,’ Journal for Environmental Economics and Management, 11(4), 303-309.
Brush, S., J. Taylor and M. Bellon, (1992): ‘Technology adoption and biological diversity in Andean potato agriculture’, Journal of Development Economics. 39, 365-387
Brush, S. and E. Meng (1996):’ Farmers’ valuation and conservation of crop genetic resources’, Paper prepared for the Symposium on the Economics of Valuation and Conservation of Genetic Resources for Agriculture, Centre for International Studies on Economic Growth, Tor Vergata University, Rome, 13-15 May.Bustard, H.R. (1982). Crocodile breeding project. In Saharia, V.B. (Ed.), Wildlife in India. Natraj Publishers, Dehra Dun. Pp. 147-163. Buchanan (1870)*******
Byerlee, D. R., (1971): ‘Option Demand and Consumer Surplus: Comment’, Quarterly Journal of Economics, 85 (4): 523-27.
CISMHE (1997): ‘Natural Resource Accounting of Yamuna Basin: Biological Resources’, Monograph submitted to Ministry o Environment and Forests, Government of India.
Carson, R.T., E. F. Nicholas, M. M. Kerry and J .L. Wright (1995): ‘Contingent valuation and revealed preference methodologies: Comparing the estimates for quasi-public goods’, Land Economcs,72(1), pp 80-99.
Cernea, M .M and Kudat, A (1997) (eds.): ‘Social Assessments for better development: case studies in Russia and Central Asia’, The World Bank, Washington DC.
Cervigini, R. (1993): ‘ Estimating the benefits for plant genetic resources for food and agriculture. CSERGE, UCL and University of East Anglia.

Cesar, H. (1996): ‘The economic value of Indonesian coral reefs’ World Bank Environmental
Division. , Washington, D.C.Champion, H.G. (1936): ‘A preliminary survey of the forest types of India and Burma’, Indian Forest Record (New Series) 1: 1-286.
Champion, H.G. and Seth, S.K. (1968): ‘A Revised Survey of the Forest Types of India’, Government of India Press, Delhi. 404 pp.
Chishti, S., (April 14-20, 2001 ): ‘India and Ongoing Review of WTO Dispute Settlement System’, Economic and Political Weekly.Chopra, K. (1993): ‘The Value of Non-Timber Forest Products : An Estimation for Tropical Deciduous Forest in India’, Economic Botany 47(3): 251-257.
Chopra, Kanchan (1994): “Valuation and Pricing of Non-Timber Forest Products: A Study for Raipur District of Madhya Pradesh”, Institute of Economic Growth, University Enclave, Delhi, Monograph.
Chopra, Kanchan (1997): ‘The valuation and pricing of NTFP; Conceptual issues and a case study from India’, in Fraser Smith [Ed].Environmental Sustainability. St. Lucie Press, Boca Raton.
Chopra, Kanchan, (April 1998): “Economic Aspects of Biodiversity Conservation : Micro and Macro Strategies for Intervention”, Institute of Economic Growth, Delhi, Monograph
Chopra, K., and Gopal Kadekodi (1997): ‘Natural resource accounting in the Yamuna basin: Accounting for forest resources’ IEG Monograph, New Delhi.
Chopra, Kanchan and Gopal Kadekodi, (1999): ‘Operationalising Sustainable Development: Economic-Ecological Modelling for Developing Countries’, Sage Publications, and New Delhi.
Chopra, K., G.K. Kadekodi, and M.N. Murty, (1990): ‘Participatory Development: People and common property resources’, New Delhi, Sage Publications.
Ciccheti, J. and Freeman II, M. A., (1971): ‘Option Demand and Consumer Surplus : Further Comment’, Quarterly Journal of Economics, 85 (4): 528-39.
Cobb, J.,(1980): ‘Ecology, ethics and theology’, In: Daly, H.E. (ed.): Ecology, economics and ethics, W.H. Freeman and Co., San Francisco.Collins, N.M., Sayer, J. and Whitmore, T.C. (eds.) (1991), ‘The Conservation Atlas of Tropical Forests: Asia and the Pacific’, IUCN, Gland, Switzerland and Cambridge, UK. 256 pp. Costanza, R. , C. Farber, and J. Maxwell, (1989), ‘The Valuation and Management of Wetland Ecosystems’, Ecological Economics, 1 : 335-361.

Coomber, N.H. and A. K. Biswas, 1973, Evaluation of Environmental Intangibles. Geneva Press, New York.
Damodaran, A. (1997): “The Economic of Forest Conservation and Sustainable Development”, Pre-Sem. Socio-economic Research in Forestry, India.
Damodaran, A. (December 1998): “Stakeholder Management Policies for Sustainable Bio-diversity Services in India”, Decision, Vol.25, Nos. 1-4.Damodaran, A (1998): ‘Plant Wealth of India: Economic Dimensions of Patenting and Plant Varieties Protection’, forthcoming in Proceedings of National Seminar on Spices and Medicinal Plants, Indian Institute of Spices Research, August 10-12, Calicut.
Damodaran, A (1998): ‘Economics of Plant Patents and Plant Variety Protection: Sui-Generic Options for India’, Working Paper No 9823, Indian Institute of Plantation Management, Bangalore.
Damodaran, A. (March 27-April 2, 1999): ‘Regulating Transgenic Plants in India, Biosafety, Plant Variety Protection and Beyond.’, Economic and Political WeeklyDamodaran, A. (April 2001), “Ayurveda in the Age of WTO-biodiversity Conservation”, The Economic Times, Bangalore.
Daniel, R.J. (1996), ‘Economics of Biodiversity: An ecological perspective’, In Pushpangadan, P., K.Ravi and V. Shantosh (Eds.): Conservation and Economic Evaluation of Biodiversity, Vol.2, Oxford & IBH Publishing co. Pvt. ltd., New Delhi and Calcutta.Dasgupta, Biplab (1976): Agrarian Change and the New Technology in India, United Nations Research Institute for Social Development, Geneva.
Dasgupta, B., (April 17-24, 1999): ‘Patent Lies and Latent Danger: A Study of the Political Economy of Patent in India’, Economic and Political Weekly.Dasgupta, P and G.M. Heal, (1979): Economic Theory of Exhaustible Growth Delhi : Oxford University Press.
Dasgupta, Purnamita (2001): “Valuing Health Damages from Water Pollution in Urban Delhi, India: A Health Production Function Approach”, Institute of Economic Growth, Delhi, Working Paper Series No. E/210/2001.
Dasgupta, P., B. Kristrom, and K-G Maler (1994), 'Current issues in resource accounting', Beijer Discussion Paper Series, No. 47, The Royal Swedish Academy of Sciences, Stockholm.
Dixon, John A. (May 2001), “The Good, The Bad, And The Ugly ----, Lessons on the Application of Benefit Transfer in the Field”, The World Bank, SANDEE Meeting.
Dixon, John and P.B. Sherman (1990): Economics of Protected Areas: a new look at Benefits and Costs, Earthscan Publications, London.
Drucker, Adam G, Veronica Gomez and Simon Anderson, (2001): “The Economic Valuation of

Farm Animal Genetic Resource : A Survey of Available Methods”, Ecological Economics Vol. 36, pp. 1-18.
ECLAC (UN Economic Commission for Latin America and the Carribbean (1994): Policies to Improve Linkages with the Global Economy, Santiago, Chile.
ECOBP (European Campaign on Biotechnology Patents) (1998): Guide for the Second Reading on the European Life Patent Directive, Brussels. International Institute of Environment and Development (IIED), (1994): Economic Evaluation of Tropical Forest Land Use Options : A Review of Methodology and Applications, Environment Economic Programme Monograph, London Eiswerth, M. E. and J. C. Haney (1992): ‘Allocating conservation expenditures: accounting for inter-species genetic distinctiveness’, Ecological Economics, 5, 235-249.
El Serafy, S. (1989): ‘The proper calculation of income from depletable nature resources’ : In Environmental Accounting for Sustainable Development, edited by Y J Ahmed, S El Serafy, and E Lutz, Washington, DC: The World Bank.FAO/UNEP (1981): ‘Tropical forest resources assessment project’, Technical report No. 3. FAO, Rome. Fishers, A. C., and Krutilla, J. V. (1985): ‘The Economics of Nature Preservation’, in A. V. Kneese and J. L. Seeney (eds.) Handbook of Natural Resources and Energy Economics, Vol. 1, North Holland Publication, Amsterdam, pp. 165-89.
Folke, C. and Kautsky, (1996): The ecological footprint concept for sustainable seafood production: a review. Paper presented at the conference “Ecosystem Management for Sustainable Marine Fisheries” Monterey, California,
Freeman, A. M. (1979): The benefits of environmental improvement: Theory and practice, Baltimore : Johns Hopkins University Press.
Freeman, A.M. (1991): ‘Valuing Environmental Resources under alternative management regimes’, Ecological Economics, vol.3, p.247-256.
Freeman, A.M. (1993): The Measurement of Environmental and Resource Values: Theory and Methods, Resources for the Future, Washington, D.C.
Gabel Shogren, J. F., Seung, S. Y., Hayes, D. J and Kliebenstein, J. B 1994, ‘Resolving differences in willingness to pay and willingness to accept,’ American Economic Review, 84(1), 255-270.Gadgil, Madhav (1989): ‘The Indian heritage of a conservation ethic’, In: Allchin, B., Allchin, F.R. and Thapar, B.K. (Eds.), Conservation of the Indian Heritage. Cosmo Publishers, New Delhi. Pp. 13-21. Gadgil, M., Documenting Diversity: An Experiment. Current Science. (70) 1: 36-44
Garrod, Guy and Kenneth G. Willis (1999), Economic Valuation of the Environment : Methods

and Case Studies, Edward Elgar, Cheltenham, UK.
Goeschl, Timo and Timothy Swanson (2002): ‘The social value of biodiversity for R & D’, Environmental and Resource Economics, 22, 477-504. Gollin, D. and R. Evanson (1998): ‘An application of Hedonic Pricing Methods to Value Rice Genetic resources in India’, chap 9 in : R. Evanson, D. Gollin and V. Santaniello, Agricultural Values of Plant Genetic Resources, Published by CAB International, Oxford.
Goossling, Stefan (1999): “Ecotorism: A Means to Safeguard Biodiversity and Ecosystem Functions?”, Ecological Economics 29, 303-320.Government of India (1985): ‘Research and Reference Division Ministry of Information and Broadcasting’.
Government of India (1996): Hand Book of Fisheries Statistics 1996, Ministry of Agriculture,
Department of Agriculture & Cooperation (Fishery Division) New Delhi.
Gowdy, J. M., (1997): ‘The Value of Biodiversity: Markets, society and Ecosystems’, Land Economics, 73(1): 25-41.
Greenley, D. A., Walsh, R. G and Young, R. A., 1981, ‘Option Value: Empirical Evidence from a case study of recreation and water quality’, Quarterly Journal of Economics, 95(4): 657-73.
Grey, L.C. (1914): ‘Rent Under the Assumption of Exhaustibility’, Quarterly Journal of Economics, 28, pp. 466-89.
Grieg-Gran Maryanne, (December 2000): “Fiscal Incentives for Biodiversity Conservation: The ICMS Ecological in Brazil”, International Institute for Environment and Development, Environmental Economic Programme, Discussion Paper 00-01.
Grimble, M and Chan, M., (1995): ‘Stakeholder analysis for natural resource management in developing countries: some practical guidelines for making management more participatory and effective’, Natural Resource Forum 19(2): pp. 113-124.Groombridge, B. (1983): ‘Comments on the rain forests of southwest India and their herpetofauna’, Paper prepared for the Centenary Seminar of the Bombay Natural History Society, 6-10 December, 1983. 18 pp. Revised, January 1984.
Groombridge, B. (ed). (1993), ‘The 1994 IUCN Red List of Threatened Animals’ IUCN, Gland, Switzerland and Cambridge, UK. lvi + 286 pp. Grote, U, A. K. Basu and N. H. Chau (1999): The international debate and economic consequences of Eco-labeling. Center for Development Research, ZEF Discussion Papers on Development Policy No.18, Bonn.
Hadker, Nandini, Sudhir Sharma, Ashish David, Muraleedharan T. R., S. Geetha and P. G. Babu, (May 1995): “Are People in Developing Countries Willing to Pay for Natural Reserve

Preservation?: Evidence from a CV of the Borivli National Park, Bombay”, Indira Gandhi Institute of Development Research, Discussion Paper No. 121.
Hammond, K. (1996): ‘The status of global farm animal genetic resources’, Paper presented for the symposium on the Economics of Valuation and Conservation of Genetic Resources for Agriculture, Centre for International Studies on Economic Growth, Tor Vergata University, Rome, 13-15 May.
Hanemann, M. (1991) ‘ Willingness to pay and willingness to accept: How much can they differ?’, American Economic Review, vol. 81, p.635-647.
Hanfee, F., (1998): Wildlife Trade: A Handbook For Enforcement Staff. TRAFFIC Trade Reecord Analysis of Flora and Fauna in Commerce), India, New Delhi.
Hanfee, F., (2001): Gentle Giants of the sea TRAFFIC – India / WWF. India, New Delhi. 56p.
Haripriya, G. S. (2001): ‘Integrated Environmental and Economic Accounting: An Application to the Forest Resources in India’, Environmental and Resource Economics, Vol. 19, No. 1, May.
Hartwick, J M. (1992): ‘Deforestation and national accounting’, Environmental and Resource Economics 2(5): 513-522.
Hartwick, J M. 1(990): ‘Natural resources, national income accounting and economic depreciation’: Journal of Public Economics 43: 291-304.
Hausman, J (Ed.): Contingent Valuation: A Critical Assessment, North Holland Publication, Amsterdam.Henry, R J (1997): Practical Applications of Plant Molecular Biology, Chapman and Hall, London. Hoevenagel, R. (1996): ‘ The Validity of the Contingent Valuation Method: Perfect and Regular Embedding’, Environmental and Resource Economics, 7(1), pp. 57-78.
Hotelling, H. (1931), ‘The Economics of Exhaustible Resource’, Journal of Political Economy, 39, pp. 137-75.
Howarth, R. B. (1991): ‘Inter-temporal Equilibria and Exhaustible Resource: An Overlapping Generations Approach’, Ecological Economics, 5(3), pp. 237-47.
Hultkrantz, L. (1991): ' National accounting of timber and forest environmental resources in Sweden', Environmental and Resource Economics 2: 283-305.
Hussain, S. A., K. K. Mohapatra and S. Ali (1984): Avifaunal profile of Chilika lake. Bombay Natural History Society Technical Report, No.4: 46 pages.
Hussain, S. A. (1999): ‘Biodiversity of the Western Ghats Complex of Karnataka’ Resource Potential and Sustainable Utilization, Biodiversity Initiative Trust, Mangalore.

IBWL (1972): ‘Project Tiger. A planning proposal for preservation of tiger (Panthera tigris tigris Linn.) in India’, Indian Board for Wildlife, Government of India, New Delhi. 114 pp.
ICBP (1992): ‘Putting biodiversity on the map: priority areas for global conservation’, International Council for Bird Preservation, Cambridge, UK. 90 pp. International Institute of Environment and Development (IIED), (1994): ‘Economic Evaluation of Tropical Forest Land Use Options: A review of methodology and applications’, Environment Economic Programme Monograph.
Isangkura, Adis, (2000): “Environmental Valuation: An Entrance Fee System for National Parks in Thailand”, From Website www.eepsea,orgIUCN (1986): ‘Review of the Protected Areas System in the Indo-Malayan Realm’, IUCN, Gland, Switzerland and Cambridge, U.K. 461 pp.
IUCN (1987): ‘Centres of Plant Diversity: A Guide and Strategy for their Conservation’, (An outline of a book being prepared by the Joint IUCN-WWF Plants Conservation Programme and IUCN Threatened Plants Unit). Iyar, Sriram K, (2001): ‘Completely at Sea’ ,The Economic Times, May 13, Bangalore p 9.
James, A.J. and M.N. Murty (1998): ‘ Measuring Non-user Benefits from Cleaning Ganges’, Institute of Economic Growth Working Paper No. E/202/1999.
James, P.S.B.R. (1999): “Shrimp Farming Development in India – An Overview of Environment, Socio-Economic, Legal and Other Implications.” Aquaculture Mangazine Online, http://www.ioa.com/~aquamag/html/featart.html
Jodha, N.S. (1986): "Common property resources and rural poor in dry regions of India", Economic and Political Weekly, 21.
Jodha, N.S. (1996): ‘Management of Common Property Resources in selected Dry Areas of India’ , in Kerr John et al., op cit p. 339-361.
Jodha, N.S. (2000): “ Waste lands management in India: Myths, motives and mechanisms”, Economic and Political Weekly, February 5, p.466-473.
Kadekodi, Gopal K., (1995): "Resource and Livelihood Linkages: The Context of Operationalising Sustainable Development', In Towards Sustainable Development, edited by M.M. Skutsch and Hans Opdam, University of Twente, Enschede.
Kadekodi, Gopal K. (2001): Common Property Resource Management: Reflections on Theory and Indian Experience, Centre for Multi-Disciplinary Development Research Monograph, Dharwad. Kadekodi, Gopal K. and S. C. Gulati (February 1999): “Root Causes of Biodiversity Losses In Chilika Lake: Reflections on Socio-Economic Magnitudes”, Institute of Economic Growth and

Centre for Multi-Disciplinary Development Research.
Kadekodi, G.K. and N. H. Ravindranath (1994): “Forestry as Carbon Sink in India: A Macro-economic Analysis”, Economic Growth and Social Change, September, pp.12-24.
Kadekodi, Gopal and M.M. Agarwal (1998): 'Integration of Preservation, Depletion, and Degradation of Natural Resources in Income Accounting', Institute of Economic Growth, Working Paper Series, No. E/189/98, Delhi.
Kadekodi, Gopal, KSR Murty and Kireet Kumar (2000): ‘Water in Kumaon’ Ecology, Value and Rights, Gyanodaya Publications, Nainital.
Kerr, J.M., D.K. Marotia, Katar Singh, C. Ramasamy and W.R. Bentley, (1997): Natural Resource Economics: Theory and Application in India, Oxford & IBH Publishing Co. Ltd. New Delhi.
Kahneman, D. and Knetsch, J. (1992a): ‘ Valuing public goods: The purchase of moral satisfaction’, Journal of Environmental Economics and Management, vol.22 (1), p.57-70.
Kahneman, D. and Knetsch, J. (1992b): ‘ Contingent valuation and the value of public goods: Reply’, Journal of Environmental Economics and Management, vol.22 (1), p.90-94. Kar, C.S. and Bhaskar, S. (1981): ‘Status of sea turtles in the Eastern Indian Ocean. In: Bjorndal, K. (Ed.)’, Biology and Conservation of Sea Turtles. Proc. World Conf. Sea Turtle Cons., Smithsonian Institute Press, Washington. Pp. 373-383.
Keayla, B K (1999): Trips Agreement on Patent Laws: Impact on Pharmaceuticals and Health for All, Centre for the Study of Global Trade System and Development, New Delhi.
Kesavan, P C (1997): ‘Induced Crop Improvement Using Mutations vis-à-vis Transgenics: Ensuring Safety of Health and Environment’, Book of Abstracts, Asia – Pacific Workshop on Biosafety – Environmental Impact Analysis of Transgenic Plants, organised by M S Swaminathan Research Foundation, Department of Biotechnology, Government of India, USDA and Cornell University, Chennai, July 21-26. Khare, Arvind, Madhu Sarin, NC Saxena, Subhabrata Palit, Seema Baathla, Farhad Vania and M. Satyanarayana (2000): Joint Forest Management: policy, practice and prospects; Policy that works for forests and people series no:3.IIED, London.
Khare, Arvind (1989-90): “Small Scale Forest Enterprises in India with Special Reference to Role of Women”, Wastelands News, Nov-Jan.
Kirby, K (1993): ‘Wetlands no wastelands’ Scenic America Technical Information Series 1 (5): 1-8.
Kopp, R.J. and V. K. Smith (Eds.) (1993): Valuing natural assets: The economics of natural resource damage assessment, Resources for the Future Incorporation Washington D.C.

Kothari, Ashish (1996):Is Joint Management of protected Areas Desirable and Possible?, in Ashish Kothari et al., op cit, pp.17-49.
Kothari, Ashish, Neena Singh and Saloni Suri (Eds.) (1996): People and Protected Area: Towards participatory conservation in India”, Sage Publications, New Delhi.
Kothari, A (1997): ‘India Explores Joint Management of Protected Areas. Ecodecision’, Winter: 49-52.
Krutilla J. V., (1967): ‘Conservation Reconsidered’, American Economic Review, 57(4): 777-786.
L. Master (1991): ‘Assessing threats and setting priorities for conservation’, Conserve, Biol, 5, 559-563.Lal, J.B. (1989): ‘India's Forests: Myth and Reality’, Natraj Publishers, New Delhi, India. Lal, J.B (1992): ‘Economic value of India’s forest stock’, in Anil Agarwal (Eds.) :The Price of Forests, Centre for Science and Environment, New Delhi.
Larson, D. M. (1992): ‘Can non-use value be measured from observable behaviour?’ American Journal of Agricultural Economics, Dec. 1114-1120.Leskein, Dan and Michael Flitner (1997): Intellectual Property Rights and Plant Genetic Resources: Options for a Sui-Generis System, Issues in Genetic Resources, No 6, IPGRI, June. Leopold, A. (1949): ‘A Sand County Almanac and Sketches Here and There’, Oxford University Press, New York.Lesser, H William (1991): Equitable Patent Protection in the Developing World Issues and Approaches, Eubios Ethics Institute, Christchurch, (NZ), Tsukuba, Japan. Lindsay, C.M., (1969): ‘Option Demand and Consumer Surplus’, Quarterly Journal of Economics, 83(4):344-45.
Long, M. F., (1967), ‘Collective Demand and Consumer Surplus’, Quarterly Journal of Economics, 81(4): 351-52.
Loomis, J. B. and D. S. White (1996): ‘Economic benefit of rare and endangered species: summary and meta-analysis’, Ecological Economics, 18, 197-206.
Loomis, J. B. and Larson, D. M. (1994): ‘Total economic value of increasing gray whale populations: Results from a contingent valuation survey of visitors and households,’ Marine Resource Economics, 9(3), 275-286.
Lotka, A. J. (1956): Elements of Mathematical Biology, Dover Publications, London.
Lovejoy, T.E., (1997). Biodiversity: What Is It? In Biodiversity II, Understanding and Protecting Our Biological Resources, Marjorie L. Reaka-Kudla, Don E.Wilson, and Edward O.Wilson (Ed.), Joseph Henry Press, Washington D.C.

Lykke, E. A., (1997): ‘A Cost-Benefit Analysis of Deforestation in the Brazilian Amazon’. Discussion No. 455, Institute for Applied Economics Research (IPEA), Rio de Janeiro Down loaded from the net.
MacArthur, J., (1996), ‘The Economic valuation of Biodiversity, its Implications and Importance in Bioresource Planning, and Initiatives for its Regular Use in Planning Conservation Projects in India’, In Pushpangadan, P., K. Ravi and V.Shantosh (Eds.): Conservation and Economic Evaluation of Biodiversity, Vol.2, Oxford & IBH Publishing co. Pvt. Ltd., New Delhi and Calcutta.
MacKinnon, J. and MacKinnon, K. (1986): ‘Review of the Protected Areas System in the Indo-Malayan Realm’, International Union for the Conservation of Nature and Natural Resources, Gland, Switzerland and Cambridge, U.K. 284 pp. MacNeely, J. (1988): Conserving the World’s Biodiversity, IUCN, Glant, Switzerland.
Magurran, A. E. (1988): “Ecological Diversity and its Measurement,” Princeton Univ. Press, Princeton, NJ.
Maharana, Iyatta, S.C. Rai and E. Sharma, (2000): G. B. Pant Institute of Himalayan Environment and Development, “Environmental Economics of the Khangchendzonga National Park in the Sikkim Himalaya, India”, Kluwer Academic Publisher, GeoJournal 50: 329-337.
Maharana, Iyatta, Sc. Rai and E. Sharma (2000): G. B. Pant Institute of Himalayan Environment and Development, “Valuing Ecotourism in a Sacred Lake of the Sikkim Himalaya, India”, Foundation for Environmental Conservation 27(3):269-277.
Maharana, I, S. C. Rai and E. Sharma (2000): ‘Valuing Ecotourism in a Sacred Lake of the Sikkim Himalaya’, India, Environmental Conservation 27(3):269-277.
Maharana, I. S.C. Rai and E. Sharma (2000): ‘Environmental Economics of the Khangchendzonga National Park in the Sikkim Himalaya’, India. GeoJournal 50:329-337.Maler, K. G. (1991): ‘National Accounts and Environmental Resources’, Environmental and Resource Economics 1, pp. 1-15.Maler, K-G. (1991): 'National accounts and environmental resources', Environmental and Resource Economics 1: 1-15Malone, T C, W. Boynton, T. Horton and C. Stevenson (1993): “Nutrient Loadings to surface waters: Chesapeake Bay case study” in Keeping Pace with Science and Engineering. Case Studies in Environmental Regulation, M R Uman ed. pp.8-38. National Academy Press, Washington, D C.
Manoharan, T. R. (September 2000): ‘Natural Resource Accounting: Economic Valuation of Intangible Benefits of Forests’, Research and Information System for the Non-Aligned and Other Developing Countries (RIS), New Delhi.Manoharan, T.R. (2000): ‘Natural Resource Accounting: Economic Valuation of Intangible Benefits of Forests’, RISDCP # 04/2000, New Dehi. Marothia, D.K. and A. K. Gauraha (1992): “Marketing of Denationalised Minor Forest Products in Tribal Economy”, Indian Journal of Agricultural Marketing, Vol.6(2).Martinez-Alier, Juan, Giuseppe Munda and John O’Neill (1998): ‘ Weak compatibility of values as a

foundation for ecological economics’, Ecological Economics, Vol. 28, pp. 277-288.
Meffe, G.K. and C.R. Caroll. (1994): ‘Principles of Conservation Biology’, Sinauer Associates, Inc.Mitchell, R. C. and Carson, R. T. (1989): Using Survey to Value Public Goods: The Contingent Valuation Method, The John Hopkins University Press for Resources for Future, Washington, DC.Montgomery, Claire A., Robert A. Pollak, Kathrya Freemark and Denis White (1999): Pricing Biodiversity, Journal of Environmental Economics and Management 38, 1-19.Moran, Dominic and Camille Bann (March 2000): ‘The Valuation of Biological Diversity for National Biodiversity Action Plans and Strategies: A Guide for Trainers’, Prepared for the United Nations Environment Program (UNEP).Munda, G. (1995): Multicriteria Evaluation in a Fuzzy Environment: Theory and Applications in Ecological Economics, Physica-Verlag-Heidelberg.Nadakarni, M.V., (1999): ‘Environment in Karnataka: A status report’, Economic and Political Weekly, 34 (38): 2735-44Nagaraj, Sudha (May 9): “Centre Sanctions Funds for 17 Medicinal Plant Projects”, Times of India Bangalore Edition.Navrud, S. and Mungatana, E. D. (1994): ‘Environmental valuation in developing countries: The recreational value of wildlife viewing,’ Ecological Economics 11, 135-151.Nayak, Shailesh and Anjali Bahuguna (1998): ‘ Remote sensing application for monitoring coral reefs’, in Proceedings of the Seminar on Status and Protection of Coral Reefs, Kadamat Island UT of Lakshadweep.Nayar, M.P. and Sastry, A.R.K. (Eds.)(1987): Red Data Book of Indian Plants, Vol. 1. Botanical Survey of India, Calcutta. 367 pp. Ninan, K. N.(January 1998): “An Assessment of European-aided Watershed Development Projects in India from the Perspective of Poverty Reduction and the Poor”, Centre for Udviklingsforskning and Centre for Development Research, CDR Working Paper.Norton, B.G., (1987): Why preserve natural variety? Princeton University Press, Sloan, New Jersey.Norton, B.G. (1988): ‘ Commodity, amenity and morality:The limits of quantification in valuing biodiversity’, in Wilson, O.E. (Ed.), op cit.
Oates, W.E., and Folmer H., (2000), Economics, Nature Conservation and Sustainable Development: An Overview, Edward Elger Publisher, U.K.ODA (1995): ‘Guidance note on how to do stakeholder analysis of aid projects and programmes’, Overseas Development Administration, London.OECD. (1995): ‘The Economic Appraisal of Environmental Projects and Policies’: A Practical Guide.Opschoor, J.B. (Eds.) Principles of Environmental and Resource Economics, Edward Elgar Publications, Brookfield. Palit, S. (1999): ‘Structural Changes in Forest Department”, Policy that Works for Forest and People’, International Institute for Environment and Development.Panayotou, T. (1998):Instruments of Change: Motivating and Financing Sustainable Development, Earthscan Publications, London.Panchamukhi, A.R. (1998): Socio-economic Ideas in Ancient Indian Literature, Rashtriya Sanskrit Sansthan, Delhi.
Pandit, M. K. (1997): ‘Ecological Economics: Towards a Synthesis of Two Disjunct Disciplines’, Current Series 72(2), pp. 119-23.Panwar, H.S. (1982): ‘Project Tiger. In: Saharia, V.B. (Ed.)’, Wildlife in India. Natraj Publications, Dehra Dun. Pp. 130-137. Parikh, Kirit (2001): ‘Natural Resource Accounting and Monitoring’, in Ecological Economics
for Sustainable Development, Indian Society for Ecological Economics, New Delhi, p. 83-110.Parikh, Kirit S and Upal Ghosh, (December 1995): “Natural Resource Accounting for Soils: Towards an Empirical Estimate of Costs of Soil Degradation for India” Indira Gandhi Institute of Development Research, Discussion Paper No.48 (Revised).Parikh ,S. K., J. K. Parikh, V. K. Sharma and J.P. Painuly (1992): “Natural Resource Accounting: A Framework for India”, Indira Gandhi Institute of Development Research, Bombay, India.Parikh, Jyoti (2001):valuing the Health Impacts of Air Pollution ,in Kadekodi G.K.(Ed):Environmental Economics in Practice: case studies from India, Centre for Multi-Disciplinary Development Research Monograph, Dharwad.
Parikh, Jyoti and G.S. Haripriya (1998):Environmental accounting in India: Trial estimates for forest resources, IGIDR working paper.Parikh, K.S. and Jyoti Parikh (1997): ‘Accounting and Valuation of Environment: volume I: A premier for developing countries’, volume II: Case Studies from the ESCAP Region, New York: United Nations.Parikh, K.S., J.K. Parikh, V.K. Sharma, and J.P. Painuly (1992): ‘Natural Resource Accounting: A framework for India’, Indira Gandhi Institute of Development Research, Bombay: Monograph. Patrick R., (1997). Biodiversity: Why Is It Important? In Biodiversity II, Understanding and Protecting Our Biological Resources, Marjorie L. Reaka-Kudla, Don E.Wilson, and Edward O.Wilson (Ed.), Joseph Henry Press, Washington D.C.Pearce, D.W., and R.K.Turner, (1990), Economics of Natural Resources and Environment, Harvester Wheatsheaf, New York.Pearce, D. W. and Moran, D. (1994): ‘The economic value of biodiversity’, IUCN, Earthscan Publications Ltd, London.Pearce, D. W., (1992): ‘Economic Valuation and the Natural World’, Centre for Social and Economic Research on the Global Environment, London and Norwich, UK.Perrings, C. (1995): Biodiversity loss: economic and ecological issues, Cambridge: Cambridge University Press.Perrings, C (1995): ‘The Economic Value of Biodiversity in Global Biodiversity Assessment’, UNEP, Cambridge University Press.Perrings, C. (1996): ‘The value of biodiversity for sustainable economic development’, in Pearce, D. and Moran D. (1994), The economic value of biodiversity’ London, Earthscan Publication.Pillai, V.N.K. (1982): ‘Status of wildlife conservation in states and union territories. In: Saharia, V.B. (Ed.)’, Wildlife in India. Natraj Publishers, Dehra Dun. Pp. 74-91. Pimentel, D. (1993): World Soil Erosion and Conservation, Cambridge University Press, Cambridge, UK.
Pimentel, D., C. Harvey, P. Resosudarmo, K. S. Pritz, L. Fitton, R. Saffouri and R. Blair (1995): ‘Economic costs of soil erosion and conservation benefits’, Science, 267, pp.1117-1123
Plummer, L. M., and Hartman, R. C., (1992): Option Value: a General Approach, ‘In the Earthscan reader in Environmental Economics edited by Anil Markandya and Julie Richardson’, Earthscan publications Ltd. London: 81-91.Polasky, Stephen and Andrew R. Solow (1995): ‘On the Value of a Collection of Species’, Journal of Environmental Economics and Management 29, 298-303.Polasky, S., A. R. Solow and J. M. Broadus (1993): ‘Searching for uncertain benefits and the conservation of biological diversity’, Environment Resource Economics 3, 171-181.Primack, R.B. (1993): Essentials of Conservation Biology, Sinauer Associates, Inc.Principe, P. (1989): “The Economic Value of Biodiversity Among Medicinal Plants,” OECD. Paris.Pushpangadan P. and Ravi K. (1996), ‘Application of Environmental Valuation Techniques for Economic Evaluation of Biodiversity: A Critical Investigation’. In Pushpangadan, P., K.Ravi and V.Shantosh (Eds.): Conservation and Economic Evaluation of

Biodiversity, Vol.2, Oxford & IBH Publishing co. Pvt. ltd., New Delhi and Calcutta.Pushpangadan, P., K.Ravi and V.Shantosh (Eds.): Conservation and Economic Evaluation of Biodiversity, Vol.2, Oxford & IBH Publishing co. Pvt. ltd., New Delhi and Calcutta.Quiggin, J. (1998), 'Existence value and the contingent valuation method', Australian Economic Papers, 37(3), 312-29.Rangarajan, I. N. (1987): The Arthashastra, Penguin Books, New Delhi.Repetto, R., Magrath, W., et al., Wasting Assets (1989): Natural Resources in the National Income Accounts, World Resources Institute, New York.Rietbergen-McCracken, J. and H. Abaza (2000): Economic Instruments for Environmental Management, Earthscan Publication, London.
Rodgers, W.A. and Panwar, H.S. (1988): Planning a wildlife protected area network in India. 2 vols. Project FO: IND/82/003. FAO, Dehra Dun. 339, 267 pp. Ronnback, Patrik, (1999): “An Ecological Basis for Economic Value of Seafood Production Supported by Mangrove Ecosystem”, Ecological Economics 29, 235-252.Routledge, P. (2000): ‘Consuming Goa, tourist site as dispensable space’, Economic and Political Weekly, July 22. Rowntree, R.A., R.A. Sanders, and J.C. Stevens (1982): ‘Evaluating urban forest structure for modifying micro-climate: The Dayton Climate Project’, In Proceedings of the Second National Urban Forestry Conference, American Forestry Association, Washington, D.C. pp. 136-42.
Sabbatucci, A.V. (1999): Salient Legal and Institutional Features with regard to the development of shrimp culture in a few countries. Papers presented at the Bankok FAO Technical Consultation on Policies for Sustainable Shrimp Cultrue. Bangkok, Thailand, 8-11 December 1997. FAO Fisheries Report No.572, Suppl. Rome, FAO. 266pSagoff, M. (1994): ‘Should preferences count,’ Land Economics, 70(2), 127-44. Sahai, B. (1993): Applications of Remote sensing for environmental management in
India, Space and Environment report of the International astronomical Federation, 44th Cong,ress Graz, Austria.
Sahai, S. ( 2001), ‘Plant Variety Protection and Farmers' Rights Law’, Economic and Political Weekly, September 1.Sahai, Suman (1996): ‘Protecting Plant Varieties: UPOV Should Not Be Our Model, Economic and Political Weekly, October 12-19, pp 2788-89. Saigal, Sushil, Chetan Agarwal and Jeffrey Y. Campbell (August-October 1997): “Food, fodder and fuel…NTFP can sustain JFM”, Wastelands News, Vol. XIII, No.1, p.46-55.Salm, R.V. (1981): ‘Coastal resources in Sri Lanka’, India and Pakistan: description. Samuelson, O. (1954): ‘Evaluation of real national income,’ Oxford Economic Papers, 2, 1-29.Samuelson, P.A. (1948):’Consumption Theory in terms of Revealed Preference’, Economica, Vol. XV (November), pp 243-253. Sankar, U (2001):Pollution Control in Tanneries, in Kadekodi, G.K.(Ed): Environmental Economics in practice: case studies from India, Monograph, CMDR, Dharwad.Sarin, Madhu, (1999): “Policy Goals and JFM Practice: An Analysis of Institutional Arrangements and Outcomes”, Policy that Works for Forest and People, International Institute for Environment and Development.Saxena, N. C., Madhu Sarin, R. V. Singh and Tushaar Shah (May 1997): “Western Ghats Forestry Project: An Independent Study of Implementation

Experience in Kanara Circle”.Scarpa, R. (1999): ‘Revealed Preference valuation methods for farm animal genetic material: principles, strengths and weaknesses’, Paper presented at: Valuation of animal genetic resources-An ILRI-FAO planning workshop, 15-17 March, FAO, Rome.Schmalenseee, R., (1972): ‘Option demand and consumer’s surplus: Valuing price changes under uncertainty’, American Economic Review, 62(4): 813-824.Schott, J assisted by Johanna W Buurman (1994): The Uruguay Round, Institute for International Economics, Washington, DC. Scott, D.A. (1989): ‘A Directory of Asian Wetlands’, IUCN, Gland, Switzerland, and Cambridge, UK. Sedjo, Roger A and R David Simpson (1995): Property Rights, Externalities and Bio-Diversity in Timothy M (ed), The Economics and Ecology of Biodiversity Decline The Forces Driving Global Change, Cambridge University Press, Cambridge, pp 79-88. Sehgal Sushil, (2000): “Does Community Based Conservation Make Economic Sense? Lessons from India”, Kalpavriksh and International Institute of Environment and Development. Seidnsticker, S.C. and P. Jackson( eds.), (1999): Riding the Tiger: Tiger Conservation in Human-Dominated Landscape, Cambridge University Press,1999: United Kingdom.Shaffer, M. L, and Samson, F. B. (1985): ‘Population size and extinction: A note on determining critical population sizes,’ The American Naturalist, 125(1), 144-152.Shaffer, M.I. (1983): “Minimal population sizes for species conservation”, Bioscience, vol.31, p.131-134.Shechter, Mordechai (1995): ‘Valuing the Environment’, in Folmer, H., L.H. Shiva, Vandana (1998): Bio-Piracy on Steroids: The US Patent on Basmati, Research Foundation, Shimla. Shiva, Vandana and Tom Crompton (1998): ‘Monopoly and Monoculture – Trends in Indian Seed Industry’, Economic and Political Weekly, September 26, pp A-137-51. Shiva, M. P. and R. B. Mathur (1993) (eds.): “Price Regime Analysis, Marketing and Trade of Minor Forest Products: A Case Study”, Centre of Minor Forest Products for Rural Development and Environmental Conservation, Dehradun.Shiva, Vandana and R Holla-Bhar (1993): Intellectual Property and the Neem Tree, The Ecologist, Vol. 22, no 6. Shogren, J., S. Shin, D. Hayes, and J. Kliebenstein (1994): ‘ Resolving differences in willingness to pay and willingness to accept’, American Economic Review, vol. 84, p.255-270.Sinden, J.A., (1967), The evaluation of extra-market benefits. A review. World Agriculture Rural Society Abstracts.Sinden, J.A. and A.C.Worrel, (1979), Unpriced values: Decisions without Market Price, Wiley, New York.Singh, Neena (1996): ‘Sowing les, reaping bare’, Down to Earth, July 15Singh, T.P. and Ravi Hegde, (2001):” Stake holders’ analysis in Joint Forest Management: A case study of Haryana Shivaliks”, in Kadekodi, Gopal K. (Ed). Environmental Economics in Practice: Selected case studies from India, (Forthcoming book)Singh, Shekhar, V. Sankaran, P. Rao and R. Mehta (1999): Natural Resource Acounting and Budgeting: An Alternative Methodology, Monograph, Indian Institute of Public Administration and Kalpavriksh, New Delhi.
Singh, T.P. and Varalakshmi (1998): ‘The Decade and Beyond - Evolving Community-State Partnership TERI’, New Delhi.Solow, A. and S. Polasky (1994): Measuring biological diversity, Environment and Ecological Statistics, 1(2), 95-107.Stewart, Frances (1993): Biases in Global Markets: Can the Forces of Inequity and Marginalisation be Modified, paper submitted to north-south round table meeting, September

1-13, 1993, Bretton Woods, New Hampshire (preparatory meeting, April 14-16, 1993, New York). Sukhatme, P. V. and B. V. Sukhatme, (1970): Sampling theory of surveys with applications. (Second revised edition) Iowa state University Press, Iowa and Asia Publishing House, Bombay.
Swanson, T.M. (1992): The Economics of a Biodiversity Convention, Centre for Social and Economic Research on the Global Environment (CSERGE) Discussion Paper GEC 92-08 Swanson, T. M. (1994): ‘The economics of extinction revisited and revised: A generalised framework for the analysis of the problems of endangered species and biodiversity loss,’ Oxford Economic Papers, 46, 800-821.Swanson, Timothy (1997): Global Action for Bio-Diversity An International Framework for Implementing the Convention on Biological Diversity, Earthscan, Cambridge. Swanson, T. M. and Barbier, E. B. (eds.) (1992): ‘Economics for the wilds: Wildlife, wildlands, diversity and development’, Earthscan Publications, London.Tobias, D. and Mendelsohn, R. (1991): ‘Valuing ecotourism in a tropical rain-forest reserve,’ Ambio, 20(2), 91-93.Tobias, D. and Mendelsohn, R. (1991), ‘Valuing Ecotourism in a Tropical Rain Forest Reserve’, Ambio, 20(2).Tobias, D. and R. Mendelsohn (1991): ‘Valuing Ecotourism in a Tropical Rain Forest Reserve’, Ambio, 20(2).Turner, R. K. (1993): ‘Sustainable Environmental Economics and Management: Principles and Practice’, Belhaven Press, New York.United Nations Conference on Trade and Development (UNCTAD), (1994): The Outcome of the Uruguay Round: An Initial Assessment, Geneva. United Nations (1968): ‘A System of National Accounts’, Publication E-69, XVII.3, New York.United Nations (1993): ‘Integrated Environmental and Economic Accounting, Interim version’, Studies in Methods Series, F. No. 61, Department of Economic and Social Information and Policy Analysis, New York.United Nations (1993): Integrated Environmental and Economic Accounting, Interim version, Studies in Methods Series, F. No. 61, Department of Economic and Social Information and Policy Analysis, United Nations, New York.UNEP (1995): Global Biodiversity Assessment. United Nations Environment Programme and Cambridge University Press, Cambridge. UNEP/IUCN (1988): Directory of Coral reefs of International Importance. Vol. 2. Indian Ocean, Red Sea and Gulf. UNEP Regional Seas Directories and Bibliographies. IUCN, Gland, Switzerland, Cambridge, UK/UNEP, Nairobi, Kenya. 389 pp, 36 maps.
United Nations Environment Programme (1993): 'Environmental accounting: A review of the
current debate', Environment and Economics Unit, Environmental Economics Series, paper no.
8. Varalakshmi, V., Hegde, R. And Singh, T.P. (1999): ‘Trends in grassroots institutional
evolution – a case from joint Forest Management Programme in Haryana’, India, International
Journal of Sustainable Development and World Ecology (6): 1-11Verma, Madhu (2000):
‘Economic Valuation of Forests of Himachal Pradesh’, in Himachal Pradesh Forest Sector
Review, International Institute for Environment and Development, London.Verma, Madhu,
(2000): ‘Economic Valuation of Bhoj Wetland for Sustainable Use’, Monograph, Indian
Institute of Forest Management, Bhopal.Viscusi, W.K. (1993): “The value of risks to life and
health,’ Journal of Economic Literature, 31(4), 1912-1946.Walsh, R. G., Loomis, J. B. and

Gillman, R. A., (1984): ‘Valuing Option, Existence and Bequest Demands for Wilderness’,
Land Economics 60(1): 14-29.Weisbrod, B. A., (1964): ‘Collective Consumption Services of
Individual Consumption Goods’, Quarterly Journal of Economics, 78(4): 471-77.
White, A T and A. Cruz – Trinidad (1998): ‘The value of Philippines coastal resources: Why
protection and management are critical’ Coastal Resources Management Project. Cebu City,
Philippines. Whitehead, J. C. (1993): ‘Total economic values for coastal and marine wildlife: Specification, validity and valuation issues,’ Marine Resource Economics, 8, 119-132.Wilson, E. O. (ed.), (1988): Biodiversity, Washington, DC: National Academy Press.Wilson, E.O. (1992): The Diversity of Life. W.W. Norton and Co., New York and London.World Bank (1994):India-Ecodevelopment Project: Project Information Document, The World Bank, Washington DC.World Conservation Monitoring Centre (1992): Global Biodiversity: Status of the Earth's Living Resources. Chapman and Hall, London. World Commission on Environment and Development (WCED), (1990): Our Common Future, Oxford University Press, Oxford.
WEBSITES :http://www.aere.orghttp://www.ambio.kva.sehttp://www.cscindia.orghttp://www.cscindia.org/html/eyou/eyou33.htmhttp://www.ecotrust.orghttp://www.eepsea.org/publications/specialp2/sectionc.htmlhttp://www.mangroveindia.orghttp://www.mpeda.com/p u b l i c a t i o n s / e x p o r t r e v i e w 9 7 / t r e n d s . h t m h t t p : / / w w w. n a t u r e n e t . n e t h t t p : / /www.oneworld.orghttp://www.ramsar.org/lib_val_e_6.htmhttp://www.ramsar.org/values_biodiversity_e.htmhttp://www.ramsar.org/values_climate_e.htmhttp://www.ramsar.org/values_cultural_e.htmhttp://www.ramsar.org/values_floodcontrol_e.htmhttp://www.ramsar.org/values_groundwater_e.htmhttp://www.ramsar.org/values_intro_e.htmhttp://www.ramsar.org/values_products_e.htmhttp://www.ramsar.org/values_recreation_e.htmhttp://www.ramsar.org/values_sediment_e.htmhttp://www.ramsar.org/values_shoreline_e.htmhttp://www.ramsar.org/values_waterpurification_e.htmhttp://www.stopextinction.orghttp://www.ioa.com/~aquamag/html/featart.htmlhttp://www.teriin.org/envishttp://www.rediff.com/business/1999/dec/06wto.htm