Economic Value of GBRMP - GBRMPA - Home
62
RESEARCH PUBLICATION NO. 84 Measuring the Economic and Financial Value of the Great Barrier Reef Marine Park Access Economics Pty Limited 30 June 2005
Transcript of Economic Value of GBRMP - GBRMPA - Home

RESEARCH PUBLICATION NO. 84
Measuring the Economic and Financial Valueof the Great Barrier Reef Marine Park
Access Economics Pty Limited30 June 2005

© Great Barrier Reef Marine Park Authority 2005
Published by the Great Barrier Reef Marine Park Authority
This work is copyright. Apart from any use as permitted under the Copyright Act 1968, no
part may be reproduced by any process without the prior written permission of the Great
Barrier Reef Marine Park Authority. Requests and inquiries concerning reproduction and
rights should be addressed to Manager, Research and Monitoring Social Sciences,
Great Barrier Reef Marine Park Authority, PO Box 1379, Townsville, Qld 4810.
The National Library of Australia Cataloguing-in-Publication data:
Measuring the Economic and Financial Value of The Great Barrier Reef.
Bibliography.
ISBN 1 876945 51 6 (Online).
1. Marine parks and reserves – Queensland – Great Barrier Reef – Economic aspects.
2. Great Barrier Reef Marine Park (Qld.) – Economic aspects. I. Access Economics
(Firm). II. Great Barrier Reef Marine Park Authority. (Series : Research publication
(Great Barrier Reef Marine Park Authority) ; no. 84).
333.7809943
Comments on the document are welcome and should be addressed to:
Great Barrier Reef Marine Park Authority
PO Box 1379
TOWNSVILLE QLD 4810
AUSTRALIA
Attention: Manager, Research and Monitoring Social Sciences
Further information is available from:
Great Barrier Reef Marine Park Authority
2-68 Flinders Street
PO Box 1379
TOWNSVILLE QLD 4810
Phone: (07) 4750 0700
Fax: (07) 4772 6093
Email: [email protected]
www.gbrmpa.gov.au
CONTENTS
EXECUTIVE SUMMARY .........................................................................................................1 This Report in Context.....................................................................................................................1 Access Economics’ Conclusions.....................................................................................................2 Caveats...............................................................................................................................................4 Further Work Needed......................................................................................................................5
PREAMBLE: THIS REPORT IN CONTEXT ............................................................................6
1. FOCUS OF THIS REPORT ............................................................................................8
2. GEOGRAPHIC SCOPE OF THE ANALYSIS.................................................................9 2.1 Defining The Great Barrier Reef Marine Park..................................................................9 2.2 Defining The Reef Catchment Area.................................................................................10 2.3 Why Focus On The Catchment Area? .............................................................................12
3. THE NATURE OF ACCESS ECONOMICS’ ANALYSIS..............................................13 3.1 Aggregating Across Tourism & Other Activity.............................................................13 3.2 Limitations Of The Analysis.............................................................................................14 3.3 Economic Contribution Vs Economic Impact Studies ..................................................14
4. COMPILING THE RELEVANT DATA FOR 2004-05 ...................................................16 4.1 Possible Data Sources ........................................................................................................16 4.2 Data Limitations.................................................................................................................20
5. DIRECT ECONOMIC VALUE OF CATCHMENT AREA..............................................21 5.1 Tourism Data for the Catchment Area............................................................................21 5.2 Direct Economic Contribution: Tourism .......................................................................23 5.3 Direct Economic Contribution: Other Industries .........................................................28 5.4 Direct Economic Contribution: Non-Park Industries ..................................................29 5.5 Direct Employment............................................................................................................30 5.6 Inter-Regional, Interstate and International Trade .......................................................31
6. INDIRECT ECONOMIC VALUE OF CATCHMENT AREA ..........................................36 6.1 Indirect Economic Value As Measured...........................................................................36 6.2 Indirect Tourism Economic Value Is Understated ........................................................39
7. TOTAL ECONOMIC VALUE OF CATCHMENT AREA ...............................................41
8. CONCLUSIONS, CAVEATS & FURTHER WORK NEEDED ......................................44 8.1 Access Economics’ Conclusions.......................................................................................44 8.2 Caveats ................................................................................................................................45 8.3 Further Work Needed .......................................................................................................45
ATTACHMENT A: METHODOLOGY ...................................................................................47
ATTACHMENT B: DATA SOURCES & REFERENCES......................................................57

FIGURES 1. Great Barrier Reef Catchment Area and Included LGAs…………………..……………11
TABLES 1. Direct Plus Indirect Contributions of Selected Activities to the GBRCA, 2004-05……..3 2. Direct Plus Indirect Contributions of Selected Activities to Queensland, 2004-05…….3 3. Direct Plus Indirect Contributions of Selected Activities to Australia, 2004-05………..4 4. Allowed Activities in GBRMP Zones, Simplified………………………………………..10 5. NVS and IVS Tourism Data for GBRCA, Year Ending September 2004……………….23 6. Recorded Visits to GBR Marine Park, Thousands………………………………………..23 7. Direct Contributions of Selected Activities to the GBRCA, 2004-05……………………25 8. Direct Contributions of Value Added for Selected Industries within the GBRCA,
by Input-Output Industry, 2004-05 $Million……………………………………………26 9. Direct Contributions of Selected Activities to Queensland, 2004-05…………………...27 10. Direct Contributions of Selected Activities to Australia, 2004-05……………………….27 11. Value Added by Industry, GBRCA, 2004-05……………………………………………...30 12. Direct Employment in GBRCA Industries, by Industry, 2004-05 (Thousands or %)…31 13. GBRCA Exports and Imports for Selected GBRCA Activities, 2004-05, $Million…….33 14. Queensland Exports and Imports for Selected GBRCA Activities, 2004-05, $Million..33 15. Australian Exports and Imports for Selected GBRCA Activities, 2004-05, $Million….34 16. Indirect Contributions of Selected Activities to the GBRCA, 2004-05………………….37 17. Indirect Contributions of Value Added for Selected Activities within the GBRCA,
by Input-Output Industry, 2004-05, $Million……………………………………………38 18. Indirect Contributions of Selected Activities to Queensland, 2004-05………………….39 19. Indirect Contributions of Selected Activities to Australia, 2004-05……………………..39 20. Direct Plus Indirect Contributions of Selected Activities to the GBRCA, 2004-05…….42 21. Direct Plus Indirect Contributions of Selected Activities to Queensland, 2004-05……42 22. Direct Plus Indirect Contributions of Selected Activities to Australia, 2004-05……….42 23. Total Value Added for Selected Industries, 2004-05, $Million…………………………..43 24. Regional, Interstate and International Expenditures by Industry for GBRCA,
$Million, 2004-05……………………………………………………………………………52

1
EXECUTIVE SUMMARY
This report, prepared by Access Economics and commissioned by the Great Barrier Reef Marine Park Authority (GBRMPA), presents quantitative estimates of the economic and financial value of activity undertaken within the Great Barrier Reef Marine Park Catchment Area (the GBRCA) for the financial year 2004-05.
This Report in Context
There have been several attempts, on varying bases, to measure the economic, financial and social value of the Great Barrier Reef Marine Park.1
The Total Economic Value (TEV) concept used in the Hand Report is a much more ambitious conceptual framework than is used in this report, covering:
‘Use’ and ‘non-use’ values.
Within the former, direct and indirect values, also broken down into extractive and non-extractive uses and goods and services.
Some of these may or may not line up well with standard stocks and flows concepts, and in many cases, valuations are both difficult and subjective.
This is not to say that such values are either unimportant or not worth attempting to quantify but they cover dimensions not easily incorporated into the current national accounting framework.
This Access Economics report is much less ambitious:
It only looks at national accounts-based flows for which market transactions can readily be estimated and for which input-output tables (Australian, Queensland and regional) can be compiled.
It concentrates on value added, gross product and employment.
It does not look at stocks because of the fledgling state of the art in relation to environmental accounting using national accounts frameworks.
And it concentrates on only three industries: tourism, commercial fishing and cultural and recreational activity, where the first and third of these include estimates for recreational fishing.
1 See, for example, An Economic and Social Evaluation of Implementing The Representative Areas Program
By Rezoning The Great Barrier Reef Marine Park Report on the Revised Zoning Plan, Tony Hand, PDP Australia Pty Ltd, November 2003. Hereafter this is referred to as the Hand Report.

2
Access Economics’ Conclusions
As measured using the quantitative data (primarily national accounts-based) available to it, Access Economics concludes that the total (direct plus indirect) economic contribution of tourism, commercial fishing, and cultural and recreational activity to the GBRCA in 2004-05 is as follows:
For value-added, over $3.5 billion per annum.
For gross product, (which adds net indirect taxes less subsidies to value-added) over $4.1 billion per annum.
For employment (full time equivalent basis), about 51,000 persons.
The corresponding estimates for Queensland are:
For value-added, over $4.3 billion per annum.
For gross product, over $4.9 billion per annum.
For employment (full time equivalent basis), about 59,000 persons.
The corresponding estimates for Australia are:
For value-added, over $5.1 billion per annum.
For gross product, over $5.8 billion per annum.
For employment (full time equivalent basis), about 63,000 persons.
Tourism dominates these contributions:
For value-added and gross product, tourism’s share is about 86%-87%.
For employment, tourism’s share is about 83%-87%.
Access Economics’ results are presented in more detail in Tables 1, 2, and 3 below

3
Total contribution Total Total Tota
Table 1. Direct Plus Indirect Contributions of Selected Activities to the GBRCA, 2004-05
l
(direct plus indirect) Value Added GSP, GDP Employment($m) ($m) (FTE 000)
Total tourism within the GBRCA Visitors from GBRCA 637 747 9 Visitors from rest of Queensland 349 407 5 Interstate visitors 941 1,093 12 by GBRCA residents for travel outside GBRCA 76 87 1 International visitors 1,057 1,244 16Total tourism 3,060 3,578 43Commercial fishing 104 106 1Recreational activity (net of tourism) 409 461 7Total contribution to GBRCA 3,572 4,145 51
Source: Access Economics.
Table 2. Direct Plus Indirect Contributions of Selected Activities to Queensland, 2004-05
Total contribution Total Total Total
(direct plus indirect) Value Added GSP, GDP Employment($m) ($m) (FTE 000)
Total tourism within the GBRCA Visitors from GBRCA 743 854 10 Visitors from rest of Queensland 504 576 6 Interstate visitors 1,103 1,257 14 by GBRCA residents for travel outside GBRCA 89 100 1 International visitors 1,282 1,471 18Total tourism 3,720 4,257 49Commercial fishing 132 135 2Recreational activity (net of tourism) 477 529 9Total contribution to GBRCA 4,329 4,920 59
Source: Access Economics.

4
Total contribution Total Total Tota
Table 3. Direct Plus Indirect Contributions of Selected Activities to Australia, 2004-05
l
(direct plus indirect) Value Added GSP, GDP Employment($m) ($m) (FTE 000)
Total tourism within the GBRCA Visitors from GBRCA 839 958 11 Visitors from rest of Queensland 566 645 6 Interstate visitors 1,436 1,636 16 by GBRCA residents for travel outside GBRCA 99 111 1 International visitors 1,550 1,757 20Total tourism 4,490 5,107 54Commercial fishing 145 149 2Recreational activity (net of tourism) 548 610 7Total contribution to GBRCA 5,183 5,866 63
Source: Access Economics.
The economic contribution of these selected industry activities to the GBRMP will be a sub-set of the results just summarised for the wider GBRCA:
For commercial fishing, the subset results for the GBRMP will presumably be a very high percentage of the GBRCA results.
For tourism and cultural and recreational activities, the subset results will be somewhat smaller proportions of the GBRCA results.
Caveats
These estimates are subject to a variety of caveats, as noted throughout this report. For example:
They cover market-related transactions only: non-market activities, including cultural and indigenous activities, are not covered.
The analysis relates to annual flows estimated for 2004-05 only: there is no balance sheet assessment covering stocks of assets, etc.
The quantification is based on a wide variety of data sources compiled by different Commonwealth and State agencies: there will inevitably be some inconsistencies between these sources.
Much of the actual data is relatively old and needs to be ‘scaled up’ to obtain estimates for the reference year (2004-05). The scaling up process undertaken by Access Economics inevitably involves scope for additional errors.
Externality effects (eg, adverse effects on water quality within the GBRMP associated with other industries (eg, agriculture)) have not been taken into account.

5
On externality effects, the economic contributions of the three selected industries also do not cover adverse effects over time from them (eg, from tourism and local resident congestion, at least at some locations within the GBRMP, possible over-fishing, etc.)
Further Work Needed
The main requirement for improved and updated analysis of the type presented in this report is more up-to-date and hopefully more fully consistent data.
Above all, these types of analysis are hampered by delays in the release of the three input-output tables that are a crucial foundation for economic contribution studies such as this. The currently-released data (for 1996-97) is nearly a decade out of date.
Scientific research is an important activity within the GBRCA in general and the GBRMP in particular, but we have not been able to obtain quantitative estimates that we can re-formulate in a national accounts-consistent framework at this stage. But a comprehensive summation of the annual gross costs involved in policy development, management, monitoring and research, based on the Hand report, might be between $100 and $200 million per annum. More work is needed to refine this estimate.
Economic contributions from expenditures on other activities such as scuba diving, snorkelling and boating that are not included in Cultural & Recreational Services are also likely to be significant, but we have no data on these at present.
Any information in these areas would help to make the analysis in this report more comprehensive.
Even if these data gaps can be filled, because of other, insuperable, data gaps relating to the Tourism Satellite Account (TSA) methodology used in this report, the economic contribution of tourism to the GBRCA will be understated by the type of analysis presented in this report.
The main factors working the other way – if not for a particular reference year, at least over time – are the external diseconomies associated with industry activity on the environment of the GBRMP, which is surely a major drawcard for tourism, commercial fishing, and other activity.
As and if such diseconomies degrade the GBRMP itself, the ‘pulling power’ of the GBRCA itself is likely to be reduced, and with it the economic contribution of the selected industries examined in this report.
However, no quantification of these effects has been included in this report.

PREAMBLE: THIS REPORT IN CONTEXT
There have been several attempts, on varying bases, to measure the economic, financial and social value of the Great Barrier Reef Marine Park.2
These sometimes entail combining a variety of methodologies and value imputations covering activities and perceived values that are not readily amenable to objective, or market price-based, quantification.
Where these generate quantitative estimates that are then added together to (i) generate a ‘total’ estimate which, in some cases (ii) is compared with Australia’s GDP or Queensland’s Gross State Product (GSP), there arises a major risk that ‘apples and oranges’ are being compared.
This report is much less ambitious:
It only looks at national accounts-based flows for which market transactions can readily be estimated and for which input-output tables (Australian, Queensland and regional) can be compiled.
It concentrates on value added, gross product and employment.
It does not look at stocks because of the fledgling state of the art in relation to environmental accounting using national accounts frameworks.
And it concentrates on only three industries: tourism, commercial fishing and cultural and recreational activity, where the first and third of these include estimates for recreational fishing.
Even within a national accounts framework, the focus on the three industries just listed means that about 70%3 of the gross value of production in the region within which the Great Barrier Reef Marine Park lies is excluded.
Mineral production (about 50% of the total) and agricultural production (another 20% or so) are not given much attention in this report.
The Total Economic Value (TEV) concept used in the Hand Report is a much more ambitious conceptual framework, covering:
‘Use’ and ‘non-use’ values.
Within the former, direct and indirect values, also broken down into extractive and non-extractive uses and goods and services.
2 See, for example, An Economic and Social Evaluation of Implementing The Representative Areas Program By
Rezoning The Great Barrier Reef Marine Park Report on the Revised Zoning Plan, Tony Hand, PDP Australia Pty Ltd, November 2003. Hereafter this is referred to as the Hand Report.
3 Based on estimates presented in land Use and Water Quality in the Great Barrier Reef Catchment Productivity Commission, Research Report, 2003.
6

Some of these may or may not line up well with standard stocks and flows concepts, and in many cases, valuations are both difficult and subjective.
An illustrative list of the elements included within the TEV framework makes the point. These elements include (see the Hand report for full definitions:4
Existence values.
Bequest values.
Option values.
Quasi-option values.
Religious and/or spiritual (including indigenous community) values.
None of these are easily, or at all, incorporated within a quantitative national accounting framework, whatever their intrinsic importance, whether we are looking at flows and/or stocks.
From a complementary perspective, these values cover, amongst other things:5
Indigenous cultural values.
National heritage values.
Environmental and scarcity values (coral reefs, species, bioregions, marine protected areas, direct non-use values, ecosystem services, shoreline coastal protection, medical resources/bioprospecting.
Other indirect environmental values (visual amenity/aesthetic value, research value, education, etc.)
Some of these are effectively embodied in market transactions, but many are not.
This is not to say that such values are either unimportant or not worth attempting to quantify. On the contrary. But they cover dimensions not easily incorporated into the current national accounting framework.
4 See Hand, op. cit., section 4.
5 Hand, op. cit., pages 8-14.
7

1. FOCUS OF THIS REPORT
This report, prepared by Access Economics and commissioned by the Great Barrier Reef Marine Park Authority (GBRMPA), presents quantitative estimates of the economic and financial value of selected types of activity undertaken within the Great Barrier Reef Marine Park Catchment Area (GBRCA) for the financial year 2004-05.
The rest of the report is organised as follows:
Section 2 defines the geographic scope of the analysis and sets out the reasons for concentrating on the GBRCA.
Section 3 summarises the nature of Access Economics’ analysis, which is determined by adherence to a national accounting framework, including a ‘Tourism Satellite Account’ (TSA) treatment of tourism, as used by the Australian Bureau of Statistics (ABS). It also defines the industry activity covered by this report. In addition, it sets out the general limitations of the analysis used.
Section 4 describes how the data used in the analysis was compiled. It also presents a review of the limitations of the available data.
Section 5 presents Access Economics’ estimates of the direct economic value of the selected activities in the GBRCA.
Section 6 presents Access Economics’ estimates of the indirect economic value of the selected activities in the GBRCA.
Section 7 presents Access Economics’ estimates of the total (ie, direct plus indirect) economic value of the selected activities in the GBRCA.
Section 8 presents Access Economics’ conclusions, relevant caveats, and outlines areas where further work is needed.
More detailed material, as necessary, is also presented in attachment A to the report. References are listed in attachment B to the report and text references thereto are included throughout the report in parentheses.
8

2. GEOGRAPHIC SCOPE OF THE ANALYSIS
2.1 Defining The Great Barrier Reef Marine Park
The Great Barrier Reef Marine Park (GBRMP) begins at the tip of Cape York in Queensland and extends south past the Tropic of Capricorn almost to Bundaberg.
It covers an area of approximately 345,400 square kilometres and stretches more than 2,300 kilometres along the northeast coast of Queensland. Its width varies from around 90 kilometres to around 300 kilometres.
The Park extends eastwards from the Queensland shoreline (defined as the mean low water mark) and its outer boundaries are defined in terms of coordinates of latitude and longitude. It includes reef and wrecks within these boundaries. However, it excludes islands within its boundaries and some harbour areas around ports.
A revised Zoning Plan for the Park came into effect on 1 July 2004. It established new types of zones and corresponding boundaries. The revised zones and classification of allowable activities in different zones have greatly improved protection of the range of biodiversity within the Park, while preserving public access to much of the Park.
The major change was to increase the proportion of ‘no-take area’ from around 4.5% to 33.3% of the Park. Anyone can enter a no-take area, and boating, swimming, sailing and snorkelling are allowed. However, extractive activities like fishing or collecting are not allowed unless written permission by the Authority has been obtained.
There are now seven Commonwealth-specified types of zones within the Park, as summarised in Table 4 below (although this rises to eight, if we add the estuarine conservation zone, which is a State zoning only).
This table presents a very simplified description that conveys a broad picture of activities that are allowed. There are exceptions and additional restrictions for some categories.
The only ‘no go area’ is the Preservation Zone.
The ‘no-take area’ corresponds to the Marine National Park Zone.
In summary, individuals are allowed access to most areas of the Park for boating, diving and photography, but there are varying restrictions on what they can catch or collect.
Commercial operations require permits, and they are not allowed to engage in extractive activities in some zones.
Tourism programs are allowed in all zones except the Preservation Zone, but subject to permits that specify which activities are allowed. Shipping requires permits if operating outside of designated shipping lanes G/U Zones.
9

Table 4. Allowed Activities in GBRMP Zones, Simplified
Activity General Use Zone
Habitat Protection
Zone
Conservation Park Zone
Buffer Zone
Scientific Research
Zone
Marine National
Park Zone
Preservation Zone
no take no go
Trawling yesNetting (other than bait netting) yes yesBait netting, crabbing yes yes yesLimited spearfishing (snorkel only), line fishing yes yes yesLimited collecting yes yes yesTrolling yes yes yes yesBoating, diving, photography yes yes yes yes yes yesTraditional uses of marine resources yes yes yes yes yes yesLimited impact research yes yes yes yes yes yes permit
Dive-based fishing (sea cucumber, permit permit trochus, tropical rock lobster)Aquaculture, dive-based fishing (aquarium fish, permit permit permit coral, beachworm) Shipping (other than in designated shipping area) yes permit permit permit permit permitTourism program permit permit permit permit permit permitResearch (other than limited impact) permit permit permit permit permit permit permit Source: GBRMPA.
GBRMPA receives limited income from the issue of permits to commercial operators. A fee of $4 per person per day is collected from tourism operators. This amounts to revenue of about $8 million a year.
GBRMPA receives no income from commercial fishing licences, boat registration fees, or for shipping moving through the Park. (There are no Queensland licence fees for ocean recreational fishing.)
Fishing licence fees are paid to the Queensland Fisheries Service and boat registration fees to Queensland Transport Services, while shipping charges including pilot fees are paid to port authorities. Permits are required for ships to move through the Park but GBRMPA receives no corresponding income. There are considerable risks of oil spills, but the costs of recovery from damage are seen as an insurance matter.
Estimates of the impacts of the new Zoning Plan on commercial fishing, recreational fishing and tourism have been examined (GBRMPA, December 2003), and require continuing monitoring.
2.2 Defining The Reef Catchment Area
The boundary of the Great Barrier Reef Catchment Area (GBRCA) is shown in Figure 1 below (OESR, 2005).
It is essentially the catchment area for waters that flow into the Great Barrier Reef Marine Park (GBRMP). It is defined geographically as a set of Local Government Areas (LGAs) where these LGAs have rivers that flow into the GBRMP.
The western boundary more or less follows the Great Dividing Range. At the northern end, the Catchment Area extends further west to the Gulf of Carpentaria because the relevant LGAs cover the whole width of the Cape York Peninsular.
10

0
kilometres150 300
Kolan (S)
Duaringa (S)
Broadsound (S)
Sarina (S)
Mackay (C)
Whitsunday (S)
Monto (S)
Livingstone (S)
Taroom (S)
Nebo (S)
Mirani (S)
Dalrymple (S)
Charters Towers (C)
Townsville (C)Thuringowa (C)
Burdekin (S)
Hinchinbrook (S)
Cook (S)
Bowen (S)
Belyando (S)
Eacham (S)Johnstone (S)
Cardwell (S)
Atherton (S)Cairns (C)
Herberton (S)
Mareeba (S)Douglas (S)
Bauhinia (S)
Peak Downs (S)
Bungil (S)
Emerald (S)
Jericho (S)
Aurukun (S)
Torres (S)
Bundaberg (C)
Burnett (S)
Kolan (S)
Monto (S)
Miriam Vale (S)
Gladstone (C)
Calliope (S)
Banana (S)
Mount Morgan (S)
Rockhampton (C)Fitzroy (S)
Livingstone (S)
Bundaberg (C)
Insert one: LGAs in south of the GBRCA
Coral Sea
SOUTH
PACIFIC
OCEAN
Figure 1. Great Barrier Reef Catchment Area and Included LGAs Source: OESR (2005)
The Great Dividing Range becomes more poorly defined as it moves south. The southern boundary of the Catchment Area extends from north of Roma to the coast south of Bundaberg.
11

The Catchment Area extends about 100 kilometres further south along the coast than the Marine Park. Water from the Bundaberg River is carried north into the Park by currents. The southern boundary of the Catchment Area excludes some parts of rivers that flow into the Bundaberg River. Major cities and towns within the Catchment Area are Cairns, Townsville, Charters Towers, Bowen, Mackay, Rockhampton, Gladstone and Bundaberg.
The GBRCA corresponds approximately to the ABS Statistical Divisions (SDs) of Far North, Northern, Mackay and Fitzroy.
The Statistical Divisions of Northern, Mackay and Fitzroy are wholly contained within the Catchment Area. Around 85% of the Far North SD is within the Catchment Area; the other 15% in the south west is sparsely populated.
The GBRCA also includes around 30% of the Wide Bay-Burnett SD (Bundaberg is in the Catchment Area, but Maryborough, Hervey Bay and Gympie are not) and the northern 20% of the Darling Downs SD.
For the purposes of our analysis, which is based on Queensland Regional Input Output Tables, we have approximated the GBRCA as consisting of the Statistical Divisions of Far North, Northern, Mackay and Fitzroy. However, we have included commercial fishing data for boats from Bundaberg, and we report additional tourism estimates for the Bundaberg tourism region.
2.3 Why Focus On The Catchment Area?
Most residents in the GBRCA are relatively close to the GBRMP and can use it for recreational purposes.
However, travel distances from the western borders of the Catchment Area to the Marine Park are 400 kilometres in some cases.
The BTR, in its Assessment of tourism activity in the GBR Marine Park Region (2003), used a stricter definition of accessibility for recreational purposes that excluded some of the western parts of the Catchment Area.
Use of a water catchment area that includes all rivers that flow into the GBRMP is appropriate for studies of the effects on the Reef of water run-off from the land, and from industrial activity, commercial activity and households.
The rivers collect chemicals and sediments that can affect marine life on the Reef. Sediments may be the result of heavy rain or flood control strategies. Agriculture generates chemicals in the rivers in the form of run-off that includes phosphate fertilisers and residues from treatments for diseases – herbicides, insecticides. There can also be considerable detergents and residues from industrial and household processes.
12

3. THE NATURE OF ACCESS ECONOMICS’ ANALYSIS
The measurement of the economic and financial value of the GBRCA and GBRMP in this report concentrates on:
An accounting framework that complies with the various rules of the United Nations System of National Accounts (SNA) to avoid problems such as double-counting and resulting charges of over-claiming or exaggeration.
Those activities for which market transactions, or imputations based on related market transactions, are available.
Specifically focussing on three areas of activity: tourism, commercial fishing and ‘cultural and recreational services industry’ activity.
For completeness, data relating to other economic activities located within the GBRCA are also presented in this report.
A flow-based analysis, for the financial year 2004-05.
3.1 Aggregating Across Tourism & Other Activity
When seeking a single number to quantify the economic and financial value of the GBRCA and the GBRMP aggregation across the three specific industry activities: tourism, commercial fishing and the ‘cultural and recreational services’ industry, adjustments must be made to ensure no double counting, as noted above.
Adjustments are needed:
To reduce the value assigned to the ‘cultural and recreational services’ industry by the value therein assigned to tourism under the TSA approach.
To add to the value assigned to the ‘cultural and recreational services’ industry an estimated amount for recreational fishing by local residents.
To add to the value assigned to the tourism industry an estimated amount for recreational fishing by tourists.
Accordingly, tourism, commercial fishing and the ‘cultural and recreational services’ industry:
are defined consistent with ABS ANZSIC industry definitions and/or TSA definitions, with three exceptions:
– Most of recreational fishing has been added to the ‘cultural and recreational services’ industry rather than being spread across a number of other industries.
– The remainder of recreational fishing has been added to the TSA-based tourism industry measure.
13

– The part of the ‘cultural and recreational services’ industry effectively included
in the TSA based measure of tourism has been subtracted from the ‘cultural and recreational’ industry.
These adjustments have been made to avoid double counting when aggregating to obtain the economic and financial value of the GBRCA and the GBRMP.
3.2 Limitations Of The Analysis
This report does not cover:
A balance sheet analysis, identifying the value of the stock of assets contained within the GBRCA or the GBRMP.
Non-market activities for which imputed market values cannot readily be compiled (such as indigenous activities within the GBRCA, and probably substantial externality effects, notably external diseconomies due to water pollution affecting the GBRCA and GBRMP and generated as a by-product of other activity).
Environmental accounting in the national accounts is still in its infancy, but it is a matter currently under investigation by the ABS (for example, see Accounting for the environment in the national accounts, ABS Cat 5206.0, June quarter 2002, pages 13-25).
3.3 Economic Contribution Vs Economic Impact Studies
This report provides an economic contribution study, not an economic impact study:
The former is an economic accounting exercise, relating to a specific period (in this case 2004-05), that seeks to capture all of the market-related activity flows for the specified industries or activities. It tells a story about the value of that activity at that time, but does not explain why or how that activity came about.
The latter is properly tackled as a general equilibrium modelling exercise, where a specified change (or ‘shock’) to the status quo is quantified and run through the model to explore how the model solution changes. If the model is properly structured, this exercise does quantify how the specified shock impacts on the rest of the model of the economy under consideration.
The direct and indirect impacts of tourism (and other industries) are often characterised as multipliers, expressed in statements such as: ‘Every 100 visitors generates one job’. (Even at this level, this report is different, because the TSA approach forces the analysis to concentrate on what travellers spend, and its contribution to value added, rather than how many of them visit.)
But even using the TSA approach, these so-called ‘multipliers’ must be treated carefully. While expressing the data in this manner may be seen as a convenient rule of thumb, Access Economics cautions against overuse of these ‘multipliers’.
The rest of this section of the report briefly explains why.
Tourism and other businesses often have significant scale economies. Airports, airlines, hotels, restaurants and many other tourism businesses could increase output by 10% (that is,
14

serve 10% more tourists) by only increasing inputs (such as labour) by, say, 4%. If they also have spare capacity, they can boost activity without adding to the staff employed, at least to some extent.
Some may argue this is bad news: the employment multiplier is less than expected. Access Economics believes that this is not a sensible way of looking at the issue. Instead, this example suggests that increasing traveller demand will increase jobs, albeit perhaps by less than the average ‘multiplier’ implied, but it will increase the economic payoffs to the region even more as these scale economies are captured.
Spending on travel is in significant part a substitute for spending on other items. For example, if there was a short-term downturn in travel, it may well be offset by increases in other types of spending. To be more specific, suppose a few Cairns residents had planned to travel to Mossman for lunch, but it was raining, so they went to a local restaurant instead. Lunch was still eaten and money was still spent, but Mossman would have counted as tourist expenditure, whereas the local restaurant is not counted, because it is a local (non-tourist) meal. In this example, the reduction in tourist expenditure is offset by an increase in non-tourist expenditure, so a simple multiplier would overstate the effect on the GBRCA.
Hence the caveat: over reliance on, or careless interpretation of, multipliers can lead to inaccuracies.
15

4. COMPILING THE RELEVANT DATA FOR 2004-05
4.1 Possible Data Sources
The report is for the financial year 2004-05 but has been written in May 2005, before 2004-05 is complete.
The most recent data in many cases are for calendar year 2003 or financial year 2003-04. Consequently, values for 2004-05 need to be estimated by projecting forward for one or two years.
Data are required for activities in the specified industries located in the GBRCA and GBRMP areas, and also for Queensland and Australia, and the contributions of individual industries within the GBR Catchment Area.
4.1.1 Tourism
The sources of tourism data are:
Tourism Research Australia (TRA) CD-MOTA data for international visitors and domestic visitors, for Australia, Queensland and tourism regions within Queensland. They include numbers of visitors and visitor nights, and also expenditure details, although expenditures are for whole trips and splits between regions have to be estimated. The latest quarterly data are for September 2004.
TRA has estimated expenditures within tourism regions using its Regional Expenditure Model separately for international and domestic visitors. The latest results are for calendar year 2003.
The TRA data are to be scaled to be consistent with national Tourism Satellite Accounts (TSA) data which is available for 2003-04.
More up to date tourism data on total international arrivals are available from the ABS Overseas Arrivals and Departures Australia, monthly, with the latest data being for March 2005. There are no published arrivals data by state. (In the event, we have not used this data.)
Tourism Forecasting Committee annual estimates for calendar year 2005 onwards and data for recent years. Estimates for domestic visitor nights and expenditure are by state and type of visitor (holiday, business, etc.). Estimates for numbers of international visitors and associated expenditure are for Australia.
BTR paper for GBRMPA (BTR, 2003) using tourism data 2002-03 for the GBRMP tourism region which consists of modified versions of the standard tourism regions and islands within the GBRMP. The modified tourism regions are defined in terms of local government areas, and correspond to those parts of the GBR Catchment Area that are relatively close to the ocean.
The tourism data show an appreciable decline in 2000 and 2001 that is gradually recovering but in 2003 had still not reached the 1999 level.
16

This no doubt reflects the effects of the Sydney Olympic Games and the subsequent shocks associated with 11 September 2001, the collapse of Ansett, the SARS outbreak and the Iraq war. This is particularly pronounced for international visitors, and especially in the Tropical North that includes Cairns. There is a corresponding, but lesser, dip for domestic visitors to the GBRCA, with the size of the dip declining going from north to south (presumably as ground transport becomes a more practical option).
TRA data are available for the number of visits to tourism regions and also for visits to the GBRMP, as identified by the GBR indicator. For example, the GBR indicator may record 2 days of a 7-day trip as visiting the reef, and the nights and remaining time on shore in the GBRCA..
In order to measure GBRCA exports of tourism, total tourists are separated into international, interstate, the rest of Queensland (outside the GBRCA), and those domiciled within the GBRCA.
Many day trips and short distance overnight trips are counted as tourism rather than local recreational trips. The TRA defines overnight travel as involving a stay away from home for at least one night, at a place at least 40 kilometres from home. Day visitor travel requires a round trip distance of at least 50 kilometres and being away from home for at least four hours. It excludes travel as parts of an overnight trip and commuting between work/school and home.
4.1.2 Commercial Fishing
The sources of commercial fishing data are:
Queensland Department of Primary Industries & Fisheries (QDPI&F) data in file CHRIS.xls. Detailed records of tonnes, number of boats, and days fishing, and estimated gross value of product (based on processor prices and described by QDPI&F as ‘purely indicative’) annually from 1988 to 2003, for the GBR World Heritage Area (WHA)6 and other areas.
The WHA is slightly larger than the GBRMP but provides a sufficient approximation to the Park for the commercial fishing aspects of this report. The data refer to fish that are caught within the WHA, even though some of the relevant fishing boats come from ports such as Bundaberg that are not adjacent to the GBRMP.
Data for fishing and aquaculture for recent calendar years up to, and including, 2004 have been received from QDPI&F. Data for the 6 months from 1 July 2004 and the corresponding 6 months from 1 July 2003 were requested for the purpose of estimating the reduction in fishing due to introduction of the new zones (which took effect from 1 July 2004).
Data for payments for commercial fishing licences and boat registration associated with use of the GBRMP, even though these payments are made to state authorities
6 The GBR World Heritage Area differs from the GBRMP by including waters above the mean low water
mark (the Marine Park boundary) and into the creeks and inter-tidal areas.
17

rather than to GBRMPA. They are contributions to the Queensland economy even if not to the GBRCA or GBRMP. Nevertheless, given that they are associated with use of the GBRMP, they could be argued to constitute contributions sourced both to the GBRCA and GBRMP as well as to Queensland and Australia. There are no recreational fishing licence fees for ocean fishing in Queensland.
Data for payments for pilots to navigate through the Reef and for port charges, especially for coal ships. These charges are received by local port authorities and contribute to the economy of the GBRCA.
ABARE measures of tonnes, export tonnes and value of production for fishing and aquaculture in Queensland for 2001-02 and 2002-03. The ABARE tonnes and value of production (around $290m) for Queensland exceed those from QDPI&F ($215m). The difference is due primarily to the exclusion of aquaculture in the QDPI&F CHRIS.xls data.
Bureau of Rural Sciences paper for GBRMPA (2003) which examines GBRMP commercial fishing in considerable detail, and estimates the decrease in fishing activity, by port, as a result of the new GBRMP zones coming into effect from 1 July 2004. Values for commercial fishing for 2004-05 will be based on QDPI&F trends in recent years, but reduced by the Bureau of Rural Sciences estimate of 10% for the overall decrease in commercial fishing as a result of introduction of the new zones from 1 July 2004.
4.1.3 Recreational Use
The distinction between tourism and recreational use is explained at the end of section 4.1.1. The distinction depends mainly on the distance travelled from home. A day fishing trip that required travelling 30 kilometres from home (ie a 60 kilometres round trip) would be classified as a tourist trip. For a resident of Cairns, fishing locally would be recreational use, but travelling along the coast to a favourite fishing spot – depending upon the distance involved – might be a tourist trip. Somebody living somewhere over 50 kilometres inland and going on a fishing excursion on the coast would be classified as a tourist, regardless of where in the ocean they fished.
Recreation is usually described by reference to the ABS ANZSIC ‘cultural and recreational services’ industry. This covers sport, gambling, libraries, museums, the arts, parks and gardens, and film, video, radio and television services. While these categories may be adequate for some studies, they do not include expenditure on other recreational activities within the GBRMP such as fishing, boating, sailing and snorkelling.
Major expenditures associated with GBRMP activities are on boats, fishing equipment, and scuba and snorkelling equipment. These have been allocated as follows: 25% to tourism and 75% to ‘cultural and recreational’ activity.
QDPI&F has estimated expenditure on recreational fishing (using boats) in the GBRMP for 2004 at around $100 million. QDPI&F data (for 1997) indicate that 55% of fish caught in the GBRMP were released.
18

4.1.4 Other Activities Within the GBRMP
International and coastal shipping passes through the GBRMP.
This includes exports of coal from within the GBRCA, movement of iron ore and other metallic ores around the Australian coast, and container ships in transit. To the extent that ships enter ports within the GBRCA they pay fees to the appropriate port authorities, or to Queensland Transport in the case of smaller ports. Ships passing through the GBRMP in most cases must carry a pilot, and the cost of this is paid to the appropriate port authority. Port and pilot fees are included in the regional input-output tables, but we have not identified them separately.
The GBRMPA does not receive any of this revenue.
Scientific research is another activity within the Park, but we have not been able to obtain quantitative estimates for it. This activity would be included in ABS ANZSIC industry 7810.
4.1.5 Other Industries Within the GBR Catchment Area
While tourism, commercial fishing and cultural and recreational activities (as defined in this report) are the major economic industries within the GBRMP itself, they are, nevertheless, relatively small compared with total activity as measured by value added or gross product within the GBRCA.
There is additional tourism activity on shore, and it is also instructive to estimate economic contributions of all industries within the Catchment Area.
In principle, all of the tourism contributions should be subtracted from the relevant industries, so that total contributions are the sums of the relevant industries and other activities, without any double counting. In practice, given the narrower industry focus of this report, it is easier to omit this step, and simply caution against adding tourism, commercial fishing and recreational contributions to the conventional ABS ANZSIC-defined industry results when discussing the estimates (see section 5.4 below).
The analysis requires descriptions of industries for the GBRCA, Queensland and Australia, and the dependencies of given industries on other industries. These are best described and quantified by using input-output tables.
The ABS has compiled national input-output tables for 1996-97 (the latest available year), while the Queensland Office of the Government Statistician has prepared corresponding 1996-97 input-output tables for Queensland and ten Queensland Regions. The regions correspond to the Queensland Statistical Divisions, as at 1996, with the exception of the Brisbane and Moreton Bay Statistical Divisions, which have been combined. As noted in section 2 above, the GBRCA is approximated by the sum of four regions – Fitzroy, Mackay, Northern and Far North.
The broad structures of input-output tables tend to be fairly steady over periods of five to ten years, so that the composition (but not the absolute levels) of industry costs and sales for 1996-97 are assumed by Access Economics to be reasonable overall approximations for 2004-05. Value-added, gross GBRCA product and other sales-based estimates are scaled up from
19

1996-97 to 2004-05 using the estimated change in Queensland gross value added (or GSP) over that period.
Employment by industry in 1996-97 is provided as part of the 1996-97 input-output data. Employment by industry (ANZSIC-defined) by region for the year to February 2005 is derived from ABS ‘data cube’ data, and extrapolated to June 2005 using an estimated annual increase of 2.8% in total employment from 2003-04 to 2004-05 (Access Economics, 2005).
In all cases employment is expressed in full time equivalents (FTE), calculated as the number of full time persons plus half the number of part time persons.
4.2 Data Limitations
The review above shows that the data available is subject to a number of limitations:
It is often dated, necessitating a ‘scaling up’ process to generate 2004-05 estimates.
It comes from a wide variety of sources, and so the underlying methodology used for its compilation may not be fully consistent.
And, beyond these aspects, it is subject to the specific narrow focus and the more general limitations briefly covered in section 3 of this report.
20

5. DIRECT ECONOMIC VALUE OF CATCHMENT AREA
Access Economics has calculated the gross area value added, gross area product, and employment contributions of various activities in the GBRCA using an input-output table for the Area.
The focus is on activities at least partly associated with, or undertaken within, the GBRMP, and specifically: tourism, commercial fishing and cultural and recreational activity.
As noted in section 3 above, tourism is analysed using a methodology based on the ABS TSA approach. The results for cultural and recreational use are adjusted to remove the tourism component thereof.
5.1 Tourism Data for the Catchment Area
Tourism is quantified for the GBRCA, and some additional data on visitor numbers only are provided for the GBRMP.
The tourism contribution to the entire GBRCA is defined to cover the four Statistical Divisions, plus the associated offshore areas within the GBRMP.
The chosen definition of the GBRCA excludes parts of the Catchment Area around Bundaberg that account for about 30% of the Wide Bay-Burnett Statistical Division. The additional tourism contributions of Bundaberg to the GBRCA and GBRMP are estimated separately below.
Table 5 below summarises number of visits, number of visitor nights, expenditure and expenditure per night for visits to the GBRCA for the year ending September 2004. It also includes some corresponding data for Queensland and Australia. These data are based on National Visitor Survey (NVS) and International Visitor Survey (IVS) data collected by Tourism Research Australia (TRA) and previously collected by the Bureau of Tourism Research (BTR). Expenditures for Australia are based on TSA data for 2003-04, while expenditures for GBRCA are based on 2004-05 data in Table 24 of Attachment A. The expenditures are adjusted to the year ending September 2004 according to annual growth rates in expenditure from TFC-based data of 1.1% for day visitors, 3.3% for domestic overnight visitors and 5.5% for international visitors (see Attachment A). Note that this reference time period does not correspond to the financial year – 2004-05 – which is the focus in the remaining parts of Section 5.
Table 5 shows that about 19% of international visitors coming to Australia visit the GBRCA, and that the GBRCA accounts for 6.4% of nights spent in Australia by international visitors. The GBRCA also accounts for 5.0% of visits and 6.3% of nights for domestic overnight visitors. For day visitors, assumed to be Australian residents only, the GBRCA accounts for 3.8% of total Australian visits.
GBRCA expenditure per night for international visitors ($189) is above the average across Australia for international visitors ($135). Average expenditure per night for domestic overnight visitors ($135) is below the national average ($147), but there are large differences between interstate visitors ($170) and Queensland residents (between $99 and $114).
21

Interstate visitors have average expenditures well above the national average, probably at least partly because of above-average air fares.
Table 5 (bottom section) also shows the number of day visitors and the numbers of visits and visitor nights recorded in the NVS and IVS for visits to the Great Barrier Reef. The day visitor numbers refer only to visits by day tourists, most of whom would be GBRCA residents. The domestic overnight and international numbers refer only to visitors staying on islands within the GBRMP. Day visits by domestic overnight visitors and international visitors staying on the mainland are not included.
The total number of Reef visits in Table 5 is 625,000 and the total number of visitor nights spent on the Reef is 1,848,000.
These estimates can be compared with the number of visits to the Reef recorded by GBRMPA, (see Table 6 below). GBRMPA receives from registered operators the numbers of persons on tours within the GBRMP and the numbers of persons being transferred between the mainland and GBRMP islands. An overnight visitor to an island would be counted twice, for the trips to and from the island, plus any additional tours taken from the island. The GBRMPA numbers are thus more like a count of the number of visitor days than the number of visitors. GBRMPA does not record numbers of visitors in private boats.
GBRMPA has been consistently recording just under 2 million visits per year to the Reef, with modest average annual growth over the period from 2001 to 2004.
The GBRMPA estimates are quite different from the TRA estimates, and the two measures are not directly comparable because TRA omits day visits from overnight and international visitors staying on shore, while GBRMPA omits visitors on private boats. Both measures are probably underestimates of the number of visitor days for visits to the Reef.
22
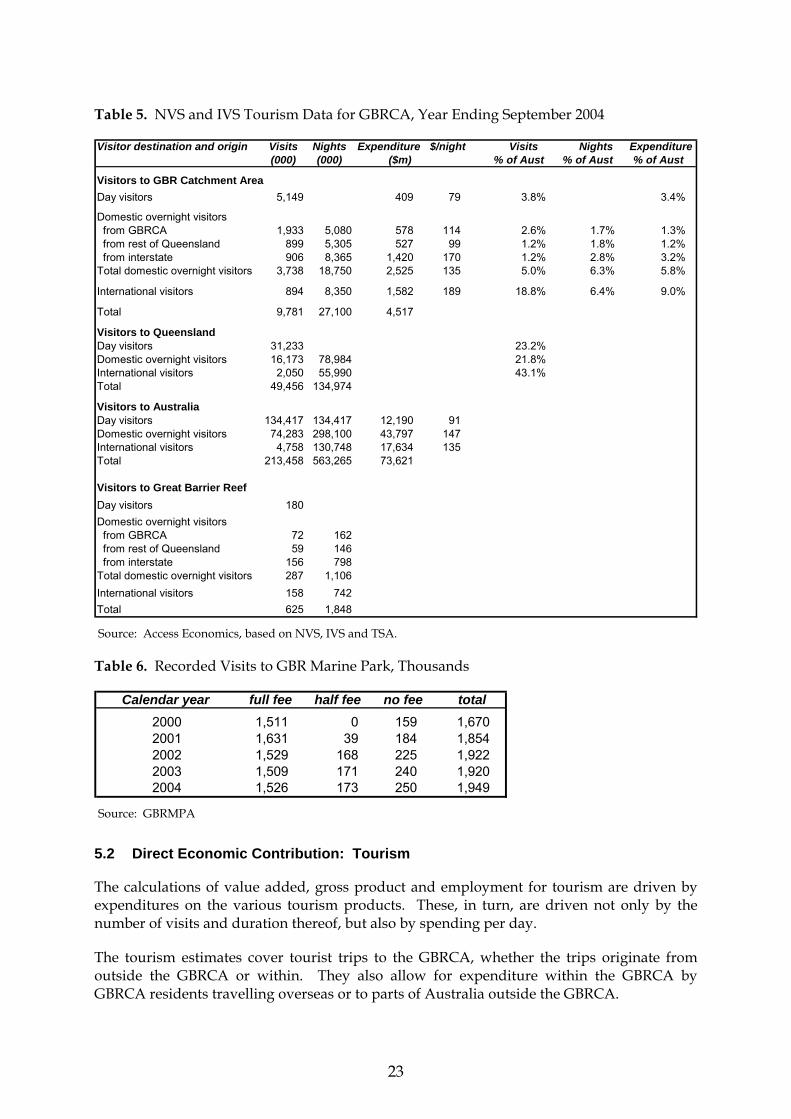
Table 5. NVS and IVS Tourism Data for GBRCA, Year Ending September 2004
Visitor destination and origin Visits Nights Expenditure $/night Visits Nights Expenditure(000) (000) ($m) % of Aust % of Aust % of Aust
Visitors to GBR Catchment AreaDay visitors 5,149 409 79 3.8% 3.4%
Domestic overnight visitors from GBRCA 1,933 5,080 578 114 2.6% 1.7% 1.3% from rest of Queensland 899 5,305 527 99 1.2% 1.8% 1.2% from interstate 906 8,365 1,420 170 1.2% 2.8% 3.2%Total domestic overnight visitors 3,738 18,750 2,525 135 5.0% 6.3% 5.8%
International visitors 894 8,350 1,582 189 18.8% 6.4% 9.0%
Total 9,781 27,100 4,517
Visitors to QueenslandDay visitors 31,233 23.2%Domestic overnight visitors 16,173 78,984 21.8%International visitors 2,050 55,990 43.1%Total 49,456 134,974
Visitors to AustraliaDay visitors 134,417 134,417 12,190 91Domestic overnight visitors 74,283 298,100 43,797 147International visitors 4,758 130,748 17,634 135Total 213,458 563,265 73,621
Visitors to Great Barrier ReefDay visitors 180Domestic overnight visitors from GBRCA 72 162 from rest of Queensland 59 146 from interstate 156 798Total domestic overnight visitors 287 1,106International visitors 158 742Total 625 1,848 Source: Access Economics, based on NVS, IVS and TSA.
Table 6. Recorded Visits to GBR Marine Park, Thousands
Calendar year full fee half fee no fee total2000 1,511 0 159 1,6702001 1,631 39 184 1,8542002 1,529 168 225 1,9222003 1,509 171 240 1,9202004 1,526 173 250 1,949
Source: GBRMPA
5.2 Direct Economic Contribution: Tourism
The calculations of value added, gross product and employment for tourism are driven by expenditures on the various tourism products. These, in turn, are driven not only by the number of visits and duration thereof, but also by spending per day.
The tourism estimates cover tourist trips to the GBRCA, whether the trips originate from outside the GBRCA or within. They also allow for expenditure within the GBRCA by GBRCA residents travelling overseas or to parts of Australia outside the GBRCA.
23

Direct contributions of tourism for 2004-05 have been estimated separately for:
travellers from within the GBRCA;
travellers from the rest of Queensland;
interstate travellers; and
international travellers.
Where relevant, each is the sum of contributions from day visitors and overnight visitors (this tends not to apply to the last two groups above, and most of the second group, which are predominantly overnight visitors).
The GBRCA accounts for a much higher proportion of domestic overnight and international tourism within Australia than its proportion of economic activity generally. The relevant GBRCA proportions of national aggregates are value added 4.1% (four Statistical Divisions in 1996-97, ABS 2001), population 4.3% (full Catchment Area in 2001, OESR 2005) and employment 4.6% (four Statistical Divisions in February 2005, ABS 2005b).
The contributions to the GBRCA are presented in Table 7 below, which also includes estimates for commercial fishing and cultural and recreational activity.
Table 5.2.1 below also shows that the contributions of tourism to the GBRCA far exceed those from commercial fishing and (as estimated) cultural and recreational activity.
The estimated additional tourism contributions for the Bundaberg tourism region are around 5% of the total tourism results presented in Table 7.
These results are not included in Table 7 and are therefore additional to the results therein.
The 5% result is obtained by summing international, interstate and ‘rest of Queensland’ contributions obtained from the TRA data. NVS/IVS visitor nights are expressed as proportions of corresponding results for the GBRCA and then converted to expenditures using TRA-based estimates of average expenditures per night. The Bundaberg tourism region accounts for an additional 2% of international visitor nights, an additional 7% of interstate visitor nights, and an additional 16% of rest of Queensland visitor nights. While average expenditure per night for international visitors is fairly constant across the GBRCA, average expenditure per night for domestic overnight visitors for Bundaberg and Fitzroy at the southern end of the GBRCA is about 56% of the GBRCA average. Accordingly, the additional Bundaberg expenditure contributions to the GBRCA are scaled back for this factor to: 2% for international visitors, 4% for interstate visitors and 9% for visitors from the rest of Queensland. The weighted sum of these results is around 5%.
24

ribution Direct Direct Direct
Table 7. Direct Contributions of Selected Activities to the GBRCA, 2004-05
Direct cont
Value Added GSP, GDP Employment($m) ($m) (FTE 000)
Total tourism within the GBRCA Visitors from GBRCA 456 554 7 Visitors from rest of Queensland 246 297 3 Interstate visitors 676 810 9 by GBRCA residents for travel outside GBRCA 55 65 1 International visitors 742 902 13Total tourism 2,176 2,627 33Commercial fishing 68 69 1Recreational activity (net of tourism) 302 348 6Total contribution to GBRCA 2,546 3,043 39
Source: Access Economics. All magnitudes are to the nearest $million. Totals may not add due to rounding.
Table 8. below shows the distribution across industries of tourism, commercial fishing and cultural and recreational activity value added contributions within the GBR Catchment Area for 2004-05.
Table 9. below presents estimates for the economic contributions of the selected industries to the Queensland economy, and Table 10 presents the same estimates for the Australian economy as a whole.
The major differences between Table 6 and both 8 and 9 are that the Queensland and Australian estimates include larger proportions of air fares and other long distance travel expenses than is assumed for the GBRCA.
All domestic airfares associated with visits to the GBRCA contribute fully to tourism for Australia. However, only a proportion of these airfares is assumed to generate activity within the GBRCA itself (or to Queensland as a whole).
Similarly, all international airfares (associated with Australian-owned airlines) relating to visits to the GBRCA contribute to tourism for Australia, but these contribute to the GBRCA only for arrivals at and departures from international airports within the GBRCA (Cairns, Townsville).
For international visits to the GBRCA, only about 40% of the international arrivals and departures are through Cairns. We assume therefore that only 40% of the associated international airfares contribute to the GBRCA. The remainder are associated with domestic aviation feeder services to GBRCA, and the international airfare component is either a contribution to the Queensland economy or more generally Australia as a whole.
In addition some fishing charges accrue to Queensland authorities rather than to GBRCA authorities.
25

Table 8. Direct Contributions of Value Added for Selected Industries within the GBRCA, by Input-Output Industry, 2004-05, $million
Industry total commercial recreational total commercial recreationaltourism fishing activity tourism fishing activity
($m) ($m) ($m) (%) (%) (%)Sheep, grain 0 0 0 0% 0% 0%Beef cattle 0 0 0 0% 0% 0%Dairy cattle and pigs 0 0 0 0% 0% 0%Other agriculture, sugar cane growing 14 0 0 1% 0% 0%Forestry and fishing 5 0 0 0% 0% 0%
Coal, oil and gas 0 0 0 0% 0% 0%Non-ferrous metal ores 0 0 0 0% 0% 0%Other mining 0 0 0 0% 0% 0%Food manufacturing 59 6 1 3% 9% 0%Textiles, clothing and footwear 8 0 0 0% 0% 0%Wood and paper manufacturing 19 1 0 1% 2% 0%Chemicals, petroleum and coal products 35 7 6 2% 11% 2%Non-metallic mineral products 1 0 0 0% 0% 0%Metals, metal products 1 3 0 0% 4% 0%Machinery, appliances and equipment 52 12 10 2% 18% 3%Miscellaneous manufacturing 3 1 4 0% 1% 1%Electricity supply, gas and water 0 1 0 0% 1% 0%Residential building construction 0 0 0 0% 0% 0%Other construction 0 0 0 0% 0% 0%Trade 420 25 0 19% 38% 0%Accommodation, cafes and restaurants 593 1 1 27% 1% 0%Road transport 49 1 0 2% 2% 0%Rail and pipeline transport 28 0 0 1% 0% 0%Other transport 377 2 2 17% 2% 1%Communication services 55 1 0 3% 2% 0%Finance, property and business services 42 4 1 2% 6% 0%Ownership of dwellings 101 0 0 5% 0% 0%Government administration and defence 0 1 2 0% 2% 1%Education 7 0 0 0% 0% 0%Health and community services 129 0 0 6% 0% 0%Cultural and recreational services 127 0 275 6% 0% 91%Personal and other services 51 0 0 2% 1% 0%
Total GBRCA 2,176 68 302 100% 100% 100% Source: Access Economics. Values are rounded to the nearest $m so that zero means less than $0.5m. Totals may not add due to rounding.
26

Table 9. Direct Contributions of Selected Activities to Queensland, 2004-05
Direct contribution Direct Direct DirectValue Added GSP, GDP Employment
($m) ($m) (FTE 000)
Total tourism within the GBRCA Visitors from GBRCA 450 548 7 Visitors from Queensland 305 368 4 Interstate visitors 680 814 9 by GBRCA residents for travel outside GBRCA 56 66 1 International visitors 763 923 12Total tourism 2,254 2,718 32Commercial fishing 68 69 1Recreational activity (net of tourism) 277 319 6Total contribution to Queensland 2,599 3,105 39
Source: Access Economics.
Table 10. Direct Contributions of Selected Activities to Australia, 2004-05
Direct contribution Direct Direct DirectValue Added GSP, GDP Employment
($m) ($m) (FTE 000)
Total tourism within the GBRCA Visitors from GBRCA 454 551 7 Visitors from Queensland 313 377 4 Interstate visitors 823 985 9 by GBRCA residents for travel outside GBRCA 57 66 1 International visitors 825 985 12Total tourism 2,471 2,964 33Commercial fishing 68 69 1Recreational activity (net of tourism) 315 363 4Total contribution to Australia 2,854 3,396 38
Source: Access Economics.
Economic contributions in Table 10 for Australia are in general (as would be expected) greater than those in Table 9 for Queensland which, in turn, are in general greater than those in Table 7 for the GBRCA.
This applies especially for tourism as a result of the inclusion of increased proportions of airfares. For tourism value added, the GBRCA contribution is 88% of the Australian contribution and the Queensland contribution is 91% of the Australian contribution.
However, there are exceptions from this Australia-Queensland-GBRCA pattern for some of the entries in the tables. The entries are driven by the average value added and employment shares by industry for the different geographical areas, which are calculated from separately-compiled input-output tables and applied to the relevant shares of the industries of interest.
One area where the ‘expected’ ranking does not apply is for employment, where the estimates for Australia are slightly lower than the corresponding estimates for GBRCA and Queensland.
27

There are three possible reasons for these discrepancies. First, there may be genuine differences between different geographical areas. Second, there may be estimating errors in the underlying input-output data. The third possibility is that there are deficiencies in the methodology we have used for scaling production data from 1996-97 to 2004-05.
5.3 Direct Economic Contribution: Other Industries
The other major activities within the GBRMP are commercial fishing and cultural and recreational activities by local residents.
5.3.1 Commercial Fishing
Direct economic contributions for commercial fishing are estimated on the assumptions that the GBRCA-located industry has the same cost structure as the Queensland commercial fishing industry.
Access Economics estimates the gross value of production in 2004-05 for commercial fishing in the GBRMP as around $180 million, consisting of around $130 million for fish and $50 million for aquaculture.
These values are based on QDPI&F estimates for 2004 and preceding years.
The sum of aquaculture production for Fitzroy, Mackay, Northern and Far North Statistical Divisions has been fairly constant at around $50 million for several years. Fishing has averaged around $145 million but was reported as $125 million for calendar year 2004. Fishing production in the GBRMP is influenced by drought, competitive imports, changes in fishing techniques, and business amalgamations and closures, in addition to introduction of the new GBR zones from 1 July 2004. We have estimated the value for 2004-05 as approximately equal to $145 million less the 10% reduction anticipated as a consequence of introduction of the new zones (Bureau of Rural Sciences, 2003).
The direct contribution of commercial fishing to value added in the GBRCA is $68 million (see Table 7. above).
The same contribution applies for Queensland and Australia.
5.3.2 Local Resident Cultural & Recreational Activity
The contributions of local resident cultural and recreational activity for all of the GRBCA are calculated in two parts:
The first is the contribution of the industry identified as ‘Cultural & Recreational Services’ in the input-output tables.
The second is the contribution of recreational fishing by local residents. This activity is not included in Cultural & Recreational Services. There would also be contributions from expenditures on other recreational activities such as scuba diving, snorkelling and boating that are not included in Cultural & Recreational Services, but we have no data on these. It is expected that these other contributions would be small compared with recreational fishing.
28

All of the ‘Cultural and Recreational Services’ industry is treated as contributing to recreational activity within the GBRCA. However, some of its contributions have already been counted in tourism. To avoid double counting, as noted above, the recreational activity results are presented net of tourism components.
Recreational fishing is not allocated to one specific input-output industry in the ABS ANZSIC coding. Like tourism more generally, it can be defined as a collection of supplies of boats, petrol, tackle, travel, etc.
QDPI&F estimates the recreational fishing economic contribution to the GBRCA/GBRMP at around $100 million and has provided its industry composition (QDPI&F data request, 2005).
The QDPI&F data includes expenditures such as accommodation and travel that overlap with tourism. Based on the accommodation expenditure compared with overnight accommodation expenditure, Access Economics estimates that about 25% of recreational fishing is already included in tourism, and we net this out from the recreational fishing component added to cultural & recreational activity to avoid double counting.
5.4 Direct Economic Contribution: Non-Park Industries
The direct contributions (value added and employment) of all economic activities in the GBRCA are summarised in Table 11. below.
The value added entries are based on 1996-97 data that have been scaled to 2004-05 by multiplication by a common factor of 1.64 representing cumulative growth in Australian GDP over the period from 1996-97 to (the Access Economics forecast for) 2004-05 (Access Economics 2005). They are thus indicative.
The contributions of tourism, commercial fishing and cultural and recreational activity are shown at the bottom of the table for comparison.
These last three industries should not be simply added to those standard ANZSIC industries shown in the table as adding to ‘total GBRCA’. That would result in double counting in the table because the contributions for tourism, commercial fishing and recreational use are already included in the lines above the total. For example, commercial fishing is part of the ‘forestry and fishing’ industry. The value added for cultural and recreational activity (net of tourism) shown at the bottom of the table equals all of Cultural and Recreational Services, less the tourism component thereof, plus recreational fishing by local residents that consists of supplies distributed across ‘Machinery’ (boats) and other industries. Tourism is spread over many industries, with major contributions to ‘Other Transport’ (air services, tours), ‘Accommodation and meals’, ‘Food’, and ‘Trade’ (retail margin, takeaway meals).
Measured in terms of value added, tourism makes a major contribution to the total value added of the GBRCA (6.7%). It is larger than total agriculture (5.6% with a fraction of this being tourism) and is significant relative to total manufacturing (9.0%, with some of this being tourism).
The GBRCA direct tourism share of total value added is almost twice the direct national average for tourism, which is currently estimated at 3.5% for 2003-04, the latest year for which official national estimates are available (see TSA 2003-04, Table 1).
29
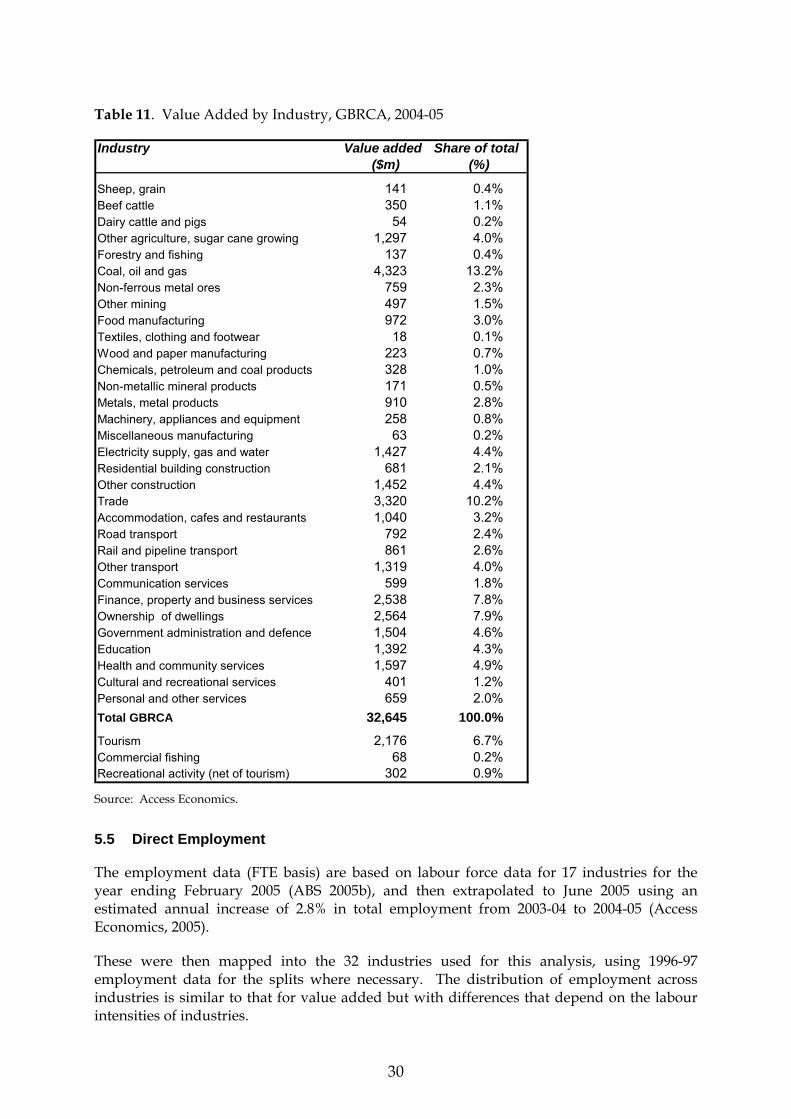
Table 11. Value Added by Industry, GBRCA, 2004-05
Industry Value added Share of total($m) (%)
Sheep, grain 141 0.4%Beef cattle 350 1.1%Dairy cattle and pigs 54 0.2%Other agriculture, sugar cane growing 1,297 4.0%Forestry and fishing 137 0.4%Coal, oil and gas 4,323 13.2%Non-ferrous metal ores 759 2.3%Other mining 497 1.5%Food manufacturing 972 3.0%Textiles, clothing and footwear 18 0.1%Wood and paper manufacturing 223 0.7%Chemicals, petroleum and coal products 328 1.0%Non-metallic mineral products 171 0.5%Metals, metal products 910 2.8%Machinery, appliances and equipment 258 0.8%Miscellaneous manufacturing 63 0.2%Electricity supply, gas and water 1,427 4.4%Residential building construction 681 2.1%Other construction 1,452 4.4%Trade 3,320 10.2%Accommodation, cafes and restaurants 1,040 3.2%Road transport 792 2.4%Rail and pipeline transport 861 2.6%Other transport 1,319 4.0%Communication services 599 1.8%Finance, property and business services 2,538 7.8%Ownership of dwellings 2,564 7.9%Government administration and defence 1,504 4.6%Education 1,392 4.3%Health and community services 1,597 4.9%Cultural and recreational services 401 1.2%Personal and other services 659 2.0%Total GBRCA 32,645 100.0%
Tourism 2,176 6.7%Commercial fishing 68 0.2%Recreational activity (net of tourism) 302 0.9%
Source: Access Economics.
5.5 Direct Employment
The employment data (FTE basis) are based on labour force data for 17 industries for the year ending February 2005 (ABS 2005b), and then extrapolated to June 2005 using an estimated annual increase of 2.8% in total employment from 2003-04 to 2004-05 (Access Economics, 2005).
These were then mapped into the 32 industries used for this analysis, using 1996-97 employment data for the splits where necessary. The distribution of employment across industries is similar to that for value added but with differences that depend on the labour intensities of industries.
30

Industr
Table 12. Direct Employment in GBRCA Industries, by Industry, 2004-05 (Thousands or %)
y total commercial recreational total commercial recreational
tourism fishing activity tourism fishing activityFTE 000 FTE 000 FTE 000 (%) (%) (%)
Sheep, grain 0.0 0.0 0.0 0% 0% 0%Beef cattle 0.0 0.0 0.0 0% 0% 0%Dairy cattle and pigs 0.0 0.0 0.0 0% 0% 0%Other agriculture, sugar cane growing 0.1 0.0 0.0 0% 0% 0%Forestry and fishing 0.0 0.0 0.0 0% 0% 0%
Coal, oil and gas 0.0 0.0 0.0 0% 0% 0%Non-ferrous metal ores 0.0 0.0 0.0 0% 0% 0%Other mining 0.0 0.0 0.0 0% 0% 0%Food manufacturing 0.6 0.1 0.0 2% 7% 0%Textiles, clothing and footwear 0.2 0.0 0.0 1% 0% 0%Wood and paper manufacturing 0.3 0.0 0.0 1% 2% 0%Chemicals, petroleum and coal products 0.2 0.0 0.0 0% 4% 0%Non-metallic mineral products 0.0 0.0 0.0 0% 0% 0%Metals, metal products 0.0 0.0 0.0 0% 2% 0%Machinery, appliances and equipment 0.7 0.2 0.1 2% 18% 3%Miscellaneous manufacturing 0.0 0.0 0.1 0% 1% 1%Electricity supply, gas and water 0.0 0.0 0.0 0% 0% 0%Residential building construction 0.0 0.0 0.0 0% 0% 0%Other construction 0.0 0.0 0.0 0% 0% 0%Trade 7.6 0.5 0.0 23% 50% 0%Accommodation, cafes and restaurants 12.9 0.0 0.0 39% 2% 0%Road transport 0.6 0.0 0.0 2% 2% 0%Rail and pipeline transport 0.3 0.0 0.0 1% 0% 0%Other transport 2.8 0.0 0.0 9% 1% 0%Communication services 0.4 0.0 0.0 1% 1% 0%Finance, property and business services 0.5 0.0 0.0 1% 5% 0%Ownership of dwellings 0.0 0.0 0.0 0% 0% 0%Government administration and defence 0.0 0.0 0.0 0% 2% 1%Education 0.1 0.0 0.0 0% 0% 0%Health and community services 2.4 0.0 0.0 7% 0% 0%Cultural and recreational services 2.4 0.0 5.2 7% 0% 94%Personal and other services 0.7 0.0 0.0 2% 1% 0%
Total GBRCA 32.9 0.9 5.5 100% 100% 100% Source: Access Economics. Totals do not always add due to rounding
5.6 Inter-Regional, Interstate and International Trade
For Australia as a whole, exports and imports of the ANZSIC industries ‘commercial fishing’ and ‘cultural & recreational services’ are available in input-output tables.
Exports of tourism equal expenditure on Australian-produced goods and services by overseas visitors to Australia, including those parts of prepaid airline fares and package tours paid to Australian firms. Imports of tourism are those same payments by Australian residents to foreign firms in relation to overseas visits. In 2003-04 tourism exports for
31

Australia totalled $17,317 million and tourism imports totalled $16,512 million (TSA 2004, Tables 9 and 8).
For Queensland, in addition to its shares of international tourism exports and imports, there are interstate imports corresponding to spending by Queenslanders visiting other States/Territories, and interstate exports corresponding to spending by persons from other States/Territories visiting Queensland. The Office of the Government Statistician (2004) has provided estimates of Queensland’s interstate exports and imports by industry in its Queensland and Queensland Regional Input-Output Tables for 1996-97, and these can be used as a starting point for scaled-up estimates for 2004-05. The imports data can then be used to estimate the proportions of industry supplies in each of the industries that constitute tourism, commercial fishing and recreational activity.
For the GBRCA, in addition to international and interstate trade, there are also imports into the GBRCA from the rest of Queensland and exports from GBRCA to the rest of Queensland. The individual regional input-output tables contain estimates of inter-regional flows. The GBRCA input-output table is constructed as the sum of four regional tables, although it does not have the inter-regional trade flows between these four regions netted out. As for Queensland, data by industry can be used to estimate the proportions of industry supplies associated with tourism, commercial fishing and recreational activity.
In the current analysis, all these measures are restricted to the set of visitors who visit the GBRCA and those GBRCA residents who travel outside the GBRCA. Furthermore, the estimates reported in this sub-section are restricted to the direct imports and exports.
5.6.1 Exports
Exports of tourism are given by the expenditures that lie behind the value added results presented in Table 7. Table 24 in Attachment A lists expenditures, obtained as the summation of day visitors and overnight visitors where appropriate, separately for the rest of Queensland, interstate and international. The results for the rest of Queensland would change slightly if Bundaberg was included as part of the GBRCA.
We have no direct measure of commercial fishing exports from the GBRCA.
Commercial fishing exports for Queensland appear to be 78% (ABARE, 2005) based on seafood exports and fisheries production by state, where both measures include both fish and aquaculture. However, the exports are measured fob at the port of export rather than where the fish are caught or the home port of the fishing boat, and also include the costs of transport between ports where relevant.
The Queensland exports presumably include some fish from the north coast of NSW. We assume that exports are 75% of the value of production for Queensland. Applying the same proportion to the GBRCA means that exports from the GBRCA are $135 million. We assume that the remaining $45 million of commercial fishing in the GBRCA is consumed within the GBRCA, and that there are zero sales to the rest of Queensland or interstate.
Exports of cultural and recreational activity (defined to be spending by non-local residents in the GBRCA) are zero because they are fully allowed for in tourism.
32

Access Economics’ estimates of exports and imports associated with tourism, commercial fishing and cultural & recreational activity in the GBRCA are presented in Tables 13 (GBRCA), 14 (Queensland) and 15 (Australia) below.
There are different row headings for exports and imports depending on whether the geographical area of interest is the GBRCA, Queensland or Australia. Note that exports and imports, measured as gross expenditures, do not line up with the estimates for value added and gross production in Tables 13, 14 and 15, because the latter net out input costs.
Table 13. GBRCA Exports and Imports for Selected GBRCA Activities, 2004-05, $million
Component of trade Exports: Imports: Imports: Net exportsvisitors to trips by GBRCA inputs of goods
GBRCA residents and services
Tourism Visitors to/from GBRCA 241 -241 Visitors to/from rest of Queensland 544 579 127 -162 Visitors to/from interstate 1,436 370 323 744 GBRCA residents travelling outside GBRCA 25 -25 Visitors to/from international 1,669 651 398 619Total tourism 3,649 1,600 1115 934Commercial fishing 135 54 81Recreational activity (net of tourism) 0 175 -175Total trade contribution to GBRCA 3,784 1,600 1344 840 Source: Access Economics.
Table 14. Queensland Exports and Imports for Selected GBRCA Activities, 2004-05, $million
Component of trade Exports: Imports: Imports: Net exportsvisitors to trips by GBRCA inputs of goods
GBRCA residents and services
Tourism Visitors to/from GBRCA 154 -154 Visitors to/from rest of Queensland 89 -89 Visitors to/from interstate 1,436 370 177 889 GBRCA residents travelling outside GBRCA 14 -14 Visitors to/from international 1,669 651 235 783Total tourism 3,105 1,021 669 1415Commercial fishing 135 41 94Recreational activity (net of tourism) 0 109 -109Total trade contribution to Queensland 3,240 1,021 819 1400 Source: Access Economics.
33

Table 15. Australian Exports and Imports for Selected GBRCA Activities, 2004-05, $million
Component of trade Exports: Imports: Imports: Net exportsvisitors to trips by GBRCA inputs of goods
GBRCA residents and services
Tourism Visitors to/from GBRCA 65 -65 Visitors to/from rest of Queensland 35 -35 Visitors to/from interstate 83 -83 GBRCA residents travelling outside GBRCA 5 -5 Visitors to/from international 1,669 651 101 917Total tourism 1,669 651 289 728Commercial fishing 135 18 117Recreational activity (net of tourism) 0 53 -53Total trade contribution to Australia 1,804 651 361 792 Source: Access Economics.
5.6.2 Imports
Imports consist of (a) tourist expenditures by GBRCA residents outside the GBRCA and (b) imports into the GBRCA that are used as inputs into the tourism, commercial fishing and recreational activity industries. The estimates reported in this sub-section are restricted to direct imports.
Firstly, there are expenditures outside the GBRCA by GBRCA residents on trips to the rest of Queensland, on interstate trips and on international trips. Expenditure within the GBRCA that is associated with these trips is not an import. It has already been included as tourism expenditure within the GBRCA in Table 13. We assume that international imports by GBRCA residents associated with an overseas trip are probably in much the same proportions as for Australia.
Next, some of the inputs used to provide tourism and other services are imported into the GBRCA from either overseas, interstate or other parts of Queensland. For example, there is relatively little wine produced in Queensland and even less in the GBRCA, so that most wine is imported from other states and from other countries. Similarly, some food products are supplied from outside the region. Much machinery and many tourist souvenirs are imported from overseas.
The calculations are much less simple in the cases of interstate and inter-regional imports. The Queensland input-output table contains the total value of interstate imports used by each industry, but not the industry composition of these imported inputs
For each industry, we can multiply the total interstate imports by the share of that industry that is accounted for by tourism. The same procedure can be used for commercial fishing and recreational fishing. In the case of the Cultural & Recreational Services part of recreational activity, imports are available in the input-output table, although adjustment must be made for the overlap with tourism. Interstate imports have been scaled from 1996-97 to 2004-05 by multiplication by a common factor of 1.64 representing cumulative growth in Australian GDP over the period from 1996-97 to (Access Economics forecast for) 2004-05 (Access Economics 2005). They are thus indicative.
The procedure for the GBRCA is the same as that for Queensland, but using the GBRCA input-output table.
34

5.6.3 GBRCA Export and Import Estimates: Some Comments Tables 13, 14 and 15 show that the sum of the contributions from the selected GBRCA activities results in a net trade surplus of the order of $0.8 billion for the GBRCA, $1.4 billion for Queensland, and $0.8 billion for Australia.
Exports of tourism increase moving down from Australia as a whole to GBRCA, because expenditures by visitors from interstate and the rest of Queensland count as exports for GBRCA but not for Australia. The same pattern applies for expenditures by GBRCA residents travelling outside the GBRCA. Similarly, imports of goods and services are larger for GBRCA than for Australia because imports for Australia are international imports only, whereas imports for GBRCA also include imports from interstate and other Queensland regions.
Many of the entries in these three tables depend on assumptions and approximations, and the numerical results are sensitive to these.
Imports of goods and services have been calculated by assuming that imports into each industry, for the activities of interest, are in the same proportions as for those industries as represented in the three 1996-97 input-output tables. This leads to two possible sources of error. Firstly, the import shares may have changed since 1996-97. Secondly, the import share for the tourism part of an industry may not be the same as the import share for the industry as a whole.
The TSA for 2002-03 (ABS 2004) provides a partial check on imports of tourism goods and services for Australia. Table 8 in that publication shows that total imports purchased in Australia by tourists in 2000-01 were $4,092 million. (There is no corresponding information in TSA 2003-04.) We have estimated that the GBRCA accounts for about 7.5% of total expenditure on tourism in Australia in 2004-05.
If we assume that the same share applies to imports, then GBRCA would have accounted for $307 million of imports into tourism in 2000-01. The corresponding value in 2004-05 is $371 million if it is assumed that it increased by a factor of 1.21 representing cumulative growth in the nominal value of Australian imports over the period from 2000-01 to (Access Economics forecast for) 2004-05 (Access Economics 2005).
The value of $289 million in Table 15 is considerably less. This suggests that the imports of goods and services presented in Table 15, and also presumably Tables 14 and 15, may be under-estimates.
35

6. INDIRECT ECONOMIC VALUE OF CATCHMENT AREA
6.1 Indirect Economic Value As Measured
When a tourist buys (say) a meal in a restaurant, the direct economic impact (reported in the tourism part of Section 5) is only the value added directly at the restaurant. This would include the wages of staff and the gross operating surplus of the restaurant.
For example, if the meal purchased by the tourist cost $40 and the raw inputs purchased by the restaurant were $16, only the $24 value added by the restaurant is included. Similarly, if the restaurant sells a bottle of wine for $25, worth $15 wholesale, only the $10 value added is included. (Note that value added is measured at basic prices, so excludes GST and other indirect taxes.)
If the restaurant used raw ingredients that mostly came from GBRCA abattoirs, fisheries and wholesalers then much of the $16 cost of the raw materials in the above example is a further, albeit indirect, contribution made via expenditure by the tourist to the GBRCA economy.
However, if some of the inputs were imported from another region, state or from overseas, the indirect impact on GBRCA region output and employment would be less.
Therefore, a restaurant that serves GBRCA meat would make a greater indirect economic contribution to the GBRCA than a restaurant that serves South Australian wine and meat from western Queensland, for example.
To measure indirect value added requires the tourism expenditure on each item to be traced to each input used in its production, and the inputs used to create these inputs, and so on.
The mathematical technique used to sum this chain of inputs requires the inversion of a matrix of coefficients derived from the GBRCA input-output table that summarises the relationships between different GBRCA industries (see Attachment A).
Indirect contributions for Queensland and Australia, for visitors to the GBRCA, are calculated in a similar way using input-output tables for Queensland and Australia.
The indirect contributions for Queensland are expected to be greater than for the GBRCA, and the Australian indirect contributions to be larger again. This is because the larger the area being considered, the larger the proportion of inputs that are supplied from that area.
Table 16 below summarises the indirect contributions of tourism, commercial fishing and cultural and recreational activity to the GBRCA. Tables 18 and 19 present the corresponding results for Queensland and for Australia.
As is frequently the case for such analyses, the indirect contributions of the three industry groups shown in Table 16, whether to value-added, gross product, or employment, tend to be less than the direct contributions estimated in Section 5 above.
The discrepancy is largest the smallest region (the GBRCA) and smallest for the largest region (Australia as a whole). This reflects the increasing scope for ‘upstream’ inputs to be
36

sourced to production outside the region – and therefore not counting as part of the industry’s contribution to the region – the smaller is the region in question.
Comparisons between Tables 16, 18 and 19 show that indirect contributions for the selected activities (tourism, commercial fishing, and recreational activity) are indeed greater for Australia than for Queensland, and least for GBRCA, as expected.
The effect is appreciable in the case of tourism. Expressed another way, the ratio of the indirect value added to the direct value added for tourism (see also Tables 7, 9 and 10) is 0.41 for the GBRCA, 0.64 for Queensland and 0.82 for Australia.
Table 16. Indirect Contributions of Selected Activities to the GBRCA, 2004-05
Indirect contribution Indirect Indirect IndirectValue Added GSP, GDP Employment
($m) ($m) (FTE 000)
Total tourism within the GBRCA Visitors from GBRCA 180 193 2 Visitors from rest of Queensland 103 110 1 Interstate visitors 265 283 3 by GBRCA residents for travel outside GBRCA 21 22 0 International visitors 315 342 4Total tourism 884 951 10Commercial fishing 36 37 0Recreational activity (net of tourism) 107 113 1Total contribution to GBRCA 1,027 1,102 12
Source: Access Economics.
Table 17 below shows the distribution of indirect contributions across industries for tourism (total), commercial fishing and cultural and recreational activity.
These distributions are quite different from the direct contributions shown in Table 8 above, where the largest contributions to tourism are from Accommodation, Other Transport and Trade, the largest contributions to Commercial fishing are from Trade, Machinery and Chemicals (fuel), and the largest contribution to cultural and recreational activity is from Cultural and Recreational Services.
The largest indirect contributions, in contrast, are from Finance, Property and Business Services (28%), Trade (16%), Other Transport (10%) and Other Agriculture (10%).
Much the same pattern is repeated for each of tourism, commercial fishing and recreational activity.
37
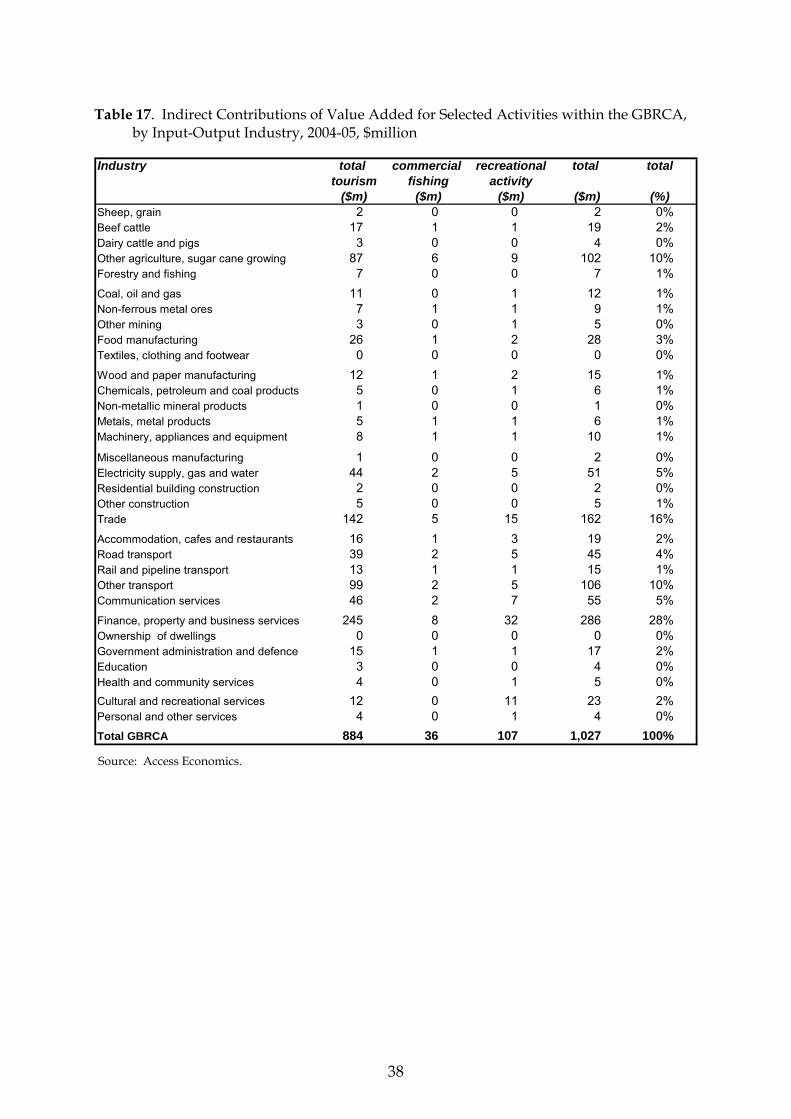
Table 17. Indirect Contributions of Value Added for Selected Activities within the GBRCA,
by Input-Output Industry, 2004-05, $million
Industry total commercial recreational total totaltourism fishing activity
($m) ($m) ($m) ($m) (%)Sheep, grain 2 0 0 2 0Beef cattle 17 1 1 19 2%Dairy cattle and pigs 3 0 0 4 0Other agriculture, sugar cane growing 87 6 9 102 10%Forestry and fishing 7 0 0 7 1Coal, oil and gas 11 0 1 12 1%Non-ferrous metal ores 7 1 1 9 1Other mining 3 0 1 5 0Food manufacturing 26 1 2 28 3%Textiles, clothing and footwear 0 0 0 0 0Wood and paper manufacturing 12 1 2 15 1%Chemicals, petroleum and coal products 5 0 1 6 1Non-metallic mineral products 1 0 0 1 0Metals, metal products 5 1 1 6 1Machinery, appliances and equipment 8 1 1 10 1
Miscellaneous manufacturing 1 0 0 2 0Electricity supply, gas and water 44 2 5 51 5%Residential building construction 2 0 0 2 0Other construction 5 0 0 5 1Trade 142 5 15 162 16%Accommodation, cafes and restaurants 16 1 3 19 2%Road transport 39 2 5 45 4%Rail and pipeline transport 13 1 1 15 1%Other transport 99 2 5 106 10%Communication services 46 2 7 55 5%Finance, property and business services 245 8 32 286 28%Ownership of dwellings 0 0 0 0 0Government administration and defence 15 1 1 17 2%Education 3 0 0 4 0Health and community services 4 0 1 5 0Cultural and recreational services 12 0 11 23 2%Personal and other services 4 0 1 4 0Total GBRCA 884 36 107 1,027 100%
%
%
%
%%
%
%%%%
%
%%
%
%%
%
Source: Access Economics.
38

Table 18. Indirect Contributions of Selected Activities to Queensland, 2004-05
Indirect contribution Indirect Indirect IndirectValue Added GSP, GDP Employment
($m) ($m) (FTE 000)
Total tourism within the GBRCA Visitors from GBRCA 293 306 3 Visitors from rest of Queensland 199 208 2 Interstate visitors 423 443 5 by GBRCA residents for travel outside GBRCA 33 34 0 International visitors 519 548 6Total tourism 1,466 1,539 17Commercial fishing 64 66 1Recreational activity (net of tourism) 200 210 3Total contribution to GBRCA 1,730 1,815 20
Source: Access Economics.
Table 19. Indirect Contributions of Selected Activities to Australia, 2004-05
Indirect contribution Indirect Indirect IndirectValue Added GSP, GDP Employment
($m) ($m) (FTE 000)
Total tourism within the GBRCA Visitors from GBRCA 386 407 4 Visitors from rest of Queensland 253 268 3 Interstate visitors 613 651 6 by GBRCA residents for travel outside GBRCA 42 45 0 International visitors 725 772 8Total tourism 2,019 2,143 22Commercial fishing 77 80 1Recreational activity (net of tourism) 233 247 3Total contribution to GBRCA 2,329 2,470 25
Source: Access Economics. Totals may not add due to rounding.
6.2 Indirect Tourism Economic Value Is Understated
At the national level for Australia, tourism generates indirect international imports of goods and services of about the same magnitude as direct international tourism imports (excluding international tourists themselves).
But there is another indirect contribution of tourism to the GBRCA and to Queensland.
This is the demand for GBRCA production of goods and services that is used as inputs into non-GBRCA businesses directly supplying goods and services to tourism outside the GBRCA.
GBRCA tourism value added will be underestimated by the amount associated with production in the GBRCA of goods and services sold directly to tourists outside the GBRCA in Queensland, in other States, or overseas, or used directly or indirectly in the production of tourism goods outside the GBRCA in Queensland, in other States, or overseas.
39

All State- and region-specific studies undertaken along the lines of this report would underestimate region and state tourism value added, and the sum across all Australian regions or states would be less than Australian tourism value added as a result.
This issue throws up a limitation of the TSA approach as currently applied.
Consider the hypothetical case where there was a TSA for the world economy:
Globally (assuming no trade with other planets!) there are no imports or exports, only world production of goods and services.
All goods and services, ideally, will be allocated, via the hypothetical global TSA, either to meeting the needs of travellers or non-travellers.
An analysis that incorporates the direct plus indirect components as described earlier in this report will capture all production and employment, and allocate it either to tourism-related demand or non-tourism-related demand via the TSA approach.
But national, state, territory and regional TSA analyses generally will understate the full direct plus indirect contribution of tourism to the nation, state, territory or region. For example, in the context of Australia:
The TSA approach does not treat the export of an Australian bottle of wine that is consumed by a French traveller in a Californian restaurant as tourism-related for purposes of the Australian-focussed TSA. However, the Australian TSA would deduct the import value of a French champagne consumed by an American visitor to Australia in calculating the contribution to Australian value added attributable to tourism.
Similarly, the TSA approach as applied above by Access Economics to GBRCA does not treat the export of a GBRCA beverage that is consumed by a French traveller in a Californian restaurant as tourism-related for purposes of the GBRCA-focussed TSA. However, the GBRCA TSA does deduct the import value of a French champagne consumed by an American visitor to the GBRCA in calculating the contribution to GBRCA value added attributable to tourism.
Yet, from a GBRCA perspective, the sale of a GBRCA-produced beverage to a French traveller eating a meal in California seems sensibly regarded – in the spirit of the TSA approach – as an indirect, tourism-related, contribution to GBRCA value added and employment.
40

7. TOTAL ECONOMIC VALUE OF CATCHMENT AREA
The total economic contributions of tourism, commercial fishing and cultural & recreational activity to the GBRCA are the sums of the direct contributions and the indirect contributions that have been presented in Sections 5 and 6. There are different sets of results depending on whether the calculations are for contributions to the GBRCA, Queensland or Australia.
Contributions of value added, gross regional product and employment for the GBRCA are summarised in Table 20. Tourism is the dominant component, accounting for 86% of value added and 84% of employment. Tourism has very approximately equal contributions from international visitors, interstate visitors and visitors from Queensland, with around two thirds of the Queensland contribution being from visitors living within the GBRCA.
The other value added contributions are commercial fishing 3% and recreational activity 11%, after netting out duplication with tourism.
The total economic contributions for Queensland (Table 21) and for Australia (Table 22) show much the same proportions of tourism, commercial fishing and cultural & recreational activity as for the GBRCA. All the numbers are larger than for GBRCA because the larger geographical areas include inputs additional to those provided within the GBRCA alone.
Total value added for the selected activities is 21% greater for Queensland than for the GBRCA and 45% greater for Australia than for the GBRCA. The additional contributions include not only direct inputs such as food, petrol, souvenirs and the remaining shares of airfares, but also indirect inputs such as business services and (wholesale) trade.
Some of the employment entries in Table 21 for Queensland are slightly smaller than those in Table 22 for Australia, contrary to expectations. This was addressed at the end of Section 5.2. It is probably due to a combination of limitations of the three 1996-97 input-output tables for our purposes and deficiencies in our scaling of results from 1996-97 to 2004-05. The input-output tables may not be consistent with one another in the sense that the same industry may not be represented in the same way in all tables because it consists of a combination of industries which are combined with different weights in different tables.
Table 23 shows the value added pattern across direct and indirect contributions and across the GBRCA, Queensland and Australia for total value added for the selected industries. It shows how the direct contributions change relatively little across the geographical areas while the indirect contributions change markedly. The combined result is a mix of the two.
41

Table 20. Direct Plus Indirect Contributions of Selected Activities to the GBRCA, 2004-05
Total contribution Total Total Total(direct plus indirect) Value Added GSP, GDP Employment
($m) ($m) (FTE 000)
Total tourism within the GBRCA Visitors from GBRCA 637 747 9 Visitors from rest of Queensland 349 407 5 Interstate visitors 941 1,093 12 by GBRCA residents for travel outside GBRCA 76 87 1 International visitors 1,057 1,244 16Total tourism 3,060 3,578 43Commercial fishing 104 106 1Recreational activity (net of tourism) 409 461 7Total contribution to GBRCA 3,572 4,145 51
Source: Access Economics.
Table 21. Direct Plus Indirect Contributions of Selected Activities to Queensland, 2004-05
Total contribution Total Total Total(direct plus indirect) Value Added GSP, GDP Employment
($m) ($m) (FTE 000)
Total tourism within the GBRCA Visitors from GBRCA 743 854 10 Visitors from rest of Queensland 504 576 6 Interstate visitors 1,103 1,257 14 by GBRCA residents for travel outside GBRCA 89 100 1 International visitors 1,282 1,471 18Total tourism 3,720 4,257 49Commercial fishing 132 135 2Recreational activity (net of tourism) 477 529 9Total contribution to GBRCA 4,329 4,920 59 Source: Access Economics.
Table 22. Direct Plus Indirect Contributions of Selected Activities to Australia, 2004-05
Total contribution Total Total Total(direct plus indirect) Value Added GSP, GDP Employment
($m) ($m) (FTE 000)
Total tourism within the GBRCA Visitors from GBRCA 839 958 11 Visitors from rest of Queensland 566 645 6 Interstate visitors 1,436 1,636 16 by GBRCA residents for travel outside GBRCA 99 111 1 International visitors 1,550 1,757 20Total tourism 4,490 5,107 54Commercial fishing 145 149 2Recreational activity (net of tourism) 548 610 7Total contribution to GBRCA 5,183 5,866 63 Source: Access Economics.
42

Table 23. Total Value Added for Selected Industries, 2004-05, $Million
direct indirect combined indirect/directGBRCA 2,546 1,027 3,572 0.40Queensland 2,599 1,730 4,329 0.67Australia 2,854 2,329 5,183 0.82
GBRCA/Australia 89% 44% 69%Queensland/Australia 91% 74% 84%
Source: Access Economics.
43

8. CONCLUSIONS, CAVEATS & FURTHER WORK NEEDED
8.1 Access Economics’ Conclusions
As measured using the quantitative data (primarily national accounts-based) available to it, Access Economics concludes that the total (direct plus indirect) economic contribution of tourism, commercial fishing, and cultural and recreational activity to the GBRCA in 2004-05 is as follows:
For value-added, over $3.5 billion per annum.
For gross product, over $4.1 billion per annum.
For employment (full time equivalent basis), about 51,000 persons.
The corresponding estimates for Queensland are:
For value-added, over $4.3 billion per annum.
For gross product, over $4.9 billion per annum.
For employment (full time equivalent basis), about 59,000 persons.
The corresponding estimates for Australia are:
For value-added, over $5.1 billion per annum.
For gross product, over $5.8 billion per annum.
For employment (full time equivalent basis), about 63,000 persons.
Tourism dominates these contributions:
For value-added and gross product, tourism’s share is about 86%-87%.
For employment, tourism’s share is about 83%-87%.
The economic contribution of these selected industry activities to the GBRMP will be a sub-set of the results just summarised:
For commercial fishing, the subset results for the GBRMP will presumably be a very high percentage of the GBRCA results.
For tourism and cultural and recreational activities, the subset results will be smaller proportions of the GBRCA results.
These results are likely to understate the economic contribution of the selected industries to the GBRCA (see Sections 8.2 and 8.3 below).
44

8.2 Caveats
These estimates are subject to a variety of caveats, as noted throughout this report. For example:
They cover market-related transactions only: non-market activities, including cultural and indigenous activities, are not covered.
The analysis relates to annual flows estimated for 2004-05 only: there is no balance sheet assessment covering stocks of assets, etc.
The quantification is based on a wide variety of data sources compiled by different Commonwealth and State agencies: there will inevitably be some inconsistencies between these sources.
Much of the actual data is relatively old and needs to be ‘scaled up’ to obtain estimates for the reference year (2004-05). The scaling up process undertaken by Access Economics inevitably involves scope for additional errors.
Externality effects (eg, adverse effects on water quality within the GBRMP associated with other industries (eg, agriculture) have not been taken into account.
On externality effects, the economic contributions of the three selected industries also do not cover adverse effects over time (eg, from tourism and local resident congestion, at least at some locations within the GBRMP, possible over-fishing, etc.)
8.3 Further Work Needed
The main requirement for improved and updated analysis of the type presented in this report is more up-to-date and hopefully more fully consistent data.
Above all, these types of analysis are hampered by delays in the release of the three input-output tables that are a crucial foundation for economic contribution studies such as this. The currently-released data (for 1996-97) is nearly a decade out of date.
Scientific research is an important activity within the GBRCA in general and the GBRMP in particular, but we have not been able to obtain quantitative estimates that we can re-formulate in a national accounts-consistent framework at this stage. But a comprehensive summation of the annual gross costs involved in policy development, management, monitoring and research, based on the Hand report, might be between $100 and $200 million per annum. More work is needed to refine this estimate.
Economic contributions from expenditures on other activities such as scuba diving, snorkelling and boating that are not included in Cultural & Recreational Services are also likely to be significant, but we have no data on these at present.
Any information in these areas would help to make the analysis in this report more comprehensive.
45

Even if these data gaps can be filled, for the reasons set out in Section 6.2 above, the economic contribution of tourism to the GBRCA will be understated by the type of analysis presented in this report.
The main factors working the other way – if not for a particular reference year, at least over time – are the external diseconomies associated with industry activity on the environment of the GBRMP, which is surely a major drawcard for tourism, commercial fishing, and other activity.
As such diseconomies degrade the GBRMP itself, the ‘pulling power’ of the GBRCA itself is likely to be reduced, and with it the economic contribution of the selected industries examined in this report.
46
ATTACHMENT A: METHODOLOGY
The economic analysis relies strongly on the Tourism Satellite Account (TSA) methodology, which can be applied to commercial fishing and cultural & recreational activity as well as tourism. Tourism is not an identifiable supply industry in the national accounts. It is defined instead on the demand side as a combination of products that are purchased by tourists. The TSA methodology is a means of relating these demands to proportions of outputs of conventionally defined supply industries, and hence calculating economic contributions of tourism in terms of gross value added, gross product and employment.
Overview of the TSA Methodology
Access Economics has had a long involvement in various panels and forums promoting the development of a TSA, since 1992. Based on our long experience with the concept of a TSA, we judge that the approach adopted by the ABS is the most consistent and elegant approach of those currently proposed by various international agencies (WTO, OECD, WTTC).
The ABS Tourism Satellite Account 2003-04 (ABS 2005) has calculated the direct effects of tourism in Australia using Tourism Research Australia tourism survey data, but adjusted to be consistent with ABS national accounts and balance of payments data (TRA 2005). Building upon the TSA analysis for 2001-02, the Bureau of Tourism Research has calculated the indirect effects of tourism in Australia for 2001-02 (BTR 2004a).
Direct contributions of tourism to value added, Gross Area Product (GAP), employment and exports for the GBRCA can be calculated using tourism shares of expenditure, and hence economic activity, in each industry in the GBRCA. In order to determine the indirect contributions, as well as the direct contributions for imports, it is necessary to create an input-output (IO) table for the GBRCA. Once created, the IO table can then be used to compute both the direct and indirect contributions. An important aspect of the IO table is that it takes account of inter-regional and interstate imports as well as international imports (to the extent allowed by the data).
The process can be repeated to calculate the tourism contributions of the GBRCA to the Queensland and Australian economies by using IO tables for Queensland and Australia.
Tourism Data
The data and analysis are for the year ending September 2004. The major sources of tourism data are the TSA national results for 2003-04 (ABS 2005), and the TRA National Visitor Survey (NVS) of domestic visitors (both overnight and day trips) and International Visitor Survey (IVS) that also provide State and regional information (TRA 2005). In assembling the data, our principle is to make use of the TSA data wherever possible for Australia-wide tourism contributions, and then make use of the TRA data to estimate GBRCA shares thereof.
TSA Data
The TSA presents results nationally for 2003-04, classified to products according to the ABS concepts of ‘tourism characteristic’ products and ‘tourism connected’ products, and similarly
47

for industries. The TSA makes use of the TRA data, but maps the data into supply-use classifications and scales the data to conform to national accounts totals and balance of payments aggregates. In particular, it adjusts the TRA survey data for airline fares and pre-paid packages that contain substantial proportions of airline fares paid by non-residents to foreign airlines, which are thus are not part of the Australian national accounts. The TSA allocates pre-paid package expenditure to accommodation, air fares and tours. Consistent with the treatment in the national accounts, the TSA contains an imputed value of rent for holiday houses, and includes expenditure on motor vehicles and other capital items.
The TSA provides consumption by expenditure item (expressed at purchasers’ prices) for each of: day visitors, overnight visitors and international visitors. Aggregated across expenditure items, total tourism expenditure in Australia in 2003-04 was $73,010 million consisting of day visits $12,057 million (16.5%), overnight visitors $40,448 million (55.4%), outbound Australian residents $3,188 million (4.4%) and international visitors $17,317 million (23.7%). The TRA dollar values as levels differ from the TSA values, but we can use the TRA data to calculate the GBRCA share for each expenditure item and for each type of visitor and apply these shares to TSA-based Australian magnitudes to obtain consistent GBRCA levels.
The TSA data also include Australian expenditures by outbound Australian residents before and after international trips (for example, on airline fares, luggage, vaccinations, film processing), but such data are not included in the TRA data. We regard this as a domestic tourism contribution, because it involves travel-related domestic spending by Australian residents. In the absence of other information, it is assumed that expenditure on overseas trips is in proportion to population which for the GBRCA is about 3.8% of Australia.
TRA NVS and IVS Data on CD-MOTA
Detailed tourism data for the GBRCA were assembled from TRA electronic CD-MOTA (Compact Disc – Monitor of Tourist Activity) data separately for day visitors, overnight visitors and international visitors. The latest available data are for the September 2004 quarter and we use these, together with data from earlier quarters, to construct values for the year ending September 2004. From the wealth of sample information provided in CD-MOTA, we make use of numbers of visitors, number of nights, expenditure across about 20 items, destinations visited, where the visitors came from, and itemised expenditure before and after the trip. We also distinguish between visitors to a single destination and those who visit multiple destinations. Tourism data are available for regions as small as Local Government Areas, but we have used the Queensland tourism regions. The GBR Catchment Area (GBRCA) corresponds closely to the sum of five tourism regions, namely Tropical North Queensland, Northern, Mackay, Whitsunday and Fitzroy. We present results for visitors to GBRCA coming from four categories - within GBRCA, the rest of Queensland, interstate, and international.
About half of the Bundaberg tourism region is within the GBRCA, and we estimate its economic contributions separately as an add-on.
In compiling data for GBRCA as the sum of results for four statistical divisions and five tourism regions, we note that the Tropical North dominates. It accounts for 78% of visitor nights for international visitors, 57% for interstate visitors and 30% for visitors from the rest of Queensland. Tourism patterns for GBRCA residents are different. For them, 48% of visitor nights and 84% of day visitor expenditure are within the region of residence. They
48

account for 97% of total day visit expenditure with the Tropical North, which has by far the largest geographical area, accounting for 47% of total day visit expenditure for the GBRCA.
Our analysis of the TRA data excludes expenditures on capital items and the purchase of motor vehicles. We have doubts about the allocation of these costs between tourism and other purposes, and there is no allowance for sales of items after the trip. Our objective is to determine all travel-related expenditure that can be attributed to the GBRCA. In the case of visits to the GBRCA by residents from outside the GBRCA we include all expenditure during the trip plus selected payments made before and after the trip, but clearly attributable to the GBRCA, such as accommodation, entertainment and conference fees.
The allocation of airfares between the GBRCA and other regions is more complicated. The general principle is that domestic airfares are shared equally between the GBRCA and the region of residence for single destination trips, and one third is allocated to the GBRCA for multiple destination trips. This means that, for single destination trips, all airfares associated with visits from interstate and the rest of Queensland are included when calculating Australian contributions, all airfares associated with visits from the rest of Queensland and 50% of those associated with visits from interstate are included when calculating Queensland contributions, and 50% of airfares associated with visits from interstate and the rest of Queensland are included when calculating GBRCA results. For multiple destination visits (if we assume that half of the origin share of the airfare is attributable to the GBRCA and half to other destinations), 50% of the airfares from interstate and rest of Queensland are included when calculating Australian contributions, 50% of airfares from the rest of Queensland and 33% of airfares from interstate are included when calculating Queensland contributions, and 33% of airfares from interstate and the rest of Queensland are included when calculating GBRCA contributions.
Tourism expenditure within the GBRCA also includes expenditure by GBRCA residents on overseas trips and before and after domestic overnight trips, but excludes payments for accommodation, etc. that are not attributable to the GBRCA. Domestic air fares are shared using the same principles as for visitors to the GBRCA.
We extract CD-MOTA expenditure vectors for type of visitor (day, overnight, international) and for four origin categories (within GBRCA, rest of Queensland, interstate, international). Each of the overnight and international entries is the sum of expenditures for single destination visits and multiple destination visits.
International Air Fares
Data for international airfares are derived from TSA data which differ from IVS data in the inclusion of shares of pre-paid package expenditure and the exclusion of airfares paid to foreign airlines. The allocation of airfares to regions and airports is made on the basis of IVS data on the ports of arrival and departure.
For international visitors, costs of international airfares are allocated to the airports of arrival and departure. For the 21% of international visitors to the GBRCA who visit only the GBRCA,. 92% of their arrivals and departures are through GBRCA international airports (mainly Cairns, but a little through Townsville). Another 5% of the arrivals and departures are by transit through Brisbane and Coolangatta, while the remaining 3% are through international airports in other states. For the remaining 79% of international visitors to the
49

GBRCA, 25% of arrivals and departures are through Cairns, 17% through Brisbane and Coolangatta and the remaining 58% through international airports in other states.
It has been assumed that all GBRCA residents travelled overseas from and to Cairns. (This might be changed to say 25% Cairns and 75% Brisbane.)
Other Data Issues with State and Regional Results
There are some difficulties in moving from national results to regional and State results – for example, the head office and maintenance base of Qantas is in Sydney, while Virgin Blue is headquartered in Brisbane. Hence NSW, Victoria and Qld would be expected to have more-than-proportional employment in the aviation industry relative to WA, SA or Tasmania.
In most cases tourism-related jobs tend to be where the tourists are, particularly for very localised activities like hotels, restaurants and taxis. For these jobs the economic contribution and jobs effects closely follow the data on expenditure. However, some of the larger tourism enterprises like Qantas will tend to have employment and economic impacts that diverge more from the point where the expenditure is made.
Allocating Total Trip Expenditure Between Destinations
CD-MOTA records tourist expenditure for the entire trip, with separate recording of expenditure before and after the trip (pre-paid airfares and accommodation, luggage, film processing). Expenditures before and after the trip are treated differently according to whether or not they contribute to economic activity in the destination region. No such adjustments are required for trips within the GBRCA by GBRCA residents. For all other visits to the GBRCA, expenditure on luggage makes no contribution to the GBRCA, expenditure on accommodation contributes fully, while expenditure on long distance travel, and especially air fares, contributes partly to the region. We assume that the contribution of air fares is 50% where there is a single destination and 33% where there are multiple destinations.
The split of expenditure between the destination region and other regions is not a problem where there is a single destination. In all other cases it is necessary to estimate expenditure in the region as the product of the number of visitor nights spent in the region and the estimated average expenditure per night in the region. It is likely that expenditure per night in the GBRCA for single destination visits, including holiday packages at resort hotels, would tend to be higher on average than for multiple destination visitors, which would include a larger proportion of caravan trips around Australia at a lower average cost per night. However, in the absence of other information we use the average single destination expenditure per night within the GBRCA as applying also to multiple destination visitors. 58% of domestic overnight visitor nights for the GBRCA are for a single destination, so that the assumption used for visitors with multiple destinations should not be crucial. However, in the case of international visitors, only around 14% of visitor nights in the GBRCA are associated with single destination visits, so that the assumption about average expenditure per night for visitors with multiple destinations is very important.
Regional Expenditure Model
An alternative method for determining tourism contributions is to use results from the TRA’s Regional Expenditure Model (REM) which allocates total trip expenditures to regions
50
visited by taking account of more information than Access Economics has used and thereby avoids some of the assumptions we have made. REM aggregate expenditures, numbers of visitor nights and numbers of visits are available for most of the GBRCA tourism regions for calendar year 2003.
For domestic overnight visitors, total REM expenditure in the 5 GBRCA tourism regions was $2,399 million including air fares and other long distance travel. This result corresponds to $131 per night in 2003. Our corresponding result for 2004-05 is $163 per night.
For international visitors, the sum of expenditures for 4 of the 5 GBRCA tourist regions (Fitzroy is excluded) is $1,011 million including package expenditure but excluding international air fares. This corresponds to $131 per night. An approximate adjustment for Fitzroy, which is likely to have a nightly rate like Mackay, and lower than for the northern regions, leads to around $123 per night in 2003. Our corresponding result for 2004-05 is $127 per night including packages but net of international air fares.
These comparisons suggest that, after allowance for differences in prices between 2003 and 2004-05, our estimates of expenditure for international visitors to the GBRCA are about right, but our estimates for domestic overnight visitors to the GBRCA could be high by 15% to 20%. We have assumed that expenditure per night for multiple destination visitors is the same as for single destination visitors. It seems that this assumption is broadly correct for international visitors, but it overestimates expenditures for domestic overnight visitors. One possible explanation is that average air fare expenditure per night is likely to be lower for domestic multiple destination visitors because the trip is distributed over more nights. Another explanation is that single destination visitors are likely to be mainly visitors who arrive by air, whereas multiple destination visitors will also include visitors travelling by car at a lower cost per night.
The analysis would be improved by use of REM data, but public release of REM results is at present 9 months or more after the corresponding CD-MOTA data. TRA has very long term aim of releasing CD-MOTA expenditures that have been processed through the REM.
Scaling CD-MOTA Data to TSA and Then to 2004-05
While the CD-MOTA data contain great detail, the expenditure data are not consistent with national accounts. The ABS publishes national expenditure on tourism in the TSA. The latest data are for 2003-04 (ABS 2005). We apply the 2003-04 ratios of TSA expenditures to CD-MOTA expenditures, for individual expenditure items, to the CD-MOTA results for the year ending September 2004. Because TSA, NVS and IVS use different expenditure classifications, this requires establishing mappings between some CD-MOTA and TSA expenditure items, such as from packages to accommodation, meals, tours and airfares. In the absence of other information, we assume that the same ratios apply throughout Australia.
The CD-MOTA vectors of expenditure are then scaled to be consistent with the TSA data. This is done separately for day, domestic overnight and international visitors. This process generates tourism expenditures expressed in TSA expenditure categories at purchasers’ prices. Corresponding day and domestic overnight expenditures are added together, such as for tourism expenditures by GBRCA residents within the GBRCA.
The data are then mapped into the 32 industries used in the IO tables (see below).
51

In order to analyse the economic effects on industries within GBRCA, Queensland and Australia, it is necessary to split values of tourism consumption at purchasers’ prices into domestic supplies at basic values, imports at basic values, commodity taxes and margins for components of trade and transport. The TSA for 2002-03 (ABS 2004) contains the 2000-01 splits, by product type, of tourism supplies valued at purchasers’ prices into domestic supplies at basic values, imports at basic values, taxes on tourist products and total margins on tourist products (Table 8). There is no corresponding table for TSA 2003-04. We use the data for 2000-01 together with additional information from national input output tables to split the margins into their components. The margins are added back into the appropriate domestic trade and transport industries.
The September 2004 tourism results are scaled to 2004-05 on the basis of data for calendar years 2003 and 2004 and forecasts for 2005 (Tourism Forecasting Committee, 2005). There are no separate forecasts for GBR regions. For domestic overnight visitor expenditure we estimate an increase of 1.1% based on an interpolated fall in real expenditure for holiday visitors to Queensland of 0.7% over 9 months together with a price increase of 1.8% (2.4% for a full year). For international visitor expenditure we use an increase of 5.5% based on an interpolated real increase of 3.7% over 9 months for visitors to Australia and a price increase of 1.8%. For day visitor expenditure we use an increase of 3.3% based on employment growth of 2% per year and a price increase of 2.4% per year. The domestic inputs then represent the direct supplies of domestic production to tourism within the GBRCA (Table 24). There is an additional column for expenditure by GBRCA residents on GBRA-sourced goods and services before and after trips outside the GBRCA.
Table 24. Regional, Interstate and International Expenditures by Industry for GBRCA, $Million, 2004-05
Industry Visitors from Visitors from Interstate GBRCA International Total Commercial Recreational GBRCA rest of Qld visitors residents to visitors visitors fishing use
non-GBRCA Sheep, grain 0 0 0 0 0 0 0 0Beef cattle 0 0 0 0 0 0 0 0Dairy cattle and pigs 0 0 0 0 0 0 0 0Other agriculture, sugar cane growing 8 4 8 0 10 30 0 0Forestry and fishing 3 2 3 0 4 13 0 0Coal, oil and gas 0 0 0 0 0 0 0 0Non-ferrous metal ores 0 0 0 0 0 0 0 0Other mining 0 0 0 0 0 0 0 0Food manufacturing 68 39 74 6 86 273 28 5Textiles, clothing and footwear 11 3 3 0 14 31 1 0
Wood and paper manufacturing 15 4 5 0 20 43 3 0Chemicals, petroleum and coal products 59 14 8 0 22 103 22 23Non-metallic mineral products 1 0 0 0 1 3 0 0Metals, metal products 2 1 1 0 3 6 10 0Machinery, appliances and equipment 55 14 20 0 60 149 34 38Miscellaneous manufacturing 2 1 1 0 3 7 2 1Electricity supply, gas and water 0 0 0 0 0 0 1 0Residential building construction 0 0 0 0 0 0 0 0Other construction 0 0 0 0 0 0 0 0Trade 281 99 191 6 314 891 54 0Accommodation, cafes and restaurants 201 140 363 24 668 1,395 2 2Road transport 29 18 26 5 34 113 3 0Rail and pipeline transport 13 15 8 10 5 51 0 0Other transport 70 98 367 50 216 801 3 6Communication services 26 4 23 3 30 86 2 0Finance, property and business services 12 14 55 1 27 109 11 3Ownership of dwellings 30 25 70 0 0 126 0 0Government administration and defence 0 0 0 0 0 0 2 5Education 1 1 4 0 2 8 0 0Health and community services 56 8 51 7 64 186 0 0Cultural and recreational services 30 39 135 0 62 267 0 843Personal and other services 21 3 19 3 24 71 1 0
Total GBRCA 996 544 1,436 115 1,669 4,760 180 940
5
Source: Access Economics.
52
Input Output Tables
The economic analysis is driven by access to input output (IO) tables that describe the economies of the GBRCA, Queensland and Australia. ABS has published national IO tables with 106 industries for 1996-97 (ABS 2001). IO tables for 1996-97 are available electronically for Queensland and for all regions of Queensland, where the regions correspond to the Statistical Divisions in Queensland for 1996-97 (Queensland Office of the Government Statistician, 2005). GBRCA corresponds fairly closely to the sum of four regions that border the north east coast of Queensland, namely Fitzroy, Mackay, Northern, and Far North. GBRCA also includes about 30% by area of the Wide Bay-Burnett Statistical Division that includes Bundaberg, but we omit this because the GBRCA part accounts for only about 25% of the economic activity of that Statistical Division. The GBRCA IO table has been formed as the sum of the IO tables for the four regions.
The Queensland regional IO tables are for 34 industries. We aggregate these to 32 industries by combining sheep (which has negligible production within the GBRCA) with grain, and sugar cane with other agriculture because sugar cane is not a separate industry in the national IO table. The Queensland and Australian IO tables are aggregated to the same 32 industries.
We use industry-by-industry IO tables with direct allocation of imports. The use of an industry-by-industry table means that there is a 1-to-1 correspondence between industry production or supply, as described by a column of the table, and industry sales or demand, as described by a row of the table.) This generates a table that is square, which is essential for the matrix inversion used in the calculation of indirect contributions. The need to use an IO table with direct allocation of imports is explained in the following paragraph.
Only GBRCA-produced supplies of goods and services should be included in the GBRCA calculation, only Queensland produced supplies should be used in the Queensland calculation, and only Australian-produced supplies should be included in the national calculation. Consider the sale of an imported toy koala made in China. The production of this toy koala does not contribute to Australia’s GDP, although the margins associated with its distribution and sale within Australia do contribute to Australia’s GDP. For this reason it is appropriate to use an input-output table with ‘direct allocation of imports’, i.e., in which imports are directly allocated to the sectors in which they are used, but as a separate line item. In this treatment, each cell in the intermediate use matrix of the input-output table contains only the domestically-produced inputs into an industry column, while total imported inputs into that industry are contained in a single cell at the bottom of each ‘use’ column of the table, just above the line for GBRCA, Queensland or Australian production. In the more usual ‘indirect allocation of imports’ input-output table, each input cell is the sum of the corresponding domestic and imported inputs. Value added, taxes and Australian production have the same values in both tables, but the industry inputs are presented differently. This results in different I-O coefficient matrices (A) and thus different inverse matrices (I-A)-1 that are used to form the derived coefficients for calculating the indirect effects.
Tourism expenditure is dominated by transport (especially air and road), accommodation, food and drink, entertainment (cultural and recreational services), petrol and shopping, and we use separate industries for each of these as far as possible. The IO data for the industry ‘Accommodation, restaurants and cafes’ provides no information for separating it into
53

components of accommodation, pubs & bars, cafes & restaurants, and clubs that would be more convenient for tourism studies.
Using a 1996-97 Input Output Table for a 2004-05 Application
The relationships between different industries change relatively slowly so that the 1996-97 IO table is a reasonable approximation to the structure of the economy today. There are of course changes in the relative importance of industries and the distribution of consumption across products, as described in the National Accounts and State Accounts (ABS 2004a).
While national IO tables for 1998-99 are available, Queensland state and regional IO tables are available only for 1996-97. The cost structures of IO tables do not change greatly over five or ten years, so that the coefficients derived from 1996-97 IO tables, such as value added per $ million of output, for each industry, are approximately constant over such time scales. For the employment coefficients (persons per $ million of output) it is necessary to adjust for changes in prices and productivity between 1996-97 and 2004-05 (see below).
Calculation of Direct Contributions of Tourism
Each industry column of the input output table provides the direct value added and direct employment per unit production for that industry. Application of the tourism vector of domestic production to these coefficients thus gives tourism direct value added and tourism direct employment. This process is applied to the GBRCA, Queensland and Australian input output tables. The vectors of production used in the three cases are much the same except that expenditure on airfares is larger for Queensland than for the GBRCA, and larger again for Australia.
The value added coefficients, which are ratios of value added to value of production, are calculated for 1996-97, and we assume that they are the same in 2004-05. However, the employment results need to be adjusted to allow for the changes over time in the number of persons per dollar of output (i.e., gross value of production). For each industry, the employment coefficient for 2004-05 is calculated according to
employment coefficient ’04-05 = employment coefficient ’96-97 x
(FTE 0405/FTE ’96-97) / (output ’04-05/output ’96-97)
where it is assumed that output is proportional to value added. The increases in FTE were derived from the average annual increases in employment by industry in Australia, Queensland and Queensland regions over the period August 1998 to February 2005 (ABS 2005b). The increases in value added were derived from average annual increases in factor income by industry for Australian and Queensland over the period 1996-97 to 2003-04 (ABS 2005a).
The use of 1996-97 IO tables does not take account of changes in the patterns of consumption of products or output by industries from 1996-97 to 2004-05, as measured by State Accounts (ABS 2004a). This would require creation of a more up to date IO table. However, this omission has only a second order effect on the tourism results. The activities of tourism industries are represented adequately by the 2004-05 tourism demands generated from TSA and TRA data. It is changes over time in the ratios of value added and employment to output, and the interactions between sectors, that are the largest sources of uncertainty.
54

Direct tourism value added for each industry is calculated as the sum of the direct tourism contributions associated with wages, gross operating surplus (GOS) and net taxes on production. Direct tourism GDP/GSP/GAP is then calculated as tourism value added plus taxes on products sold directly to tourists, but not including the net product taxes on inputs into production. Taxes for Australia, by product, are allocated across regions and types of visitor in proportion to expenditures.
Calculation of Indirect Contributions of Tourism
Each of the Australian inputs of goods and services into tourism activities generates additional value added and employment.
It can be shown (ABS 1996) that the total value added, including both first round and flow-on effects, that is generated by a column vector of demands d is v.(I-A)-1.d, where v is a row vector of value added shares in production. The corresponding employment result is e.(I-A)-1.d where e is a row vector of employment per unit production. A is a square matrix where the values in each column are the shares of intermediate inputs in total production for that industry. In this case, d is the vector of domestically-supplied intermediate inputs used in tourism production. The formulae describe the total effects of the demands including both the first round (or direct) contributions from the supplying industries and the flow-on (or indirect) contributions from industries further along the supply chain.
The industry composition of the value added indirect contributions is given by the sum over columns j of vi.(I-A)-1ij.dj where i denotes the row industry and j the column industry. The corresponding result for employment is obtained by using e in place of v.
The value added shares (v) and employment shares (e) are the same as for the direct contributions calculations.
We calculate indirect GDP, GSP and GAP as indirect value added plus both the direct and indirect net product taxes (commodity taxes less subsidies) on production. The direct net product taxes have been included because they were not included in direct tourism GDP, GSP and GAP. The ABS includes total indirect taxes on production when calculating GDP, but omits them when calculating contributions from individual industries. We believe that direct net product taxes should be included in direct tourism GDP, GSP and GAP. However, we have followed the TSA in omitting them from the direct results; hence we include them in the indirect results.
Commercial Fishing and Recreational Use
The same methodology applies for the contributions of commercial fishing and recreational activity within the GBRMP. Most of these expenditures occur within the GBRCA, with little additional expenditure in the rest of Queensland. Commercial fishing licence fees are paid directly to State Government authorities rather than to local authorities, and hence contribute to Queensland and Australian value added but not to GBRCA value added.
For commercial fishing, trends in published Queensland Department of Primary Industries & Fisheries (QDPI&F) tonnes and value of product are relatively smooth and can be used to extrapolate to 2004-05. Recent data obtained directly from QDPI&F data suggest that the gross value of production in 2004-05 might be about $50 million for aquaculture plus about
55

$130 million for commercial fishing. (This is consistent with recent trends, less 15% for new zones – Bureau of Rural Sciences, 2003). Commercial fishing exports are indicative rather than precise. They do not always relate to where the catch was made, but rather from the port of export, which may not be the boat’s home port.
Recreational activity is calculated as the contributions from the Cultural & recreational services industry (sport, gambling, movies, theatre, art galleries) plus those associated with recreational fishing, mainly by local residents. Cultural & recreational services includes tours to look at the reef and watch whales but does not include recreational fishing. Total expenditure on Cultural & recreational services was $512 million in 1996-97 which scales to about $840 million in 2004-05. There is a considerable overlap between Cultural & recreational services and tourism, and we report results for recreational activity net of tourism.
Recreational fishing is not allocated to an input output industry. It is like tourism in that it is the sum of contributions for boats (and associated costs such as petrol and insurance), boat hire, tackle, private car travel, and accommodation. QDPI&F estimates recreational fishing costs for the GBRMP as around $100 million and has provided estimated shares of costs for boats etc. Accommodation costs indicate that recreational fishing overlaps a little with tourism and the estimated overlap is 25%.
56

ATTACHMENT B: DATA SOURCES & REFERENCES
Access Economics, Five Yearly Business Outlook, March 2005, Canberra, 2005
Australian Bureau of Agriculture and Resource Economics, Australian Fisheries Statistics 2004, Canberra, 2005
Australian Bureau of Statistics, Overseas Arrivals and Departures Australia (Cat. no. 3401.0), Canberra, (various issues)
Australian Bureau of Statistics, Australian National Accounts: Input-Output Tables 1996-97 (Cat. no. 5209.0), Canberra, 2001
Australian Bureau of Statistics, Australian National Accounts: State Accounts 2002-03 (Cat. no. 5220.0), Canberra, 2004a
Australian Bureau of Statistics, Australian National Accounts: State Accounts 2003-04 (Cat. no. 5220.0), Canberra, March 2005a
Australian Bureau of Statistics, Information Paper: Australian National Accounts: Introduction to Input-Output Multipliers (Cat. no. 5246.0), Canberra, 1996
Australian Bureau of Statistics, Australian National Accounts: Tourism Satellite Accounts 2002-03 (Cat. no. 5249.0), Canberra, 2004
Australian Bureau of Statistics, Australian National Accounts: Tourism Satellite Accounts 2002-03 (Cat. no. 5249.0), Canberra, 2005
Australian Bureau of Statistics, Labour Force, Australia: Employed Persons by Region, (Cat. no. 6291.0.55.001, electronic delivery), Canberra, March, 2005b
Bureau of Rural Sciences, Implementing the Representative Areas Program in the Great Barrier Reef Marine Park, Commonwealth Department of Agriculture, Fisheries and Forestry, Canberra, 2003
Bureau of Tourism Research, Tourism expenditure by domestic visitors in Australia’s regions 1999, Canberra, July (and subsequent updates)
Bureau of Tourism Research, Indirect economic contribution of tourism to Australia, 2001/02, Tourism Research Report, Journal of the BTR, Vol. 5, No. 2, 2004
Great Barrier Reef Marine Park Authority, Summary report of the social and economic impacts of the rezoning of the Great Barrier Reef Marine Park, December 2003 (delivered to Parliament)
Great Barrier Reef Marine Park Authority, New GBR Zoning effective 1 July 2004, CD, 2004
Office of Economic and Economic Research, Socio-Economic Profile of the Great Barrier Reef Catchment Area, Queensland Treasury, Brisbane, March 2005 (prepared for GBRMPA)
57

Office of the Government Statistician, Queensland Regional Input-Output Tables 1996-97, 34
Industries, Brisbane, 2004
Queensland Department of Primary Industries & Fisheries, data request, May 2005
Tourism Research Australia, CD MOTA, (electronic version of TRA data for IVS and NVS), Canberra, 2005
Tourism Forecasting Committee, Tourism Forecasting Committee April 2005 Forecasts, Tourism Research Australia, Canberra, 2005
Queensland Department of Primary Industries and Fishing, data request, May 2005
58