Economic Impact Analysis (EIA) for the Fabric Coatings NESHAP Coatings_IP.pdf · Economic Impact...
49
Economic Impact Analysis (EIA) for the Fabric Coatings NESHAP Industry Profile Prepared for Lisa Conner U.S. Environmental Protection Agency Office of Air Quality Planning and Standards Innovative Strategies and Economics Group (ISEG) (MD-15) Research Triangle Park, NC 27711 EPA Contract Number 68-D-99-024 RTI Project Number 7647.002.137 March 2001
Transcript of Economic Impact Analysis (EIA) for the Fabric Coatings NESHAP Coatings_IP.pdf · Economic Impact...

Economic Impact Analysis (EIA) forthe Fabric Coatings NESHAP
Industry Profile
Prepared for
Lisa ConnerU.S. Environmental Protection Agency
Office of Air Quality Planning and StandardsInnovative Strategies and Economics Group (ISEG) (MD-15)
Research Triangle Park, NC 27711
EPA Contract Number 68-D-99-024
RTI Project Number 7647.002.137
March 2001

EPA Contract Number RTI Project Number68-D-99-024 7647.002.137
Economic Impact Analysis (EIA) forthe Fabric Coatings NESHAP
Industry Profile
March 2001
Prepared for
Lisa ConnerU.S. Environmental Protection Agency
Office of Air Quality Planning and StandardsInnovative Strategies and Economics Group (ISEG) (MD-15)
Research Triangle Park, NC 27711
Prepared by
Katherine B. HellerCharles Pringle
Research Triangle InstituteCenter for Economics Research
Research Triangle Park, NC 27709

DRAFT
iii
CONTENTS
Section Page
1 Introduction . . . . . . . . . . . . . . . . . . . . . . . . . . . . . . . . . . . . . . . . . . . . . . . . . . . . 1-1
1.1 Category Description . . . . . . . . . . . . . . . . . . . . . . . . . . . . . . . . . . . . . . . 1-1
1.2 Environmental Concerns . . . . . . . . . . . . . . . . . . . . . . . . . . . . . . . . . . . . 1-3
1.3 Profile Structure . . . . . . . . . . . . . . . . . . . . . . . . . . . . . . . . . . . . . . . . . . . 1-3
2 The Supply Side . . . . . . . . . . . . . . . . . . . . . . . . . . . . . . . . . . . . . . . . . . . . . . . . . 2-1
2.1 Production Process . . . . . . . . . . . . . . . . . . . . . . . . . . . . . . . . . . . . . . . . . 2-12.1.1 Substrates . . . . . . . . . . . . . . . . . . . . . . . . . . . . . . . . . . . . . . . . . . 2-22.1.2 Coatings . . . . . . . . . . . . . . . . . . . . . . . . . . . . . . . . . . . . . . . . . . . 2-32.1.3 Coating Application Processes . . . . . . . . . . . . . . . . . . . . . . . . . 2-4
2.2 Costs of Production . . . . . . . . . . . . . . . . . . . . . . . . . . . . . . . . . . . . . . . . 2-8
3 The Demand Side . . . . . . . . . . . . . . . . . . . . . . . . . . . . . . . . . . . . . . . . . . . . . . . . 3-1
3.1 Product Characteristics . . . . . . . . . . . . . . . . . . . . . . . . . . . . . . . . . . . . . 3-1
3.2 Uses and Consumers . . . . . . . . . . . . . . . . . . . . . . . . . . . . . . . . . . . . . . . 3-1
3.3 Substitutes . . . . . . . . . . . . . . . . . . . . . . . . . . . . . . . . . . . . . . . . . . . . . . . 3-4
4 Industry Organization . . . . . . . . . . . . . . . . . . . . . . . . . . . . . . . . . . . . . . . . . . . . . 4-1
4.1 Market Structure . . . . . . . . . . . . . . . . . . . . . . . . . . . . . . . . . . . . . . . . . . 4-1
4.2 Manufacturing Facilities . . . . . . . . . . . . . . . . . . . . . . . . . . . . . . . . . . . . 4-2
4.3 Industry Production and Capacity Utilization . . . . . . . . . . . . . . . . . . . . 4-2
4.4 Facility Employment . . . . . . . . . . . . . . . . . . . . . . . . . . . . . . . . . . . . . . . 4-4

DRAFT
iv
4.5 Companies . . . . . . . . . . . . . . . . . . . . . . . . . . . . . . . . . . . . . . . . . . . . . . . 4-54.5.1 Small Business Identification . . . . . . . . . . . . . . . . . . . . . . . . . . . 4-6
5 Markets . . . . . . . . . . . . . . . . . . . . . . . . . . . . . . . . . . . . . . . . . . . . . . . . . . . . . . . 5-1
5.1 Value of Shipments . . . . . . . . . . . . . . . . . . . . . . . . . . . . . . . . . . . . . . . . 5-1
5.2 Market Prices . . . . . . . . . . . . . . . . . . . . . . . . . . . . . . . . . . . . . . . . . . . . . 5-3
5.3 Future Outlook . . . . . . . . . . . . . . . . . . . . . . . . . . . . . . . . . . . . . . . . . . . . 5-4
5.4 International Trade . . . . . . . . . . . . . . . . . . . . . . . . . . . . . . . . . . . . . . . . . 5-5
References . . . . . . . . . . . . . . . . . . . . . . . . . . . . . . . . . . . . . . . . . . . . . . . . . . . . . . . . . . . R-1
Appendix A: Fabric Coatings Companies . . . . . . . . . . . . . . . . . . . . . . . . . . . . . . . . . A-1

DRAFT
v
LIST OF FIGURES
Number Page
2-1 Extrusion Coating Plant . . . . . . . . . . . . . . . . . . . . . . . . . . . . . . . . . . . . . . . . . . . 2-12-2 Calendering . . . . . . . . . . . . . . . . . . . . . . . . . . . . . . . . . . . . . . . . . . . . . . . . . . . . 2-52-3 Knife-Over-Roll Coating . . . . . . . . . . . . . . . . . . . . . . . . . . . . . . . . . . . . . . . . . . 2-52-4 Reverse-Roll Coating . . . . . . . . . . . . . . . . . . . . . . . . . . . . . . . . . . . . . . . . . . . . . 2-62-5 Rotary Screen Coating . . . . . . . . . . . . . . . . . . . . . . . . . . . . . . . . . . . . . . . . . . . . 2-62-6 Transfer Coating . . . . . . . . . . . . . . . . . . . . . . . . . . . . . . . . . . . . . . . . . . . . . . . . 2-72-7 Extrusion Coating . . . . . . . . . . . . . . . . . . . . . . . . . . . . . . . . . . . . . . . . . . . . . . . 2-72-8 Lamination Coating . . . . . . . . . . . . . . . . . . . . . . . . . . . . . . . . . . . . . . . . . . . . . . 2-72-9 Gravure Print Coating . . . . . . . . . . . . . . . . . . . . . . . . . . . . . . . . . . . . . . . . . . . . 2-72-10 Impregnation Coating . . . . . . . . . . . . . . . . . . . . . . . . . . . . . . . . . . . . . . . . . . . . 2-8
4-1 Facility Locations . . . . . . . . . . . . . . . . . . . . . . . . . . . . . . . . . . . . . . . . . . . . . . . . 4-3

DRAFT
vi
LIST OF TABLES
Number Page
1-1 Types of Products in Coated Fabrics Industry (NAICS 31332) . . . . . . . . . . . . . 1-2
2-1 Production Costs for NAICS 313320, Fabric Coating Mills . . . . . . . . . . . . . . . 2-92-2 Materials Consumed by Kind, NAICS 31332, 1997 . . . . . . . . . . . . . . . . . . . . 2-10
3-1 Variables Essential for Product Development Derived fromApplications of Coated Materials . . . . . . . . . . . . . . . . . . . . . . . . . . . . . . . . . . . 3-2
3-2 Coated Fabric Products and the Materials Used to Make Them . . . . . . . . . . . . 3-33-3 Coated Fabric Demand by Product Market . . . . . . . . . . . . . . . . . . . . . . . . . . . . 3-53-4 Coated Fabrics: Principal U.S. Industries and Factors Affecting
Demand . . . . . . . . . . . . . . . . . . . . . . . . . . . . . . . . . . . . . . . . . . . . . . . . . . . . . . . 3-6
4-1 Measure of Market Concentration for Fabric Coatings Companies: 1992 . . . . . . . . . . . . . . . . . . . . . . . . . . . . . . . . . . . . . . . . . . . . . . . . . . . . . . . . . . 4-2
4-2 Full Production Capacity Utilization Rates by Industry: FourthQuarters 1993–1998 . . . . . . . . . . . . . . . . . . . . . . . . . . . . . . . . . . . . . . . . . . . . . . 4-3
4-3 Distribution of Facilities by Employment . . . . . . . . . . . . . . . . . . . . . . . . . . . . . 4-44-4 Costs of Production by Facility Size, 1997 . . . . . . . . . . . . . . . . . . . . . . . . . . . . 4-54-5 Employment Size Distribution of Companies . . . . . . . . . . . . . . . . . . . . . . . . . . 4-74-6 Sales Size Distribution of Companies . . . . . . . . . . . . . . . . . . . . . . . . . . . . . . . . 4-8
5-1 General Trends: 1985–1998 . . . . . . . . . . . . . . . . . . . . . . . . . . . . . . . . . . . . . . . 5-25-2 Coated Fabrics Shipments by Type: 1989–2008 ($106) . . . . . . . . . . . . . . . . . . 5-35-3 Coated Fabrics Pricing Trends: 1989–2008 ($106) . . . . . . . . . . . . . . . . . . . . . . 5-35-4 Coated Fabrics Demand (million sq yards) . . . . . . . . . . . . . . . . . . . . . . . . . . . . 5-45-5 Coated Fabrics Foreign Trade: 1989–2008 ($106) . . . . . . . . . . . . . . . . . . . . . . 5-5
DRAFT
1-1
SECTION 1
INTRODUCTION
The United States Environmental Protection Agency’s (EPA) Office of Air Quality
Planning and Standards (OAQPS) is developing an industry standard for emissions of
Hazardous Air Pollutant (HAP) emissions for the fabric coatings industry. The profile
presented here is intended to provide a basic understanding of the industry in support of an
Economic Impact Analysis (EIA).
1.1 Category Description
The fabric coatings industry produces a wide variety of products, all of which are
created by coating a textile substrate with various polymers. The final product takes on
characteristics of both the substrate and the coating. Products made by the industry include
air bags, clothing, wall coverings, upholstery, tarpaulins, tents, air inflated structures, and
pond liners. The almost infinite variety of combinations of coating and fabric materials
allows for the production of highly technical products with specialized performance
characteristics. Consequently, coated fabrics can be found serving many different functions
in the manufacturing, road building, apparel, aircraft, automotive, boating, transportation,
outdoor equipment, mining, and other industries. Despite the wide variety of products, they
are all created using similar processes. A coating is dipped, rolled, laminated, or spread onto
a fabric substrate.
This report contains federal statistical data that are broken down into the Standard
Industrial Classification (SIC) codes and the North American Industry Classification System
(NAICS) code. After 1997, NAICS codes replaced SIC codes for all federal statistical data.
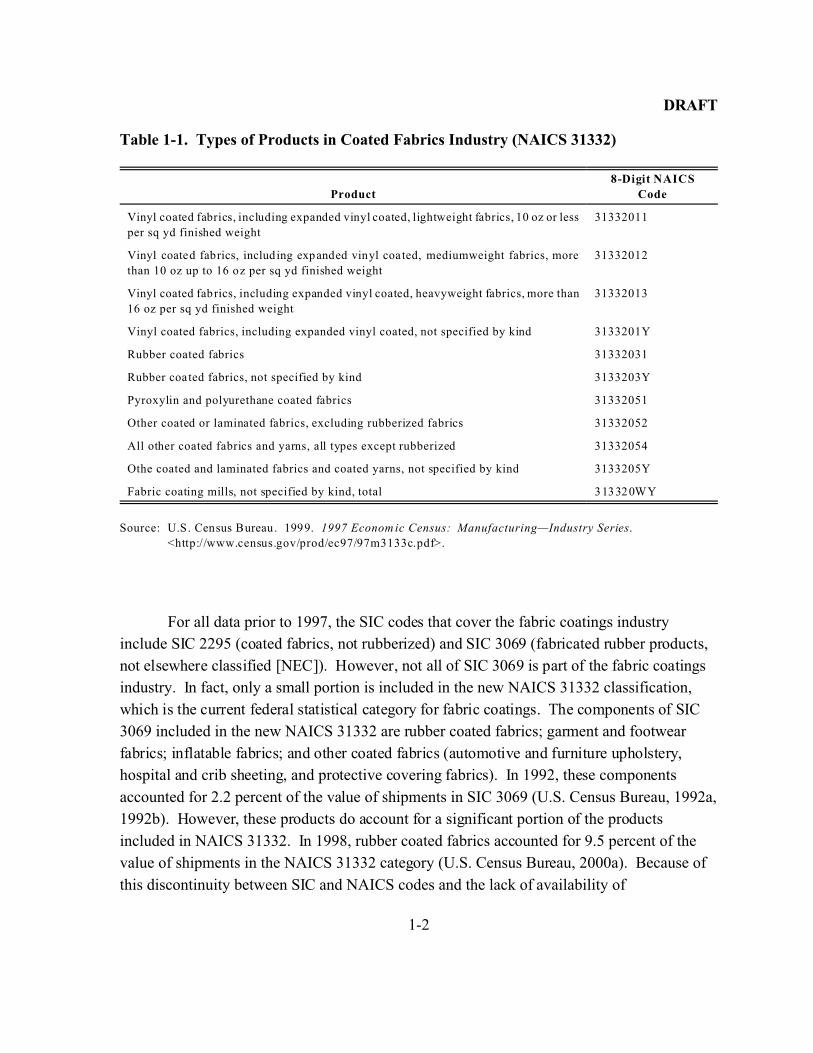
The NAICS 31332 category is comprised of three segments; vinyl coated fabrics, including
expanded vinyl coated; rubber coated fabrics; and other coated or laminated fabrics and
coated yarns that are not rubberized. These categories are broken down further into
subcategories as shown in Table 1-1.
DRAFT
1-2
For all data prior to 1997, the SIC codes that cover the fabric coatings industry
include SIC 2295 (coated fabrics, not rubberized) and SIC 3069 (fabricated rubber products,
not elsewhere classified [NEC]). However, not all of SIC 3069 is part of the fabric coatings
industry. In fact, only a small portion is included in the new NAICS 31332 classification,
which is the current federal statistical category for fabric coatings. The components of SIC
3069 included in the new NAICS 31332 are rubber coated fabrics; garment and footwear
fabrics; inflatable fabrics; and other coated fabrics (automotive and furniture upholstery,
hospital and crib sheeting, and protective covering fabrics). In 1992, these components
accounted for 2.2 percent of the value of shipments in SIC 3069 (U.S. Census Bureau, 1992a,
1992b). However, these products do account for a significant portion of the products
included in NAICS 31332. In 1998, rubber coated fabrics accounted for 9.5 percent of the
value of shipments in the NAICS 31332 category (U.S. Census Bureau, 2000a). Because of
this discontinuity between SIC and NAICS codes and the lack of availability of
Table 1-1. Types of Products in Coated Fabrics Industry (NAICS 31332)
Product
8-Digit NAICS
Code
Vinyl coated fabrics, including expanded vinyl coated, lightweight fabrics, 10 oz or less
per sq yd finished weight
31332011
Vinyl coated fabrics, including expanded vinyl coated, mediumweight fabrics, more
than 10 oz up to 16 oz per sq yd finished weight
31332012
Vinyl coated fabrics, including expanded vinyl coated, heavyweight fabrics, more than
16 oz per sq yd finished weight
31332013
Vinyl coated fabrics, including expanded vinyl coated, not specified by kind 3133201Y
Rubber coated fabrics 31332031
Rubber coated fabrics, not specified by kind 3133203Y
Pyroxylin and polyurethane coated fabrics 31332051
Other coated or laminated fabrics, excluding rubberized fabrics 31332052
All other coated fabrics and yarns, all types except rubberized 31332054
Othe coated and laminated fabrics and coated yarns, not specified by kind 3133205Y
Fabric coating mills, not specified by kind, total 313320WY
Source: U.S. Census Bureau. 1999. 1997 Econom ic Census: Manufacturing—Industry Series.
<http://www.census.gov/prod/ec97/97m3133c.pdf>.

DRAFT
1-3
disaggregated data in years other than census years (1987, 1992), the fabric coatings industry
is characterized here using SIC 2295 before 1997 and NAICS 31332 for 1997 and later years.
1.2 Environmental Concerns
EPA has determined that the fabric coatings industry is a source of HAPs. The
principal source of HAPs is the use of solvents in the production process. EPA administered
a survey to 21 facilities in the industry to gather qualitative data providing descriptions of the
industrial processes and quantitative data for HAP emissions. The survey results were used
to develop a Maximum Achievable Control Technology (MACT) floor for the industry.
Results from 20 of the 21 industries were obtained for HAP emissions, the total of which was
calculated to be 1,231 tons in 1997 for HAPs from all 20 facilities (Hellwig, 2000). Toulene
was the number one hazardous pollutant, making up 47 percent of total HAPs, followed by
Methyl ethyl ketone (34 percent), Hexane (8 percent), Dimethyl formamide (3 percent) (all
others accounted for 8 percent of the total) (Hellwig, 2000).
Emissions from the production of coated fabrics come from various stages of the
industrial process. The preparation of coating materials in mills, mixers, and tanks prior to
application; the coating application area; the flash-off area; and the drying ovens are all
sources of HAP emissions. Survey respondents indicated that 95.7 percent of all emissions
came from the coating application and drying and curing stages of the industrial process.
These processes are described in detail in Section 2.1 of this report. Emissions are dealt with
by using a capture and a control device. Given the similarity among sources, it is not
surprising that similar abatement technologies are used across the industry. Capture devices
are typically covers, vents, hoods, and partial and total enclosures (EPA, 1988). The most
common control devices are incinerators and absorbers.
1.3 Profile Structure
The supply side of the industry is described in the industry profile, including a
description of the production process and its costs. Next is an examination of the demand
side of the industry (i.e., the uses and consumers of coated fabric products), followed by a
look at the fabric coatings facilities to be regulated, including size and location data and their
financial characteristics. Finally, the profile presents the market data to be used in the EIA.

DRAFT
2-1
Figure 2-1. Extrusion Coating Plant
Source: Wypych, J. 1988. Polymer Modified Textile
Materials. New York: John W iley & Sons.
SECTION 2
THE SUPPLY SIDE
This section describes the supply side of the fabric coatings industry. The first part of
the section illustrates the production process and describes materials and production
techniques. A discussion of production costs follows, giving a detailed summary of the costs
suppliers face in the production of coated fabric products.
2.1 Production Process
A similar production process is used to create a wide array of different products in the
fabric coatings industry. All products are composed of a fabric substrate, to which a polymer
coating is applied, giving the product characteristics of the coating and the fabric. The fabric
gives the product strength, structure, and flexibility characteristics. The coating significantly
enhances the fabric’s performance capabilities and provides qualities such as water
repellency, flame retardence, chemical resistance, increased strength, and abrasion
resistance. Coatings are composed of the polymer base, solvents, pigments, plasticizers,
lubricants, and fillers. These ingredients are prepared in mills and mixers to ready the
material for application to the fabric. The coating is applied using a variety of techniques
that dip, roll, or spread the coating
onto the fabric material. The process
must ensure that the fabric is not
damaged during coating application.
After application, the product passes
through a flash-off area on its way to
the drying and curing ovens. These
ovens mark the final stage of the
production process, where the coating
is fused to the substrate. A diagram of
the production process is shown in
Figure 2-1.
DRAFT
2-2
2.1.1 Substrates
The substrate used depends on the type of product desired. Factors such as tear
strength, tensile strength, dimensional stability, and flexibility are heavily influenced by the
choice of the textile material and the way in which it is constructed. The strength and weight
of a fabric is a function of the construction method, the size and weight of the yarn, and the
number of yarns per unit area in the fabric. The most common fabric construction types are
weaves, knits, and nonwoven fabrics. Woven fabrics are very strong and are resistant to
elongation. Knitted substrates allow the fabric to be stretched and contoured. Stretching
allows for tear resistance, but the coating must be able to stretch and flex along with the
fabric. Nonwoven fabrics are less expensive to construct, but are not strong unless they are
coated. Unlike knits and weaves, a coating must be used to impart stability to a nonwoven
fabric.
Cotton, nylon, polyester, polypropylene, rayon, glass, and blends are the most
common types of textile materials. Among these, polyester, cotton, and nylon accounted for
over 90 percent of coated fabrics sold in 1998 (Industry News, 1999). Nylon is the strongest
material used in coated fabrics. Its performance qualities include good abrasion resistance,
high tensile strength, wet strength, excellent flexibility and elasticity, and it can be heat set to
reduce shrinkage. Although sunlight degrades its performance characteristics, coating can
eliminate this problem.
Polyester is not unlike nylon and is used in many similar applications. It is the most
commonly used substrate fiber (Industry News, 1999). While polyester is more resistant to
environmental degredation, the application of coatings is more problematic. The fibers have
a very smooth surface that creates bonding difficulties. Polypropylene is very inexpensive
and has the highest weight-to-strength ratio among common fibers. Like polyester, it is
difficult to apply a durable coating to polypropylene. It is also easily susceptible to heat
damage.
Cotton absorbs and transmits moisture very easily and is commonly used in apparel
products. It can act as a barrier under intense heat and is stronger when wet. Rayon is a
synthetic form of cotton; it is not as strong as cotton and tends to shrink. Mechanical
adhesion is difficult, but chemical adhesion and dyes are easily imparted to the fabric. Glass
is used in conveyor belts and other applications where rigid reinforcement. It resists high
temperatures, is chemically inert, and has high tensile strength, but breaks easily when bent.

DRAFT
2-3
Other high-strength fibers such as kevlar and other carbon fibers are used in the industry for
specialized applications.
2.1.2 Coatings
The most common coating materials used in the industry are vinyl (PVC),
polyurethane, and rubber compounds. Other compounds, such as acrylic and teflon, are also
used to produce coated fabrics. PVC is often the least expensive coating material, but does
not always provide the desired product performance qualities. There is no unique solution to
polymer choice because different materials can be used to achieve similar results in the end
product. The manufacturer’s choice of polymer is affected by polymer properties, polymer
availability, cost analysis, equipment available, tradition, and environmental protection
(Wypych, 1988).
Prior to application, base polymers are mixed in tanks with plasticizers and solvents
to adjust viscosity. The viscosity of the coating must permit flow around the fiber surface
(Kroschwitz, 1986). Pigments, lubricants, stabilizers, and fillers are also added to the
mixture to form the coating material. From the mixing tanks, the coating is transported to
the line of production, where it is applied using various techniques discussed later in this
report.
PVC is the most commonly used polymer. It is inexpensive and resistant to
combustion, chemicals, aging, and abrasion, and it can be applied to the substrate using a
variety of techniques. With the use of plasticizers, PVC can be processed into a soft,
manageable compound that can be easily applied to a fabric. PVC is used to produce coated
products such as tarpaulins, tents, roofing materials, greenhouses, boat covers, boats,
conveyor belts, pool covers, rainwear, luggage, automotive upholstery, and a variety of
technical protective clothing products (Wypych, 1988).
Polyurethane is another common coating type that can be used for a wide variety of
products such as tents, life vests, evacuation slides, flexible fuel storage tanks, and apparel
items (Howe-Grant, 1993). Inflatable boats, rainwear, luggage, automotive upholstery, water
storage bags, food conveyor belts, and fuel hoses are also made with polyurethane coatings
(Wypych, 1988). They provide ultra-violet protection, toughness, and can impart a leather-
like feel to the fabric. Like PVC, polyurethanes can create a clear protective finish to
decorative products (such as wall coverings). Polyurethane coatings provide more protection
from abrasion than PVC but are less elastic.
DRAFT
2-4
Rubber or elastomer coatings make up another category of commonly used coatings
in the industry. There are an extremely large number of variations of available elastomers,
including natural rubber, silicones, acrylics, styrene-butadiene (SBR), polyisoprene, and
many more. These different materials can be used to create products that are oil, water, and
flame resistant. Rubber or elastomer coatings are used in both latex and solid forms. Rubber
coated products are used for rainwear, boats, lifeboats, gymnasium mats, aprons, truck
covers, containers, garbage chutes, neoprene wetsuits, roofing materials, protective garments,
inflated structures, balloons, and fumigation covers (Wypych, 1988; Howe-Grant, 1993).
Solvents are often used with rubber coating processes and add high levels of HAP emissions
to the production process.
Acrylic and teflon are also used extensively as coating materials. Acrylic resins are
the most common material for a class of products known as geotextiles. These fabric
products are used in earth structures. Drainage projects, asphalt construction, erosion
control, mining, road building, and earth stabilization projects all make use of geotextiles
(Wypych, 1988). Teflon is used to coat glass fabrics in industrial applications such as
warehouses, sports halls, exhibition tents, stadiums, swimming pools, gaskets, conveyor
belts, public meeting facilities, and other large structures (Wypych, 1988).
The list of products presented above illustrates the wide variety of uses for coated
fabrics. It is important to note that the same products may be produced with different
materials. As stated earlier, the choice of the coating material will depend on a variety of
factors, including end use, cost, traditional local techniques, environmental concerns, and the
availability of materials and equipment.
2.1.3 Coating Application Processes
There are various ways to apply coating to the fabric substrate. The method chosen
depends on the properties of the substrate and the coating material. In all application types,
the fabric is placed under tension and is directed through a system of rollers. Rollers are
combined with various types of equipment used to apply the coating material. The most
commonly used techniques are reverse-roll coating, calendering, knife-over-roll coating,
transfer coating, impregnation, direct-gravure coating, lamination, rotary-screen, and
extrusion coating. The coating is usually heated, and care must be taken to ensure that the
fabric is not damaged by high temperatures. The coating application process is a source of
HAP emissions, which come primarily from the use of solvents in coating materials.

DRAFT
2-5
Figure 2-2. Calendering
Source: Kroschwitz, J.I. ed. 1986 . Encyclopedia
of Polymer Science and Engineering.
Volume 6: Emulsion Polymerization to
Fibers, Manufacture. New York: John
Wiley & Sons.
Figure 2-3. Knife-Over-Roll Coating
Source: Kroschwitz, J.I. ed. 1986 . Encyclopedia
of Polymer Science and Engineering.
Volume 6: Emulsion Polymerization to
Fibers, Manufacture. New York: John
Wiley & Sons.
Calendering is the most efficient method
of coating. It allows for high speed processing
using three vertically arranged rolls. A fabric
under tension is passed between two of the rollers,
one of which applies the coating. The coating
passes over heated rolls before being applied to
the substrate (see Figure 2-2). Coatings of 0.1 to
0.5 mm can be applied to the fabric (Kroschwitz,
1986). Rubber and PVC compounds lend
themselves well to this coating technique.
In knife-over-roll coatings, the fabric
passes under a blade that spreads the coating onto
the fabric. The coating material is placed in front
of the knife, and the distance between the knife
and the fabric regulates the thickness of the
coating (see Figure 2-3). This method is most
commonly used in the production of
polyurethane-coated fabrics (Howe-Grant, 1993).
This process often requires the heavy use of
solvents, which creates a larger amount of HAP
emissions. The technique is usually used with
slow application rates and is most common with
thin coatings.
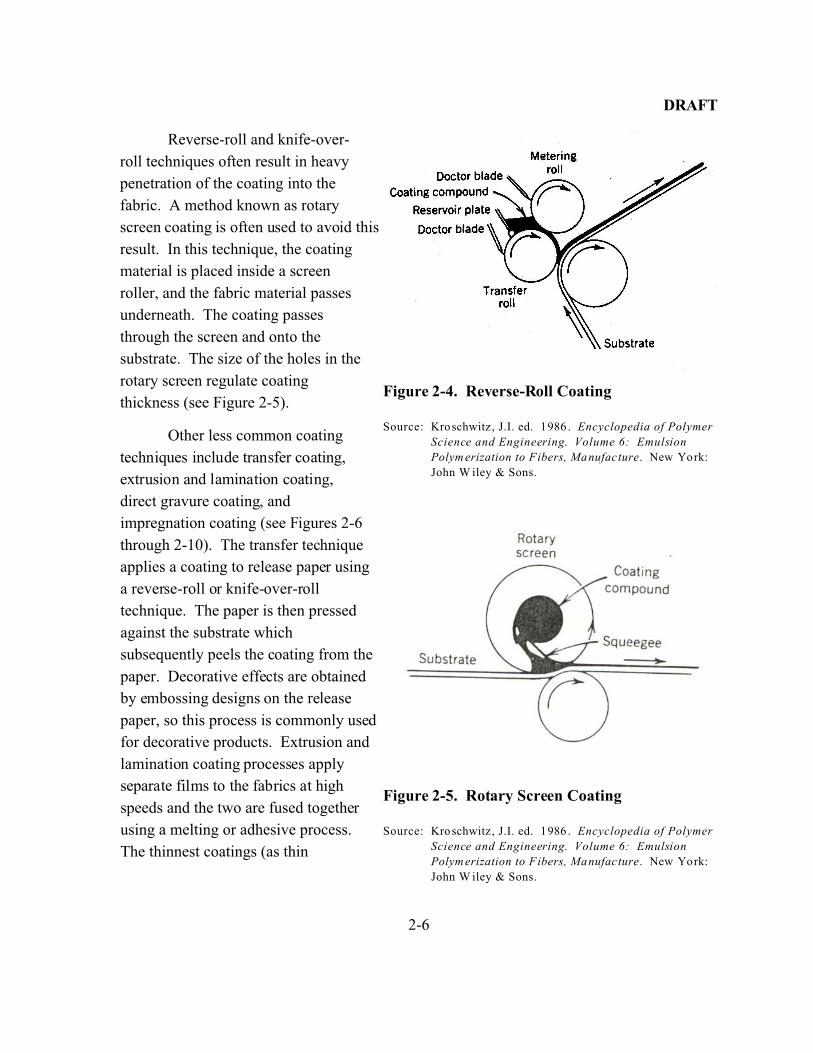
The most expensive coating technique is
reverse-roll coating, which uses three precisely
ground steel rollers to apply a coating to the fabric
(see Figure 2-4). The rolls must have precisely
regulated drive speeds to obtain the desired
coating effect. Reverse-roll coating is versatile
and can be used with the widest variety of coating
viscosities and production speeds. The distance
between the transfer roll and the backing roll
determines the thickness of the coating. This technique commonly makes use of solvents.
DRAFT
2-6
Figure 2-4. Reverse-Roll Coating
Source: Kroschwitz, J.I. ed. 1986 . Encyclopedia of Polymer
Science and Engineering. Volume 6: Emulsion
Polym erization to Fibers, Manufacture. New York:
John W iley & Sons.
Figure 2-5. Rotary Screen Coating
Source: Kroschwitz, J.I. ed. 1986 . Encyclopedia of Polymer
Science and Engineering. Volume 6: Emulsion
Polym erization to Fibers, Manufacture. New York:
John W iley & Sons.
Reverse-roll and knife-over-
roll techniques often result in heavy
penetration of the coating into the
fabric. A method known as rotary
screen coating is often used to avoid this
result. In this technique, the coating
material is placed inside a screen
roller, and the fabric material passes
underneath. The coating passes
through the screen and onto the
substrate. The size of the holes in the
rotary screen regulate coating
thickness (see Figure 2-5).
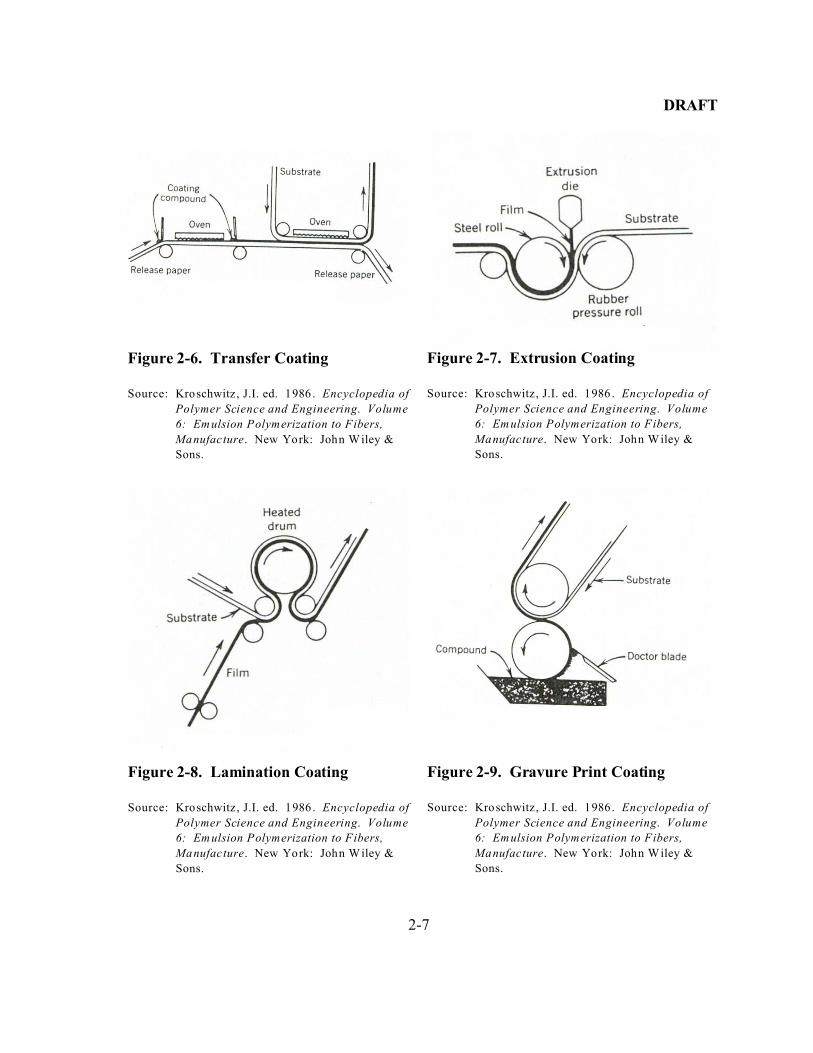
Other less common coating
techniques include transfer coating,
extrusion and lamination coating,
direct gravure coating, and
impregnation coating (see Figures 2-6
through 2-10). The transfer technique
applies a coating to release paper using
a reverse-roll or knife-over-roll
technique. The paper is then pressed
against the substrate which
subsequently peels the coating from the
paper. Decorative effects are obtained
by embossing designs on the release
paper, so this process is commonly used
for decorative products. Extrusion and
lamination coating processes apply
separate films to the fabrics at high
speeds and the two are fused together
using a melting or adhesive process.
The thinnest coatings (as thin
DRAFT
2-7
Figure 2-6. Transfer Coating
Source: Kroschwitz, J.I. ed. 1986 . Encyclopedia of
Polymer Science and Engineering. Volume
6: Emulsion Polymerization to Fibers,
Manufacture. New York: John Wiley &
Sons.
Figure 2-7. Extrusion Coating
Source: Kroschwitz, J.I. ed. 1986 . Encyclopedia of
Polymer Science and Engineering. Volume
6: Emulsion Polymerization to Fibers,
Manufacture. New York: John Wiley &
Sons.
Figure 2-8. Lamination Coating
Source: Kroschwitz, J.I. ed. 1986 . Encyclopedia of
Polymer Science and Engineering. Volume
6: Emulsion Polymerization to Fibers,
Manufacture. New York: John Wiley &
Sons.
Figure 2-9. Gravure Print Coating
Source: Kroschwitz, J.I. ed. 1986 . Encyclopedia of
Polymer Science and Engineering. Volume
6: Emulsion Polymerization to Fibers,
Manufacture. New York: John Wiley &
Sons.
DRAFT
2-8
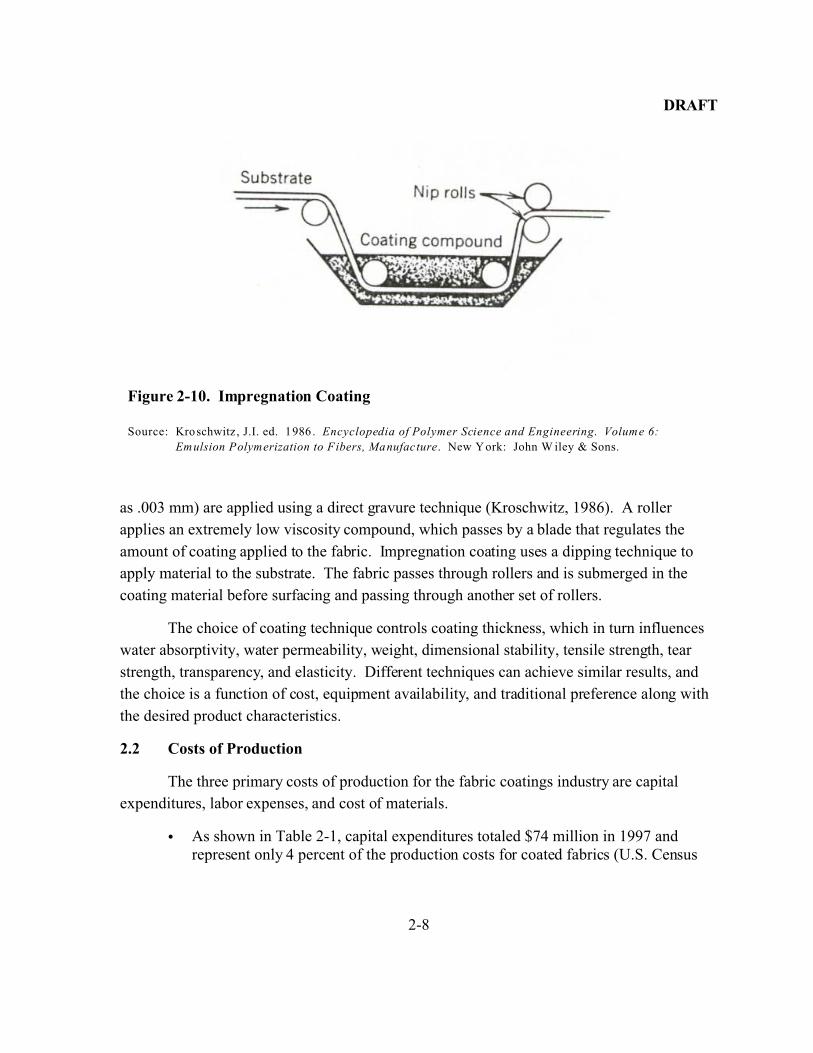
Figure 2-10. Impregnation Coating
Source: Kroschwitz, J.I. ed. 1986 . Encyclopedia of Polymer Science and Engineering. Volume 6:
Emulsion Polymerization to Fibers, Manufacture. New York: John W iley & Sons.
as .003 mm) are applied using a direct gravure technique (Kroschwitz, 1986). A roller
applies an extremely low viscosity compound, which passes by a blade that regulates the
amount of coating applied to the fabric. Impregnation coating uses a dipping technique to
apply material to the substrate. The fabric passes through rollers and is submerged in the
coating material before surfacing and passing through another set of rollers.
The choice of coating technique controls coating thickness, which in turn influences
water absorptivity, water permeability, weight, dimensional stability, tensile strength, tear
strength, transparency, and elasticity. Different techniques can achieve similar results, and
the choice is a function of cost, equipment availability, and traditional preference along with
the desired product characteristics.
2.2 Costs of Production
The three primary costs of production for the fabric coatings industry are capital
expenditures, labor expenses, and cost of materials.
C As shown in Table 2-1, capital expenditures totaled $74 million in 1997 andrepresent only 4 percent of the production costs for coated fabrics (U.S. Census

DRAFT
2-9
Bureau, 1999). Buildings and other structures accounted for 16 percent of theseexpenses, while machinery and equipment made up the remaining 84 percent.
C The industry spent $505 million on labor in 1997, which accounted for 27 percentof total production expenditures. Approximately 76 percent of labor costs werespent on annual payroll, and the remainder went toward fringe benefits (U.S.Census Bureau, 1999).
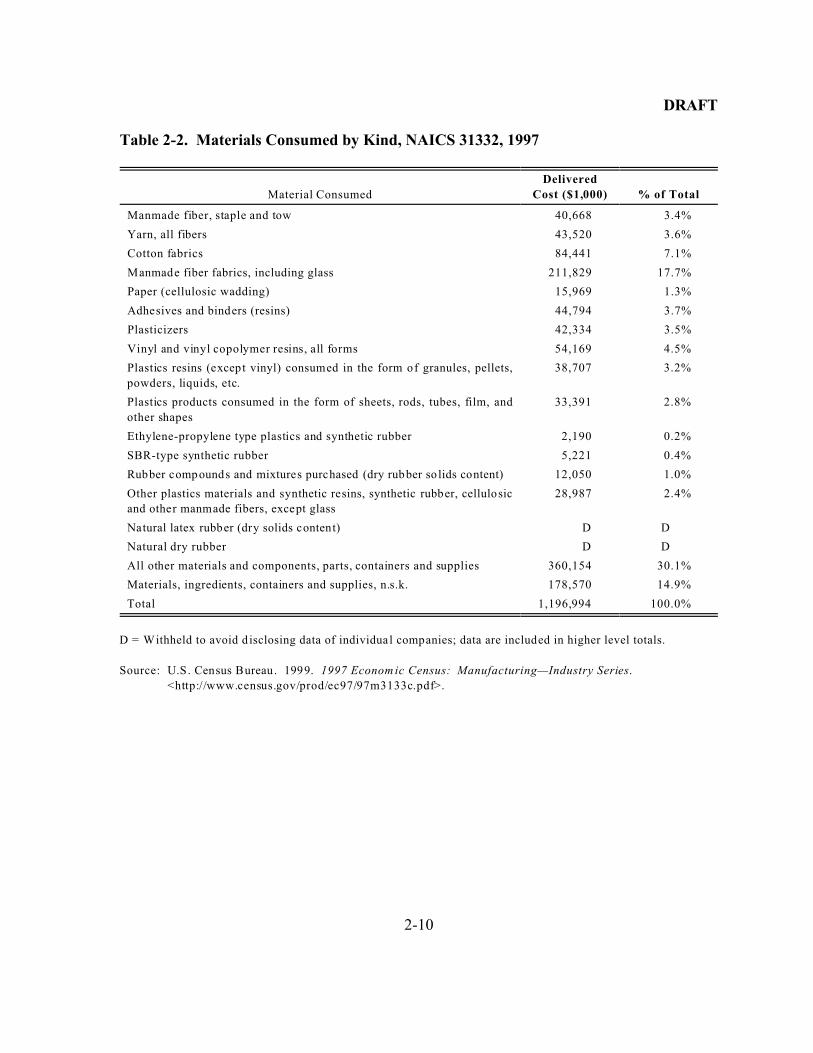
C By far the largest cost of production for the industry in 1997 was the cost ofmaterials. The $1,331 million spent on materials by the industry constitutedabout 69 percent of total production costs. Approximately 92 percent of materialscosts were for materials, parts, containers, and other such materials. Theremaining 8 percent was made up by resales, fuels purchased, electricity, andcontract work. Table 2-2 shows the cost of materials consumed by kind for theindustry in 1997. Man-made fiber fabrics and other materials make up the largestcomponents of materials consumed in the production process (U.S. CensusBureau, 1999).
Table 2-1. Production Costs for NAICS 313320, Fabric Coating Mills
1997
($106)
Percentage of Total Cost
of Production
Total Cost of Production 1,881 100.0%
Total Capital Expenditures 74 4.0%
Buildings and Other Structures 12 0.7%
Machinery and Equipment 62 3.3%
Total Labor Expenditures 505 26.9%
Annual Payroll 383 20.4%
Fringe Benefits 122 6.5%
Total Cost of Materials 1,301 69.2%
Materials, Parts, Containers, etc. 1,203 63.9%
Resales 38 2.0%
Fuels 20 1.1%
Purchased Electricity 23 1.2%
Contract Work 18 0.9%
Source: U.S. Census Bureau. 1999. 1997 Econom ic Census: Manufacturing—Industry Series.
<http://www.census.gov/prod/ec97/97m3133c.pdf>.
DRAFT
2-10
Table 2-2. Materials Consumed by Kind, NAICS 31332, 1997
Material Consumed
Delivered
Cost ($1,000) % of Total
Manmade fiber, staple and tow 40,668 3.4%
Yarn, all fibers 43,520 3.6%
Cotton fabrics 84,441 7.1%
Manmade fiber fabrics, including glass 211,829 17.7%
Paper (cellulosic wadding) 15,969 1.3%
Adhesives and binders (resins) 44,794 3.7%
Plasticizers 42,334 3.5%
Vinyl and vinyl copolymer resins, all forms 54,169 4.5%
Plastics resins (except vinyl) consumed in the form of granules, pellets,
powders, liquids, etc.
38,707 3.2%
Plastics products consumed in the form of sheets, rods, tubes, film, and
other shapes
33,391 2.8%
Ethylene-propylene type plastics and synthetic rubber 2,190 0.2%
SBR-type synthetic rubber 5,221 0.4%
Rubber compounds and mixtures purchased (dry rubber so lids content) 12,050 1.0%
Other plastics materials and synthetic resins, synthetic rubber, cellulosic
and other manmade fibers, except glass
28,987 2.4%
Natural latex rubber (dry solids content) D D
Natural dry rubber D D
All other materials and components, parts, containers and supplies 360,154 30.1%
Materials, ingredients, containers and supplies, n.s.k. 178,570 14.9%
Total 1,196,994 100.0%
D = Withheld to avoid d isclosing data of individual companies; data are included in higher level totals.
Source: U.S. Census Bureau. 1999. 1997 Econom ic Census: Manufacturing—Industry Series.
<http://www.census.gov/prod/ec97/97m3133c.pdf>.
DRAFT
3-1
SECTION 3
THE DEMAND SIDE
This section gives a detailed illustration of the demand side of the fabric coatings
industry. It starts by describing coated fabric products, and then discusses the uses and
consumers of coated fabrics and possible substitutes.
3.1 Product Characteristics
The coated fabric’s characteristics are a function of the type of fabric used and the
coating that is applied to it. The fabric provides the foundation for the product’s strength and
flexibility characteristics. The coating improves durability, abrasion resistance, flame
retardence, oil resistance, chemical resistance, strength, and/or flexibility. Table 3-1 lists the
wide variety of product characteristics demanded by consumers of coated fabrics.
Table 3-1 shows the vast array of qualities demanded by the consumers of coated
fabrics. The techniques used to achieve these product qualities are variable, and different
materials and manufacturing techniques can be used to obtain the same characteristic in the
final product. Coated fabric products are produced to meet specialized requirements
determined by the end use. For example, the product may be relatively simple and
inexpensive, or highly technical and expensive, depending on how it will be used.
3.2 Uses and Consumers
The fabric coating industry produces products for a wide variety of uses and
consumers. Coated fabrics can be used for indoor and outdoor apparel, luggage, tarpaulins,
equipment covers, wall coverings, automotive uses, tents, air-inflated structures, books,
hoses, belts and gaskets, leather imitations, and a variety of industrial uses.

DRAFT
3-2
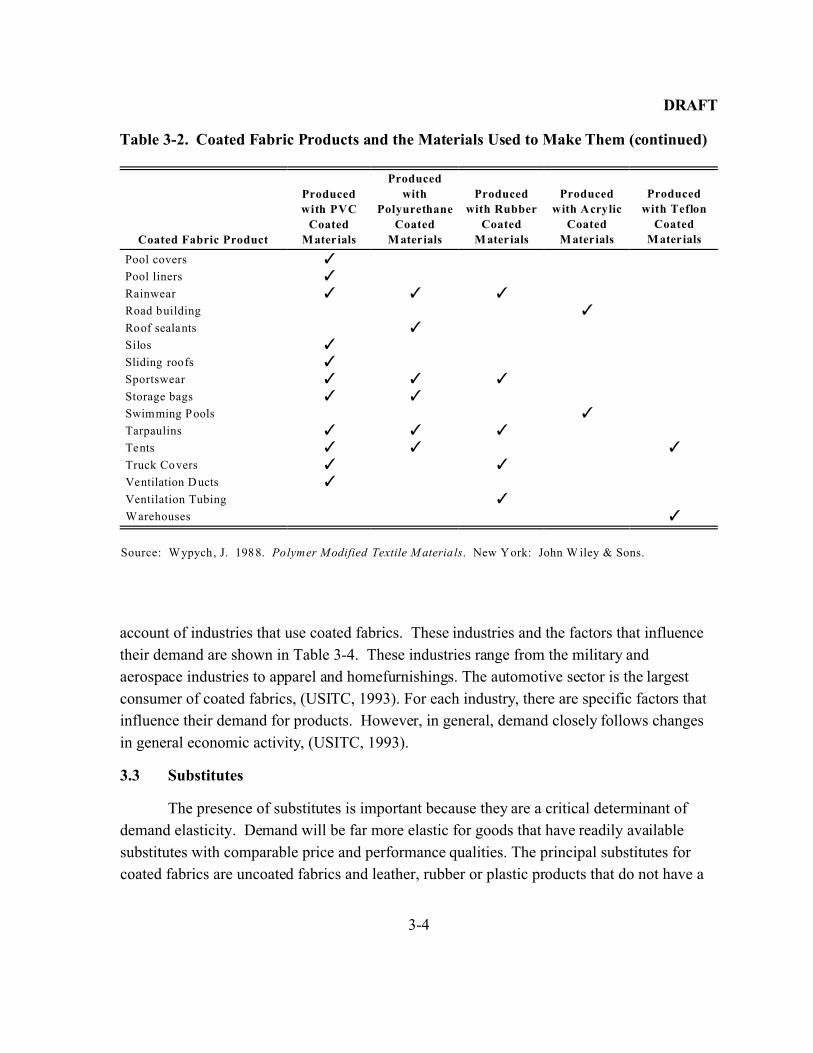
As Table 3-2 indicates, there are a wide variety of products in the industry. It is also
important to note that many products are produced with a variety of techniques. For
instance, food containers are produced with rubber, polyurethane, and PVC coatings.
Similarly, clothing products are made with all three types of coatings. Although various
coatings can provide the same function, many specialized products are only made with
specific coating materials, such as arctic fuel drums and fabrics used to control erosion
(Wypych, 1988).
The wide variety of uses and applications for coated fabrics translates into an equally
wide variety of industries and consumers that use them. Automotive, apparel, furniture,
wallcovering, book, tent, road building, and many other industries all make extensive use of
coated fabrics. Table 3-3 presents the markets that demand coated fabrics. In a 1993 report
on the industry, the United States International Trade Commission (USITC) gives another a
Table 3-1. Variables Essential for Product Development Derived from Applications ofCoated Materials
Tensile Strength Food Contact
Elasticity Effect of Chemicals
Abrasion Resistance Microbiological Protection
Tear Resistance Biological Corrosion
Dimensional Stability Aging Properties
Interlayer Adhesion Service Duration
Surface Roughness Weight
Compatibility Odor
Joints Formation and Properties Effect of Temperature
Burning Behavior Thermal Properties
Water Permeability Antistatic Properties
Solvent Vapor Permeability Air Tightness
Light Transparency Sunlight Reflection
Product Appeal Colorfastness
Cleaning Frequency
Source: Wypych, J. 1988. Polymer Modified Textile M aterials. New York: John W iley & Sons.

DRAFT
3-3
Table 3-2. Coated Fabric Products and the Materials Used to Make Them
Coated Fabric Product
Produced
with PVC
Coated
Materials
Produced with
Polyurethane
Coated
Materials
Produced
with Rubber
Coated
Materials
Produced
with Acrylic
Coated
Materials
Produced
with Teflon
Coated
Materials
Air inflated structures TAprons TArctic fuel drums TAsphalt construction TAutomotive upholstery T TAwnings TBoat Covers T TBoats T TChimney covers TClothing T T TCollapsible containers T T TCollapsible fuel tanks TConveyor belts T T TDevices to reduce escape
of vapors
T
Earth stabilization TErosion control TFactory curtains TFlexible space dividers TFood containers T T TFootwear T T TFuel hoses T TGarbage chutes TGaskets TGreenhouses
Gymnasium mats THome furnishings T TInflatable boats T TLarge buildings and
structures
T
Life jackets TLuggage T TMembranes TMining TOil ring shelters T
(continued)
DRAFT
3-4
account of industries that use coated fabrics. These industries and the factors that influence
their demand are shown in Table 3-4. These industries range from the military and
aerospace industries to apparel and homefurnishings. The automotive sector is the largest
consumer of coated fabrics, (USITC, 1993). For each industry, there are specific factors that
influence their demand for products. However, in general, demand closely follows changes
in general economic activity, (USITC, 1993).
3.3 Substitutes
The presence of substitutes is important because they are a critical determinant of
demand elasticity. Demand will be far more elastic for goods that have readily available
substitutes with comparable price and performance qualities. The principal substitutes for
coated fabrics are uncoated fabrics and leather, rubber or plastic products that do not have a
Table 3-2. Coated Fabric Products and the Materials Used to Make Them (continued)
Coated Fabric Product
Produced
with PVC
Coated
Materials
Produced
with
Polyurethane
Coated
Materials
Produced
with Rubber
Coated
Materials
Produced
with Acrylic
Coated
Materials
Produced
with Teflon
Coated
Materials
Pool covers TPool liners TRainwear T T TRoad building TRoof sealants TSilos TSliding roofs TSportswear T T TStorage bags T TSwimming Pools TTarpaulins T T TTents T T TTruck Covers T TVentilation Ducts TVentilation Tubing TWarehouses T
Source: Wypych, J. 1988. Polymer Modified Textile M aterials. New York: John W iley & Sons.

DRAFT
3-5
fabric substrate. For example, uncoated canvas fabric is sometimes used for tents. Also,
plastic sheets can be used as tarpaulins or rain ponchos. Imitation leather products are
typically made with polyurethane coated fabrics. Consequently, authentic leather products
are substitutes for the imitations. Coated fabrics tend to perform better than fabrics that are
not coated; they can be stronger, more waterproof, or exhibit other qualitites presented earlier
in this section that cannot be achieved from an uncoated fabric product. Similarly, materials
that lack a fabric substrate are not as stable and resilient as a coated fabric product.
Consequently, there are not many substitutes for coated fabrics that exhibit comparable
performance characteristics. However, coated fabrics can be substituted for one another, as
various types of fabrics and coatings can be combined to perform similar tasks.
Table 3-3. Coated Fabric Demand by Product Market
Market Percent of Demand
Motor Vehicles 26%
Furniture 19%
Industrial 10%
Wallcoverings 9%
Protective Clothing 9%
Books 6%
Awnings 5%
Non-auto Transportation 5%
Tents and Other 11%
Source: Freedonia Group. 1999. Coated Fabrics in the United States to 2003— Introduction, Executive
Sum mary, Market Environm ent, Coated Shipments, Demand and Markets. Available at
<http://www.profound.com/htbin/titles_do>.

DRAFT
3-6
Table 3-4. Coated Fabrics: Principal U.S. Industries and Factors Affecting Demand
Industry Demand Factors
Aerospace Space programs and developmental projects; military spending on aircraft;
replacement of aircraft or parts by commercial airlines.
Apparel and footwear Styles and fashion; improved characteristics (i.e., breathability and moisture
absorbency)
Automotive New products, (i.e., air bags); interior style change (i.e., cloth seats); substitibility
for other materials (i.e., plastics)
Chemicals and o il Environmental awareness; new EPA regulations; change in storage and shipping
capacity
Construction and building Expansion of infrastructures; housing starts; repairing of existing civil engineering
projects
Homefurnishings Awareness of home energy conservation; home decorating; popularity of leisure and
casual furniture
Luggage Economic conditions affecting the travel industry; styles and fashion
Marine and boating Popularity of water-related activities; favorable climatic conditions
Medical and health Public and institutional awareness of confinement of contagious diseases;
disposable versus reusable products; new medical discoveries and applications
Military Shortage of required equipment; international armed conflict; change in number of
active-duty and reserve forces
Recreation and sports New sports facilities; promotion of physical fitness and individual conditioning;
more individual leisure and recreational time
Source: U.S. International T rade Commission (USITC). 1993 . Industry and Trade Summ ary: Coated Fabrics.
Washington, DC: U.S. International Trade Commission.

DRAFT
4-1
SECTION 4
INDUSTRY ORGANIZATION
This section provides information for describing firms’ behavior within the market
for fabric coated products. Data for location of coating facilities are provided, along with a
description of market structure in terms of key estimates of industry construction.
4.1 Market Structure
Market structure is of interest because it determines the behavior of producers and
consumers in the industry. In perfectly competitive industries, neither consumers nor
producers can affect the prices of goods. In addition, producers are unable to affect the price
of inputs purchased for use in their products. This condition most likely holds if the industry
has a large number of buyers and sellers, the products sold and inputs used in production are
homogeneous, and there is free entry and exit for firms in the industry. Entry and exit of
firms are unrestricted for most industries, except in cases where one firm holds a patent on a
product, where the government regulates who is able to produce output (like in the utility
industries), where one firm owns the entire stock of a critical input (as in the diamond
industry), or where a single firm is able to supply the entire market. In industries that are not
perfectly competitive, producer and/or consumer behavior can affect price considerations.
Concentration ratios (CRs) and Herfindahl-Hirschmann indices (HHIs) can provide
some insight into the competitiveness of an industry. The U.S. Department of Commerce
reports these ratios and indices for the four-digit SIC code level for 1992, which is the most
recent year available. CRs are typically measured in two ways: the CR4 gives the
percentage of sales for the top four companies in an industry, and the CR8 is the percentage
of sales for the top eight companies in an industry. Table 4-1 shows the measure of market
concentration for fabric coatings companies in 1992.
The criteria for evaluating the HHIs are based on the 1992 Department of Justice’s
Horizontal Merger Guidelines. According to these criteria, industries with HHIs below
1,000 are considered unconcentrated (i.e., more competitive), those with HHIs between
1,000 and 1,800 are considered moderately concentrated (i.e., moderately competitive), and

DRAFT
4-2
those with HHIs above 1,800 are considered highly concentrated (i.e., less competitive). In
general, firms in less concentrated industries are more likely to be price takers, while those in
more concentrated industries have more ability to influence market prices. Based on these
criteria, the fabric coatings industry is considered unconcentrated.
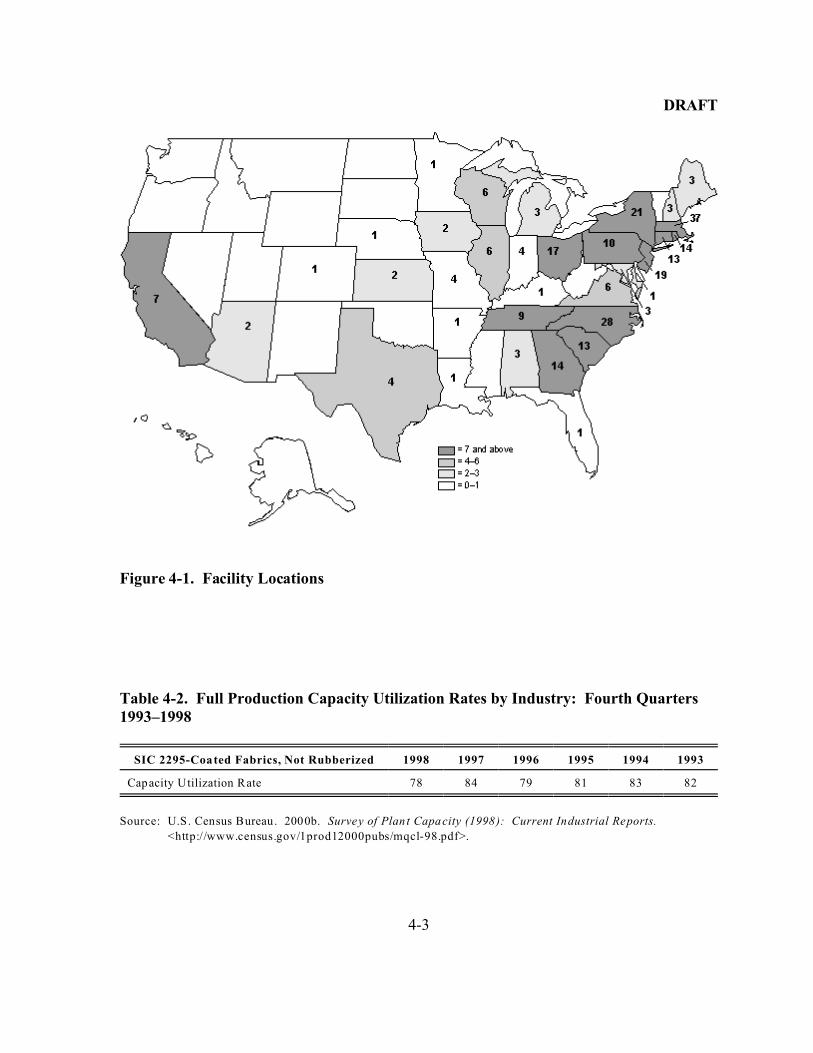
4.2 Manufacturing Facilities
EPA has identified 261 facilities that produce coated fabrics. The location (by state)
of these facilities is shown in the map in Figure 4-1. Most production for the industry is
concentrated in the eastern part of the country. Massachusetts has the greatest number of
manufacturing facilities (37). North Carolina is second (28), followed by New York (21),
New Jersey (19), and Ohio (17). There are 16 states without any facilities that produce
coated fabrics. These are mostly concentrated in the western United States, but Vermont,
West Virginia, Mississippi, and Oklahoma are also without any facilities.
4.3 Industry Production and Capacity Utilization
The U.S. Census Bureau collects data for capacity utilization rates industries across
the manufacturing sector. Capacity utilization is defined as the ratio of actual value of
production to the level at which a plant can produce at full production capacity. These data
can indicate the health of an industry—a low rate of capacity utilization indicates the
presence of idle capital equipment and lower than expected production rates. As shown in
Table 4-2, census data for plant capacity utilization for SIC 2295 (coated fabrics, not
rubberized) reveal approximately an 80 percent capacity utilization rate for facilities in the
industry.
Table 4-1. Measure of Market Concentration for Fabric Coatings Companies: 1992
SIC Number of Companies Value of Shipments CR4 CR8 HHI
2295 186 1,528.1 20 34 228
3069 984 6,937 18 26 129
Source: U.S. Census Bureau. 1992c. Concentration Ratios in Manufacturing, MC92-S-2 . Available at
http://www.census.gov/mcd/mancen/download/mc92cr.sum>.
DRAFT
4-3
Figure 4-1. Facility Locations
Table 4-2. Full Production Capacity Utilization Rates by Industry: Fourth Quarters1993–1998
SIC 2295-Coated Fabrics, Not Rubberized 1998 1997 1996 1995 1994 1993
Capacity Utilization Rate 78 84 79 81 83 82
Source: U.S. Census Bureau. 2000b. Survey of Plant Capacity (1998): Current Industrial Reports.
<http://www.census.gov/1prod12000pubs/mqcl-98.pdf>.

DRAFT
4-4
Data provided to EPA by an industry trade association indicate a much lower
capacity utilization rate than the census data reveal. These data show an average capacity
utilization rate of only 43 percent for facilities that engage in the production of coated fabrics
and related textile products. This very different capacity utilization rate may reflect a period
of relatively low demand during which a substantial share of productive capital was idle. It
may also represent a subset of the industry that was experiencing a more significant decline.
4.4 Facility Employment
Census data taken for the 31223 NAICS category facilities reveals a relatively even
dispersion of facility employment sizes up to about 250 workers. As shown in Table 4-3,
there are only six facilities that employ more than 250 workers. The smallest employment
size category, with between one and four workers, has the largest number of operating
facilities (59). This represents 23 percent of the 258 facilities that make up the 31332
NAICS category. The next largest employment size category has between 20 and 49
workers. There are 55 facilities in this grouping (21 percent of the total). It should be noted
that these figures are for the facility level, not the company level. Company employment
data are presented in Section 4.5.
Table 4-3. Distribution of Facilities by Employment
Employment Range Number of Facilities Share of Total
1-4 59 22.9%
5-9 43 16.7%
10-19 35 13.6%
20-49 55 21.3%
50-99 34 13.2%
100-249 26 10.1%
250-499 6 2.3%
Sources: Hoover’s Online. 2001. Companies and Industry. Available at
<http://www.hoovers.com/companyindustry/0 ,1334,8,00.html>.
. Lycos Companies Online. 2001. Company Research. Available at
<http://www.companiesonline.com>.
Gale Group. 2000. INFOTRAC Database. <http://infotrac/galegroup.com>. Farmington Hills, MI:
Gale Group.
Lexis/Nexis. 2001. Academic Universe Database. <http://web.lexis-nexis.com/universe>. Bethesda,
MD: Lexis/Nexis.

DRAFT
4-5
Facilities of various sizes tend to have similar cost structures. Table 4-4 shows
facility expenditures for wages, materials, and capital by size category for facilities in
NAICS 31332 in 1997. The smallest facility size category has between one and four
workers. For this grouping, wages constitute 14 percent of the total for these expenditures,
materials make up 81 percent, and capital expenditures are 5 percent of the total. Similarly,
the size category with 20 to 49 workers spends 14 percent of these outlays on wages, 83
percent on materials, and 3 percent on capital. The largest facilities spent more on wages
and capital than their competitors in 1997. Approximately 18 percent of money spent on
wages capital and materials went towards wages, 73 percent was for materials, and capital
expenditures made up the remaining 8 percent.
4.5 Companies
Potentially directly affected companies include entities that own coated fabrics
manufacturing plants. The chain of ownership may be simple as one plant owned by one
company or as complex as multiple plants owned by subsidiary companies. Based on survey
and secondary source data, EPA identified 230 ultimate parent companies that own and
operate the directly affected fabric coatings facilities. For the economic analysis, EPA
Table 4-4. Costs of Production by Facility Size, 1997
Number of Employees
Industry Segment Cost
Component 1 to 4 5 to 9
10 to
19
20 to
49
50 to
99
100 to
249
250 to
499
313320 Fabric Coating M ills
Wages ($106) 1.80 4.43 7.45 31.69 43.05 88.76 45.49
Total Materials ($106) 10.34 22.94 55.70 185.08 350.45 492.19 181.51
Capital Expenditures ($106) 0.55 1.27 3.06 7.23 12.03 28.99 21.32
Number of Facilities 59 43 35 55 34 26 6
Source: U.S. Census Bureau. 1999. 1997 Econom ic Census: Manufacturing—Industry Series.
<http://www.census.gov/prod/ec97/97m3133c.pdf>.

DRAFT
4-6
obtained company sales and employment data from survey data or one of the following
secondary sources:
C Dun & Bradstreet Market Identifiers (Lycos Companies Online, 2001);
C Academic Universe (Lexis/Nexis, 2001);
C General BusinessFile International (Gale Group, 2000); or
C Hoover’s Company Profiles (Hoover’s Online, 2001).
Sales and employment data were available for 169 of the 230 companies and are included in
Appendix A.
4.5.1 Small Business Identification
The Regulatory Flexibility Act (RFA) of 1980, as amended by the Small Business
Regulatory Enforcement Fairness Act (SBREFA) of 1996, requires EPA to give special
consideration to small entities affected by federal regulation. Companies operating fabric
coatings manufacturing plants can be grouped into small and large categories using Small
Business Administration (SBA) general industry size standard definitions. The SBA defines
small business in terms of the sales or employment of the owning entity, and these thresholds
vary by the industry classification (NAICS code). Businesses within the NAICS 31332
industry category that have 1,000 or fewer employees are considered small by the SBA (U.S.
SBA, 2001).
Table 4-5 shows the large number of facilities in this industry that employ a small
number of workers. Based on survey and secondary source data, EPA identified 230 parent
companies that own and operate the directly affected fabric coatings facilities. Employment
and sales data were available for 169 of the 230 companies. Only 18 percent of the
companies identified by EPA as owners of affected facilities employ more than 1,000
workers. Using the SBA definition of a small business, 57 percent of the companies
identified fall in the small business category. This is probably an underestimate of the
proportion of small businesses in the industry. It is likely that a relatively large share of
companies for which data are not available are small, because small businesses are less likely
to be found in publicly available financial databases.
The table also shows that there is a relatively even dispersion of employment size
categories within the industry. For example, 13 percent of companies employ less than 50

DRAFT
4-7
workers, 10 percent employ between 50 and 100, and 12 percent employ between 250 and
500 people. The employment size category with 100 to 249 employees per company had the
largest number of companies in the identified grouping with 37 companies (16 percent of the
total).
Table 4-6 shows a frequency distribution of companies in the industry by sales. As
with employment data, sales data were not available for 61 of the 230 identified companies.
Companies with more than $1 billion in annual sales made up approximately 10 percent of
the identified firms. Twenty-two percent of the companies had more than $100 million.
Thirty percent of companies had less than $25 million in sales. Once again, this is most
likely a substantial underestimate, because it does not include the companies for which data
are not available (these companies are most likely small).
Table 4-5. Employment Size Distribution of Companies
Employment Range Number of Companies Percent
0 to 49 30 13%
50 to 99 22 10%
100 to 249 37 16%
250 to 499 27 12%
500 to 999 13 6%
1,000 to 4,999 15 7%
>5,000 25 11%
NA 61 27%
Total Companies 230 100%
Sources: Hoover’s Online. 2001. Companies and Industry. Available at <http://www.hoovers.com/
companyindustry/0 ,1334,8,00.html>.
. Lycos Companies Online. 2001. Company Research. Available at <http://www.
companiesonline.com>.
Gale Group. 2000. INFOTRAC Database. <http://infotrac/galegroup.com>. Farmington Hills, MI:
Gale Group.
Lexis/Nexis. 2001. Academic Universe Database. <http://web.lexis-nexis.com/universe>. Bethesda,
MD: Lexis/Nexis.

DRAFT
4-8
The large number of small firms in the industry is in part the result of significant
structural change in recent years. The fabric coatings industry has seen the entry of many
small, highly specialized firms. Between 1987 and 1992, the industry realized a net gain of
almost 30 firms (USITC, 1993). Most of these new firms are believed to be very small
manufacturers of high performance textiles with special properties for specific end-use
applications. The trend towards specialization can be explained primarily by the fact that
these products often have very specific capital equipment requirements for their production
(USITC, 1993).
Table 4-6. Sales Size Distribution of Companies
Sales Range ($106) Number of Companies Percent of Total
0 to 4 19 8%
5 to 9 11 5%
10 to 24 39 17%
25 to 49 31 13%
50 to 99 20 9%
100 to 499 24 10%
500 to 999 4 2%
1,000 to 5,000 15 7%
>5,000 6 3%
NA 61 27%
Total 230 100%
Sources: Hoover’s Online. 2001. Companies and Industry. Available at <http://www.hoovers.com/
companyindustry/0 ,1334,8,00.html>.
. Lycos Companies Online. 2001. Company Research. Available at <http://www.
companiesonline.com>.
Gale Group. 2000. INFOTRAC Database. <http://infotrac/galegroup.com>. Farmington Hills, MI:
Gale Group.
Lexis/Nexis. 2001. Academic Universe Database. <http://web.lexis-nexis.com/universe>. Bethesda,
MD: Lexis/Nexis.

DRAFT
5-1
SECTION 5
MARKETS
This section examines market volumes and prices for the fabric coatings industry. It
starts by examining trends in product shipments for the industry. This discussion is followed
by a presentation of market price data. Next is a brief analysis of the industry’s future
outlook. Finally, foreign trade issues are examined, along with export and import data.
5.1 Value of Shipments
Table 5-1 shows the trends in employment and shipments for the industry from 1985
through 1998. It is clear from these data that while there has been an expansion in shipments
over this time, employment has not increased significantly. For SIC 2295, value of
shipments increased approximately 55 percent from 1985 to 1996 (U.S. Census Bureau,
2000a). Conversely, employment increased a paltry 1 percent over the same period. Thus,
increased production can be explained by an increased productivity per worker rather than by
the addition of more workers. The decline in the average number of production workers in
the industry is the result of an increased emphasis on capital investments and the greater
efficiency of machinery (USITC, 1993).
The value of shipments by product type has been fairly stable over the past decade.
Table 5-2 presents data from a Freedonia Group report from August of 1999. It shows that
the proportion of total shipments accounted for nonrubber-coated fabrics was 71 percent in
1989, 71 percent in 1993, and 72 percent in 1998. The report predicts that these numbers
will jump to 74 percent and 76 percent, respectively, in 2003 and 2008. Rubber-coated
fabrics made up 17 percent of total shipments in 1989, 19 percent in 1993, 17 percent in
1998, and are predicted to be 16 percent in 2003 and 15 percent in 2008. Finally, fabric-
backed wallcoverings accounted for 11 percent of total shipments in 1989. The proportion is
predicted to be 9 percent in 2003 and 8 percent in 2008 (Freedonia, 1999).

DRAFT
5-2
Table 5-1. General Trends: 1985–1998
Yeara
Value of
Shipments
($106) Employment
Value of
Shipments/Employee
($106)
New Capital
Expendituresb
($106)
SIC 2295
1985 $1,228.2 10,400 $0.1181 $33 .9
1986 $1,172.0 9,700 $0.1208 $37 .4
1987 $1,433.7 10,300 $0.1392 $63 .4
1988 $1,509.4 10,300 $0.1465 $38 .7
1989 $1,542.7 9,400 $0.1641 $59 .8
1990 $1,361.8 8,900 $0.1530 $52 .9
1991 $1,298.4 8,000 $0.1623 $54 .5
1992 $1,528.1 9,200 $0.1661 $47 .1
1993 $1,773.3 9,900 $0.1791 $55 .8
1994 $1,804.3 10,800 $0.1671 $75 .2
1995 $1,827.9 11,100 $0.1647 $74 .8
1996 $1,906.1 10,500 $0.1815 $89 .8
NAICS 31332 c
1997 $2,256.7 11,592 $0.1947 $74.39
1998 $2,304.2 11,441 $0.2014 $47.686
a Data from 1993–1996 were taken from U.S. census annual surveys of manufactures for those years. Data
from 1985–1992 were taken from 1992 U.S. census data. Data from 1997–1998 were taken from U.S. census
annual survey of manufactures for NAICS 31332 for 1997–1998.b The 1997–1998 survey of manufactures refers to capital expenditures as “total capital expenditures,” rather
than “new capital expenditures,” which was the term used for data from previous years.c Data for 1997–1998 are for NAICS code 31332, which includes “rubber coated fabrics.” These products
were not previously classified under the SIC code 2295 . In 1998, “rubber coated fabrics” accounted for 9.5
percent of the value of product shipments for coated fabrics included in the NAICS 31332 product class.
Source: U.S. Census Bureau. 2000a. Annual Survey of Manufactures—Industry Statistics.
<http://www.census.gov/prod/2000pubs/M98-as1.pdf>.

DRAFT
5-3
5.2 Market Prices
Price data for the fabric coatings industry are presented in Table 5-3. The table
shows that prices in dollars per square yard of coated fabric were $4.72 in 1998, according to
a Freedonia Group report from August of 1999. Prices for coated fabrics fell roughly 10
percent between 1989 and 1998. The report predicts a similar decline through 2008.
Because of the wide range and variability of coated fabric products, the price per yard also
Table 5-2. Coated Fabrics Shipments by Type: 1989–2008 ($106)
Product 1989 1993 1998 2003 2008
United States GDP ($109) 5,439 6,558 8,511 1,075 13,550
$ Fabric/million $ GDP 374 342 331 319 304
Nonrubber-Coated Fabrics 1,459 1,585 2,052 2,555 3,150
Rubber-Coated Fabrics 351 431 484 550 630
Fabric-Backed W allcoverings 226 226 285 310 340
Total Coated Fabric Shipments 2,036 2,242 2,821 3,415 4,120
Source: Freedonia Group. 1999. Coated Fabrics in the United States to 2003— Introduction, Executive
Sum mary, Market Environm ent, Coated Shipments, Demand and Markets. Available at
<http://www.profound.com/htbin/titles_do>.
Table 5-3. Coated Fabrics Pricing Trends: 1989–2008 ($106)
Year 1989 1993 1998 2003 2008
Coated Fabrics Demand
(million sq yards)
355 401 525 635 770
$/sq yd 5.22 5.17 4.72 4.54 4.39
Coated Fabrics Demand
($106)
1,854 2,072 2,480 2,880 3,380
Source: Freedonia Group. 1999. Coated Fabrics in the United States to 2003— Introduction, Executive
Sum mary, Market Environm ent, Coated Shipments, Demand and Markets. Available at
<http://www.profound.com/htbin/titles_do>.

DRAFT
5-4
varies widely and specialized, highly technical products are more costly. Disaggregated
price data were not available.
5.3 Future Outlook
Shipments of coated fabrics are forecast to increase 3.9 percent annually until 2003
(Freedonia Group, 1999). This represents a decline in growth from the mid-1990s, when
demand was high due to a rebound from the recession of the early 1990s. The Freedonia
Group (1999) forecasts that average prices for coated fabrics will continue to decrease
through 2008.
Parts of the industry are expected to expand. The increased use of airbags with the
addition of side-impact airbags, under-dash airbags, and expanded use of airbags in trucks
will create an increase in demand for coated nylon. Industry segments of nonautomotive
transport equipment (boat and truck covers), protective clothing, awnings, and canopies are
also expected to have increased demand. Table 5-4 shows the demand over time from 1989
through 2008 by market sector. It shows that for all sectors except industrial uses, the
growth in demand from 1998 through 2008 is expected to decline from the levels
Table 5-4. Coated Fabrics Demand (million sq yards)
Percent Annual Growth
Coated Fabrics Demand 1989 1993 1998 2003 2008 1989–1998 1998–2008
Coated Fabrics Demand 355 401 525 635 770 4.4 3.9
Motor Vehicles 79 96 137 182 236 6.3 5.6
Furniture 74 79 101 115 135 3.5 2.9
Industrial 46 49 53 61 68 1.6 2.5
Protective Clothing 28 34 47 56 65 5.9 3.3
Wall Coverings 37 38 45 47 51 2.2 1.3
Book Coverings 27 30 32 34 36 1.9 1.2
Awnings and Canopies 14 15 27 33 40 7.6 4
Nonautomotive
Transportation Equipment
12 15 25 36 53 8.5 7.6
Commercial Tents 11 13 18 21 25 5.6 3.3
Other Markets 27 32 40 50 61 4.5 4.3
Source: Freedonia Group. 1999. Coated Fabrics in the United States to 2003— Introduction, Executive
Sum mary, Market Environm ent, Coated Shipments, Demand and Markets. Available at
<http://www.profound.com/htbin/titles_do>.

DRAFT
5-5
experienced by the industry from 1989 through 1998.
5.4 International Trade
When compared to the textile industry in general, the fabric coatings industry has
fared extremely well in the face of increased foreign competition. Unlike the broader textile
goods industry, the coated fabrics industry has not seen a significant decline in employment
over the past decade (Heil and Peck, 1998). It is clear that trade activity overall has
increased because of the industry’s increasingly global nature (Smith, 1999). Import and
export sales totals rose 30 percent from 1989 to 1998. However, despite the growth of the
industry abroad and an increase in imports, exports have also increased. Actually, the trade
surplus for the United States doubled from $170 million in 1993 to $341 million in 1998.
This growth came after a 7 percent decline in net exports from 1988 to 1993. The increase in
net exports is expected to continue through 2008. Net exports are forecast to be $535 million
in 2003 and $740 million in 2008 (Freedonia, 1999). Table 5-5 shows data from the 1999
Freedonia Group report.
While US producers have been able to dominate the domestic market for high priced
items, imports of lower priced items have increased dramatically. U.S. imports of coated
fabrics rose by 33 percent from 1988 to 1992 (USITC, 1993). Imported products are usually
lower priced items, such as imitation leather and other consumer goods where small
Table 5-5. Coated Fabrics Foreign Trade: 1989–2008 ($106)
1989 1993 1998 2003 2008
Coated Fabric Shipments 2,036 2,242 2,821 3,415 4,120
Exports 480 400 677 985 1270
Imports 298 230 336 450 530
Net Exports 182 170 341 535 740
Sales 1,854 2,072 2,480 2,880 3,380
Imports as Percent of Sales 16.1 11.1 13.5 15.6 15.7
Exports as Percent of Shipments 23.6 17.8 24 28.8 30.8
Source: Freedonia Group. 1999. Coated Fabrics in the United States to 2003— Introduction, Executive
Sum mary, Market Environm ent, Coated Shipments, Demand and Markets. Available at
<http://www.profound.com/htbin/titles_do>.

DRAFT
5-6
variations in quality are not critical. Canada was the largest supplier of imports from 1988 to
1992, supplying 28 percent of imports by value. Others suppliers were Germany, Taiwan,
Italy, and Japan, which collectively supplied 39 percent of the value of imported products
(USITC, 1993).
Larger manufacturers supply the greatest proportion of US exports (USITC, 1993).
These products tended to be high quality, high priced, industrial-use products with specific
applications. U.S. producers have a reputation of producing high quality products with high
levels of consistency. The United States is increasingly less competitive in markets for
lower priced consumer goods. The largest export markets for U.S.-produced coated fabrics
were Canada, Japan, and Europe from 1988 to 1992. However, in developing countries, the
market for fabrics that prevent water pollution and contamination is expected to expand
considerably (USITC, 1993).
The increase in production of coated fabrics abroad is important when considered
within the context of an increasingly strict regulatory environment in the United States.
Environmental issues can be expected to have more of an impact on where goods are
produced than will the economics of production because compliance costs are becoming a
major portion of production costs (Smith, 1999). Unless foreign producers are also facing an
increase in regulatory costs, a well developed foreign industry is likely to become even more
competitive with the coated fabrics industry in the United States.
DRAFT
R-1
REFERENCES
Freedonia Group. 1999. Coated Fabrics in the United States to 2003—Introduction,
Executive Summary, Market Environment, Coated Shipments, Demand and Markets.
Available at <http://www.profound.com/htbin/titles_do>.
Heil, S., and T.W. Peck, eds. 1998. Encyclopedia of American Industries 2nd Edition.
Volume 1: Manufacturing Industries. Detroit, MI: Gale Research.
Hellwig, G.V. October 30, 2000. Memorandum to Fabric Coating, Printing, and Dyeing
File. Fabric Coating Floor.
Hoover’s Online. 2001. Companies and Industry. Available at
<http://www.hoovers.com/companyindustry/0,1334,8,00.html>.
Howe-Grant, M. 1993. Kirk-Othmer Encyclopedia of Chemical Technology. Fourth
Edition. Volume 6: Chlorocarbons and Chlorohydrocarbons—C2 to Combustion
Technology. New York: John Wiley & Sons.
Industry News. 1999. “Coated Fabrics Shipments by Type.” Journal of Coated Fabrics
29(1):6-10.
Gale Group. 2000. INFOTRAC Database. <http://infotrac/galegroup.com>. Farmington
Hills, MI: Gale Group.
Kroschwitz, J.I., ed. 1986. Encyclopedia of Polymer Science and Engineering. Volume 6:
Emulsion Polymerization to Fibers, Manufacture. New York: John Wiley & Sons.
Lexis/Nexis. 2001. Academic Universe Database. <http://web.lexis-nexis.com/universe>.
Bethesda, MD: Lexis/Nexis.
Lycos Companies Online. 2001. Company Research. Available at
<http://www.companiesonline.com>.
Smith, W.C. 1999. “Coated and Laminated Fabrics—Putting the Industry in Perspective.”
Journal of Coated Fabrics 28:292-299.

DRAFT
R-2
U.S. Census Bureau. 1992a. 1992 Census of Manufactures: Industry Series—Miscellaneous
Textile Goods. <http://www.census.gov/prod/1/manmin/92mmi/mci22ef.pdf>.
U.S. Census Bureau. 1992b. 1992 Census of Manufactures: Industry Series—Rubber
Products. <http://www.census.gov/prod/1/manmin/92mmi/mci30af.pdf>.
U.S. Census Bureau. 1992c. Concentration Ratios in Manufacturing, MC92-S-2. Available
at http://www.census.gov/mcd/mancen/download/mc92cr.sum>.
U.S. Census Bureau. 1999. 1997 Economic Census: Manufacturing—Industry Series.
<http://www.census.gov/prod/ec97/97m3133c.pdf>.
U.S. Census Bureau. 2000a. Annual Survey of Manufactures—Industry Statistics.
<http://www.census.gov/prod/2000pubs/M98-as1.pdf>.
U.S. Census Bureau. 2000b. Survey of Plant Capacity (1998): Current Industrial Reports.
<http://www.census.gov/1prod12000pubs/mqcl-98.pdf>.
U.S. Environmental Protection Agency (EPA). 1988. AP-42, Fifth Edition, Volume I,
Chapter 4: Evaporation Loss Sources. Available at
<http://www.epa.gov/ttn/chief/ap42/ch04/final/c4s02-2g.pdf>.
U.S. International Trade Commission (USITC). 1993. Industry and Trade Summary:
Coated Fabrics. Washington, DC: U.S. International Trade Commission.
U.S. Small Business Administration (SBA), Office of Size Standards. 2001. Small Business
Size Standards. <http://www.sba.gov/size/Table-of-Small-Business-Size-Standards-
from-final-rule.htm>.
Wypych, J. 1988. Polymer Modified Textile Materials. New York: John Wiley & Sons.
DRAFT
A-1
APPENDIX A
FABRIC COATINGS COMPANIES
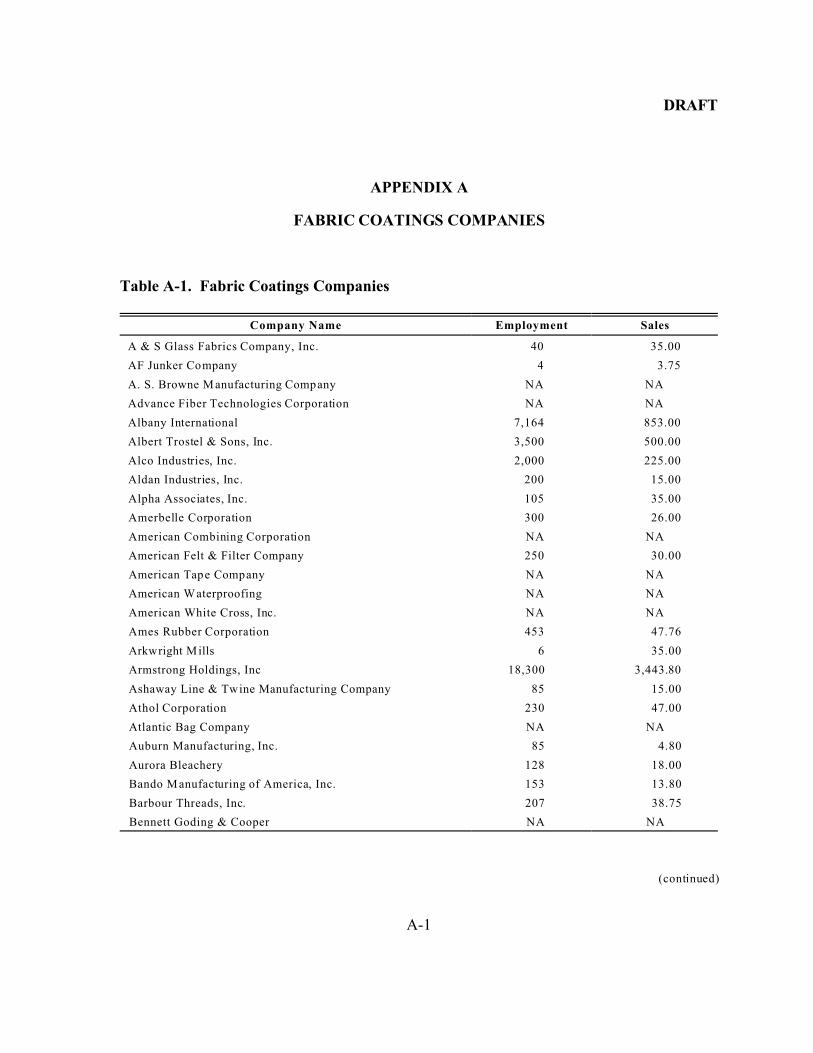
Table A-1. Fabric Coatings Companies
Company Name Employment Sales
A & S Glass Fabrics Company, Inc. 40 35.00
AF Junker Company 4 3.75
A. S. Browne M anufacturing Company NA NA
Advance Fiber Technologies Corporation NA NA
Albany International 7,164 853.00
Albert Trostel & Sons, Inc. 3,500 500.00
Alco Industries, Inc. 2,000 225.00
Aldan Industries, Inc. 200 15.00
Alpha Associates, Inc. 105 35.00
Amerbelle Corporation 300 26.00
American Combining Corporation NA NA
American Felt & Filter Company 250 30.00
American Tape Company NA NA
American Waterproofing NA NA
American White Cross, Inc. NA NA
Ames Rubber Corporation 453 47.76
Arkwright Mills 6 35.00
Armstrong Holdings, Inc 18,300 3,443.80
Ashaway Line & Twine Manufacturing Company 85 15.00
Athol Corporation 230 47.00
Atlantic Bag Company NA NA
Auburn Manufacturing, Inc. 85 4.80
Aurora Bleachery 128 18.00
Bando Manufacturing of America, Inc. 153 13.80
Barbour Threads, Inc. 207 38.75
Bennett Goding & Cooper NA NA
(continued)

DRAFT
A-2
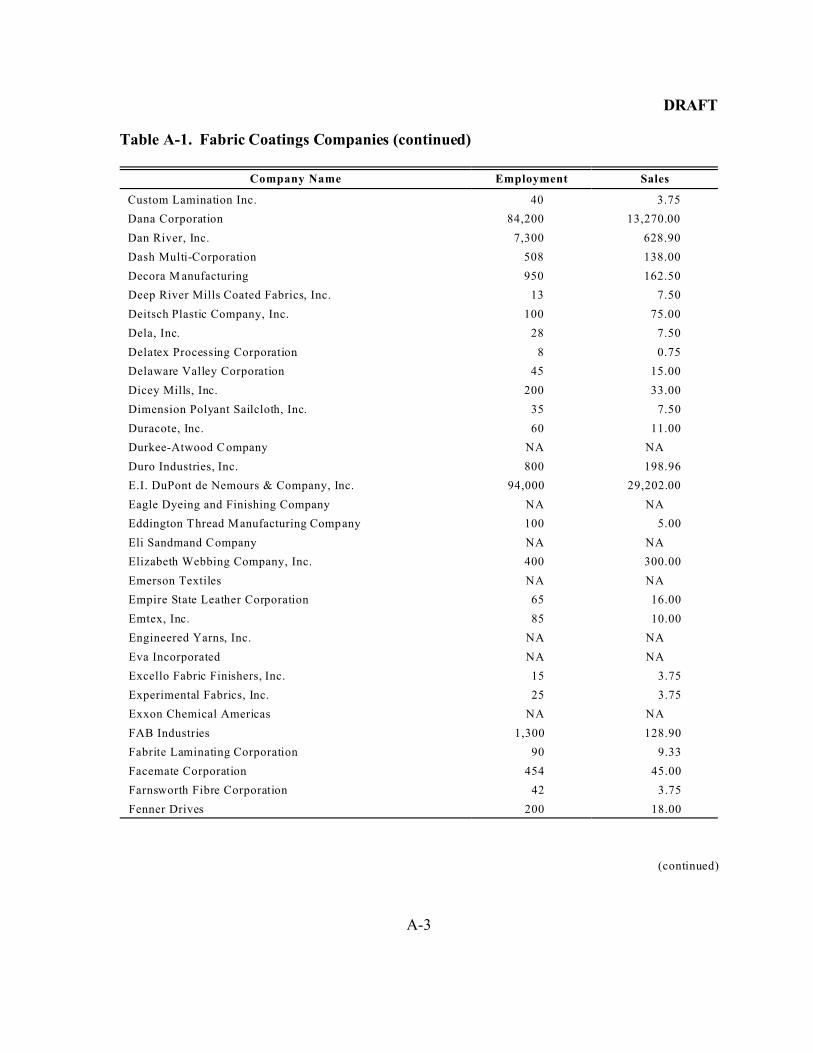
Table A-1. Fabric Coatings Companies (continued)
Company Name Employment Sales
Berkley, Inc. 768 190.00
Bettcher Industries, Inc. 155 10.00
BF Goodrich 27,044 4,364.00
Bibb Company NA NA
Bloomsburg Mills, Inc. 470 50.00
BondCote NA NA
Bradford Dyeing Association 250 17.00
Bradford Industries, Inc. 177 53.00
Buffalo Weaving and Belting 50 15.00
Bridgestone Corporation 101,489 20,403.00
Burke Narrow Fabric Corporation NA NA
Burlington Industries, Inc. 17,900 1,620.20
Burrell Leder Beltech, Inc. 90 35.00
Cadie Products Corporation 70 10.00
Carolina M ills, Inc. 2,500 200.50
CEBI Norton NA NA
Champion Dyeing & Finishing Company, Inc. 71 15.00
Chase Corporation 347 68.50
Chemfab Corporation 738 126.48
Chemprene, Inc. 200 12.00
Chemtech Archer Rubber NA NA
Chris Craft Industries, Inc. 1,254 491.50
Chrysler Plastic Products Corporation NA NA
Cleveland Plastics NA NA
Coats American 1,100 254.00
Collins and Aikman Corporation 15,600 1,898.60
Columbus Coated Fabrics 450 53.30
Consolidated Thread Mills, Inc. 15 1.75
Cooley, Inc. 250 63.23
Crimptex of Rhode Island, Inc. NA NA
Crown Textile Company NA NA
Culp, Inc. 3,800 488.10
Custom Coated Products NA NA
(continued)
DRAFT
A-3
Table A-1. Fabric Coatings Companies (continued)
Company Name Employment Sales
Custom Lamination Inc. 40 3.75
Dana Corporation 84,200 13,270.00
Dan River, Inc. 7,300 628.90
Dash Multi-Corporation 508 138.00
Decora M anufacturing 950 162.50
Deep River Mills Coated Fabrics, Inc. 13 7.50
Deitsch Plastic Company, Inc. 100 75.00
Dela, Inc. 28 7.50
Delatex Processing Corporation 8 0.75
Delaware Valley Corporation 45 15.00
Dicey Mills, Inc. 200 33.00
Dimension Polyant Sailcloth, Inc. 35 7.50
Duracote, Inc. 60 11.00
Durkee-Atwood Company NA NA
Duro Industries, Inc. 800 198.96
E.I. DuPont de Nemours & Company, Inc. 94,000 29,202.00
Eagle Dyeing and Finishing Company NA NA
Eddington Thread Manufacturing Company 100 5.00
Eli Sandmand Company NA NA
Elizabeth Webbing Company, Inc. 400 300.00
Emerson Textiles NA NA
Empire State Leather Corporation 65 16.00
Emtex, Inc. 85 10.00
Engineered Yarns, Inc. NA NA
Eva Incorporated NA NA
Excello Fabric Finishers, Inc. 15 3.75
Experimental Fabrics, Inc. 25 3.75
Exxon Chemical Americas NA NA
FAB Industries 1,300 128.90
Fabrite Laminating Corporation 90 9.33
Facemate Corporation 454 45.00
Farnsworth Fibre Corporation 42 3.75
Fenner Drives 200 18.00
(continued)
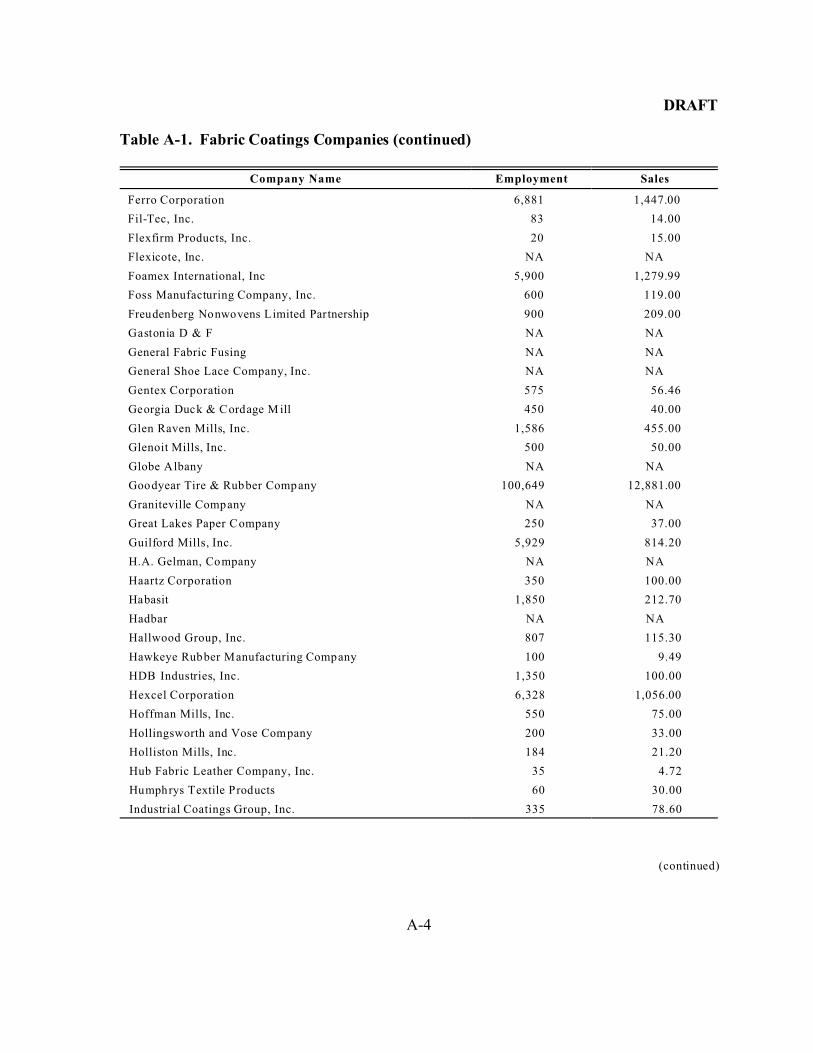
DRAFT
A-4
Table A-1. Fabric Coatings Companies (continued)
Company Name Employment Sales
Ferro Corporation 6,881 1,447.00
Fil-Tec, Inc. 83 14.00
Flexfirm Products, Inc. 20 15.00
Flexicote, Inc. NA NA
Foamex International, Inc 5,900 1,279.99
Foss Manufacturing Company, Inc. 600 119.00
Freudenberg Nonwovens Limited Partnership 900 209.00
Gastonia D & F NA NA
General Fabric Fusing NA NA
General Shoe Lace Company, Inc. NA NA
Gentex Corporation 575 56.46
Georgia Duck & Cordage M ill 450 40.00
Glen Raven Mills, Inc. 1,586 455.00
Glenoit Mills, Inc. 500 50.00
Globe Albany NA NA
Goodyear Tire & Rubber Company 100,649 12,881.00
Graniteville Company NA NA
Great Lakes Paper Company 250 37.00
Guilford Mills, Inc. 5,929 814.20
H.A. Gelman, Company NA NA
Haartz Corporation 350 100.00
Habasit 1,850 212.70
Hadbar NA NA
Hallwood Group, Inc. 807 115.30
Hawkeye Rubber Manufacturing Company 100 9.49
HDB Industries, Inc. 1,350 100.00
Hexcel Corporation 6,328 1,056.00
Hoffman Mills, Inc. 550 75.00
Hollingsworth and Vose Company 200 33.00
Holliston Mills, Inc. 184 21.20
Hub Fabric Leather Company, Inc. 35 4.72
Humphrys Textile Products 60 30.00
Industrial Coatings Group, Inc. 335 78.60
(continued)

DRAFT
A-5
Table A-1. Fabric Coatings Companies (continued)
Company Name Employment Sales
Intermark Fabric Corporation 150 1.75
Interface, Inc. 7,250 1,228.20
Intex Corporation 178 35.00
JB Group, Inc. 220 29.00
J.P. Stevens and Company, Inc. NA NA
James Thompson & Company, Inc. 180 14.00
Jersey Pacific Netting Company NA NA
Jewell Sheen Coating, Inc. NA NA
Joanna W estern Mills Company NA NA
Johns Manville Corporation 9,740 2,161.80
Johnston Industries, Inc. 2,600 264.00
K M Fabrics, Inc. 81 15.00
Kenyon Laminating Group NA NA
Kiesling-Hess Finishing Company 7 1.75
Kleen-Tex Industries, Inc. 516 50.04
Lacey Mills, Inc. 200 24.00
Lacrosse Footwear, Inc. 1,100 124.30
Lantor, Inc. 175 35.00
Lawrence Schiff Silk Mills 25 3.75
Lewcott Corporation 66 10.70
Lloyd Manufacturing Company, Inc. 27 7.50
Ludlow Composites Corporation 140 26.80
Ludlow Textiles Company, Inc. 110 10.00
Marathon Rubber Products NA NA
Mark IV Industries, Inc. 15,600 1,993.70
Max Katz Bag Company, Inc. NA NA
McCord Gasket Company NA NA
Meridian Industries, Inc. 1,200 270.00
Middlesex Research Manufacturing Company, Inc. 25 7.50
Milliken & Company 20,000 4,000.00
Mitchellace, Inc. 221 17.00
M L Rose & Sons, Inc. 7 1.75
Molded Dimensions, Inc. 66 15.00
(continued)

DRAFT
A-6
Table A-1. Fabric Coatings Companies (continued)
Company Name Employment Sales
Monterey, Inc. 400 38.00
Mount Hope Finishing Company 150 35.00
Murray Rubber Company NA NA
National Coating Corporation 29 15.00
National Dye Works, Inc. 35 3.75
Neese Coated Fabrics NA NA
New England Belting 9 0.60
New England Ropes, Inc. 110 17.00
New York W ire Textile 400 35.00
Newtown Finishing Corporation 4 0.75
NFA Corporation 1,000 65.00
North American Rayon Corporation NA NA
Nylco Division 200 34.20
OOC, Inc. NA NA
Orchard M anufacturing Company NA NA
Osterneck Company 75 15.00
Otto Fabric, Inc. NA NA
Ouimet Corporation 65 15.00
Pacific Combining Corporation 45 10.00
Packaging Systems Corporation NA NA
Penn Racquet Sports 390 75.00
Perma Glas-Mesh, Inc. 100 5.00
Pillowtex Corporation 14,000 1,552.10
Plymouth Rubber Company 475 77.70
Polyclad Laminates 1,440 235.00
Putman-Herzl Finishing Company, Inc. NA NA
Rapid Die & Molding Company, Inc. 8 3.75
RCA Rubber Company 250 35.00
Reef Industries, Inc. 220 20.98
Reeves Brothers, Inc. 531 35.00
RM Industrial Products, Inc. NA NA
Rockland Industries, Inc. 300 50.00
Ross & Roberts, Inc. 110 15.90
(continued)

DRAFT
A-7
Table A-1. Fabric Coatings Companies (continued)
Company Name Employment Sales
Ruddick 20,000 2,682.80
Sara Lee Corporation 154,000 17,511.00
Scandura, Inc. 400 31.00
Scapa Dryers, Inc. NA NA
Scapa Forming Fabrics 135 35.00
Schneider Banks, Inc. 9 1.75
Schneller, Inc. 200 28.30
Seaman Corporation 290 22.00
Semperit Industrial Products, Inc. 10 1.75
Sommers, Inc. 60 35.00
Stacy Fabric Corporation NA NA
Stanbee Company, Inc. 50 7.50
Standard Coated Products NA NA
Star Tex Industries NA NA
Starensier, Inc. 60 20.00
Stedfast Rubber Company NA NA
Stonecutter Mills Corporation 343 53.20
Superior Fabrics 150 11.00
Takata, Inc. 6,000 375.00
TBM C, Inc. NA NA
Tex-Tech Industries, Inc. 438 63.39
Textile Proofers LP 6 1.75
The Alpine Group 6,600 1,370.40
Tomkins PLC 70,039 8,722.00
TSG, Inc. 80 7.00
Twiss Associates, Inc. 20 3.75
Uniroyal Technology Corp 440 68.30
Uniroyal Goodrich Tire Manufacturing 225 75.00
Uretek, Inc. 70 12.88
Utex Industries 450 47.00
Victor Products NA NA
Viking Technical Rubber Company NA NA
Voyager Emblems 108 16.00
(continued)

DRAFT
A-8
Table A-1. Fabric Coatings Companies (continued)
Company Name Employment Sales
W.R. Grace and Company 6,300 1,569.00
Wade Manufacturing Company 386 75.00
Warwick Dyeing Corporation NA NA
Wellington Sears Company NA NA
West Coast Fibre Corporation NA NA
Worthen Industries, Inc. 200 34.20