Economic Evaluation and Fiscal Impact Analysis of Gateway ...
40
Report Economic Evaluation and Fiscal Impact Analysis of Gateway Oyster Point Prepared for: BioMed Realty Prepared by: Economic & Planning Systems, Inc. April 9, 2013 EPS #131017
Transcript of Economic Evaluation and Fiscal Impact Analysis of Gateway ...

Report
Economic Evaluation and Fiscal Impact Analysis of Gateway Oyster Point Prepared for: BioMed Realty Prepared by: Economic & Planning Systems, Inc. April 9, 2013 EPS #131017
Table of Contents
1. INTRODUCTION AND SUMMARY OF FINDINGS .................................................................. 1
Summary of Key Findings .......................................................................................... 1
2. ECONOMIC CONTEXT OF PROJECT ............................................................................. 10
The Biotechnology Industry ...................................................................................... 10
3. PROJECT DESCRIPTION ......................................................................................... 12
Project Employment ................................................................................................ 12
Project Assessed Value ............................................................................................ 13
4. ECONOMIC IMPACTS ............................................................................................ 14
Biotech Development .............................................................................................. 14
Employment ........................................................................................................... 14
Annual Fiscal Revenue ............................................................................................. 14
Development Impact Fees ........................................................................................ 15
5. FISCAL METHODOLOGY AND ASSUMPTIONS .................................................................. 16
General Fund Revenues ........................................................................................... 16
General Fund Expenditures ...................................................................................... 18
APPENDIX A: Fiscal Model
List of Tables
Table 1 Project Description Summary .............................................................................. 6
Table 2 Annual Fiscal Impact Summary at Project Buildout (2013$) .................................... 7
Table 3 Annual Fiscal Impact Summary by Phase (2013$) ................................................. 8
Table 4 Expanded Annual Fiscal Impact Summary (2013$) ................................................ 9

Economic & Planning Systems, Inc. 1 P:\131000s\131017OysterPt\Report\131017_GatewayOysterPt_040913_v2.doc
1. INTRODUCTION AND SUMMARY OF FINDINGS
At the request of BioMed Realty, Economic & Planning Systems, Inc. prepared this economic evaluation and fiscal impact analysis of the proposed Gateway Oyster Point development project (Project) in the City of South San Francisco. The total development program includes 1.23 million square feet of new developed Floor Area Ratio (FAR) space, consisting primarily of office/life science space and including approximately 48,000 gross square feet of amenity space. Approximately 3,200 above- and below-grade structured parking spaces are proposed to serve on-site employees and visitors. The on-site open space will be privately-maintained.
The Project is proposed to be developed in four phases, with the first phase consisting of the iconic “statement” buildings at the corner of Oyster Point Boulevard and Gateway Boulevard, which will be visible from Highway 101 and to all vehicles exiting Highway 101 at Oyster Point. The analysis evaluates the fiscal effects by individual phase and at full buildout.
Chapter 2 describes the economic context of the Project, and Chapter 3 provides description of the Project. Associated economic impacts are described in Chapter 4, and a detailed explanation of the methodology and assumptions can be found in Chapter 5. Appendix A provides the complete fiscal model in detail.
Summa ry o f Key F ind ings
This report evaluates the proposed development program for the Project, presented in Table 1. The analysis is focused on the net new impact of the Project (future development less existing development) and the net fiscal impact to the City’s General Fund (gross revenues less gross expenditures). The key findings of the fiscal impact analysis are described below and shown in Table 2, with results by phase shown in Tables 3 and 4. All results are in constant 2013 dollars. Below is a summary of the preliminary key economic and fiscal findings regarding this Project.
1. The Gateway Oyster Point Project will enhance the strength and vitality of South San Francisco’s biotechnology and life sciences industry cluster, further establishing the City’s reputation as a competitive and desirable place for biotech businesses to locate.
The San Francisco Bay Area is one of the largest national and global concentrations of biotechnology, and South San Francisco possesses the largest amount of existing life sciences square footage among all Bay Area sub-markets with nearly 6 million square feet of supply. South San Francisco is within proximity to the Bay Area’s major research centers and venture capital providers.
As a result, South San Francisco is well-positioned to capture both established and emerging biotechnology companies seeking a location with access to skilled labor, research institutions and venture capital. The City also competes well based on its high-quality housing and neighborhoods that are relatively less expensive compared with San Francisco/other Silicon

Fiscal Impact Analysis of Gateway Oyster Point Report 04/09/13
Economic & Planning Systems, Inc. 2 P:\131000s\131017OysterPt\Report\131017_GatewayOysterPt_040913_v2.doc
Valley cities as well as accessibility to a number of highly desirable communities throughout the Peninsula.
2. The Gateway Oyster Point Project represents a significant upgrade in the quality of design and construction and provision of campus amenities from what was originally proposed in the 2010 Master Plan.
The Project Sponsor has re-planned and re-configured the Gateway Oyster Point campus to take advantage of the Project site’s prominent location at the corner of Oyster Point Boulevard and Gateway Boulevard. The Project is envisioned to be an architecturally significant, Class A structure that will attract premium tenants at premium lease rates. A significant upgrade to the quality of design and finish is anticipated.
3. The Gateway Oyster Point Project will contribute to the implementation of the City’s General Plan objectives for the Oyster Point area.
There is an existing cluster of biotechnology firms located in the Oyster Point area and more than adequate infrastructure (e.g., roadway capacity, access to transit including the ferry, utility capacity, public safety service capacity) to accommodate the increased activity. The Gateway Oyster Point project can benefit from the existing infrastructure and industry activity and simultaneously catalyze future development toward realization of the City’s objectives for the Oyster Point area. While it is reasonable to expect that a project of this scale and quality would induce fiscal benefits (i.e., increased property values) in the surrounding area, this analysis does not estimate these induced effects and instead focuses on those fiscal effects that are directly attributable to the Project (construction and operations).
4. At buildout, The Gateway Oyster Point Project proposes approximately 1.2 million square feet of R&D Biotech space and 33,000 square feet of amenity space for a total of 1.23 million square feet of developed FAR, which, if fully leased, will support approximately 4,000 jobs.
The R&D space is expected to support approximately 3,900 highly-paid employees at an employment density of three jobs per 1,000 square feet, which is consistent with the assumptions in the Project’s Transportation Demand Management Study. The average salary of a biotech employee in San Mateo County is $191,000, as of 2011.1 The Amenity space is expected to support approximately 100 jobs, based on a retail employment density of 500 square feet per employee. There are approximately 790 employees currently employed at the Project Site. Therefore, the net new employment generated by the Project is 3,200 jobs. At the completion of Phase I, the new development will provide capacity for 1,450 new employees.
1 Based on the 2011 Quarterly Census of Employment and Wages of NAICS 541711 Research and Development in Biotechnology for San Mateo County.
Fiscal Impact Analysis of Gateway Oyster Point Report 04/09/13
Economic & Planning Systems, Inc. 3 P:\131000s\131017OysterPt\Report\131017_GatewayOysterPt_040913_v2.doc
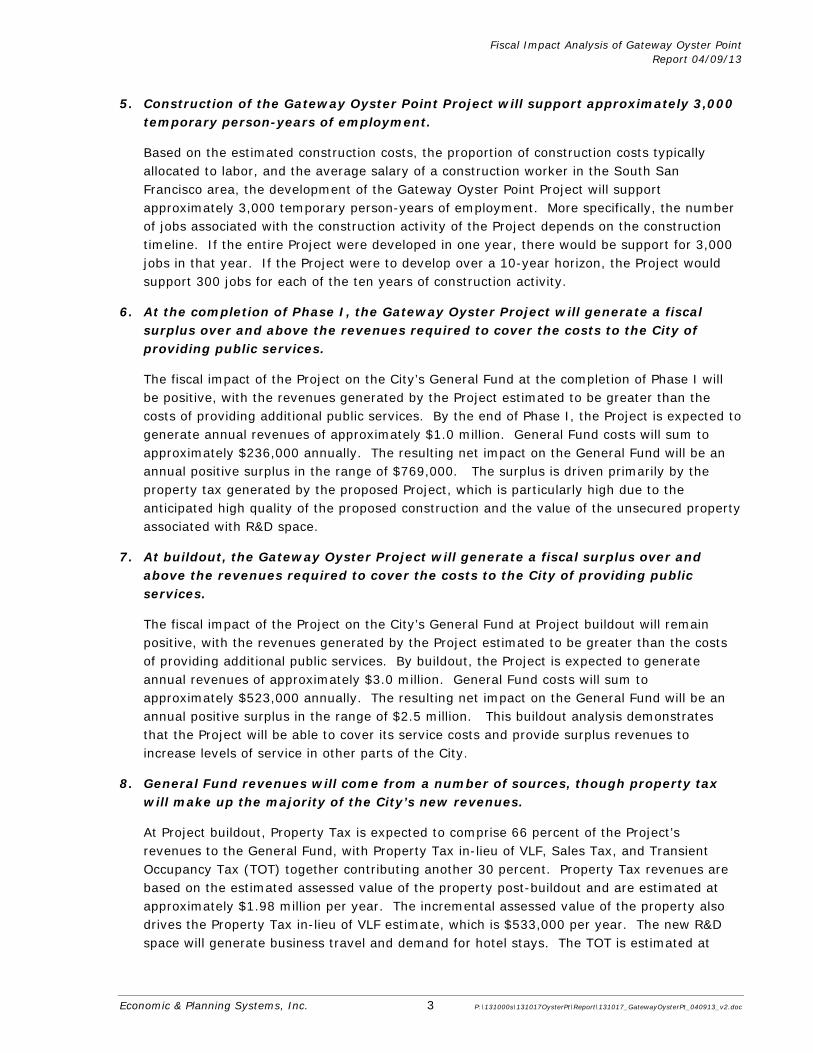
5. Construction of the Gateway Oyster Point Project will support approximately 3,000 temporary person-years of employment.
Based on the estimated construction costs, the proportion of construction costs typically allocated to labor, and the average salary of a construction worker in the South San Francisco area, the development of the Gateway Oyster Point Project will support approximately 3,000 temporary person-years of employment. More specifically, the number of jobs associated with the construction activity of the Project depends on the construction timeline. If the entire Project were developed in one year, there would be support for 3,000 jobs in that year. If the Project were to develop over a 10-year horizon, the Project would support 300 jobs for each of the ten years of construction activity.
6. At the completion of Phase I, the Gateway Oyster Project will generate a fiscal surplus over and above the revenues required to cover the costs to the City of providing public services.
The fiscal impact of the Project on the City’s General Fund at the completion of Phase I will be positive, with the revenues generated by the Project estimated to be greater than the costs of providing additional public services. By the end of Phase I, the Project is expected to generate annual revenues of approximately $1.0 million. General Fund costs will sum to approximately $236,000 annually. The resulting net impact on the General Fund will be an annual positive surplus in the range of $769,000. The surplus is driven primarily by the property tax generated by the proposed Project, which is particularly high due to the anticipated high quality of the proposed construction and the value of the unsecured property associated with R&D space.
7. At buildout, the Gateway Oyster Project will generate a fiscal surplus over and above the revenues required to cover the costs to the City of providing public services.
The fiscal impact of the Project on the City’s General Fund at Project buildout will remain positive, with the revenues generated by the Project estimated to be greater than the costs of providing additional public services. By buildout, the Project is expected to generate annual revenues of approximately $3.0 million. General Fund costs will sum to approximately $523,000 annually. The resulting net impact on the General Fund will be an annual positive surplus in the range of $2.5 million. This buildout analysis demonstrates that the Project will be able to cover its service costs and provide surplus revenues to increase levels of service in other parts of the City.
8. General Fund revenues will come from a number of sources, though property tax will make up the majority of the City’s new revenues.
At Project buildout, Property Tax is expected to comprise 66 percent of the Project’s revenues to the General Fund, with Property Tax in-lieu of VLF, Sales Tax, and Transient Occupancy Tax (TOT) together contributing another 30 percent. Property Tax revenues are based on the estimated assessed value of the property post-buildout and are estimated at approximately $1.98 million per year. The incremental assessed value of the property also drives the Property Tax in-lieu of VLF estimate, which is $533,000 per year. The new R&D space will generate business travel and demand for hotel stays. The TOT is estimated at
Fiscal Impact Analysis of Gateway Oyster Point Report 04/09/13
Economic & Planning Systems, Inc. 4 P:\131000s\131017OysterPt\Report\131017_GatewayOysterPt_040913_v2.doc
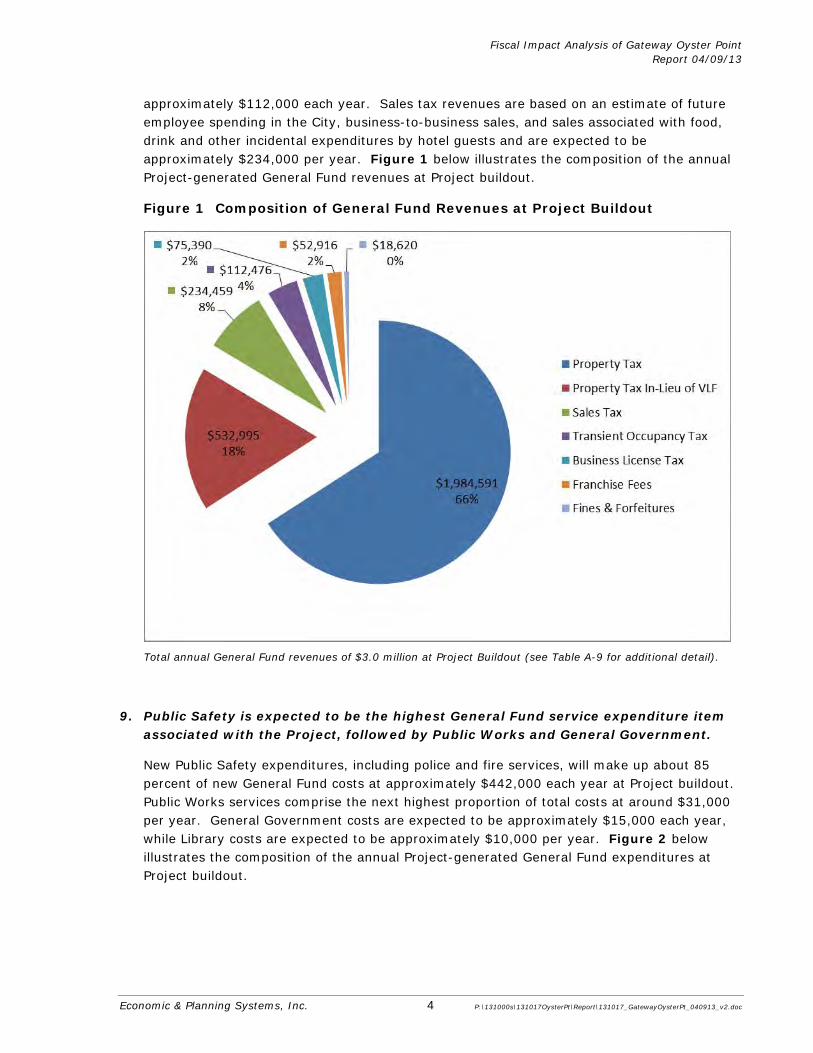
approximately $112,000 each year. Sales tax revenues are based on an estimate of future employee spending in the City, business-to-business sales, and sales associated with food, drink and other incidental expenditures by hotel guests and are expected to be approximately $234,000 per year. Figure 1 below illustrates the composition of the annual Project-generated General Fund revenues at Project buildout.
Figure 1 Composition of General Fund Revenues at Project Buildout
Total annual General Fund revenues of $3.0 million at Project Buildout (see Table A-9 for additional detail).
9. Public Safety is expected to be the highest General Fund service expenditure item associated with the Project, followed by Public Works and General Government.
New Public Safety expenditures, including police and fire services, will make up about 85 percent of new General Fund costs at approximately $442,000 each year at Project buildout. Public Works services comprise the next highest proportion of total costs at around $31,000 per year. General Government costs are expected to be approximately $15,000 each year, while Library costs are expected to be approximately $10,000 per year. Figure 2 below illustrates the composition of the annual Project-generated General Fund expenditures at Project buildout.

Fiscal Impact Analysis of Gateway Oyster Point Report 04/09/13
Economic & Planning Systems, Inc. 5 P:\131000s\131017OysterPt\Report\131017_GatewayOysterPt_040913_v2.doc
Figure 2 Composition of General Fund Expenditures at Project Buildout
$240,21846%
$202,05838%
$30,6566%
$25,2165%
$14,7463%
$10,0702%
Fire
Police
Public Works
Parks & Recreation
General Government
Library
Total annual General Fund expenditures of $523,000 at Project Buildout (see Table A-14 for additional detail).
10. Development of the Gateway Oyster Point Project will generate approximately $13.0 million in one-time development impact fee revenue.
The development of Gateway Oyster Point will generate one-time development impact fees in addition to annual fiscal revenues. About $13.0 million in one-time impact fees to the City of South San Francisco is projected to help fund new or expanded public infrastructure improvements. At this time it is not clear if the Project will pay Childcare Impact Fees. Also at this time it is assumed that the Project will abate 50 percent of the Park in-lieu Fees and pay the remaining 50 percent. Total fee revenue could increase if the Childcare Impact Fee is required.

Table 1Project Description Summary, Phase I and BuildoutEconomic Evaluation and Fiscal Impact Analysis of Gateway Oyster Point; EPS #131017
Land Use Phase I Buildout
Office/R&D (Gross Square Feet) [1] 451,485 1,303,114Amenity (Gross Square Feet) [2] 47,938 47,938
Total, All Buildings (Gross Square Feet) [3] 499,423 1,351,052
Parking (Spaces) 692 3,272
[1] Approximately 1.2 million square feet of Office/R&D space contribute to the net FAR.[2] Approximately 33,000 square feet of Amenity space contribute to the net FAR.[3] Total net FAR is expected to be approximately 1.23 million square feet at buildout.
Sources: Gateway Oyster Point Draft EIR; FLAD Architects; BioMed Realty; Economic & Planning Systems, Inc.
Economic & Planning Systems, Inc. 4/9/2013 P:\131000s\131017OysterPt\Model\131017FiscalModel_040913.xlsx
6
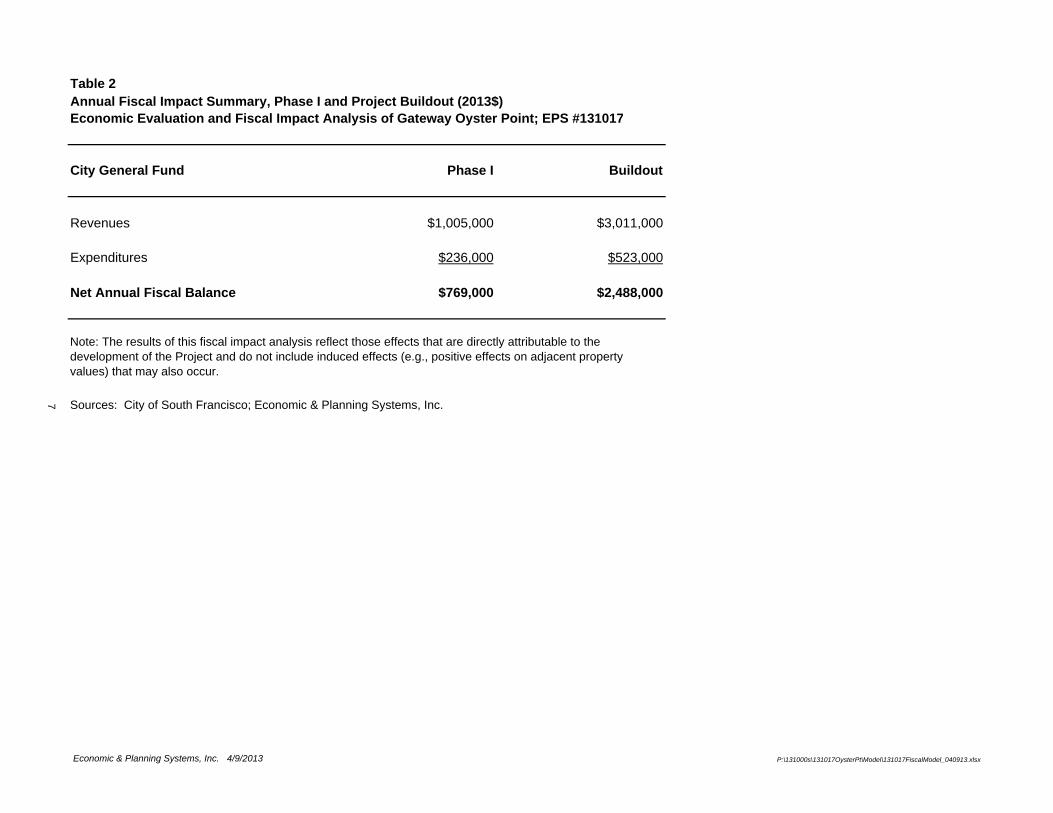
Table 2Annual Fiscal Impact Summary, Phase I and Project Buildout (2013$)Economic Evaluation and Fiscal Impact Analysis of Gateway Oyster Point; EPS #131017
City General Fund Phase I Buildout
Revenues $1,005,000 $3,011,000
Expenditures $236,000 $523,000
Net Annual Fiscal Balance $769,000 $2,488,000
Sources: City of South Francisco; Economic & Planning Systems, Inc.
Note: The results of this fiscal impact analysis reflect those effects that are directly attributable to the development of the Project and do not include induced effects (e.g., positive effects on adjacent property values) that may also occur.
Economic & Planning Systems, Inc. 4/9/2013 P:\131000s\131017OysterPt\Model\131017FiscalModel_040913.xlsx
7
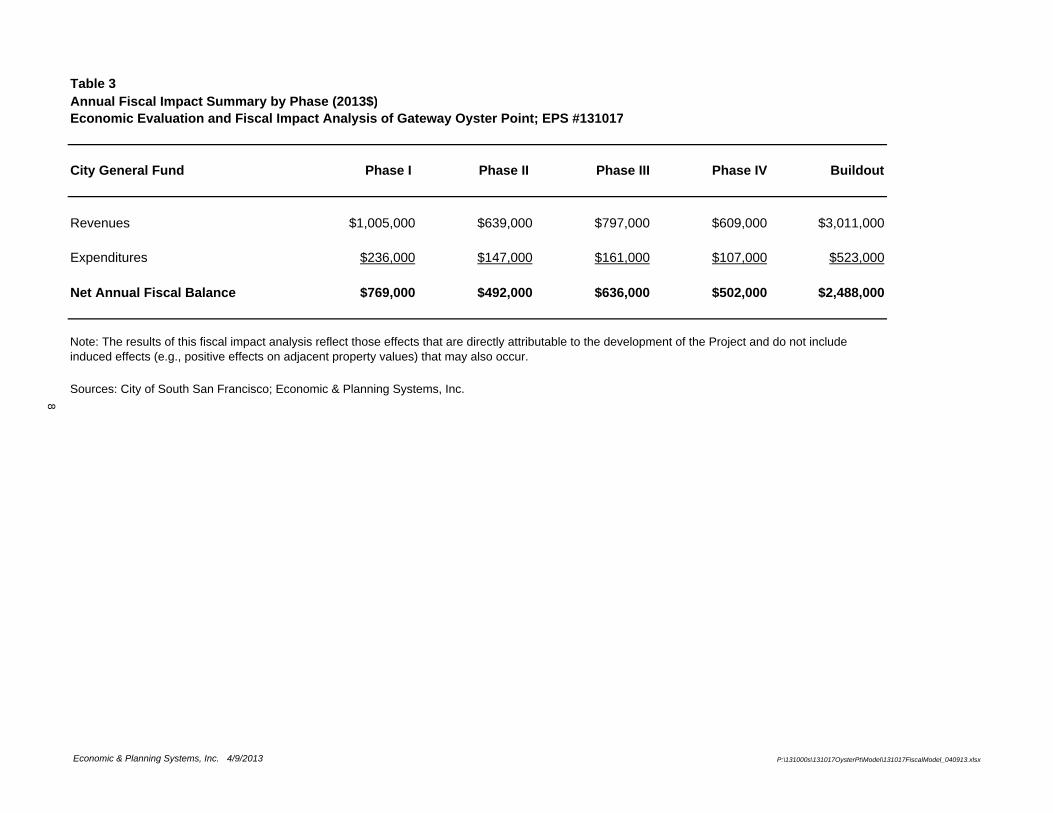
Table 3Annual Fiscal Impact Summary by Phase (2013$)Economic Evaluation and Fiscal Impact Analysis of Gateway Oyster Point; EPS #131017
City General Fund Phase I Phase II Phase III Phase IV Buildout
Revenues $1,005,000 $639,000 $797,000 $609,000 $3,011,000
Expenditures $236,000 $147,000 $161,000 $107,000 $523,000
Net Annual Fiscal Balance $769,000 $492,000 $636,000 $502,000 $2,488,000
Sources: City of South San Francisco; Economic & Planning Systems, Inc.
Note: The results of this fiscal impact analysis reflect those effects that are directly attributable to the development of the Project and do not include induced effects (e.g., positive effects on adjacent property values) that may also occur.
Economic & Planning Systems, Inc. 4/9/2013 P:\131000s\131017OysterPt\Model\131017FiscalModel_040913.xlsx
8

Table 4Expanded Annual Fiscal Impact Summary (2013$)Economic Evaluation and Fiscal Impact Analysis of Gateway Oyster Point; EPS #131017
Category Phase I Phase II Phase III Phase IV Buildout
City General Fund Revenues
Property Tax $652,195 $416,398 $515,452 $400,547 $1,984,591Transient Occupancy Tax $50,689 $31,706 $34,531 $23,055 $112,476Sales Tax $62,443 $38,557 $65,157 $49,071 $234,459Business License Tax $33,975 $21,252 $23,145 $15,453 $75,390Property Tax In-Lieu of VLF $173,588 $110,828 $137,192 $106,609 $532,995Franchise Fees [2] $23,847 $14,917 $16,246 $10,847 $52,916Fines & Forfeitures $8,391 $5,249 $5,716 $3,817 $18,620Total General Fund Revenues $1,005,128 $638,906 $797,439 $609,399 $3,011,446
City General Fund Expenditures
General Government [1] $6,646 $4,157 $4,527 $3,023 $14,746Public Safety
Police $91,060 $56,959 $62,033 $41,418 $202,058Fire $108,258 $67,716 $73,749 $49,240 $240,218
Public Works $13,816 $8,642 $9,412 $6,284 $30,656Library $4,538 $2,839 $3,092 $2,064 $10,070Parks & Recreation $11,364 $7,108 $7,741 $5,169 $25,216Total General Fund Expenditures $235,681 $147,421 $160,554 $107,197 $522,964
City General Fund - Net Annual Fiscal Balance $769,447 $491,485 $636,885 $502,202 $2,488,482
Sources: City of South San Francisco; Economic & Planning Systems, Inc.
Note: The results of this fiscal impact analysis reflect those effects that are directly attributable to the development of the Project and do not include induced effects (e.g., positive effects on adjacent property values) that may also occur.
Economic & Planning Systems, Inc. 4/9/2013 P:\131000s\131017OysterPt\Model\131017FiscalModel_040913.xlsx
9

Economic & Planning Systems, Inc. 10 P:\131000s\131017OysterPt\Report\131017_GatewayOysterPt_040913_v2.doc
2. ECONOMIC CONTEXT OF PROJECT
To evaluate the economic effects of The Gateway Oyster Point Project and the ways in which the Project may act to catalyze additional growth and development in the Oyster Point area, the Project needs to be evaluated within the economic context of South San Francisco and the region.
The B io tec hno logy Indus t ry
“Biotechnology,” often abbreviated “biotech,” includes any businesses engaged in the research and development of technologies that interact with biological organisms or processes to produce commercial products and applications. This includes both high-level scientific research and manufacturing of resultant commercial products, the development of human medical applications as well as non-medical applications such as genetically-modified foods. Biotechnology is a cutting-edge and research-dependent field that thrives in locations including major research universities and venture capital.
Global and National Context
According to Ernst & Young’s report Beyond Borders: Global Biotechnology Report 2010,2 established concentrations of the biotechnology industry are located in the United States, Europe, Canada, and Australia, while China and India feature large, rapidly emerging biotechnology sectors. Small and large biotechnology companies alike compete on a global scale since product development occurs at globally-competitive institutions and companies, and manufacturing and distribution of products can be located worldwide. Global competition in all fields of biotechnology will intensify as India and China grow their educated workforces, emphasize development of cutting-edge research through government investments, and take advantage of their continued economic growth and low costs.
Within the United States, the largest biotechnology clusters are found in the San Francisco Bay Area and Boston regions. These regions formed the earliest concentrations of biotechnology companies in the 1970s and are distinguished by their large concentrations of universities, high-level research and development companies, and concentrations of venture capital. The United States’ biotechnology industry experienced minimal job losses between 2008 and 2010 despite overall national and global economic health and appears to once again be healthy and poised for additional growth.
2 Ernst & Young. Beyond Borders: Global Biotechnology Report 2010. 2010.
Fiscal Impact Analysis of Gateway Oyster Point Report 04/09/13
Economic & Planning Systems, Inc. 11 P:\131000s\131017OysterPt\Report\131017_GatewayOysterPt_040913_v2.doc
Bay Area Context
As mentioned above, the San Francisco Bay Area is one of the largest national and global concentrations of biotechnology. The region benefits from its inclusion of numerous research universities, research hospitals such as UC San Francisco, and the highest concentration of venture capital in the nation.
Looking ahead, the greatest challenge to the Bay Area’s biotechnology competitiveness comes from talent attraction and retention. The local biotechnology industry is well-established and dominant, but reports by Joint Venture Silicon Valley and other Bay Area economic development organizations, coupled with global growth trends of the cluster, indicate that it will become increasingly difficult to fill positions left open by retiring baby boomers.
In addition, recent industry growth in Orange, San Bernardino and Riverside Counties has far outpaced that of the Bay Area, reflecting a number of factors such as the continuing implementation of cost-cutting measures within the industry as discussed in the 2012 BayBio Biomedical Industry Report. However, the Bay Area still outpaces all other California locations in venture capital dollars, the main driver for research and development in biotechnology and medical devices and will likely remain the leading biotechnology hub in the state.
South San Francisco
South San Francisco possesses the largest amount of existing life sciences square footage among all Bay Area sub-markets with nearly 6 million square feet and a healthy vacancy rate (6.82%)3. Furthermore, South San Francisco is within close proximity to the Bay Area’s major research centers and venture capital providers. As a result, South San Francisco is well positioned to capture both established and emerging biotechnology companies seeking a location with access to skilled labor, research institutions and venture capital. The City also competes well based on its inclusion of high-quality housing and neighborhoods that are relatively less expensive compared San Francisco/other Silicon Valley cities as well as accessibility to a number of highly desirable communities throughout the Peninsula.
Given this context, the Gateway Oyster Point Project will enhance the strength and vitality of South San Francisco’s biotechnology and life sciences industry cluster, further establishing the City’s reputation as a competitive and desirable place for biotech businesses to locate.
3 Cornish & Carey. Bay Area Life Science: Market Report. Q1 2012.

Economic & Planning Systems, Inc. 12 P:\131000s\131017OysterPt\Report\131017_GatewayOysterPt_040913_v2.doc
3. PROJECT DESCRIPTION
This analysis evaluates the annual fiscal effects of the proposed development of the Gateway Oyster Point Project (the Project) in the City of South San Francisco. The 22.6-acre project site is located at the corner of Gateway Boulevard and Oyster Point Boulevard. There are currently six single-story office/light industrial buildings on the site that, over the course of four phases, will be taken down to allow the development of 1.23 million square feet of primarily R&D space and associated parking. This analysis evaluates the impact of the net new development—new construction less existing development so as not to double-count fiscal revenues or costs. The surrounding area includes a mix of R&D, light industrial and office employment uses and hotels. There are nearby vacant sites that are planned for development.
Under the development program (the Project), a new R&D/life science campus is planned that would consist of 1.23 million square feet of development assuming a floor area ratio (FAR) of 1.25. See Table A-1 for a detailed Project description and land use assumptions. The new space will be developed in six buildings: five R&D buildings and one “amenities” building. The “amenities” building is not fully programmed yet, but could offer child care, a fitness center, incidental retail, and food service.
The Project is expected to provide 3,272 parking spaces through a mix of structured and underground lots. Additionally, there are open space and landscaped areas that are planned as part of the Project which will be accessible to the public.
Though not officially part of the Project, 180 and 200 Oyster Point Boulevard are two recently-developed R&D buildings (now owned by BioMed Realty, the Gateway Oyster Point Developer) that are expected to function as part of the Gateway Oyster Point campus.
Construction is expected to occur in four phases, as shown on Table A-1, with the first phase consisting of the iconic “statement” buildings at the corner of Oyster Point Boulevard and Gateway Boulevard, which will be visible from Highway 101 and to all vehicles exiting Highway 101 at Oyster Point. The underground parking and the Amenity Building will also be part of the first phase.
Pro jec t Emp loyment
The planned R&D space is expected to support three employees per 1,000 square feet and the amenities center is expected to support one employee per 500 square feet. At Project buildout, the development is expected to accommodate 4,003 employees, as shown on Table A-2. There are currently approximately 787 employees employed at the site. The new development will result in net new employment of 3,216. Because this Project will not directly generate any new residents, demand for public services will be driven by Project employees. For purposes of estimating public service costs, the number of new employees is converted to a resident-equivalent or “daytime population,” which is typically calculated by adding the total residential population and one-half of employment – in this case, just one-half of employment. The Project will support a daytime service population of 1,298.

Fiscal Impact Analysis of Gateway Oyster Point Report 04/09/13
Economic & Planning Systems, Inc. 13 P:\131000s\131017OysterPt\Report\131017_GatewayOysterPt_040913_v2.doc
Pro jec t Assessed Va lue
To estimate the assessed value of the Project, this analysis relies on development costs provided by the Developer. Development costs include hard and soft construction costs and tenant improvements and are approximately $900 per square foot for the R&D space and approximately $800 per square foot for the amenity space. The unsecured assessed value is estimated at 25 percent of the secured assessed value, consistent with information provided by existing tenants at the Project site. The actual assessed value of the Project will be determined by the County Assessor’s Office at the time of assessment.
The total assessed value of the Project less the existing assessed value of the Project represents the net new assessed value, which is the basis of the property tax-related calculations in this analysis. The existing assessed value of the Project site is shown on Table A-3 and the new assessed value of the Project is shown on Table A-4.

Economic & Planning Systems, Inc. 14 P:\131000s\131017OysterPt\Report\131017_GatewayOysterPt_040913_v2.doc
4. ECONOMIC IMPACTS
Development of the Gateway Oyster Point Project will result in a number of benefits - some quantifiable, others not - to the City of South San Francisco. These benefits include economic development activity in a targeted area of the City, employment growth, increase in fiscal revenues and collection of development impact fees. These benefits are described below and shown in Table A-5.
Bio tec h Deve lopm ent
The Project is intended to create a high-density, iconic, high-quality bioscience space that adds approximately 1.2 million net new square feet of R&D space to the Oyster Point area of South San Francisco. The new space will support the ongoing evolution of the life sciences industry and continued development of the biotech cluster in South San Francisco. The new development is planned as a pedestrian friendly campus within proximity to the Caltrain station, BART and the recently-opened ferry terminal.
Employment
EPS estimates that development of the Gateway Oyster Point Project will support approximately 4,000 jobs, or 3,200 net new jobs after accounting for existing employment on the Project site. The majority of these jobs are expected to be in the biotech industry, with average annual salaries of approximately $191,000.
EPS also estimates that development of the Gateway Oyster Point Project will create temporary construction jobs during the period of development. Assuming a Project development cost of approximately $700 million, construction of the new buildings is estimated to create approximately 3,000 one-time construction jobs over the construction period.
New development projects can often generate economic multiplier effects as the businesses and the employees they support spend money in the local economy. Consequently, the new commercial space planned for the Project is likely to create more jobs in South San Francisco than those that are directly attributable to on-site employment. Economic multipliers are based on the concept that new demand for goods and services creates a “ripple effect” throughout the economy, as supplying firms hire workers and purchase other inputs necessary for production.
Annua l F i s ca l Revenue
As described in the following chapters, the City’s annual fiscal revenues will increase by approximately $2.5million, due primarily to property-tax related revenues and sales tax revenues which will increase due to net new employment. The high quality of construction will increase the assessed value of the Project site and will generate new property tax related revenues to the City. New employees generated by the Project are estimated to spend about 10 percent of their total expenditures in South San Francisco – though this estimate could be higher to the extent that the City’s competitive retail supply can be effectively capitalized.
Fiscal Impact Analysis of Gateway Oyster Point Report 04/09/13
Economic & Planning Systems, Inc. 15 P:\131000s\131017OysterPt\Report\131017_GatewayOysterPt_040913_v2.doc
Deve lopment Impac t Fees
The development of Gateway Oyster Point will generate one-time development impact fees in addition to annual fiscal revenues. As shown in Table A-6, about $13.0 million in one-time impact fees to the City of South San Francisco is projected to help fund new or expanded public infrastructure improvements. At this time it is not clear if the Project will pay Childcare Impact Fees. Also at this time, it is assumed that the Project will abate 50 percent of the Park in-lieu Fees and pay the remaining 50 percent. Development impact fees may change as the Project moves forward and are subject to review by an engineer.
Economic & Planning Systems, Inc. 16 P:\131000s\131017OysterPt\Report\131017_GatewayOysterPt_040913_v2.doc
5. FISCAL METHODOLOGY AND ASSUMPTIONS
This chapter describes the methodology and key assumptions used in estimating the fiscal impacts of the Gateway Oyster Point Project. The analysis is based on a number of sources including the City of South San Francisco's 2012-2013 Adopted Operating Budget; City, County, and State data sources; public real estate data, data provided by BioMed Realty, and EPS’s recent experience in South San Francisco and comparable jurisdictions.
The analysis describes annual operating costs and revenue impacts on the City’s General Fund. All revenue and expenditure forecasts are in constant 2013 dollars. For the purpose of evaluating the potential fiscal impact of the Project, this analysis considers impacts by phase and at buildout.
The analysis uses standard estimating procedures to estimate new General Fund revenues and an average cost approach to estimate the incremental General Fund costs to the City of providing services to the Project. The average cost approach provides a planning-level estimate of the costs of supplying public services to the Project. Key assumptions and calculations are shown in Appendix Tables A-7 through A-16.
Genera l Fund Revenues
This section describes the methodology and assumptions used for each General Fund revenue item. Citywide demographic assumptions that are used to estimate Project impacts are shown on Tables A-7 and A-8. Table A-9 provides a summary of the City's current General Fund revenues as estimated in the 2012-2013 Adopted Operating Budget as well as impact estimating factors. A general description of the method used for this analysis is provided for each revenue item. Some items are not forecasted because they are not expected to be affected by the Project (e.g., intergovernmental revenues).
Property Tax
Though the actual assessed value of the Project will be determined by market conditions at the time of sale or assessment, this analysis relies on development costs to estimate the future secured assessed value of the Project. The new office/R&D space is assumed to generate assessed value of approximately $900 per square foot (including tenant improvements), and the amenity building is assumed to generate assessed value of approximately $800 per square foot. The associated unsecured value can be significant for R&D buildings that often include lab equipment. This analysis assumes the unsecured value is approximately 25 percent of the secured value, consistent with ratios of the existing tenants at the project site.
The assessed value of the parking structures are based on weighted-average construction costs of approximately $38,000 per space, as provided by the developer. The underground spaces are estimated to cost approximately $50,000 per space and the structured parking spaces are estimated to cost approximately $35,000 per space. Full calculations are shown on Table A-4.

Fiscal Impact Analysis of Gateway Oyster Point Report 04/09/13
Economic & Planning Systems, Inc. 17 P:\131000s\131017OysterPt\Report\131017_GatewayOysterPt_040913_v2.doc
The annual property tax is 1 percent of assessed value, and the City receives approximately 16.9 percent of property taxes collected in the Project site’s Tax Rate Area.4 Approximately 17 percent is shifted to the State’s Educational Revenue Augmentation Fund (ERAF). Taxes are calculated based on the net increase in assessed value from the existing assessed value of the proposed Project site, including the existing structures. Property tax is estimated as a net increase from the Project site’s existing assessed value (secured and unsecured) of approximately $196 million. The annual property tax forecast at Project buildout is illustrated on Table A-10. While it is reasonable to expect that a project of this scale and quality would induce fiscal benefits (i.e., increased property values and increased property taxes) in the Project vicinity, this analysis does not estimate these induced effects and instead focuses on the property tax that is directly attributable to the Project.
Property Tax in-lieu of VLF Revenue
Property Tax in-lieu of VLF revenue is based on the growth of assessed value in the City. Based on the increase in Citywide assessed value that is expected to result from the Project over South San Francisco’s 2011-2012 base assessed value, Property Tax in-lieu of VLF revenue is expected to be approximately $534,000. These calculations and results are presented in Table A-11.
Transfer Tax
The City receives real property transfer tax for any property that is sold at a rate of $0.55 for every $1,000 of value. Because the entire campus will be owned by the Developer and then leased to one or more tenants, General Fund revenue from real property transfer tax will only materialize if and when the Developer sells the property. Because this is likely to be an irregular and infrequent occurrence, this analysis does not calculate transfer tax revenue.
Transient Occupancy Tax (TOT)
Though the Project does not include an on-site hotel, the new business activity is expected to generate demand for new hotel stays at a rate of 3.75 room nights per employee, based on previous EPS research.5 As shown on Table A-12, an average transient occupancy tax amount is estimated per room night based on 2012/13 TOT revenue projections and the number of room nights available in the City assuming an 85 percent occupancy rate. The TOT rate is currently 10 percent, all of which goes to the General Fund. There is an additional Conference Center Tax (CCT) which is charged at the rate of $2.50 per occupied room and goes to the South San Francisco Conference Center.
Sales Tax
The Gateway Oyster Point Project is expected to generate sales tax in several ways: through employee spending on site and in the City, through spending in the City by hotel guests, and through business-to-business sales. To estimate the level of new retail sales generated by new
4 Based on pre-ERAF City allocation for the relevant tax rate area.
5 An average based on previous EPS studies in Chula Vista and San Ramon.

Fiscal Impact Analysis of Gateway Oyster Point Report 04/09/13
Economic & Planning Systems, Inc. 18 P:\131000s\131017OysterPt\Report\131017_GatewayOysterPt_040913_v2.doc
employees, retail expenditures as a percentage of an average annual per bio-tech employees are calculated, as shown in Table A-13. About 10 percent of total taxable expenditures are estimated to be captured by retailers located in South San Francisco, most of which is likely to occur on site through the purchase of prepared food. Off-site spending by employees is assumed to be modest given the location of the Project relative to other retail opportunities in the City. Of these sales, the City will collect 1 percent in sales tax from expenditures in the City.
As described in the TOT discussion, new business activity is expected to generate demand for new hotel stays. These stays are likely to generate additional sales tax through the sale of prepared food and drink and other incidentals at the hotels and nearby establishments. Based on rates provided by the U.S. General Services Administration, EPS has assumed the amount spent on meals and incidentals is $61 per day6 and 40 percent of these sales will be captured within the City. Of these sales, the City will collect 1 percent in sales tax from expenditures in the City.
Sales tax generated by business-to-business sales is assumed to be $22 per employee based on previous EPS analyses and is calculated on Table A-13.
Business License Tax
The City of South San Francisco collects annual business license taxes. Business license taxes are estimated on a per employee basis as shown on Table A-9.
Franchise Fees
Franchise fees are paid by providers of cable, utilities, and waste management services in the City. The fee ranges from 0.5% to 10% of gross receipts depending on the type of service provided. Franchise fees are estimated on a per daytime service population basis as shown on Table A-9.
Fines, Forfeitures, and Penalties
The 2012-2013 Adopted Operating Budget indicates that the City will receive approximately $1.17 million, or roughly $14.34 per daytime service population, in revenue from fines, forfeitures, and penalties. It is expected that the City will continue to collect fines and fees at this per daytime service population rate (see Table A-9).
Genera l Fund Expend i tu res
This section describes the methodology and assumptions used for the General Fund expenditure items. Table A-14 provide a summary of the City's current General Fund expenditures as estimated in the 2012-2013 Adopted Operating Budget as well as impact estimating factors. A general description of the method used for this analysis is provided for each item. A number of expenditure items are calculated on a per-daytime population basis.
6 FY 2012 Per Diem Rates for San Mateo / Foster City / Belmont, California

Fiscal Impact Analysis of Gateway Oyster Point Report 04/09/13
Economic & Planning Systems, Inc. 19 P:\131000s\131017OysterPt\Report\131017_GatewayOysterPt_040913_v2.doc
General Government
According to the City’s Adopted Operating Budget, the City spends $6.16 million per year to provide General Government services, which specifically include the City Council, City Clerk, City Treasurer, City Attorney, City Manager, Finance, Non-Departmental, and Human Resources divisions. This analysis assumes that 15 percent of General Government costs are variable and likely to increase with the addition of new service population. Therefore costs resulting from the Gateway Oyster Point Project are estimated at approximately $11 per daytime service population (see Table A-14).
Public Safety
Through discussions with City staff, the police and fire departments have sufficient capacity to serve the new development.7 The existing development is adequately served and the net new development will not require the construction of additional facilities to serve the area. EPS’s calculations of public safety expenditures show the costs to maintain current service levels and thus represent a conservative (i.e., high) estimate of expenditures stemming from the project. They do not intend to suggest that any particular changes to staffing or organization structure will be required to serve the project adequately.
Police
Police expenditures in the City of South San Francisco include Police Patrol, Records & Communications, and Investigations. To capture the full cost of the police protection that will serve the Project, without consideration for the existing service capacity, EPS assumes that the current service level of 0.89 patrol officers per 1,000 daytime service population would be maintained and applied to the Project, resulting in a need for the equivalent of 1.2 new officers. An estimated annual average cost of $174,000 per officer (including employee costs and supplies and services) is applied to the projected number of new patrol officers that would be required by the Project’s new daytime population at buildout. Forecasted police enforcement expenditures are illustrated in Table A-15.
Fire
Fire expenditures in the City of South San Francisco include Administrative, Fire Prevention, and Emergency Medical Services/Operations divisions. To capture the full cost of the police protection that will serve the Project, without consideration for the existing service capacity, EPS assumes that the current service level of 0.88 fire fighters per 1,000 daytime service population would be maintained and applied to the Project, resulting in a need for the equivalent of 1.1 new fire fighters. An estimated annual average cost of $211,000 per fire fighter (including employee costs and supplies and services) is applied to the projected number of new fire fighters that would be required by the Project’s new daytime population at buildout. Forecasted fire expenditures are illustrated in Table A-16.
7 Meeting with Mike Lappen, February 2013.
Fiscal Impact Analysis of Gateway Oyster Point Report 04/09/13
Economic & Planning Systems, Inc. 20 P:\131000s\131017OysterPt\Report\131017_GatewayOysterPt_040913_v2.doc
Economic & Community Development
Beyond the Project planning stages, it is assumed that the Project will not generate demand for Economic & Community Development Services. It is not likely that the City would need to hire additional staff or otherwise increase Department resources to manage this Project’s planning and approval.
Public Works
This department provides engineering, streets and storm drainage maintenance, sewer maintenance, fleet maintenance and operates the water quality control plant. The Public Works department will incur a marginal increase of costs associated with normal wear and tear elsewhere in the City from the Project’s net new employees. Based on a review of the Department budget, the department’s costs are assumed to be 60 percent variable, resulting in expenditures of $23.60 per daytime service population. Estimated total annual costs are shown in Table A-13.
Library
According to the City’s Adopted Operating Budget, the City spends $4.2 million per year to provide Library services to the community. Though this Project is unlikely to trigger demand for additional library services, this analysis conservatively assumes that 15 percent of Library costs are variable and likely to increase with the addition of new service population. Therefore costs resulting from the Gateway Oyster Point Project are estimated at approximately $7.75 per daytime service population (see Table A-14).
Parks and Recreation
The Parks and Recreation department provides parks, facilities, and common green area maintenance services as well as recreation-related services for the City. The City of South San Francisco offers recreational opportunities that employees at the Site might be interested in joining, as part of a company-sponsored team or as an individual. In addition, the Site is located close to trails and parks that could be utilized by Project employees. To account for this use, EPS assumes 15 percent of the Parks and Recreation budget is variable, resulting in expenditures of nearly $20 per daytime service population (see Table A-14). The Project’s site plan includes open space and landscaped areas, which will be privately maintained.
APPENDIX A:
Fiscal Model
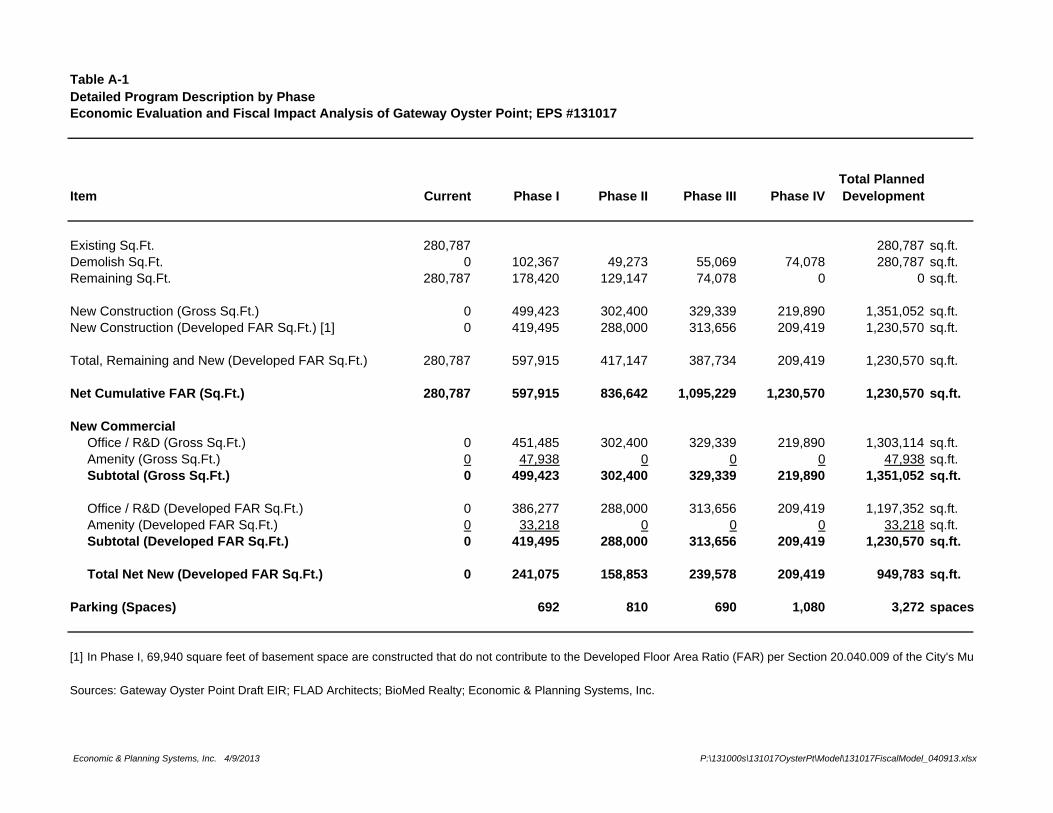
Table A-1Detailed Program Description by PhaseEconomic Evaluation and Fiscal Impact Analysis of Gateway Oyster Point; EPS #131017
Total PlannedItem Current Phase I Phase II Phase III Phase IV Development
Existing Sq.Ft. 280,787 280,787 sq.ft.Demolish Sq.Ft. 0 102,367 49,273 55,069 74,078 280,787 sq.ft.Remaining Sq.Ft. 280,787 178,420 129,147 74,078 0 0 sq.ft.
New Construction (Gross Sq.Ft.) 0 499,423 302,400 329,339 219,890 1,351,052 sq.ft.New Construction (Developed FAR Sq.Ft.) [1] 0 419,495 288,000 313,656 209,419 1,230,570 sq.ft.
Total, Remaining and New (Developed FAR Sq.Ft.) 280,787 597,915 417,147 387,734 209,419 1,230,570 sq.ft.
Net Cumulative FAR (Sq.Ft.) 280,787 597,915 836,642 1,095,229 1,230,570 1,230,570 sq.ft.
New CommercialOffice / R&D (Gross Sq.Ft.) 0 451,485 302,400 329,339 219,890 1,303,114 sq.ft.Amenity (Gross Sq.Ft.) 0 47,938 0 0 0 47,938 sq.ft.Subtotal (Gross Sq.Ft.) 0 499,423 302,400 329,339 219,890 1,351,052 sq.ft.
Office / R&D (Developed FAR Sq.Ft.) 0 386,277 288,000 313,656 209,419 1,197,352 sq.ft.Amenity (Developed FAR Sq.Ft.) 0 33,218 0 0 0 33,218 sq.ft.Subtotal (Developed FAR Sq.Ft.) 0 419,495 288,000 313,656 209,419 1,230,570 sq.ft.
Total Net New (Developed FAR Sq.Ft.) 0 241,075 158,853 239,578 209,419 949,783 sq.ft.
Parking (Spaces) 692 810 690 1,080 3,272 spaces
[1] In Phase I, 69,940 square feet of basement space are constructed that do not contribute to the Developed Floor Area Ratio (FAR) per Section 20.040.009 of the City's Mu
Sources: Gateway Oyster Point Draft EIR; FLAD Architects; BioMed Realty; Economic & Planning Systems, Inc.
Economic & Planning Systems, Inc. 4/9/2013 P:\131000s\131017OysterPt\Model\131017FiscalModel_040913.xlsx

Table A-2Employee Generation Assumptions by PhaseEconomic Evaluation and Fiscal Impact Analysis of Gateway Oyster Point; EPS #131017
Item Current Phase I Phase II Phase III Phase IV
Existing EmployeesRemaining Sq.Ft. of Existing Space 280,787 178,420 129,147 74,078 0 280,787 sq.ft.Remaining Sq.Ft. of Leased Space 145,000 145,000 125,000 70,000 0 145,000 sq.ft.Number of Employees [1] 787 787 562 162 0 787 employees
New EmployeesNew Office / R&D (Sq.Ft.) 0 451,485 302,400 329,339 219,890 1,303,114 sq.ft.Number of Employees [2] 3 per 1,000 sq.ft. 0 1,354 907 988 660 3,909 employees
New Amenity (Sq.Ft.) 0 47,938 0 0 0 47,938 sq.ft.Number of Employees [3] 2 per 1,000 sq.ft. 0 96 0 0 0 96 employees
Total Employees 787 2,237 1,469 1,150 660 4,005 employees
Total Net New Employees 0 1,450 907 988 660 3,218 employeesDaytime Service Population [4] 40% 0 585 366 399 266 1,299 employees
[1] Employees by tenant provided by BioMed Realty; phasing based on demolition schedule.[2] Consistent with the employment densities assumed in the Gateway Business Park Transportation Demand Management Study.[3] Amenity space is treated as retail space with an average employment density of 500 square feet per employee, which is typical of retail uses.[4]
Sources: Gateway Oyster Point Draft EIR; FLAD Architects; BioMed Realty; Economic & Planning Systems, Inc.
Assumption Total
"Daytime Service Population" equals 100 percent of City residents plus 40% of jobs in the City. This measure of service population is used for cost or revenue impacts where employment affects the demand for service but by less than the residential demand. See Table A-7.
Economic & Planning Systems, Inc. 4/9/2013 P:\131000s\131017OysterPt\Model\131017FiscalModel_040913.xlsx
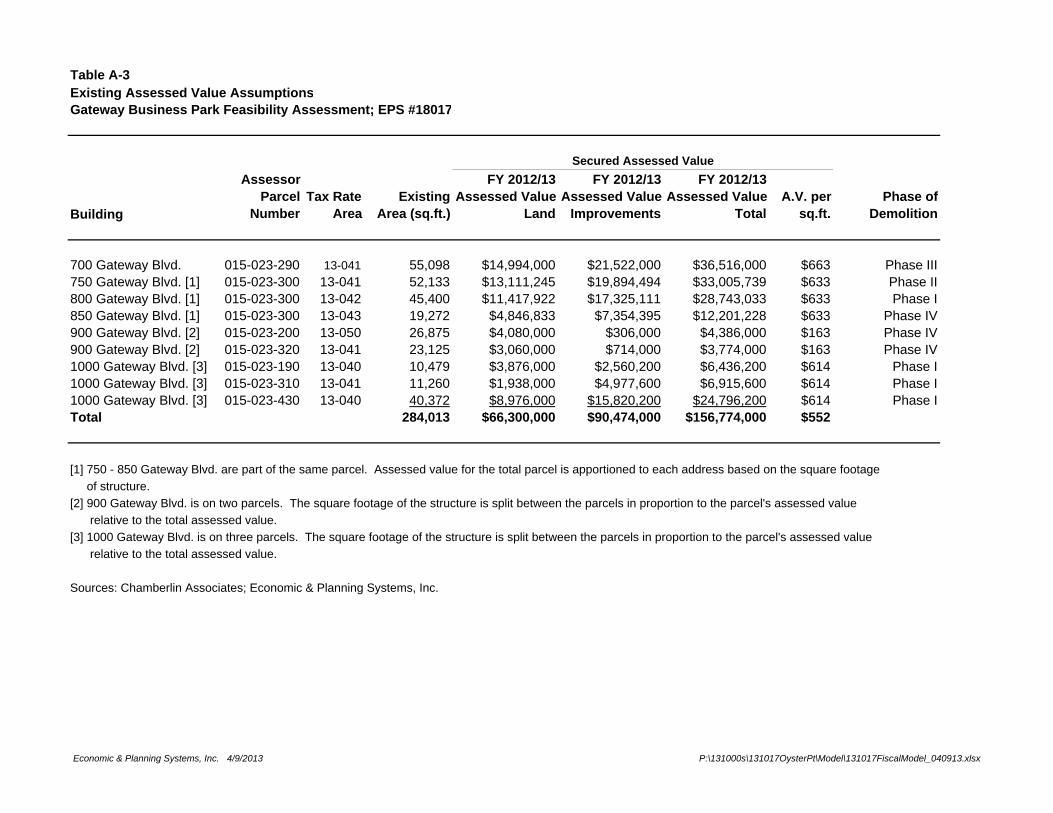
Table A-3Existing Assessed Value AssumptionsGateway Business Park Feasibility Assessment; EPS #18017
Building
Assessor Parcel
NumberTax Rate
AreaExisting
Area (sq.ft.)
FY 2012/13 Assessed Value
Land
FY 2012/13 Assessed Value
Improvements
FY 2012/13 Assessed Value
TotalA.V. per
sq.ft.Phase of
Demolition
700 Gateway Blvd. 015-023-290 13-041 55,098 $14,994,000 $21,522,000 $36,516,000 $663 Phase III750 Gateway Blvd. [1] 015-023-300 13-041 52,133 $13,111,245 $19,894,494 $33,005,739 $633 Phase II800 Gateway Blvd. [1] 015-023-300 13-042 45,400 $11,417,922 $17,325,111 $28,743,033 $633 Phase I850 Gateway Blvd. [1] 015-023-300 13-043 19,272 $4,846,833 $7,354,395 $12,201,228 $633 Phase IV900 Gateway Blvd. [2] 015-023-200 13-050 26,875 $4,080,000 $306,000 $4,386,000 $163 Phase IV900 Gateway Blvd. [2] 015-023-320 13-041 23,125 $3,060,000 $714,000 $3,774,000 $163 Phase IV1000 Gateway Blvd. [3] 015-023-190 13-040 10,479 $3,876,000 $2,560,200 $6,436,200 $614 Phase I1000 Gateway Blvd. [3] 015-023-310 13-041 11,260 $1,938,000 $4,977,600 $6,915,600 $614 Phase I1000 Gateway Blvd. [3] 015-023-430 13-040 40,372 $8,976,000 $15,820,200 $24,796,200 $614 Phase ITotal 284,013 $66,300,000 $90,474,000 $156,774,000 $552
[1] 750 - 850 Gateway Blvd. are part of the same parcel. Assessed value for the total parcel is apportioned to each address based on the square footage of structure.[2] 900 Gateway Blvd. is on two parcels. The square footage of the structure is split between the parcels in proportion to the parcel's assessed value relative to the total assessed value.[3] 1000 Gateway Blvd. is on three parcels. The square footage of the structure is split between the parcels in proportion to the parcel's assessed value relative to the total assessed value.
Sources: Chamberlin Associates; Economic & Planning Systems, Inc.
Secured Assessed Value
Economic & Planning Systems, Inc. 4/9/2013 P:\131000s\131017OysterPt\Model\131017FiscalModel_040913.xlsx
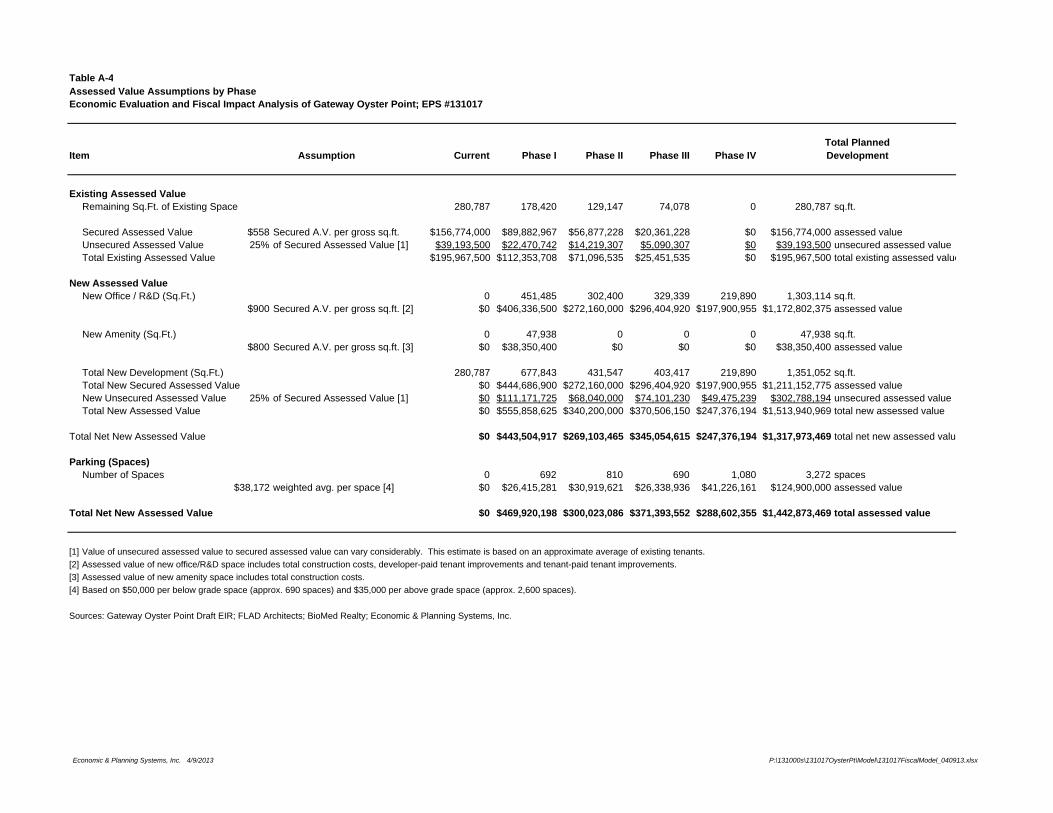
Table A-4Assessed Value Assumptions by PhaseEconomic Evaluation and Fiscal Impact Analysis of Gateway Oyster Point; EPS #131017
Item Current Phase I Phase II Phase III Phase IV
Existing Assessed ValueRemaining Sq.Ft. of Existing Space 280,787 178,420 129,147 74,078 0 280,787 sq.ft.
Secured Assessed Value $558 Secured A.V. per gross sq.ft. $156,774,000 $89,882,967 $56,877,228 $20,361,228 $0 $156,774,000 assessed valueUnsecured Assessed Value 25% of Secured Assessed Value [1] $39,193,500 $22,470,742 $14,219,307 $5,090,307 $0 $39,193,500 unsecured assessed valueTotal Existing Assessed Value $195,967,500 $112,353,708 $71,096,535 $25,451,535 $0 $195,967,500 total existing assessed value
New Assessed ValueNew Office / R&D (Sq.Ft.) 0 451,485 302,400 329,339 219,890 1,303,114 sq.ft.
$900 Secured A.V. per gross sq.ft. [2] $0 $406,336,500 $272,160,000 $296,404,920 $197,900,955 $1,172,802,375 assessed value
New Amenity (Sq.Ft.) 0 47,938 0 0 0 47,938 sq.ft.$800 Secured A.V. per gross sq.ft. [3] $0 $38,350,400 $0 $0 $0 $38,350,400 assessed value
Total New Development (Sq.Ft.) 280,787 677,843 431,547 403,417 219,890 1,351,052 sq.ft.Total New Secured Assessed Value $0 $444,686,900 $272,160,000 $296,404,920 $197,900,955 $1,211,152,775 assessed valueNew Unsecured Assessed Value 25% of Secured Assessed Value [1] $0 $111,171,725 $68,040,000 $74,101,230 $49,475,239 $302,788,194 unsecured assessed valueTotal New Assessed Value $0 $555,858,625 $340,200,000 $370,506,150 $247,376,194 $1,513,940,969 total new assessed value
Total Net New Assessed Value $0 $443,504,917 $269,103,465 $345,054,615 $247,376,194 $1,317,973,469 total net new assessed value
Parking (Spaces)Number of Spaces 0 692 810 690 1,080 3,272 spaces
$38,172 weighted avg. per space [4] $0 $26,415,281 $30,919,621 $26,338,936 $41,226,161 $124,900,000 assessed value
Total Net New Assessed Value $0 $469,920,198 $300,023,086 $371,393,552 $288,602,355 $1,442,873,469 total assessed value
[1] Value of unsecured assessed value to secured assessed value can vary considerably. This estimate is based on an approximate average of existing tenants.[2] Assessed value of new office/R&D space includes total construction costs, developer-paid tenant improvements and tenant-paid tenant improvements.[3] Assessed value of new amenity space includes total construction costs.[4] Based on $50,000 per below grade space (approx. 690 spaces) and $35,000 per above grade space (approx. 2,600 spaces).
Sources: Gateway Oyster Point Draft EIR; FLAD Architects; BioMed Realty; Economic & Planning Systems, Inc.
Total PlannedAssumption Development
Economic & Planning Systems, Inc. 4/9/2013 P:\131000s\131017OysterPt\Model\131017FiscalModel_040913.xlsx

Table A-5Select Economic BenefitsEconomic Evaluation and Fiscal Impact Analysis of Gateway Oyster Point; EPS #131017
Benefits Estimating Factors Total
EmploymentNet New On-Site R&D Employment [1] 3 per 1,000 sq.ft. 3,122
Construction Jobs (temporary)Development Cost [2] $700,000,000Labor Cost 40% of development value $280,000,000Average Annual Salary [3] $92,330 per construction employeeNew One-Time Construction Employment 3,000
Sales Tax Revenue (annual)Average Biotech Salary [4] $190,638 per employee $595,236,891Retail Taxable Expenditures [5] 27% of total income $160,714,000% of Expenditures in South San Francisco 10% of total retail taxable expenditures $16,071,000Sales Tax Revenue to City's General Fund 1.0% of total retail expenditure in South SF $161,000
[2] A rounded estimate based on per square foot development hard costs provided by BMR.
[5] Based on the BLS Consumer Expenditure Survey.
Sources: Bureau of Labor Statistics; and Economic & Planning Systems, Inc.
[1] Employment density factor is consistent with the employment densities assumed in the Gateway Business Park Transportation Demand Management Study. The number of net new employees reflects R&D jobs only, excluding jobs supported by amenity space.
[3] Based on 2011 Quarterly Census of Employment and Wages of NAICS 2362 Nonresidential Building Construction for San Mateo County. [4] Based on 2011 Quarterly Census of Employment and Wages of NAICS 541711 Research and Development in Biotechnology for San Mateo County.
Economic & Planning Systems, Inc. 4/9/2013 P:\131000s\131017OysterPt\Model\131017FiscalModel_040913.xlsx
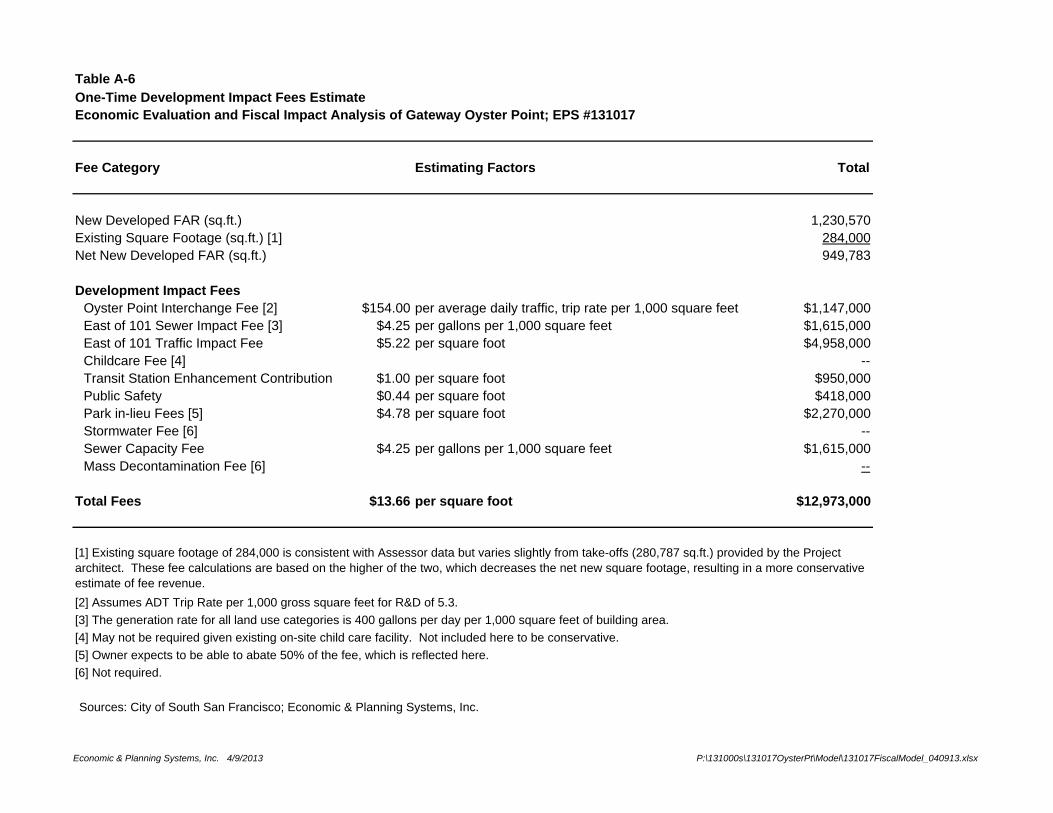
Table A-6One-Time Development Impact Fees EstimateEconomic Evaluation and Fiscal Impact Analysis of Gateway Oyster Point; EPS #131017
Fee Category Estimating Factors Total
New Developed FAR (sq.ft.) 1,230,570Existing Square Footage (sq.ft.) [1] 284,000Net New Developed FAR (sq.ft.) 949,783
Development Impact FeesOyster Point Interchange Fee [2] $154.00 per average daily traffic, trip rate per 1,000 square feet $1,147,000East of 101 Sewer Impact Fee [3] $4.25 per gallons per 1,000 square feet $1,615,000East of 101 Traffic Impact Fee $5.22 per square foot $4,958,000Childcare Fee [4] --Transit Station Enhancement Contribution $1.00 per square foot $950,000Public Safety $0.44 per square foot $418,000Park in-lieu Fees [5] $4.78 per square foot $2,270,000Stormwater Fee [6] --Sewer Capacity Fee $4.25 per gallons per 1,000 square feet $1,615,000Mass Decontamination Fee [6] --
Total Fees $13.66 per square foot $12,973,000
[2] Assumes ADT Trip Rate per 1,000 gross square feet for R&D of 5.3.[3] The generation rate for all land use categories is 400 gallons per day per 1,000 square feet of building area.[4] May not be required given existing on-site child care facility. Not included here to be conservative.[5] Owner expects to be able to abate 50% of the fee, which is reflected here.[6] Not required.
Sources: City of South San Francisco; Economic & Planning Systems, Inc.
[1] Existing square footage of 284,000 is consistent with Assessor data but varies slightly from take-offs (280,787 sq.ft.) provided by the Project architect. These fee calculations are based on the higher of the two, which decreases the net new square footage, resulting in a more conservative estimate of fee revenue.
Economic & Planning Systems, Inc. 4/9/2013 P:\131000s\131017OysterPt\Model\131017FiscalModel_040913.xlsx

Table A-7Resident-Employee Weighting and RelationshipEconomic Evaluation and Fiscal Impact Analysis of Gateway Oyster Point; EPS #131017
Category Number [1]Share of
Sub-Group Weight [2]Weighted
PercentageNormalized
to 100%
ResidentsNot in Labor Force 35,501 56% 100% 56%Employed in South San Francisco 3,531 6% 66% 4%Employed outside of South San Francisco 24,600 39% 66% 25%
Total Residents 63,632 100% 85% 100%
Employees (Jobs in South San Francisco)Live in South San Francisco 3,531 8% 34% 3%Live outside of South San Francisco 38,885 92% 34% 31%
Total Employees 42,416 100% 34% 40%
Total Residents and Employees 106,048
[1] 2010 Census figure estimates used to calculate employee weighting.
Sources: U.S. Census, 2010; Economic & Planning Systems, Inc.
2010 (Base Year)
[2] Weighting based on percent of annual number of "waking" hours [5,840 = 16 hours per day * 365 days per year] and percent of annual number of hours at job [2,000 = 40 hours per week * 50 weeks per year].
Economic & Planning Systems, Inc. 4/9/2013 P:\131000s\131017OysterPt\Model\131017FiscalModel_040913.xlsx

Table A-8Citywide Demographic DataEconomic Evaluation and Fiscal Impact Analysis of Gateway Oyster Point; EPS #131017
Item Amount Source
Population (2012) a 64,307 DoFTotal Jobs (2010) b 42,416 CensusDaytime Service Population [1] c 81,425 c = a + (b * 40%)
[1] "Daytime Service Population" equals 100 percent of City residents plus 40% of jobs in the City. This measure of service population is used for cost or revenue impacts where employment affects the demand for service but by less than the residential demand. See Table A-7.
Sources: California Department of Finance, U.S. Census Bureau, and Economic & Planning Systems, Inc.
Economic & Planning Systems, Inc. 4/9/2013 P:\131000s\131017OysterPt\Model\131017FiscalModel_040913.xlsx

Table A-9General Fund Revenue 2012/13 and Estimating FactorsEconomic Evaluation and Fiscal Impact Analysis of Gateway Oyster Point; EPS #131017
2012-13Table Adopted Estimating
Item Reference General Fund Factor/Assumptions Phase I Phase II Phase III Phase IV Build-out
Property Tax Table A-10 $19,026,838 16.9% of Property Tax $652,195 $416,398 $515,452 $400,547 $1,984,591Transient Occupancy Tax Table A-12 $8,516,099 $9.32 per room night $50,689 $31,706 $34,531 $23,055 $112,476Sales Tax Table A-13 $12,978,812 1.0% of estimated taxable sales $62,443 $38,557 $65,157 $49,071 $234,459Business License Tax $993,632 $23.43 per employee $33,975 $21,252 $23,145 $15,453 $75,390Real Property Transfer Tax $235,000 - not estimated - - - - - Commercial Parking Tax [1] $2,546,441 - not estimated - - - - - Property Tax In-Lieu of VLF Table A-11 $5,137,005 based on assessed value $173,588 $110,828 $137,192 $106,609 $532,995Franchise Fees [2] $3,317,516 $40.74 per daytime service pop. $23,847 $14,917 $16,246 $10,847 $52,916Licenses & Permits $2,959,155 not estimated - - - - - Fines & Forfeitures $1,167,350 $14.34 per daytime service pop. $8,391 $5,249 $5,716 $3,817 $18,620Intergovernmental $706,459 not estimated - - - - - Charges for Services $7,506,062 not estimated - - - - - Use of Money and Property $2,907,817 not estimated - - - - - Other Revenues $342,568 not estimated - - - - -
Total General Fund Revenues [3] $68,340,754 $1,005,128 $638,906 $797,439 $609,399 $3,011,446
[1] On-site parking will not charge parking fees and, therefore, will not be subject to the City's Commercial Parking Tax.[2] Franchise fees are paid by providers of cable, utilities, and waste management services in the City. The fee ranges from 0.5% to 10% of gross receipts depending on the type of service provided.[3] Total does not include $1.3 million of Transfers In.
Sources: City of South San Francisco Adopted Operating Budget FY 2012-2013; Economic & Planning Systems, Inc.
Project Revenues
Economic & Planning Systems, Inc. 4/9/2013 P:\131000s\131017OysterPt\Model\131017FiscalModel_040913.xlsx

Table A-10Property Tax CalculationEconomic Evaluation and Fiscal Impact Analysis of Gateway Oyster Point; EPS #131017
Category Phase I Phase II Phase III Phase IV Buildout
Incremental Assessed Value of Site See Table A-4 $469,920,198 $300,023,086 $371,393,552 $288,602,355 $1,442,873,469
Property Tax Total 1.0% of Assessed Value $4,699,202 $3,000,231 $3,713,936 $2,886,024 $14,299,392Share of Property Tax to General Fund [1] 16.9% 16.9% 16.9% 16.9% 16.9%Pre-ERAF Property Tax to City's General Fund [2] $795,083 $507,625 $628,381 $488,302 $2,419,391
ERAF Shift [3] 18.0% of City's Share $142,888 $91,228 $112,929 $87,755 $434,800Post-ERAF Property Tax to City's General Fund $652,195 $416,398 $515,452 $400,547 $1,984,591
[2] Does not include the state allocation of property tax retained in-lieu of VLF. Instead, property tax in-lieu of VLF is calculated separately in Table A-11.[3] Based on City's ERAF shift as a percentage of the City's total property tax revenue as provided by the County Controller.
Sources: County of San Mateo Controller; Economic & Planning Systems, Inc.
Assumptions/Reference
[1] Tax allocation rate reflects the share of the 1% base property tax allocated to the City of South San Francisco. Rate reflects the average factor of the tax rate areas present in the Project site. Factors are provided by the County Controller.
Economic & Planning Systems, Inc. 4/9/2013 P:\131000s\131017OysterPt\Model\131017FiscalModel_040913.xlsx
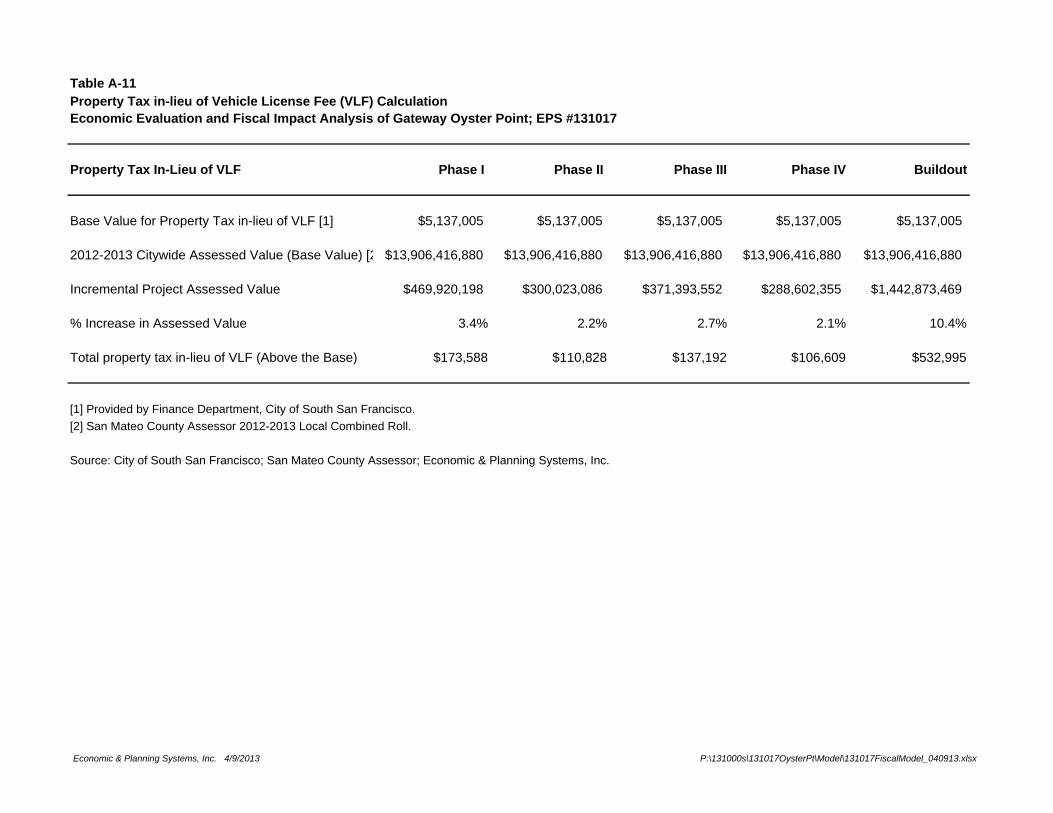
Table A-11Property Tax in-lieu of Vehicle License Fee (VLF) CalculationEconomic Evaluation and Fiscal Impact Analysis of Gateway Oyster Point; EPS #131017
Property Tax In-Lieu of VLF Phase I Phase II Phase III Phase IV Buildout
Base Value for Property Tax in-lieu of VLF [1] $5,137,005 $5,137,005 $5,137,005 $5,137,005 $5,137,005
2012-2013 Citywide Assessed Value (Base Value) [2 $13,906,416,880 $13,906,416,880 $13,906,416,880 $13,906,416,880 $13,906,416,880
Incremental Project Assessed Value $469,920,198 $300,023,086 $371,393,552 $288,602,355 $1,442,873,469
% Increase in Assessed Value 3.4% 2.2% 2.7% 2.1% 10.4%
Total property tax in-lieu of VLF (Above the Base) $173,588 $110,828 $137,192 $106,609 $532,995
[1] Provided by Finance Department, City of South San Francisco.[2] San Mateo County Assessor 2012-2013 Local Combined Roll.
Source: City of South San Francisco; San Mateo County Assessor; Economic & Planning Systems, Inc.
Economic & Planning Systems, Inc. 4/9/2013 P:\131000s\131017OysterPt\Model\131017FiscalModel_040913.xlsx

Table A-12Transient Occupancy Tax (TOT) CalculationEconomic Evaluation and Fiscal Impact Analysis of Gateway Oyster Point; EPS #131017
Item Phase I Phase II Phase III Phase IV Buildout
Existing Supply Total Rooms [1] 2,951 2,951 2,951 2,951 2,951Total Potential Room Nights 1,077,115 1,077,115 1,077,115 1,077,115 1,077,115Average Citywide Occupancy [1] 85% 85% 85% 85% 85%Average Room Nights 913,753 913,753 913,753 913,753 913,753
FY 2012-2013 TOT Estimate $8,516,099 $8,516,099 $8,516,099 $8,516,099 $8,516,099TOT per room night $9.32 $9.32 $9.32 $9.32 $9.32
Expected GrowthEmployees 1,450 907 988 660 3,218Room Night Generation Factor [2] 3.75 3.75 3.75 3.75 3.75Room Nights Generated 5,439 3,402 3,705 2,474 12,068TOT Generated $50,689 $31,706 $34,531 $23,055 $112,476
[1] City of South San Francisco provided total rooms in City and average occupancy as of 1st half of FY 2012/2013.[2] Based on estimates from previous EPS market studies conducted in Chula Vista and San Ramon.
Sources: City of South San Francisco; City of South San Francisco Adopted Operating Budget FY 2012-2013; Economic & Planning Systems, Inc.
Economic & Planning Systems, Inc. 4/9/2013 P:\131000s\131017OysterPt\Model\131017FiscalModel_040913.xlsx
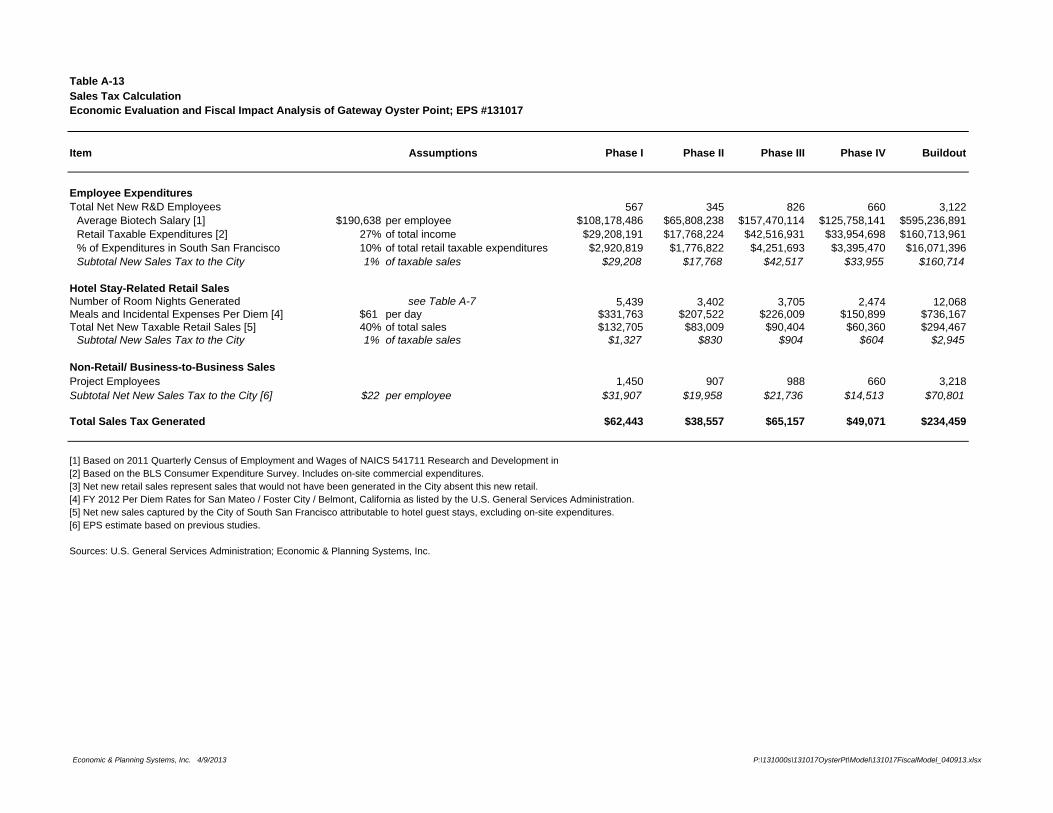
Table A-13Sales Tax CalculationEconomic Evaluation and Fiscal Impact Analysis of Gateway Oyster Point; EPS #131017
Item Phase I Phase II Phase III Phase IV Buildout
Employee ExpendituresTotal Net New R&D Employees 567 345 826 660 3,122
Average Biotech Salary [1] $190,638 per employee $108,178,486 $65,808,238 $157,470,114 $125,758,141 $595,236,891Retail Taxable Expenditures [2] 27% of total income $29,208,191 $17,768,224 $42,516,931 $33,954,698 $160,713,961% of Expenditures in South San Francisco 10% of total retail taxable expenditures $2,920,819 $1,776,822 $4,251,693 $3,395,470 $16,071,396Subtotal New Sales Tax to the City 1% of taxable sales $29,208 $17,768 $42,517 $33,955 $160,714
Hotel Stay-Related Retail SalesNumber of Room Nights Generated 5,439 3,402 3,705 2,474 12,068Meals and Incidental Expenses Per Diem [4] $61 per day $331,763 $207,522 $226,009 $150,899 $736,167Total Net New Taxable Retail Sales [5] 40% of total sales $132,705 $83,009 $90,404 $60,360 $294,467
Subtotal New Sales Tax to the City 1% of taxable sales $1,327 $830 $904 $604 $2,945
Non-Retail/ Business-to-Business SalesProject Employees 1,450 907 988 660 3,218Subtotal Net New Sales Tax to the City [6] $22 per employee $31,907 $19,958 $21,736 $14,513 $70,801
Total Sales Tax Generated $62,443 $38,557 $65,157 $49,071 $234,459
[2] Based on the BLS Consumer Expenditure Survey. Includes on-site commercial expenditures.[3] Net new retail sales represent sales that would not have been generated in the City absent this new retail.[4] FY 2012 Per Diem Rates for San Mateo / Foster City / Belmont, California as listed by the U.S. General Services Administration.[5] Net new sales captured by the City of South San Francisco attributable to hotel guest stays, excluding on-site expenditures.[6] EPS estimate based on previous studies.
Sources: U.S. General Services Administration; Economic & Planning Systems, Inc.
Assumptions
see Table A-7
[1] Based on 2011 Quarterly Census of Employment and Wages of NAICS 541711 Research and Development in
Economic & Planning Systems, Inc. 4/9/2013 P:\131000s\131017OysterPt\Model\131017FiscalModel_040913.xlsx

Table A-14General Fund Expenditures 2011/12 and Estimating FactorsEconomic Evaluation and Fiscal Impact Analysis of Gateway Oyster Point; EPS #131017
2012-13 PercentTable Adopted Variable
Item Reference General Fund Costs [1] Phase I Phase II Phase III Phase IV Buildout
General Government [1] $6,163,307 15% $11.35 per daytime service pop. $6,646 $4,157 $4,527 $3,023 $14,746
Public SafetyPolice Table A-15 $21,054,388 100% $174,272 per patrol officer $91,060 $56,959 $62,033 $41,418 $202,058Fire Table A-16 $18,669,464 100% $210,692 per firefighter $108,258 $67,716 $73,749 $49,240 $240,218
Economic & Community Development
$3,762,691 - not estimated - - - - -
Public Works $3,203,292 60% $23.60 per daytime service pop. $13,816 $8,642 $9,412 $6,284 $30,656
Library $4,208,912 15% $7.75 per daytime service pop. $4,538 $2,839 $3,092 $2,064 $10,070
Parks & Recreation $10,539,100 15% $19.42 per daytime service pop. $11,364 $7,108 $7,741 $5,169 $25,216
Total General Fund Expenditures [2] $67,601,154 $235,681 $147,421 $160,554 $107,197 $522,964
[2] Total does not include $889,877 of Minor Maintenance Projects.
Sources: City of South San Francisco Adopted Operating Budget FY 2012-2013; Economic & Planning Systems, Inc.
[1] Includes City Council, City Clerk, City Treasurer, City Attorney, City Manager, Finance, Non-Departmental, and Human Resources.
EstimatingFactor/Approach
Project Expenditures
Economic & Planning Systems, Inc. 4/9/2013 P:\131000s\131017OysterPt\Model\131017FiscalModel_040913.xlsx
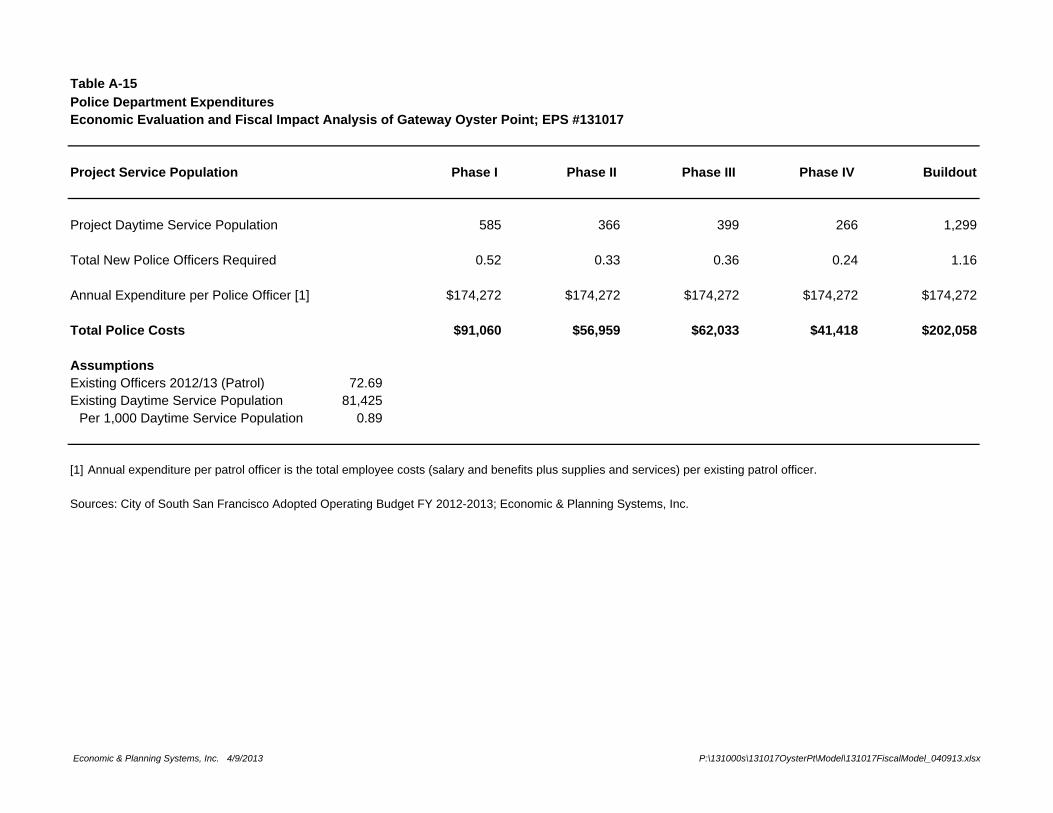
Table A-15Police Department ExpendituresEconomic Evaluation and Fiscal Impact Analysis of Gateway Oyster Point; EPS #131017
Project Service Population Phase I Phase II Phase III Phase IV Buildout
Project Daytime Service Population 585 366 399 266 1,299
Total New Police Officers Required 0.52 0.33 0.36 0.24 1.16
Annual Expenditure per Police Officer [1] $174,272 $174,272 $174,272 $174,272 $174,272
Total Police Costs $91,060 $56,959 $62,033 $41,418 $202,058
AssumptionsExisting Officers 2012/13 (Patrol) 72.69Existing Daytime Service Population 81,425
Per 1,000 Daytime Service Population 0.89
[1] Annual expenditure per patrol officer is the total employee costs (salary and benefits plus supplies and services) per existing patrol officer.
Sources: City of South San Francisco Adopted Operating Budget FY 2012-2013; Economic & Planning Systems, Inc.
Economic & Planning Systems, Inc. 4/9/2013 P:\131000s\131017OysterPt\Model\131017FiscalModel_040913.xlsx

Table A-16Fire Department ExpendituresEconomic Evaluation and Fiscal Impact Analysis of Gateway Oyster Point; EPS #131017
Phase I Phase II Phase III Phase IV Buildout
Project Daytime Service Population 585 366 399 266 1,299
Total New Firefighters Required 0.51 0.32 0.35 0.23 1.14
Annual Expenditure per Firefighter [1] $210,692 $210,692 $210,692 $210,692 $210,692
Total Fire Costs $108,258 $67,716 $73,749 $49,240 $240,218
AssumptionsExisting Firefighters 2012/13 (Operations and EMS) 71.48Existing Daytime Service Population 81,425
Per 1,000 Daytime Service Population 0.88
[1] Annual expenditure per firefighter is the total employee costs (salary and benefits plus supplies and services) per existing firefighter.
Sources: City of South San Francisco Adopted Operating Budget FY 2012-2013; Economic & Planning Systems, Inc.
Project Service Population
Economic & Planning Systems, Inc. 4/9/2013 P:\131000s\131017OysterPt\Model\131017FiscalModel_040913.xlsx