Economic Conditions and Regional Economic … Conditions and Regional Economic Outlook Brian...
24
W.E. UPJOHN INSTITUTE FOR EMPLOYMENT RESEARCH Economic Conditions and Regional Economic Outlook Brian Pittelko September 21, 2016 1 W.E. UPJOHN INSTITUTE FOR EMPLOYMENT RESEARCH
Transcript of Economic Conditions and Regional Economic … Conditions and Regional Economic Outlook Brian...

W.E.
UPJOHN INSTITUTEFOR EMPLOYMENT RESEARCH
Economic Conditions and Regional Economic Outlook
Brian Pittelko
September 21, 2016
1
W.E.
UPJOHN INSTITUTEFOR EMPLOYMENT RESEARCH

W.E.
UPJOHN INSTITUTEFOR EMPLOYMENT RESEARCH
W.E. Upjohn Institute for Employment Research
• The Institute is an activity of the W.E. Upjohn Unemployment Trustee Corporation, which was established in 1932 to administer a fund set aside by Dr. W.E. Upjohn, founder of the Upjohn Company.
• MISSION:– The W.E. Upjohn Institute for Employment Research is a private,
nonprofit, nonpartisan, independent research organization devoted to investigating the causes and effects of unemployment, to identifying feasible methods of insuring against unemployment, and to devising ways and means of alleviating the distress and hardship caused by unemployment.
2
W.E.
UPJOHN INSTITUTEFOR EMPLOYMENT RESEARCH
Regional and Economic Planning Services
• Data Dissemination & Analysis
• Economic Impact Studies
• Economic & Workforce Development Strategy
• Talent Assessment
• Urban & Regional Planning
3

W.E.
UPJOHN INSTITUTEFOR EMPLOYMENT RESEARCH
Forecasts are flat
-2,500
-2,000
-1,500
-1,000
-500
0
500
1,000
1,500
-10
-8
-6
-4
-2
0
2
4
6
2006 2008 2010 2012 2014 2016
Emp
loym
ent
Ch
ange
(0
00
s)
GD
P C
han
ge (
%)
Gross Domestic Product and Employment Change
GDP Change (L) Employment Change (R)
Forecast
4Source: Bureau of Labor Statistics Current Employment Survey, Bureau of Economic Analysis, Philadelphia Federal Reserve Consensus Forecast

W.E.
UPJOHN INSTITUTEFOR EMPLOYMENT RESEARCH
The calendar isn’t yet calling for a recession—if you trust history
1960–1969
1981–1990
1991–2000
2001–2007
2007–present (105 months)
90
95
100
105
110
115
120
125
130
135
M1
M7
M1
3
M1
9
M2
5
M3
1
M3
7
M4
3
M4
9
M5
5
M6
1
M6
7
M7
3
M7
9
M8
5
M9
1
M9
7
M1
03
M1
09
M1
15
M1
21
M1
27
Employment Index From Business Cycle Peak
Source: Bureau of Labor Statistics Current Employment Survey5
Mo
nth
1 o
f R
eco
very
=10
0
W.E.
UPJOHN INSTITUTEFOR EMPLOYMENT RESEARCH
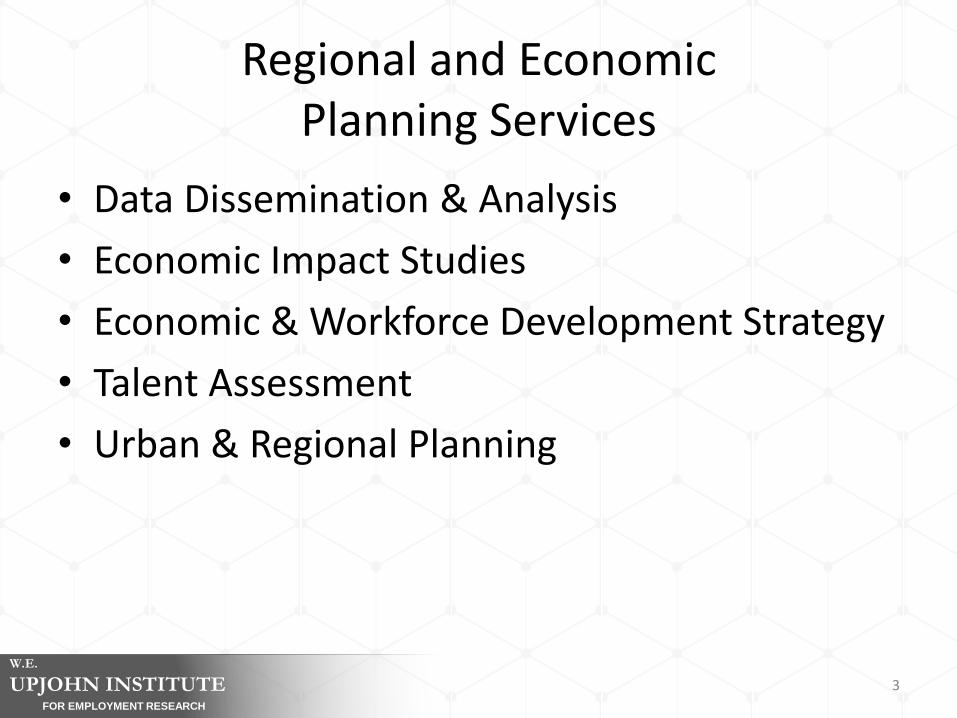
Mixed signals from consumers
0
20
40
60
80
100
120
-20
-10
0
10
20
30
40
2006 2007 2008 2009 2010 2011 2012 2013 2014 2015 2016
Ind
ex: 1
99
5 =
10
0
Bill
ion
s ($
)
Consumer Confidence and Change in Consumer Debt
Consumer Debt (L) Consumer Confidence (R)
Source: New York Federal Reserve and Conference Board6

W.E.
UPJOHN INSTITUTEFOR EMPLOYMENT RESEARCH
Are sales at a natural peak?
0
2
4
6
8
10
12
14
16
18
20
22
24
2000 2001 2002 2003 2004 2005 2006 2007 2008 2009 2010 2011 2012 2013 2014 2015 2016
An
nu
al R
ate
of
Sale
s (i
n 0
00
,00
0s)
Annualized Rate of U.S. Light Vehicle Sales (in millions)
18.1 (2000 to 2007 Peak)
16.8 (2000 to 2007 Average)
7Source: Bureau of Economic Analysis

W.E.
UPJOHN INSTITUTEFOR EMPLOYMENT RESEARCH
Moving on to Michigan
8

W.E.
UPJOHN INSTITUTEFOR EMPLOYMENT RESEARCH
Employment is growing in nearly every industry
Construct.
Manufacturing
Wholesale
Retail
Transport. and util.
Info.
Finance
Real estate
Prof. and business
Management
Admin.
Education
Health
Hospitality
Other srv.
Govt.
-5000
0
5000
10000
15000
20000
Emp
loym
ent
Ch
ange
(0
00
s)
Employment Change, Q2 2015 to Q2 2016
9Source: Bureau of Labor Statistics Current Employment Survey

W.E.
UPJOHN INSTITUTEFOR EMPLOYMENT RESEARCH
Statewide wages are not matching the national trend
16
18
20
22
24
26
28
2006 2007 2008 2009 2010 2011 2012 2013 2014 2015 2016
Ho
url
y W
ages
($
)
Average Hourly Wage for Production Workers (2016$)
United States Michigan
10Source: Bureau of Labor Statistics Current Employment Survey and Consumer Price Index

W.E.
UPJOHN INSTITUTEFOR EMPLOYMENT RESEARCH
Battle Creek MSA and Kalamazoo-Portage MSA
11

W.E.
UPJOHN INSTITUTEFOR EMPLOYMENT RESEARCH
The unemployment rates – from the nation to the region – have been steadily falling
0
2
4
6
8
10
12
14
16
2006 2007 2008 2009 2010 2011 2012 2013 2014 2015 2016
Perc
ent
of
lab
or
forc
e
Unemployment Rate
U.S. Michigan Battle Creek MSA Kalamazoo MSA
12Source: Bureau of Labor Statistics Local Area Unemployment Statistics

W.E.
UPJOHN INSTITUTEFOR EMPLOYMENT RESEARCH
Unemployment rates across the region are low
13Source: Bureau of Labor Statistics Local Area Unemployment Statistics

W.E.
UPJOHN INSTITUTEFOR EMPLOYMENT RESEARCH
However, labor force participation rates are lower
14Source: Bureau of Labor Statistics Local Area Unemployment Statistics

W.E.
UPJOHN INSTITUTEFOR EMPLOYMENT RESEARCH
Overall employment growth is tapering
70
75
80
85
90
95
100
105
110
2006 2007 2008 2009 2010 2011 2012 2013 2014 2015 2016
Ind
ex 2
00
6 =
10
0
Total Employment Index (2006 = 100)
U.S. Michigan Battle Creek MSA Kalamazoo MSA
15Source: Bureau of Labor Statistics Current Employment Statistics and Upjohn Institute
W.E.
UPJOHN INSTITUTEFOR EMPLOYMENT RESEARCH
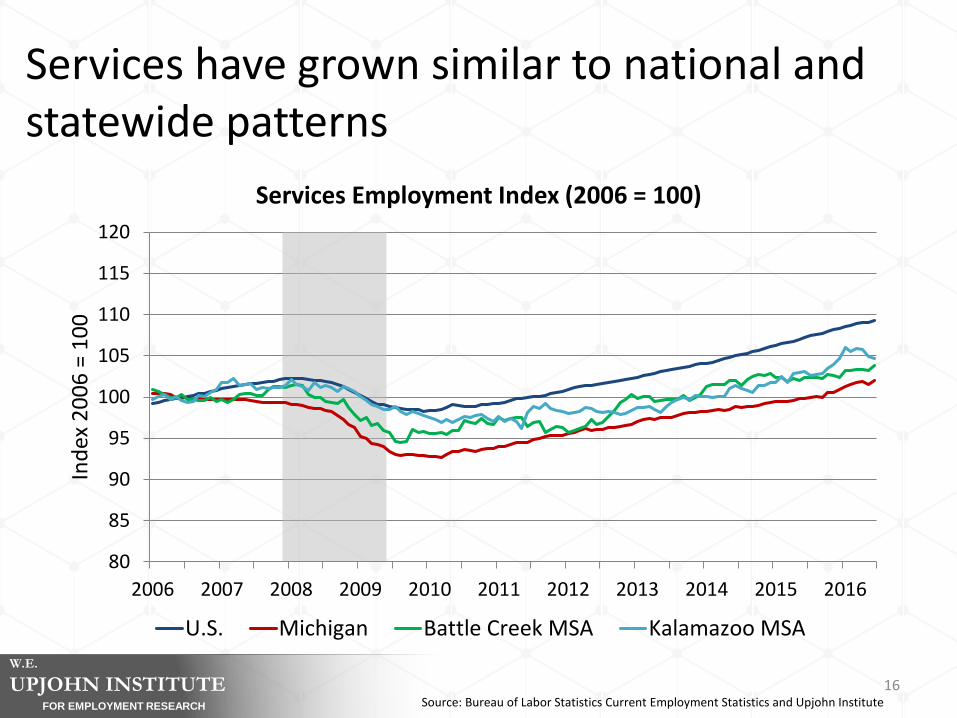
Services have grown similar to national and statewide patterns
80
85
90
95
100
105
110
115
120
2006 2007 2008 2009 2010 2011 2012 2013 2014 2015 2016
Ind
ex 2
00
6 =
10
0
Services Employment Index (2006 = 100)
U.S. Michigan Battle Creek MSA Kalamazoo MSA
16Source: Bureau of Labor Statistics Current Employment Statistics and Upjohn Institute

W.E.
UPJOHN INSTITUTEFOR EMPLOYMENT RESEARCH
Manufacturing employment growth has outpaced the national rate
40
50
60
70
80
90
100
110
120
2006 2007 2008 2009 2010 2011 2012 2013 2014 2015 2016
Ind
ex 2
00
6 =
10
0
Manufacturing Employment Index (2006 = 100)
U.S. Michigan Battle Creek MSA Kalamazoo MSA
17Source: Bureau of Labor Statistics Current Employment Statistics and Upjohn Institute

W.E.
UPJOHN INSTITUTEFOR EMPLOYMENT RESEARCH
Employment growth in the Battle Creek MSA was mixed in the third quarter
Construct.
Manufacturing
Trade, transport., and util.
Finance
Prof. and business
Education and health services
Leisure and hospitality
Other Srv.
Govt.
-0.15
-0.10
-0.05
0.00
0.05
0.10
0.15
0.20
0.25
0.30
0.35
Emp
loym
ent
Ch
ange
(0
00
s)
Battle Creek Employment Change, Q2 2015 to Q2 2016
18Source: Bureau of Labor Statistics Current Employment Statistics and Upjohn Institute

W.E.
UPJOHN INSTITUTEFOR EMPLOYMENT RESEARCH
Nearly every industry grew in the second quarter
Construct.
Manufacturing
Trade, transport., and util.
Information
Financial activities
Prof. and business
Education and health services
Leisure and hospitality
Other Srv.
Govt.
-0.4
-0.2
0
0.2
0.4
0.6
0.8
1
Emp
loym
ent
Ch
ange
(0
00
s)
Kalamazoo Employment Change, Q2 2015 to Q2 2016
19Source: Bureau of Labor Statistics Current Employment Statistics and Upjohn Institute

W.E.
UPJOHN INSTITUTEFOR EMPLOYMENT RESEARCH
Overall, real wages are rising
700
750
800
850
900
950
1,000
1,050
1,100
2006 2007 2008 2009 2010 2011 2012 2013 2014 2015
Ave
rage
Wee
kly
Wag
e ($
)
Total Wages ($2016)
U.S. Michigan Battle Creek MSA Kalamazoo MSA
20

W.E.
UPJOHN INSTITUTEFOR EMPLOYMENT RESEARCH
Manufacturing wages are rising in Kalamazoo, but falling in Battle Creek
1,000
1,100
1,200
1,300
1,400
1,500
1,600
1,700
2006 2007 2008 2009 2010 2011 2012 2013 2014 2015
Ave
rage
Wee
kly
Wag
e ($
)
Manufacturing Wages ($2016)
U.S. Michigan Battle Creek MSA Kalamazoo MSA
21

W.E.
UPJOHN INSTITUTEFOR EMPLOYMENT RESEARCH
Battle Creek is forecast for slow growth this year and next
2.3
2.72.5
1.2
1.6
2.2
1.6
0.4
1.3
0.8
1.6
0.8
0.0
0.5
1.0
1.5
2.0
2.5
3.0
Total Goods producing Service providing Government
Perc
ent
Ch
ange
Battle Creek Employment Forecast
2015 2016 2017
22Source: Bureau of Labor Statistics Current Employment Statistics and Upjohn Institute

W.E.
UPJOHN INSTITUTEFOR EMPLOYMENT RESEARCH
Kalamazoo’s forecast shows a sharper drop-off in goods production
1.9
4.1
1.5
0.5
1.4
2.0
1.4
0.6
1.4 1.31.5
0.9
0.0
0.5
1.0
1.5
2.0
2.5
3.0
3.5
4.0
4.5
Total Goods producing Service providing Government
Perc
ent
Ch
ange
Kalamazoo Employment Forecast
2015 2016 2017
23Source: Bureau of Labor Statistics Current Employment Statistics and Upjohn Institute

W.E.
UPJOHN INSTITUTEFOR EMPLOYMENT RESEARCH
Questions and comments?
• Upjohn Institute: 269-343-5541
• Brian Pittelko–Regional Analyst
24