Economic and Revenue Forecasts...MI Motor Vehicle Production & Employment 3.1 2.7 2.9 2.8 2.6 2.5...
46
January 2016 Consensus Conference Economic and Revenue Forecasts FY 2016 * FY 2017 * FY 2018 Consensus Revenue Estimating Conference January 14, 2016
Transcript of Economic and Revenue Forecasts...MI Motor Vehicle Production & Employment 3.1 2.7 2.9 2.8 2.6 2.5...

January 2016 Consensus Conference
Economic and Revenue ForecastsFY 2016 * FY 2017 * FY 2018
Consensus Revenue Estimating ConferenceJanuary 14, 2016
January 2016 Consensus Conference
Outline
• Economic ForecastJim Stansell, House Fiscal Agency
• Revenue Estimates for Major Taxes David Zin, Senate Fiscal Agency
• Revenue Estimates by Fund Jay Wortley, Department of Treasury
2

January 2016 Consensus Conference
0.2%
3.1% 2.7%
1.4%
-2.7%
2.0%
-1.9%
-8.2%
-5.4%
-0.5%
1.3%
3.9%
1.7%
3.9%
2.7% 2.5%
-1.5%
2.9%
0.8%
4.6%
2.7%1.9%
0.5%0.1%
1.9%1.1%
3.0%3.8%
-0.9%
4.6% 4.3%
2.1%
0.6%
3.9%
2.0%
2007 Q1 2008 Q1 2009 Q1 2010 Q1 2011 Q1 2012Q1 2013Q1 2014Q1 2015Q1
GDP Quarterly Growth Rates
Real GDP Growth
Figures are annualized percent change from preceding quarter in 2005 chained dollars.Source: Bureau of Economic Analysis. 3
January 2016 Consensus Conference
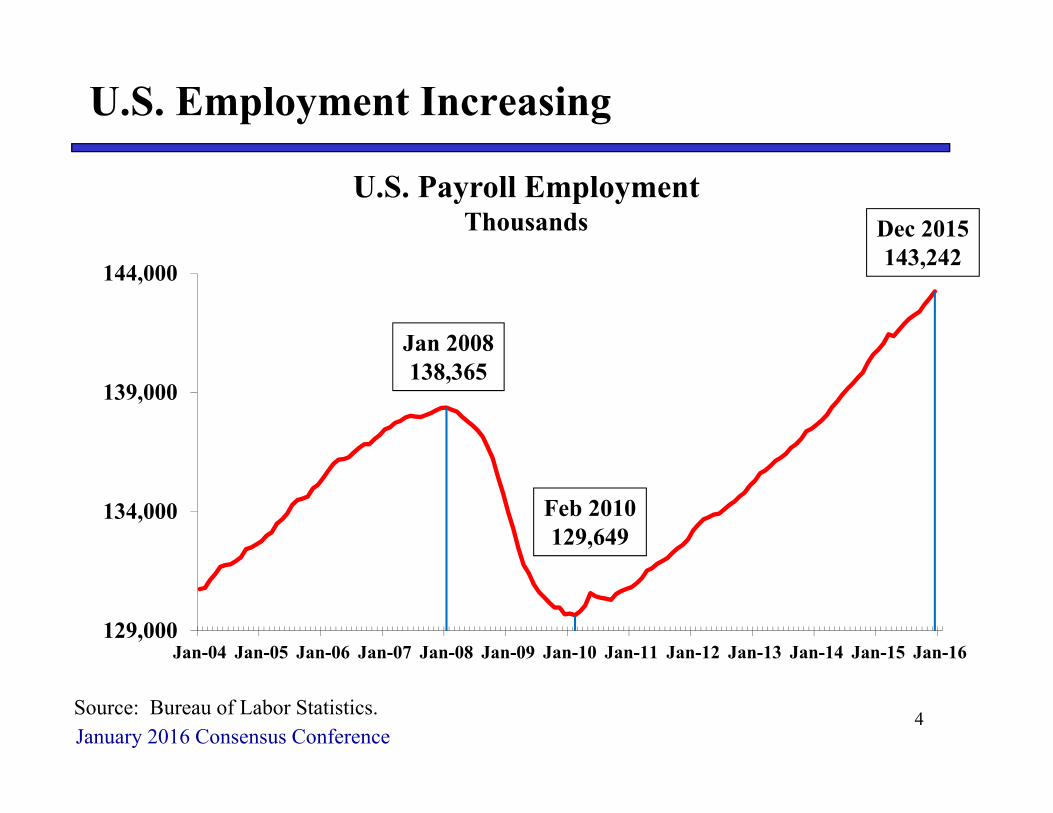
U.S. Employment Increasing
129,000
134,000
139,000
144,000
Jan-04 Jan-05 Jan-06 Jan-07 Jan-08 Jan-09 Jan-10 Jan-11 Jan-12 Jan-13 Jan-14 Jan-15 Jan-16
Source: Bureau of Labor Statistics.
U.S. Payroll EmploymentThousands Dec 2015
143,242
Jan 2008138,365
Feb 2010129,649
4

January 2016 Consensus ConferenceSource: Bureau of Economic Analysis.
Light Vehicle Sales at Historically High Levels
Millions of Units
910111213141516171819
Jan-08 Jan-09 Jan-10 Jan-11 Jan-12 Jan-13 Jan-14 Jan-15 Jan-16
Dec. 201517.2
Note: Sales rates are shown as an annual average sales rate.
5

January 2016 Consensus Conference
ISM Indices Show Manufacturing Contracting
30
35
40
45
50
55
60
65
Jan-07 Jan-08 Jan-09 Jan-10 Jan-11 Jan-12 Jan-13 Jan-14 Jan-15 Jan-16
ISMManufacturing Index
Dec 2015 = 48.2
ISMNon-Manufacturing Index
Dec 2015 = 55.3
Source: Institute for Supply Management. 6

January 2016 Consensus ConferenceSource: New Privately Owned Housing Units Started, U.S. Department of Commerce.
Housing Starts Increasing From Historical Lows
Thousands
400600800
1000120014001600180020002200
Jan-90 Jan-95 Jan-00 Jan-05 Jan-10 Jan-15
Jan 20062,273
Nov 20151,173
7
January 2016 Consensus Conference
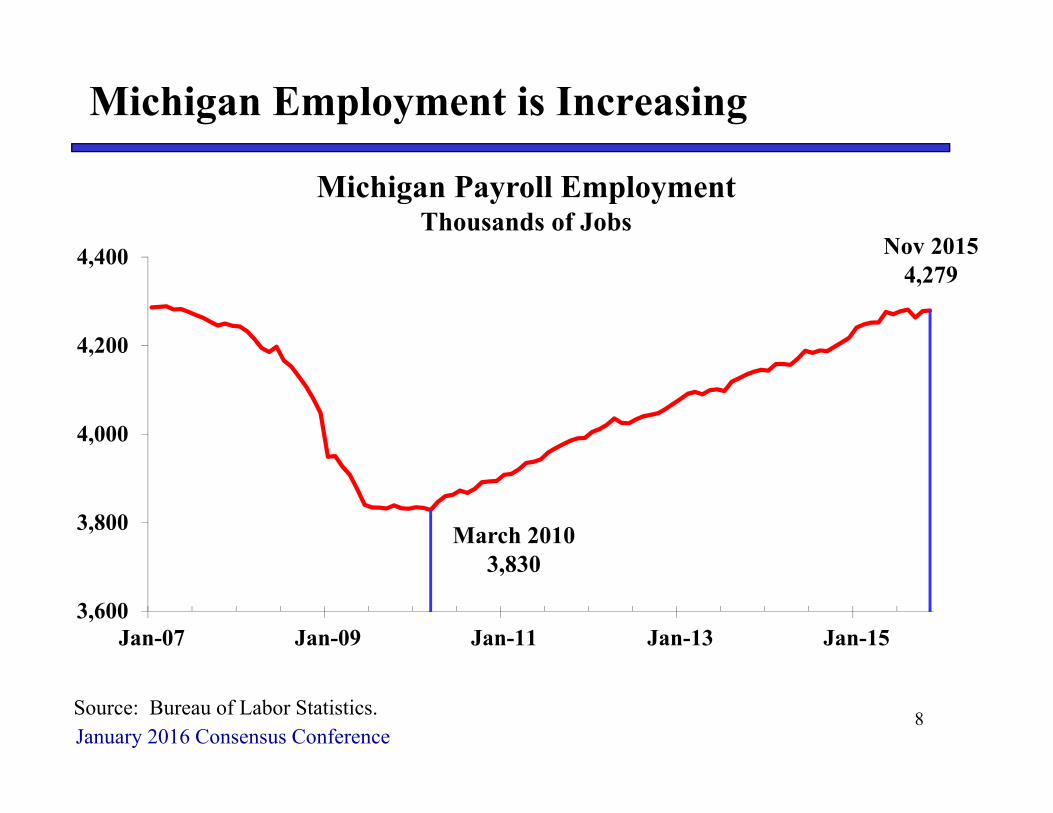
Michigan Employment is Increasing
3,600
3,800
4,000
4,200
4,400
Jan-07 Jan-09 Jan-11 Jan-13 Jan-15
Source: Bureau of Labor Statistics.
Michigan Payroll EmploymentThousands of Jobs
Nov 20154,279
March 20103,830
8
January 2016 Consensus Conference
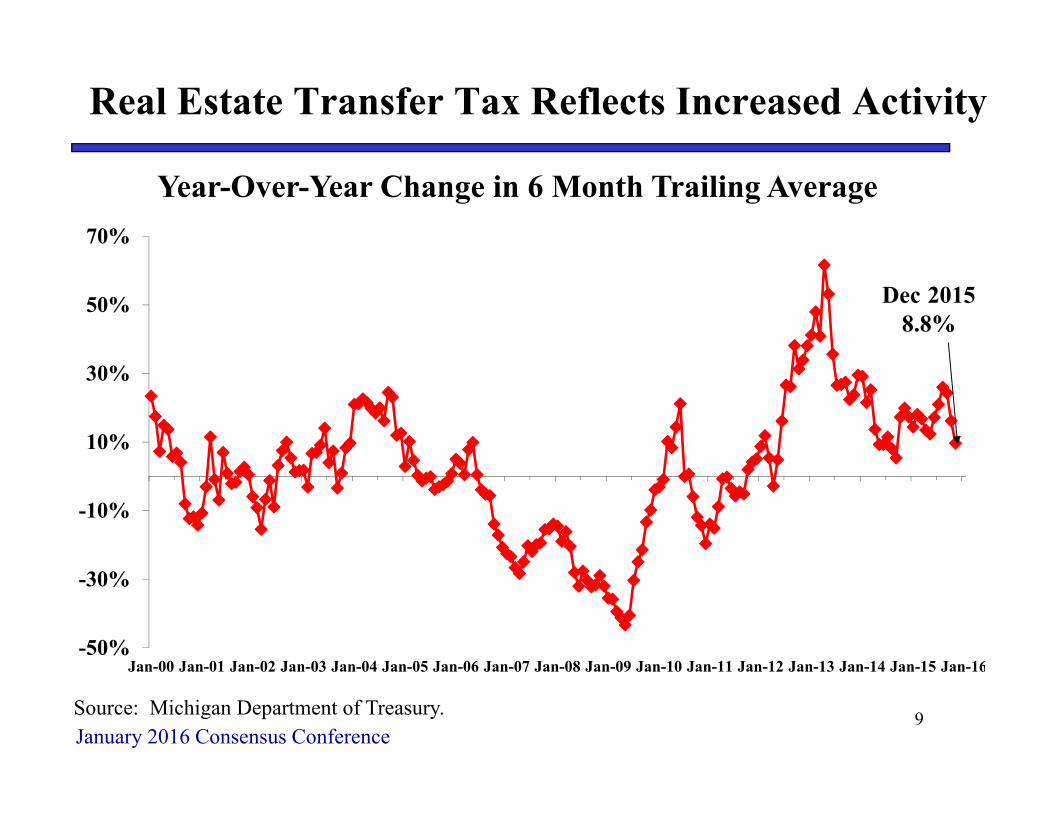
Real Estate Transfer Tax Reflects Increased Activity
-50%
-30%
-10%
10%
30%
50%
70%
Jan-00 Jan-01 Jan-02 Jan-03 Jan-04 Jan-05 Jan-06 Jan-07 Jan-08 Jan-09 Jan-10 Jan-11 Jan-12 Jan-13 Jan-14 Jan-15 Jan-16
Year-Over-Year Change in 6 Month Trailing Average
Dec 20158.8%
Source: Michigan Department of Treasury. 9

January 2016 Consensus Conference
GDP Forecasts
Annual Percent Change
2.6% 2.8% 2.5%2.5%1.9% 2.0% 2.2%
2.9% 2.9%2.5%
2015 2016 2017 2018
HFA SFA Admin.Estimate10

January 2016 Consensus Conference
Light Vehicle Sales Forecast
17.8 18.1 17.917.4
18.0 18.0 17.918.1 18.0 17.8
2015 2016 2017 2018HFA SFA Admin.
Millions of Units
Actual
11
January 2016 Consensus Conference
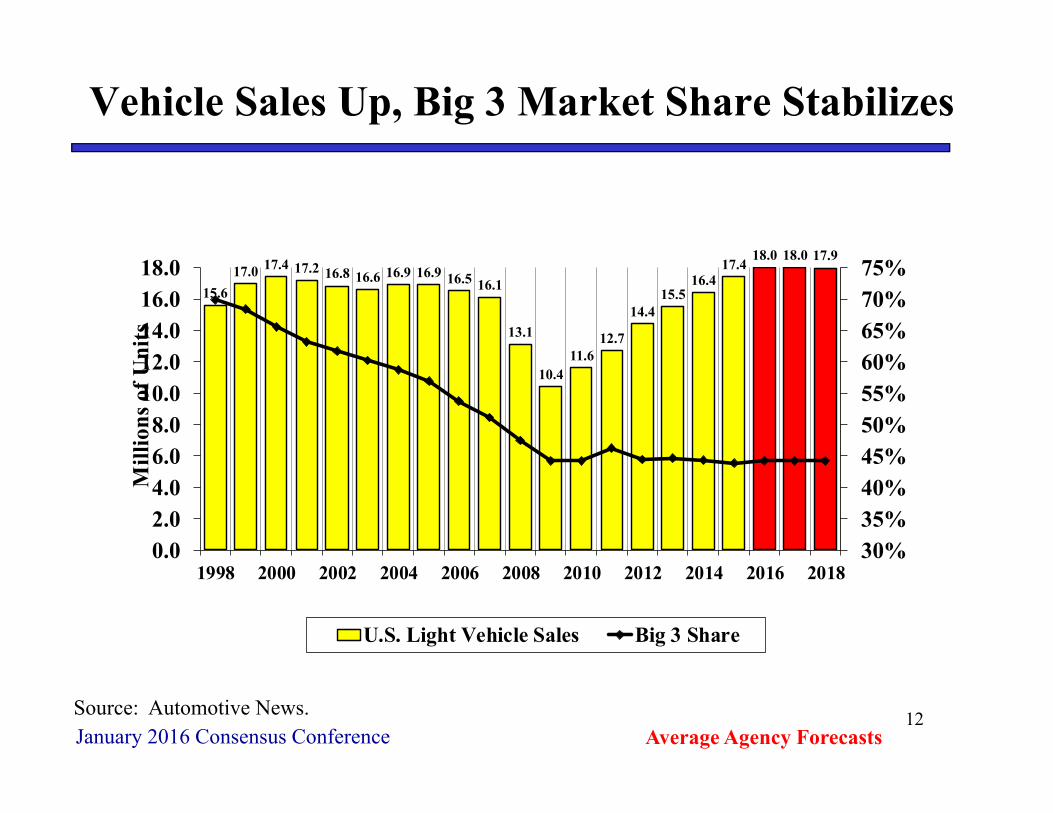
Vehicle Sales Up, Big 3 Market Share Stabilizes
15.617.0 17.4 17.2 16.8 16.6 16.9 16.9 16.5 16.1
13.1
10.411.6
12.7
14.415.5
16.417.4
18.0 18.0 17.9
30%35%40%45%50%55%60%65%70%75%
0.02.04.06.08.0
10.012.014.016.018.0
1998 2000 2002 2004 2006 2008 2010 2012 2014 2016 2018
Mill
ions
of U
nits
U.S. Light Vehicle Sales Big 3 Share
Average Agency ForecastsSource: Automotive News. 12
January 2016 Consensus Conference
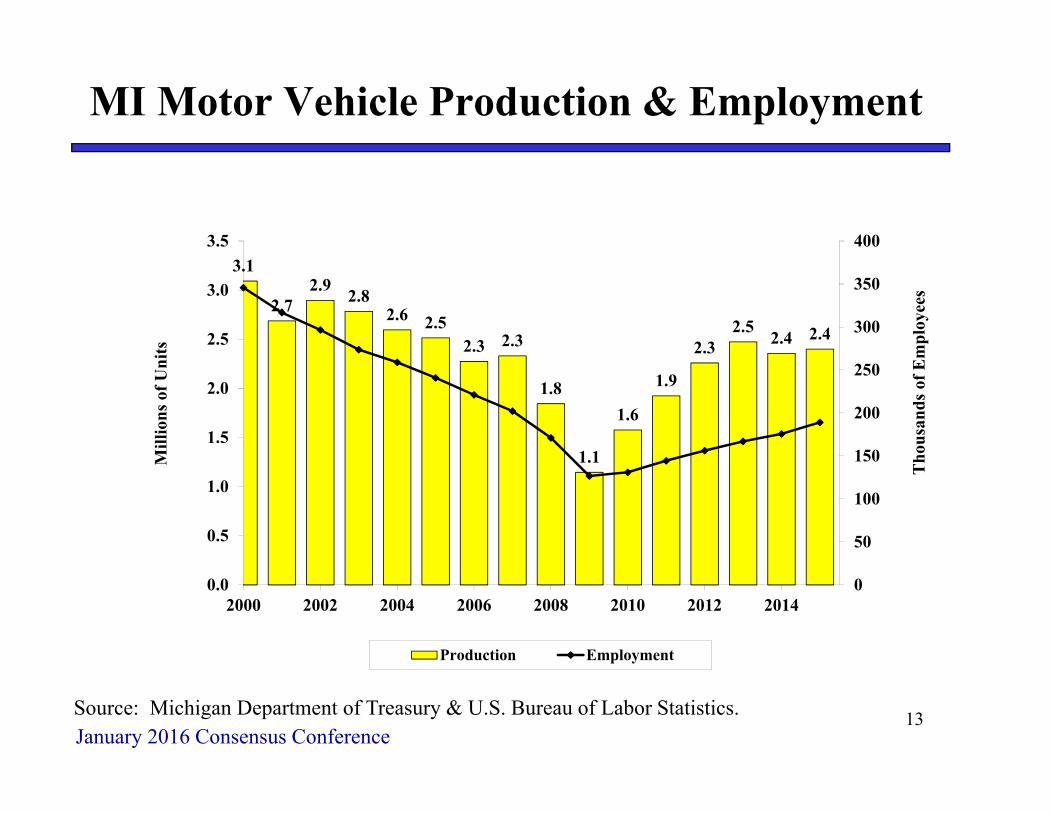
MI Motor Vehicle Production & Employment
3.1
2.72.9 2.8
2.6 2.52.3 2.3
1.8
1.1
1.6
1.9
2.32.5
2.4 2.4
0
50
100
150
200
250
300
350
400
0.0
0.5
1.0
1.5
2.0
2.5
3.0
3.5
2000 2002 2004 2006 2008 2010 2012 2014
Tho
usan
ds o
f Em
ploy
ees
Mill
ions
of U
nits
Production Employment
Source: Michigan Department of Treasury & U.S. Bureau of Labor Statistics. 13

January 2016 Consensus Conference
Inflation Remains Low
1.1%
2.2% 2.3%
-1.1%
1.0%
2.4%2.6%
1.1%
2.2%2.4%
2015 2016 2017 2018
HFA SFA Admin.
Detroit Consumer Price IndexFiscal Year Growth
Actual
14

January 2016 Consensus Conference
Michigan Wage and Salary Employment
Annual Percent Change
1.1%
1.6%1.4%
2.2%
1.2%1.0%
0.7%
1.3% 1.4%
1.0%
2015 2016 2017 2018
HFA SFA Admin.Forecast
15

January 2016 Consensus Conference
Michigan Job Gains Expected Through 2018
Change in Michigan Wage and Salary EmploymentThousands
Average Agency Forecasts
88.0
-112.7-76.8 -71.0
-16.9 -9.3
-63.2 -58.7
-105.7
-291.6
-7.2
88.5 81.5 71.2 70.489.5
51.6 57.2 44.8
Avg.
16

January 2016 Consensus Conference
Forecast of Major Taxes
• Individual Income Tax Annual Payments are expected to decline in FY16 from the large one-time capital gains driven increase in FY15.
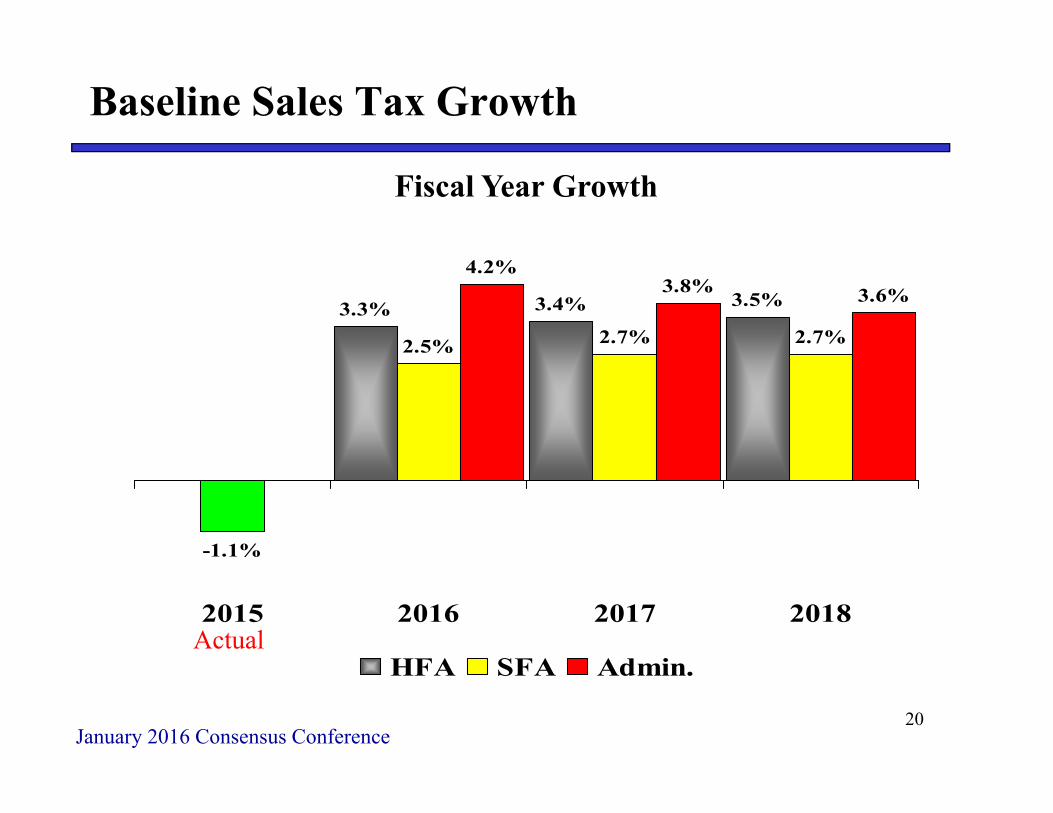
• Gasoline prices are not expected to drop again like they did in FY15, so sales tax revenue is expected to grow in FY16 - FY17.
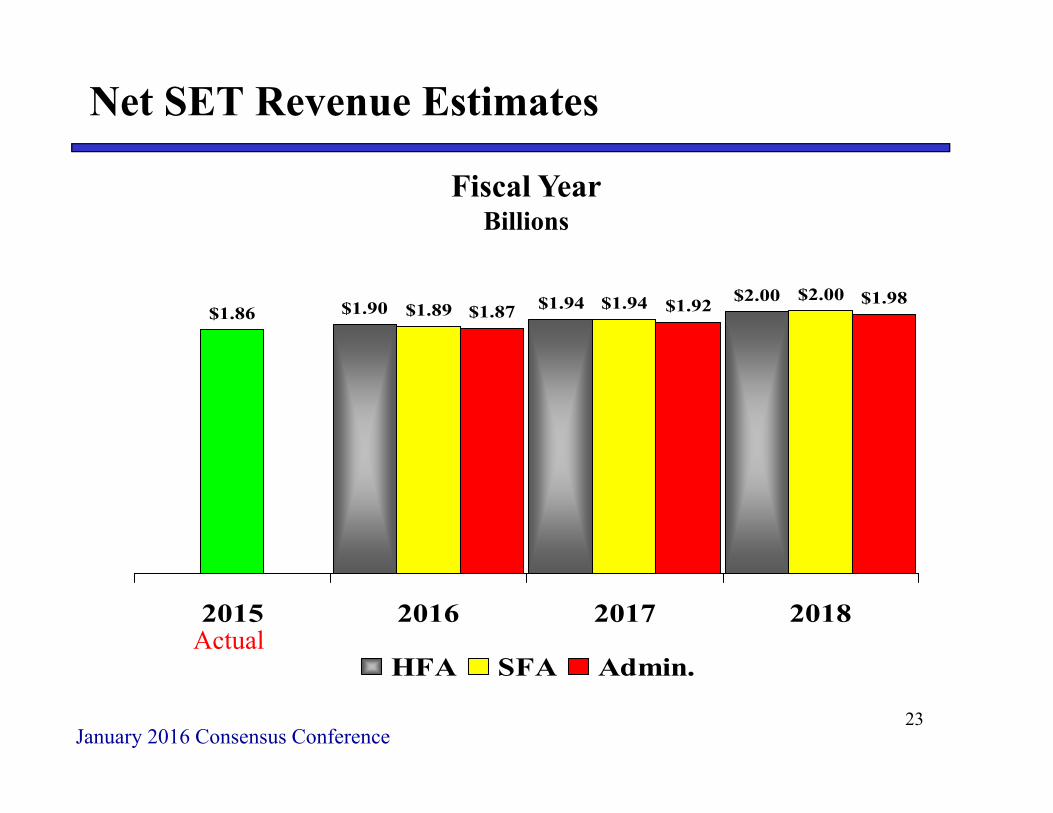
• SET is expected to continue to grow, but it will grow at a slower rate in FY16 due to low inflation.
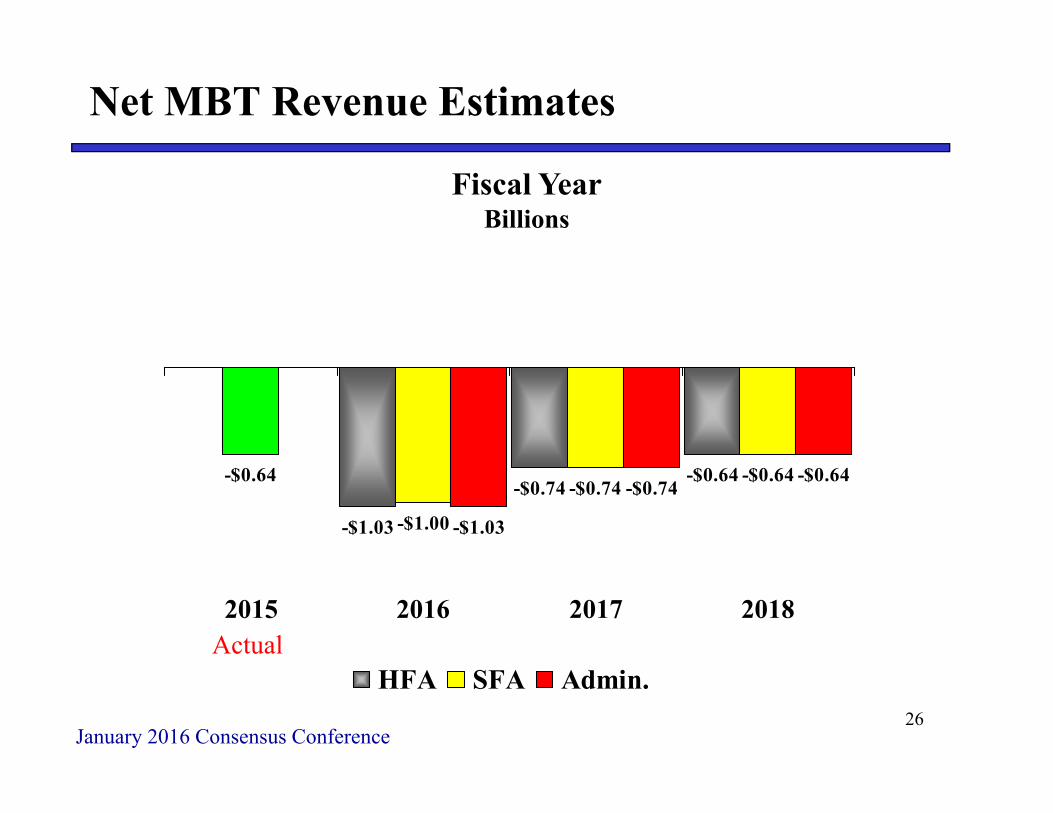
• MBT net refunds are expected to peak in FY16 and CIT is expected to grow through FY18.
17
January 2016 Consensus Conference
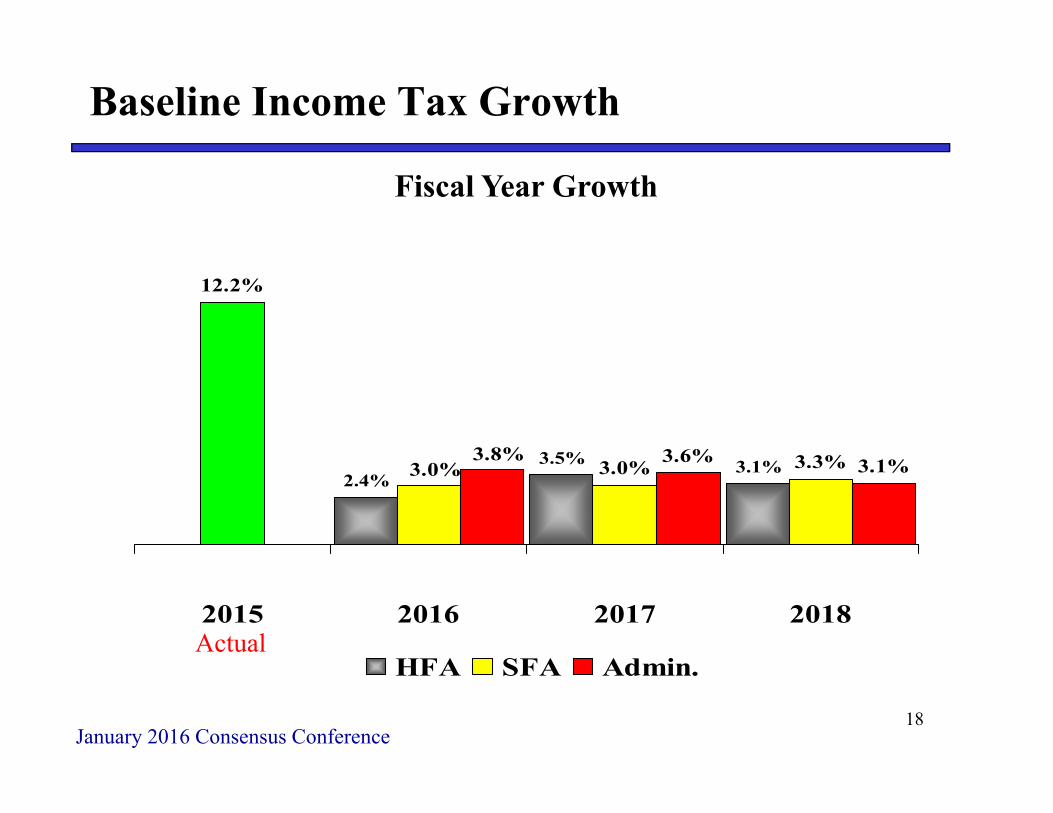
Baseline Income Tax Growth
2.4%3.5% 3.1%
12.2%
3.0% 3.3%3.6% 3.1%3.0%3.8%
2015 2016 2017 2018
HFA SFA Admin.
Fiscal Year Growth
Actual
18

January 2016 Consensus Conference
Net Income Tax Revenue Estimates
$9.03$9.35
$9.83
$9.27$9.52
$9.83$9.32
$9.65$9.93
$8.98
2015 2016 2017 2018
HFA SFA Admin.
Fiscal YearBillions
Actual
19
January 2016 Consensus Conference
Baseline Sales Tax Growth
3.3% 3.4% 3.5%
-1.1%
2.5% 2.7%
4.2%3.8% 3.6%
2.7%
2015 2016 2017 2018
HFA SFA Admin.Actual
Fiscal Year Growth
20

January 2016 Consensus Conference
Net Sales Tax Revenue Estimates
$7.54$7.78
$8.05
$7.25$7.50
$7.68$7.88
$7.59$7.87
$8.15
2015 2016 2017 2018
HFA SFA Admin.
Fiscal YearBillions
Actual
21
January 2016 Consensus Conference
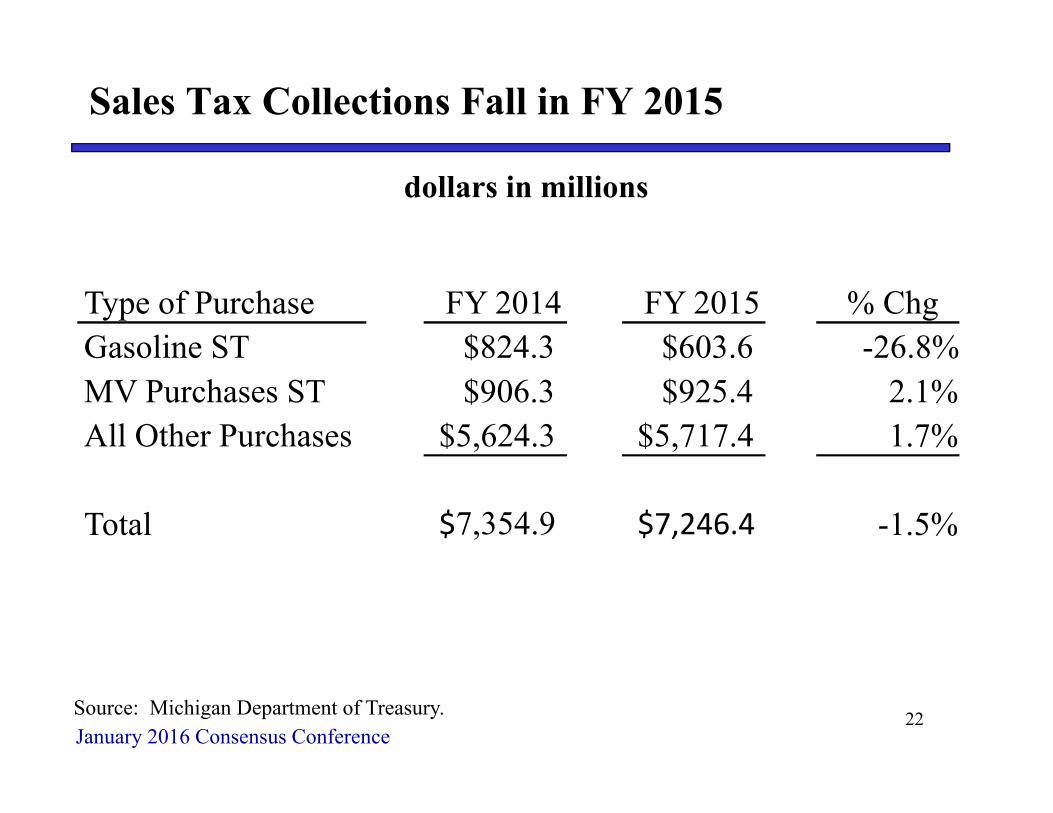
Sales Tax Collections Fall in FY 2015
Source: Michigan Department of Treasury. 22
dollars in millions
Type of Purchase FY 2014 FY 2015 % ChgGasoline ST $824.3 $603.6 -26.8%MV Purchases ST $906.3 $925.4 2.1%All Other Purchases $5,624.3 $5,717.4 1.7%
Total $7,354.9 $7,246.4 -1.5%
January 2016 Consensus Conference
Net SET Revenue Estimates
$1.90 $1.94 $2.00$1.86 $1.89 $1.94 $2.00
$1.87 $1.92 $1.98
2015 2016 2017 2018
HFA SFA Admin.
Fiscal YearBillions
Actual
23

January 2016 Consensus Conference
Net CIT/MBT Revenue Estimates
$0.07
$0.40
$0.53
$0.44
$0.13
$0.42
$0.53
$0.08
$0.40
$0.53
2015 2016 2017 2018
HFA SFA Admin.
Fiscal YearBillions
Actual
24

January 2016 Consensus Conference
Net CIT Revenue Estimates
$1.11 $1.15 $1.17$1.08 $1.14 $1.16 $1.17$1.11 $1.14 $1.17
2015 2016 2017 2018
HFA SFA Admin.
Fiscal YearBillions
Actual
25
January 2016 Consensus Conference
Net MBT Revenue Estimates
-$1.03
-$0.74-$0.64-$0.64
-$1.00
-$0.74-$0.64
-$1.03
-$0.74-$0.64
2015 2016 2017 2018
HFA SFA Admin.
Fiscal YearBillions
Actual
26
January 2016 Consensus Conference
Michigan Business Tax & Certificated Credits
• The MEDC/Treasury system to track certificated credits is working well.
• MEDC notifies Treasury when a business qualifies for a certificated credit.
• Treasury builds this information into their revenue estimates.
• Businesses must file the certificate with Treasury to receive a refund.
• However, some certificates are not filed as soon as expected.
27
January 2016 Consensus Conference
Estimating MBT Net Refunds
• In FY15, MBT net refunds were $112 million short of the May estimate.
• This reflects a timing issue, not a reduction in MBT refunds.
• Most of the $112 million in credits have already been filed in FY16.
• While MBT net refunds were smaller in FY15 by $112 million, they will be up by $112 million in FY16.
28
January 2016 Consensus Conference
Insurance Tax
• Insurance companies pay into several special funds to help pay certain benefits.
• The Insurance Tax provides insurance companies credits for many of these payments.
• PA 204 of 2012 (amended Insurance Code) moved the administration of one of these funds from the Secretary of State to the MAIPF.
• No credit was provided for the payments to the Secretary of State, but payments to a fund administered by the MAIPF has qualified and continues to qualify for a tax credit.
29
January 2016 Consensus Conference
Insurance Tax (continued)
• In FY15, insurance companies began claiming credits for their old and new payments to the MAIPF.
• This reduced insurance tax collections $60 million in FY15 and will reduce them an estimated $80 million in FY16 and after.
30
January 2016 Consensus Conference
GF-GP and School Aid Fund Revenue
31
• Growth rate comparisons.• Level comparisons. • Budget Stabilization Fund calculation.• Constitutional Revenue Limit calculation.

January 2016 Consensus Conference
GF-GP and School Aid Revenue
Baseline Growth Rates Before Tax Changes
Average Agency Forecasts32
1.1%
-2.7%
2.9%
6.5%
8.3%
6.0% 6.1%5.5% 5.9%
7.9%
6.1%
-1.7%-1.3%-0.9%
1.9%
3.8%
1.0% 1.1%
2.6%
-10.5%
-2.1%
7.1%
4.5%
7.4%
5.0% 5.1%
2.6%
3.0%2.9%

January 2016 Consensus Conference
GF-GP Net Revenue Growth
-3.5%
3.9% 3.8%
11.3%
-2.1%
2.7%3.9%
-0.8%
3.9% 3.5%
2015 2016 2017 2018HFA SFA Admin.
Fiscal Year Growth
Actual
33

January 2016 Consensus Conference
GF-GP Net Revenue Estimates
$9.69
$10.07$10.46
$10.03 $9.95
$10.22$10.62
$9.96
$10.35$10.71
2015 2016 2017 2018
HFA SFA Admin.
Fiscal YearBillions
Actual
34

January 2016 Consensus Conference
School Aid Fund Net Growth
2.9% 2.8% 2.9%
1.7%
3.0%2.5% 2.6%
3.7%
3.2%
2.9%
2015 2016 2017 2018
HFA SFA Admin.
Fiscal Year Growth
Actual
35

January 2016 Consensus Conference
School Aid Fund Net Revenue Estimates
$12.08$12.42
$12.78
$11.75$12.12 $12.42
$12.74$12.18
$12.57$12.93
2015 2016 2017 2018
HFA SFA Admin.
Fiscal YearBillions
Actual
36

January 2016 Consensus Conference
Major Revenue Estimate Revisions Compared to May Estimates
• $112 million in MBT refunds were moved from FY15 to FY16.
• Additional credits being claimed by insurance companies is reducing insurance tax: $60 million in FY15 and $80 million in FY16 and after.
• Tax litigation court decisions are reducing use tax $60 million in FY16, $15 million in FY17 and $25 million in FY18 and MBT $18 million in FY16.
37

January 2016 Consensus Conference
Major Revenue Estimate Revisions Compared to May Estimates (continued)
• Larger lottery jackpots will boost lottery revenuean estimated $20 million.
• Newly enacted data center sales and use tax exemptionwill reduce revenue $11 million in FY16, $15 million in FY17 and $16 million in FY18.
38
January 2016 Consensus Conference
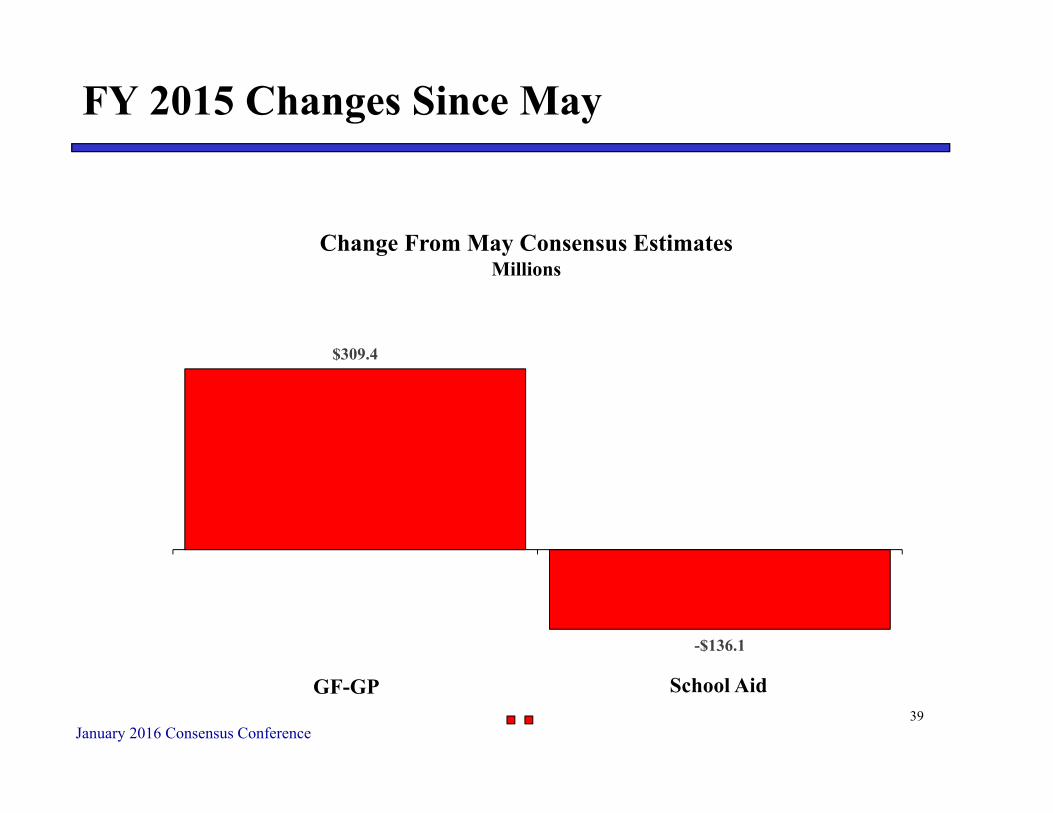
FY 2015 Changes Since May
Change From May Consensus EstimatesMillions
39
$309.4
-$136.1
GF-GP School Aid
January 2016 Consensus Conference
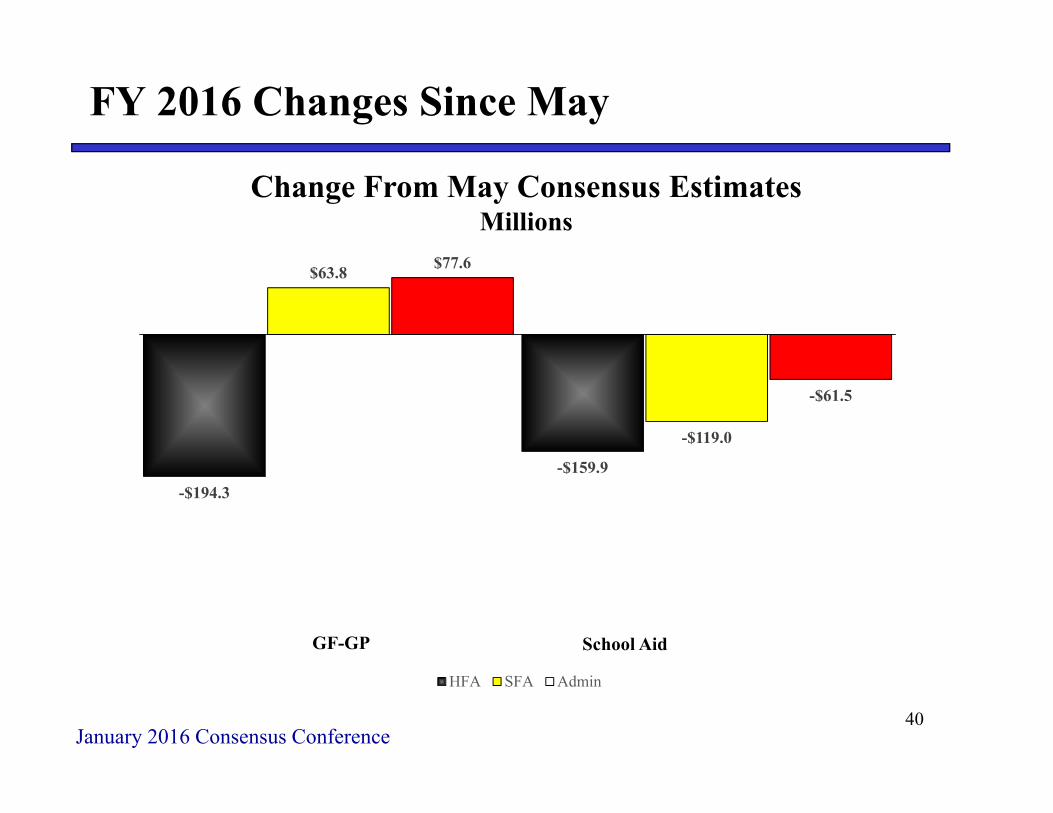
FY 2016 Changes Since May
Change From May Consensus EstimatesMillions
40
-$194.3-$159.9
$63.8
-$119.0
$77.6
-$61.5
HFA SFA Admin
GF-GP School Aid
January 2016 Consensus Conference
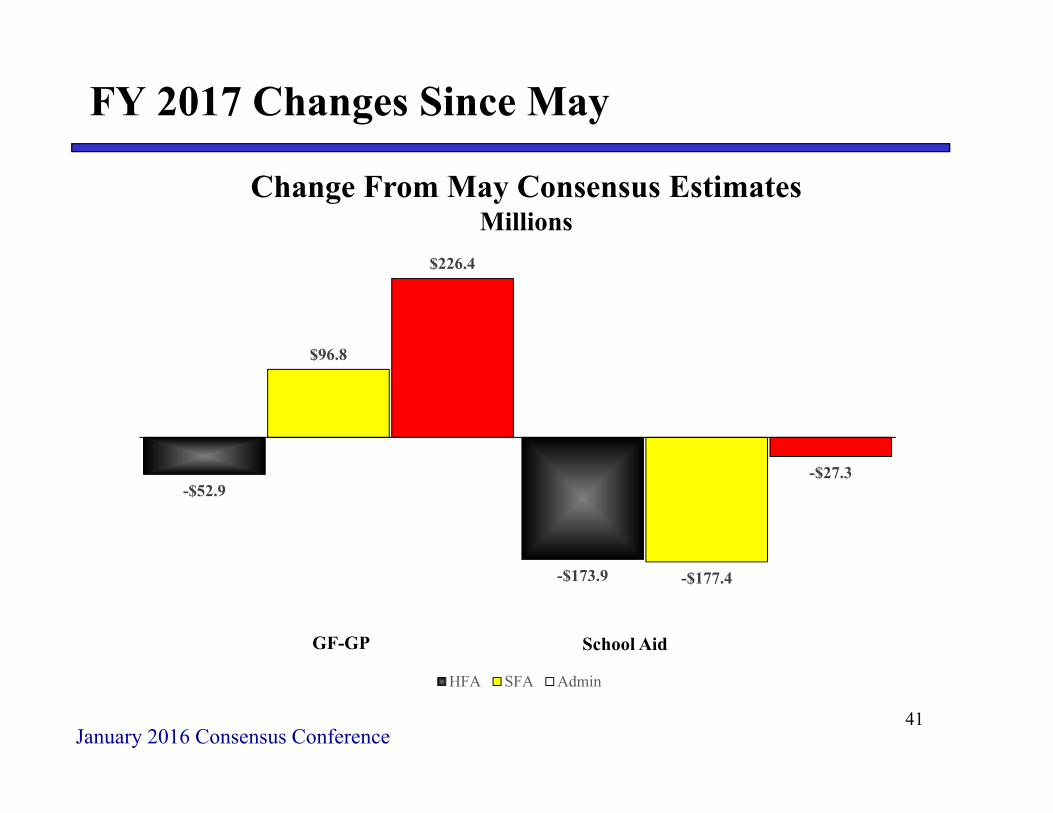
FY 2017 Changes Since May
Change From May Consensus EstimatesMillions
41
-$52.9
-$173.9
$96.8
-$177.4
$226.4
-$27.3
HFA SFA Admin
GF-GP School Aid

January 2016 Consensus Conference
Revenue Forecast Comparison
Millions
42
FY 2016 FY 2017 FY 2018House Senate House Senate House SenateFiscal Fiscal Fiscal Fiscal Fiscal Fiscal
Revenue Treasury Agency Agency Treasury Agency Agency Treasury Agency Agency
GF-GP $9,959 $9,688 $9,946 $10,348 $10,069 $10,218 $10,714 $10,455 $10,619
School Aid $12,181 $12,083 $12,124 $12,572 $12,425 $12,421 $12,934 $12,780 $12,740
Combined $22,140 $21,771 $22,070 $22,919 $22,493 $22,640 $23,649 $23,235 $23,359
Difference From May
GF-GP $77 ($194) $64 $226 ($53) $97 --- --- ---School Aid ($62) ($160) ($119) ($27) ($174) ($177) --- --- ---Combined $16 ($354) ($55) $199 ($227) ($81) --- --- ---
MayGF-GP $9,882 $9,882 $9,882 $10,122 $10,122 $10,122 --- --- ---School Aid $12,243 $12,243 $12,243 $12,599 $12,599 $12,599 --- --- ---

January 2016 Consensus Conference
Budget Stabilization Fund
• In FY 2016, the Agencies estimate pay-ins from $246 to $265 million.
• In FY 2017, the Agencies estimate pay-ins ranging from $171 to $229 million.
• In FY 2018, the Agencies estimate pay-ins ranging from $0 to $58 million.
• No BSF pay-outs are estimated by any of the Agencies during FY 2016, FY 2017 or FY 2018.
43
January 2016 Consensus Conference
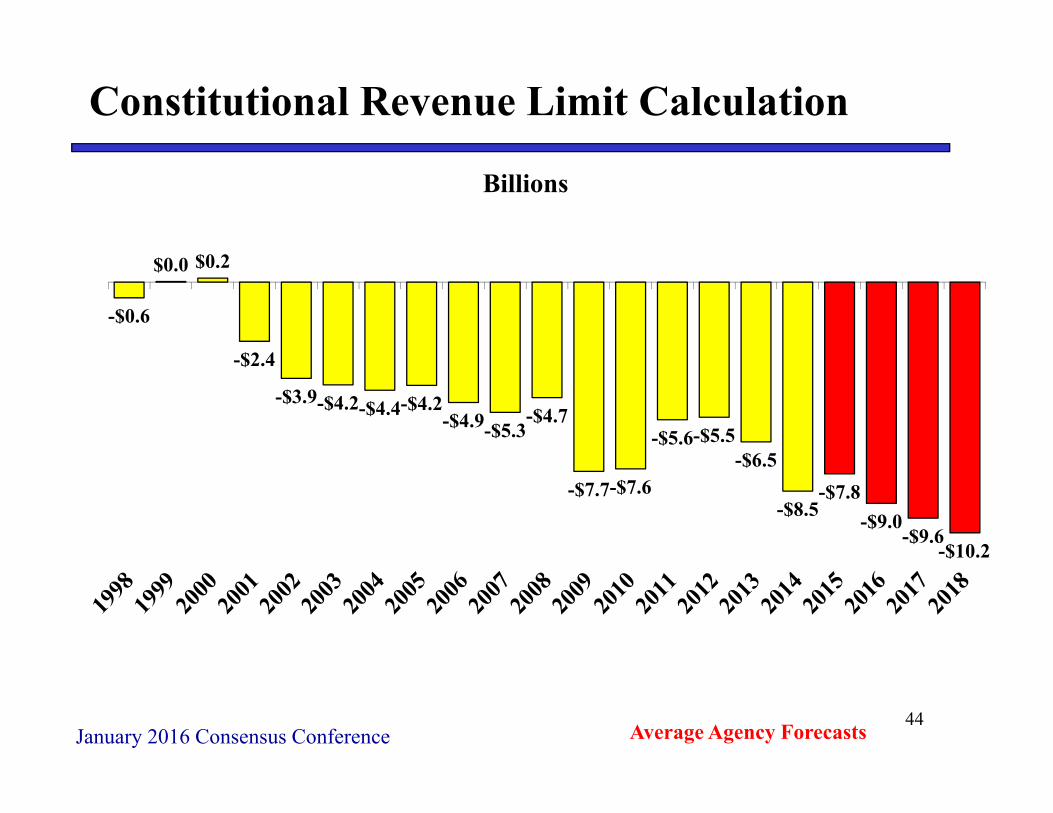
Constitutional Revenue Limit Calculation
Billions
-$0.6
$0.0 $0.2
-$2.4
-$3.9-$4.2-$4.4-$4.2-$4.9-$5.3
-$4.7
-$7.7-$7.6
-$5.6-$5.5-$6.5
-$8.5-$7.8
-$9.0-$9.6
-$10.2
Average Agency Forecasts 44

January 2016 Consensus Conference
Forecast Risks
• International issues (political and economic)• At what pace will Fed raise interest rates?• Oil price uncertainty• How will consumers react to international issues,
interest rate increases, oil price changes, etc. and how will this impact sales tax?
• Housing: will more consumers take on financial commitment?
• MBT, CIT, Insurance Tax uncertainty• Income Tax Annual Payments
45
January 2016 Consensus Conference
Economic and Revenue ForecastsFY 2016 * FY 2017 * FY 2018
Consensus Revenue Estimating ConferenceJanuary 14, 2016