Economic Analysis of Vegetation Management Practices · The coordination of PGRs applications and...
86
1 Economic Analysis of Vegetation Management Practices NCDOT Project 2016-17 FHWA/NC/2016-17 July 2017 James B. Martin, MCE, PE Joyendu Bhadury, PhD Brittany V. Gaustad, MPP Institute for Transportation Research & Education North Carolina State University Research IV, 909 Capability Dr. Raleigh, NC 27606 School of Business and Management The College at Brockport, State University of New York 350 New Campus Drive Brockport, NY 14420
Transcript of Economic Analysis of Vegetation Management Practices · The coordination of PGRs applications and...
1
Economic Analysis of Vegetation
Management Practices
NCDOT Project 2016-17
FHWA/NC/2016-17
July 2017
James B. Martin, MCE, PE
Joyendu Bhadury, PhD
Brittany V. Gaustad, MPP
Institute for Transportation Research & Education
North Carolina State University
Research IV, 909 Capability Dr.
Raleigh, NC 27606
School of Business and Management
The College at Brockport, State University of New York
350 New Campus Drive
Brockport, NY 14420

2
Technical Report Documentation Page
1. Report No. FHWA/NC/20016-17
2. Government Accession No.
… …
3. Recipient’s Catalog No.
… …
4. Title and Subtitle 5. Report Date
July 2017
Economic Analysis of Vegetation Management Practices 6. Performing Organization Code
… …
7. Author(s)
James B. Martin, PE
Joyendu Bhadury, PhD
Brittany V. Gaustad, MPP
8. Performing Organization Report No.
… …
9. Performing Organization Name and Address 10. Work Unit No. (TRAIS)
… …
Institute for Transportation Research & Education
North Carolina State University
Centennial Campus, Box 8601
Raleigh, NC 27695-8601
School of Business and Management
The College at Brockport, State University of New York
350 New Campus Drive
Brockport, NY 14420
11. Contract or Grant No.
… …
12. Sponsoring Agency Name and Address
Research and Development Unit
13. Type of Report and Period Covered
Report
104 Fayetteville Street
Raleigh, North Carolina 27601
August 1, 2015 – July 31, 2017
14. Sponsoring Agency Code
2016-17
Supplementary Notes:
… …
16. Abstract
The purpose of this study was to conduct a thorough evaluation of the mechanical, chemical and cultural components of all
vegetation management operations and their governing organizational structures to determine cost-effective practices and
efficient administrative procedures and structures. The research problem being investigated is how to reduce costs associated
with vegetation management as well as how to administer the vegetation management program within the NCDOT more
effectively. The research design used was mixed methods, with a quantitative cost analysis, as well as qualitative interviews,
peer state comparisons, and gathering relevant background information. The major conclusion that resulted from this study
is that it would be cost-effective to replace one mowing cycle by one PGR application cycle, which would result in an
estimated $2.5 million in yearly savings.
17. Key Words
Vegetation management, mowing, PGR, PGRs, plant
growth regulators, cost analysis, herbicides,
practices, organizational structure. As a minimum,
list a few keywords selected from Transportation
18. Distribution Statement
… …
3
Research Thesaurus available for download at:
http://www.infodesigns.com/files.html
19. Security Classif. (of this report)
Unclassified
20. Security Classif. (of this page)
Unclassified
21. No. of Pages
…fill in…
22. Price
… …
Form DOT F 1700.7 (8-72) Reproduction of completed page authorized
DISCLAIMER The contents of this report reflect the views of the author(s) and not necessarily the views
of the University. The author(s) are responsible for the facts and the accuracy of the data
presented herein. The contents do not necessarily reflect the official views or policies of
either the North Carolina Department of Transportation or the Federal Highway
Administration at the time of publication. This report does not constitute a standard,
specification, or regulation.

4
Acknowledgements
This research would not have been possible without our partners at the NCDOT Roadside
Environmental Unit, including NCDOT Roadside Environmental Division Staff. Steve Bert was also a
valuable contributor to this study. J. Douglas Small III, as well as Christian Conrad, were also
instrumental in completing the cost analysis section of the report. Rui Yang provided GIS analytics
expertise which was helpful in creating the maps showing types of turf around North Carolina. The
research team would like to thank all involved in this research.

5
Executive Summary
Background
The current study was conceptualized to document and analyze effective coordination of turf
management by NCDOT inclusive of the Road Environmental Unit and the Roadside
Environmental and Roadway Maintenance Division staff. This study was completed by
researchers from North Carolina State’s (NCSU) Institute for Transportation Research and
Education (ITRE) and State University of New York at Brockport with funding from the
NCDOT.
Process
The duration of this research project was two years. The approach for this research includes
mixed methods, including a quantitative cost analysis as well as qualitative interviews, gathering
relevant background information, and peer state comparisons. The data was collected from the
NCDOT, from online searches, and interviews were completed either over the telephone/email or
in person at various locations across North Carolina.
First, a literature review and a document review of pertinent states was completed (i.e. Alabama,
Kentucky, North Carolina, Texas). Next, a cost analysis was completed using NCDOT data in
order to identify areas for potential cost savings, specifically relating to the mowing and PGR
data. Seventeen interviews were completed with NCDOT Roadside Environmental staff. A
benchmarking analysis was completed by comparing NCDOT vegetation management practices
to those of three other states (Alabama, Kentucky and Texas).
Research Findings
Generally, it appears that NCDOT operates an efficient and cost effective roadside vegetation
management system and utilizes many best practices identified in this study. This research
concluded with seven findings as described below.
Two findings come from peer state analysis:
1. NCDOT’s annual budget for roadside vegetation management is comparable to Texas,
with Alabama and Kentucky reporting less extensive road networks and corresponding
lower budgets in comparison to North Carolina.

6
2. The literature review and peer state interviews lent support for including eco-regional
approaches into integrated vegetation management plans and implementing regular,
mandatory training for vegetation management professionals.
The remaining five findings followed from a review of the literature, interviews, data
collection, cost analysis, and document review.
3. Replacing one mowing cycle with an additional PGR application cycle on all systems
may result in cost savings of $2.5 million annually. The most significant savings are
associated with the implementation of PGR applications on secondary roads. That may
result in a savings of $1.4 million per year primarily from reduce mowing costs.
4. The coordination of PGRs applications and mowing is critical for maximizing the
benefits of PGRs. The passage of House Bill 97 consolidated responsibilities for
vegetation management from Roadside Maintenance and Roadside Environmental Units
into one, with responsibility for all vegetation management practices administered solely
by Roadside Environmental staff.
5. While secondary roads are mowed more frequently, interstates and primary roads are
more likely to be applied with PGR applications. In addition, March through July are the
most common times that PGRs are applied, with most division staff reporting that
applying PGRs is associated with one less mowing cycle, with some believing applying
PGRs can save two mowing cycles.
6. Inconsistencies were found between the purchase order data and the NCDOT fiscal data,
as well as between fiscal years. This suggests potentially inconsistent cost reporting.
7. Division staff cited the following barriers to increasing the coverage and number of PGR
applications: too few personnel, budgetary restrictions, not enough equipment, and
having a limited time window for successful PGR applications.
Recommendations
Five recommendations follow from this research and correspond to the findings.
1. Consider the use of one additional PGR application cycle across all systems, including
secondary, to accrue potential cost savings.
7
2. Continue to monitor the effective coordination between mowing and PGR applications,
with the help of the Roadside Vegetation Management Tool to monitor costs of
vegetation management practices.
3. Additional consideration should be given to effectively integrate eco-regional approaches
into vegetation management practices as described by the benchmarking with peer states
analysis as well as the literature review.
4. Standardize cost reporting practices for mowing and PGR applications. This could help
make NCDOT fiscal data more consistent across fiscal years. For example, one division
representative mentioned during interviews that in FY 2015, they used function code
2908 (“Brush and Tree Control”) a lot to report turf management, rather than function
code 2904 (“Turf Management”). Standardizing these reporting practices can facilitate a
more precise analysis in the future.
5. Consider ways to mitigate the most commonly mentioned barriers to the increased
application of PGRs in interviews with NCDOT staff. An increase in staff and
equipment, as well as additional contracted services, are options to be considered.
Further research may identify other methods to manage different types of turf in order to
maximize cost-effectiveness and efficiency.

8

9
Table of Contents
Introduction ................................................................................................................................................. 12
Literature Review ........................................................................................................................................ 14
NCDOT Roadside Environmental Operations and Organizational Structure ............................................. 21
NCDOT Mowing Contract Administration ................................................................................................ 26
Benchmarking with Peer States .................................................................................................................. 28
NCDOT Division Vegetation Management Practices ................................................................................ 32
Vegetation Management Practices Cost Analysis....................................................................................... 34
Inconsistencies in the Data .......................................................................................................................... 40
Research Findings ....................................................................................................................................... 43
Recommendations ....................................................................................................................................... 46
Close-out Implementation Plan ................................................................................................................... 49
References ................................................................................................................................................... 52
Appendices .................................................................................................................................................. 54
10
List of Tables
Table 1 Cost savings by state associated with switching to an integrated vegetation management plan in
lieu of one without the use of herbicides. ................................................................................................... 20
Table 2 The number of counties in each NCDOT division, displayed by division numbers ...................... 22
Table 3 Turf management maintenance program descriptions from the NCDOT website. ........................ 24
Table 4 Descriptions of methods used for woody vegetation management from the NCDOT website. .... 25
Table 5 Size and budget of other DOTs. ..................................................................................................... 29
Table 6 Organizational structure of other DOTs. ....................................................................................... 29
Table 7 Average turf type percentages by road system. ............................................................................. 32
Table 8 PGR use and average mowing cycles by road system ................................................................... 33
Table 9 Summary of overall average costs for divisions by road system, per cycle per shoulder mile. ..... 36
Table 10 Predicted savings accrued by replacing one mowing cycle with one PGR application cycle. .... 37
Table 11 Total shoulder mileage for mowing by road type. ....................................................................... 38
Table 12 Per cycle shoulder mileage for mowing and applying PGRs. ...................................................... 38
Table 13 Brush and tree total costs from 2014 to 2016. ............................................................................. 39
Table 14 Brush and tree total costs by road type and type of charge .......................................................... 39
Table 15 Brush and tree averages per mile by system. ............................................................................... 40
Table 16 Turf types in interstate systems separated by division number.................................................... 62
Table 17 Turf types in primary roadway systems separated by division. ................................................... 63
Table 18 Turf types in secondary roadway systems separated by division. ............................................... 64
Table 19 Times of year in which PGRs are applied to roads, by each division of NC. .............................. 67
Table 20 The number of mowing cycles that division roadside environmental engineers believe can be
reduced by using PGRs. .............................................................................................................................. 68
Table 21 How often Broadleaf Control chemicals are used. ...................................................................... 72
Table 22 Time frames in which Broadleaf Control chemicals are applied by division number. ................ 72
Table 23 The types of treatments and procedures used to control vegetation around fixed objects. .......... 74
Table 24 The types of treatments and procedures used to control wooded species. ................................... 78
Table 25 How chemical treatment is coordinated with mechanical wooded species control. .................... 80
Table 26 NCDOT division responses to barriers to increasing the number of PGR applications. ............. 81
11
List of Figures
Figure 1 NCDOT organizational structure. ................................................................................................. 21
Figure 2 NCDOT Division Map. ................................................................................................................ 22
Figure 3 General NCDOT Roadside Environmental Unit Organizational Structure .................................. 23
Figure 4 Average Mowing Cost per Cycle per Shoulder Mile. .................................................................. 34
Figure 5 Average PGR Application Cost per Cycle per Shoulder Mile. .................................................... 35
Figure 6 Ratio of Average Cost per Cycle per Shoulder Mile .................................................................... 36
Figure 7 Interstate mowing costs comparing purchase order data to NCDOT's financial data. ................. 40
Figure 8 Primary mowing costs comparing purchase order data to NCDOT's financial data. ................... 41
Figure 9 Secondary mowing costs comparing purchase order data to NCDOT's financial data. ............... 41
Figure 10 Interstate mowing costs across fiscal years 2014, 2015 and 2016 .............................................. 42
Figure 11 Primary mowing costs across fiscal years 2014, 2015 and 2016................................................ 42
Figure 12 Secondary mowing costs across fiscal years 2014, 2015 and 2016............................................ 43
Figure 13 The percentage of participants who use PGRs on interstates. .................................................... 65
Figure 14 The percentage of participants who use PGRs on primary roads. .............................................. 66
Figure 15 The percentage of participants who use PGRs on secondary roads. .......................................... 66
Figure 16 Percentages of participants who believe that PGRs reduce the number of mowing cycles........ 68
Figure 17 Percentages of the number of mowing cycles completed yearly on interstates. ......................... 69
Figure 18 Percentages of the number of mowing cycles completed yearly on primary roads. ................... 70
Figure 19 Percentages of the number of mowing cycles completed yearly on secondary roads. ............... 70
Figure 20 The percentage of interview participants that use selective chemicals versus those that use non-
selective chemicals ...................................................................................................................................... 75
Figure 21 Treatments and procedures used to control vegetation around fixed objects, with selective and
non-selective chemical treatments distinguished. ....................................................................................... 76
Figure 22 Treatments and procedures used to control vegetation around fixed objects, with selective and
non-selective chemicals grouped together. ................................................................................................. 77
Figure 23 The types of treatments and procedures used to control wooded species .................................. 79
Figure 24 The number of responses to whether the number of cycles of PGRs would be increased if
barriers were overcome. .............................................................................................................................. 83
Figure 25 The number of PGR application cycles that NCDOT division representatives reported that they
would implement if barriers were overcome. ............................................................................................. 84
Figure 26 The desired change in PGR cycles as reflected in interviews . .................................................. 84

12
Introduction Vegetation growth along highways is a significant maintenance issue for transportation
departments, since poorly managed vegetation can have adverse impacts on roadways due to
increased risks to traffic and premature deterioration of the road system infrastructure. In
addition, budget cuts make it challenging to maintain vegetation along roadways with fewer staff
and limited resources. Furthermore, public awareness of environmental impacts associated with
vegetation management has given rise to the development of Integrated Roadside Vegetation
Management Programs (IRVMPs) across the United States. The North Carolina Department of
Transportation (NCDOT) defines the IRVMP as “a decision making and quality management
process for maintaining roadside vegetation that integrates… [the] needs of local communities
and highway users, knowledge of plant ecology processes, design, construction, and maintenance
considerations, monitoring and evaluation procedures, government statutes and regulations, and
technology with cultural, biological, mechanical, and chemical pest control methods to
economically manage roadsides for safety plus environmental and visual quality” (p. 1).
The NCDOT has also adopted an IRVMP, but its implementation can be significantly
enhanced through the study of costs attributable to each practice associated with vegetation
management. Comprehensive cost and effectiveness data are not readily available for practices
such as mowing, herbicidal applications, tree trimming, brush control etc. especially when
broken down by different types of vegetation (e.g. trees, weeds, brush and different types of turf
grasses such as fescue, zoysia, etc.).
The need for data-based cost-effectiveness measures is imperative because in North
Carolina, the legislature has been placing an emphasis on needs-based budgeting. This further
underscores the requirement for a complete understanding of current vegetation management
procedures being employed by NCDOT, as well as the inter-organizational relationships that are
currently in place to manage them across the state’s 14 divisions. In addition, it is also imperative
to have reliable cost and effectiveness data associated with each vegetation management
practice. It is only with this knowledge that NCDOT can develop and enact cost-effective and
need-based vegetation management budgets that are grounded in reliable data.
In line with this identified need, the goal of this study is to complete a thorough
evaluation of the mechanical, chemical and cultural components of vegetation management
operations related to turf and woody vegetation in order to determine cost-effective practices as
well as efficient administrative procedures and structures.
Research Approach
The methodology for this study included gathering and analyzing data on various turf
types and vegetation management practices as well as cost-effectiveness data that were obtained
by completing in-person as well as emailed interviews with 14 roadside environmental
engineers, interviews with NCDOT vegetation management administrators, and an interview
with a vegetation management professional at Duke Energy. A literature review and a document
analysis (e.g. NCDOT website) were also completed. Appendix A displays a list of interviewees
and Appendix B shows the interview questions. As a part of the cost analysis, NCDOT cost data
was utilized to construct a NCDOT Cost Effectiveness Tool and to compare costs of mowing and
herbicidal applications per shoulder mile, as well as per cycle per shoulder mile. NCDOT
13
division contracts were also analyzed to gather relevant data regarding organizational structure
and vegetation management procedures.

14
Literature Review
In the United States, there are over 17,000,000 acres of roadside that need regular
vegetation management. The NC road system alone has one of the most extensive highway
systems in the United States, with 80,000 total miles of road (NCDOT, 2017). As stated in the
introduction, vegetation management practices have to balance a plethora of factors such as
ensuring the long-term performance of highways, minimizing environmental impact, and
operating with decreasing budget resources. Traditionally, roadside vegetation management has
been divided into two separate approaches: mow and apply pesticides or encourage native
growth. These two approaches are also referred to as agricultural (Harper-Lore, Johnson &
Skinner 2007) and eco-regional (Harper-Lore et al., 2013), respectively. More recently, in
response to the complexities surrounding vegetation management, roadside managers across the
United States have begun to utilize an Integrated Roadside Vegetation Management Program,
which holistically combines traditional vegetation management approaches such as mowing and
pesticide application, with eco-regional approaches. Two excellent references on the subject are
Berger (2005), which includes a compendium of best practices across the country, and also the
Integrated Roadside Vegetation Management Technical Manual available from the University of
Northern Iowa (Brandt, Henderson, & Uthe, 2015).
There are several common ways in which vegetation can be controlled on roadsides
including cultural, biological, mechanical, chemical, and combinations thereof. Common
methods include hand cutting, mowing, and herbicide application (Jackson & Finley, 2007;
Johnstone, 2008). Herbicides may be applied in a variety of ways including basal bark, basal
soil, cut stump, foliar, hack and squirt, and stem injection. Another class of pesticides, plant
growth regulators, commonly referred to as PGRs, may also be used to suppress turf grasses in
order to reduce the intensity of management needed. Timely plant growth regulator applications
can save significant time and money put towards mowing.
Woody vegetation must also be managed on roadsides. Many woody species produce
stump sprouts including common North Carolina hardwoods such as black locust (Robinia
pseudoacacia), red maple (Acer rubrum), sweetgum (Liquidambar styraciflua), yellow poplar
(Liriodendron tulipifera), etc. Stump sprouts are a common occurrence after mechanical cuts
leave a hardwood stump. Cut stump herbicide applications can be used to combat this problem
(Haymond & McNabb, 1994) or intensive and indefinite mowing may be required. One major
advantage to this technique is that it works on invasive hardwoods and woody vine species of
various sizes with the exception of stems less than half an inch diameter.
Finally, it is also important to note that absent efficient organizational structures and clear
and well managed processes, even the cost effective solutions are doomed to suffer, leading to
degraded organizational performance (Nair, 2006). Therefore, it is important that the
development of cost-effective vegetation management strategies be accompanied with
corresponding recommendations about efficient organizational structures and procedures to
implement them.
Methods for Vegetation Management

15
Methods used for vegetation management include the following categories: (1)
mechanical, (2) chemical, (3) cultural, (4) biological (Gover, Johnson & Kuhns, 2007), and (5)
indirect strategies (Bennett, n.d.).
Mechanical. Mechanical approaches include mowing, string trimming, cat excavation,
mechanical mulchers, brush cutters, and other mechanized forms of weed control (Bennett, n.d.).
Tillage, ripping, and subsoiling are also included in this definition (Bennett, n.d.), as well as
grubbing (Gover et al., 2007). This method involves the use of mechanical equipment to crush,
chop, or break apart tree saplings and brush, which leaves behind organic matter from plants on
the ground (Bennett, n.d.). Gover et al. (2007) recommend cutting turf between 4 to 8 inches
from the ground in order to minimize stress to turf species, which will allow them to more
effectively compete against the weeds, stabilize the soil, and enhance the effectiveness of
herbicide applications. If turf is mowed too soon following an herbicide application, this could
make the herbicide application less effective, particularly if the chemical treatment has not yet
had a chance to move into the target weed species (Gover et al., 2007). It is recommended to use
PGRs following mechanical work in order to prevent the species from growing back; for
example, following either trimming branches or cutting a tree down, the application of PGRs
prevents it from growing back (Gover et al., 2007). Mulching and brush cutting helps to retain
organic matter and soil moisture, which facilitates growth and health in desirable plant species
(Bennett, n.d.).
Chemical. Chemical approaches to vegetation management can be classified into several
different categories, including selective/non-selective, pre-emergent/post-emergent, foliar-
applied/soil-applied, and based upon the type of plant species targeted (Gover et al., 2007).
Chemicals used are either selective or non-selective. Selective chemicals damage or kill
unwanted plants while allowing desirable plants to remain (PSCAS, 2016). Examples of
selective herbicides include triclopyr and some plant growth regulators. In contrast, non-selective
chemicals kill or damage any plants in a given area without specifically targeting the species that
is considered to be a nuisance (PSCAS, 2016). An example of a non-selective herbicide is
glysophate (i.e. Round Up) (PSCAS, 2016). Duke (1990) described the mechanisms of action of
herbicides, and wrote that many types of herbicides act through the inhibition of photosynthesis,
while others inhibit lipid synthesis, particularly with monocot weeds (e.g. Fescue). According to
Duke (1990), “in addition to site of action structure-activity relationships, herbicide structure and
chemical properties also strongly influence absorption, translocation, bioactivation, and
environmental stability” (p. 1). In other words, there are a variety of factors to consider regarding
the effectiveness of herbicidal applications.
Chemical approaches can also be divided into pre-emergent or post-emergent categories.
Pre-emergent chemicals are applied prior to the growth of the plant, while post-emergent
chemicals are applied following plant growth (NCDOT Roadside Environmental Unit, n.d.;
PSCAS, 2016). An example of a pre-emergent herbicide includes plant growth regulators. An
example of a post-emergent herbicide is glysophate (i.e. Round Up).
Herbicides can also be classified based upon whether they are foliar- or soil-applied.
According to Penn State College of Agricultural Sciences (2016), “post-emergence herbicides
are usually foliar applied, whereas pre-emergence herbicides are soil applied” (p. 1). Of course,

16
there are also different herbicides that would be appropriate depending upon the type of plants
dealt with (e.g. wooded species and broadleaf control chemicals).
Chemical sprayers are often used to apply herbicides to manage roadside vegetation over
large areas and can include truck sprayers and handheld sprayers, among others (Holland, 2013).
The term “surfactant” is a shortened version of the term “surface active agent,” and refers to
chemicals added to herbicides to increase their effectiveness (Lincoln County Noxious Weed
Control Board, n.d.). Specifically, surfactants used for vegetation management along with
herbicides work by spreading, sticking, and/or penetrating the herbicide into the plant, as well as
by making it more difficult for weather conditions to prevent the uptake of the chemical (Lincoln
County Noxious Weed Control Board, n.d.).
CSU Agricultural Sciences (2014) found that the application of PGRs resulted in a
reduced amount of clipping and mowing needed. In addition, PGRs were associated with an
improved quality of turf species, reduced costs of maintenance, and the reallocation of labor
(CSU Agricultural Sciences, 2014).
Biological. Biological approaches to vegetation management involve introducing an
advantageous organism to an area in order to target an undesirable organism (Gover et al., 2007).
This approach to vegetation management includes the introduction of a disease, fungus, or insect
to control weeds (Bennett, n.d.; Gover et al., 2007). Biological approaches usually involve the
reduction in the mass of targeted plants rather than completely destroying them, and it is
important to coordinate biological control efforts with the North Carolina Department of
Agriculture (Bennett, n.d.).
Indirect/Cultural. Indirect approaches to vegetation management, also referred to as
cultural methods, involve applying principles of weed ecology to modify the environment to
make it less amenable to undesirable plant species (Bennett, n.d.). Gover et al. (2007) noted that
“a well-established groundcover is the best line of defense against weed and brush
encroachment” (p. 2), and that the revitalization of turf should be completed following erosion or
roadside maintenance activities. This means ensuring that topsoil is still present and that it is not
smoothed from the vegetation management equipment (Gover et al., 2007). Incorporating
fertilizer into apply applications, as well as mowing high, can also help to facilitate the growth of
desirable vegetation (Gover et al., 2007). Cultural approaches to vegetation management
“enhance the growth of desirable vegetation, or prevent weed growth and establishment” (Gover
et al., 2007, p. 1). This approach could involve the introduction of more shade to a particular area
and/or the application of a thick layer of organic matter, since many undesirable plant species
have a harder time growing in shade and organic material (Bennett, n.d., p. 7). Thoroughly
cleaning and sanitizing equipment between locations, as well as utilizing soil from areas without
weeds, are two ways to prevent weed establishment (Bennett, n.d.). Bennett noted that indirect
approaches to vegetation management can be cost-effective.
Integrated Roadside Vegetation Management Programs (IRVMPs). Integrated
Vegetation Management approaches involve the coordination of a multi-faceted program to
control problematic plant species (Gover et al., 2007). For example, the Idaho Transportation
Department’s IRVMP involves the consideration of mechanical, biological, cultural, and
chemical methods of control based upon ecological impacts, impacts to human health, cost-
effectiveness, and feasibility considerations (2013). The goal of the Idaho IRVMP is to
17
“[provide] safe and reliable transportation, [maintain] infrastructure investments, [operate]
within budget and personnel limitations, and [to minimize] environmental impacts” (ID
Transportation Department, 2013, p. 1). Similarly, the Pennsylvania DOT involves four
components – mechanical, cultural, biological, and chemical – and it is noted that the chemical
approaches taken under their Integrated Vegetation Management Plan is the most cost-effective
(Gover et al., 2007). North Carolina currently has an IRVMP in which “decisions to utilize
herbicides are made after cultural or biological control methods have been evaluated” (NCDOT
Roadside Environmental Unit, n.d.). IRVMPs, as illustrated by the two examples listed, typically
involve evaluating various methods to vegetation management to use the most effective approach
with the least adverse environmental impact.
Economic Analyses of Roadside Vegetation Management
According to an analysis of the PennDOT Herbicide Program Overview, their herbicide
program is the most cost-effective element of PennDOT’s vegetation management program as
compared to mechanical, cultural, and biological techniques (Gover et al., 2007). While
herbicide treatments are most often used by PennDOT, herbicidal treatments are most effective
when used in tandem with other approaches for vegetation management (Gover et al., 2007). In
addition, it is not recommended to apply herbicides right before or after mowing (Gover et al.,
2007). A combination of herbicides is typically applied depending on the objective of the
program, and product cost is one element taken into consideration when assigning a Cost
Function Code (Gover et al., 2007). Selective weed and brush control can be used to control non-
woody broadleaf weeds and brush with just one application (Gover et al., 2007).
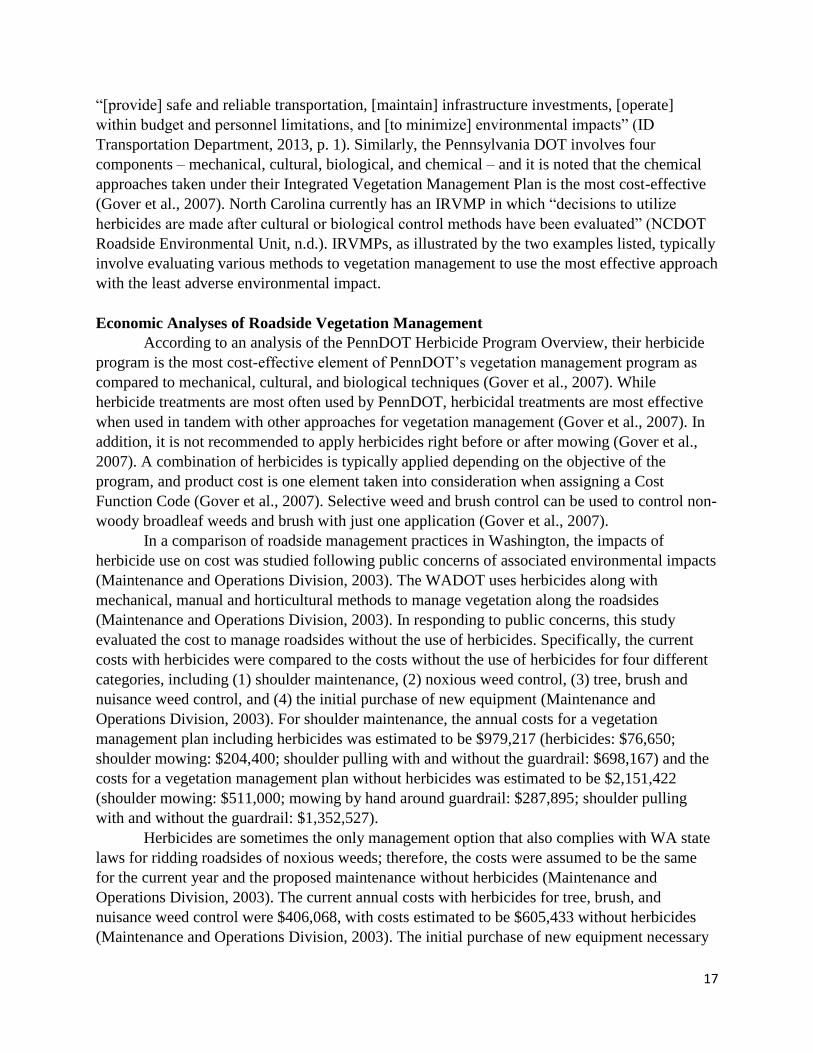
In a comparison of roadside management practices in Washington, the impacts of
herbicide use on cost was studied following public concerns of associated environmental impacts
(Maintenance and Operations Division, 2003). The WADOT uses herbicides along with
mechanical, manual and horticultural methods to manage vegetation along the roadsides
(Maintenance and Operations Division, 2003). In responding to public concerns, this study
evaluated the cost to manage roadsides without the use of herbicides. Specifically, the current
costs with herbicides were compared to the costs without the use of herbicides for four different
categories, including (1) shoulder maintenance, (2) noxious weed control, (3) tree, brush and
nuisance weed control, and (4) the initial purchase of new equipment (Maintenance and
Operations Division, 2003). For shoulder maintenance, the annual costs for a vegetation
management plan including herbicides was estimated to be $979,217 (herbicides: $76,650;
shoulder mowing: $204,400; shoulder pulling with and without the guardrail: $698,167) and the
costs for a vegetation management plan without herbicides was estimated to be $2,151,422
(shoulder mowing: $511,000; mowing by hand around guardrail: $287,895; shoulder pulling
with and without the guardrail: $1,352,527).
Herbicides are sometimes the only management option that also complies with WA state
laws for ridding roadsides of noxious weeds; therefore, the costs were assumed to be the same
for the current year and the proposed maintenance without herbicides (Maintenance and
Operations Division, 2003). The current annual costs with herbicides for tree, brush, and
nuisance weed control were $406,068, with costs estimated to be $605,433 without herbicides
(Maintenance and Operations Division, 2003). The initial purchase of new equipment necessary

18
to accomplish the additional mowing if herbicides are not used is around $1,303,000
(Maintenance and Operations Division, 2003). The additional annual costs associated with using
non-herbicidal methods is estimated to be $1,371,570, and when combined with the costs to
purchase new equipment, the projected initial cost would be $2,674,570 to transition from a
vegetation management plan to one without herbicides (Maintenance and Operations Division,
2003). Therefore, a vegetation management program including herbicides as well as other
approaches is more cost-effective when compared with a vegetation management program
without herbicides.
In another report completed in response to public concern surrounding the harm of
herbicides on non-targeted plants as well as aesthetics of an area, an assessment of mechanical
and herbicidal methods of managing roadside vegetation was published by the Texas DOT
(Brennan, 2012). Mechanical methods of removal for roadside vegetation were estimated to cost
between $1000 and $3000 per mile of road side treated, while herbicidal/chemical approaches of
removal for roadside vegetation were estimated to cost around $140 per mile of road side treated
(Brennan, 2012). Therefore, mechanical methods cost about 11 times more than herbicidal
methods (Brennan, 2012). The report did not estimate the total cost of each method because they
are based on cost per mile, which can vary year to year. Due to a tight budget and the findings
listed above, the TXDOT has begun to consider the use of herbicides as frequently as possible
(Brennan, 2012). Similarly, Louisiana found that it was best to use herbicides, unless there is an
immediate safety issue, in which case, mechanical methods are more appropriate (Brennan,
2012).
In one study focusing on alternative approaches to herbicides and mechanical methods in
managing roadside vegetation, the cost of citric acid, clove oil, corn gluten meal, and pelargonic
acid were estimated (Barker & Prostak, 2009). It was found that the cost of alternative herbicides
was higher than using conventional herbicides; retail prices and labor costs were more expensive
because alternatives had to be applied three or more times per year (Barker & Prostak, 2009).
Additionally, the cost of using bark or woodchip mulch was more expensive than mowing,
conventional and alternative herbicides, although it was most effective in weed prevention
(Barker & Prostak, 2009). In line with this finding, Bennett (n.d.) noted that while non-chemical
approaches to vegetation management may be viable, chemical applications are generally more
cost-effective in comparison. In addition, particular species may be next to impossible to control
without chemical applications (Bennett, n.d.). PGRs are associated with a reduction in fuel,
machinery, and labor costs (CSU Agricultural Sciences, 2014).
In another study that compared the cost-effectiveness of vegetation management plans
with and without chemical treatments, it was found that there were higher indirect costs for
mechanical and thermal control methods than for herbicide applications (Nowak et al., 2005). In
addition, all non-herbicide alternatives were less effective than herbicides, with the exception of
mulches, geotextiles, and solidifiers (Nowak et al., 2005). Through the creation of a cost-
effectiveness matrix, it was found that none of the non-herbicidal alternatives were as cost
effective as the conventional herbicide treatments (Nowak et al., 2005). In some categories,
Nowak et al. (2005) found that mulches, solidifiers and bioherbicides were more beneficial and
cost-effective when compared to herbicides, although the overall conclusion of the report found
conventional herbicides to be more cost effective when compared to non-herbicide treatments.

19
In a case study focusing on expenses associated with vegetation management approaches
with and without herbicides in Hillsborough County, Florida, mechanical mowing was estimated
to be $60/acre, and $2,340,000/year with six mowing cycles (Colorado State University
Agricultural Sciences, 2014). In contrast, herbicide applications were estimated at $35/acre and
$1,235,000/year with two mowing cycles and two herbicide applications (Colorado State
University Agricultural Sciences, 2014). The total estimated savings per year associated with the
use of herbicide in tandem with mowing amounted to $1,105,000 (Colorado State University
Agricultural Sciences, 2014). Overall advantages found by switching to herbicide application
with two mowing cycles included significant cost savings, reduced shoulder deterioration, a
decrease in complaints by citizens, and improved aesthetics and labor efficiency (Colorado State
University Agricultural Sciences, 2014).
The California DOT explored alternatives to herbicide applications and found that the
cost per volume of the natural products was lower than herbicides, but with more frequent
applications, the natural products turned out to be more expensive (Young, 2003). Natural-based
herbicide products most easily substituted for the traditional herbicides, but they damaged the
vegetation and required higher volumes of more frequent applications (3-5) to even be
comparable to the synthetic standard herbicide, glyphosate (i.e. Roundup) (Young, 2003).
Although it was noted that the authors were unable to determine the comparable price of these
alternatives to mowing, the report conclusion was that traditional synthetic herbicides are more
effective than natural based products on the market at that time (Young, 2003).
In a study of vegetation management methods used along roadsides completed by the
Indiana DOT, it was found that replacing one mowing cycle with one herbicide application
results in a 40% cost reduction (Herold, Lowe & Dukes, 2013). The potential of using native
plants to reduce maintenance costs was also studied, but the findings were inconclusive, due to a
drought occurring at the time of the study. The report also concluded that mowing is less cost
efficient than herbicidal applications, with mowing estimated to be $64/mile, and chemical
applications estimated to be $36/mile, a cost savings of $28 per mile (Herold et al., 2013). The
study authors also noted that herbicide applications are more effective at weed reduction in
comparison with mowing. Herold et al. (2013) described mowing as “the most hazardous form of
vegetation management because the slow speed and frequency of mowing puts maintenance
crews near traffic for extended periods of time” (p. 9).
Weed management programs that use a combination of methods can be more cost
efficient and effective (Cherry, 2003). Mechanical control methods require repetition (Cherry,
2003). Although not popular with the public, herbicides have proven to be both cost efficient and
effective (Cherry, 2003). One way to help cut costs and decrease the amount of herbicides used
would be to dilute the chemical to allow it to go even further, which agencies have determined to
still be effective (Cherry, 2003). Too many chemicals can sometimes harm desirable plants, as
well as noxious weeds, so this less concentrated formula helps with that as well (Cherry, 2003).
Iowa uses native grasses, wildflowers and legumes to reseed right-of-way, which allows for
more aesthetically pleasing roadsides and greater cost reduction; these plant species do not
require frequent mowing (Cherry, 2003). It is important to avoid unnecessary mowing because it
is costly and can damage the roadside slopes (Cherry, 2003).
20
The “Integrated Weed Management Plan: A Handbook for Owners and Managers of
Lands with Natural Values” provided information about different approaches to vegetation
management; a major conclusion of this report was that mowing and cutting rarely kills weeds
(Colorado Department of Agriculture, 2000). It was also found that mowing must be frequently
repeated to maintain control (Colorado Department of Agriculture, 2000). However, cutting can
be very effective for treating some types of trees and shrubs when used with herbicides
(Colorado Department of Agriculture, 2000). Mowing and cutting are associated with particular
disadvantages that are not associated with herbicides; for example, inaccessible areas such as
ones that are too rocky or steep may not be feasible with mechanical methods (Colorado
Department of Agriculture, 2000). The estimates above from the different states for costs and
savings associated with the application of herbicides as a way are summarized in Table 1.
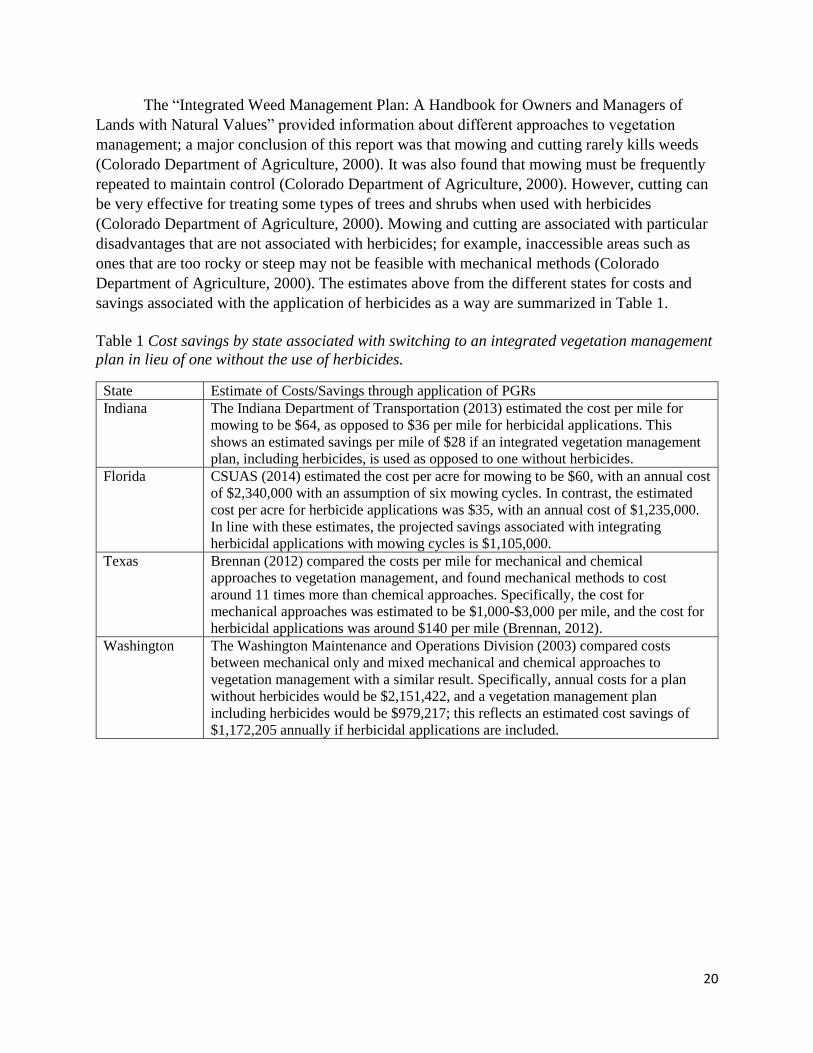
Table 1 Cost savings by state associated with switching to an integrated vegetation management
plan in lieu of one without the use of herbicides.
State Estimate of Costs/Savings through application of PGRs
Indiana The Indiana Department of Transportation (2013) estimated the cost per mile for
mowing to be $64, as opposed to $36 per mile for herbicidal applications. This
shows an estimated savings per mile of $28 if an integrated vegetation management
plan, including herbicides, is used as opposed to one without herbicides.
Florida CSUAS (2014) estimated the cost per acre for mowing to be $60, with an annual cost
of $2,340,000 with an assumption of six mowing cycles. In contrast, the estimated
cost per acre for herbicide applications was $35, with an annual cost of $1,235,000.
In line with these estimates, the projected savings associated with integrating
herbicidal applications with mowing cycles is $1,105,000.
Texas Brennan (2012) compared the costs per mile for mechanical and chemical
approaches to vegetation management, and found mechanical methods to cost
around 11 times more than chemical approaches. Specifically, the cost for
mechanical approaches was estimated to be $1,000-$3,000 per mile, and the cost for
herbicidal applications was around $140 per mile (Brennan, 2012).
Washington The Washington Maintenance and Operations Division (2003) compared costs
between mechanical only and mixed mechanical and chemical approaches to
vegetation management with a similar result. Specifically, annual costs for a plan
without herbicides would be $2,151,422, and a vegetation management plan
including herbicides would be $979,217; this reflects an estimated cost savings of
$1,172,205 annually if herbicidal applications are included.
21
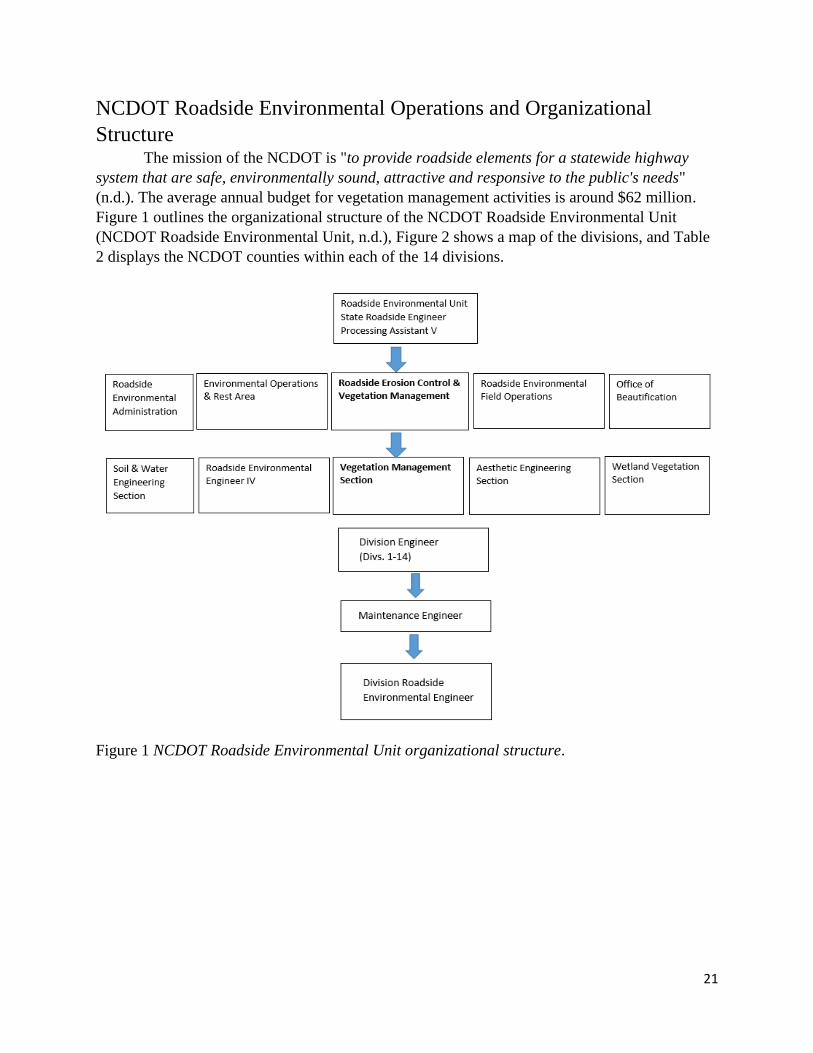
NCDOT Roadside Environmental Operations and Organizational
Structure The mission of the NCDOT is "to provide roadside elements for a statewide highway
system that are safe, environmentally sound, attractive and responsive to the public's needs"
(n.d.). The average annual budget for vegetation management activities is around $62 million.
Figure 1 outlines the organizational structure of the NCDOT Roadside Environmental Unit
(NCDOT Roadside Environmental Unit, n.d.), Figure 2 shows a map of the divisions, and Table
2 displays the NCDOT counties within each of the 14 divisions.
Figure 1 NCDOT Roadside Environmental Unit organizational structure.

22
Figure 2 NCDOT Division Map.
Table 2 The number of counties in each NCDOT division, displayed by division numbers. This
table corresponds to Figure 2 (above), the NCDOT Division Map.
No. of counties Divisions
5 6, 7, 9, 10
6 3, 4, 12
7 5, 13
8 2, 8, 11
10 14
14 1
Previously, the NCDOT Roadway Maintenance staff in each Division was in charge of
administering contract mowing operations and Roadside Environmental Division staff was in
charge of herbicidal applications. In some instances, there was a lack of coordination until House
Bill 97 was passed, which mandated the transfer of responsibility for vegetation management
within the DOT from the Roadside Maintenance Unit to the Roadside Environmental Unit
(Session Law 2015-241, section 29.9A). Now, Roadside Environmental staff is in charge of both
mowing and herbicidal applications. All divisions have undergone this legislatively mandated
change, except for division 13. Within Division 13, Roadside Maintenance is still in charge of
mowing while Roadside Environmental is responsible for applying herbicides. According to
Division 13, there are 25 roadside environmental positions in the division with six vacancies,
although there were previously 42 positions. Division 13 roadside environmental has four crews
focusing on vegetation management, including the following focus areas: two crews focusing on
erosion control, one crew focusing on plant bed maintenance, and one crew whose responsibility
it is to apply herbicides and facilitate wildflower establishment.
23
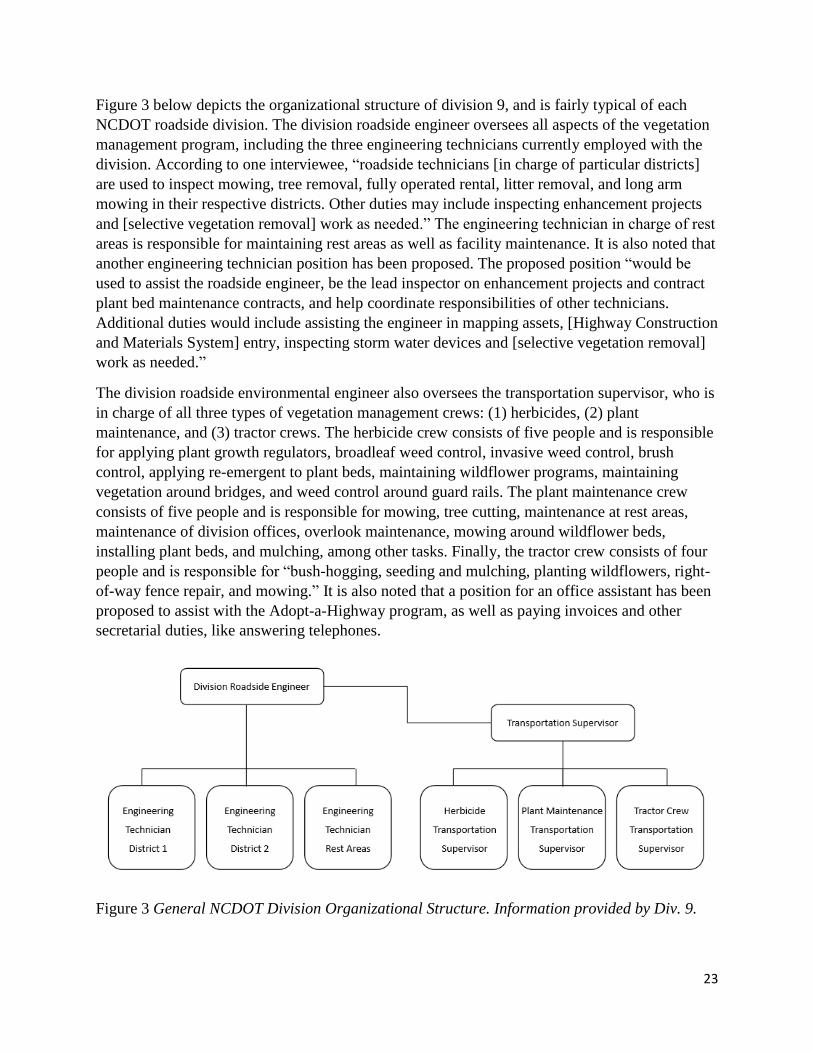
Figure 3 below depicts the organizational structure of division 9, and is fairly typical of each
NCDOT roadside division. The division roadside engineer oversees all aspects of the vegetation
management program, including the three engineering technicians currently employed with the
division. According to one interviewee, “roadside technicians [in charge of particular districts]
are used to inspect mowing, tree removal, fully operated rental, litter removal, and long arm
mowing in their respective districts. Other duties may include inspecting enhancement projects
and [selective vegetation removal] work as needed.” The engineering technician in charge of rest
areas is responsible for maintaining rest areas as well as facility maintenance. It is also noted that
another engineering technician position has been proposed. The proposed position “would be
used to assist the roadside engineer, be the lead inspector on enhancement projects and contract
plant bed maintenance contracts, and help coordinate responsibilities of other technicians.
Additional duties would include assisting the engineer in mapping assets, [Highway Construction
and Materials System] entry, inspecting storm water devices and [selective vegetation removal]
work as needed.”
The division roadside environmental engineer also oversees the transportation supervisor, who is
in charge of all three types of vegetation management crews: (1) herbicides, (2) plant
maintenance, and (3) tractor crews. The herbicide crew consists of five people and is responsible
for applying plant growth regulators, broadleaf weed control, invasive weed control, brush
control, applying re-emergent to plant beds, maintaining wildflower programs, maintaining
vegetation around bridges, and weed control around guard rails. The plant maintenance crew
consists of five people and is responsible for mowing, tree cutting, maintenance at rest areas,
maintenance of division offices, overlook maintenance, mowing around wildflower beds,
installing plant beds, and mulching, among other tasks. Finally, the tractor crew consists of four
people and is responsible for “bush-hogging, seeding and mulching, planting wildflowers, right-
of-way fence repair, and mowing.” It is also noted that a position for an office assistant has been
proposed to assist with the Adopt-a-Highway program, as well as paying invoices and other
secretarial duties, like answering telephones.
Figure 3 General NCDOT Division Organizational Structure. Information provided by Div. 9.
24
Since the organizational structure has changed, the same amount of work is now accomplished
with fewer people. According to Division 11, there are 22 staff involved with vegetation
management in their division. These 22 staff include, among others, include the following: six
inspectors who monitor the work of contractors (i.e. three turf mowing inspectors and three long
arm mowing inspectors) two who focus on herbicide applications, one on the seed crew, and one
who focuses on planting and plant bed maintenance. It was also mentioned during interviews that
broadleaf weed control is applied together with plant growth regulators.
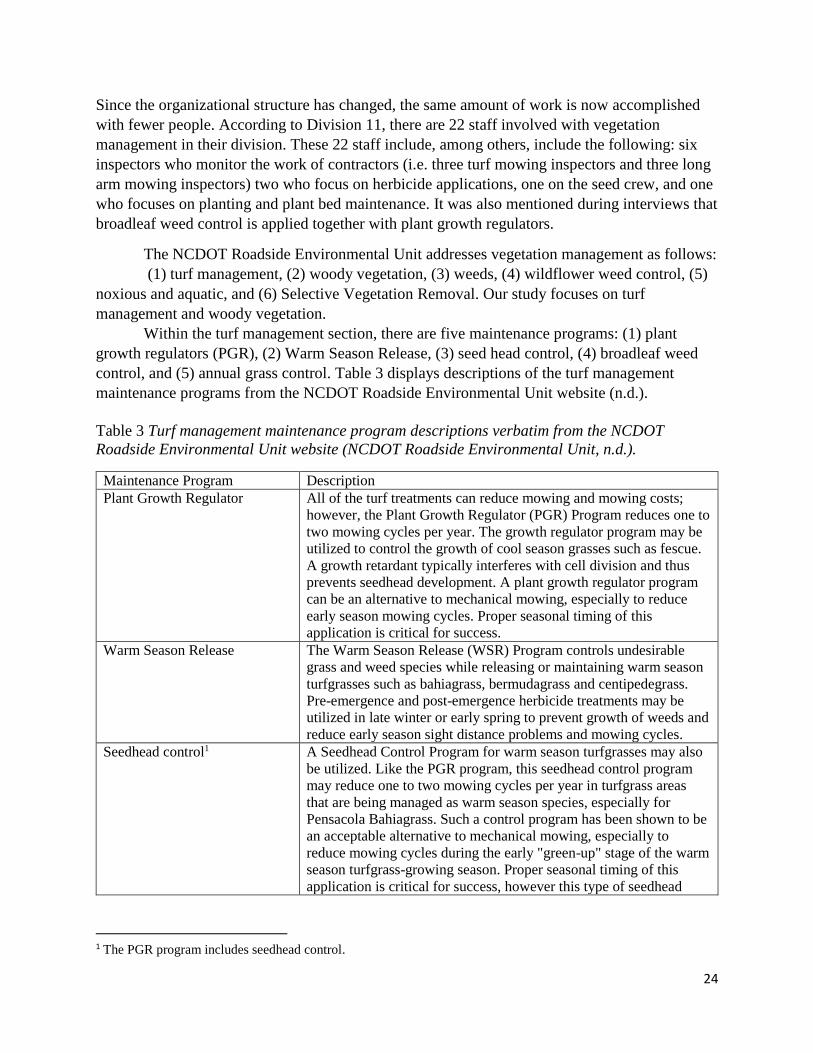
The NCDOT Roadside Environmental Unit addresses vegetation management as follows:
(1) turf management, (2) woody vegetation, (3) weeds, (4) wildflower weed control, (5)
noxious and aquatic, and (6) Selective Vegetation Removal. Our study focuses on turf
management and woody vegetation.
Within the turf management section, there are five maintenance programs: (1) plant
growth regulators (PGR), (2) Warm Season Release, (3) seed head control, (4) broadleaf weed
control, and (5) annual grass control. Table 3 displays descriptions of the turf management
maintenance programs from the NCDOT Roadside Environmental Unit website (n.d.).
Table 3 Turf management maintenance program descriptions verbatim from the NCDOT
Roadside Environmental Unit website (NCDOT Roadside Environmental Unit, n.d.).
Maintenance Program Description
Plant Growth Regulator All of the turf treatments can reduce mowing and mowing costs;
however, the Plant Growth Regulator (PGR) Program reduces one to
two mowing cycles per year. The growth regulator program may be
utilized to control the growth of cool season grasses such as fescue.
A growth retardant typically interferes with cell division and thus
prevents seedhead development. A plant growth regulator program
can be an alternative to mechanical mowing, especially to reduce
early season mowing cycles. Proper seasonal timing of this
application is critical for success.
Warm Season Release The Warm Season Release (WSR) Program controls undesirable
grass and weed species while releasing or maintaining warm season
turfgrasses such as bahiagrass, bermudagrass and centipedegrass.
Pre-emergence and post-emergence herbicide treatments may be
utilized in late winter or early spring to prevent growth of weeds and
reduce early season sight distance problems and mowing cycles.
Seedhead control1 A Seedhead Control Program for warm season turfgrasses may also
be utilized. Like the PGR program, this seedhead control program
may reduce one to two mowing cycles per year in turfgrass areas
that are being managed as warm season species, especially for
Pensacola Bahiagrass. Such a control program has been shown to be
an acceptable alternative to mechanical mowing, especially to
reduce mowing cycles during the early "green-up" stage of the warm
season turfgrass-growing season. Proper seasonal timing of this
application is critical for success, however this type of seedhead
1 The PGR program includes seedhead control.

25
control may be applied at various warm season turfgrass
developmental stages.
Broadleaf weed control The Broadleaf Weed Control Program consists of controlling weed
species along the roadsides while they are small and actively
growing. Broadleaf weeds can present a major sight distance
problem if not addressed properly. The presence of broadleaf weeds
in roadside turfgrass can also be aesthetically undesirable, and may
also prevent the desired turfgrass from becoming readily established.
The Department may utilize pre-emergence or post-emergence
herbicides which effectively control broadleaf weeds.
Annual grass control The Annual Grass Control Program may utilize herbicide treatments
during the summer to control annual and perennial grasses such as
crabgrass, dallisgrass, broomsedge, goosegrass, and others. Annual
grass control is crucial in any vegetation management program
because undesirable annual and perennial grasses compete for plant
nutrients during the summer months, thinning stands of desirable
turf. In many cases, especially in warm season grass areas, control of
undesirable annual grasses may negate or delay the need for
mechanical mowing because the desirable turfgrass may not be of
sufficient height to warrant the cost of a mowing cycle.
Woody vegetation management consists of five approaches, including (1) foliar brush
control, (2) dormant stem treatment, (3) Kudzu control, (4) fence treatment, and (5) stump
treatment (NCDOT Roadside Environmental Unit, n.d.). Table 4 shows the descriptions of each
of the turf management methodologies from the NCDOT Roadside Environmental Unit website
(n.d.).
Table 4 Descriptions of methods used for woody vegetation management, verbatim from the
NCDOT Roadside Environmental Unit website (NCDOT Roadside Environmental Unit, n.d.).
Methodology Description
Foliar brush
control
Mechanical mowing remains the most frequently used method to control woody brush
on rights-of-way. Mowing with a sequential Foliar Brush Control application has
proven the most efficient and cost effective approach for controlling brush. The
preferred process recommends mowing smaller brush late in the growing season or in
winter followed by an herbicide treatment the following year after the plants re-
sprouts and begins to "sucker" at the cut location. This process will control the root
system and generally reduce the mowing requirements for several years. This
sequence should be closely followed to avoid the need to cut or treat large brush.
Dormant stem
treatment
Over the past several years, the Department has utilized Dormant Stem Treatments
during the winter months. This has allowed the Department to expand the window of
opportunity to control brush, without causing "brown out" to the treated vegetation.
This type of brush treatment has also allowed better utilization of available personnel
and equipment during normally less productive winter months.
Kudzu control Probably the most aggressive vegetative pest in the roadside environment is kudzu.
This invasive vine not only affects the highway system, but also adjacent properties
and landowners. The Kudzu Control Program may consist of a cooperative
eradication agreement between the Department and the adjacent landowner(s), in
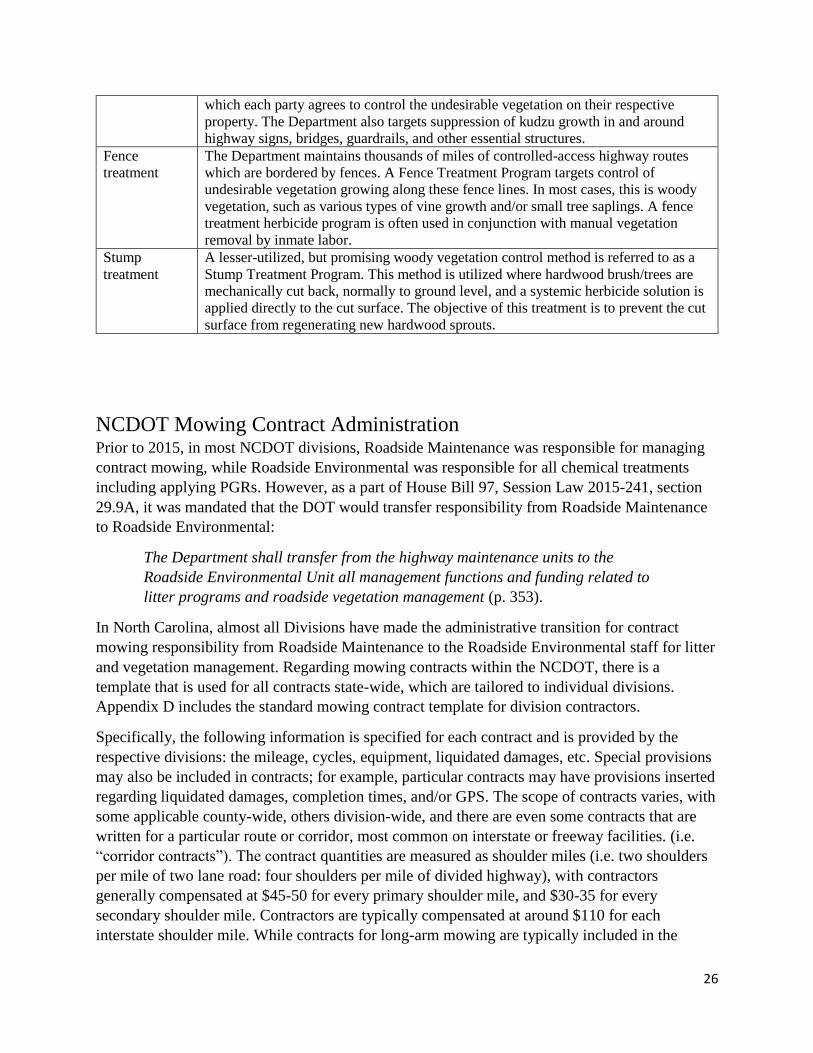
26
which each party agrees to control the undesirable vegetation on their respective
property. The Department also targets suppression of kudzu growth in and around
highway signs, bridges, guardrails, and other essential structures.
Fence
treatment
The Department maintains thousands of miles of controlled-access highway routes
which are bordered by fences. A Fence Treatment Program targets control of
undesirable vegetation growing along these fence lines. In most cases, this is woody
vegetation, such as various types of vine growth and/or small tree saplings. A fence
treatment herbicide program is often used in conjunction with manual vegetation
removal by inmate labor.
Stump
treatment
A lesser-utilized, but promising woody vegetation control method is referred to as a
Stump Treatment Program. This method is utilized where hardwood brush/trees are
mechanically cut back, normally to ground level, and a systemic herbicide solution is
applied directly to the cut surface. The objective of this treatment is to prevent the cut
surface from regenerating new hardwood sprouts.
NCDOT Mowing Contract Administration Prior to 2015, in most NCDOT divisions, Roadside Maintenance was responsible for managing
contract mowing, while Roadside Environmental was responsible for all chemical treatments
including applying PGRs. However, as a part of House Bill 97, Session Law 2015-241, section
29.9A, it was mandated that the DOT would transfer responsibility from Roadside Maintenance
to Roadside Environmental:
The Department shall transfer from the highway maintenance units to the
Roadside Environmental Unit all management functions and funding related to
litter programs and roadside vegetation management (p. 353).
In North Carolina, almost all Divisions have made the administrative transition for contract
mowing responsibility from Roadside Maintenance to the Roadside Environmental staff for litter
and vegetation management. Regarding mowing contracts within the NCDOT, there is a
template that is used for all contracts state-wide, which are tailored to individual divisions.
Appendix D includes the standard mowing contract template for division contractors.
Specifically, the following information is specified for each contract and is provided by the
respective divisions: the mileage, cycles, equipment, liquidated damages, etc. Special provisions
may also be included in contracts; for example, particular contracts may have provisions inserted
regarding liquidated damages, completion times, and/or GPS. The scope of contracts varies, with
some applicable county-wide, others division-wide, and there are even some contracts that are
written for a particular route or corridor, most common on interstate or freeway facilities. (i.e.
“corridor contracts”). The contract quantities are measured as shoulder miles (i.e. two shoulders
per mile of two lane road: four shoulders per mile of divided highway), with contractors
generally compensated at $45-50 for every primary shoulder mile, and $30-35 for every
secondary shoulder mile. Contractors are typically compensated at around $110 for each
interstate shoulder mile. While contracts for long-arm mowing are typically included in the
27
contracts, they can be separate, and may not be on the same annual contract with two renewals
possible if criteria are met. Long arm mowing is also compensated per shoulder mile.
Mandatory pre-bid conferences are held once every year, usually at two locations in North
Carolina. The locations are often regional and determined based upon the locations of the
counties that will be up for bid. In 2016, pre-bid conferences were held in Raleigh and
Statesville. Bids are submitted and bid opening is held at the Transportation Building in Raleigh.
The original bid opening was Nov. 22nd, 2016, and 8 of the contracts were re-bid on Jan. 19th,
2016.
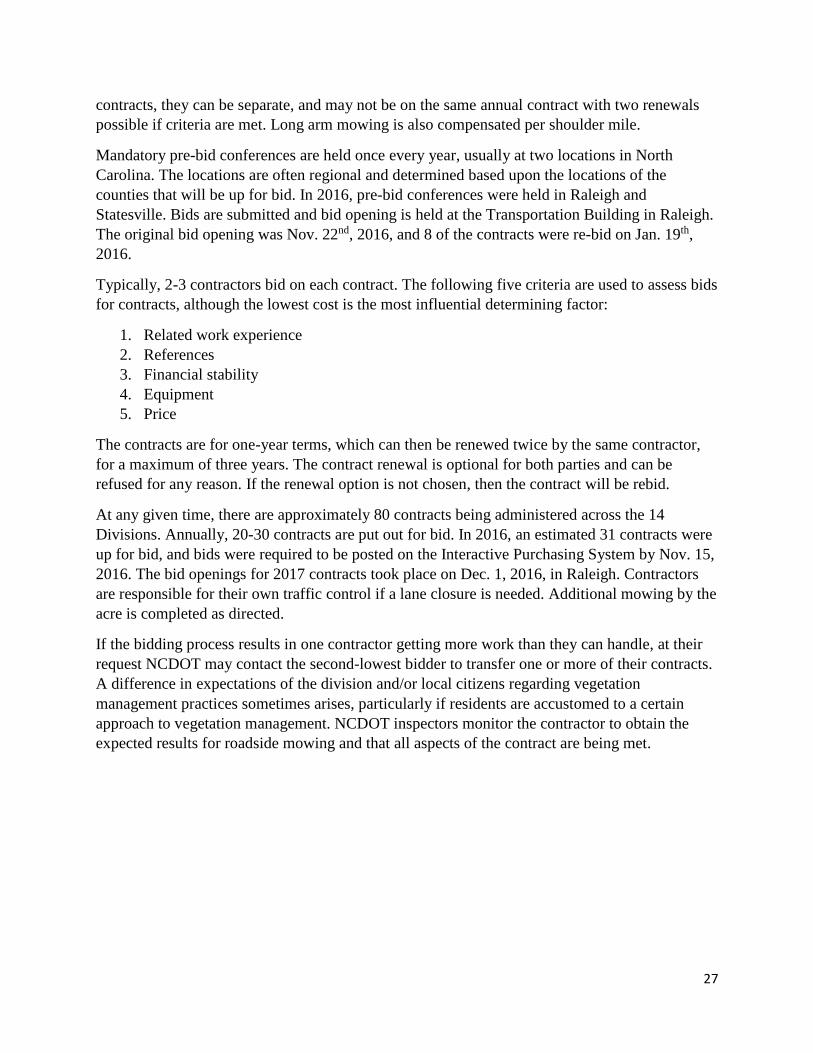
Typically, 2-3 contractors bid on each contract. The following five criteria are used to assess bids
for contracts, although the lowest cost is the most influential determining factor:
1. Related work experience
2. References
3. Financial stability
4. Equipment
5. Price
The contracts are for one-year terms, which can then be renewed twice by the same contractor,
for a maximum of three years. The contract renewal is optional for both parties and can be
refused for any reason. If the renewal option is not chosen, then the contract will be rebid.
At any given time, there are approximately 80 contracts being administered across the 14
Divisions. Annually, 20-30 contracts are put out for bid. In 2016, an estimated 31 contracts were
up for bid, and bids were required to be posted on the Interactive Purchasing System by Nov. 15,
2016. The bid openings for 2017 contracts took place on Dec. 1, 2016, in Raleigh. Contractors
are responsible for their own traffic control if a lane closure is needed. Additional mowing by the
acre is completed as directed.
If the bidding process results in one contractor getting more work than they can handle, at their
request NCDOT may contact the second-lowest bidder to transfer one or more of their contracts.
A difference in expectations of the division and/or local citizens regarding vegetation
management practices sometimes arises, particularly if residents are accustomed to a certain
approach to vegetation management. NCDOT inspectors monitor the contractor to obtain the
expected results for roadside mowing and that all aspects of the contract are being met.
28
Benchmarking with Peer States
Roadside vegetation management is a function carried out by Departments of
Transportation in every state in the US. As such, the experience and knowledge of other
states can serve as an invaluable resource for NCDOT in future decision-making. With
that in mind, this section will outline the results of a brief but comprehensive
benchmarking of NCDOT’s vegetation management practices with those of select peer
states. After a brief description below of how the states were selected and interviewed,
we present the results, especially a brief primer on identified best practices that can be
adopted by NCDOT in the future.
First, we begin with how the states were selected. For that purpose, the research team
consulted with Roadside Environmental Unit staff at NCDOT and the following states
were suggested for benchmarking comparison: Alabama, Kentucky and Texas. The
common rationale for the selection of these states above is that they are well known for
their vegetation management practices and are in the same general southern region of the
country. In addition, names and contact information for appropriate officials in each of
the states were made available to the research team for conducting the survey. Based on
the above, a questionnaire was developed (Appendix C) that was approved by NC DOT
before administration. Next, these officials above were contacted and detailed interviews
conducted with them over the telephone as well as over email. The data collected was
then compiled and forms the basis of our conclusions below.
To begin with, the following pertinent observations can be made with regards to how North
Carolina compares with the other peer states in terms of the scope and size of vegetation
management. As can be seen in Table 5, North Carolina showed the second greatest total area
managed as well as the second greatest total area mowed. This number was second only to
Texas, and greater than both Alabama and Kentucky. As the number of employees was
interpreted differently between each of the four states, no conclusions could be made as to how
the number of NCDOT employees compares. Texas had the highest annual budget for roadside
vegetation management, at $64 million; following this, North Carolina had the second highest
annual budget at approximately $62 million. Alabama was around 17.5 million, and Kentucky
had an annual budget of $17 million.

29
Table 5 Size and budget of other DOTs.
AL TX KY NC
Total system miles (centerline)
11,000 79,000 27,500 80,000
Total area managed
29,273 lane miles 1.1 million acres 200,000 acres/ 27,500 miles
300,000-350,000 acres
Total area mowed 115,400 acres 800,000 acres n/a 679,593 shoulder miles
No. of employees 4 2who focus on vegetation management
12,000 total in TXDOT & 1,300 applicators
2,000 maintenance crews & 660 specialty roadside applicators
279 vegetation management staff
Annual budget for Roadside Vegetation Management
$12.9 million - mowing & $4.5 million - herbicides
$50 million - mowing & $14 million - herbicides
$17 million $62 million average annual expenditure
Organizational structure benchmarking with the peer states reveals several pertinent
observations. NCDOT has fewer mowing contracts compared to TXDOT (see Table 6).
While Alabama has 5 regions, North Carolina has 14. In terms of the number of counties,
Texas has the greatest number (254), followed by Kentucky (120), and then North
Carolina (100). Alabama showed the least number of counties (67). While Texas
administers mowing contracts by county, North Carolina often lumps together several
counties into a single contract, with an average of 5-6 mowing contracts per division.
Table 6 Organizational structure of other DOTs.
AL TX KY NC
Organizational Structure
• 5 regions • 2 areas per region • 3-6 districts per area • 41 total district offices • 67 total counties
• 25 districts • 10 counties per district • 254 total mowing contracts • 254 total counties
• 5 roadside environmental administrators • 12 highway district offices • 120 total counties
• 14 divisions • ~7 counties per division • 80 mowing contracts • 100 total counties
2 The ALDOT number is low due to their interpretation of the question. The ALDOT representative provided the
following response: “Within ALDOT we have 4 employees that are dedicated to vegetation management issues:
Myself, my 2 staff members and 1 Regional Agronomist. The roadside mowing is accomplished either by contract
or by District employees. All herbicide treatments are accomplished by District employees. However, those
individuals are not dedicated to vegetation management; vegetation management is a part of their duties which
include all roadside maintenance activities.”
30
Previously, mowing contracts were administered by the Division Roadside Maintenance
staff within the NCDOT, and applying PGRs was completed by the Roadside
Environmental Division staff. As previously mentioned, in 2015, House Bill 97 mandated
that all vegetation management activities would be carried out and contracted out by
Roadside Environmental. While mowing will still be contracted out and application of
PGRs will still be handled internally, Roadside Environmental is now responsible for
ensuring the completion of both types of vegetation management activities.
Differing from NC, at KYDOT, vegetation management falls under the Division of
Maintenance in the Central Office, and the Roadside Manager reports to the Director of
Maintenance. The representative from the KYDOT explained that “most mechanical
mowing is done by contract forces supplemented by state forces. Most spraying is done
by state forces supplemented by contract forces.” The other two peer states, ALDOT and
TXDOT, did not specify whether vegetation management was the responsibility of
Roadside Maintenance or Roadside Environmental. Instead, they both specified that
vegetation management was carried out by districts. TXDOT further explained that
mowing is typically contracted out.
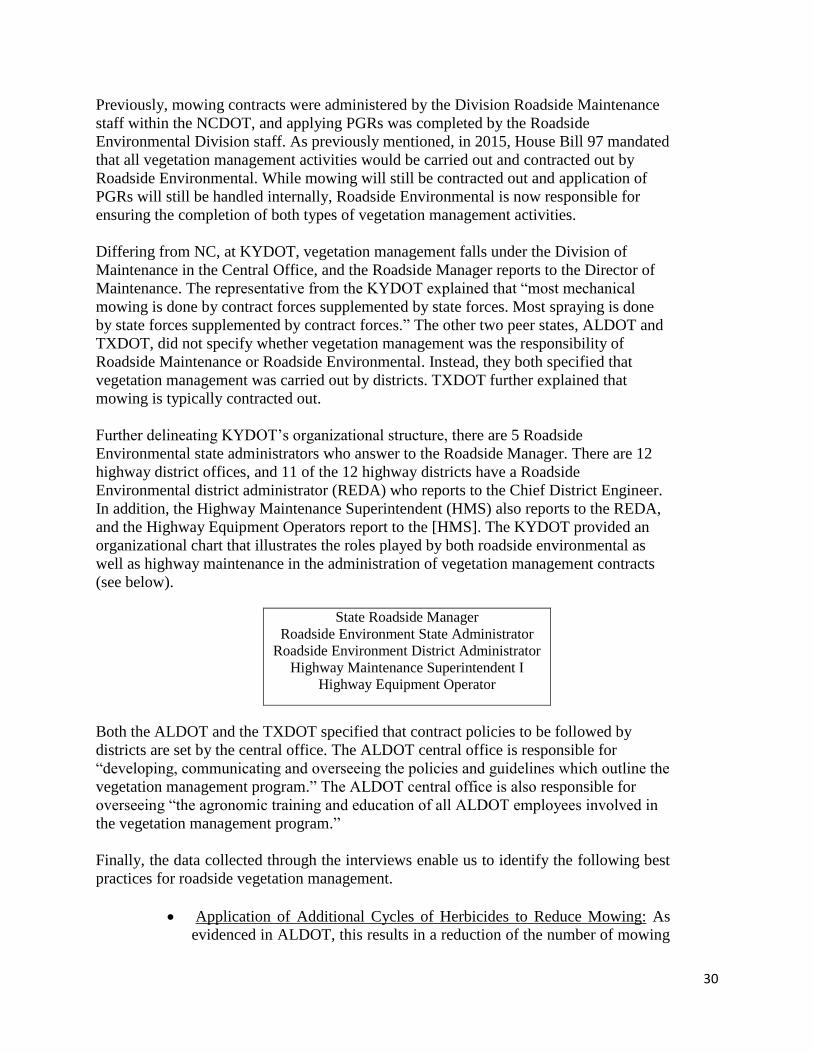
Further delineating KYDOT’s organizational structure, there are 5 Roadside
Environmental state administrators who answer to the Roadside Manager. There are 12
highway district offices, and 11 of the 12 highway districts have a Roadside
Environmental district administrator (REDA) who reports to the Chief District Engineer.
In addition, the Highway Maintenance Superintendent (HMS) also reports to the REDA,
and the Highway Equipment Operators report to the [HMS]. The KYDOT provided an
organizational chart that illustrates the roles played by both roadside environmental as
well as highway maintenance in the administration of vegetation management contracts
(see below).
State Roadside Manager
Roadside Environment State Administrator
Roadside Environment District Administrator
Highway Maintenance Superintendent I
Highway Equipment Operator
Both the ALDOT and the TXDOT specified that contract policies to be followed by
districts are set by the central office. The ALDOT central office is responsible for
“developing, communicating and overseeing the policies and guidelines which outline the
vegetation management program.” The ALDOT central office is also responsible for
overseeing “the agronomic training and education of all ALDOT employees involved in
the vegetation management program.”
Finally, the data collected through the interviews enable us to identify the following best
practices for roadside vegetation management.
Application of Additional Cycles of Herbicides to Reduce Mowing: As
evidenced in ALDOT, this results in a reduction of the number of mowing
31
cycles required and consequent savings of over $100,000 in some districts.
According to the KYDOT representative, mowing too often can also impact
environmental rehabilitation efforts: “maintaining vegetation at a level the
public expects is a challenge given shrinking highway maintenance budgets.
Our state has not embraced reduced mowing and this makes it difficult to
implement pollinator habitat recovery.”
Establishment of a Safe and Effective Herbicide Program: A safe and
effective herbicide program is essential (TXDOT, KYDOT). Applying
selective herbicides during the right times of year was also mentioned as a
component of a safe and effective herbicide program (TXDOT). Another
interviewee mentioned that “a good herbicide program is not always that
visible,” meaning that bad herbicide programs would be more noticeable,
due to brown-out and other negative results of managing vegetation poorly.
Establishment of an Effective Mowing and Trimming Program:
Representatives from the TXDOT as well as the KYDOT both mentioned
the importance of an effective mowing [and trimming] program as a best
practice. As expanded upon by the TXDOT representative: “mow at the
right time of year (e.g. October) at the right height to encourage
wildflowers, don’t mow when it’s wet, and establish no-mow areas to save
money and to preserve wildlife and pollinator habitat.”. Along these lines,
the KYDOT representative emphasized the importance of prompt and
effective hazardous tree removal for safety reasons.
Establishment of an Effective Herbicide Training Program: Herbicide
training that includes hands-on as well as classroom training is essential,
according to the TXDOT representative. An effective herbicide training
program would also emphasize hands-on training (e.g. how to properly mix
chemicals) (TXDOT). The way that TXDOT accomplishes this is by
requiring one day per year of training for all licensed herbicide applicators
in order to earn re-certification credits.

32
NCDOT Division Vegetation Management Practices
Interviews were completed with all 14 division Roadside Environmental engineers regarding
vegetation management practices (see Appendix B for a list of the interview questions).
Following the qualitative analysis, several key findings arose. The first finding is that Fescue,
followed by centipede grass, were most common across divisions, with Bermuda and Bahia the
least common out of these main turf types. The second finding is that plant growth regulators are
regularly applied on interstates and primary roads, but rarely applied on secondary roads. The
third finding from the interviews is that the transfer of responsibility for administering contract
mowing from roadway maintenance to roadside environmental has occurred across most
divisions. The fourth finding regarding roadside management practices is that the strongest
barriers to increasing the use of plant growth regulators include the following: personnel, budget,
equipment, and chemical application time constraints.
Although Fescue makes up the greatest percentage of turf type on all road systems, followed by
centipede grass, differences in turf were noted across road systems. On interstates and secondary
systems, Bahia is more common than Bermuda; however, on primary systems, Bermuda is more
common than Bahia. See Table 7 for the breakdown of turf type by percentage. Turf types are
also mapped out in more detail by road system in the Appendix.
Table 7. Average turf type percentages by road system.
Fescue Bahia Bermuda Centipede
Interstates 67% 25% 18% 37%
Primary 69% 28% 38% 43%
Secondary 64% 38% 32% 39%
The second finding is that most divisions use plant growth regulators on interstates and primary
roads, but most do not use plant growth regulators on secondary roads (see Table 8). Along with
this finding, it was found that although the number of mowing cycles across all road types was
consistently between 4 and 5, there were slight differences. Secondary systems averaged the
highest number of mowing cycles, followed by interstates, with primary roads averaging the
lowest number of mowing cycles (see Table 8). The most common time frame to apply plant
growth regulators is in March and April (n=6), followed by June (n=3), May and July (n=2).
While the second finding relates to trends in mowing and applying PGRs across road types, as
well as appropriate times of the year to apply PGRs, division representatives’ perceptions of the
effectiveness of PGRs were also delineated. Most division staff believed the use of plant growth
regulators reduces the number of mowing cycles needed (n=9). Of the six who specified the
number of mowing cycles that they believed an additional application of plant growth regulators
would reduce, four said by one cycle and two said by two cycles.
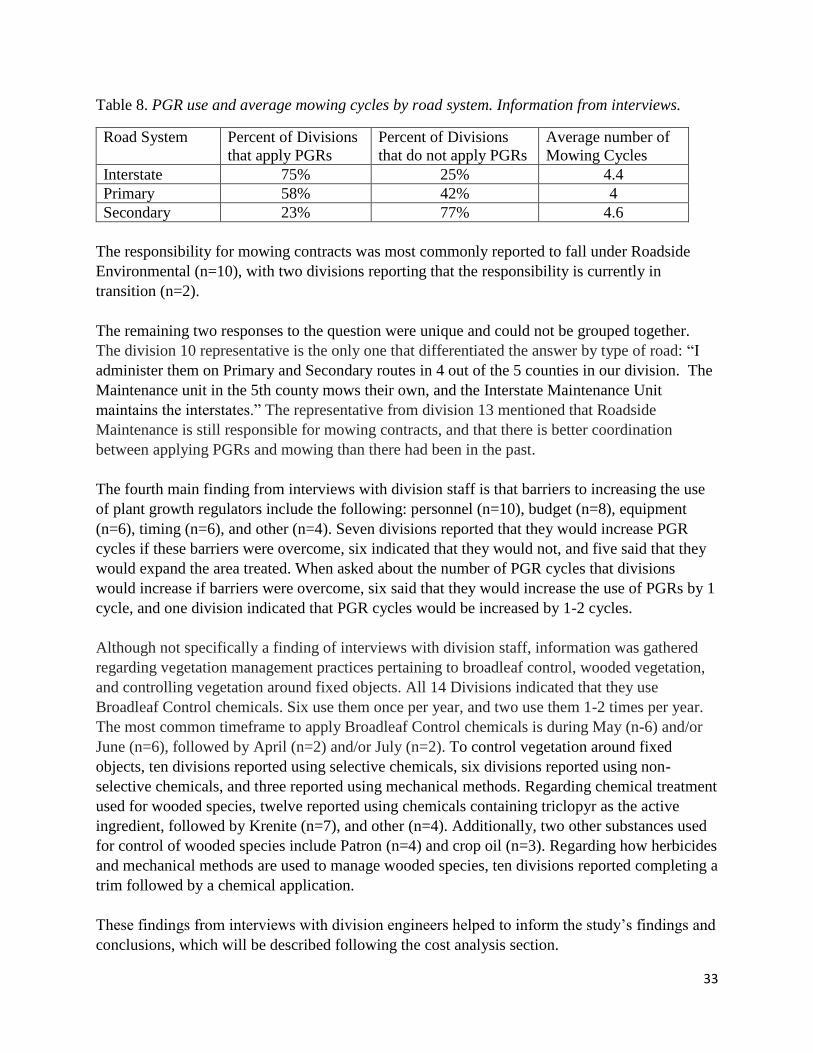
33
Table 8. PGR use and average mowing cycles by road system. Information from interviews.
Road System Percent of Divisions
that apply PGRs
Percent of Divisions
that do not apply PGRs
Average number of
Mowing Cycles
Interstate 75% 25% 4.4
Primary 58% 42% 4
Secondary 23% 77% 4.6
The responsibility for mowing contracts was most commonly reported to fall under Roadside
Environmental (n=10), with two divisions reporting that the responsibility is currently in
transition (n=2).
The remaining two responses to the question were unique and could not be grouped together.
The division 10 representative is the only one that differentiated the answer by type of road: “I
administer them on Primary and Secondary routes in 4 out of the 5 counties in our division. The
Maintenance unit in the 5th county mows their own, and the Interstate Maintenance Unit
maintains the interstates.” The representative from division 13 mentioned that Roadside
Maintenance is still responsible for mowing contracts, and that there is better coordination
between applying PGRs and mowing than there had been in the past.
The fourth main finding from interviews with division staff is that barriers to increasing the use
of plant growth regulators include the following: personnel (n=10), budget (n=8), equipment
(n=6), timing (n=6), and other (n=4). Seven divisions reported that they would increase PGR
cycles if these barriers were overcome, six indicated that they would not, and five said that they
would expand the area treated. When asked about the number of PGR cycles that divisions
would increase if barriers were overcome, six said that they would increase the use of PGRs by 1
cycle, and one division indicated that PGR cycles would be increased by 1-2 cycles.
Although not specifically a finding of interviews with division staff, information was gathered
regarding vegetation management practices pertaining to broadleaf control, wooded vegetation,
and controlling vegetation around fixed objects. All 14 Divisions indicated that they use
Broadleaf Control chemicals. Six use them once per year, and two use them 1-2 times per year.
The most common timeframe to apply Broadleaf Control chemicals is during May (n-6) and/or
June (n=6), followed by April (n=2) and/or July (n=2). To control vegetation around fixed
objects, ten divisions reported using selective chemicals, six divisions reported using non-
selective chemicals, and three reported using mechanical methods. Regarding chemical treatment
used for wooded species, twelve reported using chemicals containing triclopyr as the active
ingredient, followed by Krenite (n=7), and other (n=4). Additionally, two other substances used
for control of wooded species include Patron (n=4) and crop oil (n=3). Regarding how herbicides
and mechanical methods are used to manage wooded species, ten divisions reported completing a
trim followed by a chemical application.
These findings from interviews with division engineers helped to inform the study’s findings and
conclusions, which will be described following the cost analysis section.

34
Vegetation Management Practices Cost Analysis We constructed the database from a variety of sources. The North Carolina Department of
Transportation (NC DOT) provided cost data reported by function code from fiscal year 2014
through 2016 for both mowing and PGR applications for each division as well as centerline
mileage for each division. As a part of this data, the costs were broken down by road system as
well (interstate/primary/secondary). Division Roadside Environmental staff provided the number
of mowing and PGR application cycles per system as well as a rough percentage breakdown of
turf type within their respective divisions. The number of PGR application cycles was assumed
to be one, since this was the most common response in the interviews.
Based on available data, the average mowing cost per cycle per shoulder mile was calculated by
system (see Figure 4). Consistent with prior conclusions from the NCDOT vegetation
management cost data, interstate systems are the costliest (mean=$91.06; median=$87.17),
followed by primary systems (mean=$48.59; median=$46.79), with secondary roads showing the
least cost (mean=$30.33; median=$28.46).
Mowing costs in Divisions 4 ($179.25) and 13 ($171.23) were outliers compared to the median
($87.17). Information gathered from interviews showed that division 4 reported mowing two
cycles annually on interstate and primary routes (5 on secondary). Division 13 reported mowing
4 cycles annually on interstate routes for Fescue and 2 cycles annually on interstate routes for
warm season grasses; in comparison, division 13 reported mowing 3 cycles on both primary and
secondary routes.
Figure 4 Average Mowing Cost per Cycle per Shoulder Mile.
$0.00
$20.00
$40.00
$60.00
$80.00
$100.00
$120.00
$140.00
$160.00
$180.00
$200.00
1 2 3 4 5 6 7 8 9 10 11 12 13 14
Mo
win
g C
ost
Divisions
Interstate Primary Secondary

35
The average cost of PGR applications per cycle per shoulder mile was calculated based on
NCDOT data (see Figure 5) as well as insights from interviews. The costs associated with PGR
applications on roadsides was the highest for interstates (mean=$65.70), followed by primary
systems (mean=$17.04). Secondary roads were not incorporated into the graph because the costs
reported are negligible, with most divisions reporting having not applied on secondary systems.
The reason why interstate PGR application costs vary so much is that several divisions
mentioned during interviews that although they use other herbicides, they do not use PGRs
(divisions 4, 6, 8 and 14), and two divisions do not have interstates in their divisions (divisions 1
and 2). Information gathered from interviews showed that division 5 reported PGR use on
interstates and primary roads, but not on secondary systems. Division 12 reported PGR use on all
road types.
Figure 5 Average PGR Application Cost per Cycle per Shoulder Mile.
The ratio, or the average cost of mowing divided by the average cost of PGR applications, was
calculated per cycle per shoulder mile. As displayed in Figure 6, primary systems have the
greatest average ratio (mean=5.06) in comparison to interstate systems (mean=1.92). As can be
seen from the line graph, an outlier for primary systems was 14.60 (Div. 3).
$0.00
$20.00
$40.00
$60.00
$80.00
$100.00
$120.00
$140.00
1 2 3 4 5 6 7 8 9 10 11 12 13 14
PG
R A
pp
licat
ion
Co
st
Divisions
Interstate Primary

36
Figure 6 Ratio of Average Cost per Cycle per Shoulder Mile (i.e. mowing divided by PGR
applications).
Table 9 displays the overall average costs for all divisions by road type, based upon available
data. The first column, “mowing,” refers to the overall average cost of mowing per shoulder
mile. The second column, “PGR applications,” lists the overall average cost of PGR applications
per shoulder mile. The third column, “ratio of mow/PGR application cost,” lists the ratio (i.e.
mowing cost divided by PGR cost) per shoulder mile. This data can be viewed in further detail in
Appendices E (interstate data), F (data for primary roads) and G (secondary data).
Table 9 Summary of overall average costs for all divisions by road system, per cycle per
shoulder mile.
Mowing PGR
Applications
Ratio of Mow/ PGR
Application Cost
Interstate $91.06 $65.70 1.39
Primary $48.59 $17.04 2.85
Secondary3 $30.33 N/A N/A
Table 10 displays the estimated savings for each division that might be realized by replacing one
mowing cycle with one PGR application cycle. These savings are separated by road system type
– interstate, primary, and secondary, as well as division totals. The total savings across all road
types that are possible by reducing mowing cycles by one and increasing PGR application cycles
by one was estimated to be $2,464,216 or approximately $2.5 million per year.
Overall average savings were greatest for secondary roads (mean=$98,946.57;
total=$1,385,251.94), largely because divisions reported minimal PGR applications on secondary
roads (see Table 9). The second highest savings were on primary roads, with an average savings
3 Note: Although mowing cost information was retrieved for secondary systems, PGR cost data for this road type
was not reliable.
0
2
4
6
8
10
12
14
16
1 2 3 4 5 6 7 8 9 10 11 12 13 14
Rat
io
Divisions
Interstate Primary
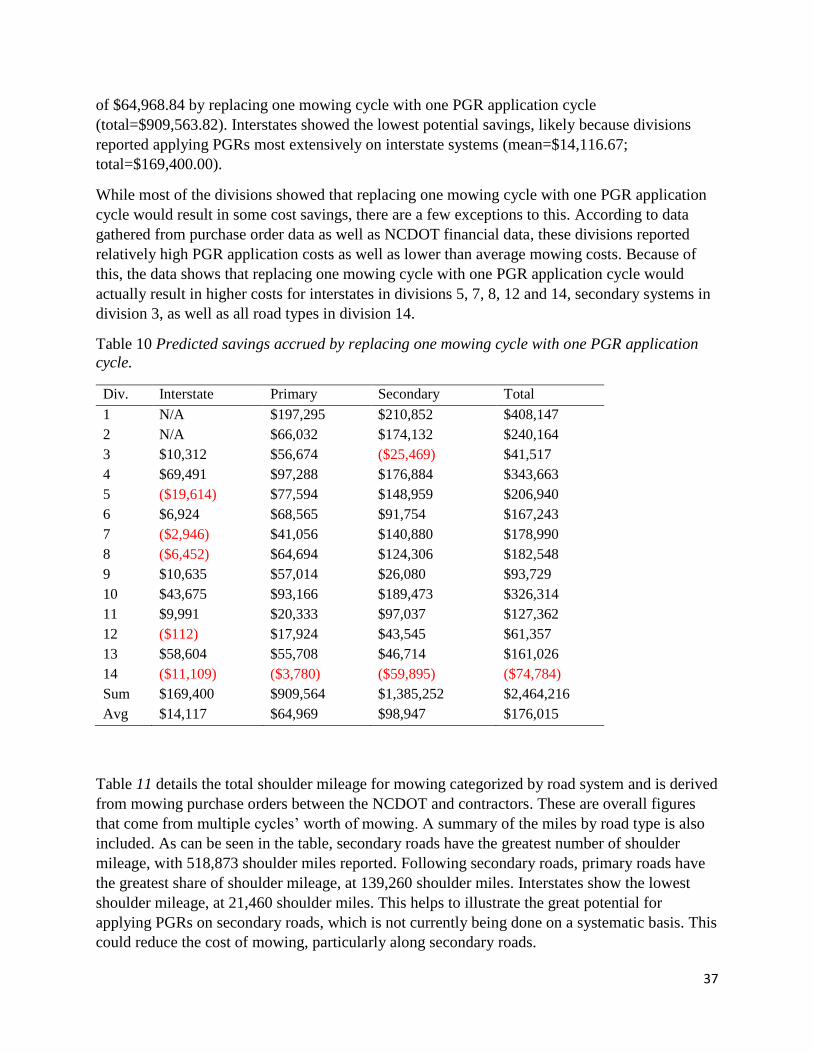
37
of $64,968.84 by replacing one mowing cycle with one PGR application cycle
(total=$909,563.82). Interstates showed the lowest potential savings, likely because divisions
reported applying PGRs most extensively on interstate systems (mean=$14,116.67;
total=$169,400.00).
While most of the divisions showed that replacing one mowing cycle with one PGR application
cycle would result in some cost savings, there are a few exceptions to this. According to data
gathered from purchase order data as well as NCDOT financial data, these divisions reported
relatively high PGR application costs as well as lower than average mowing costs. Because of
this, the data shows that replacing one mowing cycle with one PGR application cycle would
actually result in higher costs for interstates in divisions 5, 7, 8, 12 and 14, secondary systems in
division 3, as well as all road types in division 14.
Table 10 Predicted savings accrued by replacing one mowing cycle with one PGR application
cycle.
Div. Interstate Primary Secondary Total
1 N/A $197,295 $210,852 $408,147
2 N/A $66,032 $174,132 $240,164
3 $10,312 $56,674 ($25,469) $41,517
4 $69,491 $97,288 $176,884 $343,663
5 ($19,614) $77,594 $148,959 $206,940
6 $6,924 $68,565 $91,754 $167,243
7 ($2,946) $41,056 $140,880 $178,990
8 ($6,452) $64,694 $124,306 $182,548
9 $10,635 $57,014 $26,080 $93,729
10 $43,675 $93,166 $189,473 $326,314
11 $9,991 $20,333 $97,037 $127,362
12 ($112) $17,924 $43,545 $61,357
13 $58,604 $55,708 $46,714 $161,026
14 ($11,109) ($3,780) ($59,895) ($74,784)
Sum $169,400 $909,564 $1,385,252 $2,464,216
Avg $14,117 $64,969 $98,947 $176,015
Table 11 details the total shoulder mileage for mowing categorized by road system and is derived
from mowing purchase orders between the NCDOT and contractors. These are overall figures
that come from multiple cycles’ worth of mowing. A summary of the miles by road type is also
included. As can be seen in the table, secondary roads have the greatest number of shoulder
mileage, with 518,873 shoulder miles reported. Following secondary roads, primary roads have
the greatest share of shoulder mileage, at 139,260 shoulder miles. Interstates show the lowest
shoulder mileage, at 21,460 shoulder miles. This helps to illustrate the great potential for
applying PGRs on secondary roads, which is not currently being done on a systematic basis. This
could reduce the cost of mowing, particularly along secondary roads.

38
Table 11 Total shoulder mileage for mowing by road type.
Div. Interstate Primary Secondary
1 N/A 13,017 33,217
2 N/A 9,844 27,448
3 1,032 13,561 35,194
4 1,224 13,095 44,728
5 2,360 9,814 42,688
6 1,416 13,545 47,062
7 4,331 8,917 43,077
8 1,555 11,871 52,053
9 1,008 5,568 28,620
10 3,656 6,592 22,190
11 1,000 8,205 41,078
12 1,296 7,712 41,482
13 1,868 10,277 31,826
14 714 7,242 28,210
Sum 21,460 139,260 518,873
Table 12 displays the number of shoulder miles per cycle by road type, which was used for both
mowing and PGR application calculations.
Table 12 Per cycle shoulder mileage for mowing and applying PGRs.
Division Interstate Primary Secondary
1 N/A 4,004 10,244
2 N/A 2,432 6,850
3 344 2,804 7,556
4 624 2,792 7,126
5 472 1,908 9,034
6 404 2,460 8,322
7 1,024 1,686 7,754
8 312 2,338 10,744
9 336 1,460 7,346
10 536 1,404 5,080
11 200 1,796 9,390
12 324 1,788 9,648
13 504 2,410 8,232
14 272 1,896 9,110
Sum 5,352 31,178 116,436
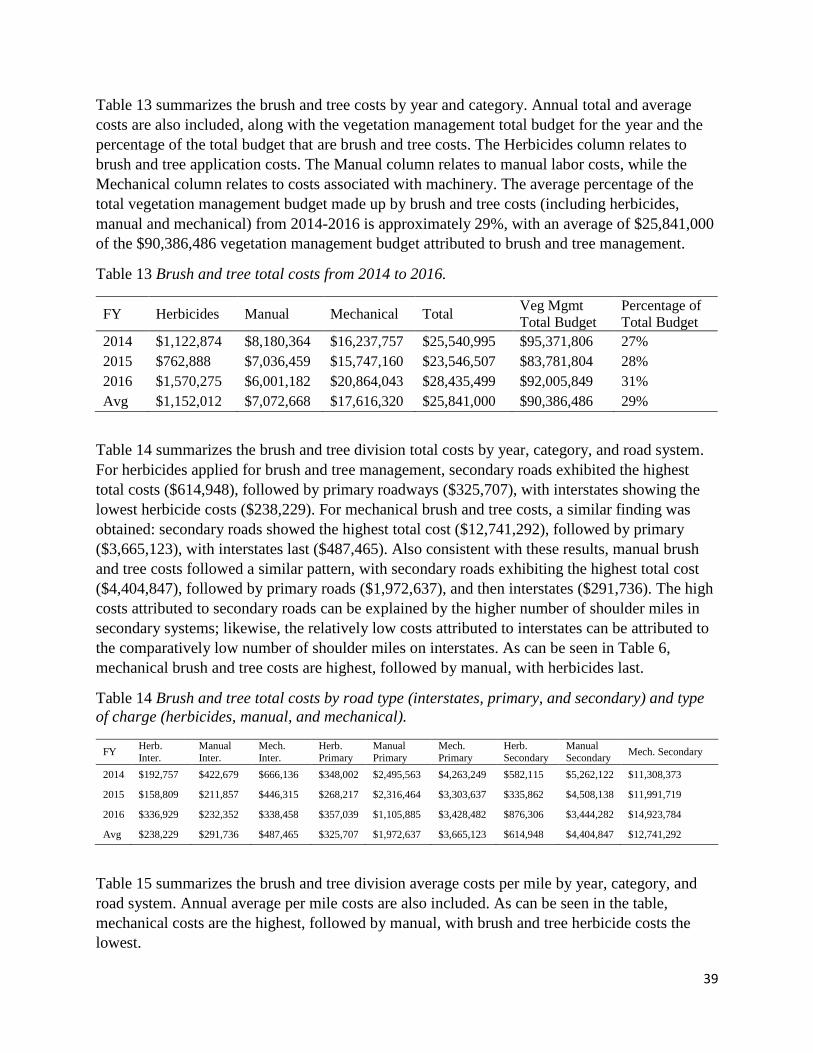
39
Table 13 summarizes the brush and tree costs by year and category. Annual total and average
costs are also included, along with the vegetation management total budget for the year and the
percentage of the total budget that are brush and tree costs. The Herbicides column relates to
brush and tree application costs. The Manual column relates to manual labor costs, while the
Mechanical column relates to costs associated with machinery. The average percentage of the
total vegetation management budget made up by brush and tree costs (including herbicides,
manual and mechanical) from 2014-2016 is approximately 29%, with an average of $25,841,000
of the $90,386,486 vegetation management budget attributed to brush and tree management.
Table 13 Brush and tree total costs from 2014 to 2016.
FY Herbicides Manual Mechanical Total Veg Mgmt
Total Budget
Percentage of
Total Budget
2014 $1,122,874 $8,180,364 $16,237,757 $25,540,995 $95,371,806 27%
2015 $762,888 $7,036,459 $15,747,160 $23,546,507 $83,781,804 28%
2016 $1,570,275 $6,001,182 $20,864,043 $28,435,499 $92,005,849 31%
Avg $1,152,012 $7,072,668 $17,616,320 $25,841,000 $90,386,486 29%
Table 14 summarizes the brush and tree division total costs by year, category, and road system.
For herbicides applied for brush and tree management, secondary roads exhibited the highest
total costs ($614,948), followed by primary roadways ($325,707), with interstates showing the
lowest herbicide costs ($238,229). For mechanical brush and tree costs, a similar finding was
obtained: secondary roads showed the highest total cost ($12,741,292), followed by primary
($3,665,123), with interstates last ($487,465). Also consistent with these results, manual brush
and tree costs followed a similar pattern, with secondary roads exhibiting the highest total cost
($4,404,847), followed by primary roads ($1,972,637), and then interstates ($291,736). The high
costs attributed to secondary roads can be explained by the higher number of shoulder miles in
secondary systems; likewise, the relatively low costs attributed to interstates can be attributed to
the comparatively low number of shoulder miles on interstates. As can be seen in Table 6,
mechanical brush and tree costs are highest, followed by manual, with herbicides last.
Table 14 Brush and tree total costs by road type (interstates, primary, and secondary) and type
of charge (herbicides, manual, and mechanical).
FY Herb. Inter.
Manual Inter.
Mech. Inter.
Herb. Primary
Manual Primary
Mech. Primary
Herb. Secondary
Manual Secondary
Mech. Secondary
2014 $192,757 $422,679 $666,136 $348,002 $2,495,563 $4,263,249 $582,115 $5,262,122 $11,308,373
2015 $158,809 $211,857 $446,315 $268,217 $2,316,464 $3,303,637 $335,862 $4,508,138 $11,991,719
2016 $336,929 $232,352 $338,458 $357,039 $1,105,885 $3,428,482 $876,306 $3,444,282 $14,923,784
Avg $238,229 $291,736 $487,465 $325,707 $1,972,637 $3,665,123 $614,948 $4,404,847 $12,741,292
Table 15 summarizes the brush and tree division average costs per mile by year, category, and
road system. Annual average per mile costs are also included. As can be seen in the table,
mechanical costs are the highest, followed by manual, with brush and tree herbicide costs the
lowest.
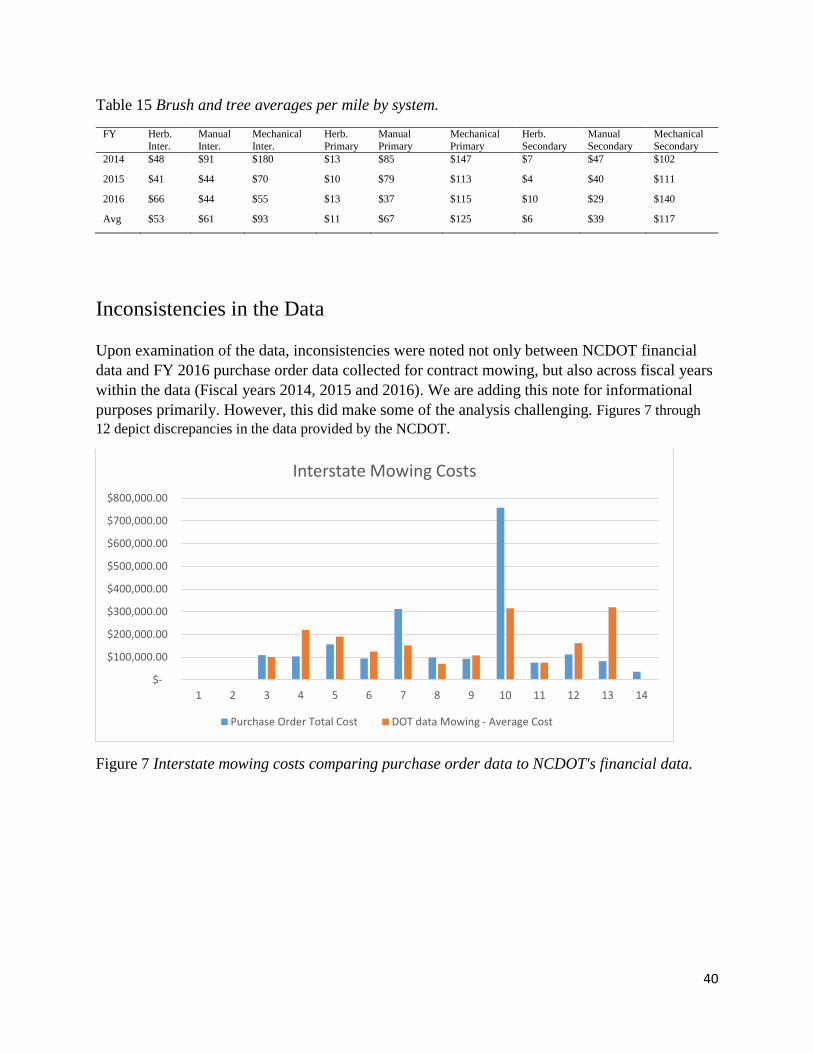
40
Table 15 Brush and tree averages per mile by system.
FY Herb.
Inter.
Manual
Inter.
Mechanical
Inter.
Herb.
Primary
Manual
Primary
Mechanical
Primary
Herb.
Secondary
Manual
Secondary
Mechanical
Secondary
2014 $48 $91 $180 $13 $85 $147 $7 $47 $102
2015 $41 $44 $70 $10 $79 $113 $4 $40 $111
2016 $66 $44 $55 $13 $37 $115 $10 $29 $140
Avg $53 $61 $93 $11 $67 $125 $6 $39 $117
Inconsistencies in the Data
Upon examination of the data, inconsistencies were noted not only between NCDOT financial
data and FY 2016 purchase order data collected for contract mowing, but also across fiscal years
within the data (Fiscal years 2014, 2015 and 2016). We are adding this note for informational
purposes primarily. However, this did make some of the analysis challenging. Figures 7 through
12 depict discrepancies in the data provided by the NCDOT.
Figure 7 Interstate mowing costs comparing purchase order data to NCDOT's financial data.
$-
$100,000.00
$200,000.00
$300,000.00
$400,000.00
$500,000.00
$600,000.00
$700,000.00
$800,000.00
1 2 3 4 5 6 7 8 9 10 11 12 13 14
Interstate Mowing Costs
Purchase Order Total Cost DOT data Mowing - Average Cost

41
Figure 8 Primary mowing costs comparing purchase order data to NCDOT's financial data.
Figure 9 Secondary mowing costs comparing purchase order data to NCDOT's financial data.
$-
$200,000.00
$400,000.00
$600,000.00
$800,000.00
$1,000,000.00
$1,200,000.00
1 2 3 4 5 6 7 8 9 10 11 12 13 14
Primary Mowing Costs
Purchase Order Total Cost DOT data Mowing - Average Cost
$-
$200,000.00
$400,000.00
$600,000.00
$800,000.00
$1,000,000.00
$1,200,000.00
$1,400,000.00
$1,600,000.00
$1,800,000.00
1 2 3 4 5 6 7 8 9 10 11 12 13 14
Secondary Mowing Costs
Purchase Order Total Cost DOT data Mowing - Average Cost
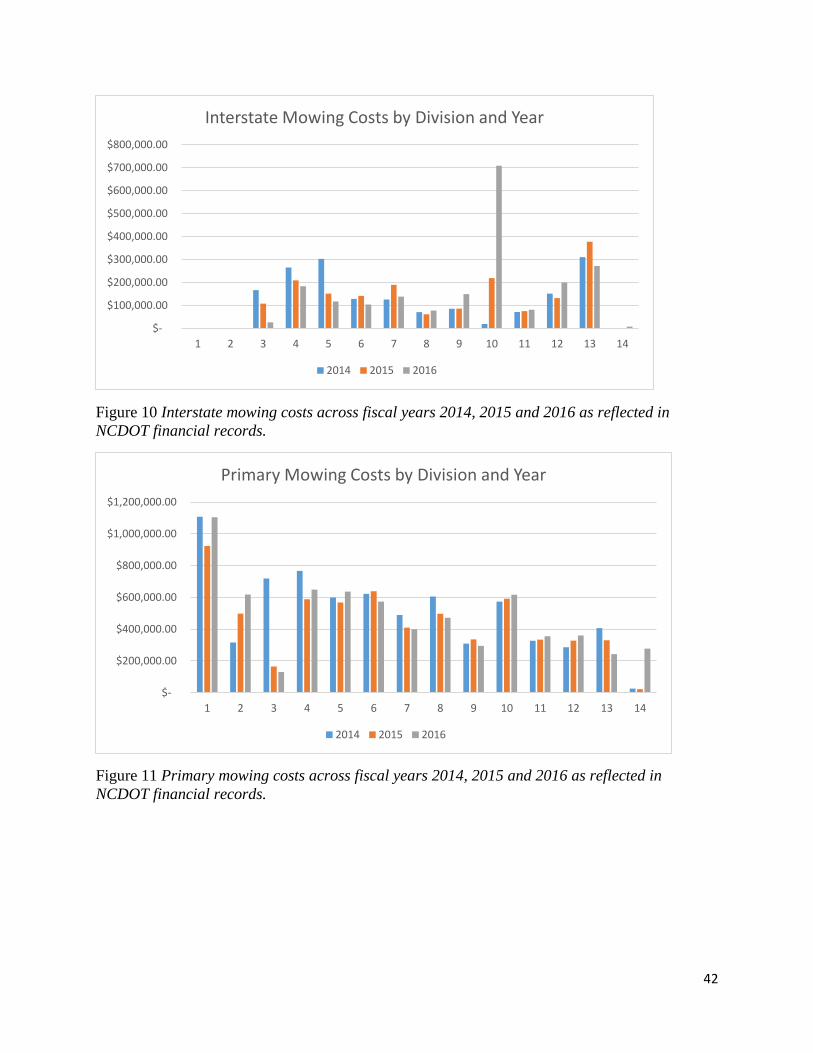
42
Figure 10 Interstate mowing costs across fiscal years 2014, 2015 and 2016 as reflected in
NCDOT financial records.
Figure 11 Primary mowing costs across fiscal years 2014, 2015 and 2016 as reflected in
NCDOT financial records.
$-
$100,000.00
$200,000.00
$300,000.00
$400,000.00
$500,000.00
$600,000.00
$700,000.00
$800,000.00
1 2 3 4 5 6 7 8 9 10 11 12 13 14
Interstate Mowing Costs by Division and Year
2014 2015 2016
$-
$200,000.00
$400,000.00
$600,000.00
$800,000.00
$1,000,000.00
$1,200,000.00
1 2 3 4 5 6 7 8 9 10 11 12 13 14
Primary Mowing Costs by Division and Year
2014 2015 2016

43
Figure 12 Secondary mowing costs across fiscal years 2014, 2015 and 2016 as reflected in
NCDOT financial records.
Research Findings
Generally, it appears that NCDOT operates an efficient and cost effective roadside vegetation
management system and utilizes many best practices identified in this study.
There were seven main findings of this research. Two of the findings came from the peer state
analysis: (1) NCDOT’s annual budget for roadside vegetation management is comparable to
Texas, with Alabama and Kentucky reporting less extensive road networks and corresponding
lower budgets in comparison to North Carolina, and (2) the literature review and peer state
interviews lent support for including eco-regional approaches into integrated vegetation
management plans and implementing regular, mandatory training for vegetation management
professionals.
The remaining four findings came from interviews, data collection, cost analysis, literature
review, and document review: (3) replacing one mowing cycle with an additional PGR
application cycle on all systems may result in cost savings of $2.5 million annually; (4)
coordination of PGR applications and mowing is critical for maximizing the benefits of PGRs,
which was largely addressed following the passage of House Bill 97; (5) while secondary roads
$-
$200,000.00
$400,000.00
$600,000.00
$800,000.00
$1,000,000.00
$1,200,000.00
$1,400,000.00
$1,600,000.00
$1,800,000.00
$2,000,000.00
1 2 3 4 5 6 7 8 9 10 11 12 13 14
Secondary Mowing Costs by Division and Year
2014 2015 2016
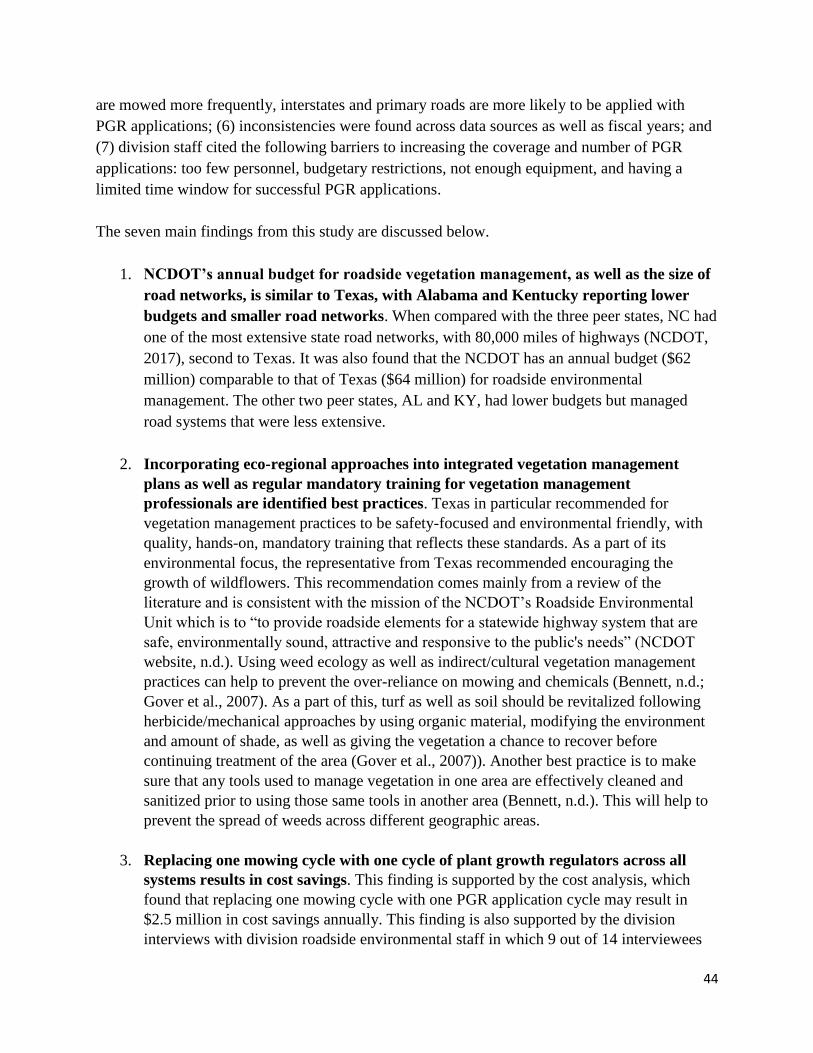
44
are mowed more frequently, interstates and primary roads are more likely to be applied with
PGR applications; (6) inconsistencies were found across data sources as well as fiscal years; and
(7) division staff cited the following barriers to increasing the coverage and number of PGR
applications: too few personnel, budgetary restrictions, not enough equipment, and having a
limited time window for successful PGR applications.
The seven main findings from this study are discussed below.
1. NCDOT’s annual budget for roadside vegetation management, as well as the size of
road networks, is similar to Texas, with Alabama and Kentucky reporting lower
budgets and smaller road networks. When compared with the three peer states, NC had
one of the most extensive state road networks, with 80,000 miles of highways (NCDOT,
2017), second to Texas. It was also found that the NCDOT has an annual budget ($62
million) comparable to that of Texas ($64 million) for roadside environmental
management. The other two peer states, AL and KY, had lower budgets but managed
road systems that were less extensive.
2. Incorporating eco-regional approaches into integrated vegetation management
plans as well as regular mandatory training for vegetation management
professionals are identified best practices. Texas in particular recommended for
vegetation management practices to be safety-focused and environmental friendly, with
quality, hands-on, mandatory training that reflects these standards. As a part of its
environmental focus, the representative from Texas recommended encouraging the
growth of wildflowers. This recommendation comes mainly from a review of the
literature and is consistent with the mission of the NCDOT’s Roadside Environmental
Unit which is to “to provide roadside elements for a statewide highway system that are
safe, environmentally sound, attractive and responsive to the public's needs” (NCDOT
website, n.d.). Using weed ecology as well as indirect/cultural vegetation management
practices can help to prevent the over-reliance on mowing and chemicals (Bennett, n.d.;
Gover et al., 2007). As a part of this, turf as well as soil should be revitalized following
herbicide/mechanical approaches by using organic material, modifying the environment
and amount of shade, as well as giving the vegetation a chance to recover before
continuing treatment of the area (Gover et al., 2007)). Another best practice is to make
sure that any tools used to manage vegetation in one area are effectively cleaned and
sanitized prior to using those same tools in another area (Bennett, n.d.). This will help to
prevent the spread of weeds across different geographic areas.
3. Replacing one mowing cycle with one cycle of plant growth regulators across all
systems results in cost savings. This finding is supported by the cost analysis, which
found that replacing one mowing cycle with one PGR application cycle may result in
$2.5 million in cost savings annually. This finding is also supported by the division
interviews with division roadside environmental staff in which 9 out of 14 interviewees

45
believed that applying PGRs can decrease the number of mowing cycles needed. In the
benchmarking with peer states section of the report, it was also found that the Alabama
DOT representative recommended adding an additional PGR application cycle. This
finding is also supported by the literature review, in which it was found that herbicides
are among the most cost-efficient and effective approaches to vegetation management
(Cherry, 2003; Nowak et al., 2005).
4. Coordination of applying PGRs and mowing is critical for maximizing the benefits
of PGRs. Regarding the organizational structure of the NCDOT in terms of vegetation
management, it was previously found that there had been some coordination concerns in
terms of PGR applications and mowing. The second finding in the current study found
that this problem has since been remediated; in section 29.9A of the 2015 budget bill
(House Bill 97, Session Law 2015-241), the responsibility for mowing contracts was
shifted from Roadway Maintenance to Roadside Environmental in each Division. This
allows the same department, Roadside Environmental, to handle mowing and herbicide
contracts, as well as to optimize the timing of mowing after chemical applications.
During interviews, it was indicated that this transfer of responsibility has been completed
in 10 out of the 14 divisions, with two in transition; division 13 reported having no plans
to complete this transition, and division 10 reported different responsible parties
depending on road type, including a unit responsible for interstate contracts. In all three
peer states, divisions/districts were responsible for ensuring the execution of mowing and
herbicidal application contracts, whether or not the divisions themselves or contractors
were the ones carrying out the activity. In all three peer states, the central office was
responsible for establishing vegetation management guidelines and policies, as well as
training vegetation management staff. These facets of the organizational structure within
state DOTs for vegetation management were similar to NC. While it seems likely that
this transfer of responsibility for vegetation management practices will result in a greater
coordination between mowing and herbicidal applications, it is too soon for conclusive
data on this subject.
5. While secondary roads are mowed more frequently, interstates and primary roads
are more likely to be applied with PGR applications. This finding relates to current
vegetation management practices implemented throughout North Carolina; this
information was gleaned from interviews with division engineers representing all 14
roadside divisions. It was found that 75% of the divisions reported using plant growth
regulators on interstates, 58% reported applying PGRs on primary roads, with only 33%
reporting use of PGRs on secondary roads. In contrast, divisions reported the highest
number of mowing cycles on secondary roads (mean=4.55), followed by interstates
(mean=4.38), with the fewest mowing cycles reported on primary roads (mean=4). Four
out of six division engineers believed the use of PGRs to decrease the number of mowing
cycles by one, and two believed the use of PGRs to reduce the mowing cycles needed by
46
two. Six out of 11 division engineers reported applying PGRs between March and April,
three reported applying them in June, and two reported using PGRs in May and July.
6. Inconsistencies were found across data sources as well as fiscal years. There were
inconsistencies between the purchase order data and the NCDOT fiscal data. There were
also discrepancies between fiscal years within the NCDOT mowing and PGR data. This
suggests potentially inconsistent reporting practices across fiscal years.
7. The following barriers to increasing the coverage and number of PGR applications
were identified in interviews: too few personnel, budgetary restrictions, not enough
equipment, and having a limited time window for successful PGR applications. This
information was derived through interviews with the 14 NCDOT division representatives.
Specifically, it was reported that inadequate personnel (n=10), a low budget (n=8), not
enough equipment (n=6), limited timing for applying PGRs (n=6), and other reasons
(n=4) were mentioned as barriers to increasing PGR usage. Although cost savings are
associated with increasing the number of PGR application cycles and reducing the
number of mowing cycles, only half of the divisions (n=7) noted that they would increase
PGR cycles if barriers were overcome; six division engineers reported that they would
not increase their usage of PGRs if barriers were overcome, and five indicated that they
would expand the area treated. Additionally, six division staff reported that they would
increase the number of PGR application cycles by one, and one division staff indicated
that he would increase the number of PGR cycles by 1-2.
Recommendations
In light of the above findings, there are five recommendations that are supported by this research:
1. Consider one additional PGR application cycle, which may reduce one mowing cycle
resulting in cost savings of approximately $2.5 million per year. This
recommendation is consistent with the first finding, which is that cost savings can be
realized by replacing one mowing cycle with an additional PGR cycle. Notably most of
this savings can be seen from utilizing PGRs on the secondary system where essentially
none is used presently. This recommendation is also consistent with feedback from the
peer state ALDOT representative, who identified supplanting one mowing cycle with an
additional PGR application cycle. Prior research has also supported the efficacy and cost-
effectiveness of herbicides (Cherry, 2003; Nowak et al., 2005). However, it is important
to note that the findings of this research do not lend support to unlimited increases in the
use of PGRs. One additional constraint is that NCDOT division staff identified a limited
time frame for the effective application of PGRs (i.e. March through July).
47
2. Continue to monitor the effective coordination between mowing and PGR
applications, with the help of the Roadside Vegetation Management Tool to monitor
costs of vegetation management practices. This recommendation follows from the
finding that House Bill 97 (2015) streamlined the responsibilities for vegetation
management along NC roadsides under Roadside Environmental, making coordination
between mowing and herbicidal applications more effective. In addition, discussions
during interviews indicated that 12 out of 14 divisions had completed this transfer of
responsibility, while two divisions still maintained Roadside Maintenance’s role in
vegetation management in some form. This recommendation to effectively coordinate
mowing and herbicidal applications was supported by two of the peer state
representatives (KYDOT, TXDOT). While this may be partially remediated due to
mandated transfer of responsibility from Roadside Maintenance to Roadside
Environmental (section 29.9A in House Bill 97, Session Law 2015-241), there is a need
to monitor the continued coordination between mowing and herbicidal applications for
maximum effectiveness following the transition. Under optimal conditions, projected cost
savings should be realized; in contrast, under suboptimal weather conditions, the actual
cost savings could be lower than what is projected in this report (this is supported by
interviews). This is consistent with a recommendation by the representative for the
TXDOT, in the benchmarking with peer states section of the report, who recommended
to apply PGRs and mow and the right times of the year according to established practices.
3. Effectively integrate eco-regional approaches into vegetation management practices.
For example, establishing non-mow areas, encouraging the use of wildflowers and native
species, revitalizing turf and soil, and following other best practices are all aspects of eco-
regional approaches. These are all supported in the literature on integrated vegetation
management plans (Bennett, n.d.; Gover et al., 2007). Regular, mandatory hands-on
vegetation management training for responsible staff consistent with an eco-regional
approach to an integrated vegetation management plan that is based on the most effective
practices was recommended by TXDOT.
4. Standardize cost reporting practices for mowing and PGR applications. This could
help make NCDOT fiscal data more consistent across fiscal years. For example, one
division representative mentioned during interviews that in FY 2015, they used function
code 2908 (“Brush and Tree Control”) a lot to report turf management (i.e. herbicide
use), rather than function code 2904 (“Turf Management”). Standardizing these reporting
practices can facilitate a more precise analysis in the future.
5. Address the most common barriers to increase PGR usage as reported in the
interviews with NCDOT division staff. The most commonly mentioned barriers to
increasing PGR usage, as identified in finding 6, are related to a lack of resources;
48
specifically, a lack of personnel, equipment, and a low budget were the barriers most
often mentioned in interviews. Following these budget-related barriers is that there is a
limited window of time where applying PGRs is effective (i.e. March through July).
However, there is a caveat to this recommendation: during interviews, only half of the
division roadside engineers said that they would increase the number of PGR cycles
applied if these barriers were overcome, with five saying that they would increase the
area treated. In fact, six division roadside engineers explicitly stated that they would not
increase PGR usage even if obstacles were remediated.

49
Close-out Implementation Plan
NCDOT Research and Development
RP 2016-17 Economic Analysis of Vegetation Management Practices Project Start Date: 8/01/2015
Project Completion Date: 7/31/2017
Project Cost: $186,127
Customers and Stakeholders
David Harris
Derek Smith
Don Lee
Kevin Clemmer
Neil Mastin
Morgan DeWit
Deliverables received: X Literature Search Results
X Draft Final Report
X Quarterly Progress Reports
Final Report
P. I.’s Recommendations per Final Report (see attached):
1. Consider one additional PGR application cycle, which may reduce one mowing cycle
2. Continue to monitor the effective coordination between mowing and PGR
applications, with the help of the Roadside Vegetation Management Tool.
3. Effectively integrate eco-regional approaches into vegetation management practices.
4. Standardize cost reporting practices for mowing and applying PGRs.
5. Address the most common barriers to increase PGR usage.
Implementable Research Products (output): The primary implementable research product from this project
are the 5 recommendations above.
Implementation Plan (Now what?): (For suggestions, see list on the other side)
Training: Training may be required for Recommendation #4 above.
Outreach: Outreach is necessary to Division personnel for implementing Recommendation #1 above. In addition, outreach will also be necessary to identify the necessary rectifications for the barriers ,mentioned in Recommendation #5.
Revise documents (e.g., specifications design guidelines, etc.): N/A
Application to processes (e.g., design): N/A
Application to projects: Meetings with Division personnel necessary to implement Recommendation #1
50
Other: N/A
Anticipated Benefits (outcome): Implementing Recommendation #1 can save $2.5 million/year and the same for Recommendation #5 can increase these savings. Implementing Recommendation #4 will lead to more accurate and consistent cost information for future analysis projects.
How can Research and Development Unit participate? Coordinate communication and outreach.
Any other comment: N/A
Your Name James B Martin Date __7__ - ___31__ - __2017____
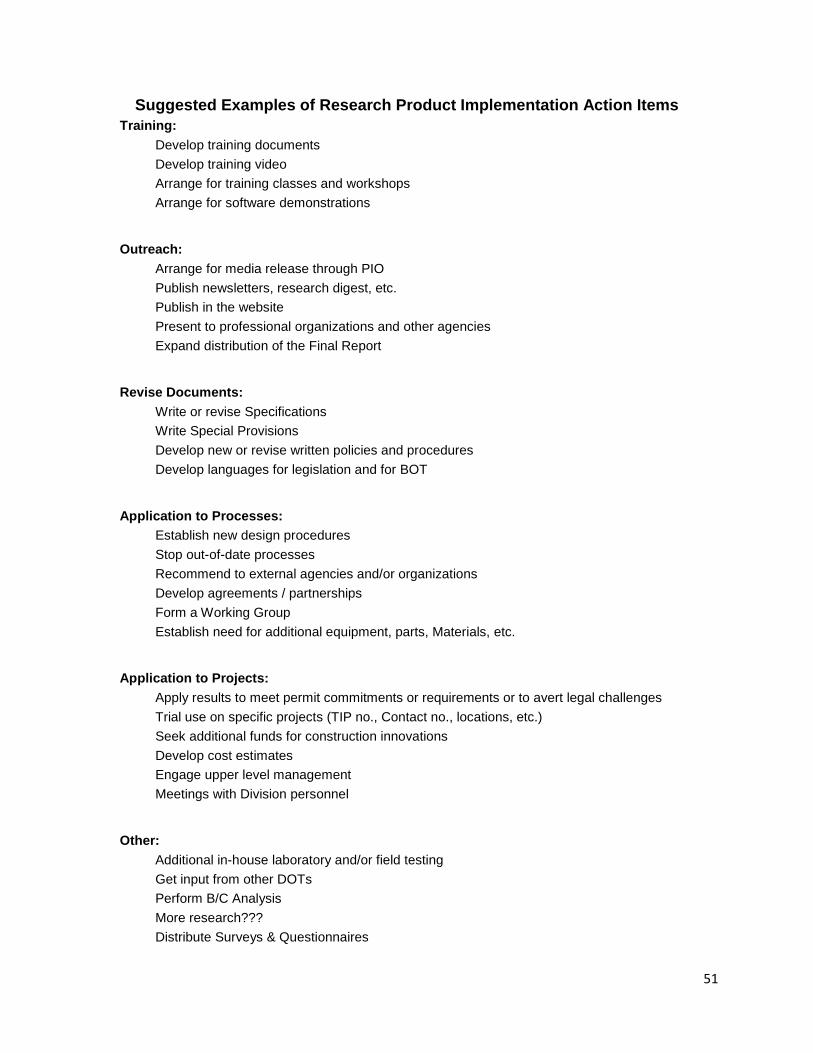
51
Suggested Examples of Research Product Implementation Action Items
Training:
Develop training documents
Develop training video
Arrange for training classes and workshops
Arrange for software demonstrations
Outreach:
Arrange for media release through PIO
Publish newsletters, research digest, etc.
Publish in the website
Present to professional organizations and other agencies
Expand distribution of the Final Report
Revise Documents:
Write or revise Specifications
Write Special Provisions
Develop new or revise written policies and procedures
Develop languages for legislation and for BOT
Application to Processes:
Establish new design procedures
Stop out-of-date processes
Recommend to external agencies and/or organizations
Develop agreements / partnerships
Form a Working Group
Establish need for additional equipment, parts, Materials, etc.
Application to Projects:
Apply results to meet permit commitments or requirements or to avert legal challenges
Trial use on specific projects (TIP no., Contact no., locations, etc.)
Seek additional funds for construction innovations
Develop cost estimates
Engage upper level management
Meetings with Division personnel
Other:
Additional in-house laboratory and/or field testing
Get input from other DOTs
Perform B/C Analysis
More research???
Distribute Surveys & Questionnaires
52
References
Barker, A.V. & Prostak, R.G. (2009). Alternative management of roadside vegetation.
HortTechnology, 19(2), 346-352. Retrieved from
http://horttech.ashspublications.org/content/19/2/346.full.
Bennett, M. (n.d.). Non-chemical vegetation management solutions: Southern Oregon forestry
note #9. Oregon State University Extension: Corvallis, OR.
Berger, R.L. (2005). National Cooperative Highway Research Program Synthesis 341: Integrated
Roadside Vegetation Management. Transportation Research Board: Olympia, WA.
Brandt, J., Henderson, K., & Uthe, J. (2015). Integrated Roadside Vegetation Management
Technical Manual. United States Department of Agriculture Natural Resources
Conservation Service: Prairie City, IA. Available at www.uni.edu/irvm.
Brennan, L.A. (2012). Comparison and assessment of mechanical and herbicide-chemical side-
trimming methods of managing roadside vegetation by the Texas department of
transportation: Technical report 0-6732-1. Texas A&M University-Kingsville:
Kingsville, TX. Retrieved from
http://d2dtl5nnlpfr0r.cloudfront.net/tti.tamu.edu/documents/0-6732-1.pdf.
Cherry, K. (2003). Integrated weed management: Report NM02ENV-02. New Mexico
Department of Transportation Research Bureau: Albuquerque, NM. Retrieved from
http://dot.state.nm.us/content/dam/nmdot/Research/NM02ENV02IntegratedNoxiousWee
dMgmtNM2003.pdf.
Colorado State University Agricultural Sciences (2014). Right of way issues in an urban
environment: How to take advantage of herbicide versatility and label restrictions
[PowerPoint slides]. Retrieved from
http://wci.colostate.edu/Assets/pdf/PMW2012/Helm.109.pdf.
Division of Plant Industry: Colorado Department of Agriculture. (2000). Creating an integrated
weed management plan: A handbook for owners and managers of lands with natural
values. Caring For The Land Series, 4. Retrieved from
http://www.blm.gov/pgdata/etc/medialib/blm/wy/programs/invasiveplants/docs.Par.4243
4.File.dat/IWMhandbook.pdf.
Duke, S.O. (1990). Overview of herbicide mechanisms of action. Environmental Health
Perspectives, 87, 263-271.
Gover, A., Johnson, J., & Kuhns, L. (2007). Herbicide applicator training: Module 2. Penn State
Department of Horticulture College of Agricultural Sciences. Penn State University:
State College, PA. Retrieved from
http://plantscience.psu.edu/research/projects/vegetative-
management/publications/herbicide-applicator-training/module-2-penndot-herbicide-
program-overview.
Harper-Lore, B., Johnson, M., & Ostrum, W.F. (2013). Vegetation management: An ecoregional
approach. US Department of Transportation Federal Highway Administration:
Washington, D.C.
Harper-Lore, B., Johnson, M., & Skinner, M.W. (2007). Roadside Weed Management. Retrieved
from http://www.weedcenter.org/.
Haymond, J.L. & McNabb, K. (1994). Stand improvement. Southern Hardwood Management R8-
MB 67, 45-50.
Holland, F.H. (2013). Roadside Vegetation Manual. Texas Department of Transportation: Austin,
TX.
53
Herold, J.M., Lowe, Z.E., & Dukes, J.S. (2013). Integrated Vegetation Management (IVM) for
INDOT Roadsides. Publication FHWA/IN/JTRP-2013/08. Joint Transportation Research
Program, Indiana Department of Transportation and Purdue University. West Lafayette,
IN. doi: 10.5703/1288284315210
Jackson, D.R. & Finely, J.C. (2007). Herbicides and Forest Vegetation Management: Controlling
Unwanted Trees, Brush, and other Competing Forest Vegetation. The Pennsylvania State
University: University Park, PA.
Johnstone, R.A. (2008). Integrated vegetation management. Utility Arborist Association Summer
Quarterly.
Kaynak, H. (2003). The relationship between total quality management practices and their effects
on firm performance. Journal of Operations Management, 21(4), 405-435.
Lincoln County Noxious Weed Control Board. (n.d.) Tips for noxious weed control. Lincoln
County Noxious Weed Control Board: Davenport, WA.
Maintenance and Operations Division. (2003). A comparison of roadside maintenance practices:
Impacts of herbicide use on cost and results. Washington State Department of
Transportation: Tumwater, WA. Retrieved from
http://www.wsdot.wa.gov/NR/rdonlyres/7A91C8A4-C1B8-4B2D-8A2A-
861F3D0254A3/0/Comparison_Herbicide.pdf.
Nair, A. (2006). Meta-analysis of the relationship between quality management practices and firm
performance—implications for quality management theory development. Journal of
Operations Management, 24(6), 948-975.
NCDOT. (2017). NCDOT Fast Facts. http://www.ncdot.gov/download/newsroom/FastFacts.pdf
NCDOT Roadside Environmental Unit. (n.d.). Vegetation management section: Maintenance
programs. Retrieved from www.ncdot.gov.
Nowak, C.A., Bukowski, C.J., & Ballard, B.D. (2005). Developing a cost-effectiveness model for
research, development, and application of herbicide and non-herbicide vegetation
management treatments for roadside rights-of-way. State University of New York
College of Environmental Science and Forestry: Syracuse, NY. Retrieved from
https://www.dot.ny.gov/divisions/engineering/environmental-analysis/repository/c-02-
09-4.pdf.
Penn State College of Agricultural Sciences. (2016). Chemical weed control. Penn State
University: State College, PA.
Young, S.L. (2003). Exploring alternative methods for vegetation control and maintenance along
roadsides. Hopland Research and Extension Center, University of California: Hopland,
CA. Retrieved from http://www.dot.ca.gov/newtech/researchreports/2002-
2006/2003/alternative_vegetation_control_final_report.pdf.
http://www.wsdot.wa.gov/NR/rdonlyres/7A91C8A4-C1B8-4B2D-8A2A-861F3D0254A3/0/Comparison_Herbicide.pdf
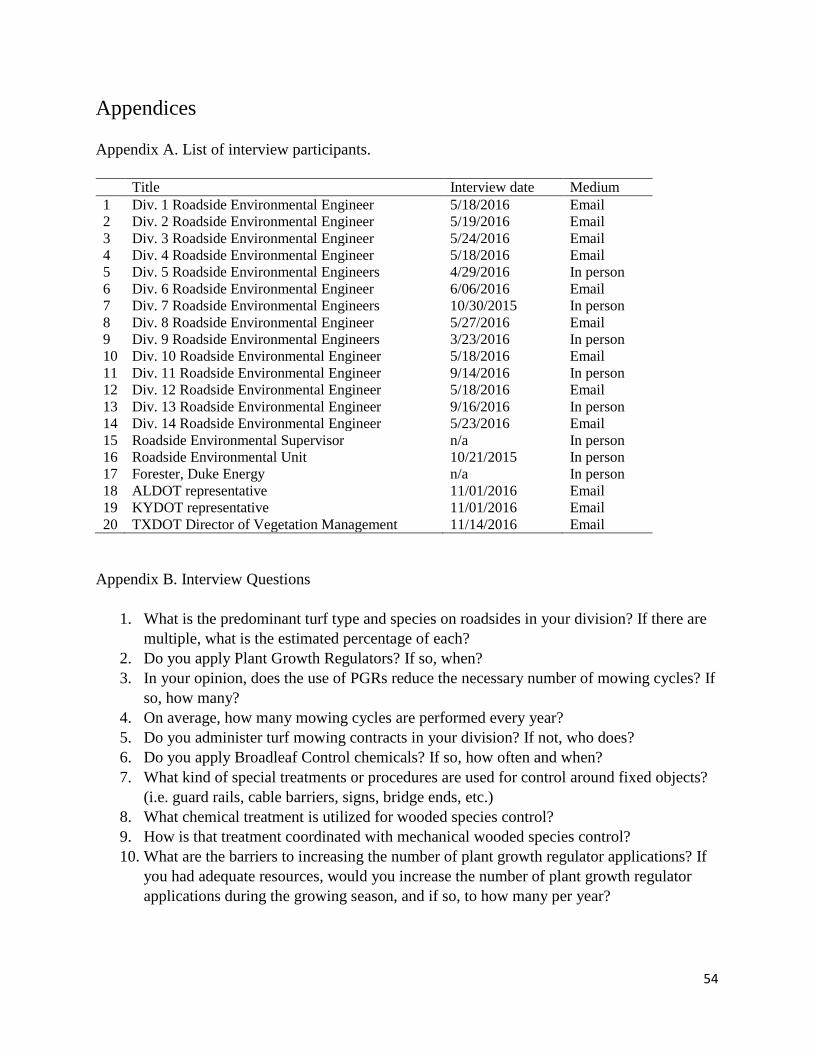
54
Appendices
Appendix A. List of interview participants.
Title Interview date Medium
1 Div. 1 Roadside Environmental Engineer 5/18/2016 Email
2 Div. 2 Roadside Environmental Engineer 5/19/2016 Email
3 Div. 3 Roadside Environmental Engineer 5/24/2016 Email
4 Div. 4 Roadside Environmental Engineer 5/18/2016 Email
5 Div. 5 Roadside Environmental Engineers 4/29/2016 In person
6 Div. 6 Roadside Environmental Engineer 6/06/2016 Email
7 Div. 7 Roadside Environmental Engineers 10/30/2015 In person
8 Div. 8 Roadside Environmental Engineer 5/27/2016 Email
9 Div. 9 Roadside Environmental Engineers 3/23/2016 In person
10 Div. 10 Roadside Environmental Engineer 5/18/2016 Email
11 Div. 11 Roadside Environmental Engineer 9/14/2016 In person
12 Div. 12 Roadside Environmental Engineer 5/18/2016 Email
13 Div. 13 Roadside Environmental Engineer 9/16/2016 In person
14 Div. 14 Roadside Environmental Engineer 5/23/2016 Email
15 Roadside Environmental Supervisor n/a In person
16 Roadside Environmental Unit 10/21/2015 In person
17 Forester, Duke Energy n/a In person
18 ALDOT representative 11/01/2016 Email
19 KYDOT representative 11/01/2016 Email
20 TXDOT Director of Vegetation Management 11/14/2016 Email
Appendix B. Interview Questions
1. What is the predominant turf type and species on roadsides in your division? If there are
multiple, what is the estimated percentage of each?
2. Do you apply Plant Growth Regulators? If so, when?
3. In your opinion, does the use of PGRs reduce the necessary number of mowing cycles? If
so, how many?
4. On average, how many mowing cycles are performed every year?
5. Do you administer turf mowing contracts in your division? If not, who does?
6. Do you apply Broadleaf Control chemicals? If so, how often and when?
7. What kind of special treatments or procedures are used for control around fixed objects?
(i.e. guard rails, cable barriers, signs, bridge ends, etc.)
8. What chemical treatment is utilized for wooded species control?
9. How is that treatment coordinated with mechanical wooded species control?
10. What are the barriers to increasing the number of plant growth regulator applications? If
you had adequate resources, would you increase the number of plant growth regulator
applications during the growing season, and if so, to how many per year?

55
Appendix C. Questions for Benchmarking with Peer States
1. What is the total acreage/mileage of vegetation managed in your department? How many
employees are staffed? What is your annual budget?
2. Can you provide the organizational structure in your state for vegetation management?
Are herbicidal treatments handled by the same department that handles mechanical
vegetation control (e.g. mowing)? If you could provide us with an organizational chart of
the organization responsible for vegetation management, this would be especially helpful.
3. What are the vegetation management practices followed in your state? Of particular
importance to us are the following aspects of vegetation management: turf management
(mowing as well as herbicidal applications), guardrail and fixed object vegetation control,
as well as broadleaf management.
4. Based upon your experience, what would you consider to be 3-5 best practices for
vegetation management in your state?
5. Are there any additional comments you would like to include regarding your vegetation
management program? This can include emerging trends, challenges, and concerns,
among others.
6. If you have any supporting documentation or background information regarding your
state's vegetation management practices, that would be helpful.

56
Appendix D. Table of contents for the mowing template for NCDOT vegetation management
contractors, followed by a sample bid sheet.
57
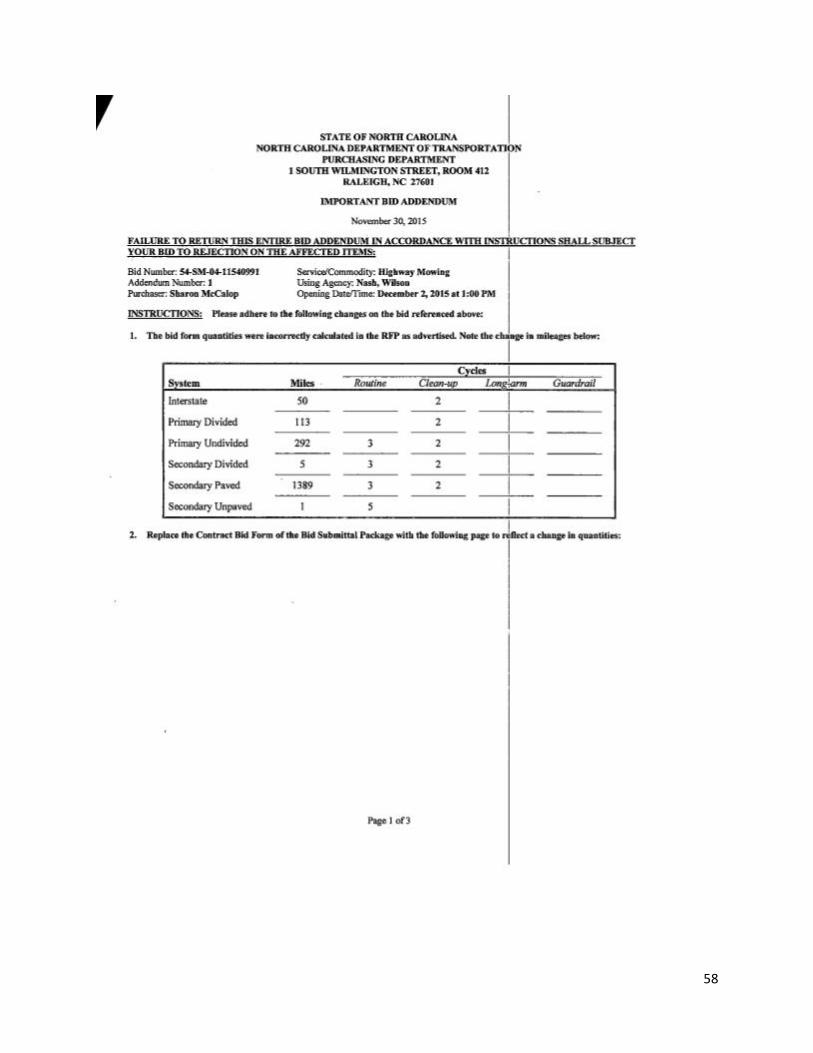
58
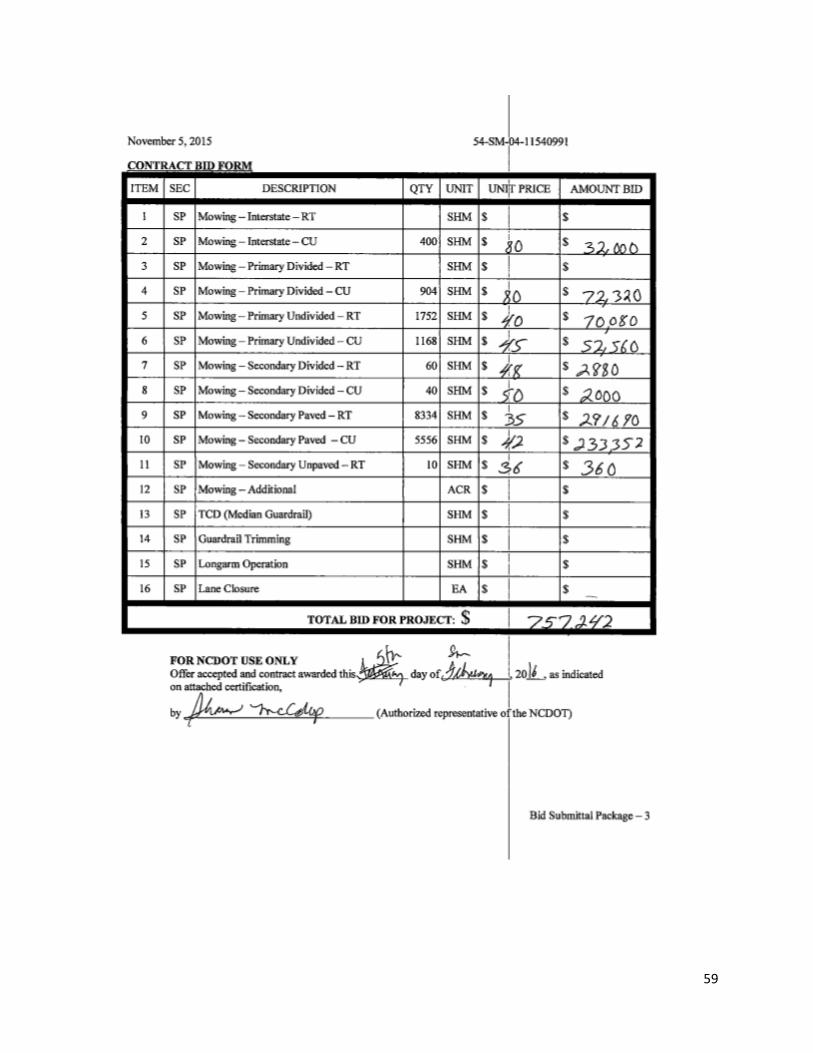
59
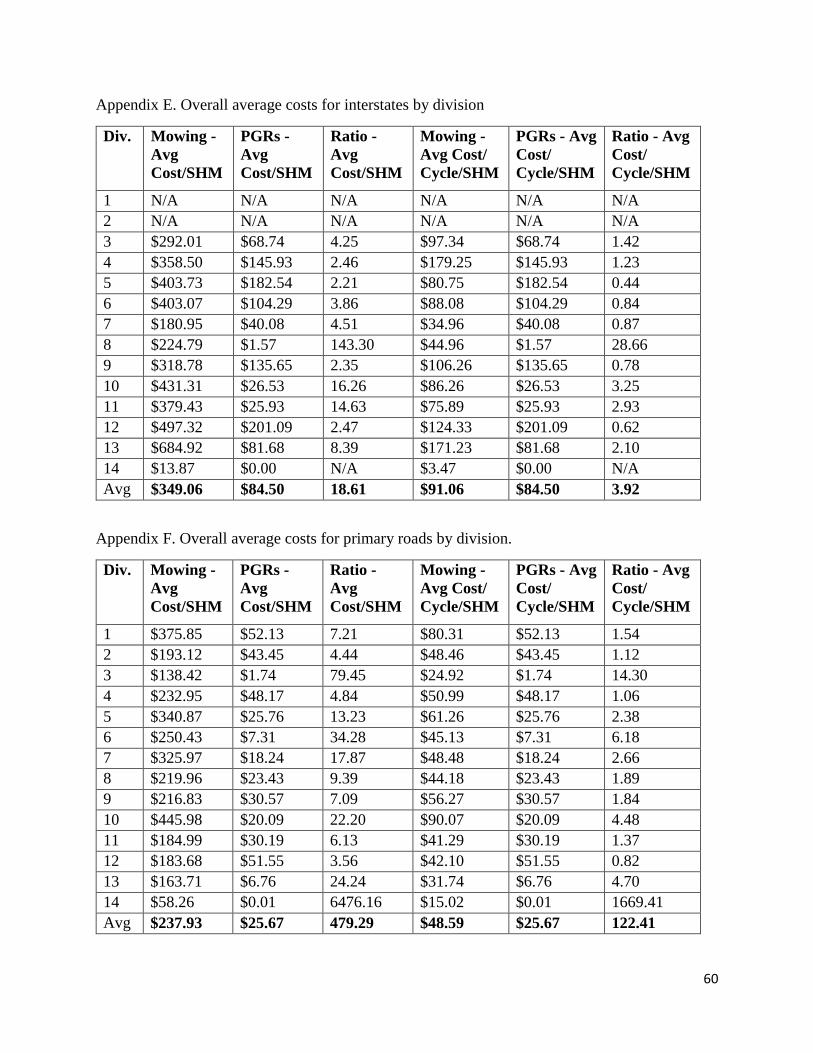
60
Appendix E. Overall average costs for interstates by division
Div. Mowing -
Avg
Cost/SHM
PGRs -
Avg
Cost/SHM
Ratio -
Avg
Cost/SHM
Mowing -
Avg Cost/
Cycle/SHM
PGRs - Avg
Cost/
Cycle/SHM
Ratio - Avg
Cost/
Cycle/SHM
1 N/A N/A N/A N/A N/A N/A
2 N/A N/A N/A N/A N/A N/A
3 $292.01 $68.74 4.25 $97.34 $68.74 1.42
4 $358.50 $145.93 2.46 $179.25 $145.93 1.23
5 $403.73 $182.54 2.21 $80.75 $182.54 0.44
6 $403.07 $104.29 3.86 $88.08 $104.29 0.84
7 $180.95 $40.08 4.51 $34.96 $40.08 0.87
8 $224.79 $1.57 143.30 $44.96 $1.57 28.66
9 $318.78 $135.65 2.35 $106.26 $135.65 0.78
10 $431.31 $26.53 16.26 $86.26 $26.53 3.25
11 $379.43 $25.93 14.63 $75.89 $25.93 2.93
12 $497.32 $201.09 2.47 $124.33 $201.09 0.62
13 $684.92 $81.68 8.39 $171.23 $81.68 2.10
14 $13.87 $0.00 N/A $3.47 $0.00 N/A
Avg $349.06 $84.50 18.61 $91.06 $84.50 3.92
Appendix F. Overall average costs for primary roads by division.
Div. Mowing -
Avg
Cost/SHM
PGRs -
Avg
Cost/SHM
Ratio -
Avg
Cost/SHM
Mowing -
Avg Cost/
Cycle/SHM
PGRs - Avg
Cost/
Cycle/SHM
Ratio - Avg
Cost/
Cycle/SHM
1 $375.85 $52.13 7.21 $80.31 $52.13 1.54
2 $193.12 $43.45 4.44 $48.46 $43.45 1.12
3 $138.42 $1.74 79.45 $24.92 $1.74 14.30
4 $232.95 $48.17 4.84 $50.99 $48.17 1.06
5 $340.87 $25.76 13.23 $61.26 $25.76 2.38
6 $250.43 $7.31 34.28 $45.13 $7.31 6.18
7 $325.97 $18.24 17.87 $48.48 $18.24 2.66
8 $219.96 $23.43 9.39 $44.18 $23.43 1.89
9 $216.83 $30.57 7.09 $56.27 $30.57 1.84
10 $445.98 $20.09 22.20 $90.07 $20.09 4.48
11 $184.99 $30.19 6.13 $41.29 $30.19 1.37
12 $183.68 $51.55 3.56 $42.10 $51.55 0.82
13 $163.71 $6.76 24.24 $31.74 $6.76 4.70
14 $58.26 $0.01 6476.16 $15.02 $0.01 1669.41
Avg $237.93 $25.67 479.29 $48.59 $25.67 122.41

61
Appendix G. Overall average costs for secondary roads by division.
Div. Mowing -
Avg
Cost/SHM
PGRs -
Avg
Cost/SHM
Ratio -
Avg
Cost/SHM
Mowing -
Avg Cost/
Cycle/SHM
PGRs - Avg
Cost/
Cycle/SHM
Ratio - Avg
Cost/
Cycle/SHM
1 $243.67 $1.21 200.78 $48.76 $1.21 40.18
2 $169.67 $1.01 168.36 $42.42 $1.01 42.09
3 $63.43 $0.89 71.12 $13.69 $0.89 15.35
4 $182.89 $0.16 1133.29 $36.73 $0.16 227.61
5 $162.73 $6.30 25.81 $33.83 $6.30 5.37
6 $160.29 $0.07 2447.54 $28.15 $0.07 429.76
7 $198.26 $0.00 N/A $35.37 $0.00 N/A
8 $141.25 $0.15 929.18 $28.77 $0.15 189.24
9 $81.83 $0.09 906.39 $20.65 $0.09 228.76
10 $246.75 $0.06 4302.59 $55.21 $0.06 962.64
11 $125.79 $0.14 890.99 $27.75 $0.14 196.55
12 $95.97 $1.43 66.91 $21.69 $1.43 15.12
13 $89.28 $0.09 1015.94 $22.79 $0.09 259.35
14 $34.14 $0.01 3809.16 $8.88 $0.01 991.22
Avg $142.57 $0.83 1228.31 $30.33 $0.83 277.17

62
Appendix H. Analysis of interviews by question.
Summary of Information obtained from Interviews with NCDOT Division Representatives
Out of 14 NCDOT roadside environmental engineers representing the 14 divisions that
were initially contacted, all 14 participated in either in-person or telephone interviews. Division
numbers 1 and 2 do not have an interstate included in their divisions. A copy of the interview list
is displayed in Appendix A, and interview questions are included in Appendix B.
Question 1: What is the predominant turf type and species on roadsides in your Division?
If there are multiple what is the estimated percentage of each? All 14 interview participants
provided answers to this question. See the tables below for percentages of the four types of turf,
sorted by the type of roadway system and by division. Table 16 shows that both centipede grass
and Fescue are the most common turf types found along interstates in North Carolina (10 out of
12 interview participants reported a presence of this species in their divisions). Bermuda and
Bahia are the next most prevalent (both were mentioned by 3 out of 12 interviewees). “Other”
was mentioned once, with division 13 reporting a presence of zoysia in the division. The mean
percentage of centipede grass presence in interstate systems is 36.8%, the mean percentage of
Fescue is 66.8%, for Bermuda the average percentage is 18%, and the average percentage of
Bahia is 25%. This shows that Fescue is used in the largest percentage when compared to other
turf types, with centipede grass making up the second largest percentage. Bahia is used in greater
percentages than Bermuda.
Table 16 Turf types in interstate systems separated by division number.
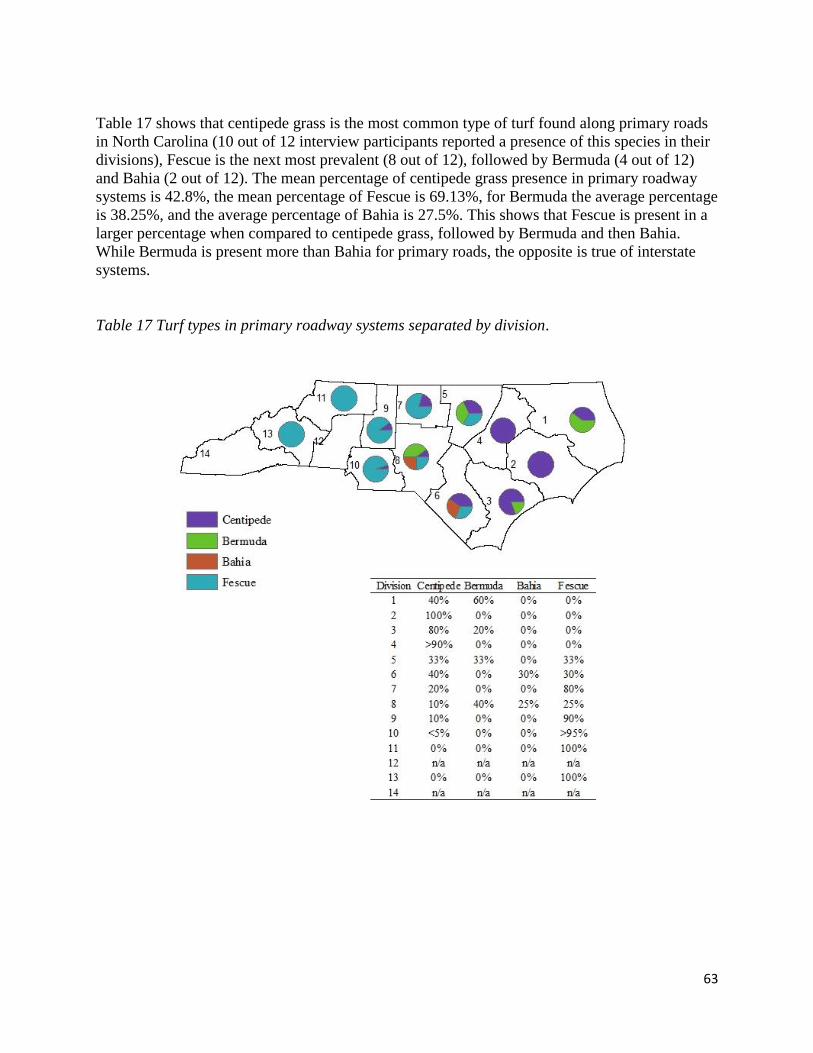
63
Table 17 shows that centipede grass is the most common type of turf found along primary roads
in North Carolina (10 out of 12 interview participants reported a presence of this species in their
divisions), Fescue is the next most prevalent (8 out of 12), followed by Bermuda (4 out of 12)
and Bahia (2 out of 12). The mean percentage of centipede grass presence in primary roadway
systems is 42.8%, the mean percentage of Fescue is 69.13%, for Bermuda the average percentage
is 38.25%, and the average percentage of Bahia is 27.5%. This shows that Fescue is present in a
larger percentage when compared to centipede grass, followed by Bermuda and then Bahia.
While Bermuda is present more than Bahia for primary roads, the opposite is true of interstate
systems.
Table 17 Turf types in primary roadway systems separated by division.
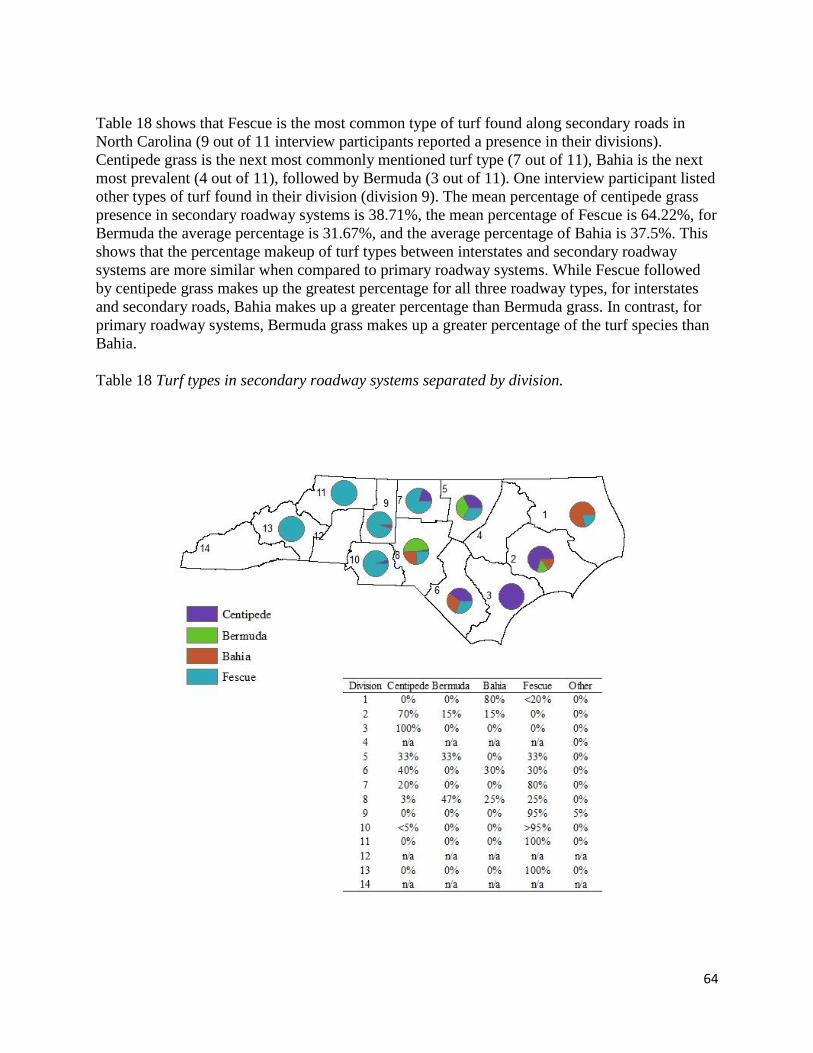
64
Table 18 shows that Fescue is the most common type of turf found along secondary roads in
North Carolina (9 out of 11 interview participants reported a presence in their divisions).
Centipede grass is the next most commonly mentioned turf type (7 out of 11), Bahia is the next
most prevalent (4 out of 11), followed by Bermuda (3 out of 11). One interview participant listed
other types of turf found in their division (division 9). The mean percentage of centipede grass
presence in secondary roadway systems is 38.71%, the mean percentage of Fescue is 64.22%, for
Bermuda the average percentage is 31.67%, and the average percentage of Bahia is 37.5%. This
shows that the percentage makeup of turf types between interstates and secondary roadway
systems are more similar when compared to primary roadway systems. While Fescue followed
by centipede grass makes up the greatest percentage for all three roadway types, for interstates
and secondary roads, Bahia makes up a greater percentage than Bermuda grass. In contrast, for
primary roadway systems, Bermuda grass makes up a greater percentage of the turf species than
Bahia.
Table 18 Turf types in secondary roadway systems separated by division.
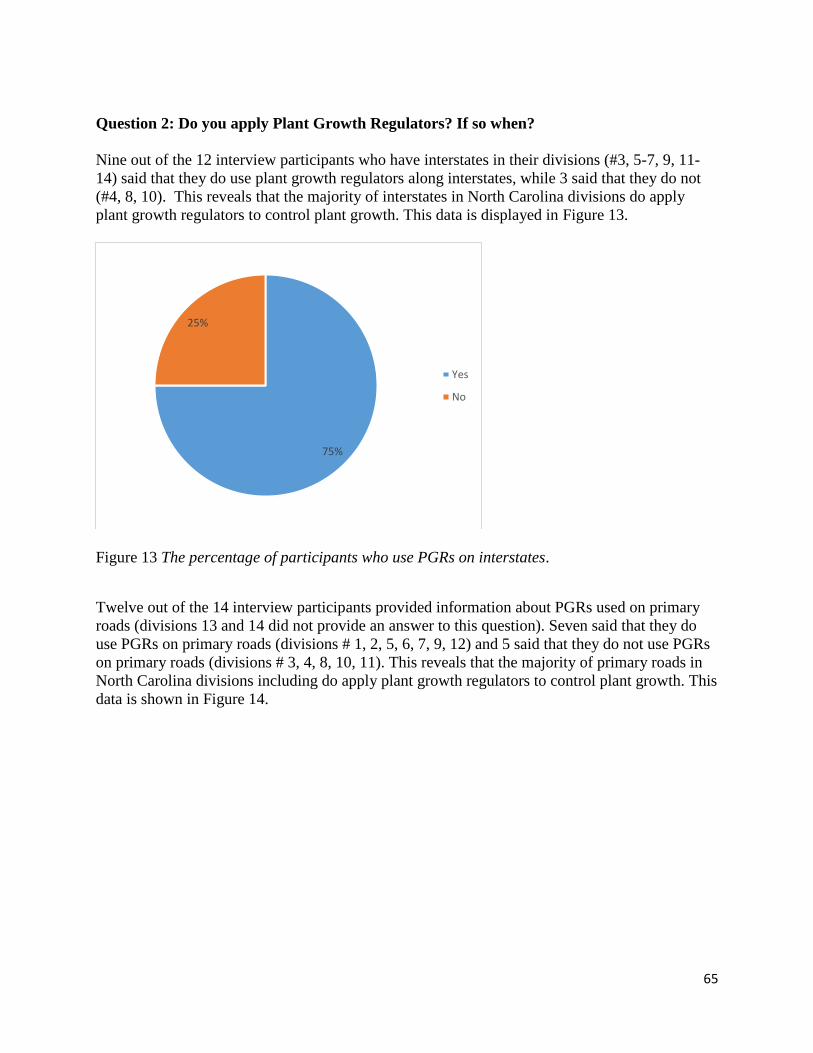
65
Question 2: Do you apply Plant Growth Regulators? If so when?
Nine out of the 12 interview participants who have interstates in their divisions (#3, 5-7, 9, 11-
14) said that they do use plant growth regulators along interstates, while 3 said that they do not
(#4, 8, 10). This reveals that the majority of interstates in North Carolina divisions do apply
plant growth regulators to control plant growth. This data is displayed in Figure 13.
Figure 13 The percentage of participants who use PGRs on interstates.
Twelve out of the 14 interview participants provided information about PGRs used on primary
roads (divisions 13 and 14 did not provide an answer to this question). Seven said that they do
use PGRs on primary roads (divisions # 1, 2, 5, 6, 7, 9, 12) and 5 said that they do not use PGRs
on primary roads (divisions # 3, 4, 8, 10, 11). This reveals that the majority of primary roads in
North Carolina divisions including do apply plant growth regulators to control plant growth. This
data is shown in Figure 14.
75%
25%
Yes
No
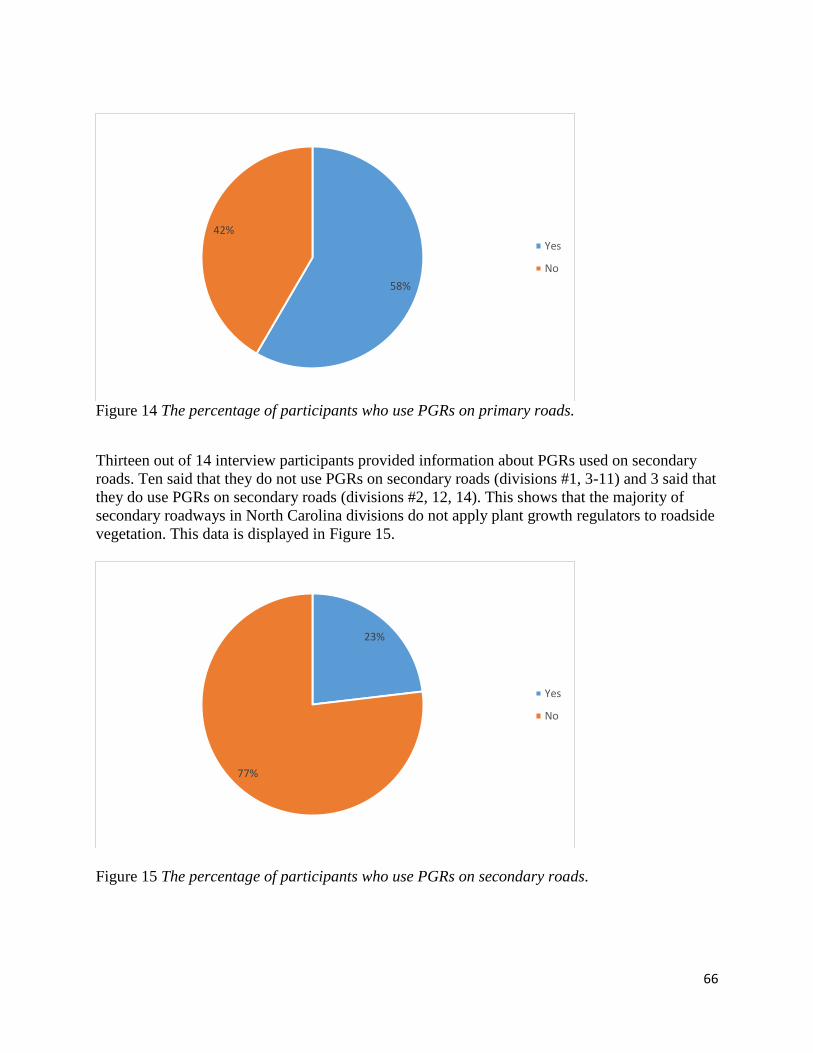
66
Figure 14 The percentage of participants who use PGRs on primary roads.
Thirteen out of 14 interview participants provided information about PGRs used on secondary
roads. Ten said that they do not use PGRs on secondary roads (divisions #1, 3-11) and 3 said that
they do use PGRs on secondary roads (divisions #2, 12, 14). This shows that the majority of
secondary roadways in North Carolina divisions do not apply plant growth regulators to roadside
vegetation. This data is displayed in Figure 15.
Figure 15 The percentage of participants who use PGRs on secondary roads.
58%
42%
Yes
No
23%
77%
Yes
No
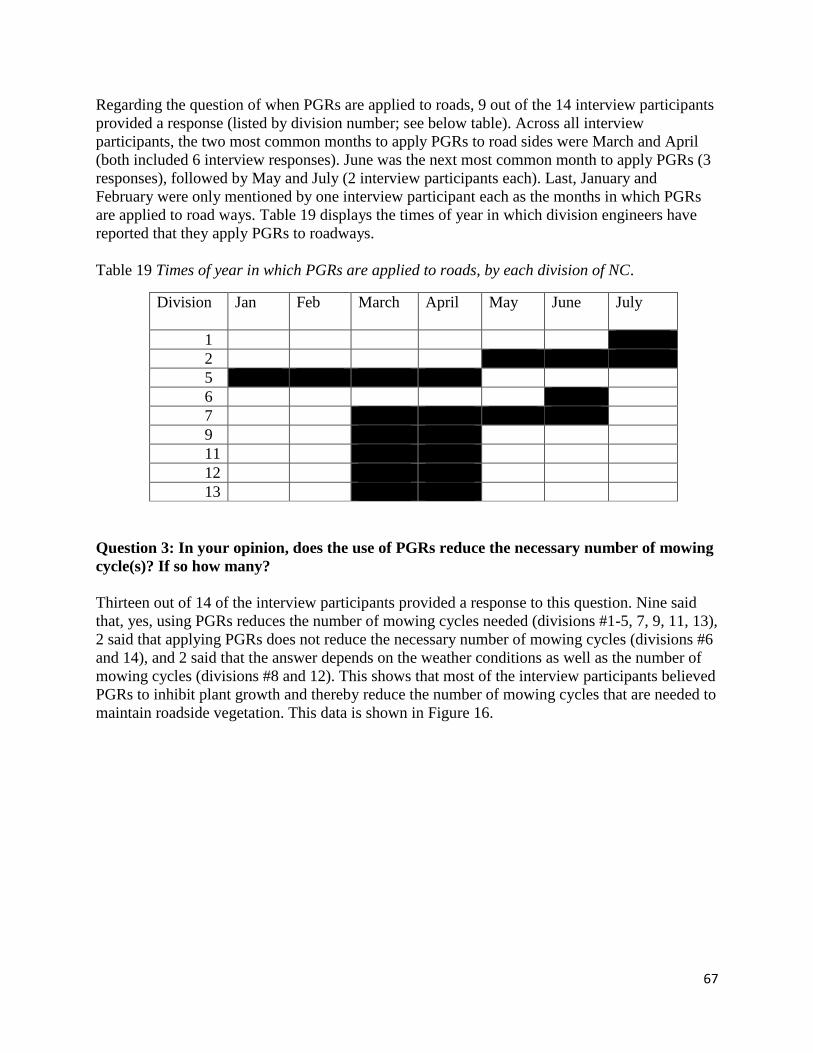
67
Regarding the question of when PGRs are applied to roads, 9 out of the 14 interview participants
provided a response (listed by division number; see below table). Across all interview
participants, the two most common months to apply PGRs to road sides were March and April
(both included 6 interview responses). June was the next most common month to apply PGRs (3
responses), followed by May and July (2 interview participants each). Last, January and
February were only mentioned by one interview participant each as the months in which PGRs
are applied to road ways. Table 19 displays the times of year in which division engineers have
reported that they apply PGRs to roadways.
Table 19 Times of year in which PGRs are applied to roads, by each division of NC.
Division
N.
Jan Feb March April May June July
1
2
5
6
7
9
11
12
13
Question 3: In your opinion, does the use of PGRs reduce the necessary number of mowing
cycle(s)? If so how many?
Thirteen out of 14 of the interview participants provided a response to this question. Nine said
that, yes, using PGRs reduces the number of mowing cycles needed (divisions #1-5, 7, 9, 11, 13),
2 said that applying PGRs does not reduce the necessary number of mowing cycles (divisions #6
and 14), and 2 said that the answer depends on the weather conditions as well as the number of
mowing cycles (divisions #8 and 12). This shows that most of the interview participants believed
PGRs to inhibit plant growth and thereby reduce the number of mowing cycles that are needed to
maintain roadside vegetation. This data is shown in Figure 16.
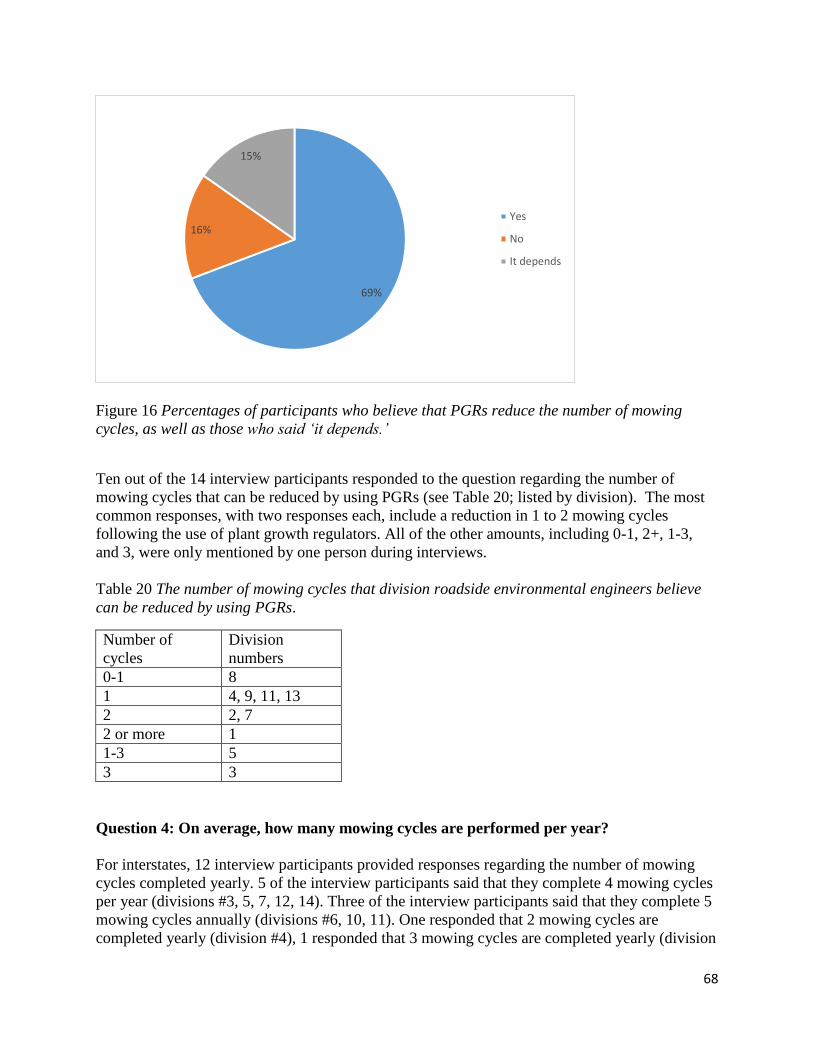
68
Figure 16 Percentages of participants who believe that PGRs reduce the number of mowing
cycles, as well as those who said ‘it depends.’
Ten out of the 14 interview participants responded to the question regarding the number of
mowing cycles that can be reduced by using PGRs (see Table 20; listed by division). The most
common responses, with two responses each, include a reduction in 1 to 2 mowing cycles
following the use of plant growth regulators. All of the other amounts, including 0-1, 2+, 1-3,
and 3, were only mentioned by one person during interviews.
Table 20 The number of mowing cycles that division roadside environmental engineers believe
can be reduced by using PGRs.
Number of
cycles
Division
numbers
0-1 8
1 4, 9, 11, 13
2 2, 7
2 or more 1
1-3 5
3 3
Question 4: On average, how many mowing cycles are performed per year?
For interstates, 12 interview participants provided responses regarding the number of mowing
cycles completed yearly. 5 of the interview participants said that they complete 4 mowing cycles
per year (divisions #3, 5, 7, 12, 14). Three of the interview participants said that they complete 5
mowing cycles annually (divisions #6, 10, 11). One responded that 2 mowing cycles are
completed yearly (division #4), 1 responded that 3 mowing cycles are completed yearly (division
69%
16%
15%
Yes
No
It depends

69
#9), and 1 responded that 4-5 mowing cycles are completed every year (division #8). One said
that 2-4 mowing cycles are completed annually (#13), 2 for warm season grasses and 4 for
Fescue. This shows that the majority of the interview participants to complete 4 mowing cycles
on interstates within their divisions, with 5 cycles being second most common. Figure 17
displays the number of mowing cycles completed on interstates as reported by division
engineers.
Figure 17 Percentages of the number of mowing cycles completed yearly on interstates.
For primary roads, 12 interview participants provided responses. Three interview participants
said that they complete 4 mowing cycles every year (divisions #2, 5, 14). Three interview
participants said that they complete 3 mowing cycles annually (divisions #1, 9, 13), and 3
interview participants stated that they complete 5 mowing cycles yearly (divisions # 6, 10, 11).
One interview participant said that 2 mowing cycles are completed annually (division # 4). One
interview participant stated that 3-4 mowing cycles are completed every year (division #12), and
1 interview participant said that 4-5 mowing cycles are completed annually (division #3). This
shows that on primary roads in North Carolina, it is most common to complete 3-5 mowing
cycles yearly; all have 3 divisions that reported this. Figure 18 displays the number of mowing
cycles completed on primary roadways as reported by division engineers.
2 cycles9%
3 cycles8%
2 to 4 cycles8%
4 cycles42%
4 to 5 cycles8%
5 cycles25%

70
Figure 18 Percentages of the number of mowing cycles completed yearly on primary roads.
For secondary roads, 12 interview participants provided responses. 5 interview participants
stated that 5 mowing cycles are completed annually (divisions # 1, 4, 5, 6, 10). Four interview
participants said that 4 mowing cycles are completed annually (divisions # 2, 11, 12, 14), and 2
said that 4-5 mowing cycles are completed every year (divisions # 3 and 9). One said that 3
mowing cycles are completed annually on secondary roads (#13). This shows that on secondary
roads in North Carolina, 5 mowing cycles are most commonly completed, followed by 4 cycles.
Figure 19 shows the number of mowing cycles completed on secondary roads as reported during
interviews.
Figure 19 Percentages of the number of mowing cycles completed yearly on secondary roads.
2 cycles9%
3 cycles25%
3 to 4 cycles
8%4 cycles25%
4 to 5 cycles8%
5 cycles25%
3 cycles8%
4 cycles33%
4 to 5 cycles17%
5 cycles42%
71
Question 5: Do you administer turf mowing contracts in your Division? If not, who does?
All 14 interview participants provided information regarding parties responsible for
administering turf mowing contracts within their respective divisions. Ten responded that they
are the ones responsible for administering turf mowing contracts in their respective divisions
(divisions #1-6, 9, 11, 12, 14). Two replied that the party responsible for administering turf
mowing contracts is in transition (divisions #7 and 8). The division 10 representative is the only
one that differentiated the answer by type of road. The representative from division 13 mentioned
that Roadside Maintenance is still responsible for mowing contracts, and that there is better
coordination than there had been in the past; the division 13 interviewee also mentioned that
there is currently no plan for Roadside Environmental to inspect contractors.
[Included in the section on contracts: “In North Carolina, almost all of the divisions have made
the administrative transition from Roadside Maintenance to the Roadside Environmental Unit for
litter and vegetation management (divisions #1-6, 9, 11, 12, 14). Divisions 7 and 8 explained that
the party responsible for mowing contracts is currently in transition. While division 13 still has
Roadside Maintenance administering mowing contracts, in division 10 there is collaboration
between Roadside Maintenance and Roadside Environmental in the administration of mowing
contracts.”]
The representative from division 7 replied:
“This is my first year administering mowing contracts. We are currently transitioning from the
maintenance unit this year. The Maintenance UNIT has performed the mowing and other
mechanical operations in the past years we are currently transitioning the operation over to my
department the transition should be completed by the end of this year.”
The division 8 representative stated that “we are currently transitioning to administer mowing
contracts. In the process of hiring inspectors and training them to take over from county
maintenance.”
One interview participant stated that they are responsible for administering some of the turf
mowing contracts (division #10): “I administer them on Primary and Secondary routes in 4 out
of the 5 counties in our division. The Maintenance unit in the 5th county mows their own, and
the Interstate Maintenance Unit maintains the interstates.”
Out of the 14 interview participants, 4 provided information regarding other parties responsible
for turf mowing contracts other than themselves. One said that the responsibility for mowing
contracts still rests with the Roadside Maintenance department. Three said that this responsibility
is currently in transition; out of these 3, 1 person said that the responsibility is transitioning from
maintenance to their department, and 1 person said that the responsibility is transitioning from
county maintenance to inspectors.
Question 6: Do you apply Broadleaf Control chemicals? If so how often and when?
All 14 divisions indicated that they use Broadleaf Control chemicals. Out of 14 participants, 10
responded with information regarding how often Broadleaf Control chemicals are used. This
information is displayed in the table below and includes the division numbers. The representative

72
for division number 12 differentiated their answer based upon the type of road; specifically,
he/she said that interstates are treated with Broadleaf Control chemicals twice per year, while
primary roads are treated with Broadleaf Control chemicals once per year. Six interview
participants apply Broadleaf Control chemicals once per year, 2 reported applying Broadleaf
Control chemicals 1-2 times per year. One person said that he/she applies broadleaf chemicals
once every 2-3 years, and 1 said twice per year. The representative from division 13 stated that
he/she may not get around to all secondary roads. Table 21 displays the interview responses from
each of the divisions regarding the frequency with which Broadleaf Control chemicals are used.
Table 21 How often Broadleaf Control chemicals are used.
Occurrence Division No.
Once every 2-3 years 10
Once per year 4, 7, 8, 9, 11, 13
1-2 times per year 3, 12
Twice per year 14
Seven out of the 14 participants provided information regarding the time frames in which
Broadleaf Control chemicals are applied within their divisions. Table 22 displays this
information by division number. The time frames are approximate. For example, division
number 12 responded that Broadleaf Control chemicals are applied during the spring and late
summer. Out of all responses, May and June were noted as the most common months in which
Broadleaf Control chemicals are applied to roadsides (6 responses each). Following May and
June, April and July were next most commonly mentioned (2 responses each). March, August,
and September were the least frequently mentioned by interview participants, with one response
each.
Table 22 Time frames in which Broadleaf Control chemicals are applied by division number.
Division
No.
March April May June July Aug Sept
2
4
5
7
8
9
12
Although the question was not specifically asked of interview participants, many people
provided information regarding the type of broadleaf chemical application used to control broad
leaf weeds. Out of 14 total participants, 5 provided information about the types of broad leaf
weed control used. They all provided different answers so were not grouped into categories. The
representative from division 1 said that they use Confront, division 2 listed WSR 2.0, division 5
listed Garlon 3A Triclopyr, division 6 listed 24D “and others,” and division 12 listed (1) 2D and
(2) Element 3A. The representative from division 1 was the only division that provided
73
information about the specifics of its chemical application: “[Confront] is added to the SFM75
mixture at 28 oz/Ac.”
Question 7: What kind of special treatments or procedure is used for control around fixed
objects? (guard rail, cable barrier, signs, bridge ends, etc.).
As is displayed in Table 23, 10 interview participants reported using selective chemicals
(divisions #1, 2, 5, 6, 7, 8, 11-14) and 6 reported using non-selective chemicals to control
roadside vegetation within their divisions (divisions #1, 3, 4, 7, 10, 12). Out of the selective
chemicals mentioned, 4 mentioned plant growth regulators (divisions 5, 6, 8, 12) and 4
mentioned chemicals with triclopyr as the active ingredient (divisions #1, 2, 7, 12); out of these,
2 specifically mentioned Element 3A, 1 mentioned Garlon, and 1 mentioned triclopyr in general.
One person mentioned 2D, which is a selective chemical used to control vegetation, under the
“other” category. Non-selective chemicals used for roadside vegetation management include
chemicals with glysophate as the active ingredient (divisions 1, 4, 7) as well as chemicals like
Round Up.
Following the use of chemicals, mechanical methods were the most commonly
mentioned approach to controlling roadside vegetation around fixed objects (divisions #2, 3, 9).
Following this, sprayers were mentioned twice (divisions #3, 8), and surfactants are mentioned
twice (divisions #2, 7). Out of the 12 interview participants, 10 provided additional information
under the “other” category that could not be grouped into existing categories (all except for
divisions 1 and 14). The following were listed under the “other” category: prodiamine, Rodeo,
Esplanade (2), basic grass control, WSR, broadleaf weed control (2), pre-emergent, herbicide
mix, chemicals, Round Up, Confront, Krenite, and 2D.
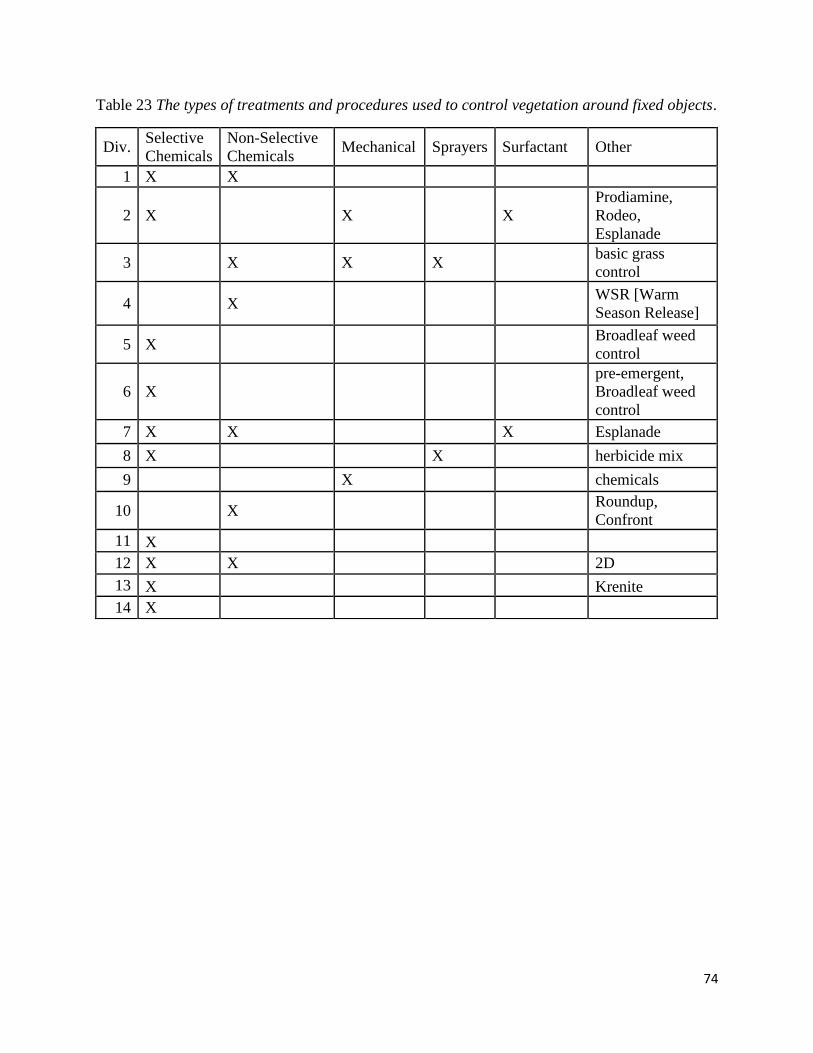
74
Table 23 The types of treatments and procedures used to control vegetation around fixed objects.
Div. Selective
Chemicals
Non-Selective
Chemicals Mechanical Sprayers Surfactant Other
1 X X
2 X X X
Prodiamine,
Rodeo,
Esplanade
3 X X X basic grass
control
4 X WSR [Warm
Season Release]
5 X Broadleaf weed
control
6 X
pre-emergent,
Broadleaf weed
control
7 X X X Esplanade
8 X X herbicide mix
9 X chemicals
10 X Roundup,
Confront
11 X
12 X X 2D
13 X Krenite
14 X
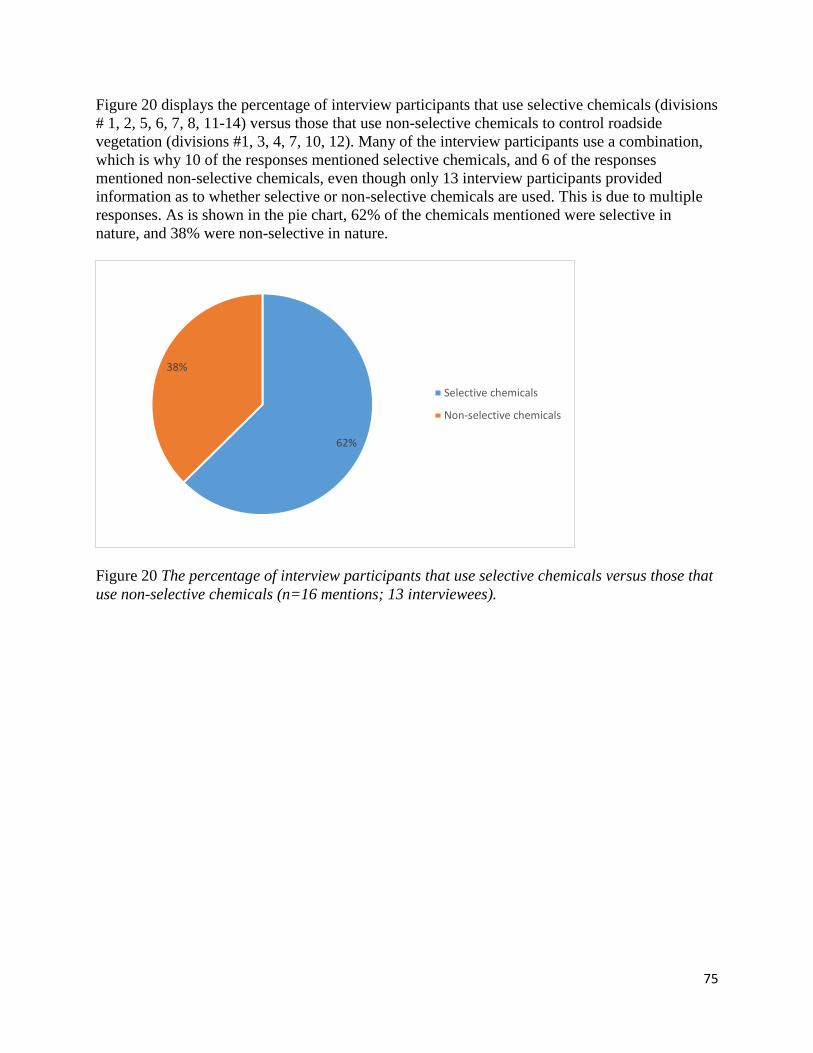
75
Figure 20 displays the percentage of interview participants that use selective chemicals (divisions
# 1, 2, 5, 6, 7, 8, 11-14) versus those that use non-selective chemicals to control roadside
vegetation (divisions #1, 3, 4, 7, 10, 12). Many of the interview participants use a combination,
which is why 10 of the responses mentioned selective chemicals, and 6 of the responses
mentioned non-selective chemicals, even though only 13 interview participants provided
information as to whether selective or non-selective chemicals are used. This is due to multiple
responses. As is shown in the pie chart, 62% of the chemicals mentioned were selective in
nature, and 38% were non-selective in nature.
Figure 20 The percentage of interview participants that use selective chemicals versus those that
use non-selective chemicals (n=16 mentions; 13 interviewees).
62%
38%
Selective chemicals
Non-selective chemicals
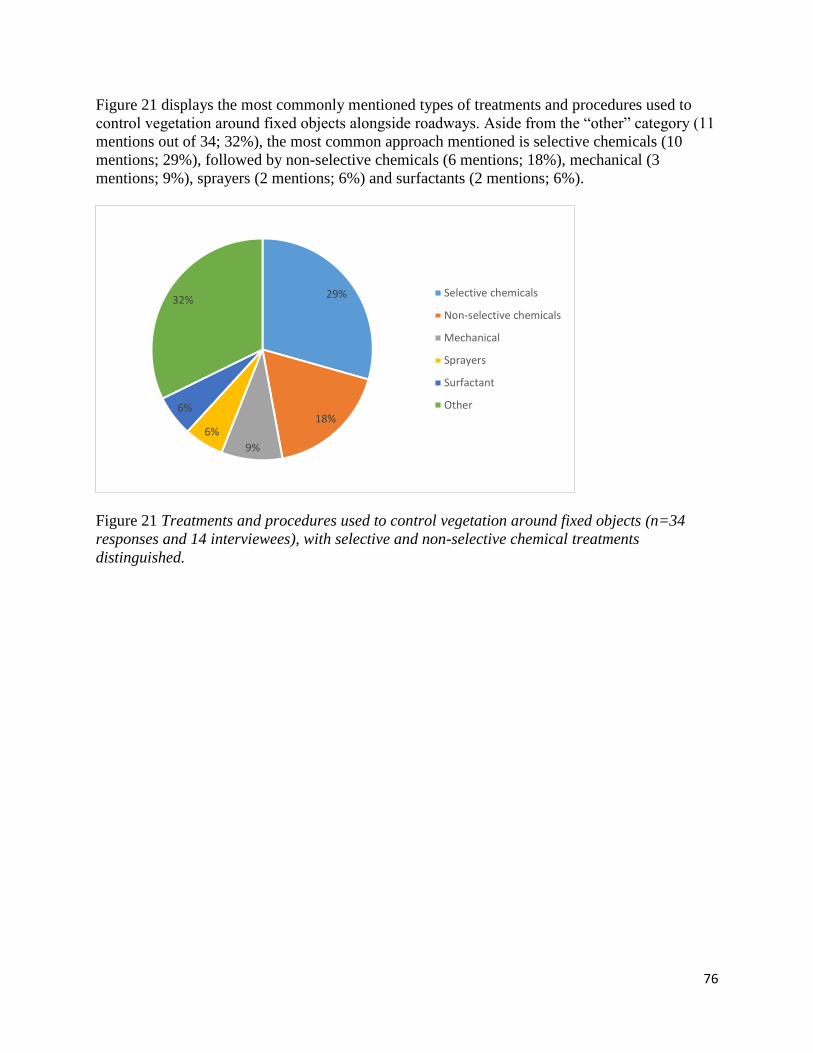
76
Figure 21 displays the most commonly mentioned types of treatments and procedures used to
control vegetation around fixed objects alongside roadways. Aside from the “other” category (11
mentions out of 34; 32%), the most common approach mentioned is selective chemicals (10
mentions; 29%), followed by non-selective chemicals (6 mentions; 18%), mechanical (3
mentions; 9%), sprayers (2 mentions; 6%) and surfactants (2 mentions; 6%).
Figure 21 Treatments and procedures used to control vegetation around fixed objects (n=34
responses and 14 interviewees), with selective and non-selective chemical treatments
distinguished.
29%
18%
9%
6%
6%
32%Selective chemicals
Non-selective chemicals
Mechanical
Sprayers
Surfactant
Other

77
Figure 22 displays the most commonly mentioned types of treatments and procedures used to
control vegetation around fixed objects alongside roadways, with selective and non-selective
chemical approaches categorized together under “chemical applications.” Aside from the “other”
category (11 mentions out of 31; 36%), the most common approach mentioned is chemical
applications (13 mentions; 42%), followed by mechanical (3 mentions; 10%), sprayers (2
mentions; 6%) and surfactants (2 mentions; 6%). This shows that chemical and mechanical
applications are the most prevalent.
Figure 22 Treatments and procedures used to control vegetation around fixed objects (n=31
mentions; 14 interviewees), with selective and non-selective chemicals grouped together.
10%
42%
6%
6%
36% Mechanical
Chemicals
Sprayers
Surfactant
Other
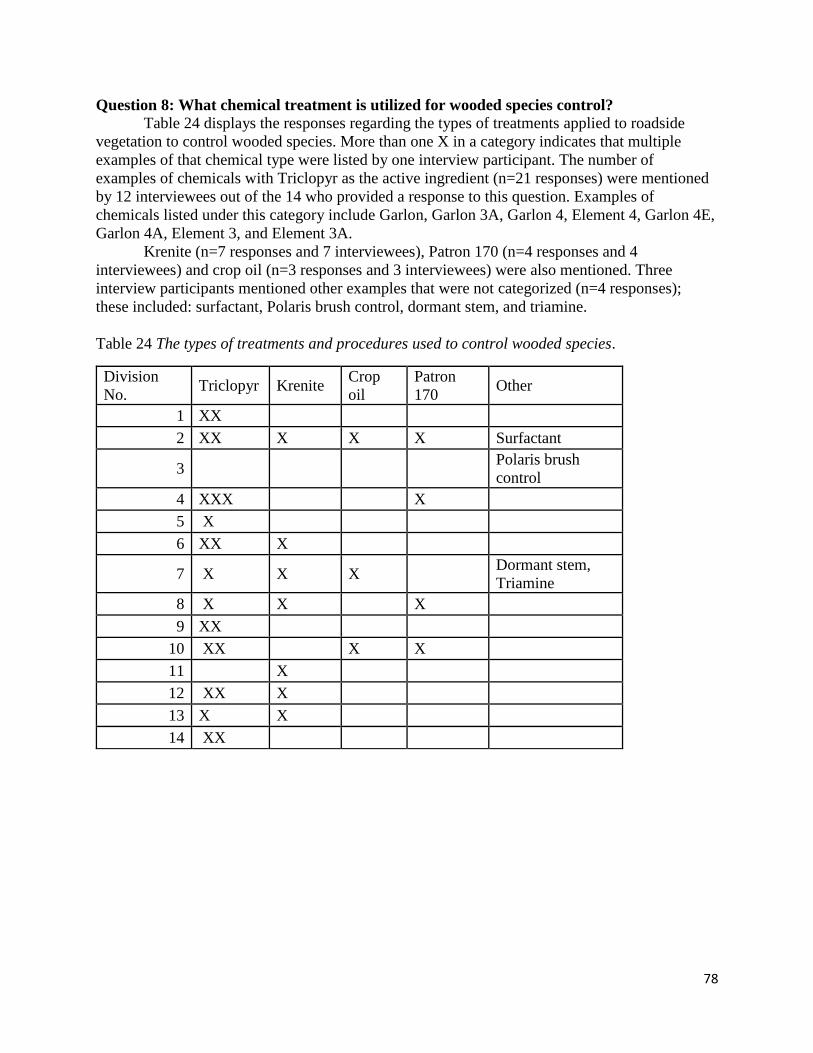
78
Question 8: What chemical treatment is utilized for wooded species control?
Table 24 displays the responses regarding the types of treatments applied to roadside
vegetation to control wooded species. More than one X in a category indicates that multiple
examples of that chemical type were listed by one interview participant. The number of
examples of chemicals with Triclopyr as the active ingredient (n=21 responses) were mentioned
by 12 interviewees out of the 14 who provided a response to this question. Examples of
chemicals listed under this category include Garlon, Garlon 3A, Garlon 4, Element 4, Garlon 4E,
Garlon 4A, Element 3, and Element 3A.
Krenite (n=7 responses and 7 interviewees), Patron 170 (n=4 responses and 4
interviewees) and crop oil (n=3 responses and 3 interviewees) were also mentioned. Three
interview participants mentioned other examples that were not categorized (n=4 responses);
these included: surfactant, Polaris brush control, dormant stem, and triamine.
Table 24 The types of treatments and procedures used to control wooded species.
Division
No. Triclopyr Krenite
Crop
oil
Patron
170 Other
1 XX
2 XX X X X Surfactant
3 Polaris brush
control
4 XXX X
5 X
6 XX X
7 X X X Dormant stem,
Triamine
8 X X X
9 XX
10 XX X X
11 X
12 XX X
13 X X
14 XX
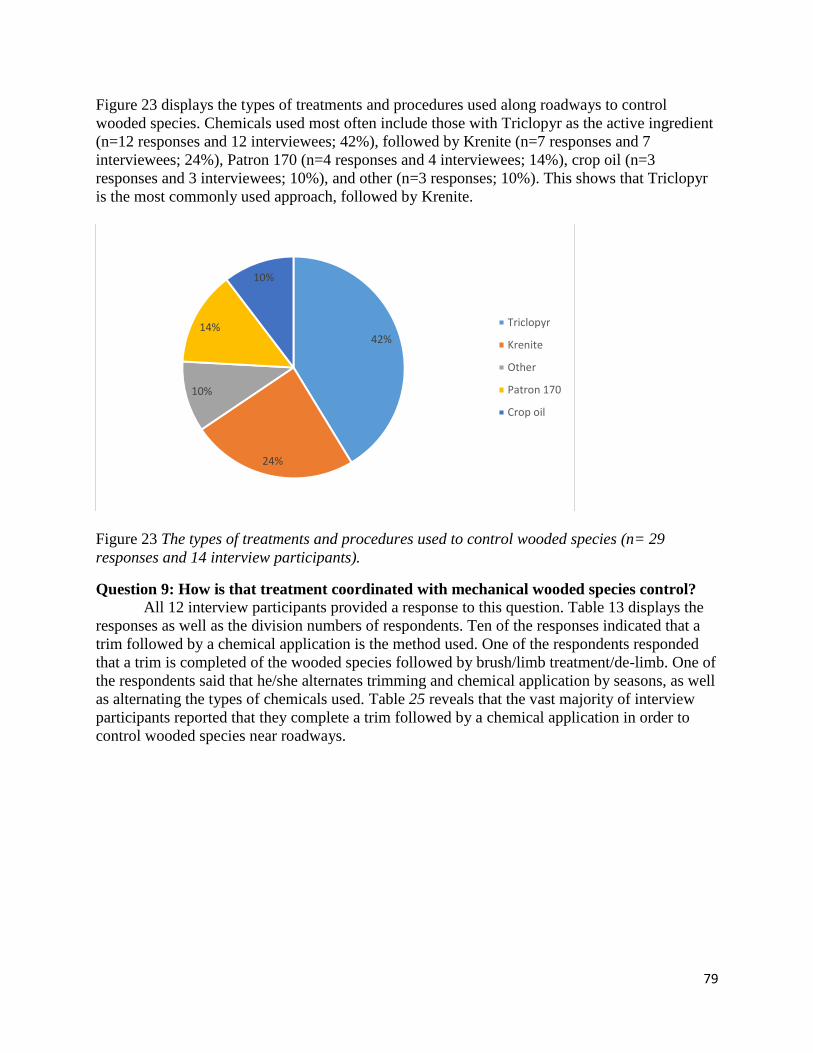
79
Figure 23 displays the types of treatments and procedures used along roadways to control
wooded species. Chemicals used most often include those with Triclopyr as the active ingredient
(n=12 responses and 12 interviewees; 42%), followed by Krenite (n=7 responses and 7
interviewees; 24%), Patron 170 (n=4 responses and 4 interviewees; 14%), crop oil (n=3
responses and 3 interviewees; 10%), and other (n=3 responses; 10%). This shows that Triclopyr
is the most commonly used approach, followed by Krenite.
Figure 23 The types of treatments and procedures used to control wooded species (n= 29
responses and 14 interview participants).
Question 9: How is that treatment coordinated with mechanical wooded species control?
All 12 interview participants provided a response to this question. Table 13 displays the
responses as well as the division numbers of respondents. Ten of the responses indicated that a
trim followed by a chemical application is the method used. One of the respondents responded
that a trim is completed of the wooded species followed by brush/limb treatment/de-limb. One of
the respondents said that he/she alternates trimming and chemical application by seasons, as well
as alternating the types of chemicals used. Table 25 reveals that the vast majority of interview
participants reported that they complete a trim followed by a chemical application in order to
control wooded species near roadways.
42%
24%
10%
14%
10%
Triclopyr
Krenite
Other
Patron 170
Crop oil

80
Table 25 How chemical treatment is coordinated with mechanical wooded species control.
Method Divisions
Trim followed by a chemical
application
1, 2, 4, 5, 7, 8, 9, 10, 11, 12, 14
Trim followed by brush/treatment of
limbs/de-limb
3
Alternate trim and chemical
application by seasons; alternate
types of chemicals used
6
Trim followed by a chemical
application within one year
13
Question 10: Other comments
One comment was provided by the representative for division 1: “we do not maintain any
interstate systems in our Division. Division 4 maintains the small section of I95 that runs through
Division 1.”
The representative for division 11 described the structure of the division as follows: 22
staff, including 2 herbicides, 1 seed crew, 1 planting and plant bed maintenance; 6 inspectors,
who monitor the work of contractors [3 turf mowing inspectors & 3 long arm mowing
inspectors]. The division 11 representative also explained that Broadleaf control is applied with
PGRs. Six years ago, zoysia grass was planted around cable rails (2-16 inch strips), which are
given one pass of the weed eater in the fall; I-77 is not applied since there is established turf.
The representative for division 13 also explained the structure of his/her division:
Currently there are 25 positions with 6 vacancies; there used to be 42 positions. There are four
crews, one focusing on the plant bed, two focusing on erosion control, and one focusing on the
herbicide/wildflower program.
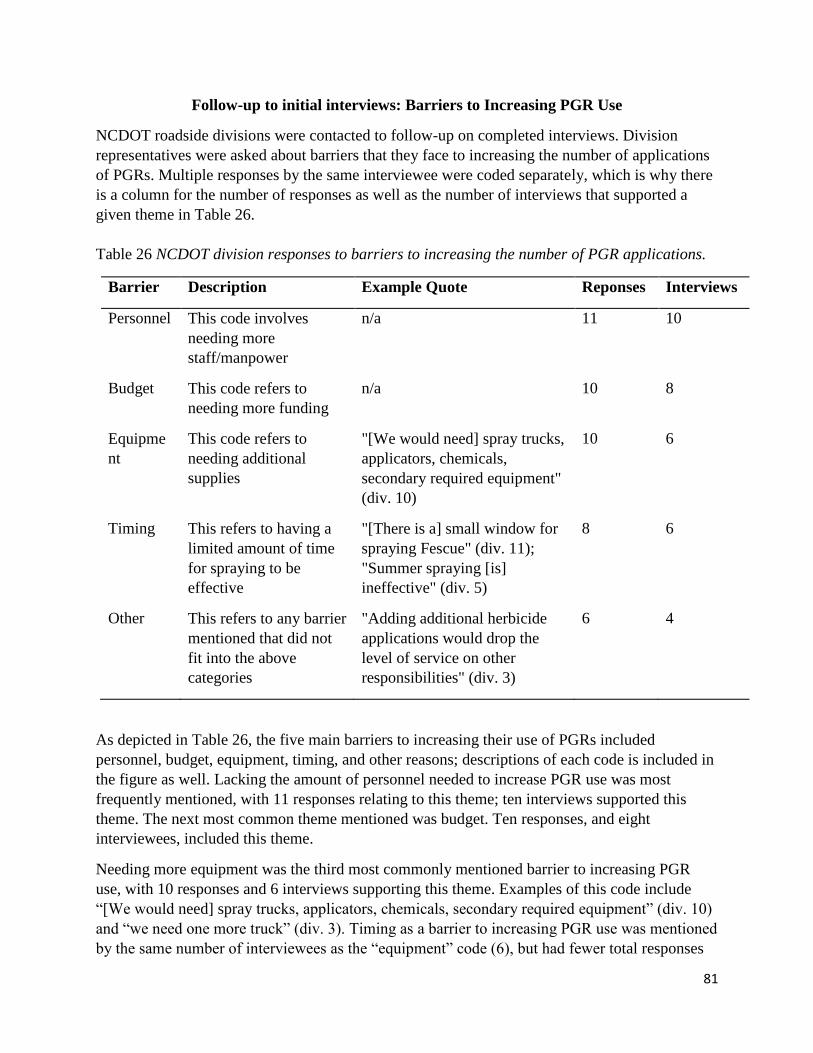
81
Follow-up to initial interviews: Barriers to Increasing PGR Use
NCDOT roadside divisions were contacted to follow-up on completed interviews. Division
representatives were asked about barriers that they face to increasing the number of applications
of PGRs. Multiple responses by the same interviewee were coded separately, which is why there
is a column for the number of responses as well as the number of interviews that supported a
given theme in Table 26.
Table 26 NCDOT division responses to barriers to increasing the number of PGR applications.
Barrier Description Example Quote Reponses Interviews
Personnel This code involves
needing more
staff/manpower
n/a 11 10
Budget This code refers to
needing more funding
n/a 10 8
Equipme
nt
This code refers to
needing additional
supplies
"[We would need] spray trucks,
applicators, chemicals,
secondary required equipment"
(div. 10)
10 6
Timing This refers to having a
limited amount of time
for spraying to be
effective
"[There is a] small window for
spraying Fescue" (div. 11);
"Summer spraying [is]
ineffective" (div. 5)
8 6
Other This refers to any barrier
mentioned that did not
fit into the above
categories
"Adding additional herbicide
applications would drop the
level of service on other
responsibilities" (div. 3)
6 4
As depicted in Table 26, the five main barriers to increasing their use of PGRs included
personnel, budget, equipment, timing, and other reasons; descriptions of each code is included in
the figure as well. Lacking the amount of personnel needed to increase PGR use was most
frequently mentioned, with 11 responses relating to this theme; ten interviews supported this
theme. The next most common theme mentioned was budget. Ten responses, and eight
interviewees, included this theme.
Needing more equipment was the third most commonly mentioned barrier to increasing PGR
use, with 10 responses and 6 interviews supporting this theme. Examples of this code include
“[We would need] spray trucks, applicators, chemicals, secondary required equipment” (div. 10)
and “we need one more truck” (div. 3). Timing as a barrier to increasing PGR use was mentioned
by the same number of interviewees as the “equipment” code (6), but had fewer total responses

82
(8). Examples of how timing can be a barrier to increasing the use of PGRs include the
following:
• “[There is a] small window for spraying Fescue" (div. 11)
• "Summer spraying [is] ineffective" (div. 5)
• “Have mostly Fescue which is applied between March 15 and April 15” (div. 9)
Lastly, barriers to increasing PGR use by division representatives that did not fit into any of the
categories discussed were coded as “other.” Other barriers were mentioned by 4 interviewees
with a total of 6 responses. The responses coded as “other” included the following:
• “Adding additional herbicide applications would drop the level of service on other
responsibilities" (div. 3)
• "[A PGR application] doesn't always work (e.g. wet season)” (div. 1)
• “Aesthetic concerns” (div. 1)
• “[NCDOT] would need to construct a PGR program that maps the nuances (turf type,
soil type, weed pressure, water table)” (div. 1)
• "More research is needed on multiple PGR applications” (div. 7)
• “[It is] hard to justify adding more staff when there is no work for them the rest of the
year” (div. 11)
NCDOT divisions were also asked whether they would increase the number of PGR applications
if the barriers listed were overcome. In response, the 13 total interviewees either responded yes
(7) or no (6). Five of these division representatives also explained that they would increase the
amount of area that was treated with PGR use; out of the five interviewees that would expand the
amount of area covered by PGRs, two had responded that they would not increase the number of
PGR cycles, and three indicated that they would also increase the number of PGR cycles. Figure
24 depicts the total responses in a pie chart (18 responses from 13 interviewees). Two examples
of quotes where division representatives indicated that they would increase the number of PGR
cycles used if barriers were overcome are displayed below.
• "We may increase the NUMBER of applications by 1" (div. 2)
• "[We] currently we do not use any PGRs but if we did have the necessary resources to
use them extensively we would probably do so" (div. 4)
Six division representatives indicated that they would not increase the number of PGR cycles and
most of them stated “no.” A more extensive example of this code is as follows: "With unlimited
resources, I still do not think I would pursue additional SVR treatments" (div. 11).
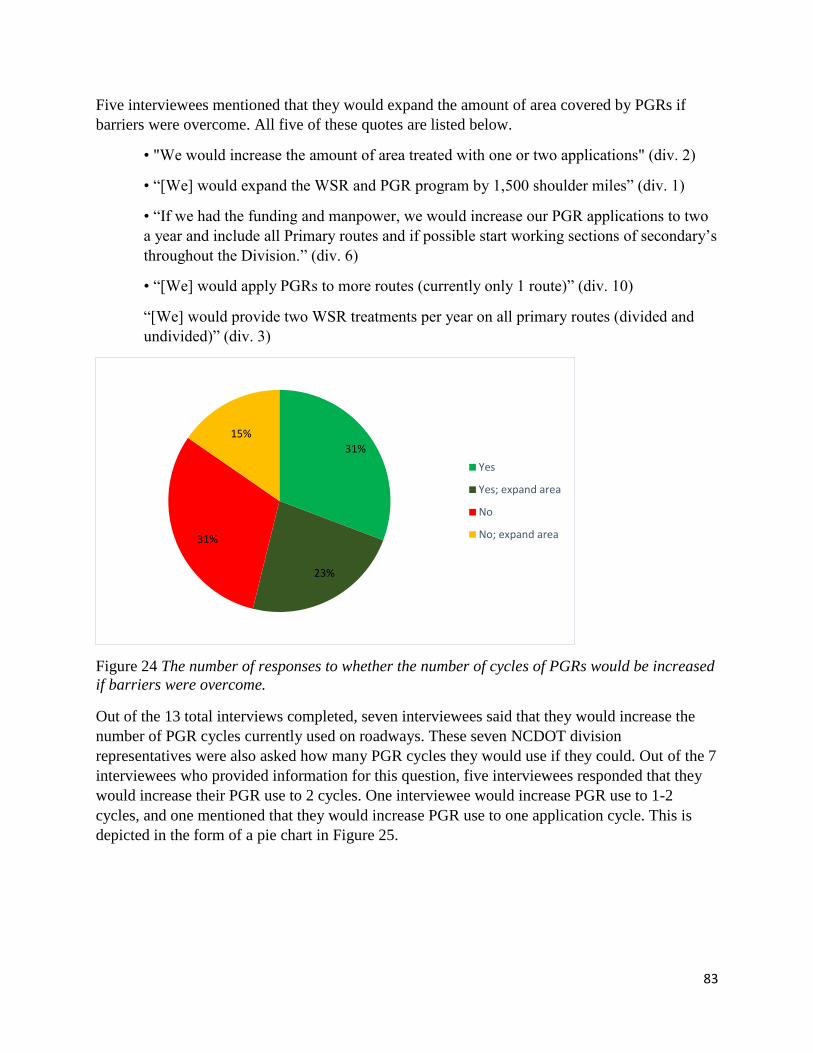
83
Five interviewees mentioned that they would expand the amount of area covered by PGRs if
barriers were overcome. All five of these quotes are listed below.
• "We would increase the amount of area treated with one or two applications" (div. 2)
• “[We] would expand the WSR and PGR program by 1,500 shoulder miles” (div. 1)
• “If we had the funding and manpower, we would increase our PGR applications to two
a year and include all Primary routes and if possible start working sections of secondary’s
throughout the Division.” (div. 6)
• “[We] would apply PGRs to more routes (currently only 1 route)” (div. 10)
“[We] would provide two WSR treatments per year on all primary routes (divided and
undivided)” (div. 3)
Figure 24 The number of responses to whether the number of cycles of PGRs would be increased
if barriers were overcome.
Out of the 13 total interviews completed, seven interviewees said that they would increase the
number of PGR cycles currently used on roadways. These seven NCDOT division
representatives were also asked how many PGR cycles they would use if they could. Out of the 7
interviewees who provided information for this question, five interviewees responded that they
would increase their PGR use to 2 cycles. One interviewee would increase PGR use to 1-2
cycles, and one mentioned that they would increase PGR use to one application cycle. This is
depicted in the form of a pie chart in Figure 25.
31%
23%
31%
15%
Yes
Yes; expand area
No
No; expand area

84
Figure 25 The number of PGR application cycles that NCDOT division representatives reported
that they would implement if barriers were overcome.
Out of the seven interviewees who reported that they would increase their use of PGRs if
possible, five reported to be currently using one cycle of PGR applications, and two reported that
they did not currently use PGRs in their divisions. Taking into account the current number of
PGR application cycles in use in each of these seven divisions relative to their desired number of
PGR cycles, Figure 26 is displayed below to show the desired increase in PGR cycles as reported
in interviews. Out of these seven divisions, six showed a desired increase in PGR use by one
cycle (i.e. either from zero to one or from one to two); one division representative reported a
desired change of 1-2, from a current level of no regular PGR use.
Figure 26 The desired change in terms of PGR cycles, comparing the current level of PGR use in
each division to the reported number of PGR cycles that each division would like.
72%
14%
14%
2 cycles (n=5)
1-2 cycles (n=1)
1 cycle (n=1)
86%
14%
1 cycle increase (n=6)
1-2 cycle increase (n=1)

85
Conclusions from Interviews
This analysis of barriers to increasing the use of PGRs on NC roadways shows that personnel,
budget, equipment, and timing were the most commonly mentioned by NCDOT division
representatives. Out of 13 total interview participants, it was also found that slightly more than
half of NCDOT division representatives (n=7; 53.85%) would increase the number of PGR
cycles used, and slightly less than half (n=6; 46.15%) would not increase the number of PGR
cycles. In addition to these responses, five of the 13 interviewees (38.46%) mentioned that they
would expand the area covered by PGRs if barriers to implementation were overcome.
Five of the seven interviewees who would increase the number of PGR application cycles
indicated that they would increase the number to 2 cycles. One reported that they would
implement 1-2 PGR cycles, and one said that they would administer one PGR cycle. Finally, out
of the seven interviewees who indicated that they would increase the number of PGR cycles if
barriers were overcome, six would increase the number of cycles by one, and one person
reported that they would increase the number of PGR application cycles implemented by 1-2.
As has been noted in the literature review section, application of PGRs is a more cost-effective
solution to vegetation management than morning. The data presented above clearly indicates that
most divisions in NC DOT currently perceive several barriers to increasing the number of PGR
applications, primarily having to do with budget and personnel but also because of compressed
time windows. If such barriers, especially with regards to budget, equipment and personnel can
be addressed by NC DOT, some divisions would increase the number of PGR applications by
one additional cycle. Based on the analysis of the overall average associated costs, increasing
PGR use by one cycle is expected to save NC DOT an annual sum of $758,461.83 if the seven
divisions who stated that they would increase the number of PGR cycles did so, and
$1,516,923.66 if all 14 divisions increased their PGR use by one cycle.
86
Vegetation Management Practices obtained from Benchmarking with Peer States
ALDOT: “Roadsides are mowed from 2 to 4 times annually depending upon the average daily
traffic count or local activity interest; guardrails / cable rails are trimmed as needed as a part of
the scheduled mowing cycle. Each mowing is typically followed by a turf broadcast herbicide
treatment designed to control or delay the regrowth of broadleaf weeds and to provide seed head
suppression of grasses. Specific treatments are made as required for the control of perennial
grasses such as Johnsongrass or Cogongrass. Side trim and other brush control applications are
generally restricted to the fall”
TXDOT: Herbicidal applications and mowing - “Spraying is done in-house, staff are
trained, including as to the chemicals that are acceptable to use. The supervisors in charge
of herbicidal applications are all licensed. TX DOT doesn’t use PGRs because they work
on some species but not others; instead, they use a mixture of selective and non-selective
chemicals. Mowing takes place 2-3x/year (urban: 3; rural: 2).” For herbicide treatments at
the TXDOT, there are typically 1-2 applicators in rural counties, and 7-8 applicators in
urban counties.
Guardrail & fixed object: Concrete pad around, spray trucks, herbicides, add grass, weed
eating 3x/year
Broadleaf: Wildfires drive our program; to controls species like bloodweed and other
brush species, the herbicides Escort, Dista, Transline, Pathfinder II and Capstone are
used. Long arm mowing is also used.
The following were provided as examples of vegetation management practices followed by the
KYDOT: “Mechanical mowing, herbicide application, weed bio-control, fertilization, seeding,
ditching.” Furthermore, KYDOT specified that “all roadside turf is mowed at least 3 times per
year and applied once for broadleaf weeds and once for noxious weeds. All guardrail, traffic
islands, cable guardrail, and barrier wall is applied at least once per year.”