
Ecommerce Quarterly (EQ2 2012)
22
a publication from Ecommerce Quarterly EQ2 2012 2
Transcript of Ecommerce Quarterly (EQ2 2012)

a publication from
Ecommerce Quarterly
EQ2 2012
2

ContentsAbout the EQ ···················································· 3
Battle of the Giants: Apple vs. Google ····· 5
Social Media Cheapskates ·························· 9
Who’s Really Winning the Browser War? ···· 12
Benchmark Reports ······································· 14
Methodology ··················································· 20
References ························································ 20
About Monetate ·············································· 21
ExECutivE SuMMARy
Average order value (AOV) is one of the most important key
performance indicators for any ecommerce business. And
online marketers who use AOV to discover new visitor segments
will see an immediate impact on their bottom line.
There’s plenty to be said about AOV for common customer
segments—such as new versus returning visitors, or shoppers
with an affinity to a brand/category—but to achieve long-term
revenue and growth, successful ecommerce businesses will
identify customers who spend the most money and get them
to buy again and again. As website traffic continues to make a
drastic shift from traditional desktop and laptop computers to
smartphones and tablets, EQ2 2012 takes a look at two visitor
segments—platform type and inbound traffic source—that
stand out as potential game-changers.
Lastly, EQ2 2012 tells the real story behind web browsers.
While the amount of visitors accessing websites via traditional
methods plummets, one web browser has nabbed a significant
portion of market share and left the once-mighty Internet
Explorer in the rearview mirror in a unique and revealing way.
a monetate publication | 2
eq2 2012

ABoUt tHe eQAs ecommerce companies look for ways to increase customer
engagement and sales in a highly competitive online shopping
environment, they’re faced with challenges centered on massive
amounts of data. This Big Data conundrum extends beyond the
collection and storage of information about customers and prospects;
the critical component of business intelligence is the ability to transform
this never-ending stream of data into meaningful insights to create
more relevant shopping experiences.
Managing this data is a big part of delivering relevance. Using a
combination of historical and real-time data to target each website visit
can delight customers who then become extremely loyal and share
their experiences with others. Ecommerce businesses that tackle Big
Data head-on focus their attention on three primary visitor segments,
groups that will be explored (with examples of each) in every release
of the EQ:
• Predefined: New versus returning; referring traffic sources; technographics; geography.
•CustomorProprietary: Demographics; proximity to location.
• In-SessionBehavior: Shopping cart activity; brand or category affinity.
a monetate publication | 3
eq2 2012

Technology providers like Monetate play an essential role in helping
businesses understand this data and their audiences. Through the
use of the Monetate Agility Suite and advice from Monetate’s website
optimization experts and content resources, businesses are now able
to realize the unfulfilled promise of ecommerce: Delivering relevant
messages to customers at the right place and at the right time.
The EQ also provides takeaways and ideas that point to the importance
ecommerce businesses must place on delivering a more engaging
shopping experience to customers in ways that provide measurable
impact. As more online businesses look to maximize their investments
in technology and marketing, these tactics will become even more
critical to consider.
The EQ is published four times a year, after the conclusion of every
calendar year quarter.
a monetate publication | 4
eq2 2012

BAttle of tHe GiAnts: Apple vs. GooGlePlatforms and devices impact conversion and average order value.
A great deal of attention continues to be paid to sales of smartphone
and tablet devices from Apple and Google.
As these technology behemoths battle it out, there appears to be a
correlation between a decrease in Android smartphone market share1
and the amount of website traffic that comes from users of these
devices.
Leading ecommerce websites receive 3.31% of their total visits from
smartphones running Android, up from 1.76% last year and an increase
of 85% in total shopping sessions. These same websites receive 5.41% of
their traffic from iPhones compared to 2.45% a year earlier, an increase
of 117% in total shopping sessions over the same time period.
Despite the growth in iPhone market share, shoppers on Android-
powered smartphones continue to convert better (1.26%) than iPhone
users (1.00%).2011
Q2 Q2Q3 Q4 Q1
2012
iPhone Android
2.45% 2.45%2.25%
3.44%
5.41%
1.76%1.95% 1.99%
2.53%
3.31%
SMARTPHONE SHARE OFTOTAL WEBSITE TRAFFIC
a monetate publication | 5
eq2 2012

Less than a year ago, the Google versus Apple smartphone debate did not have a clear frontrunner: Leading ecommerce websites received just 6% more traffic in Q4 2011 from iPhones than from smartphones running Android.
Following the release of the popular iPhone 4S in October 2011, consumers’ appetites for Jelly Bean, Ice Cream Sandwich, Honeycomb, or Gingerbread running on devices like the Galaxy, Nexus, Evo, Thrill, or Droid have greatly diminished as almost 25% more visits now come from iPhones.
SMARTPHONE MARKET SHARE
2011
Q2 Q2Q3 Q4 Q1
2012
iPhone Android
57.24%
54.80%
52.27%
56.82%
61.19%
41.14%
43.58%
46.14%
41.82%
37.46%
a monetate publication | 6
eq2 2012

There’s a different story when comparing website traffic from Android-
based tablets to the iPad. Although the iPad is the most dominant device
in terms of tablet-based traffic (88.31%), in just one year the Amazon
Kindle Fire and other Android tablets have swiped 10% of market share
away from Apple. It will be interesting to see how Google’s Nexus 7
impacts tablet market share in the second half of 2012 and beyond.
Similar to smartphones, conversion rates on Android tablets (3.58%)
have crept ahead of the rival iPad (3.19%).
Q2 2012Q2 2011
TABLET MARKET SHARE
iPad Kindle FireAndroid
98.46% 88.31%
5.11%6.58%
1.54%
a monetate publication | 7
eq2 2012

EQ tAkEAWAyS
•WhetheronaniPadorAndroiddevice,consumersareshoppingmoreontabletsandrepresentoneofthefastest-growingcustomersegments.Convertmoretabletbrowserstobuyersbytestingalternatepaymentmethods—suchasPayPal—thatdon’trequireashoppertoreachforacreditcard.
•Understandyourspecificsmartphoneandtabletopportunities.Usequantitativedata(webanalytics)andqualitativedata(usabilitytesting)tostartidentifyingwhat’sbrokenandfixwhatdoesn’twork.BothsmartphonesandtabletscouldpresentasignificantAOVopportunityforyourbusiness.
Q2 2012 AVERAGE ORDER VALUE BY DEVICE
Mac Windows Linux
$102.83
$88.75 $84.91
TRADITIONAL
iPad Android Kindle Fire
$96.80 $95.81
$84.56
TABLET
iPhone Android Windows
$97.49 $97.16$92.45
SMARTPHONE
a monetate publication | 8
eq2 2012
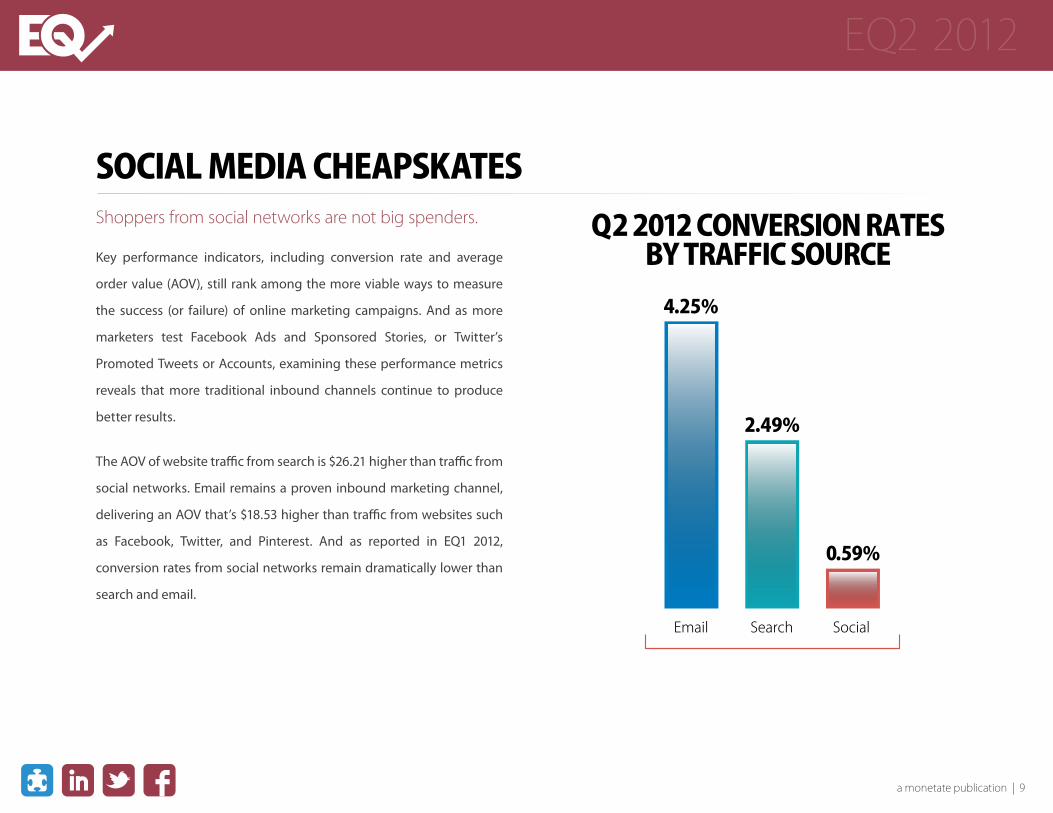
soCiAl MediA CHeApskAtesShoppers from social networks are not big spenders.
Key performance indicators, including conversion rate and average
order value (AOV), still rank among the more viable ways to measure
the success (or failure) of online marketing campaigns. And as more
marketers test Facebook Ads and Sponsored Stories, or Twitter’s
Promoted Tweets or Accounts, examining these performance metrics
reveals that more traditional inbound channels continue to produce
better results.
The AOV of website traffic from search is $26.21 higher than traffic from
social networks. Email remains a proven inbound marketing channel,
delivering an AOV that’s $18.53 higher than traffic from websites such
as Facebook, Twitter, and Pinterest. And as reported in EQ1 2012,
conversion rates from social networks remain dramatically lower than
search and email.
Q2 2012 CONVERSION RATESBY TRAFFIC SOURCE
Email Search Social
4.25%
2.49%
0.59%
a monetate publication | 9
eq2 2012
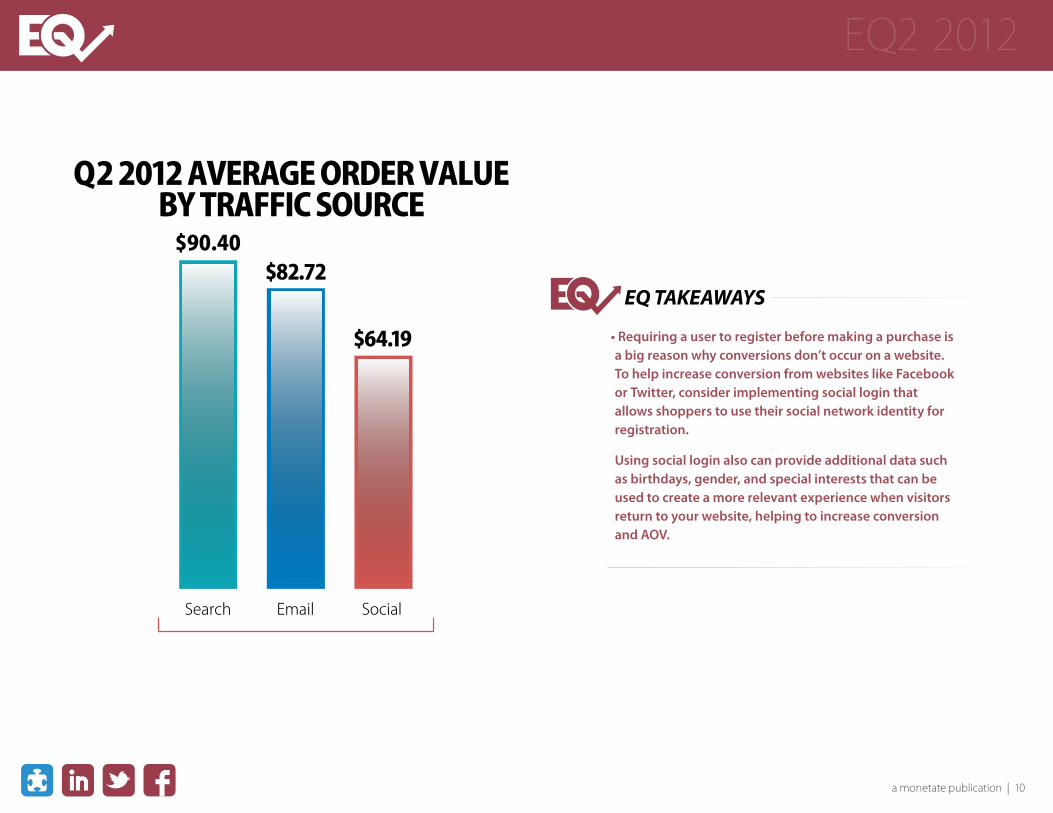
EQ tAkEAWAyS
•Requiringausertoregisterbeforemakingapurchaseisabigreasonwhyconversionsdon’toccuronawebsite.TohelpincreaseconversionfromwebsiteslikeFacebookorTwitter,considerimplementingsocialloginthatallowsshopperstousetheirsocialnetworkidentityforregistration.
Usingsocialloginalsocanprovideadditionaldatasuchasbirthdays,gender,andspecialintereststhatcanbeusedtocreateamorerelevantexperiencewhenvisitorsreturntoyourwebsite,helpingtoincreaseconversionandAOV.
Q2 2012 AVERAGE ORDER VALUEBY TRAFFIC SOURCE
Search Email Social
$90.40$82.72
$64.19
a monetate publication | 10
eq2 2012
timing is everything
Remember the replatforming initiative you started back in February
that keeps getting delayed? For most ecommerce businesses, the
holiday season will make or break the entire year.
A recent Forrester Consulting Thought Leadership Paper, “Getting
the Most From Your Replatforming Project,” reveals that for 95% of
ecommerce businesses, AOV decreased following a redesign and
replatforming.2 By not timing a replatforming initiative correctly,
especially around the holidays, any potential increase in AOV could
be lost—or even worse, as many ecommerce businesses have
experienced, AOV could drop even lower.
The message is loud and clear: It’s critical for ecommerce businesses
to complete a technology project like replatforming well before the
holiday season. Increases in AOV—like the noticeable improvement
of $14.08 when comparing all traffic in the second quarter of 2012
with the third quarter of last year—means that projects targeted for
completion later in the year could result in businesses missing out
on additional revenue.
Make sure backend systems are tried, tested, and ultimately stable.
Don’t wait until September to deploy new features and functionality
(either unfinished or not started). The eve of holiday shopping is
not the time for unpredictable performance and untested ideas.
a monetate publication | 11
eq2 2012

WHo’s ReAlly WinninG tHe BRoWseR WAR?A new contender is ready to claim victory.
In May 2012, both the media and blogosphere were abuzz when web
traffic analysis tool StatCounter released weekly browser share data
that indicated Google Chrome surpassed Microsoft Internet Explorer
as the most popular web browser worldwide.3 However, our research
reveals the rapid rise of Safari as a preferred choice of online shoppers
throughout the day.
When combining Mobile Safari with its desktop counterpart,
ecommerce businesses get more than one-fourth of their traffic
(28.76%) from Safari, an increase of 9.04% in one year, making it second
only to Internet Explorer. Comparatively, Chrome’s market share
(17.15%) increased 6.27% in one year.
Outside of the enterprise—in other words, after work computers are
shut down for the day—Safari slips in as the dominant web browser
with 31.42% market share between the hours of 6 p.m. and 6 a.m. In
fact, all web browsers other than Internet Explorer see an increase in
usage after the typical workday comes to an end, when users have the
ability to choose the web browser that they want to use.
The once-dominant Internet Explorer—a browser that claimed more
than 90% of market share a decade ago—is now used by just over one-
third (37.50%) of consumers who visit leading ecommerce websites,
while losing 6% more market share between 6 p.m. and 6 a.m.
Q2 2012 BROWSER MARKET SHARE
Internet Explorer
Safari
Chrome
Firefox
Other
37.50%
28.76%
17.15%
15.80%
0.79%
a monetate publication | 12
eq2 2012

EQ tAkEAWAyS:
•WithInternetExplorer’sdominanceintheenterprisewaning,whenwillyoustopsupportingolderversionsinordertomoveyourbusinessforwardwithnewplatforms,tools,andtechnology?
•WiththependingreleaseofInternetExplorer104,onlinemarketersneedtounderstandwhat“DoNotTrack”policiesinboththeUSandworldwidecouldmeantotheirbusiness,andproactivelyinformtheircustomersabouthowthiscouldaffecttheuserexperience.Thefirststepistodoathoroughauditofanynewbrowserversions’impactonwebsiteperformance,functionality,andusability,andthensupportthesefindingswithqualitativeusertesting.
Q2 2012 BROWSER MARKET SHARE (6PM‒6AM)
Internet Explorer
Safari
Chrome
Firefox
Other
31.42%
31.41%
19.82%
16.41%
0.93%
a monetate publication | 13
eq2 2012
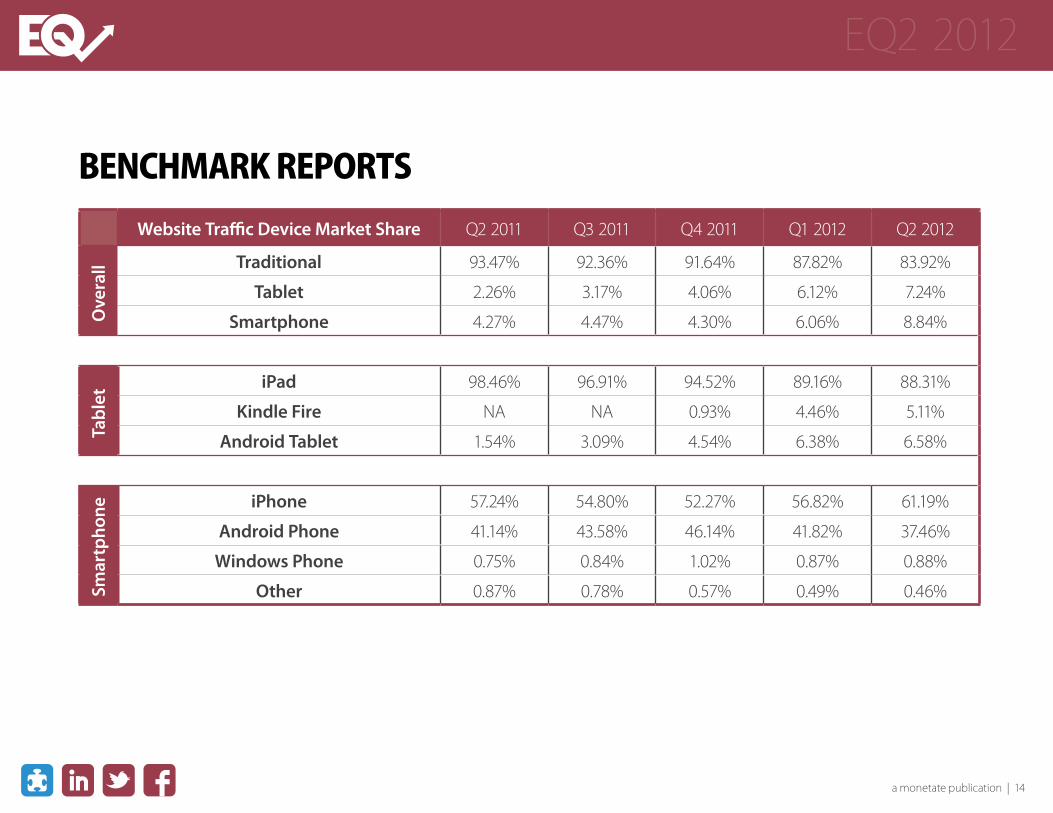
BenCHMARk RepoRtsWebsiteTrafficDeviceMarketShare Q2 2011 Q3 2011 Q4 2011 Q1 2012 Q2 2012
Traditional 93.47% 92.36% 91.64% 87.82% 83.92%
Tablet 2.26% 3.17% 4.06% 6.12% 7.24%
Smartphone 4.27% 4.47% 4.30% 6.06% 8.84%
iPad 98.46% 96.91% 94.52% 89.16% 88.31%
KindleFire NA NA 0.93% 4.46% 5.11%
AndroidTablet 1.54% 3.09% 4.54% 6.38% 6.58%
iPhone 57.24% 54.80% 52.27% 56.82% 61.19%
AndroidPhone 41.14% 43.58% 46.14% 41.82% 37.46%
WindowsPhone 0.75% 0.84% 1.02% 0.87% 0.88%
Other 0.87% 0.78% 0.57% 0.49% 0.46%
Ove
rall
Tablet
Smar
tpho
ne
a monetate publication | 14
eq2 2012

ConversionRatesbyDevice Q2 2011 Q3 2011 Q4 2011 Q1 2012 Q2 2012
Traditional 3.05% 2.65% 3.47% 3.03% 3.34%
Tablet 2.93% 2.55% 3.23% 2.86% 3.17%
Smartphone 0.96% 0.93% 1.25% 1.15% 1.09%
iPad 2.94% 2.57% 3.25% 2.86% 3.19%
KindleFire NA NA 2.06% 1.98% 2.22%
AndroidTablet 2.18% 2.02% 3.15% 3.50% 3.58%
iPhone 0.93% 0.87% 1.13% 1.04% 1.00%
AndroidPhone 1.03% 1.04% 1.40% 1.33% 1.26%
WindowsPhone 0.78% 0.73% 1.02% 1.13% 1.02%
Other 0.08% 0.06% 0.09% 0.08% 0.03%
Ove
rall
Tablet
Smar
tpho
ne
a monetate publication | 15
eq2 2012
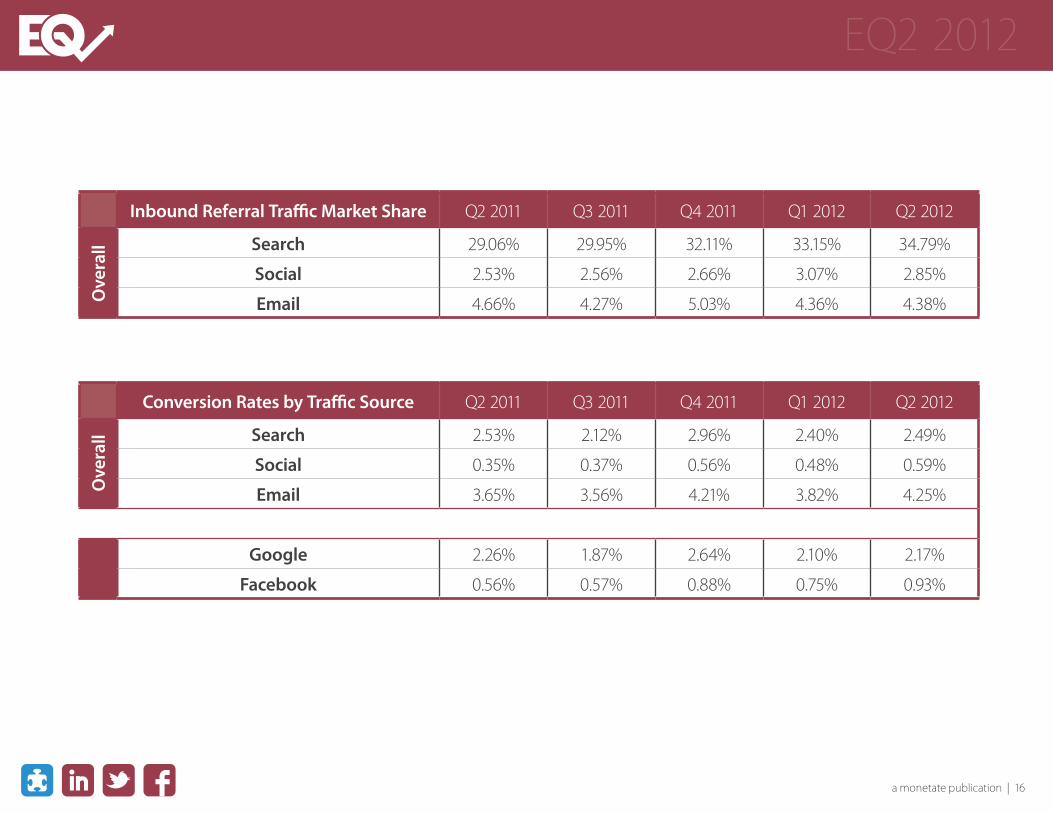
InboundReferralTrafficMarketShare Q2 2011 Q3 2011 Q4 2011 Q1 2012 Q2 2012
Search 29.06% 29.95% 32.11% 33.15% 34.79%
Social 2.53% 2.56% 2.66% 3.07% 2.85%
Email 4.66% 4.27% 5.03% 4.36% 4.38%
ConversionRatesbyTrafficSource Q2 2011 Q3 2011 Q4 2011 Q1 2012 Q2 2012
Search 2.53% 2.12% 2.96% 2.40% 2.49%
Social 0.35% 0.37% 0.56% 0.48% 0.59%
Email 3.65% 3.56% 4.21% 3.82% 4.25%
Google 2.26% 1.87% 2.64% 2.10% 2.17%
Facebook 0.56% 0.57% 0.88% 0.75% 0.93%
Ove
rall
Ove
rall
a monetate publication | 16
eq2 2012

AverageOrderValuebyPlatform Q1 2012 Q2 2012
Mac $108.32 $102.83
Windows $91.56 $88.75
AverageOrderValuebyDevice Q2 2011 Q3 2011 Q4 2011 Q1 2012 Q2 2012
Traditional * $106.96 $106.38 $95.41 $91.86
Tablet * $100.91 $106.80 $96.83 $96.11
Smartphone * $106.46 $121.35 $104.96 $97.39
iPad * $100.67 $106.55 $96.68 $96.80
AndroidTablet * $108.50 $116.13 $99.17 $95.81
KindleFire * NA $87.16 $86.42 $84.56
iPhone * $103.92 $117.05 $102.21 $97.49
AndroidPhone * $107.73 $126.20 $107.49 $97.16
WindowsPhone * $118.90 $114.74 $97.72 $92.45
* Incomplete Data
Ove
rall
Tablet
Smar
tpho
ne
a monetate publication | 17
eq2 2012
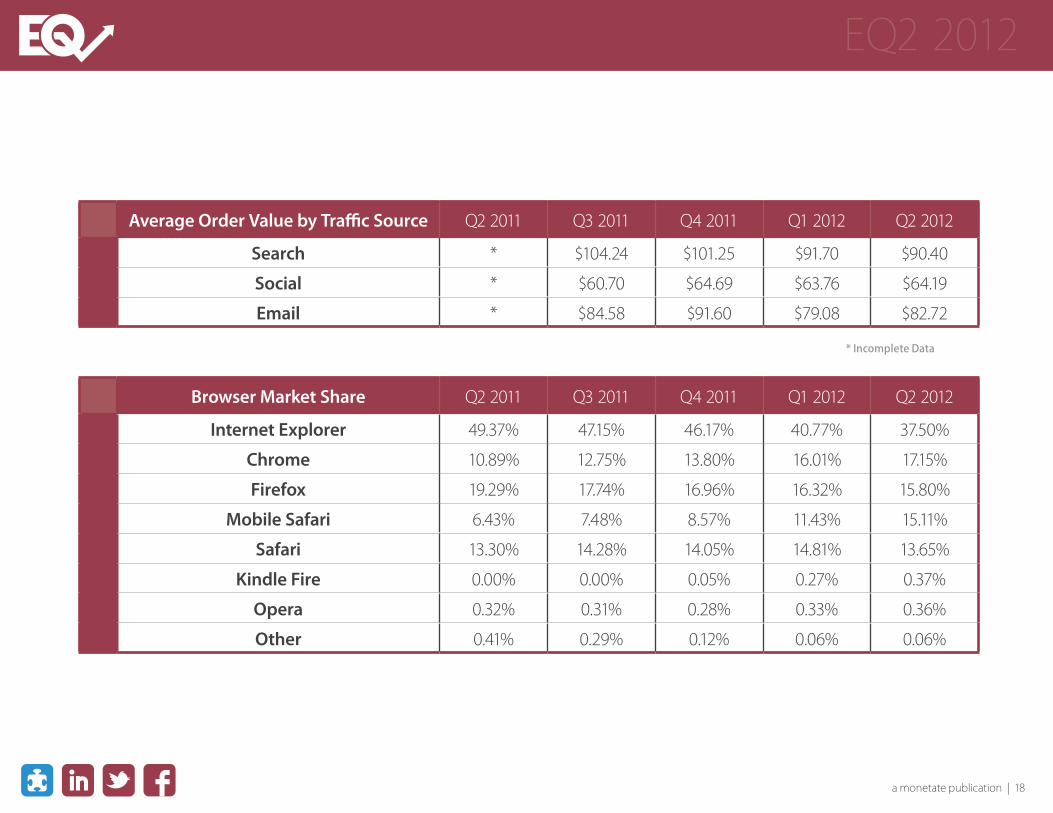
AverageOrderValuebyTrafficSource Q2 2011 Q3 2011 Q4 2011 Q1 2012 Q2 2012
Search * $104.24 $101.25 $91.70 $90.40
Social * $60.70 $64.69 $63.76 $64.19
Email * $84.58 $91.60 $79.08 $82.72
* Incomplete Data
BrowserMarketShare Q2 2011 Q3 2011 Q4 2011 Q1 2012 Q2 2012
InternetExplorer 49.37% 47.15% 46.17% 40.77% 37.50%
Chrome 10.89% 12.75% 13.80% 16.01% 17.15%
Firefox 19.29% 17.74% 16.96% 16.32% 15.80%
MobileSafari 6.43% 7.48% 8.57% 11.43% 15.11%
Safari 13.30% 14.28% 14.05% 14.81% 13.65%
KindleFire 0.00% 0.00% 0.05% 0.27% 0.37%
Opera 0.32% 0.31% 0.28% 0.33% 0.36%
Other 0.41% 0.29% 0.12% 0.06% 0.06%
a monetate publication | 18
eq2 2012
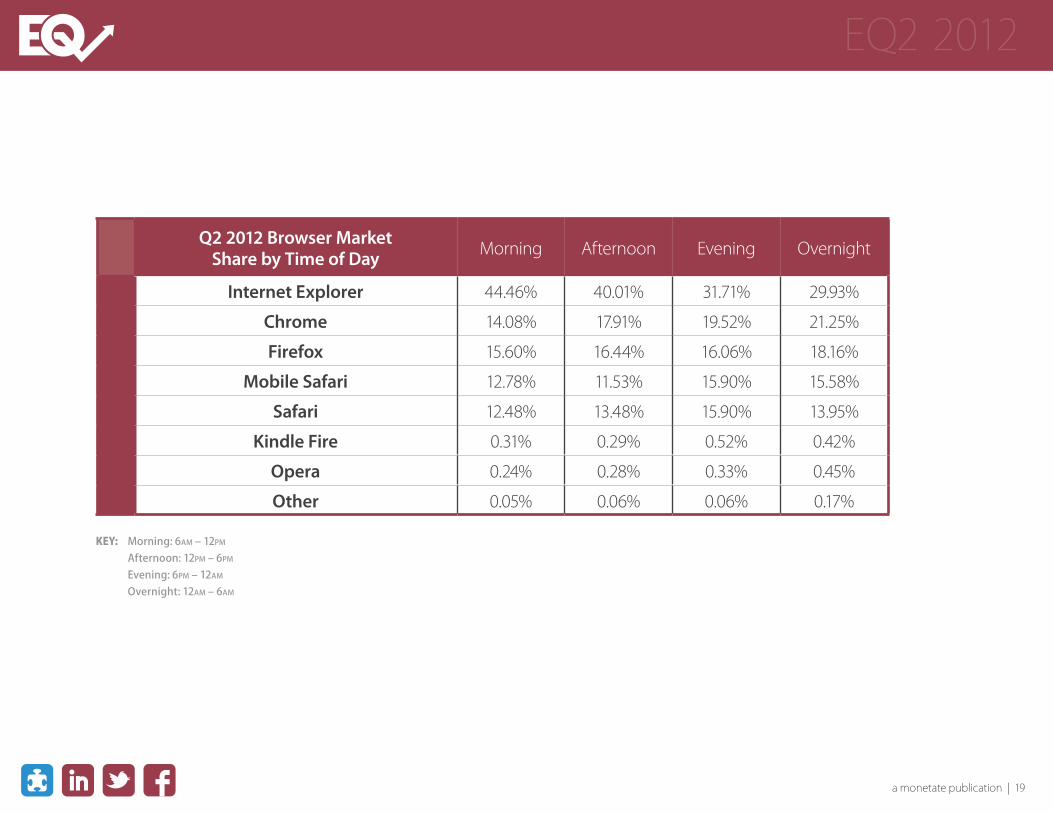
Q22012BrowserMarketSharebyTimeofDay Morning Afternoon Evening Overnight
InternetExplorer 44.46% 40.01% 31.71% 29.93%
Chrome 14.08% 17.91% 19.52% 21.25%
Firefox 15.60% 16.44% 16.06% 18.16%
MobileSafari 12.78% 11.53% 15.90% 15.58%
Safari 12.48% 13.48% 15.90% 13.95%
KindleFire 0.31% 0.29% 0.52% 0.42%
Opera 0.24% 0.28% 0.33% 0.45%
Other 0.05% 0.06% 0.06% 0.17%
Key: Morning: 6am – 12pm Afternoon: 12pm – 6pm Evening: 6pm – 12am Overnight: 12am – 6am
a monetate publication | 19
eq2 2012

MetHodoloGyThe EQ analyzes a random sample of more than 100 million
online shopping experiences using “same store” data across
each calendar quarter.
For all media inquiries, questions, and feedback
regarding the information in this report, or to obtain
copies of previous releases of the EQ, contact:
MarifranManzo-RitchieDirector of Corporate Communications (215) 987-4441 [email protected]
REFERENCES1. Android Growth to End in 2012 as Microsoft Begins to Steal Google and Apple’s Thunder (June 6, 2012)
2. Getting the Most From Your Replatforming Project (June 2012)
3. StatCounter: Google Chrome Pushes Past Microsoft’s Internet Explorer (Again) (May 21, 2012)
4. IE 10′s ‘Do-Not-Track’ Default Dies Quick Death (June 6, 2012)
a monetate publication | 20
eq2 2012

ABoUt MonetAteMonetate drives billions of dollars of revenue every year for some
of the best-known brands in the world, including Best Buy, QVC,
Urban Outfitters, Aeropostale, The Sports Authority, and PETCO. The
company’s comprehensive product suite and conversion expertise
enable marketers to deliver a more relevant customer experience with
unprecedented agility.
Leading marketers rely on Monetate’s cloud-based browser technology
to achieve a new level of speed and control, which allows them to run
16 times more optimization campaigns compared to industry averages.
The Monetate Agility Suite includes advanced products for testing,
merchandising, targeting, and cross-channel consistency, providing an
opportunity to bypass IT restraints and react in real time to customer
demands. Monetate also helps marketers implement best practices,
and drive online revenue through its expert strategic services and
content publishing teams.
a monetate publication | 21
eq2 2012

Expert Optimization ResourcesValuable case studies, eBooks, white papers, webinars & infographics
monetate.com/resources
Request a DemoCall 877-MONETATE (US) l 484-323-6313 (around the world)
demo.monetate.com
1-877-MONETATE | 484-323-6313 | www.monetate.com
©2012 Monetate Inc. All Rights Reserved