Ecological risk assessment for the effects of fishing
13
Fisheries Research 108 (2011) 372–384 Contents lists available at ScienceDirect Fisheries Research journal homepage: www.elsevier.com/locate/fishres Ecological risk assessment for the effects of fishing A.J. Hobday a,∗,1 , A.D.M. Smith a,1 , I.C. Stobutzki b,2 , C. Bulman a , R. Daley a , J.M. Dambacher a , R.A. Deng b , J. Dowdney a , M. Fuller a , D. Furlani a , S.P. Griffiths b , D. Johnson c , R. Kenyon b , I.A. Knuckey d , S.D. Ling a,3 , R. Pitcher b , K.J. Sainsbury a , M. Sporcic a , T. Smith c , C. Turnbull e , T.I. Walker f , S.E. Wayte a , H. Webb a , A. Williams a , B.S. Wise g , S. Zhou b a Wealth from Oceans Flagship, CSIRO Marine and Atmospheric Research, Castray Esplanade, Hobart, Australia b Wealth from Oceans Flagship, CSIRO Marine and Atmospheric Research, Middle St, Cleveland, Australia c Australian Fisheries Management Authority, Canberra, Australia d Fishwell Consulting, Victoria, Australia e Queensland Department of Primary Industries, Brisbane, Australia f Primary Industries Victoria, Australia g Department of Fisheries, Western Australia, Australia article info Article history: Received 29 November 2010 Received in revised form 11 January 2011 Accepted 13 January 2011 Keywords: ERAEF Australian fisheries Ecological risk assessment Data limited fisheries abstract Management of fisheries around the world is challenged by fishing impacts on habitats, bycatch species, threatened and endangered species, and even associated ecological communities. One response to these other factors has been a call for ecosystem-based fisheries management (EBFM), which demands consid- eration of the above non-target interactions. A challenge with implementation of EBFM is the scale and range of issues to be considered, all of which cannot be addressed at the same level of detail as for target species, due to data or time constraints. We developed an approach to progress the EBFM mandate in Australia, using a new ecological risk assessment framework applied to fisheries, termed Ecological Risk Assessment for the Effects of Fishing (ERAEF). Novel features of this framework include its hierarchical structure and its precautionary approach to uncertainty. The amount of information required increases through the hierarchy, and allows application in data-limited situations. The ERAEF framework has been applied to over 30 fisheries in Australia and elsewhere. The efficiencies in application of the hierarchical approach are illustrated by the south-east otter trawl fishery, where following Level 1 assessment of all components, an initial set of 600 species and 158 habitats was reduced to a group of concern of 159 species and 46 habitats using the Level 2 analysis, with the number of species of concern further reduced to 25 following Level 3 analysis. As a result of the assessments in Australia, management actions have been enacted for a range of the high risk species. Overall, the ERAEF approach offers a realistic method to assess ecological risk in an EBFM context, and has applicability in a wide range of fisheries. The interac- tive and inclusive nature of the approach also has the advantage of bringing stakeholders, scientists and managers together to develop management solutions. Crown Copyright © 2011 Published by Elsevier B.V. All rights reserved. 1. Introduction It is now widely recognized that fisheries have impacts on marine species, habitats and ecosystems that go well beyond the direct impacts of fishing on target species (see Hollingworth, 2000 ∗ Corresponding author. E-mail address: [email protected] (A.J. Hobday). 1 These authors contributed equally to this work. 2 Present address: Bureau of Rural Sciences, Department of Agriculture, Fisheries and Forestry, Canberra, Australia. 3 Present address: Institute for Marine and Antarctic Studies, University of Tasmania, Australia. and papers within; Hall and Mainprize, 2004). For example, hun- dreds of species are regularly caught and discarded in many trawl and longline fisheries, and global annual discards from fishing have been estimated at over 20 million tonnes (FAO, 1999). Interac- tions with threatened species can impact vulnerable populations, and are a concern in many fisheries (e.g. Goldsworthy et al., 2001; Kock, 2001). Impacts on habitats and ecological communities have also been documented (e.g. Thrush et al., 1995; Freese et al., 1999; Thrush and Dayton, 2002; Althaus et al., 2009). To address these broader impacts of fishing, ecosystem-based fisheries management (EBFM), also called the ecosystem approach to fisheries, has emerged over the past decade as an alternative approach to single-species fishery management (Link et al., 2002; FAO, 2003; Pikitch et al., 2004). While policy has shifted towards 0165-7836/$ – see front matter. Crown Copyright © 2011 Published by Elsevier B.V. All rights reserved. doi:10.1016/j.fishres.2011.01.013
Transcript of Ecological risk assessment for the effects of fishing

E
ARITa
b
c
d
e
f
g
a
ARRA
KEAED
1
md
a
T
0d
Fisheries Research 108 (2011) 372–384
Contents lists available at ScienceDirect
Fisheries Research
journa l homepage: www.e lsev ier .com/ locate / f i shres
cological risk assessment for the effects of fishing
.J. Hobdaya,∗,1, A.D.M. Smitha,1, I.C. Stobutzkib,2, C. Bulmana, R. Daleya, J.M. Dambachera,
.A. Dengb, J. Dowdneya, M. Fullera, D. Furlania, S.P. Griffithsb, D. Johnsonc, R. Kenyonb,.A. Knuckeyd, S.D. Linga,3, R. Pitcherb, K.J. Sainsburya, M. Sporcica, T. Smithc, C. Turnbull e,.I. Walker f, S.E. Waytea, H. Webba, A. Williamsa, B.S. Wiseg, S. Zhoub
Wealth from Oceans Flagship, CSIRO Marine and Atmospheric Research, Castray Esplanade, Hobart, AustraliaWealth from Oceans Flagship, CSIRO Marine and Atmospheric Research, Middle St, Cleveland, AustraliaAustralian Fisheries Management Authority, Canberra, AustraliaFishwell Consulting, Victoria, AustraliaQueensland Department of Primary Industries, Brisbane, AustraliaPrimary Industries Victoria, AustraliaDepartment of Fisheries, Western Australia, Australia
r t i c l e i n f o
rticle history:eceived 29 November 2010eceived in revised form 11 January 2011ccepted 13 January 2011
eywords:RAEFustralian fisheriescological risk assessmentata limited fisheries
a b s t r a c t
Management of fisheries around the world is challenged by fishing impacts on habitats, bycatch species,threatened and endangered species, and even associated ecological communities. One response to theseother factors has been a call for ecosystem-based fisheries management (EBFM), which demands consid-eration of the above non-target interactions. A challenge with implementation of EBFM is the scale andrange of issues to be considered, all of which cannot be addressed at the same level of detail as for targetspecies, due to data or time constraints. We developed an approach to progress the EBFM mandate inAustralia, using a new ecological risk assessment framework applied to fisheries, termed Ecological RiskAssessment for the Effects of Fishing (ERAEF). Novel features of this framework include its hierarchicalstructure and its precautionary approach to uncertainty. The amount of information required increasesthrough the hierarchy, and allows application in data-limited situations. The ERAEF framework has beenapplied to over 30 fisheries in Australia and elsewhere. The efficiencies in application of the hierarchicalapproach are illustrated by the south-east otter trawl fishery, where following Level 1 assessment of all
components, an initial set of 600 species and 158 habitats was reduced to a group of concern of 159species and 46 habitats using the Level 2 analysis, with the number of species of concern further reducedto 25 following Level 3 analysis. As a result of the assessments in Australia, management actions havebeen enacted for a range of the high risk species. Overall, the ERAEF approach offers a realistic method toassess ecological risk in an EBFM context, and has applicability in a wide range of fisheries. The interac-tive and inclusive nature of the approach also has the advantage of bringing stakeholders, scientists andelop
managers together to dev. Introduction
It is now widely recognized that fisheries have impacts onarine species, habitats and ecosystems that go well beyond the
irect impacts of fishing on target species (see Hollingworth, 2000
∗ Corresponding author.E-mail address: [email protected] (A.J. Hobday).
1 These authors contributed equally to this work.2 Present address: Bureau of Rural Sciences, Department of Agriculture, Fisheries
nd Forestry, Canberra, Australia.3 Present address: Institute for Marine and Antarctic Studies, University of
asmania, Australia.
165-7836/$ – see front matter. Crown Copyright © 2011 Published by Elsevier B.V. All rioi:10.1016/j.fishres.2011.01.013
management solutions.Crown Copyright © 2011 Published by Elsevier B.V. All rights reserved.
and papers within; Hall and Mainprize, 2004). For example, hun-dreds of species are regularly caught and discarded in many trawland longline fisheries, and global annual discards from fishing havebeen estimated at over 20 million tonnes (FAO, 1999). Interac-tions with threatened species can impact vulnerable populations,and are a concern in many fisheries (e.g. Goldsworthy et al., 2001;Kock, 2001). Impacts on habitats and ecological communities havealso been documented (e.g. Thrush et al., 1995; Freese et al., 1999;Thrush and Dayton, 2002; Althaus et al., 2009).
To address these broader impacts of fishing, ecosystem-basedfisheries management (EBFM), also called the ecosystem approachto fisheries, has emerged over the past decade as an alternativeapproach to single-species fishery management (Link et al., 2002;FAO, 2003; Pikitch et al., 2004). While policy has shifted towards
ghts reserved.

s Rese
EtelfiiWiae
EbLomaah
fAfaurunsawp
2
aiousga2
ofitAWa2yrmt
(t
••
•
A.J. Hobday et al. / Fisherie
BFM in a number of countries, development of practical methodso implement EBFM has not been as rapid (Pitcher et al., 2009). Forxample, the EBFM approach has been broadly adopted at a policyevel within Australia through a variety of instruments includingsheries legislation, environmental legislation, and a national pol-
cy on integrated oceans management (McLoughlin et al., 2008;ebb and Smith, 2008). These policy changes, occurring mainly
n the late 1990s, required the rapid development of scientificnd management tools to support practical implementation (Smitht al., 2007a; McLoughlin et al., 2008).
A key challenge in developing the scientific tools to supportBFM has been the paucity of data and understanding about theroader ecological impacts of fishing in particular fisheries (e.g.eslie et al., 2008). One response to this has been the adoptionf risk-based assessment methods, notably ecological risk assess-ent. In some cases, application of these tools to fisheries has
dopted conventional likelihood-consequence approaches to riskssessment (Fletcher, 2005), while in other cases novel approachesave been developed (Stobutzki et al., 2002).
In this paper we describe a new ecological risk assessmentramework applied to fisheries, termed ERAEF (Ecological Riskssessment for the Effects of Fishing). Novel features of this
ramework include its hierarchical structure and its precautionarypproach to ecological uncertainty. This method has been widelysed within federally managed fisheries in Australia, and is noweceiving international interest, having recently been adapted forse by the Marine Stewardship Council. Here we outline the ratio-ale for risk assessments in fisheries and the desirable features ofuch approaches, before describing the ERAEF method in detail,nd presenting some results from Australian fisheries. We concludeith some general observations about the challenge and futurerospects of such methods in supporting the EBFM approach.
. Risk assessment for fisheries
There are many definitions of risk and many approaches to riskssessment (Burgman, 2005). In the method we will describe, risks defined as the probability that a (specified) fishery managementbjective is not achieved. By this definition, many tools currentlysed in fishery assessment, including conventional quantitativetock assessment, may be viewed as forms of risk assessment. Inte-ration of social and economic aspects in risk assessments is lessdvanced (Webb and Smith, 2008, but see Pitcher and Preikshot,001), and so the focus here is on ecological risk assessments (ERA).
One way that ERA approaches can be distinguished is in the levelf quantitative information required. Particularly for data-deficientsheries and those with limited knowledge of ecological interac-ions, a qualitative risk assessment tool is needed (Fletcher, 2005;stles et al., 2006; Walker, 2005; Campbell and Gallagher, 2007).here more data are available, semi-quantitative or quantitative
pproaches may be useful (Stobutzki et al., 2002; Zhou and Griffiths,008). Most existing ERA methods operate at a single level of anal-sis (Scandol et al., 2009). The distinguishing feature of the ERAEFelative to other approaches is that it comprises a hierarchical set ofethods or tools, representing different levels of “quantification”,
hat are linked within a single framework.There are several desirable attributes of an ERA process
Burgman, 2005; Smith et al., 2007b; Scandol et al., 2009). An ERAhat is used to assess the effects of fishing should ideally be:
Comprehensive (identify and analyse all potential hazards).Flexible (applicable to all types of fishery, irrespective of size,fishing method, species).Transparent and repeatable (be clear about the methods, data andassumptions used in the analyses).
arch 108 (2011) 372–384 373
• Understandable (easy for stakeholders to grasp).• Cost effective (make use of existing knowledge, information and
data within realistic limits of time and resources).• Scientifically defensible (be able to withstand independent sci-
entific peer review).• Useful for management (inform appropriate risk management
responses), and• Take a precautionary approach to uncertainty.
In reality, there are tradeoffs between these various criteria, andno single approach to ERA is likely to completely meet all criteria(Scandol et al., 2009). Nevertheless, the ERAEF method we describehere was designed with these criteria in mind. The individual meth-ods used within ERAEF have evolved from several approaches,including Stobutzki et al. (2002), Fletcher (2005), Walker (2005),Griffiths et al. (2006) and Zhou and Griffiths (2008). Similar semi-quantitative approaches have also been developed over the last fiveyears (e.g. Astles et al., 2006; Campbell and Gallagher, 2007). TheERAEF method described here is a framework rather than a singlemethod, and is distinguished by its explicit hierarchical structure.Full details of the ERAEF methods, including a step-by-step userguide, are in Hobday et al. (2007) and an overview only is presentedhere.
3. Description of the ERAEF method
The ERAEF framework involves a hierarchical approach thatmoves from a comprehensive but largely qualitative analysis of riskat Level 1, through a more focused and semi-quantitative approachat Level 2, to a highly focused and fully quantitative “model-based”approach at Level 3 (Fig. 1). This approach is efficient because manypotential activities/hazards are screened out at Level 1, so that themore intensive and quantitative analyses at Level 2, and ultimatelyat Level 3, are limited to a subset of the higher risk activities asso-ciated with fishing. It also leads to rapid identification of high-riskactivities, which in turn can lead to immediate remedial action (riskmanagement response) where it may be inappropriate to delayaction pending further analysis. The ERAEF approach is also precau-tionary, in the sense that fishing activities are assumed to pose highrisks in the absence of information, evidence or logical argumentto the contrary (Hobday et al., 2007).
The approach makes use of a general conceptual model of howfishing impacts on ecological systems, which is used as the basisfor the risk assessment evaluations at each level of analysis. Fivegeneral ecological components are evaluated, corresponding tofive areas of focus in evaluating impacts of fishing for strategicassessment under Australian environmental legislation. The fivecomponents are:
• Target species.• By-product and by-catch species.• Threatened, endangered and protected species (TEP species).• Habitats.• Ecological communities.
Because a single widely accepted operational definition of anecosystem is lacking, we define these five components in sucha way that “elements of an ecosystem” are covered. This com-partmental approach allows all five components to be evaluatedindependently; a single component might be included in a risk
assessment if a particular focus is required. Future expansion orcontraction of the components is also possible within the ERAEFframework. Within each of these components, units of analysis aredefined: in the three species components (target, bycatch, TEP) theunits are species or stocks; for the habitat component the units
374 A.J. Hobday et al. / Fisheries Research 108 (2011) 372–384
F l in tha
ae
miarncaa
ietdeTltot
3
ahapa
helps in identifying suitable management responses. In many fish-eries in Australia, a wide range of stakeholders are already involvedin the management process, while for other jurisdictions, assem-bling representative stakeholders may pose a challenge. Without
Fig. 2. Schematic representation of the successive screening of risk and reduction
ig. 1. Overview of the ERAEF framework showing focus of analysis for each levelternative to proceeding to the next level in the hierarchy.
re habitat types defined by abiotic and biotic elements; and forcological communities, the units are assemblages.
A crucial process in any risk assessment framework is to docu-ent the rationale behind assessments and decisions at each step
n the analysis (Burgman, 2005). The decision to analyse the riskst subsequent higher levels in the ERAEF depends on (i) estimatedisk at the current level, (ii) availability of data to proceed to theext level, and (iii) management response to risks identified at theurrent level (e.g. if the risk is high but immediate changes to man-gement regulations or fishing practices will reduce the risk, thennalysis at the next level may be unnecessary).
In the hierarchy of the ERAEF, uncertainty decreases withncreasing level (Fig. 2). Units that are clearly low risk can often beliminated without analysis at higher levels of complexity. Unitshat cannot be clearly shown to be low risk are examined in moreetail at the next level. The trade-offs in progressing to higher lev-ls are increased data needs and costs to undertake the assessment.hus, the ERAEF is able to screen out the low risk elements at eachevel, and focus attention on potential issues of higher and/or uncer-ain risk at subsequent levels. In the following sub-sections weutline the steps in the ERAEF approach, together with an explana-ion of the underlying model that unites the levels of the hierarchy.
.1. Stakeholder participation in the ERAEF
Participation of stakeholders is an important feature of ERAEF,
nd is particularly important in the more qualitative levels in theierarchy (scoping and Level 1), where a range of inputs requiresdiverse group. Stakeholders in ERAEF are defined as those peo-le who have a direct interest in a fishery, and can include forcommercial fishery: commercial fishers, managers, recreationale hierarchy at the left in italics. At each level a risk management response is an
fishers, indigenous fishers, conservation focused non-governmentorganizations, fishery scientists, and experts in particular taxa.Stakeholder participation in the process not only improves theassessments, but also increases the chance of uptake of results and
of uncertainty through the ERAEF hierarchy. The width of the grey bars at each levelindicates the uncertainty in determining high or low risk. The activities, symbolizedby black dots, can be more clearly distinguished as low or high risk (outside thegrey bars) at higher levels in the hierarchy. Note that the reduction in uncertainty isaccompanied by an increase in assessment costs (data and $) in moving from Levels1 to 3.

s Rese
aio
3
peaae(aawbnnWtar
3
arUttcbagtm
fat(totsst
FEithm
••••••
t
A.J. Hobday et al. / Fisherie
good representation of stakeholders, issues may not be correctlyndentified or evaluated, particularly at Level 1 in the ERAEF. Mostften, stakeholders are engaged through face-to-face meetings.
.2. Precautionary elements in the ERAEF
The ERAEF approach has a number of features that result in arecautionary or conservative approach to identifying and rankingcological risk. Principal among these is assuming high risk in thebsence of data or information to the contrary. This feature providesn incentive to collect data to support future assessments. In gen-ral, the precautionary approach will result in more false positivesunits identified at higher risk than would occur when assessed athigher level with more data) than false negatives (units scored
t a lower risk than would occur when assessed at a higher levelith more data). This bias is important, as false positive results can
e screened out at higher levels in the ERAEF hierarchy, while falseegatives result in improper elimination of a hazard or unit, witho further opportunity to consider it at later stages in the ERAEF.hile no bias would be preferable, the uncertainty associated with
he qualitative and semi-quantitative risk assessments at Levels 1nd 2 argues in favour of maintaining a bias against false negativeesults.
.3. Scoping
The first step in the ERAEF is the scoping stage, and it is here thatdescription of the fishery is completed, management objectives
ecorded, activities/hazards listed, and units of analyses identified.nit of analysis is a generic term that applies to the species within
he species components (target, bycatch, TEP), the habitats withinhe habitat component, and the ecological assemblages within theommunity component. The set of species to be considered cane assembled using catch data, observer records, expert opinion,nd/or species distribution maps. The set of habitats is based oneo-morphology Williams et al. (in press). Substratum and faunis-ic characters and the community units are either qualitative or
odel-based foodweb descriptions (Hobday et al., 2007).ERAEF requires the identification of management objectives
or all five ecological components in the system. These are notlways well defined a priori, and we have developed a generic sethat can be modified by the stakeholders and assessment teamHobday et al., 2007). For example, a generic objective for the habi-at component is “Relative abundance of habitat types does not varyutside acceptable bounds”. While often quite general, these objec-ives serve to promote discussion and agreement among disparatetakeholders that a range of ecological values are important to theustainability of the fishery. More specific “acceptable bounds” arehen developed for use in Level 1.
The set of activities is selected from a comprehensive checklist.ormally, these activities are known as hazards (Burgman, 2005). InRAEF, hazards are the activities undertaken in the process of fish-ng, together with any external activities, which have the potentialo adversely impact on ecological components. The fishery-specificazards are divided into the following categories based on theajor effect of the activity:
capture/removal;direct impact without capture;addition/movement of biological material;addition of non biological material;
disturbance of physical processes;external hazards.These categories are then subdivided into fishing activities (ofhe fishery being evaluated) and external activities (including other
arch 108 (2011) 372–384 375
fisheries) (Hobday et al., 2007). These fishing and external activitiesare scored on a presence/absence basis for each fishery. Only thoseactivities that are scored as present in a fishery are then carriedforward for analysis in subsequent levels.
Precautionary elements in the scoping stage are included in twoways. First, the identification of objectives allows an appropriateapproach to precaution. The default objectives provided are gen-erally of the form “impact is within acceptable bounds” and thesebounds are selected to be precautionary (Hobday et al., 2007). Thesecond precautionary element at this stage is in the identificationof the activities. Use of a comprehensive activity checklist forcesconsideration of a broad range of potential hazards, which is pre-cautionary in nature compared to considering only expert-selectedsubsets of activities. At the end of the scoping stage, the back-ground characteristics and history of the fishery will have beendocumented, the objectives recorded, units of analysis identified,and the activities that may cause harm identified. The next stage inERAEF is to proceed to the analytical levels of the hierarchy (Levels1–3).
Levels in the ERAEF framework differ in the resolution at whichrisk is assessed, but the levels are linked by an underlying model.The underlying model is based on a theoretical relationship thatdescribes the rate of change (in abundance, amount or extent) ofthe unit at risk (e.g. a species or habitat). The fishery under consid-eration has the potential to influence the rate of change of units ineach component (e.g. target bycatch, TEP species, habitat types, andecological communities) and the ecological risk is the expressionof the influence of the fishery activities on the rate of change of theunit. Fishery activities that cause too much change in the dynamicsof the ecological system are undesirable in terms of ecological risk.In general, the rate of change in a unit (dP/dt) can be expressed asa function of the intrinsic growth rate (r) and the total amount ofthe unit (P)
dP
dt= f (r, P) (1)
Removal or enhancement (C, which can be positive or negative)due to anthropogenic factors can be subtracted from the relation-ship.
dP
dt= f (r, P) − C (2)
This general form is suitable for all the components included inthe ERAEF and can be modified to an appropriate model for eachcomponent (e.g. Williams et al., in press). The logistic equation is awell-known example from this general form (1) that describes therate of change of a population biomass (unit measure for species) asa function of carrying capacity, intrinsic rate of population growth,and fishery removals that are related to effort, population biomassand catchability. The unit measures are specific to each compo-nent, expressed in terms of areal coverage for habitat components,or species richness for communities, for example. The exact for-mulation of the general model differs among components andsub-components, but the influence of fishing activities on the func-tional form (Eq. (2)) remains consistent. The relative magnitudeof the impact on each of the parameters need not be consideredprior to Level 3, although threshold levels for the acceptable rate ofchange may be identified, such as often occurs for TEP species.
3.4. Level 1 – scale intensity consequence analysis (SICA)
Level 1 analysis relies on expert judgment involving the stake-holders. The focus of analysis at this level (SICA) is the ecologicalcomponent. In other ERA approaches that are equivalent to ERAEF’sLevel 1 (e.g. Fletcher et al., 2002; Fletcher, 2005), a likelihood-consequence framework has been employed in which likelihood

376 A.J. Hobday et al. / Fisheries Research 108 (2011) 372–384
Table 1Productivity cutoff scores for species attributes for the ERAEF Level 2 PSA method. These cutoffs have been determined from analysis of the distribution of attribute valuesfor species in the ERAEF database, and are intended to divide the attribute values into low, medium and high productivity categories.
Attribute Low productivity (high risk, score = 3) Medium productivity medium risk, score = 2) High productivity (low risk, score = 1)
Average age at maturity >15 years 5–15 years <5 yearsAverage maximum age >25 years 10–25 years <10 yearsFecundity <100 eggs per year 100–20,000 eggs per year >20,000 eggs per yearAverage maximum size >300 cm 100–300 cm <100 cm
200 cmersal–3.25
aeceiewiruiicsafwL
cawiartaf
3
ttcsbvmthc
nlowcah
3
w
Average size at maturity >200 cm 40–Reproductive strategy Live bearer (and birds) DemTrophic level >3.25 2.75
nd the consequence of the event is estimated for each unit inach of the components considered, which can be extremely timeonsuming (Scandol et al., 2009). In the ERAEF framework, anxposure-effects risk assessment approach is used at Level 1, ands only applied to the “worst case” unit (see below). The exposure-ffects model is common in situations such as human drug testing,here an effect given an exposure to a drug is of interest. Similarly,
n fisheries, the interest is the effect (e.g. impact on population size)esulting from a certain exposure (e.g. catch level). The approachsed at Level 1 involves scoring each fishing activity (hazard) for
mpact on the core objective for the component. The scale andntensity of the activity are each scored (≈exposure), and then theonsequence score (≈effect) is selected from a component-specificet of scoring guidelines (Hobday et al., 2007). These scoring tables,dapted from Fletcher et al. (2002), reflect a range of impact levelsrom negligible (score 1) to extreme (score 6). Scores of 3 or higherithin a component result in that component being examined at
evel 2.The scale and intensity scoring reflects potential changes in the
atch/removal term of the logistic model (q and E) due to the haz-rd, while the consequence scoring reflects the effect the hazardill have on the intrinsic rate of increase (r). For example, a high
ntensity score would indicate that “removal” is highly likely, whilehigh consequence score indicates that the rate of increase or car-
ying capacity would be greatly reduced by this activity. The efforterm (E) is approximated by the spatial and temporal scale of thectivity, which is an important consideration in evaluating the riskor particular activities.
.4.1. Level 1 – uncertainty and precautionary elementsThe SICA analysis employs a “plausible worst case” approach
o evaluation of risk, rather than considering all possible interac-ions. In assigning a consequence score for each activity/componentombination, the highest-scoring (worst case) plausible scenario iselected. For example, in scoring the direct impact of fishing on theycatch component, the stakeholders would consider the relativeulnerability to the gear among the bycatch species, and select theost vulnerable species based on the combination of exposure to
he gear and potential rate of recovery of the species to impact. Theighest score consistent with a plausible scenario is reported in thease of dispute.
If the plausible worst case scenario is not assessed to be at sig-ificant risk, then all other hazards will be at even lower risk. This
eads to considerable efficiency in screening out low risks. The levelf consequence that is deemed “significant” can also be selectedith precaution in mind. In Australian applications to date, any
onsequence level above “minor” (score of 2) either elicits a man-gement response, or is analysed further at a higher level in theierarchy.
.5. Level 2 – productivity susceptibility analysis (PSA)
The analysis at Level 2 is based on scoring each unit of analysisithin a component on a number of productivity and susceptibility
<40 cmegg layer Broadcast spawner
<2.75
attributes, and follows from an approach developed by Stobutzkiet al. (2002). The productivity attributes influence the “intrinsicrate of increase” (r) in the logistic model (Table 1), while the sus-ceptibility attributes are reflected in the catch/removal portion, inparticular the catchability term (q) (Table 2). Thus, the productiv-ity and susceptibility concepts that are used at Level 2 are similarin approach to Level 1. A major difference is the amount of datarequired, but the underlying model is basically the same.
The level of fishing impact a unit of analysis (e.g. species, habi-tat type, or species assemblage) can sustain, and the capacity torecover from impacts depends on its inherent productivity. Forexample, the productivity of a species or populations is determinedby demographic attributes such as longevity, growth rate, fecun-dity, recruitment and natural mortality (Table 1). The productivityof a unit such as a “habitat type” is determined by habitat attributessuch as regeneration rates (see Williams et al., in press). For com-munity units, the productivity might be determined by the diversityor size of the members. While units have inherent productivity,fishing can also affect productivity of the unit depending on thesize of reduction in the unit and the life stage of a species taken bya fishery. The productivity attributes were scored using a defaultset of scores developed for Australian fisheries (for a species exam-ple see Table 1); values for the cutoffs between risk categories mayneed to be tuned for other regions. For example, in tropical regions,faster demographic rates may lead to different productivity for thesame values as in temperate regions, and hence the need to modifythe cutoff scores.
Following Walker (2005), species susceptibility is estimated asthe product of four independent aspects: availability, encounter-ability, selectivity and post-capture mortality (PCM). A multiplica-tive approach is considered more appropriate for susceptibilitybecause low risk for any single aspect acts to reduce the overallrisk to a low value. For example, if a species is available in a fish-ing area, encounters the fishing gear, is selected by the gear, but isreturned to the water unharmed (post-capture mortality low), thenthe overall susceptibility should be recognized as low. The treat-ment of these aspects has been tailored to utilize available datasets(e.g. FishBase), and incorporate additional information, such as out-puts from mapping of species range and distribution (Hobday et al.,2007). The level of fishing impact that a unit of analysis can sustaindepends on its susceptibility to capture or damage by the sub-fishery activities. For example, the susceptibility of a unit such as aspecies is determined by species attributes such as habitat overlapwith the fishery, depth in the water column, and feeding method(Table 2). The susceptibility of a unit such as “habitat type” is deter-mined by abiotic habitat attributes such as substratum type andthe fishing method (Hobday et al., 2007). The susceptibility of thecommunity units is determined by functional group redundancy,or trophic level diversity.
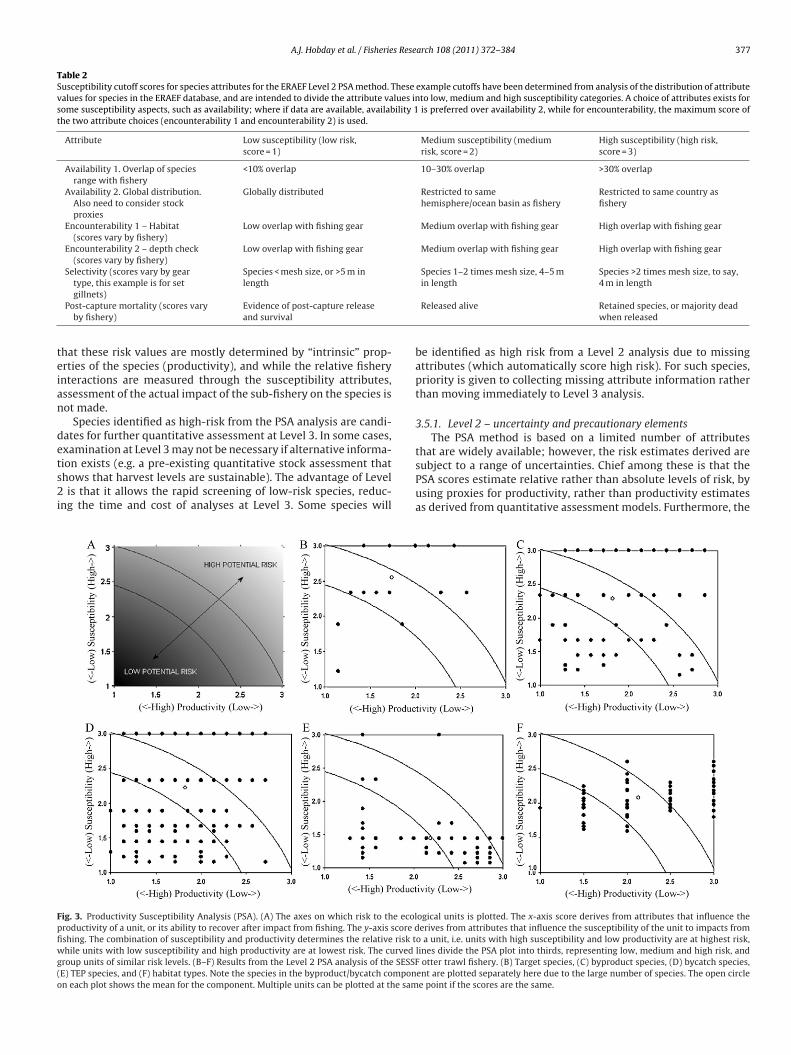
The productivity and susceptibility attributes are scored as 1(low), 2 (medium) or 3 (high). Missing attributes are scored as a3. These scores are then plotted for visualization on a PSA plot(Fig. 3A). An overall risk score is the Euclidean distance from theorigin, which allows a single risk ranking. It is important to note
A.J. Hobday et al. / Fisheries Research 108 (2011) 372–384 377
Table 2Susceptibility cutoff scores for species attributes for the ERAEF Level 2 PSA method. These example cutoffs have been determined from analysis of the distribution of attributevalues for species in the ERAEF database, and are intended to divide the attribute values into low, medium and high susceptibility categories. A choice of attributes exists forsome susceptibility aspects, such as availability; where if data are available, availability 1 is preferred over availability 2, while for encounterability, the maximum score ofthe two attribute choices (encounterability 1 and encounterability 2) is used.
Attribute Low susceptibility (low risk,score = 1)
Medium susceptibility (mediumrisk, score = 2)
High susceptibility (high risk,score = 3)
Availability 1. Overlap of speciesrange with fishery
<10% overlap 10–30% overlap >30% overlap
Availability 2. Global distribution.Also need to consider stockproxies
Globally distributed Restricted to samehemisphere/ocean basin as fishery
Restricted to same country asfishery
Encounterability 1 – Habitat(scores vary by fishery)
Low overlap with fishing gear Medium overlap with fishing gear High overlap with fishing gear
Encounterability 2 – depth check(scores vary by fishery)
Low overlap with fishing gear Medium overlap with fishing gear High overlap with fishing gear
Selectivity (scores vary by gear Species < mesh size, or >5 m in Species 1–2 times mesh size, 4–5 m Species >2 times mesh size, to say,
teian
dets2i
Fpfiwg(o
type, this example is for setgillnets)
length
Post-capture mortality (scores varyby fishery)
Evidence of post-capture releaseand survival
hat these risk values are mostly determined by “intrinsic” prop-rties of the species (productivity), and while the relative fisherynteractions are measured through the susceptibility attributes,ssessment of the actual impact of the sub-fishery on the species isot made.
Species identified as high-risk from the PSA analysis are candi-ates for further quantitative assessment at Level 3. In some cases,
xamination at Level 3 may not be necessary if alternative informa-ion exists (e.g. a pre-existing quantitative stock assessment thathows that harvest levels are sustainable). The advantage of Levelis that it allows the rapid screening of low-risk species, reduc-ng the time and cost of analyses at Level 3. Some species will
ig. 3. Productivity Susceptibility Analysis (PSA). (A) The axes on which risk to the ecolroductivity of a unit, or its ability to recover after impact from fishing. The y-axis score dshing. The combination of susceptibility and productivity determines the relative risk thile units with low susceptibility and high productivity are at lowest risk. The curved
roup units of similar risk levels. (B–F) Results from the Level 2 PSA analysis of the SESSFE) TEP species, and (F) habitat types. Note the species in the byproduct/bycatch componn each plot shows the mean for the component. Multiple units can be plotted at the sam
in length 4 m in length
Released alive Retained species, or majority deadwhen released
be identified as high risk from a Level 2 analysis due to missingattributes (which automatically score high risk). For such species,priority is given to collecting missing attribute information ratherthan moving immediately to Level 3 analysis.
3.5.1. Level 2 – uncertainty and precautionary elementsThe PSA method is based on a limited number of attributes
that are widely available; however, the risk estimates derived aresubject to a range of uncertainties. Chief among these is that thePSA scores estimate relative rather than absolute levels of risk, byusing proxies for productivity, rather than productivity estimatesas derived from quantitative assessment models. Furthermore, the
ogical units is plotted. The x-axis score derives from attributes that influence theerives from attributes that influence the susceptibility of the unit to impacts from
o a unit, i.e. units with high susceptibility and low productivity are at highest risk,lines divide the PSA plot into thirds, representing low, medium and high risk, and
otter trawl fishery. (B) Target species, (C) byproduct species, (D) bycatch species,ent are plotted separately here due to the large number of species. The open circlee point if the scores are the same.

3 s Rese
maqtaerL
•
•
•
3
taid
iomadtlatkdbiP
tbtebBesoet
3
csruiri(
78 A.J. Hobday et al. / Fisherie
ethod does not require or assume that levels of catch or effortre available for each ecological unit impacted (these are fre-uently not available for bycatch and TEP species). Neverthelesshe method does allow the identification of species or habitats thatre at greater potential risk due to characteristics of their biology orxposure to hazards from fishing, and this is useful in prioritizingemedial action or further analysis. Precautionary elements in theevel 2 PSA include:
Attributes are set to default high risk values in the absence ofinformation to the contrary.If independently verifiable information (such as independentobserver data, scientific references or reports, expert knowledgefrom those with no vested interest in the fishery) can be clearlydocumented, scores can be modified (Hobday et al., 2007).Explicit assumptions in the detail of the methods – for example,the spatial overlap score for availability is based on overlap ofeffort with the species distribution only within the area of thefishery (implicitly assuming that there may be a stock that is localto the area of the fishery).
.6. Level 3
Level 3 is the point in the ERAEF hierarchy where a fully quan-itative assessment is first undertaken. A range of methods andpproaches already exists at this level, but there remain challengesn finding methods that can work within the constraints of limitedata and time for analysis.
One “rapid assessment” method that has been applied to speciess the Sustainability Assessment for Fishing Effects (SAFE) methodf Zhou and Griffiths (2008). This method provides an absoluteeasure of risk by directly estimating both a fishing mortality rate
nd a quantitative reference point associated with it, but is lessemanding of data and much simpler to apply than a typical quan-itative stock assessment – for example it requires information onevels of effort but not of catch. It has proven particularly valu-ble in assessing large numbers of bycatch species in multi-speciesrawl fisheries (Zhou et al., 2009). The SAFE relies fairly heavily onnowledge of the spatial overlap of fishing effort with the speciesistribution and the estimate of risk is sensitive to this quantity,ut methods that do not account for this overlap can also miss
mportant information. SAFE requires less “productivity” data thanSA.
With regard to habitat and community components, quanti-ative benthic species impact assessment models are starting toe used (Ellis et al., 2008; Dichmont et al., 2008) but have noto date been incorporated directly in ERAEF analyses (Williamst al., in press). Similar assessments of the impacts of trawling onenthic (sessile) species have also been conducted in the Greatarrier Reef (Pitcher et al., 2007a) and the Torres Strait (Pitchert al., 2007b). Community and ecosystem level quantitative analy-es have become more common over recent years with the adventf Ecopath with Ecosim (Christensen and Walters, 2004; Walterst al., 2005). The need for these tools is addressed in the final sec-ion.
.6.1. Level 3 – uncertainty and precautionary elementsBeing quantitative and generally model-based, Level 3 analyses
an explicitly account for uncertainty. Although the SAFE analy-es provide direct estimates of uncertainty in both the exploitationate and the associated reference points, they are less explicit about
ncertainties arising from key assumptions in the method, includ-ng spatial distribution and movement of stocks. SAFE analysesetain some of the key precautionary elements of the PSA method,ncluding assumptions that fisheries are impacting local stockswithin the jurisdictional area of the fishery). Comparisons of PSA
arch 108 (2011) 372–384
and SAFE analyses for the same fisheries and species support theclaim that the PSA method generally avoids false negatives but canresult in many false positives. Limited testing of SAFE results againstfull quantitative stock assessments suggest that there is less “bias”in the method, but that both false negatives and false positives canand do arise (Hobday, unpublished data).
4. Application of the ERAEF
4.1. Summary across fisheries
The ERAEF method has been used in Australian federally man-aged fisheries over the period 2004–2007 to assess over 31sub-fisheries (gear types within managed fisheries), ranging fromdemersal trawl to longline to purse-seine (Smith et al., 2007b). Thescoping stage of the ERAEF identified five common activities (haz-ards) within these fisheries: (i) capture by fishing, (ii) direct impactwithout capture by fishing and general boat activity (e.g. steaming),(iii) addition of non-biological material by navigation and steaming,and from exhaust (iv) disturbance of physical processes by naviga-tion and steaming, and by anchoring or mooring, and (v) activitiesin other fisheries affecting the fishery being assessed. The activitiesthat were rarely occurring in these Australian fisheries included(i) stock enhancement, (ii) bait collection, and (iii) boat launch-ing away from established harbours. Between 14 and 29 activitiesoccurred in any one fishery (Smith et al., 2007b).
At Level 1, a comprehensive assessment of the risks associatedwith each of the identified fishing activities on all five ecologicalcomponents was completed for the 31 sub-fisheries. The highestrisk activities across all components were: (i) other fisheries, (ii)capture by fishing, (iii) direct impact of fishing without capture, and(iv) translocation of species. Although averaging scores can obscurethe individual results, it does allow comparison of fishing impact atLevel 1. The mean impact score across all fisheries for all activities(26 possible activities) was highest for the TEP component (1.15),followed by habitat (1.11), target species (1.01), communities (0.99)and the bycatch/byproduct component (0.92) (Fig. 4; Smith et al.,2007b).
There was often more than one activity-impact scenario for eachcomponent at Level 1 (score >2) that forced examination at Level 2(Fig. 4). These multiple scenarios give greater confidence that theassessment should move to Level 2. The number of activities thatled to a moderate or greater risk score varied between componentsand fisheries, with a maximum of six and a minimum of zeroper fishery and component (Fig. 4). TEP species resulted in moreactivity-impact scenarios that scored >2. The mean number ofscenarios scoring above this threshold (>2) per fishery was highestfor both the target and TEP component (1.71), and lowest for thebycatch/byproduct and community components (1.41). The totalnumber of cases across all fisheries that components progressedto examination at Level 2 ranged from 21 for habitats, to 29 fortarget species, out of a total of 31 fisheries assessed (Smith et al.,2007b). For individual fisheries, between 0 and 5 components perfishery progressed to examination at Level 2 assessment. A totalof 12 fisheries had five components that were evaluated at Level2, while only one fishery had no components moving to Level 2 (asquid jig fishery).
At Level 2, over 1200 unique species (68 target species, 857byproduct and bycatch species, and 364 threatened, endangeredand protected species) and over 200 habitats were assessed. Within
each fishery, the number of species assessed ranged from 91 (divefishery) to 788 (trawl fishery). The number of habitats assessedranged from 4 (purse seine fishery) to 274 (wide ranging long-line fishery), and the number of ecological communities from 3(dive fishery) to 64 (long line fishery) (Smith et al., 2007b). Compar-
A.J. Hobday et al. / Fisheries Research 108 (2011) 372–384 379
6543210
low
high
Score
Frequency
0
5
10
15 A
6543210
Score
Frequency
0
5
10
15 B
6543210
Score
Frequency
0
5
10
15 C
6543210
Score
Frequency
0
5
10
15 D
6543210
Score
Frequency
0
5
10
15 E
F h of ts ies, (Ba , accor
ioHfigwaAratgltwp
4
itoititlmms((ab
a
ig. 4. Results from the Level 1 (SICA) analysis of the SESSF otter trawl fishery. In eaccores >2, which moves each component to examination at Level 2. (A) Target specssemblages. Each consequence score can be assigned with high or low confidence
sons between fisheries are more complex at Level 2, as the numberf species/habitats/communities assessed varied across fisheries.owever, as illustration only, the mean Level 2 risk score acrosssheries differed between components, with the target speciesenerally at highest overall risk (1.87) (possible range [1.41–4.24]),hile the habitats that were assessed at Level 2 were overall
t lower risk than bycatch and byproduct, and TEP respectively.lthough risk profiles from PSA analyses are not strictly compa-able across fisheries (because different species or habitat unitsre represented) several interesting trends emerged in our Aus-ralian application. For example the mean PSA score across speciesroups (target, bycatch, TEP) was notably higher for a pelagic long-ine fishery than for a bottom trawl fishery. This appeared to reflecthe higher mean trophic level of the catch in the longline fishery,ith high selectivity for many high trophic level predators such aselagic sharks.
.2. Illustration of screening efficiency
Results from one fishery examined with the ERAEF approachn Australia are illustrative of the efficiency of the screening andhe prioritization that is possible. The SESSF otter trawl fisheryperates from Barrenjoey Point (Sydney) to Cape Jervis (Adelaide)n waters of depth 20–1300 m (Smith and Smith, 2001). At theime of the ERAEF assessment in 2005, the fleet size was approx-mately 100 vessels although only 76 were active. Total effort inhe same year consisted of approximately 40,000 sets resulting inandings of 19,000 t. The discard rate of quota species was esti-
ated at 8% and of non-quota species at 68% (2003 data). Theain target species are tiger flathead (Neoplatycephalus richard-
oni) on the shelf, pink ling (Genypterus blacodes) and blue grenadierMacruronus novaezelandiae) on the upper slope, and orange roughy
Hoplostethus atlanticus) at mid-slope depths. There is a quota man-gement system for 34 species/stocks and an observer program haseen operating since the mid-1990s (Wayte et al., 2007).The scoping analysis, which identified that 26 of 32 risk causingctivities were present in this fishery (Wayte et al., 2007), did not
he five components there were some fishery-related activity-impact (consequence)) byproduct/bycatch species, (C) TEP species, (D) habitat types, and (E) communityding to the consensus between the stakeholders.
eliminate any ecological components. Risks rated as major or above(risk scores 4 or 5) were all related to direct or indirect impactsfrom primary fishing operations. Severe impacts (risk score 5) wereconfined to habitats and byproduct/bycatch species (Fig. 4). Signifi-cant external hazards included other fisheries in the region, coastaldevelopment, and other extractive activities. While these externalactivities are not examined beyond Level 1 in the ERAEF as theyare outside the direct control of fisheries managers, their identifi-cation can lead to cross-sectoral consideration of these potentiallyneglected issues.
At Level 2, there were 600 species (28 target, 371 byprod-uct/bycatch, 201 TEP) assessed using the PSA analysis (Fig. 3B–E).Of these, 159 were assessed to be at potential high risk, including15 target species, 39 byproduct species, 99 by-catch species, and6 TEP species. By taxa, the high risk species comprised 58 chon-drichthyans, 96 teleosts, 4 marine birds, and 1 marine mammal.Of the 159 species assessed to be at high risk, 4 had more than 3missing attributes.
All the target species are managed through a quota system,and the introduction of harvest strategies for this group in 2006has provided the foundation for ongoing sustainability of catchesinto the future (Smith et al., 2008). Of the 6 TEP species assessedto be at high risk, the four birds are at high risk due to lack ofinformation. The single marine mammal at high risk (Australianfur seal, Arctocephalus pusillus doriferus) has low productivity andhigh susceptibility. It is captured in significant numbers by thefishery, but its overall population has increased rapidly in recentyears (Goldsworthy et al., 2003), and so fishing is not considereda major risk to the population (though being a protected species,the fishery is expected to take active steps to avoid mortality onseals). The single TEP teleost at high risk is the spiny pipehorse(Solegnathus spinosissimus), which is occasionally found entangled
in fishing gear (40 observations in 2004). The main ecologicalsustainability issue for species in this fishery is the number ofnon-target teleost and chondrichthyan species that are captured.In general, the chondrichthyan species are at high risk because oflow productivity, and the teleost species because of high exposure
380 A.J. Hobday et al. / Fisheries Research 108 (2011) 372–384
F A) risp e SAFl
tht
awn1ans1ttsoHHtmosHtm
t1ai
Sfomtba
g3bit
ig. 5. (A) Schematic showing relationship between Level 3 (SAFE) and Level 2 (PSositives and false negatives respectively. (B) The observed relationship between th
ow PSA categories is also shown.
o fishing (high proportion of range within the fishery, live inabitats that are likely to encounter the gear, and are the right sizeo be selected by the fishery).
With regard to the Habitat component, 158 habitats weressessed at Level 2 using the habitat PSA analysis. Habitat typesere classified based on substratum, geomorphology, and domi-ant fauna, using photographic data (Williams et al., in press). Of the58 habitat types, 46 were assessed to be at high risk, 58 medium,nd 54 low (Wayte et al., 2007) (Fig. 3F). Of the high risk habitats,one were found on the inner shelf (0–100 m), 18 were on the outerhelf (100–200 m), 12 were on the upper slope (200–700 m), and6 were on the mid-slope (700–1500 m). High risk mid-slope habi-ats include several categories of hard bottom (but still accessible torawl gear) with delicate epifauna consisting of octocorals, crinoids,mall sponges, and sedentary animals. There are also several typesf soft bottom habitat that support large, erect or delicate epifauna.abitats of seamount and canyon features occur at this depth zone.igh risk habitats on the upper slope also include several hard bot-
om types, in this case dominated by large sponges not seen on theid-slope. There are also several soft bottom habitats based on bry-
zoan communities which are restricted to a narrow zone near thehelf break. Habitats of canyon features occur at this depth zone.igh risk habitats on the outer shelf include soft sediment seabed
ypes interspersed with harder bottom supporting large sponges,ixed epifauna, and the bryozoan communities at the shelf break.The community component was not assessed for this fishery, as
he science-management decision taken at the conclusion of Level(Fig. 1) was to gather more information to support the Level 2
ssessment. Thus, the screening of communities at Level 2 is notllustrated in this paper.
Two key risks emerge from the Level 2 ERAEF analysis of theESSF otter trawl fishery. Both risks are related to direct impactsrom fishing, one on certain vulnerable benthic habitats, and thether on a suite of byproduct and bycatch species not currentlyanaged directly through the quota management system. For both
hese components, there are species or habitats at risk across aroad range of depths, from the outer shelf to the lower slope. Inddition, some inner shelf species are also at risk.
The Level 2 analysis suggested that 153 species from the tar-
et and bycatch/byproduct components were at high risk. A LevelSAFE analysis was undertaken for the majority of the 440 target,yproduct and bycatch species caught in the otter trawl (compris-ng 88 chondrichthyans and 352 teleosts) (Zhou et al., 2007). Ofhe 411 species examined, 25 were identified in a set of higher risk
k scores for 1164 species. Scores in the upper left and lower right represent falseE score and the PSA score. The average SAFE score in each of the high, medium and
categories, including 12 chondrichthyans. Two target species (bothteleosts) were in the high risk category.
Overall, the ERAEF analysis for this trawl fishery shows the hier-archical screening process in operation. While in this case the Level1 SICA analysis failed to eliminate any of the components from fur-ther consideration, the Level 2 species analysis focused attention onjust over a quarter of the species examined (159 out of 600). Of the153 non-TEP species in this list, the Level 3 SAFE analysis furtherfocused attention on 25 of these. Of the 158 habitat types screenedat Level 2, 48 were identified as a priority for further analysis ormanagement response (Fig. 6).
The Australian Fisheries Management Authority (AFMA) is in theprocess of developing comprehensive environmental managementstrategies for each fishery in response to the ERAEF results to date(see also Fig. 7). For example in the case of the SESSF otter trawlfishery, extensive spatial closures have been implemented at mid-slope depths (>700 m), in part to aid in recovery of depleted orangeroughy stocks, but also to protect high risk deepwater shark groups.On the upper slope, several closures have been implemented toprotect threatened gulper shark species. These spatial managementstrategies also act to protect several of the benthic habitat groupsidentified to be at high potential risk from trawling.
At a more general level, the disproportionate representation ofchondrichthyan species in the high risk groups at both Level 2 andLevel 3 species analyses has led to the development of a practi-cal guide for fishery managers to mitigate bycatch (Patterson andTudman, 2009).
4.3. Comparison of methods used in the ERAEF
One of the claims made about the hierarchical approach adoptedin ERAEF is that it is precautionary in the sense that less informationor more uncertainty results in estimates of higher potential for risk.More specifically, it is claimed that the PSA analyses at Level 2 inthe hierarchy are more likely to result in false positives (identifyinghigh risk when it is low) than false negatives (identifying low riskwhen it is high). Comparison between the Level 2 results and theresults obtained using the Level 3 SAFE method for 1164 speciesfrom six fisheries supports the claim that the Level 2 approach is
biased to false positives and results in few false negatives (Fig. 5).The mean values for the SAFE score also increased within each PSAcategory, indicating correlation in the approaches. While this doesnot represent an independent validation of the methods as much ofthe same data is used in both the PSA and SAFE analyses, it does sug-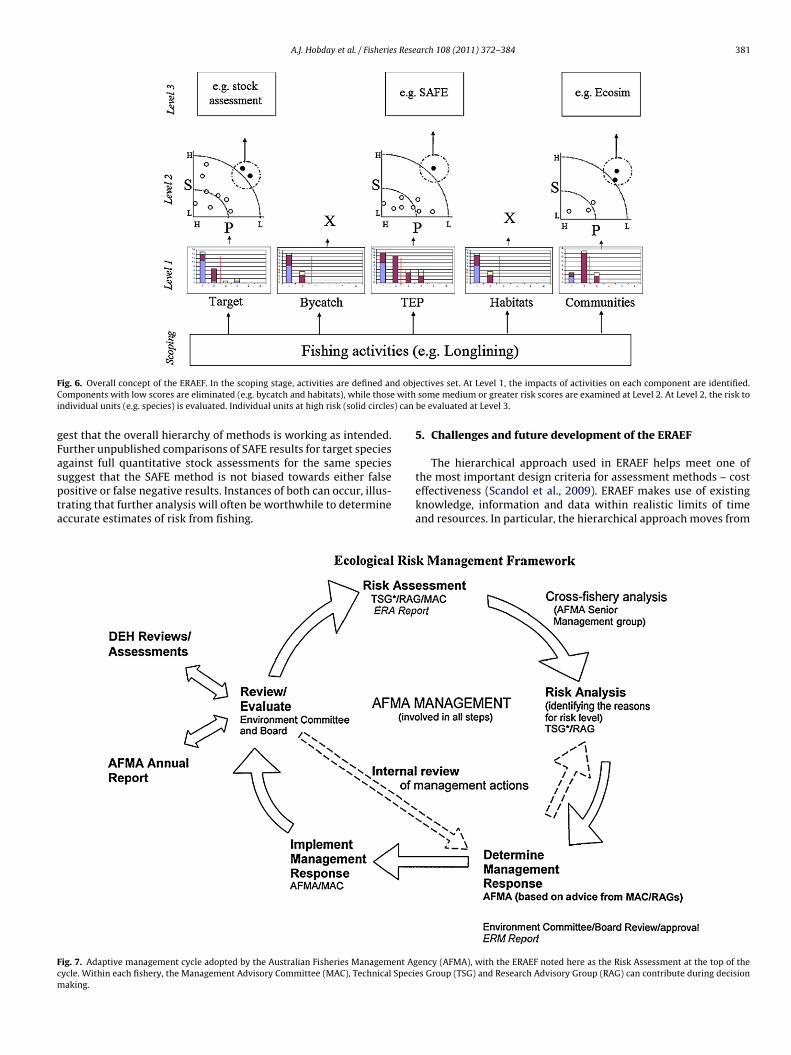
A.J. Hobday et al. / Fisheries Research 108 (2011) 372–384 381
F d objC withi ) can
gFaspta
Fcm
ig. 6. Overall concept of the ERAEF. In the scoping stage, activities are defined anomponents with low scores are eliminated (e.g. bycatch and habitats), while those
ndividual units (e.g. species) is evaluated. Individual units at high risk (solid circles
est that the overall hierarchy of methods is working as intended.urther unpublished comparisons of SAFE results for target speciesgainst full quantitative stock assessments for the same species
uggest that the SAFE method is not biased towards either falseositive or false negative results. Instances of both can occur, illus-rating that further analysis will often be worthwhile to determineccurate estimates of risk from fishing.ig. 7. Adaptive management cycle adopted by the Australian Fisheries Management Agycle. Within each fishery, the Management Advisory Committee (MAC), Technical Speciaking.
ectives set. At Level 1, the impacts of activities on each component are identified.some medium or greater risk scores are examined at Level 2. At Level 2, the risk tobe evaluated at Level 3.
5. Challenges and future development of the ERAEF
The hierarchical approach used in ERAEF helps meet one of
the most important design criteria for assessment methods – costeffectiveness (Scandol et al., 2009). ERAEF makes use of existingknowledge, information and data within realistic limits of timeand resources. In particular, the hierarchical approach moves fromency (AFMA), with the ERAEF noted here as the Risk Assessment at the top of thees Group (TSG) and Research Advisory Group (RAG) can contribute during decision

3 s Rese
bittae
hpSttMtSpmafaohttA2l
5
oblhahtTeormnm
ocdmaadrweaedt
tdsoa
82 A.J. Hobday et al. / Fisherie
eing comprehensive but relatively imprecise at Level 1, to focus-ng only on high risk components at Level 2. In moving from Level 2o Level 3, only high risk units of analysis need to be considered inhe more data and time intensive assessments. Thus ERAEF acts like“triage” system, with low risk hazards successively eliminated atach level (Fig. 6).
Since completing development of the initial method describedere, the ERAEF approach has been used and modified for specificurposes by a range of international groups, including the Marinetewardship Council (2009), the ICCAT working group on ecosys-ems, the Western Central Pacific Fisheries Commission (WCPFC),he Caribbean Regional Fisheries Mechanism (CRFM), the National
arine Fisheries Service in the US (Patrick et al., 2009), and by scien-ists involved in assessing effects of fishing in the Galapagos Islands.ome groups have chosen to use only elements within the ERAEF,articularly the PSA approach (Patrick et al., 2009). The develop-ent of new tools that can be “plugged” into the hierarchy is alsofeature of the ERAEF: each level is defined by the complexity and
ocus of the analysis and by the data requirements, rather than astool per-se. This flexibility has allowed application to all types
f fishery, irrespective of size, method, or species. The ERAEF is,owever, only an ecological risk assessment, and does not coverhe economic, social and governance components of managementhat are important in many fisheries. A single level system used inustralia for state-based fisheries (Fletcher et al., 2002; Fletcher,005) does allow this holistic treatment, but at a more qualitative
evel (Scandol et al., 2009).
.1. Lessons learned from implementation
The ERAEF is appealing as an approach that can cover a rangef ecological issues within a fishery; however, there are a num-er of challenges in undertaking an assessment, some of which are
inked to the design features of the method. The ERAEF is compre-ensive, particularly during Level 1, when all potential activitiesnd hazards are identified and treated. Some well-informed stake-olders are initially frustrated at this stage, as they often feel thatime is spent on issues that “we already know are not a problem”.his comprehensive feature is appealing to other stakeholders, forxample, with a conservation focus, as it allows all issues to be putn the table. The assembled information can allow more strategicesponses over a period of time and within a planned manage-ent process, rather than the typical reactionary responses to the
ew “issue-of-the-day” that dominates much of fishery manage-ent.The ERAEF approach is transparent and repeatable as the meth-
ds, terminology, data and assumptions used in the analyses arelearly documented. We contend that it is easy to understand, butue to the scope and multiple levels, as well as the novel ter-inology, it may take repeated exposure before all stakeholders
re comfortable with the approach. Up to three workshops forparticular fishery assessment have been needed in Australia to
evelop this understanding. On the positive side, this effort doesesult in consensus building and a shared sense of ownershipith the results, which we have seen translated into coop-
ratively developed management responses. The precautionarypproach to uncertainty is also well received by some stakehold-rs, as the absence of information does not allow an issue to beismissed and thereby induces an incentive to reduce the uncer-ainty.
In testing the ERAEF on a range of fisheries, a number of limi-
ations have become apparent and need to be resolved in ongoingevelopment (Smith et al., 2007b). Level 1 is qualitative and whilecoring tables have been developed, it is possible that small groupsf stakeholders might arrive at different risk scores. Initial guid-nce from one of our research team with experience in the methodarch 108 (2011) 372–384
and using a representative group of stakeholders has reduced thisissue. In addition, the need for clear documentation of the ratio-nale for the scoring allows decisions to be understood, debated,and reconsidered in future.
At Level 1, a range of potential risk-causing activities is consid-ered, both direct and indirect. The activity with the greatest riskhas typically been the “direct impact of fishing” on the species orhabitat of concern. This has led to the Level 2 analysis being focusedon the direct impact of the fishing activity, in terms of calculatingthe susceptibility axis. The structure of the PSA and the underlyingequations do not limit analysis to this activity, and a PSA examiningsusceptibility to other activities could be developed, using differentattributes and scoring tables. Because of the precautionary aspectto the scoring of attributes in the PSA, there is a bias to false posi-tives. This sometimes raises a credibility issue with knowledgeablestakeholders, and discussion of the results is important to deter-mine if some of the likely false positive risk scores can be correctedwith additional information.
The Level 2 PSA also ignores some current management mea-sures that may be in place to reduce risk, so operationally inAustralian fisheries we have defined the outcome of the Level 2as “potential risk”. Thus, a species can be at high potential risk, yetthe management of that risk can be used to justify “no manage-ment action needed”. Explicit inclusion of management actions inthe PSA is possible, and is under development.
One outstanding challenge in EBFM is to develop assessmenttools that integrate across a range of fisheries or components (Smithet al., 2007a). For example, a species that is captured in severalfisheries, each with different risk levels, may be better managedby a single set of arrangements, rather than fishery-specific rules.Integration and assessment of cumulative risk are easiest at thehigher levels in the ERAEF framework, for example using the SAFEmethod. In traditional stock assessment, the estimates of fishingmortality can be combined across a range of fleets. Developmentsin ecosystem modelling and its application to issues in fisheriesmanagement are providing an important integrative approach tocommunity and ecosystem level risk assessment (Smith and Fulton,2009).
5.2. Operational uptake of the ERAEF
The ERAEF can be used as part of an iterative process, as ateach level there is opportunity to improve the data used in theassessment, or to implement a management response. With regardto updating, the Australian ERAEF assessments for each federallymanaged fishery will be revisited every 3–5 years, or when certainconditions related to effort expansion or significant changes in themanagement of the fishery are encountered. ERAEF assessmentshave now been formally linked to an Ecological Risk Managementframework within AFMA, and are seen as integral to ongoing man-agement (Fig. 7). Linking the assessment to a management responseis critical in leading to improved outcomes with regard to ecologicalrisk (Burgman, 2005). To aid this, CSIRO and AFMA are in the pro-cess of extending the ERAEF to include two further stages: (i) riskcategorisation for species that provides more information about thereasons why certain species have been identified as high risk; and(ii) an assessment of residual risk, which is the level of risk remain-ing after current management arrangements are fully taken intoaccount (Smith et al., 2007b).
In conclusion, development and application of hierarchical
methods like the ERAEF presented here may offer a practical way torealistically tackle one of the challenges that arise in implementingan EBFM approach – how to assess ecological risk for the hun-dreds of species, habitats and ecological communities that may beimpacted by fishing.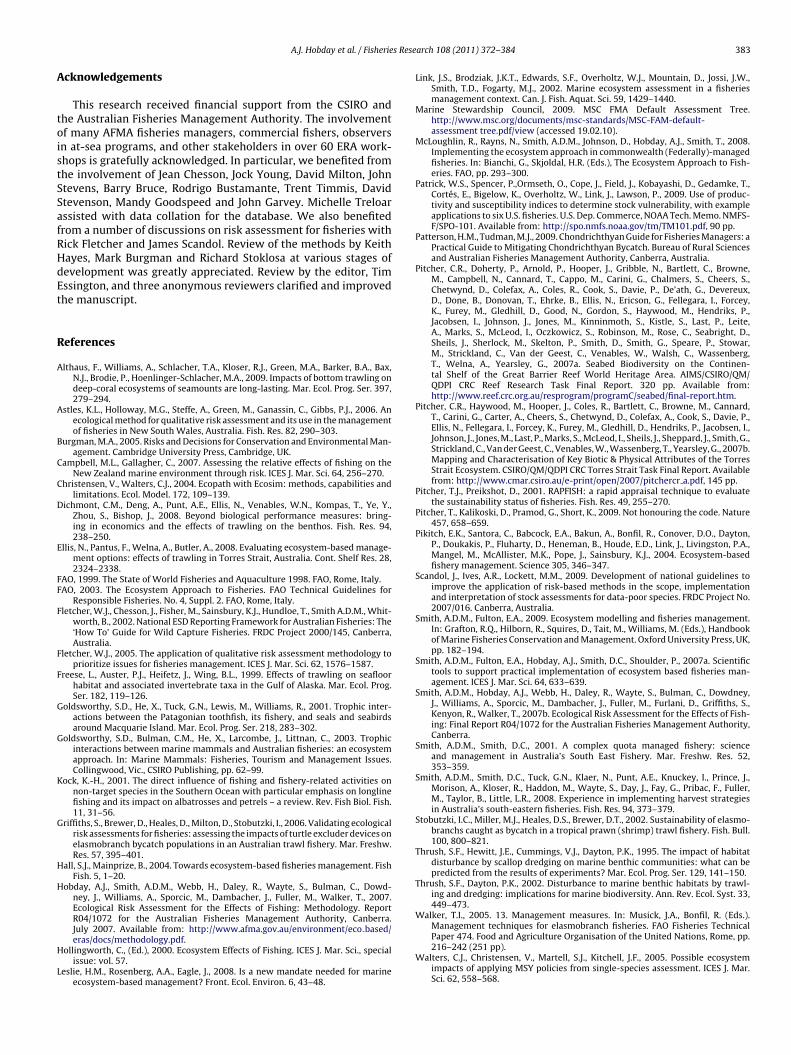
s Rese
A
toistSSafRHdEt
R
A
A
B
C
C
D
E
FF
F
F
F
G
G
K
G
H
H
H
L
A.J. Hobday et al. / Fisherie
cknowledgements
This research received financial support from the CSIRO andhe Australian Fisheries Management Authority. The involvementf many AFMA fisheries managers, commercial fishers, observersn at-sea programs, and other stakeholders in over 60 ERA work-hops is gratefully acknowledged. In particular, we benefited fromhe involvement of Jean Chesson, Jock Young, David Milton, Johntevens, Barry Bruce, Rodrigo Bustamante, Trent Timmis, Davidtevenson, Mandy Goodspeed and John Garvey. Michelle Treloarssisted with data collation for the database. We also benefitedrom a number of discussions on risk assessment for fisheries withick Fletcher and James Scandol. Review of the methods by Keithayes, Mark Burgman and Richard Stoklosa at various stages ofevelopment was greatly appreciated. Review by the editor, Timssington, and three anonymous reviewers clarified and improvedhe manuscript.
eferences
lthaus, F., Williams, A., Schlacher, T.A., Kloser, R.J., Green, M.A., Barker, B.A., Bax,N.J., Brodie, P., Hoenlinger-Schlacher, M.A., 2009. Impacts of bottom trawling ondeep-coral ecosystems of seamounts are long-lasting. Mar. Ecol. Prog. Ser. 397,279–294.
stles, K.L., Holloway, M.G., Steffe, A., Green, M., Ganassin, C., Gibbs, P.J., 2006. Anecological method for qualitative risk assessment and its use in the managementof fisheries in New South Wales, Australia. Fish. Res. 82, 290–303.
urgman, M.A., 2005. Risks and Decisions for Conservation and Environmental Man-agement. Cambridge University Press, Cambridge, UK.
ampbell, M.L., Gallagher, C., 2007. Assessing the relative effects of fishing on theNew Zealand marine environment through risk. ICES J. Mar. Sci. 64, 256–270.
hristensen, V., Walters, C.J., 2004. Ecopath with Ecosim: methods, capabilities andlimitations. Ecol. Model. 172, 109–139.
ichmont, C.M., Deng, A., Punt, A.E., Ellis, N., Venables, W.N., Kompas, T., Ye, Y.,Zhou, S., Bishop, J., 2008. Beyond biological performance measures: bring-ing in economics and the effects of trawling on the benthos. Fish. Res. 94,238–250.
llis, N., Pantus, F., Welna, A., Butler, A., 2008. Evaluating ecosystem-based manage-ment options: effects of trawling in Torres Strait, Australia. Cont. Shelf Res. 28,2324–2338.
AO, 1999. The State of World Fisheries and Aquaculture 1998. FAO, Rome, Italy.AO, 2003. The Ecosystem Approach to Fisheries. FAO Technical Guidelines for
Responsible Fisheries. No. 4, Suppl. 2. FAO, Rome, Italy.letcher, W.J., Chesson, J., Fisher, M., Sainsbury, K.J., Hundloe, T., Smith A.D.M., Whit-
worth, B., 2002. National ESD Reporting Framework for Australian Fisheries: The‘How To’ Guide for Wild Capture Fisheries. FRDC Project 2000/145, Canberra,Australia.
letcher, W.J., 2005. The application of qualitative risk assessment methodology toprioritize issues for fisheries management. ICES J. Mar. Sci. 62, 1576–1587.
reese, L., Auster, P.J., Heifetz, J., Wing, B.L., 1999. Effects of trawling on seafloorhabitat and associated invertebrate taxa in the Gulf of Alaska. Mar. Ecol. Prog.Ser. 182, 119–126.
oldsworthy, S.D., He, X., Tuck, G.N., Lewis, M., Williams, R., 2001. Trophic inter-actions between the Patagonian toothfish, its fishery, and seals and seabirdsaround Macquarie Island. Mar. Ecol. Prog. Ser. 218, 283–302.
oldsworthy, S.D., Bulman, C.M., He, X., Larcombe, J., Littnan, C., 2003. Trophicinteractions between marine mammals and Australian fisheries: an ecosystemapproach. In: Marine Mammals: Fisheries, Tourism and Management Issues.Collingwood, Vic., CSIRO Publishing, pp. 62–99.
ock, K.-H., 2001. The direct influence of fishing and fishery-related activities onnon-target species in the Southern Ocean with particular emphasis on longlinefishing and its impact on albatrosses and petrels – a review. Rev. Fish Biol. Fish.11, 31–56.
riffiths, S., Brewer, D., Heales, D., Milton, D., Stobutzki, I., 2006. Validating ecologicalrisk assessments for fisheries: assessing the impacts of turtle excluder devices onelasmobranch bycatch populations in an Australian trawl fishery. Mar. Freshw.Res. 57, 395–401.
all, S.J., Mainprize, B., 2004. Towards ecosystem-based fisheries management. FishFish. 5, 1–20.
obday, A.J., Smith, A.D.M., Webb, H., Daley, R., Wayte, S., Bulman, C., Dowd-ney, J., Williams, A., Sporcic, M., Dambacher, J., Fuller, M., Walker, T., 2007.Ecological Risk Assessment for the Effects of Fishing: Methodology. ReportR04/1072 for the Australian Fisheries Management Authority, Canberra.
July 2007. Available from: http://www.afma.gov.au/environment/eco based/eras/docs/methodology.pdf.ollingworth, C., (Ed.), 2000. Ecosystem Effects of Fishing. ICES J. Mar. Sci., specialissue: vol. 57.
eslie, H.M., Rosenberg, A.A., Eagle, J., 2008. Is a new mandate needed for marineecosystem-based management? Front. Ecol. Environ. 6, 43–48.
arch 108 (2011) 372–384 383
Link, J.S., Brodziak, J.K.T., Edwards, S.F., Overholtz, W.J., Mountain, D., Jossi, J.W.,Smith, T.D., Fogarty, M.J., 2002. Marine ecosystem assessment in a fisheriesmanagement context. Can. J. Fish. Aquat. Sci. 59, 1429–1440.
Marine Stewardship Council, 2009. MSC FMA Default Assessment Tree.http://www.msc.org/documents/msc-standards/MSC-FAM-default-assessment tree.pdf/view (accessed 19.02.10).
McLoughlin, R., Rayns, N., Smith, A.D.M., Johnson, D., Hobday, A.J., Smith, T., 2008.Implementing the ecosystem approach in commonwealth (Federally)-managedfisheries. In: Bianchi, G., Skjoldal, H.R. (Eds.), The Ecosystem Approach to Fish-eries. FAO, pp. 293–300.
Patrick, W.S., Spencer, P.,Ormseth, O., Cope, J., Field, J., Kobayashi, D., Gedamke, T.,Cortés, E., Bigelow, K., Overholtz, W., Link, J., Lawson, P., 2009. Use of produc-tivity and susceptibility indices to determine stock vulnerability, with exampleapplications to six U.S. fisheries. U.S. Dep. Commerce, NOAA Tech. Memo. NMFS-F/SPO-101. Available from: http://spo.nmfs.noaa.gov/tm/TM101.pdf, 90 pp.
Patterson, H.M., Tudman, M.J., 2009. Chondrichthyan Guide for Fisheries Managers: aPractical Guide to Mitigating Chondrichthyan Bycatch. Bureau of Rural Sciencesand Australian Fisheries Management Authority, Canberra, Australia.
Pitcher, C.R., Doherty, P., Arnold, P., Hooper, J., Gribble, N., Bartlett, C., Browne,M., Campbell, N., Cannard, T., Cappo, M., Carini, G., Chalmers, S., Cheers, S.,Chetwynd, D., Colefax, A., Coles, R., Cook, S., Davie, P., De’ath, G., Devereux,D., Done, B., Donovan, T., Ehrke, B., Ellis, N., Ericson, G., Fellegara, I., Forcey,K., Furey, M., Gledhill, D., Good, N., Gordon, S., Haywood, M., Hendriks, P.,Jacobsen, I., Johnson, J., Jones, M., Kinninmoth, S., Kistle, S., Last, P., Leite,A., Marks, S., McLeod, I., Oczkowicz, S., Robinson, M., Rose, C., Seabright, D.,Sheils, J., Sherlock, M., Skelton, P., Smith, D., Smith, G., Speare, P., Stowar,M., Strickland, C., Van der Geest, C., Venables, W., Walsh, C., Wassenberg,T., Welna, A., Yearsley, G., 2007a. Seabed Biodiversity on the Continen-tal Shelf of the Great Barrier Reef World Heritage Area. AIMS/CSIRO/QM/QDPI CRC Reef Research Task Final Report. 320 pp. Available from:http://www.reef.crc.org.au/resprogram/programC/seabed/final-report.htm.
Pitcher, C.R., Haywood, M., Hooper, J., Coles, R., Bartlett, C., Browne, M., Cannard,T., Carini, G., Carter, A., Cheers, S., Chetwynd, D., Colefax, A., Cook, S., Davie, P.,Ellis, N., Fellegara, I., Forcey, K., Furey, M., Gledhill, D., Hendriks, P., Jacobsen, I.,Johnson, J., Jones, M., Last, P., Marks, S., McLeod, I., Sheils, J., Sheppard, J., Smith, G.,Strickland, C., Van der Geest, C., Venables, W., Wassenberg, T., Yearsley, G., 2007b.Mapping and Characterisation of Key Biotic & Physical Attributes of the TorresStrait Ecosystem. CSIRO/QM/QDPI CRC Torres Strait Task Final Report. Availablefrom: http://www.cmar.csiro.au/e-print/open/2007/pitchercr a.pdf, 145 pp.
Pitcher, T.J., Preikshot, D., 2001. RAPFISH: a rapid appraisal technique to evaluatethe sustainability status of fisheries. Fish. Res. 49, 255–270.
Pitcher, T., Kalikoski, D., Pramod, G., Short, K., 2009. Not honouring the code. Nature457, 658–659.
Pikitch, E.K., Santora, C., Babcock, E.A., Bakun, A., Bonfil, R., Conover, D.O., Dayton,P., Doukakis, P., Fluharty, D., Heneman, B., Houde, E.D., Link, J., Livingston, P.A.,Mangel, M., McAllister, M.K., Pope, J., Sainsbury, K.J., 2004. Ecosystem-basedfishery management. Science 305, 346–347.
Scandol, J., Ives, A.R., Lockett, M.M., 2009. Development of national guidelines toimprove the application of risk-based methods in the scope, implementationand interpretation of stock assessments for data-poor species. FRDC Project No.2007/016. Canberra, Australia.
Smith, A.D.M., Fulton, E.A., 2009. Ecosystem modelling and fisheries management.In: Grafton, R.Q., Hilborn, R., Squires, D., Tait, M., Williams, M. (Eds.), Handbookof Marine Fisheries Conservation and Management. Oxford University Press, UK,pp. 182–194.
Smith, A.D.M., Fulton, E.A., Hobday, A.J., Smith, D.C., Shoulder, P., 2007a. Scientifictools to support practical implementation of ecosystem based fisheries man-agement. ICES J. Mar. Sci. 64, 633–639.
Smith, A.D.M., Hobday, A.J., Webb, H., Daley, R., Wayte, S., Bulman, C., Dowdney,J., Williams, A., Sporcic, M., Dambacher, J., Fuller, M., Furlani, D., Griffiths, S.,Kenyon, R., Walker, T., 2007b. Ecological Risk Assessment for the Effects of Fish-ing: Final Report R04/1072 for the Australian Fisheries Management Authority,Canberra.
Smith, A.D.M., Smith, D.C., 2001. A complex quota managed fishery: scienceand management in Australia’s South East Fishery. Mar. Freshw. Res. 52,353–359.
Smith, A.D.M., Smith, D.C., Tuck, G.N., Klaer, N., Punt, A.E., Knuckey, I., Prince, J.,Morison, A., Kloser, R., Haddon, M., Wayte, S., Day, J., Fay, G., Pribac, F., Fuller,M., Taylor, B., Little, L.R., 2008. Experience in implementing harvest strategiesin Australia’s south-eastern fisheries. Fish. Res. 94, 373–379.
Stobutzki, I.C., Miller, M.J., Heales, D.S., Brewer, D.T., 2002. Sustainability of elasmo-branchs caught as bycatch in a tropical prawn (shrimp) trawl fishery. Fish. Bull.100, 800–821.
Thrush, S.F., Hewitt, J.E., Cummings, V.J., Dayton, P.K., 1995. The impact of habitatdisturbance by scallop dredging on marine benthic communities: what can bepredicted from the results of experiments? Mar. Ecol. Prog. Ser. 129, 141–150.
Thrush, S.F., Dayton, P.K., 2002. Disturbance to marine benthic habitats by trawl-ing and dredging: implications for marine biodiversity. Ann. Rev. Ecol. Syst. 33,449–473.
Walker, T.I., 2005. 13. Management measures. In: Musick, J.A., Bonfil, R. (Eds.).
Management techniques for elasmobranch fisheries. FAO Fisheries TechnicalPaper 474. Food and Agriculture Organisation of the United Nations, Rome, pp.216–242 (251 pp).Walters, C.J., Christensen, V., Martell, S.J., Kitchell, J.F., 2005. Possible ecosystemimpacts of applying MSY policies from single-species assessment. ICES J. Mar.Sci. 62, 558–568.

3 s Rese
W
W
W
84 A.J. Hobday et al. / Fisherie
ayte, S., Dowdney, J., Williams, A., Bulman, C., Sporcic, M., Fuller, M., Smith, A.,2007. Ecological Risk Assessment for the Effects of Fishing: Otter trawl compo-nent of the Southern and Eastern Scalefish and Shark Fishery Report. Report forthe Australian Fisheries Management Authority. Canberra, Australia.
ebb, H., Smith, T., 2008. Review of the scope, assessment methods and manage-ment responses for fisheries ESD and EBFM in Australia. Fisheries Research andDevelopment Corporation, Report 2004/101, Canberra, Australia. 387 pp.
illiams, A., Dowdney, J., Smith, A.D.M., Hobday, A.J., Fuller M., in press. Evaluatingimpacts of fishing on benthic habitats: a risk assessment framework applied toAustralian fisheries. Fish. Res.
arch 108 (2011) 372–384
Zhou, S., Smith, T., Fuller, M., 2007. Rapid quantitative risk assessment for fish speciesin selected Commonwealth fisheries. Australian Fisheries Management Author-ity, Canberra, Australia. Available from CSIRO Marine Research.
Zhou, S., Griffiths, S.P., 2008. Sustainability Assessment for Fishing Effects (SAFE):
a new quantitative ecological risk assessment method and its applica-tion to elasmobranch bycatch in an Australian trawl fishery. Fish. Res. 91,56–68.Zhou, S., Griffiths, S.P., Miller, M., 2009. Sustainability assessment for fishing effects(SAFE) on highly diverse and data-limited fish bycatch in a tropical prawn trawlfishery. Mar. Freshw. Res. 60, 563–570.