Ecological Effects of a Transportation Network on … · ecological effects of a transportation...
31
Ecological Effects of a Transportation Network on Wildlife: A Spatial Analysis of the Upper Missouri River Breaks National Monument By Dawn A. Hartley Janice L. Thomson, Ph.D. Pete Morton, Ph.D. Erik Schlenker-Goodrich The Wilderness Society
Transcript of Ecological Effects of a Transportation Network on … · ecological effects of a transportation...

Ecological Effects of aTransportation Network
on Wildlife:A Spatial Analysis of the
Upper Missouri River Breaks National Monument
ByDawn A. Hartley
Janice L. Thomson, Ph.D. Pete Morton, Ph.D.
Erik Schlenker-Goodrich
The Wilderness Society

ECOLOGICAL EFFECTS OF A TRANSPORTATION NETWORK ON WILDLIFE
Acknowledgments
We are grateful to Mr. and Mrs. Bruce Rauner, the Jamee and Marshall FieldFoundation, the Mellam Family Foundation, and several anonymous donors, whosegenerosity allowed us to develop the analytical tools used in this study. TheAspenwood Foundation’s financial support for our conservation research program inthe Northern Rockies allowed us to apply these tools to the Upper Missouri RiverBreaks National Monument. The authors and The Wilderness Society express ourdeepest thanks for this crucial support, without which our research and this studywould not have been possible. Continuous donations of state-of-the-art GIS softwareto The Wilderness Society by the ESRI Conservation Program are, as always, deeplyappreciated.
Matt Becker made substantial contributions to the report, particularly through hisinsight into local landscape conditions, assistance with the analytical design, anddetailed review of results and the manuscript. Our thanks to Tom Bancroft, BetsyBuffington, Chris Killingsworth, and Wendy Vanasselt for their valuable commentson early versions of this report, Deanne Kloepfer and Mitchelle Stephenson for theirtechnical edits and design skills, and Rick Sawicki for his perseverance in guiding thereport through the production process.
Present address for co-author Erik Schlenker-Goodrich: Western Environmental Law Center,P.O. Box 1507, Taos, NM 87571 • Email: [email protected]
This science report is one of a series that stems fromconservation research studies conducted by TheWilderness Society’s Ecology and Economics ResearchDepartment. Other recent reports in the series include“Energy & Western Wildlands: A GIS Analysis of
Economically Recoverable Oil and Gas ,”“Fragmenting Our Lands: The Ecological Footprint from
Oil and Gas Development (A Spatial Analysis of a
Wyoming Gas Field) ,” and “Roadless Areas: The
Missing Link in Conservation (An Analysis of
Biodiversity and Landscape Connectivity in the
Northern Rockies) .” The reports are available at TheWilderness Society’s website (www.wilderness.org) andfrom The Wilderness Society, CommunicationsDepartment, 1615 M Street, NW, Washington, DC20036 (202-833-2300 or I-800-THE-WILD).
Editor: Deanne Kloepfer
Design/format: Mitchelle Stephenson
Printed in the United States of America by The Printing Network
on recycled paper.
© The Wilderness Society2003
1615 M Street, NWWashington, DC 20036
Tel: 202-833-2300Fax: 202-454-4337
Web site: www.wilderness.org
ReportHighlights
PAGE 1
1. IntroductionPAGE 3
2. Analytical Methods
PAGE 6
3. ResultsPAGE 10
4. Implications for Management and Conservation
PAGE 15
5. ConclusionsPAGE 21
Literature CitedPAGE 25
Contents
Preface Land conservation took a remarkable leap when President William J. Clinton, using
the authority of the Antiquities Act of 1906, established 14 national monuments onpublic lands managed by the Bureau of Land Management (BLM). Now part of theNational Landscape Conservation System, these monuments constitute an amalgamof extraordinary and ecologically valuable areas. Federally designated Wilderness,Wilderness Study Areas, Wild and Scenic Rivers, National Conservation Areas, andNational Historic and Scenic Trails are the system’s priceless jewels entrusted to theBLM’s care.
The presidential proclamations that created the monuments also mandated thatthe agency complete management plans for each of them. Every plan must alsoinclude a transportation plan to minimize the impact of access routes on monumentresources. “Ecological Effects of a Transportation Network on Wildlife: A Spatial Analysis
of the Upper Missouri River Breaks National Monument” presents the results of aWilderness Society study to identify how roads, vehicle trails, and other routes areaffecting the wild lands within Montana’s new national monument.
GIS Analyst/Programmer Dawn Hartley and Landscape Scientist Dr. JaniceThomson, at our Center for Landscape Analysis in Seattle, applied state-of-the-artspatial analysis techniques to examine the impact of various transportation features.Denver-based Resource Economist Dr. Pete Morton analyzed their findings and inter-preted the results for this report. Erik Schlenker-Goodrich of the WesternEnvironmental Law Center added his insightful legal expertise.
Our findings tell an important story. Compelling evidence exists that the currenttransportation network has had a significant impact on wildlife populations and otherfragile resources across the landscape. What is clear is that any viable transportationplan must include route closures and the restoration of route corridors to sustain pop-ulations of elk and Greater Sage-grouse, among other wildlife species — and to safe-guard the monument’s singular archaeological and historic attributes.
Beyond the Upper Missouri River Breaks National Monument and looking to thefuture, we urge the BLM to incorporate new and creative methods such as thoseemployed in this study as standard practices in land management planning. For onlywell-informed, scientifically sound decision-making will protect the treasures thatcomprise our vast National Landscape Conservation System in perpetuity.
William H. Meadows G. Thomas Bancroft, Ph.D.President Vice President
The Wilderness Society Ecology and Economics Research Department

ECOLOGICAL EFFECTS OF A TRANSPORTATION NETWORK ON WILDLIFE

PAGE 1
Report HighlightsThe spectacular Upper Missouri River Breaks National Monument in north-central
Montana, along the Wild and Scenic Upper Missouri River, was established to pre-serve the area’s outstanding ecological, scientific, and cultural values — from itsremote and undeveloped character and archaeological and historic sites to its remark-able wildlife, geologic, and paleontological resources.
Presidential Proclamation 7398, which designated the monument, requires theBureau of Land Management (BLM) to develop a transportation plan as a componentof the resource management planning process. The transportation plan is critical toprotection of the monument’s unique attributes. Although this monument appears tobe a wild, relatively untrammeled place, hundreds of years of human travel and recre-ation, cattle grazing, mining, and hunting have carved innumerable roads, vehicletrails, and other linear transportation features across the landscape. Given theirimpacts on habitat quantity and quality, the spread of invasive plants, wildlife mortal-ity, soil erosion, air quality, restoration projects, and archaeological and cultural sites,these transportation features must be carefully managed and minimized in accordancewith the monument’s preservation purpose. The immediate need to resolve trans-portation issues in this monument cannot be overstated. It reflects a key managementchallenge facing the BLM in other national monuments and conservation areas thatthe agency manages across the country.
Spatial analysis techniques can greatly assist the BLM and the public in the designof a transportation plan that minimizes impacts on the ecological and culturalresources of protected areas, while still allowing adequate access. Spatial analysis ispredicated on the recognition that roads, vehicle trails, and other linear transporta-tion features must be managed as a cohesive and interwoven system embedded withina landscape and not as a disjointed aggregation of individual access points.
This report presents three landscape fragmentation analysis methods that the BLMcan — and should — use to plan ecologically viable transportation networks. Themethods include density analysis of existing transportation network features, bufferanalysis to examine the effect zone of the transportation network, and core areaanalysis to identify habitat that remains unaffected by the transportation network.We applied these analyses to Upper Missouri River Breaks and, in this report, discussthe implications of the results for management of the monument, emphasizing poten-tial impacts on wildlife.
We found that wildlife populations are threatened by landscape fragmentationattributable to existing transportation features. Forty percent of occupied elk habitatin the monument is laced with routes at a density of 0.8 miles/mile2. Scientific litera-ture indicates that elk habitat is completely lost at this density. Nearly 100 percent ofland in the monument is within two miles of a route. It is known that Greater Sage-grouse within two miles of features constructed by people, including routes, havelower nest initiation rates. More than 86 percent of the 791-mile2 monument lieswithin one mile of a transportation feature, leaving just 111 miles2 available as poten-tial habitat for wildlife.
The results of our analyses point out the need for route closures to mitigate currentand potential impacts of the transportation network on the monument’s resources.This report does not make specific route closure recommendations, but it does presenta list of actions to ensure that the transportation plan will enhance, not degrade, thevalues of the monument. Our recommendations include:
▼
Spatial analysis can greatly assist
the BLM and the public indesigning a
transportation plan that
minimizes effects on the
monument’secological and
cultural resources.▲

• The BLM must develop a transportation plan as a key element of the monument’sResource Management Plan, emphasizing protection of the objects of interestarticulated in the proclamation and key resources that provide an overall measureof the monument’s health and integrity. The transportation plan should consist oftwo components: (1) a baseline transportation network and (2) an adaptiveecosystem management framework to guide all future transportation managementdecisions.
• In developing the baseline transportation network, the BLM should conduct ahabitat fragmentation analysis that overlays spatial data for objects of scientificand historic interest listed in the monument’s proclamation and other keyresources with transportation analysis layers similar to those generated for thisreport. “Wildcat” routes and roads or other transportation features that haveadverse impacts on the objects and resources or otherwise cause unnecessary orundue degradation of the landscape must be closed.
• Relevant literature concerning the impacts of routes on wildlife should be used toaid interpretation of the results of the habitat fragmentation analysis.
• All routes designated as open should be geographically distributed in a mannerthat reduces habitat fragmentation and human contact with sensitive resources toan acceptable minimum threshold.
• Once routes are identified for closure, the Resource Management Plan shouldinclude a detailed route closure and restoration strategy. Plan implementationshould be consistent with the adaptive ecosystem management framework andinclude enforceable timelines and a stated commitment to devote a portion ofstaff time and annual budgets to restoration of closed routes.
Spatial analysis, using mapping software and up-to-date ecological data, is a man-ageable and essential part of crafting transportation plans that protect wildlife andre c reation opportunities and other ecological, scientific, and cultural values. The useof spatial planning analysis in Upper Missouri River Breaks National Monumentclearly demonstrates the dramatic impacts of the existing transportation network byillustrating how the network causes fragmentation of critical wildlife habitat. Thisi m p o rtant information can help guide the BLM and the public in making inform e dchoices for transportation management. We believe it is essential for the BLM toincorporate spatial analysis as a standard step in transportation management p l a n n i n g .
PAGE 2ECOLOGICAL EFFECTS OF A TRANSPORTATION NETWORK ON WILDLIFE

PAGE 3
1. Introduction On January 17, 2001, Presidential
Proclamation 7398 designated 149 milesof the Wild and Scenic Upper MissouriRiver as well as adjacent Breaks countryand portions of the Judith River andArrow and Antelope creeks as theUpper Missouri River Breaks NationalMonument. The proclamation describedthe area as “remote and nearly undevel-oped” and identified “a spectacular arrayof biological, geological, and historicalobjects of interest.”
This marvelous backcountry’s river-banks and uplands are habitat for morethan 60 mammal species, 233 birdspecies, 20 different amphibians and rep-tiles, and 48 species of fish, includingthe federally endangered pallid sturgeon(Scaphirhynchus albus)and five specialstatus fish species. Mammals of particu-lar interest are the black-tailed prairiedog (Cynomys ludovicianus), a specialstatus species, and big game animals —elk (Cervus elaphus), bighorn sheep(Ovis canadensis), mule deer (Odocoileus
hemionus), whitetail deer (Odocoileus vir-
ginianus), and pronghorn antelope(Antilocapra americana).
Among the bird species, the BaldEagle (Haliaeetus leucocephalus) is listedas threatened under the federalEndangered Species Act, and thePeregrine Falcon (Falco peregrinus) andMountain Plover (Charadrius montanus)
are considered special status species.Many raptors such as eagles, PrairieFalcons (Falco mexicanus), and hawksperch and nest on the monument’s cliffs,while four species of upland game birds— Gray Partridge (Perdix perdix), Sharp-tailed Grouse (Tympanuchus
phasianellus), Greater Sage-grouse(Centrocercus urophasianus), and Ring-necked Pheasant (Phasianus colchicus) —inhabit the grasslands.
Upper Missouri River Breaks is aunique blend of forested coulees anddrainages leading down to the Missouri
River and its tribu-taries. The monu-m e n t ’s ridge topsand benches sup-p o rt the sagebrush/prairie grass-land communities typical ofN o rt h e rn Great Plains/Nort h e rnRockies landscapes. The fore s t e ddraws harbor ponderosa pine(Pinus pondero s a) and Douglas fir(Pseudotsuga menziesii), with asmaller component of RockyMountain juniper(J u n i p e rus scopulo -
ru m ). River commu-nities exhibit a widevariety of vegetativetypes, including cot-t o n w o ods ( P o p u l u s
deltoides, P. augustifo -
lia, P. trichocarpa),
The monument’s backcountry riverbanks and uplands are habitat for more than 60 mammal species, 233 bird species, 20 different amphibians and reptiles, and
48 species of fish, including (top to bottom) the federally endangered pallid sturgeonand the black-tailed prairie dog, Peregrine Falcon, and bighorn sheep.
PHOTO COURTESYNEBRASKA GAMEAND PARKS COMMISSION
1 All analyses for this report were completed using the monument’s administrative boundaryand did not address ownership patterns within the monument. Square miles are used for allarea measurements in this report for unit consistency (1 mile2 = 640 acres).
ECOLOGICAL EFFECTS OF A TRANSPORTATION NETWORK ON WILDLIFEPAGE 4
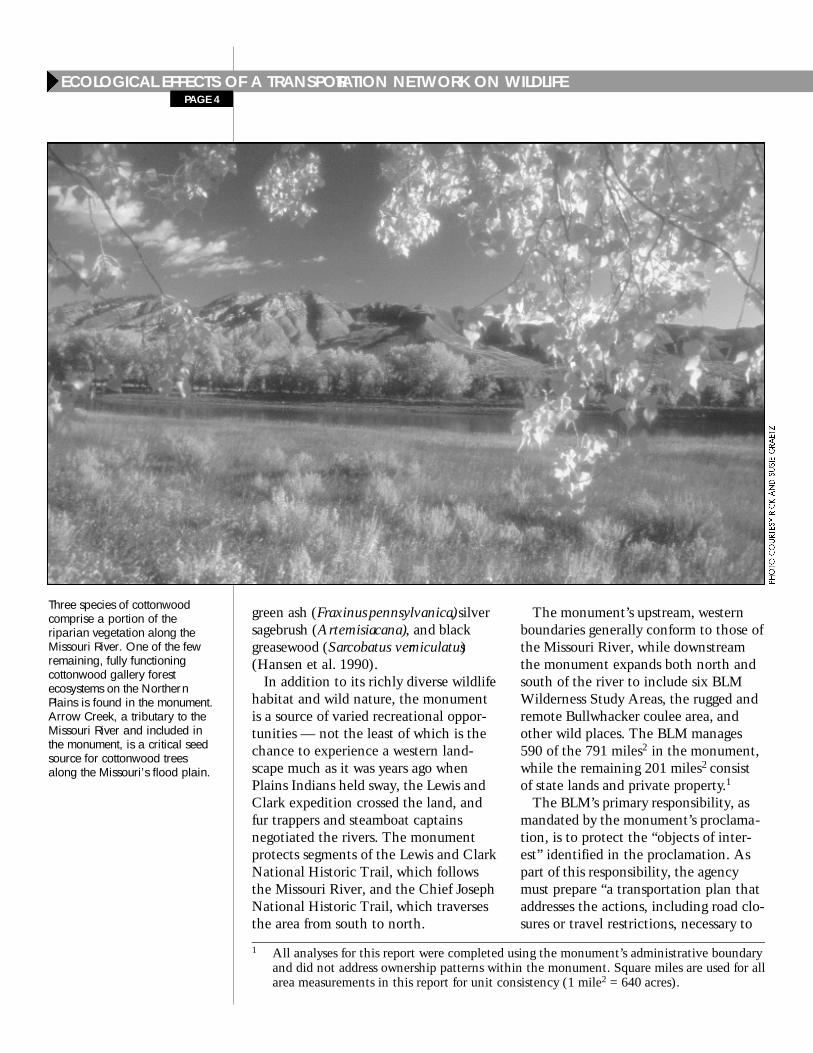
g reen ash (F r a x i n u s p e n n s y l v a n i c a ), silvers a g e b rush (A rt e m i s i ac a n a ), and blackg re a s e w o od (S a rcobatus verm i c u l a t u s)(Hansen et al. 1990).
In addition to its richly diverse wildlifehabitat and wild nature, the monumentis a source of varied recreational oppor-tunities — not the least of which is thechance to experience a western land-scape much as it was years ago whenPlains Indians held sway, the Lewis andClark expedition crossed the land, andfur trappers and steamboat captainsnegotiated the rivers. The monumentprotects segments of the Lewis and ClarkNational Historic Trail, which followsthe Missouri River, and the Chief JosephNational Historic Trail, which traversesthe area from south to north.
The monument’s upstream, westernboundaries generally conform to those ofthe Missouri River, while downstreamthe monument expands both north andsouth of the river to include six BLMWilderness Study Areas, the rugged andremote Bullwhacker coulee area, andother wild places. The BLM manages590 of the 791 miles2 in the monument,while the remaining 201 miles2 consistof state lands and private property.1
The BLM’s primary responsibility, asmandated by the monument’s proclama-tion, is to protect the “objects of inter-est” identified in the proclamation. Aspart of this responsibility, the agencymust prepare “a transportation plan thataddresses the actions, including road clo-sures or travel restrictions, necessary to
Three species of cottonwoodcomprise a portion of theriparian vegetation along theMissouri River. One of the fewremaining, fully functioningcottonwood gallery forestecosystems on the NorthernPlains is found in the monument.Arrow Creek, a tributary to theMissouri River and included inthe monument, is a critical seedsource for cottonwood treesalong the Missouri’s flood plain.

PAGE 5
protect the objects identified in thisproclamation.” Roads and other trans-portation features are of major concernbecause they fragment wildlife habitat,pose a threat to historic and archaeologi-cal objects, and destroy opportunities forremote wildland recreation. Given thefundamental significance of the trans-portation network to management andto public use of the monument, in addi-tion to the network’s profound environ-mental impacts, the transportation planmust be developed simultaneously with— and as an integral element of — theResource Management Plan for themonument.
Historically, the BLM has failed toemploy spatial analysis effectively inevaluating the direct, indirect, andcumulative impacts of transportationnetworks on cultural and naturalresources. BLM policies pertaining totransportation management are generallylimited to maintenance and design stan-
dards for individual routes and providelittle or no guidance as to the develop-ment and analysis of transportation sys-tems (see, for example, BLM Manual,Section 9113). However, the technologyis available and the need is apparent tocomplete spatial analyses. This reportdemonstrates the feasibility of usingthree landscape fragmentation metrics toevaluate the monument’s transportationnetwork at two different scales. Use ofspatial analysis technology in UpperMissouri River Breaks is particularlyimportant because of the BLM’s obliga-tion to protect objects of interest in themonument. Based on the results of ourspatial analysis, we prepared this reportto discuss the implications of transporta-tion networks on the monument’s cul-tural and natural resources and recom-mend proactive and necessary manage-ment actions to assist the BLM in ensur-ing that its decisions are reasoned andinformed.
▼
The BLM’s primaryresponsibility is to
protect the objects ofinterest identified in
the monument’sproclamation.
▲
Note: Use of the terms “transportation features” and “routes” in this report isintended to encompass all linear features used to access the monument, including“roads.” However, it is important to note that the term “roads” holds a precise legaldefinition with important management implications: within the monument, allmotorized and mechanized vehicle use is to be confined to “roads” formally designated in the Resource Management Plan. We briefly discuss the definition of “road” in our conclusions.

PAGE 6ECOLOGICAL EFFECTS OF A TRANSPORTATION NETWORK ON WILDLIFE
2 Transportation feature files for the full extent of the study area boundary were downloadedin spatial data transfer standard (SDTS) format from www.mapmart.com. The individualfiles were then combined into a single ESRI shapefile using the GlobalMapper softwareapplication, available from www.globalmapper.com.
3 Railroads and other minor transportation features are essentially absent in the monument,where they account for less than one percent of the transportation network. In the largerstudy area, they comprise a little more than two percent of the transportation network.
2. Analytical Methods
Data InputTo provide a broader context for our
analyses, we defined a study area thatencompasses the monument and sur-rounding landscape. Examination of themonument in a broader context is consis-tent with the National Enviro n m e n t a lPolicy Act of 1969, which re q u i res theBLM to analyze the direct, indirect, andcumulative impacts of managementactions on the broader landscape, not just
the lands within the administrativeboundaries of the monument. Figure 1 dis-plays the study area, which, based onwatershed-level hydrologic unit bound-aries, is 6,739 miles2 in size.
Geographic data for the transportationnetwork were obtained from the U.S.Geological Survey (USGS) in digitalline graph (DLG) format.2 This datasetcontains roads, vehicle trails, and rail-roads — all features that contribute tolandscape fragmentation3 (Figure 2).Because the BLM has not, to date, com-
FIGURE 1.
The study area
Montana
Loma
Virgelle
Missouri River
Arrow CreekJudith River
Antelope Creek
BullwhackerWilderness Study AreaUpper Missouri River Breaks National MonumentStudy Area
DY JunctionLeroy
Fort Benton

PAGE 7
pleted an inventory of roads and trails inthe monument, the USGS dataset is thebest available.4 This dataset is likely tounderestimate the mileage of “wildcat”routes created by off-road travel allowedbefore the monument was designated.
Geographic data for the monument’sboundary and streams were acquiredfrom the BLM.5 Species-distributiondata layers were obtained from the
Montana State Department of Fish,Wildlife and Parks,6 and watershedboundaries were obtained from theMontana State Library’s website.7
Methods of MeasuringFragmentation Patterns
Fragmentation has been defined as the“ c reation of a complex mosaic of spatialand successional habitats from form e r l y
FIGURE 2.
The physical footprint of the transportation network in the study areaThis figure depicts the 7,692 miles of linear transportation features (roads, vehicle trails, and railroads) in the 6,739-mile2 study area.
Study Area
Monument
Transportation Network Features
4 While the road and trail inventories are important, it is equally critical to inventory themonument’s objects of interest and key resources that provide an overall measure of themonument’s health and integrity.
5 BLM Lewiston Field Office.6 Species distribution data was downloaded in ESRI export format from the Montana State
Department of Fish, Wildlife and Parks website at http://fwp.state.mt.us/insidefwp/fwpli-brary/gis/gisdownloads.asp#Wildlife.
7 Montana 5th-Code 11-Digit Watersheds were downloaded in ESRI export format from theMontana State Library’s Natural Resource Information System athttp://nris.state.mt.us/gis/datatop.html.

PAGE 8ECOLOGICAL EFFECTS OF A TRANSPORTATION NETWORK ON WILDLIFE
contiguous habitat” (Lehmkuhl andR u ggiero 1991). The degree of fragmen-tation caused by the transportation net-work and the effects of such fragmenta-tion on the ecological composition,structure, and functions of a landscapeare difficult to measure and far from fullyunderstood. But a variety of landscapemetrics have been documented in thescientific literature to help measure thecondition of a landscape and its level offragmentation (McGarigal and Marks1994).
For our study, we selected three land-scape metrics: (1) density of roads andother linear features in the transporta-tion network, (2) amount of habitatwithin the transportation effect zone,and (3) size of core areas. Each of theselandscape metrics is important and rele-vant to any credible environmentalanalysis and any decision reached pur-suant to such analysis. The analyticalwork was conducted using commercialgeographic information systems (GIS)software from ESRI and custom softwaredeveloped by The Wilderness Society.
Method #1: Density analysis of
transportation features. Density is ameasure of the number of miles of lineartransportation features per unit area andis a common metric in quantitativeassessments of ecological impacts from alandscape perspective. Density analysisprovides easily obtainable base-levelinformation to help ensure reasoned andinformed decisions.
The density of transportation featureswas calculated as an average across themonument and overall study area. Inaddition, the landscape was sub-sampled,using a series of 1-mile2 and 4-mile2 sam-pling windows, for both the monumentand study area. Measuring density insampling windows of different sizes pro-vides an understanding of the variabilityof density across scales. This principle isimportant to gauge the effects of frag-
mentation on different species (Urban etal. 1987, Wiens and Milne 1989, Turneret al. 1994). For example, differences indispersal distances among species causethem to respond to habitat features atdifferent scales.
Method #2: Analysis of the trans -
portation effect zone. Forman (1999)uses the term “road effect zone” todescribe the influence of roads beyondthe actual physical feature. Extendingthis concept to include not just roads,but all features of a transportation net-work, we defined a “transportation effectzone.” The width of the zone depends onthe effects measured (for example, noise,dust, erosion, human presence, etc.) andthe activity that is affected (for example,Greater Sage-grouse breeding, elk calv-ing, or wilderness experience for hikers).
Analysis of transportation effect zonesenhances the credibility and viability ofenvironmental analyses and decisionsreached in accordance with such analy-ses by more accurately disclosing thedirect, indirect, and cumulative impactsof fragmentation across the landscape.Ignoring or discounting transportationeffect zones reduces and, in some cases,fatally compromises the credibility andviability of environmental analyses andassociated decisions.
We examined fragmentation patternsassociated with the physical footprintalone and the transportation effect zonesof four different widths for the monu-ment and overall study area. The physi-cal footprint of the road was estimatedby applying a width of 3.5 meters to theroad data, which represents the averagewidth of a single lane road (Trombulakand Frissell 2000). Transportation effectzone data layers were generated byapplying widths of 1/4 mile, 1/2 mile, 1mile, and 2 miles to the transportationfeatures. The zone widths were selectedto represent a range of other potentialimpacts, including noise and hunting.
▼
We conducted aspatial analysis ofthe monument andthe surroundinglandscape toillustrate impacts ofthe transportationnetwork on themonument’s objectsof interest and otherkey resources.▲

Method #3: Analysis of core area.
Core areas, sometimes called interiorhabitat or habitat security, exist in nat-ural landscapes as contiguous blocks ofuniform habitat away from habitat edges.Free from fragmentation, communities ofnative species and ecological functionspersist uninterrupted in the core areas.For our analysis, core areas are defined asportions of the landscape that are suffi-ciently far from transportation corridorsto be relatively unaffected by them. Foreach of the transportation effect zone
data layers described above, we created acorresponding core area data layer byidentifying all lands outside of the trans-portation effect zone. We also calculatedthe mean core area size by dividing thetotal core area by the number of coreareas. Generally, the larger the core area,the more viable the wildlife habitat.Analysis of core areas is essential tocredible and viable environmentalanalyses, providing valuable informationthat increases the prospects for reasonedand informed decisions.
PAGE 9
Vehicle trail across uplands habitat in the monument. Many such trails across the monument’slandscape create barriers to wildlife movement and break up important wildlife habitat.

PAGE 10
3. ResultsDensity of transportationfeatures
The monument’s administrativeboundary covers approximately 791miles2 and captures 523 miles of lineartransportation features. This representsan average transportation feature densityof 0.7 miles/mile2. Within the 6,739-mile2 study area, there are 7,692 miles oflinear transportation features, for atransportation feature density of 1.1miles/mile2.
Transportation feature density esti-mates are scale dependent, however, andvary across any landscape. Densitiesmeasured within 1- and 4-mile2 samplingwindows illustrate the spatial variationin feature density across the monumentand overall study area (Table 1 andFigure 3).
Results show that in the 1-mile2 s a m-pling windows, densities range from a highof 9.3 miles/mile2 to a low of 0.0m i l e s / m i l e2 for the monument and from ahigh of 9.2 miles/mile2 to a low of 0.0m i l e s / m i l e2 for the study area. In the 4-m i l e2 sampling windows, densities rangef rom a high of 6.8 miles/mile2 to a low ofless than 0.1 miles/mile2 for the monu-ment and from a high of 6.1 miles/mile2 t oa low of 0.0 miles/mile2 for the study are a .
The transportation feature densitiescalculated for the 1-mile2 sampling win-
dows were compared to maps of occupiedelk habitat within the monument. Basedon this overlay analysis, we found thatjust over 50 percent of the habitat hast r a n s p o rtation feature densities gre a t e rthan 0.5 miles/mile2, and 40 percent hasf e a t u re densities greater than 0.8m i l e s / m i l e2. Furt h e rm o re, 35 percent ofthe monument’s occupied elk habitat hast r a n s p o rtation feature densities gre a t e rthan one mile/mile2, and 6 percent of thehabitat contains transportation feature sat greater than two miles/mile2. Themaximum route density within occupiedelk habitat was 4.3 miles/mile2, based onthe 1-mile2 sampling window.
Analysis of the transportationeffect zone
The physical footprint of the trans-portation network in the monumentcovers approximately 1 mile2, or lessthan one percent of the monument.Within the study area, the physical foot-print is 16 miles2, representing less thanone percent of the study area. Beyondthis area of direct impact are the differ-ent transportation effect zones thataffect 32 to 99 percent of the monument(Table 2 and Figure 4). Results for theoverall study area, also included in Table2, show that 46 to 99 percent is affected,depending on the size of the transporta-tion effect zone.
ECOLOGICAL EFFECTS OF A TRANSPORTATION NETWORK ON WILDLIFE
TABLE 1.Summary of density analysis
Percent of monument and study area containing different densities of transportation features fortwo sampling window sizes.
MONUMENT STUDY AREAFeature Density 1-mile2 4-mile2 1-mile2 4-mile2
mile/mile2 window (%) window (%) window (%) window (%)0 34 9 21 50-1 30 63 28 481-2 28 26 36 392-4 7 1 14 7>4 <1 <1 <1 <1
▼
Depending on thewidth of thetransportation effectzone, thetransportationnetwork affectsbetween 32 and 99percent of themonument andbetween 46 and 99percent of the overallstudy area.▲

PAGE 11
FIGURE 3.Density of transportation network features in the study area
Calculated for 1-mile2 and 4-mile2 sampling windows. The darker the shading, the higher the transportation feature density.
Study Area
Monument
Density (mile/mile2)00-11-22-4>4
Based on 1-mile2 sampling window
Based on 4-mile2 sampling window
ECOLOGICAL EFFECTS OF A TRANSPORTATION NETWORK ON WILDLIFEPAGE 12
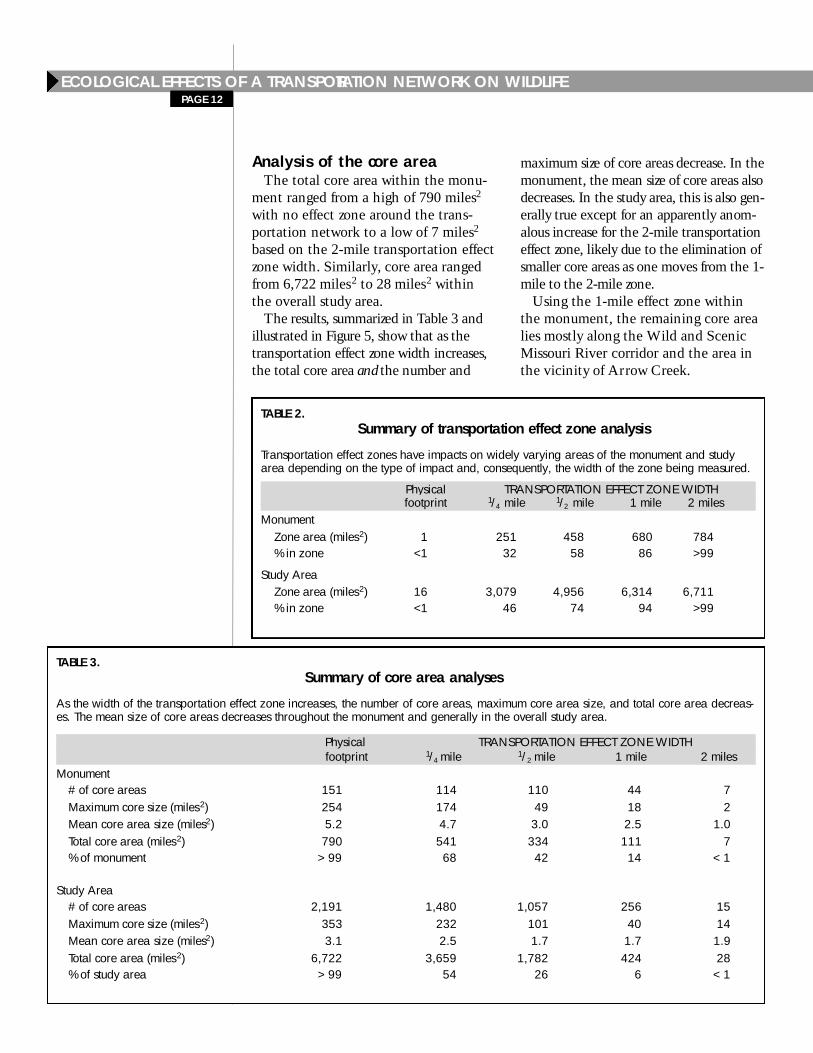
Analysis of the core areaThe total core area within the monu-
ment ranged from a high of 790 miles2
with no effect zone around the trans-portation network to a low of 7 miles2
based on the 2-mile transportation effectzone width. Similarly, core area rangedfrom 6,722 miles2 to 28 miles2 withinthe overall study area.
The results, summarized in Table 3 andillustrated in Figure 5, show that as thet r a n s p o rtation effect zone width incre a s e s ,the total core area a n d the number and
maximum size of core areas decrease. In themonument, the mean size of core areas alsod e c reases. In the study area, this is also gen-erally true except for an apparently anom-alous increase for the 2-mile transport a t i o ne ffect zone, likely due to the elimination ofsmaller core areas as one moves from the 1-mile to the 2-mile zone.
Using the 1-mile effect zone withinthe monument, the remaining core arealies mostly along the Wild and ScenicMissouri River corridor and the area inthe vicinity of Arrow Creek.
TABLE 2.Summary of transportation effect zone analysis
Transportation effect zones have impacts on widely varying areas of the monument and studyarea depending on the type of impact and, consequently, the width of the zone being measured.
Physical TRANSPORTATION EFFECT ZONE WIDTHfootprint 1/4 mile 1/2 mile 1 mile 2 miles
MonumentZone area (miles2) 1 251 458 680 784% in zone <1 32 58 86 >99
Study AreaZone area (miles2) 16 3,079 4,956 6,314 6,711% in zone <1 46 74 94 >99
TABLE 3.Summary of core area analyses
As the width of the transportation effect zone increases, the number of core areas, maximum core area size, and total core area decreas-es. The mean size of core areas decreases throughout the monument and generally in the overall study area.
Physical TRANSPORTATION EFFECT ZONE WIDTHfootprint 1/4 mile 1/2 mile 1 mile 2 miles
Monument# of core areas 151 114 110 44 7Maximum core size (miles2) 254 174 49 18 2Mean core area size (miles2) 5.2 4.7 3.0 2.5 1.0Total core area (miles2) 790 541 334 111 7% of monument > 99 68 42 14 < 1
Study Area# of core areas 2,191 1,480 1,057 256 15Maximum core size (miles2) 353 232 101 40 14Mean core area size (miles2) 3.1 2.5 1.7 1.7 1.9Total core area (miles2) 6,722 3,659 1,782 424 28% of study area > 99 54 26 6 < 1
PAGE 13
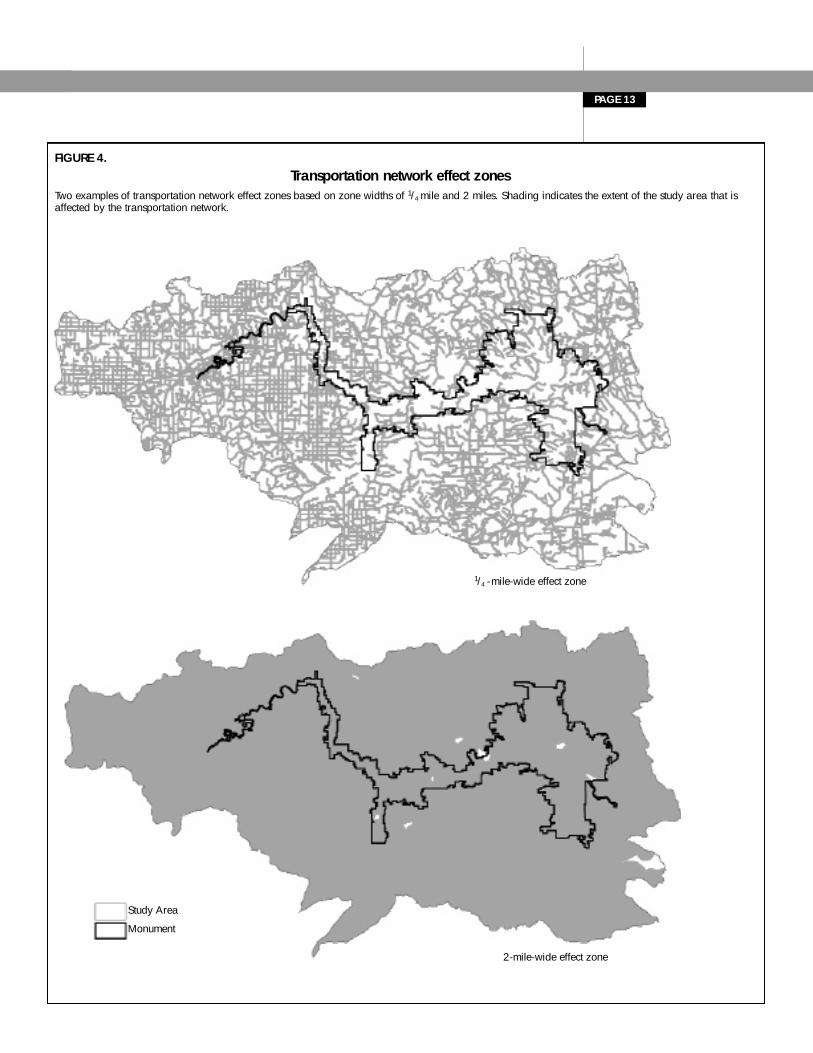
FIGURE 4.Transportation network effect zones
Two examples of transportation network effect zones based on zone widths of 1/4 mile and 2 miles. Shading indicates the extent of the study area that isaffected by the transportation network.
Study Area
Monument
1/4 -mile-wide effect zone
2-mile-wide effect zone

ECOLOGICAL EFFECTS OF A TRANSPORTATION NETWORK ON WILDLIFEPAGE 14
FIGURE 5.Core areas beyond transportation network effect zone
Two examples of core areas (shading) that lie beyond relatively narrow (1/4-mile) and wider (2-mile) transportation network effect zones.
Study Area
Monument
Core areas beyond 1/4-mile-wide effect zone
Core areas beyond 2-mile-wide effect zone
PAGE 15
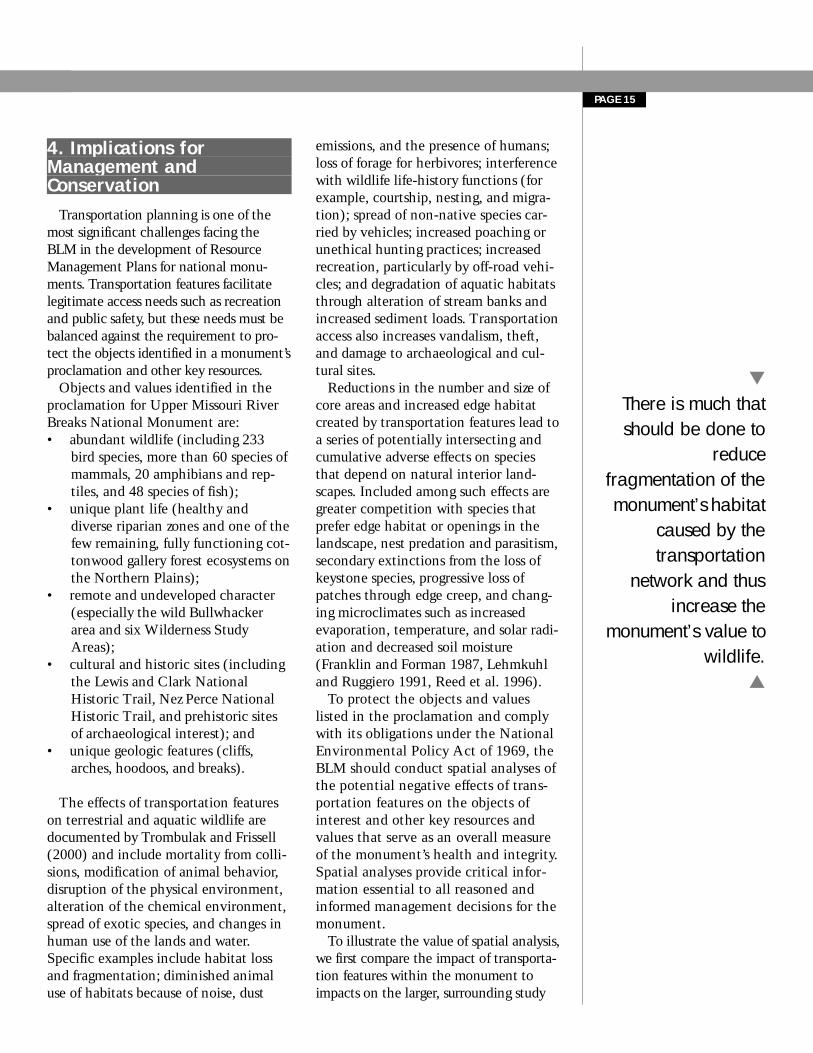
4. Implications for Management and Conservation
Tr a n s p o rtation planning is one of themost significant challenges facing theBLM in the development of Resourc eManagement Plans for national monu-ments. Tr a n s p o rtation features facilitatelegitimate access needs such as re c re a t i o nand public safety, but these needs must bebalanced against the re q u i rement to pro-tect the objects identified in a monument’sp roclamation and other key re s o u rces.
Objects and values identified in theproclamation for Upper Missouri RiverBreaks National Monument are: • abundant wildlife (including 233
bird species, more than 60 species ofmammals, 20 amphibians and rep-tiles, and 48 species of fish);
• unique plant life (healthy anddiverse riparian zones and one of thefew remaining, fully functioning cot-tonwood gallery forest ecosystems onthe Northern Plains);
• remote and undeveloped character(especially the wild Bullwhackerarea and six Wilderness StudyAreas);
• cultural and historic sites (includingthe Lewis and Clark NationalHistoric Trail, Nez Perce NationalHistoric Trail, and prehistoric sitesof archaeological interest); and
• unique geologic features (cliffs, arches, hoodoos, and breaks).
The effects of transportation featureson terrestrial and aquatic wildlife aredocumented by Trombulak and Frissell(2000) and include mortality from colli-sions, modification of animal behavior,disruption of the physical environment,alteration of the chemical environment,spread of exotic species, and changes inhuman use of the lands and water.Specific examples include habitat lossand fragmentation; diminished animaluse of habitats because of noise, dust
emissions, and the presence of humans;loss of forage for herbivores; interferencewith wildlife life-history functions (forexample, courtship, nesting, and migra-tion); spread of non-native species car-ried by vehicles; increased poaching orunethical hunting practices; increasedrecreation, particularly by off-road vehi-cles; and degradation of aquatic habitatsthrough alteration of stream banks andincreased sediment loads. Transportationaccess also increases vandalism, theft,and damage to archaeological and cul-tural sites.
Reductions in the number and size ofcore areas and increased edge habitatcreated by transportation features lead toa series of potentially intersecting andcumulative adverse effects on speciesthat depend on natural interior land-scapes. Included among such effects aregreater competition with species thatprefer edge habitat or openings in thelandscape, nest predation and parasitism,secondary extinctions from the loss ofkeystone species, progressive loss ofpatches through edge creep, and chang-ing microclimates such as increasedevaporation, temperature, and solar radi-ation and decreased soil moisture(Franklin and Forman 1987, Lehmkuhland Ruggiero 1991, Reed et al. 1996).
To protect the objects and values listed in the proclamation and complywith its obligations under the NationalE n v i ronmental Policy Act of 1969, theBLM should conduct spatial analyses ofthe potential negative effects of trans-p o rtation features on the objects ofi n t e rest and other key re s o u rces andvalues that serve as an overall measureof the monument’s health and integrity.Spatial analyses provide critical infor-mation essential to all reasoned andi n f o rmed management decisions for them o n u m e n t .
To illustrate the value of spatial analysis,we first compare the impact of transport a-tion features within the monument toimpacts on the larg e r, surrounding study
▼
There is much thatshould be done to
reducefragmentation of themonument’s habitat
caused by thetransportation
network and thusincrease the
monument’s value towildlife.
▲

a rea. Next, we look within the monumentt o briefly examine the potential impactsof the monument’s transportation networkon big game species (elk, bighorn sheep,mule deer, whitetail deer, and pro n g h o rnantelope) and the Greater Sage-gro u s eand black-tailed prairie dog. While thesebrief analyses provide adequate guidancefor some management re c o m m e n d a t i o n s ,substantially more information is neededfor a complete assessment of wildlife in
the monument and to make specific re c-ommendations for road closures. We alsosummarize the potential impacts of trans-p o rtation features on water re s o u rces andw i l d e rness re c reation opport u n i t i e s .
We emphasize that information iss o rely lacking in re g a rd to the monu-m e n t ’s objects of interest and other keyre s o u rces. Because such information isessential to reasoned and inform e dmanagement choices, it is incumbentupon the BLM to collect the inform a-tion or justify why such data and infor-mation were not obtained as part of there s o u rce management planningp ro c e s s .8 In either case, the burden ofp roof is on the agency to justify man-agement decisions and, where suchi n f o rmation is lacking, to establish ap rocess to collect the information, actc a u t i o u s l y, and defer to the side of con-s e rv a t i o n .
Context of the MonumentExamination of Figures 3 through 5
reveals the value of the monument inthe context of the study area. It is appar-ent in Figure 3 that transportation fea-ture densities are generally lower in theeastern portion of the study area, wherethe majority of the monument is locatedand that the monument contains rela-tively few higher-density sampling win-dows compared to the rest of the studyarea. This is statistically substantiatedfor both the 1- and 4-mile2 samplingwindows.
The transportation effect zones inF i g u re 4 and core areas in Figure 5 a l s oshow that the transportation networka ffects the monument less than the sur-rounding study area. For example, in the1/4-mile transportation effect zone, 74p e rcent of the study area is impacted bythe transportation network compared to58 percent in the monument. This corre-sponds to 26 percent core area in thestudy area and 42 percent core area in
ECOLOGICAL EFFECTS OF A TRANSPORTATION NETWORK ON WILDLIFEPAGE 16
Cow Island, an historicallyimportant site in the monument.Lewis and Clark passed through this area in 1805; 72 years later, Chief Joseph and the Nez Perce crossed the Missouri River at Cow Islandduring their epic journey toCanada.
8 40 C.F.R. § 1502.22(b)

PAGE 17
the monument. It is also important tonote that the mean core size of 3.0 miles2
is larger in the monument than the 1.7-m i l e2 mean core area size in the studya rea for the 1/2-mile transportation eff e c tz o n e .
The greater proportion of core area inthe monument clearly indicates themonument’s high value to wildlife rela-tive to habitat available in the surround-ing study area. Still, there is much thatshould be done to reduce fragmentationof the monument’s habitat caused by thetransportation network and thus increaseits value to wildlife.
Big Game Wildlife Species. As thedensity of transportation features incre a s-es, big game species suffer from gre a t e rhunting pre s s u re and reduced habitatsecurity caused by fragmentation and asso-ciated disturbance (Lyon 1983, Hurley1994, Canfield et al. 1999).
According to Lyon (1983), elk avoidroutes and do not fully use habitat adja-cent to routes. Lyon found that whenroute densities are as low as 1 mile/mile2,which represents approximately 35 per-cent of the monument’s occupied elkhabitat, elk habitat effectiveness isreduced by 25 percent. At 2 miles/mile2,which accounts for approximately 6 per-cent of the monument’s occupied elkhabitat, elk are displaced from up to 50percent of their habitat.
Route avoidance by wildlife is particu-larly evident in open landscapes with lit-tle surrounding vegetation (Perry andOverly 1976, Morgantini and Hudson1979, Rost and Bailey 1979) such as thatfound in the monument. In areas withlittle cover, habitat is completely lost ata route density of just 0.8 miles/mile2
(Lyon 1979), which accounts for 40 per-cent of the monument’s occupied elkhabitat.
The effect on elk from transportationfeatures in the broad, open sagebrushand grassland areas of the monumentwarrants particular attention. A study on
elk habitat effectiveness in north-centralWyoming found that few elk used areaswith route densities higher than 0.5miles/mile2 (Sawyer et al. 1997). Justover 50 percent of the monument’soccupied elk habitat has transportationfeature densities greater than 0.5miles/mile2.
As the volume of traffic on routesincreases, elk tend to occupy habitat fur-ther from routes (Johnson et al. 2000).This may be an issue at the monumentas visitation rises. Further, human distur-bance during the calving season reduceselk calving success rates (Phillips andAlldredge 2000). Ward (1976) discussesthe importance of retaining a buffer oftrees around a route to minimize the dis-placement of elk and suggests buffers of100 meters between a route and elkfeeding site.
Antelope, bighorn sheep, and deer arealso affected by human disturbancesacross a landscape. The BLM found thatantelope exhibited signs of the impactsof oil and gas projects with “nearly onemile of road per every square mile ofoccupied habitat” (Bureau of LandManagement 1999). Similarly, a studyconducted in North Dakota found thatmule deer avoided feeding and beddingin areas within 300 feet of well sites,resulting in a 28-percent reduction of
▼
One study showed that few
elk use areas with road densities
higher than 0.5 miles/mile2.
We found that morethan 50 percent of
the monument’soccupied elk habitat
has transportationfeature densities
greater than 0.5 miles/mile2.
▲
In their occupied habitat,pronghorn antelope are known
to be affected by a route density of 1 mile/mile2.

PAGE 18ECOLOGICAL EFFECTS OF A TRANSPORTATION NETWORK ON WILDLIFE
secure bedding areas (Jensen1991). The deer avoided routesand other human structures formore than seven years, indicat-ing long-term and chronic lossof habitat. Of the five big gamespecies, Canfield et al. (1999)found that bighorn sheepappear to be the most suscepti-ble to the detrimental effects ofhuman disturbance.
Greater Sage-grouse. TheProclamation states that themonument “contains essentialwinter range for sage grouse,” a
special status species whose breedingpopulations have declined by as much as47 percent in some areas (Connelly andBraun 1997). Greater Sage-grousedepend on sagebrush habitat (Patterson1952, Braun et al. 1977, Braun 1987,Connelly et al. 2000), particularly duringwinter when they feed almost exclusivelyon sagebrush leaves (Patterson 1952,Wallested 1975).
This bird is affected by human distur-bance for miles beyond the actual physi-cal features. A recent study in Wy o m i n g( Lyon 2000) compared the behavior offemales captured on leks (strutting ormating grounds) within two miles ofhuman developments to those capture don undisturbed leks more than two milesf rom any development and found thatthe hens captured on disturbed leks hadlower nest-initiation rates and movedlonger distances to nest sites than hensc a p t u red on undisturbed leks. Our analy-sis of the transportation effect zone indi-cates that 99 percent of the monument iswithin two miles of a linear transport a-tion feature, suggesting that lek distur-bance is potentially significant.
Black-tailed Prairie Dog. The black-tailed prairie dog is recognized as a key-stone species in the grassland environ-ment because of its unique and signifi-cant influences on the ecosystem (Van
Pelt 1999) and is a candidate for listingas threatened under the federalEndangered Species Act of 1974.Monument prairie dog towns serve asimportant actual and potential habitatfor numerous other special status species,including Ferruginous Hawks (Buteo
regalis), Mountain Plovers, BurrowingOwls (Athene cunicularia), and black-footed ferrets (Mustela nigripes).
This important animal has long beentreated as a varmint and subjected torecreational shooting. High-poweredrifles enable consistent accuracy at dis-tances of 400 yards or more, and just onehunter may kill a considerable number ofprairie dogs on any given day (Knowles1995, Van Pelt 1999). Although prairiedog habitat data were not available forthis study, the 1/4-mile (approximately440 yards) transportation effect zoneshould be compared in future analyses ofUpper Missouri River Breaks to the loca-tions of known prairie dog colonies andpotential habitat.
Water Resources and Riparian
Habitat. Routes running near or throughriparian strips can lead to fragmentationof riparian habitat and cause species toavoid riparian areas (Gaines et al. inpress). Routes and bridges near streamscan change the patterns of surface orsubsurface flow, which, in turn, can harmplants or wildlife that depend on naturalflow patterns, increase stream sedimenta-
The monument provides essentialwinter habitat for the GreaterSage-grouse. This special statusspecies is affected by routes andother structures for miles beyondthe actual physical features.
The black-tailed prairie dog is a candidate for listing as threatened under the federal
Endangered Species Act.

PAGE 19
tion and turbidity, and reduce fish pro-ductivity. Additional effects includealteration of hydrodynamics and sedi-mentation with resulting negativeimpacts on shorelines for miles upstreamand downstream, changes in wildlifemigration patterns that reduce distribu-tion and productivity, and changes inaquatic plant assemblages because ofaltered nutrient levels or chemicalsintroduced by routes (Trombulak andFrissell 2000). Water and riparian habi-tat are prominent features of the monu-ment, and managers must take care toavoid negative impacts from routes.
Wilderness Recreation
Opportunities. Outdoor recreationincreased substantially in the UnitedStates during the past 50 years(Tempel et al. 2003), and UpperMissouri River Breaks has the poten-tial to provide world-class non-motor-ized and wilderness recreation experi -ences. Remote wildlands provide arange of benefits to recreation andoutdoor enthusiasts, including “per-sonal development (spiritual growth,improved physical fitness, self-esteem,self-confidence and leadership abili-ties); social bonding (greater familycohesiveness and higher quality offamily life); therapeutic and healingbenefits (stress reduction helping toincrease worker productivity and reduceillness and absenteeism at work); andsocial benefits (increased nationalpride)” (Morton 2000).
Many forms of high-quality non-motorized recreational opportunities,including hiking, camping, rafting,canoeing, horseback riding, wildlifeviewing, hunting, and fishing, requirecore areas well away from motorizedaccess. Currently, just 14 percent of landin the monument is more than a milefrom a transportation feature, suggestinga need to consider route closures toimprove wilderness recreation opportu-nities.
Future Analytical
Priorities. This analysis ofhabitat fragmentation doesnot account for featuresunrelated to the transporta-tion network that fragmentthe landscape, nor did itaddress habitat connectivity,variations in scale, differ-ences in types of transporta-tion features, or seasonalvariations in species’ popula-
tions. Other human constructions andeven natural features such as topographycontribute to habitat fragmentation andshould be assessed along with the trans-portation network. It is important toconsider the connectivity of patcheswhen assessing fragmentation becausethe size and number of core areas maymatter little to a species if it cannotmigrate among them.
A multi-scale assessment of spatialpattern change is essential to understandchanges in ecosystem functions(Hessburg et al. 1999) and could beaccomplished by further varying thesampling window sizes across the land-scape to relate to specific wildlife
Many forms of high-qualityrecreation require core areas
away from motorized access. Just14 percent of land in the
monument is more than a milefrom a transportation feature,suggesting a need to consider
route closures to improvewilderness recreation
opportunities.

PAGE 20ECOLOGICAL EFFECTS OF A TRANSPORTATION NETWORK ON WILDLIFE
activities or ecosystem processes. In thiscontext, we encourage the BLM to makeuse of its own policies that emphasizethe importance of assessing issues atmultiple scales to ensure that decisionsare properly informed and tailored tospecific needs and circumstances (seeBLM Land Use Planning Handbook, H-1601-1 (II)(D)).
This study did not account for thed i ff e rent degrees of physical impact onthe ecosystem that a road may havec o m p a red to, say, a vehicle trail or forvariations in use of roads and trails.And this analysis did not address thee ffect of seasonal use on transport a t i o nf e a t u res, wildlife, or re c reation — forexample, whether a species’ tolerancefor and use of habitat changes duringd i ff e rent seasonal activities or whetherhuman use of some transportation cor-ridors varies by season.
A more comprehensive assessment offragmentation metrics should be re c a l c u-lated for each species (or suite of species)of interest, depending on how close to at r a n s p o rtation feature the species will usehabitat (transportation effect zone width)and how large an area of contiguous habi-tat is re q u i red for diff e rent life functions( c o re area size). Such an assessmente n s u res that the underlying enviro n m e n t a lanalysis constitutes the “hard look”re q u i red by the National Enviro n m e n t a lPolicy Act of 1969. As one example, if aspecies prefers to stay 300 feet from ro u t e sand/or clear-cuts, a 300-foot transport a t i o ne ffect zone should be used to evaluate thepotential core areas. With such species-specific metrics, the measurements cand e t e rmine the amount of remaining habi-tat and indicate priority areas to pro t e c tand re s t o re wildlife habitat affected byfragmentation.
There is much to learn about the monument’s resources, and it is incumbent upon the BLM to gatherneeded information for use in resource management and transportation planning.

5. ConclusionsThe viability of the Upper Missouri
River Breaks National Monument andits ecological, cultural, and scientificresources depends on the managementstrategy — and in particular, the trans-portation plan — adopted by the BLMas part of the Resource ManagementPlan for the monument. Transportationmanagement must address the full rangeof terrestrial and aquatic impacts acrossthe landscape (Trombulak and Frissell2000) and impacts on the quality of therecreational experience. Direct, indirect,and cumulative impacts must be dis-closed for individual routes and for thecollective system of routes — in boththe monument and its broader regionallandscape.
This report demonstrates the impor-tance of using sound science and spatialanalysis to guide the transportation plan.In too many cases, transportation deci-sions are guided by an ill-informed andinadequate understanding of the impactsto the broader landscape. The result isan inefficient and highly damagingaggregation of routes that requires con-tinued expenditures of taxpayer dollarsand destroys valuable public resources.To mitigate current and foreseeableimpacts to the monument and its eco-logical, scientific, and cultural resources,our results point to the need for signifi-cant route decommissioning and restora-tion of the landscape’s ecological healthand integrity.
We strongly recommend that the BLMmake aggressive use of the various man-agement tools at its disposal — in con-junction with sound science and the spa-tial analysis techniques described in thisreport — to design a protective trans-portation plan. Distilled to their essence,
we recommend that the agency incorpo-rate the following basic principles intothe transportation plan (for more infor-mation concerning legal provisions gov-erning the BLM that are cited in thisreport, see Schlenker-Goodrich 2003). • The transportation plan must
advance the protective purposes ofthe national monument and thusminimize routes to only those neces-sary for use of and access to themonument and that cause no unnec-essary or undue degradation of themonument.
• Any feature identified as a “road” inthe transportation plan must meetthe legal definition of a road as setforth in the legislative history of theFederal Land Planning andManagement Act of 1976.9 Thisautomatically precludes the inclusionof “wildcat” routes.
• Each road must be justified and man-aged through the proper level ofanalysis (centered on the objects ofscientific and historic interest andother key resources) required by theNational Environmental Policy Act,taking into account the spatial pat-tern of roads and not just mileage.
• Each road must be deemed in factnecessary for specified and defineduses of the monument.
• Procedures and standards must beincorporated to close and reclaimroads and routes that are not justi-fied, do not meet the definition of aroad, or for which specified uses havebeen completed.
To best realize these principles, we rec-ommend a transportation plan that con-sists of two interdependent components:(1) an initial, baseline transportationsystem and (2) an adaptive ecosystem
PAGE 21
▼
Incorporating spatialanalysis in
transportationmanagement
planning will helpthe BLM meet its
obligations to protectresources in Upper
Missouri RiverBreaks National
Monument and otherlands that the
agency manages.▲
9 The legal definition of road for public lands managed by the BLM is derived from the defi-nition of ‘roadless’ in the legislative history of FLPMA: “The word ‘roadless’ refers to theabsence of roads which have been improved and maintained by mechanical means toinsure relatively regular and continuous use. A way maintained solely by the passage ofvehicles does not constitute a road.” (H.R. Rep. No. 94-1163 at 17 (1976)).

PAGE 22
management framework designed to guideand inform the public and the BLM in allf u t u re transportation management deci-sions. Consistent with the monument’sp rotective purpose, a protective trans-p o rtation plan provides the best hope ofensuring the monument’s long-termhealth and integrity while providing thepublic with access to use and experiencethis splendid, irreplaceable landscape.
Establish and Assess a BaselineTransportation System
The first component of the transporta-tion plan consists of a baseline trans-portation network designed during theresource management planning process.The BLM should take the followingsequential steps to create this network: 1. Establish criteria10 to reflect the
monument’s protective purpose toidentify routes necessary for accessand use of the monument. These cri-teria will guide and inform eachstage of the planning process. In gen-eral, they should ensure that theBLM protects and restores theobjects of interest, key resources, andoverall landscape health and integri-ty by minimizing routes to only thosenecessary for use of and access to themonument and which cause nounnecessary or undue degradation ofthe monument.11 Specifically:
•Routes should be evaluated in lightof ground-truthed digital spatial dataobtained for the objects of interestand other key resources that indicateoverall land health and integrity orotherwise require heightened legalprotection.
•Designated routes should be geo-graphically distributed in a mannerthat reduces habitat fragmentationand contact with key resources, inparticular the objects of interestidentified in the proclamation.
•Individual routes must in fact be des-ignated, and the Resourc eManagement Plan must identify theallowable uses of the route (as exam-ples, general public, re c re a t i o n ,administrative) and the allowableintensity of that use. As per thep roclamation, motorized and mecha-nized travel must be confined to des-ignated roads; that is, routes meetingthe definition of “road” as per the leg-islative history of the Federal LandPolicy and Management Act of 1976.For administrative routes (includingrights of way for lessees and privateinholdings), use should be limited tothe stated administrative purpose, andthe route should be automaticallyclosed and scheduled for re c l a m a t i o nonce the administrative purpose ends.
•All unnecessary routes such asredundant routes and routes with lit-tle or no use, all “wildcat” routes,and all routes that adversely impactthe objects of interest articulated inthe proclamation or cause unduedegradation to the landscape, even ifthe route is otherwise necessary,must automatically be closed andscheduled for reclamation.
•All routes not incorporated into thefinal transportation system must beclosed and scheduled for decommis-sioning. This requires a detailedroute closure and restoration strate-gy, complete with timelines and astated commitment to devote staffand a portion of annual budgets torestoration of closed routes. To dis-courage resource degradation andprovide clear information to thepublic, routes scheduled for decom-missioning should not be placed onofficial monument maps.
2. Aggregate in digital format andground-truth existing data concern-ing the objects of interest and key
ECOLOGICAL EFFECTS OF A TRANSPORTATION NETWORK ON WILDLIFE
▼
A protectivetransportation planis the best hope ofensuring themonument’s long-term health whileproviding publicaccess to thissplendid,irreplaceablelandscape. ▲
10 43 C.F.R. § 1610.4-211 43 U.S.C. § 1732(b)

PAGE 23
resources.12 Where existing data forthe objects and resources are incom-plete or unavailable, the agencyshould aggressively inventory themonument to obtain such data, inparticular where the data are essen-tial to a reasoned choice amongalternatives and the overall costs arenot exorbitant.13
3. In accordance with the establishedcriteria (see 1. above), identify exist-ing individual routes necessary foruse and enjoyment of the monu-ment. The BLM should disclose whyeach route deemed “necessary” is, infact, necessary.
4. Use habitat fragmentation analysisto evaluate14 all routes deemed “nec-essary” to ascertain their direct, indi-rect, and cumulative impacts on keybiological, physical, recreational, andcultural resources. The evaluationshould specifically include calcula-tions of, at a minimum, transporta-tion feature density, transportationeffect zones, and the size of coreareas around each transportationroute.
5. Devise several alternative transporta-tion networks15 based on the evalua-tion of existing routes and subse-quently assess each alternative net-work through habitat fragmentationanalysis. Roads or other transporta-tion features that adversely impactthe objects of interest or keyresources or otherwise unnecessarilyor unduly degrade the landscapemust automatically be excluded fromeach of the alternatives.
6. Interpret the results of the habitatfragmentation analysis for each alter-native in light of relevant literatureconcerning the impacts of roads onwildlife.16 The BLM should makethe results publicly available, subjectthem to peer review, and summarizethem in the Environmental ImpactStatement accompanying theResource Management Plan.
7. Identify and propose a preferredtransportation system from the rangeof alternatives.17 The BLM’s choiceshould be driven by the agency’sparamount duty to advance the pro-tective purposes of the monument.
8. Establish an adaptive ecosystemmanagement framework to imple-ment the transportation system andto guide and inform the public andthe BLM with regard to all futuretransportation-related decisions.
Establish and Implement anAdaptive EcosystemManagement Framework
The second component of the trans-p o rtation plan consists of an adaptiveecosystem management framework thatp rovides the means to deal with thei n h e rent uncertainty in management ofpublic lands. Adaptive ecosystem man-agement directs the BLM to continuouslycollect and update information and applythat information to existing and futuredecisions. The goal is to ensure that envi-ronmental considerations are taken intoaccount, along with economic and tech-nical considerations, even when inform a-tion is incomplete or unavailable.1 8 I nUpper Missouri River Breaks National
12 43 C.F.R. § 1610.4-313 43 U.S.C. § 1711(a); 40 C.F.R. § 1502.22(a)14 43 C.F.R. § 1610.4-415 43 C.F.R. § 1610.4-516 43 C.F.R. § 1610.4-617 43 C.F.R. §§ 1610.4-7, 1610.4-818 42 U.S.C. § 4332(2)(B); 43 U.S.C. § 1711(a); 40 C.F.R. § 1502.22; 43 C.F.R. § 1610.4-9

PAGE 24
Monument, we recommend the followingelements for an adaptive ecosystem man-agement framework:• A g g ressive inventories of the vari-
ous natural and cultural re s o u rc e sof the monument and enforc e a b l emonitoring and evaluation re q u i re-ments to track use and manage-ment of the baseline transport a-tion system. All data collectionshould be standardized andscaleable to facilitate decision-making at multiple geographic andtime scales.
• Use of Resource Management Plan-level habitat fragmentation analysisas a living, baseline analysis.I n f o rmation collected thro u g hinventories, monitoring, and evalu-ation should be routinely incorpo-rated into the analysis to ensurethat it is up to date.Implementation-level decision-making should incorporate theR e s o u rce Management Plan-levelanalysis into decisions, refining theanalysis within an ecologicallydefined project area identified foreach decision.
• Criteria (within the Resourc eManagement Plan) for all implemen-
tation-level decisions, including cri-teria and timelines for route closure sand decommissioning and all ro u t emaintenance and construction work.These criteria should be consistentwith the initial planning criteriaused to identify the baseline trans-p o rtation system. Quantifiablet h resholds should be identified foreach landscape metric that, whenc rossed, trigger or prohibit specificaction on the part of the BLM, bothat the Resource Management Planand implementation levels. Thet h resholds can be used as a floor toallow development of more re f i n e dand, if appropriate, more stringentt h resholds at an ecologically definedimplementation-level scale.
• A prioritized route decommissioningschedule that is implementedt h rough a committed portion of them o n u m e n t ’s staff and annual budget.Prioritization of the schedule shouldbe based principally on the dire c t ,i n d i rect, and cumulative harm causedby the identified route. While factorssuch as budget and staff should bef a c t o red into the equation, they mustnot be used as excuses to evade thedecommissioning pro c e s s .
ECOLOGICAL EFFECTS OF A TRANSPORTATION NETWORK ON WILDLIFE

PAGE 25
Literature Cited
Braun, C.E. 1987. Current issues in sage grouse management. Proceedings of the
Western Association of Fish and Wildlife Agencies67:134-144.
Braun, C.E., T.Britt, and R.O. Wallestad. 1977. Guidelines for maintenance of sagegrouse habitats. Wildlife Society Bulletin5:99-106.
Bureau of Land Management. 1999. Draft EIS for the Pinedale Anticline Oil and Gas
Exploration and Development Project, Sublette County, WY. U.S. Department ofthe Interior, Bureau of Land Management, Pinedale Field Office, Pinedale, WY.
Canfield, J.E., L.J. Lyon, J.M. Hillis, and M.J. Thompson. 1999. Ungulates. Pages 6.1-6.25 in: G. Joslin and H. Youmans (cords.) Effects of Recreation on Rocky Mountain
Wildlife: A Review for Montana. Committee on Effects of Recreation on Wildlife,Montana Chapter of The Wildlife Society.Connelly, J.W., and C.E. Braun. 1997.Long-term changes in sage grouse Centrocercus urophasianuspopulations in west-ern North America. Wildlife Biology3: 229-234.
Connelly, J.W., M.A. Schroeder, A.R. Sands, and C.E. Braun. 2000. Guidelines tomanage sage grouse populations and their habitats. Wildlife Society Bulletin28(4):967-985.
Forman, R.T. 1999. Estimate of the area affected ecologically by the road system inthe United States. Conservation Biology14: 31-35.
Franklin, J.F., and R.T.T. Forman. 1987. Creating landscape patterns by forest cutting:ecological consequences and principles. Landscape Ecology1: 5-18.
Hansen, P., K. Boggs, R. Pfister, and J. Joy. 1990. Classification and Management of
Riparian and Wetland Sites in Central and Eastern Montana. University of Montana,School of Forestry; Montana Forest and Conservation Experiment Station; andMontana Riparian Association, Missoula, MT.
Hessburg, P.F., B.G. Smith, and R.B. Salter. 1999. Detecting change in forest spatialpatterns from reference conditions. Ecological Applications9(4): 1232-1252.
Hurley, M.A. 1994. Summer-fall Ecology of the Blackfoot-Clearwater Elk Herd of Western
Montana. Thesis, University of Idaho, Moscow, ID.
Gaines, W.L., P.H. Singleton, and R.C. Ross. In Press. Assessing the Cumulative Effects
of Linear Recreation Routes on Wildlife Habitats on the Okanogan and Wenatchee
National Forests. General Technical Report PNW-GTR-XXX. U.S. Department ofAgriculture, Forest Service.
Jensen, W.F. 1991. Internal Memo, North Dakota Fish and Game Department.
Johnson, B.K., J.W. Kern, and M.J. Wisdom. 2000. Resource selection and spatial sep-aration of mule deer and elk during spring. Journal of Wildlife Management64(3):685-697.
Knowles, C.J. 1995. A Summary of Black-tailed Prairie Dog Abundance and Distribution
on the Central and Northern Great Plains. Prepared for Defenders of Wildlife,Missoula, MT.

PAGE 26ECOLOGICAL EFFECTS OF A TRANSPORTATION NETWORK ON WILDLIFE
Lehmkuhl, J. F., and L. F. Ruggiero. 1991. Forest fragmentation in the PacificNorthwest and its potential effects on wildlife. Pages 35-46 in: Ruggiero, L.F.,K.B. Aubry, A.B. Carey, and M.H. Huff (tech. coords.) Wildlife and Vegetation of
Unmanaged Douglas-fir Forests. General Technical Report 285. USDA ForestService, Pacific Northwest Research Station, Portland, OR.
Lyon, A.G. 2000. The Potential Effects of Natural Gas Development on Sage Grouse
(Centrocercus urophasianus) near Pinedale, Wyoming. Thesis. University ofWyoming, Laramie, WY.
Lyon, L.J. 1983. Road density models describing habitat effectiveness for elk. Journal
of Forestry 81: 592-596.
Lyon, L.J. 1979. Habitat effectiveness for elk as influenced by roads and cover. Journal
of Forestry 77: 658-660.
McGarigal, K., and B.J. Marks. 1994. FRAGSTATS: Spatial Pattern Analysis Programs
for Quantifying Landscape Structure. Forest Science Department, Oregon StateUniversity, Corvallis, OR.
Morgantini, L.E., and R.J. Hudson. 1979. Human disturbance and habitat selection inelk. Pages 132-139 in: Boyce, M.S., and L.D. Hayden-Wing (eds.) NorthAmerican Elk: Ecology, Behavior, and Management. University of Wyoming,Laramie, WY.
Morton, P. 2000. Wildland economics: theory and practice. Pages 238-250 in:McCool, S.F., D.N. Cole, W.T. Borrie, and J. O’Loughlin (comps.) Proceedings:
Wilderness Science in a Time of Change Conference. Vol. 2. May 23-27, 1999. Proc.RMRS-P-15-Vol-2. U.S. Department of Agriculture, Forest Service, RockyMountain Research Station, Ogden, UT.
Patterson, R.L. 1952. The Sage Grouse in Wyoming. Sage Books, Denver, CO.
Perry, C., and R. Overly. 1976. Impact of roads on big game distribution in portions ofthe Blue Mountains of Washington. Pages 62-68 in: Hieb, S.R. (ed.) Proceedings
of the Elk-Logging-Roads Symposium. December 16-17, 1976, Moscow, Idaho.Forestry, Wildlife and Range Experiment Station, University of Idaho, Moscow,ID.
Phillips, G.E., and A.W. Alldredge. 2000. Reproductive success of elk following dis-turbance by humans during calving season. Journal of Wildlife Management64(2):512-530.
Reed, R.A., J. Johnson-Barnard, and W.L. Baker. 1996. Contributions of roads to for-est fragmentation in the Rocky Mountains. Conservation Biology10: 1098-1106.
Rost, G.R., and J.A. Bailey. 1979. Distribution of mule deer and elk in relation toroads. Journal of Wildlife Management43: 634-641
Sawyer, H., F. Lindzey, and B. Jellison. 1997. Applying GIS technology to test an elkhabitat effectiveness model in north-central Wyoming. Pages 176-183 in: de Vos,J. (ed.) Proceedings of the 1997 Deer/Elk Workshop, Rio Rico, Arizona. ArizonaGame and Fish Department, Phoenix, AZ.
Schlenker-Goodrich, E. 2003. A Conservationist’s Guide to BLM Planning and Decision-
making: Using FLMPA and NEPA to Protect Public Lands. The Wilderness Society,Washington, DC.

PAGE 27
Tempel, D., J. Doherty, V. Wright, and B. Walker. 2003. Linking Wilderness Research
and Management, Volume 5—Backcountry Recreation Impacts to Wildlife: An
Annotated Reading List. Aldo Leopold Research Institute, Missoula, MT.
Trombulak, S.C., and C.A. Frissell. 2000. Review of ecological effects of roads on ter-restrial and aquatic communities. Conservation Biology14: 18-30.
Turner, M.G., R.H. Gardner, R.V. O’Neill, and S.M. Pearson. 1994. Multi-scale orga-nization of landscape heterogeneity. Pages 73-79 in: Jensen, M.E., and P.S.Bourgeron (eds.) Volume II: Eastside Forest Ecosystem Health Assessment.
Ecosystem Management: Principles and Applications. General Technical Report 318.USDA Forest Service, Pacific Northwest Research Station, Portland, OR.
Urban, D.L., R.V. O’Neill, and H.H. Shugart. 1987. Landscape ecology: A hierarchi-cal perspective can help scientists understand spatial patterns. Bioscience37: 119-127.
Van Pelt, W.E. 1999. The Black-tailed Prairie Dog Conservation Assessment and Strategy:
Fifth Draft. Nongame and Endangered Wildlife Program, Arizona Game and FishDepartment, Phoenix, AZ.
Wallestad, R.O. 1975. Life History and Habitat Requirements of Sage Grouse inCentral Montana. Technical Bulletin. Montana Fish and Game Department,Helena, MT.
Ward, A.L. 1976. Elk Behavior in relation to timber harvest operations and traffic onthe Medicine Bow Range in south-central Wyoming. Pages 32-43 in: Hieb, S.R.(ed.) Proceedings of the Elk-Logging-Roads Symposium. December 16-17, 1976,Moscow, Idaho. Forestry, Wildlife and Range Experiment Station, University ofIdaho, Moscow, ID.
Wiens, J.A., and B.T. Milne. 1989. Scaling of ‘landscapes’ in landscape ecology, or,landscape ecology from a beetle’s perspective. Landscape Ecology3: 87-96.