Ecological implications of projected climate change … · Ecological implications of projected...
16
AGRICULTURAL AND FOREST METEOROLOGY ELSEVIER Agricultural and Forest Meteorology 72 (1994) 31-46 Ecological implications of projected climate change scenarios in forest ecosystems of central North America Elizabeth A. Jones*, David D. Reed, Paul V. Desanker School of Forestry and Wood Products, Michigan Technological University, Houghton, MI 49931, USA Received 26 April 1993; revision accepted 24 February 1994 Abstract Climate change scenarios in central North America were projected for selected weather stations using a stochastic daily weather simulation model. The projections were conditioned on changes in seasonal temperature and precipitation as predicted by several global climate models. The impacts of these projected changes on temperate forest ecosystems were evaluated through projected changes in such variables as average annual temperature, average growing season temperature, and the ratio of potential evaporation to precipitation during July and August. Even the mildest climate change scenario examined indicated that ecologically signifi- cant changes could occur in the composition and productivity of these forests. The possibility also exists that climatically induced regional decline episodes for a number of important commercial species could occur in the northern temperate forests of central North America. 1. Introduction Temperature is projected to increase and precipitation is projected to decrease in central North America as a result of increasing greenhouse gases in the atmosphere (Manabe and Wetherald, 1986; Schneider, 1989; Intergovernmental Panel on Climate Change, 1990). When scaled to a global warming of 1.8°C, climate models predict annual temperature increases of 2-4°C, 5-10% decreases in summer precipitation, and 0-15% increases in winter precipitation in central North America by the year 2030 (Karl et al., 1991). Changes of this magnitude in climate can be expected to lead to changes in soil moisture availability during the growing season, changes in potential evapotranspiration, and changes in the length of the growing season. * Corresponding author. 0168-1923/94/$07.00 © 1994 - Elsevier Science B.V. All rights reserved SSDI 0168-1923(94)05052-8
Transcript of Ecological implications of projected climate change … · Ecological implications of projected...

AGRICULTURAL AND
FOREST M ETEOROLOGY
ELSEVIER Agricultural and Forest Meteorology 72 (1994) 31-46
Ecological implications of projected climate change scenarios in forest ecosystems of central North America
El izabe th A. Jones*, D a v i d D. Reed, Pau l V. D e s a n k e r School of Forestry and Wood Products, Michigan Technological University, Houghton, MI 49931, USA
Received 26 April 1993; revision accepted 24 February 1994
Abstract
Climate change scenarios in central North America were projected for selected weather stations using a stochastic daily weather simulation model. The projections were conditioned on changes in seasonal temperature and precipitation as predicted by several global climate models. The impacts of these projected changes on temperate forest ecosystems were evaluated through projected changes in such variables as average annual temperature, average growing season temperature, and the ratio of potential evaporation to precipitation during July and August. Even the mildest climate change scenario examined indicated that ecologically signifi- cant changes could occur in the composition and productivity of these forests. The possibility also exists that climatically induced regional decline episodes for a number of important commercial species could occur in the northern temperate forests of central North America.
1. Introduction
Temperature is projected to increase and precipitation is projected to decrease in central Nor th America as a result of increasing greenhouse gases in the atmosphere (Manabe and Wetherald, 1986; Schneider, 1989; Intergovernmental Panel on Climate Change, 1990). When scaled to a global warming of 1.8°C, climate models predict annual temperature increases of 2-4°C, 5 -10% decreases in summer precipitation, and 0 - 1 5 % increases in winter precipitation in central Nor th America by the year 2030 (Karl et al., 1991). Changes of this magnitude in climate can be expected to lead to changes in soil moisture availability during the growing season, changes in potential evapotranspiration, and changes in the length of the growing season.
* Corresponding author.
0168-1923/94/$07.00 © 1994 - Elsevier Science B.V. All rights reserved SSDI 0168-1923(94)05052-8

32 E.A. Jones et al. / Agricultural and Forest Meteorology 72 (1994) 31-46
Most models predict the warming will be greater at higher latitudes, but there is less agreement on changes in the spatial and seasonal patterns of temperature and precipitation for areas the size of the United States. Given the rapid rate of projected changes, plant adaptations in physiology and range will have to be made within one or two lifetimes of most tree species (Burns and Honkala, 1990a,b). Numerous authors have projected changes in forest productivity, successional patterns, and shifts in the geographical ranges of species in response to these projected changes in climate (Solomon and West, 1987; Botkin et al., 1989; Davis, 1989; Gates, 1990; Overpeck et al., 1991; Solomon and Bartlein, 1992). Overall, increased atmospheric CO2 is expected to lead to a widespread loss of forests (Gates, 1990).
The effects of climate change are expected to be pronounced in the southern boreal and northern temperate forests of eastern North America. These forest communities contain mixtures of long-lived species which must be able to grow and reproduce in order to maintain ecosystem integrity, stability, and diversity. Consequences of the disruption of ecosystem processes could be particularly severe in this region.
Direct effects of drought and high temperature have been implicated in regional episodes of forest decline for northern red oak (Quercus rubra), white oak (Quercus alba), black oak (Quercus velutina), sugar maple (Acer saccharum), paper birch (Betula papyrifera), white ash (Fraxinus americana), American beech (Fagus grandifolia), quaking aspen (Populus tremuloides), and a number of other species (Millers et al., 1989). In addition, effects of drought and high temperature on pest and pathogen activity have also been implicated in forest decline (Hepting, 1971). Gates (1990), for instance, noted the recent decline of paper birch in northern Michigan as related to dry conditions in 1987-1989, a situation also documented by Jones et al. (1992) on permanent plots.
A portion of the northern temperate forest region encompasses a large part of the state of Michigan. In Michigan there is a steeper north-south gradient than one would expect for a change of 2 ° latitude; the presence of the Great Lakes plays a large role in the climate of this region. Within the state of Michigan there are two tension zones. A tension zone is defined as a boundary between major ecological regions which encompasses the geographic range limits of a large number of species. One tension zone runs north of Lake Superior and is the boundary between the northern temperate and the boreal ecosystems. A second tension zone is located in the central lower peninsula of Michigan (approximately 44°N latitude) and is the boundary between the northern temperate and central temperate forests of eastern North America. The northern hardwoods maple-birch-beech (Acer-Betula-Fagus) forest type is found on the uplands north of this zone and the oak-hickory (Quercus- Carya) forest type is commonly found to the south of this boundary. Some tree species have geographical range limits within the northern temperate forest region while others occur in communities on either side of the tension zones. This region marks the southern range limits of a number of northern species (balsam fir (Abies balsamea), paper birch, white spruce (Picea glauca), black spruce (Picea mariana), jack pine (Pinus banksiana), and red pine (Pinus resinosa)) (Merz, 1978) and the northern range limits of many central temperate species (silver maple (Acer saccharinum), shagbark hickory (Carva ovata), hackberry (Celtis occidentalis),

E.A. Jones et al. / Agricultural and Forest Meteorology 72 (1994) 31-46 33
black walnut (Juglans nigra), yellow poplar (Liriodendron tulipifera), American sycamore (Platanus occidentalis), eastern cottonwood (Populus deltoides), and black oak (Quercus velutina)) (Merz, 1978).
An initial attempt to evaluate climate changes utilized a stochastic weather simula- tion model calibrated to a specific weather station which examined projected changes in ecologically significant measures of climate at one location (Reed and Desanker, 1992). These changes, and resulting shifts in species distribution, were placed in a broader context by utilizing a regional landscape ecosystem classification system developed by Albert et al. (1986). This study extends their investigation to weather stations located from the southern boreal northern temperate tension zone near the US-Canadian border to the north-central temperate tension zone in southern Michigan. Of particular interest is the possible northward migration of the northern temperate-central temperate tension zone resulting in a shift of the range of many tree species as well as changes in successional patterns within ecosystems.
2. Methods
Long-term records were obtained from selected National Oceanic and Atmospheric Administration (NOAA) weather stations across the range of the northern temperate forest region through CD ROM media in the Climatedata database (EarthInfo., 1990). These stations were selected to represent the region between the southern boreal-northern temperate and north-central temperate tension zones. From these records, 30 year means and standard deviations for precipitation, amount, minimum temperature, and maximum temperature were used to parameterize the stochastic daily weather simulation model. The stochastic model was conditioned on projected changes in mean seasonal temperature and precipitation obtained from different climate change scenarios. An integrated ecosystem classification developed by Albert et al. (1986) was then used as a framework to interpret ecosystem responses to these projected climate changes.
2.1. Stochastic daily weather simulation model
Desanker and Reed (1991) formulated a stochastic daily weather simulation model to examine the effect of changing climatic conditions with respect to their impact on ecologically significant weather variables in local areas. Their model generates daily values of precipitation, solar radiation, daily minimum and daily maximum tempera- ture. For this study the model was parameterized using 30 years of historical data (with the exception of solar radiation which was not available in these records) from each of the five Michigan NOAA weather stations (see Fig. 1).
1. Site 1, at the northern edge of the northern temperate forest near Lake Superior (Houghton 47°07rN 88°27rW).
2. Site 2, which is less affected by the Great Lakes (Crystal Falls 46°06'N 88°20'W). 3. Site 3 (Pellston 45°27'N 84°45~W) 4. Site 4 (Cadillac 44°45'N 85°34'W)

34 E.A. Jones et al. / Agricultural and Forest Meteorology 72 (1994) 31-46
J
0 4 ] os
Fig. 1. The five Michigan NOAA weather stations selected across the range of the northern temperate forest region.
5. Site 5, near the present-day north-central temperate forest tension zone (Hart 43°42/N 86°21 tW).
Precipitation is considered the driving variable and minimum and maximum temperatures for a given day are conditioned on the wet-dry status for that day. The daily wet-dry status is modeled using a first-order Markov chain and the amount of precipitation is simulated from a truncated exponential distribution fitted to 30 year records from each station. Minimum and maximum temperature, again parameterized for each station, are generated from a multivariate model with the means and standard deviations conditioned on the wet-dry status determined by the Markov chain.
The year, beginning in January, is divided into 26 14-day periods, each of which has its own probabilities of precipitation events, and mean and standard deviations of precipitation amounts, minimum and maximum temperature which are obtained
E.A. Jones et al. / Agricultural and Forest Meteorology 72 (1994) 31-46 35
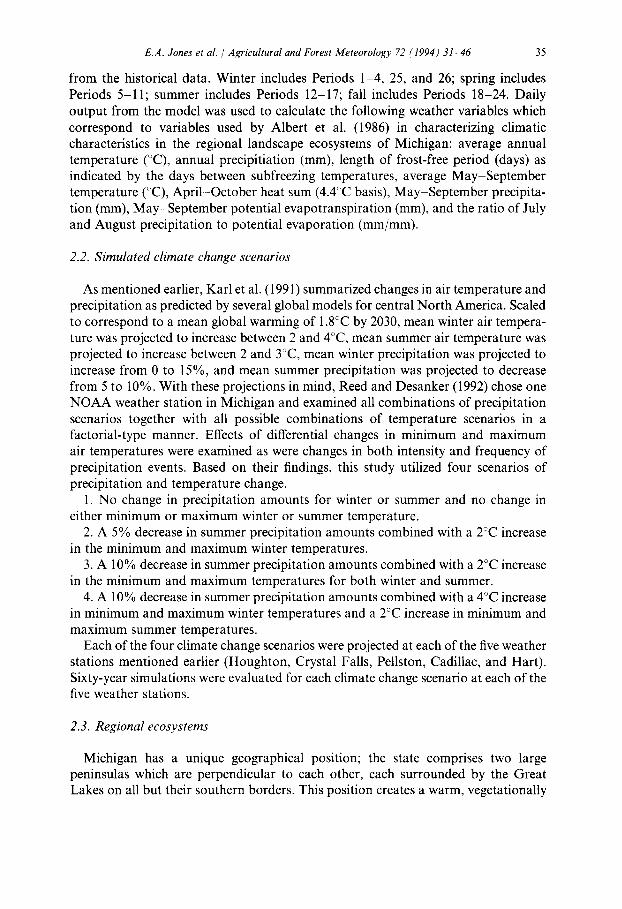
from the historical data. Winter includes Periods 1-4, 25, and 26; spring includes Periods 5-11; summer includes Periods 12-17; fall includes Periods 18-24. Daily output from the model was used to calculate the following weather variables which correspond to variables used by Albert et al. (1986) in characterizing climatic characteristics in the regional landscape ecosystems of Michigan: average annual temperature (°C), annual precipitiation (mm), length of frost-free period (days) as indicated by the days between subfreezing temperatures, average May-September temperature (°C), April-October heat sum (4.4°C basis), May-September precipita- tion (ram), May-September potential evapotranspiration (ram), and the ratio of July and August precipitation to potential evaporation (mm/mm).
2.2. Simulated climate change scenarios
As mentioned earlier, Karl et al. (1991) summarized changes in air temperature and precipitation as predicted by several global models for central North America. Scaled to correspond to a mean global warming of 1.8°C by 2030, mean winter air tempera- ture was projected to increase between 2 and 4°C, mean summer air temperature was projected to increase between 2 and 3°C, mean winter precipitation was projected to increase from 0 to 15%, and mean summer precipitation was projected to decrease from 5 to 10%. With these projections in mind, Reed and Desanker (1992) chose one NOAA weather station in Michigan and examined all combinations of precipitation scenarios together with all possible combinations of temperature scenarios in a factorial-type manner. Effects of differential changes in minimum and maximum air temperatures were examined as were changes in both intensity and frequency of precipitation events. Based on their findings, this study utilized four scenarios of precipitation and temperature change.
1. No change in precipitation amounts for winter or summer and no change in either minimum or maximum winter or summer temperature.
2. A 5% decrease in summer precipitation amounts combined with a 2°C increase in the minimum and maximum winter temperatures.
3. A 10% decrease in summer precipitation amounts combined with a 2°C increase in the minimum and maximum temperatures for both winter and summer.
4. A 10% decrease in summer precipitation amounts combined with a 4°C increase in minimum and maximum winter temperatures and a 2°C increase in minimum and maximum summer temperatures.
Each of the four climate change scenarios were projected at each of the five weather stations mentioned earlier (Houghton, Crystal Falls, Pellston, Cadillac, and Hart). Sixty-year simulations were evaluated for each climate change scenario at each of the five weather stations.
2.3. Regional ecosystems
Michigan has a unique geographical position; the state comprises two large peninsulas which are perpendicular to each other, each surrounded by the Great Lakes on all but their southern borders. This position creates a warm, vegetationally

36 E.A. Jones et al. / Agricultural and Forest Meteorology 72 (1994) 31-46
diverse climate in southern Lower Michigan and a cooler climate in Upper Michigan. The Great Lakes play a major role in the climate of the state by warming the air passing over them in the winter for lake-effect precipitation in the form of snow as well as cooling the air as it passes over the waters in the summer. The integrated regional ecosystem classification system developed by Albert et al. (1986) provided climatic norms for four regions in the state of Michigan (Fig. 2). These regions are defined by both climate and physiography although major emphasis is placed on climatic differences. The boundary between Regions I and II correspond to the north-central temperate tension zone as well as the boundary between frigid and mesic soil types (approximately 8°C average annual temperature). Regions II, III, and IV all fall in the northern temperate forest zone.
Region I consists of the southern half of Lower Michigan and is warmer than the other three regions both in the summer and the winter. It has a longer and less
i Washtenaw 2 Jackson 3 Allegan 4 Ionia 5 Huron 6 Saginaw 7 Arenac 8 Highplains 9 Newaygo
I0 Manistee 11Leelanau 12 Presque lie 13 Mackinac 14 Luce 15 Dickinson 16 Michigamme 17 Iron 18 Bergland 19 Ontonogon 20 Keweenaw /
Fig. 2. A map of the integrated regional ecosystem classification system for the state of Michigan (from Albert et al., 1986).

E.A. Jones et al. / Agricultural and Forest Meteorology 72 (1994) 31-46 37
variable growing season, receiving more solar radiation during the growing season than the other regions. Potential evapotranspiration and precipitation are higher, the maximum difference between them is greater, and the ratio of precipitation to poten- tial evapotranspiration is lower throughout the growing season. Winter precipitation is higher where more falls as rain compared with the more northern regions.
The second region's climate is affected by larger and higher physiographic features and the region's exposure to the Great Lakes. Differences exist between the shore line and the inland districts, but even the inland portion is cooler throughout the year in comparison with the southern portion of the state. There is a chance of frost through- out the growing season. Although there is less growing season precipitation, the cooler temperatures create a higher ratio of precipitation to potential evapotranspira- tion and more of the winter precipitation is in the form of snow. The influence of the Great Lakes tends to moderate temperature extremes, especially on the western edge of the region. Because of the lakes, the growing season is longer, the risk of late spring freeze is reduced, average maximum temperature is reduced during the growing season, and average minimum temperature is increased in the winter.
Region III has a cool lacustrine climate and makes up the eastern portion of the upper peninsula. The more northern latitude provides less solar radiation than the two more southern regions, but has the same as that of Region IV. The influence of the lakes creates long, cool growing seasons where warming in the spring and cooling in the fall is later and summer maximum temperatures are reduced. Winters are cold, but not as cold as those districts of the same latitude but which are further inland. There is considerable lake-effect snowfall with more in the northeastern region than other areas. This region does not have the sharp climatic differences between districts which is found in Region II.
The most continental region is Region IV which has high elevations, northern latitude and no exposure to the lakes to the south and southwest. The growing season receives a high proportion of air flows from the southwest which are not influenced by the lakes. This allows a relatively warm growing season with greater variations in temperature. There is a greater chance of frost during the growing season as well as higher heat sums prior to the last spring freeze. The lakes play a larger role in the winter climate when air flows are from the north. Region IV is cold with inland areas even colder and more variable in temperature. There is heavy lake-effect snowfall.
In this study, climatic norms from the regional ecosystem identified by Albert et al. (1986) (see Table 2) are coupled with projected conditions under each climate change scenario at each of the five selected weather stations. The objective was to then identify areas where climate scenarios for a station resulted in conditions similar to those now found further south and examine the possible changes in forest com- munities which may result in the northward migration of the tension zone.
3. Results
The daily weather simulation model was used to project the future weather

38 E.A. Jones et al. / Agricultural and Forest Meteorology 72 (1994) 31-46
Table 1 Some climatic characteristics of the projected climate change scenarios at each NOAA station
Station Climate change Average annual Average May-September July-August ratio scenario tempera ture temperature precipitation to
(°C) (°C) potential evaporation (mm:mm)
Houghton 1 4.7 14.9 0.71 2 5.7 15.4 0.70 3 6.7 16.9 0.62 4 7.7 17.3 0.62
Crystal Falls l 3.9 14.7 0.85 2 4.9 15.1 0.86 3 5.8 16.7 0.77 4 6.8 17.1 0.77
Pellston 1 5.6 15.6 0.69 2 6.6 16.0 0.64 3 7.5 17.5 0.55 4 8.5 18.0 0.55
Cadillac 1 5.9 15.8 0.69 2 6.9 16.3 0.69 3 8.0 17.9 0.59 4 9.0 18.3 0.60
Hart 1 8.3 17.8 0.54 2 9.3 18.3 0.51 3 10.3 19.8 0.49 4 11.3 20.3 0.49
conditions which would be expected at each of the N O A A weather stations for each climate change scenario (Table 1). The results were evaluated for each site through a comparison with the climatic conditions described by Albert et al. (1986) for their regional ecosystems of Michigan (Table 2).
3.1. S i te 1
The Houghton N O A A weather station is located in the Keweenaw district of the northwestern upper peninsula in Region IV (Fig. 1; Albert et al., 1986). Climate change scenario 1 (no change) resulted in an annual temperature of 4.7°C (Table 1) for Houghton which corresponded to those found in the Keweenaw and Ontonogon districts (Table 2). Climate change scenario 2 (2°C winter and no summer warming) resulted in an annual temperature of 5.7°C which compared with the Dickinson district. Projected May to September temperatures for Houghton, under Climate change scenarios 1 and 2, were similar to those found in the Keweenaw, Iron, Berg- land, and Michigamme districts as described by Albert et al. (1986). All of these districts are in Region IV, but are located to the south of the Keweenaw district. Scenario 3 (2°C winter and 2°C summer warming) resulted in an annual temperature
E.A. Jones et al. / Agricultural and Forest Meteorology 72 (1994) 31-46
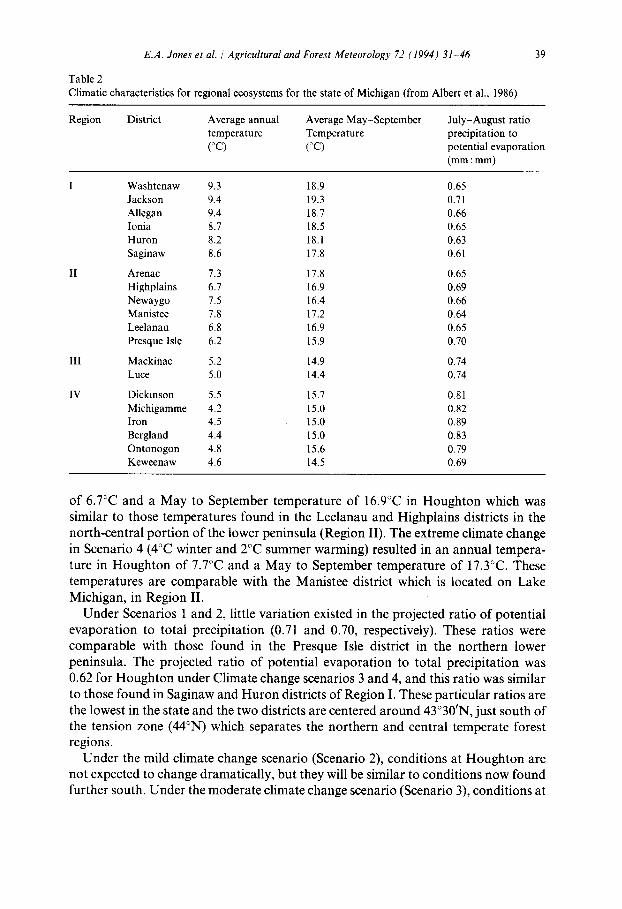
Table 2 Climatic characteristics for regional ecosystems for the state of Michigan (from Albert et al., 1986)
39
Region District Average annual Average May-September July-August ratio temperature Temperature precipitation to (°C) (°C) potential evaporation
(mm:mm)
I Washtenaw 9.3 18.9 0.65 Jackson 9.4 19.3 0.71 Allegan 9.4 18.7 0.66 Ionia 8.7 18.5 0.65 Huron 8.2 18.1 0.63 Saginaw 8.6 17.8 0.61
II Arenac 7.3 17.8 0.65 Highplains 6.7 16.9 0.69 Newaygo 7.5 16.4 0.66 Manistee 7.8 17.2 0.64 Leelanau 6.8 16.9 0.65 Presque Isle 6.2 15.9 0.70
III Mackinac 5.2 14.9 0.74 Luce 5.0 14.4 0.74
IV Dickinson 5.5 15.7 0.81 Michigamme 4.2 15.0 0.82 Iron 4.5 15.0 0.89 Bergland 4.4 15.0 0.83 Ontonogon 4.8 15.6 0.79 Keweenaw 4.6 14.5 0.69
of 6.7°C and a May to September temperature of 16.9°C in Houghton which was similar to those temperatures found in the Leelanau and Highplains districts in the north-central portion of the lower peninsula (Region II). The extreme climate change in Scenario 4 (4°C winter and 2°C summer warming) resulted in an annual tempera- ture in Houghton of 7.7°C and a May to September temperature of 17.3°C. These temperatures are comparable with the Manistee district which is located on Lake Michigan, in Region II.
Under Scenarios 1 and 2, little variation existed in the projected ratio of potential evaporation to total precipitation (0.71 and 0.70, respectively). These ratios were comparable with those found in the Presque Isle district in the northern lower peninsula. The projected ratio of potential evaporation to total precipitation was 0.62 for Houghton under Climate change scenarios 3 and 4, and this ratio was similar to those found in Saginaw and Huron districts of Region I. These particular ratios are the lowest in the state and the two districts are centered around 43°30'N, just south of the tension zone (44°N) which separates the northern and central temperate forest regions.
Under the mild climate change scenario (Scenario 2), conditions at Houghton are not expected to change dramatically, but they will be similar to conditions now found further south. Under the moderate climate change scenario (Scenario 3), conditions at

40 E.A. Jones et al. / Agricultural and Forest Meteorology 72 (1994) 31-46
Houghton are projected to be similar to those found today in the lower peninsula along the eastern shore of Lower Michigan (Region II). The same is true for the extreme climate change scenario (Scenario 4), though moisture conditions under this scenario are expected to be similar to those found today near or below the tension zone.
3.2. Site 2
The Crystal Falls NOAA weather station is found in the Iron district in the west- central portion of the upper peninsula of Region IV (Fig. 1; Albert et al., 1986). May to September temperatures projected for Crystal Falls under Scenarios 1 and 2 were similar (Table 1) and were comparable with temperatures found in the Iron, Bergland, and Michigamme districts which are all in the west-central upper peninsula (Region IV). For Crystal Falls, Scenario 3 resulted in a projected May to September tempera- ture of 16.7°C which was comparable with the Newaygo district and Scenario 4 projected a May to September temperature of 17.1°C which would compare with the Leelanau and Highplains districts; each of these districts are found in the north-central portion of the lower peninsula slightly north of the tension zone in Region II. Annual temperature projections varied with the different scenarios: Scenario 1 projected a temperature of 3.9°C for Crystal Falls which was comparable with the Michigamme district; Scenario 2 projected a temperature of 4.9°C for Crystal Falls which was comparable with the Ontonogan and Luce districts; Scenario 3 projected a temperature of 5.8°C for Crystal Falls which was comparable with the Dickinson and Presque Isle districts; Scenario 4 projected a temperature of 6.8°C for Crystal Fails which was again comparable with districts just north of the tension zone (Leelanau and Highplains).
The projected ratio of potential evaporation to precipitation for Crystal Falls under Scenarios 1 and 2 was 0.85 and 0.86, respectively. These ratios were similar to those found in Iron and Bergland districts. Scenarios 3 and 4 projected a ratio for Crystal Falls of 0.77 which was comparable with that found in the Ontonogan, Mackinac, and Luce districts. Each of these districts are located along the shoreline of either Lake Superior or Lake Michigan.
It appears that there would be little change in conditions at Crystal Falls under the mildest climate change scenario. Projected climatic conditions are similar to the present climate in districts in the west-central upper peninsula; therefore widespread elimination of species and introduction of more southern species would not be expected near Crystal Falls. The moderate and extreme climate scenarios are pro- jected to be similar to those found today in the lower peninsula, just as was the case of Houghton. This change, if realized, would result in conditions in northern Michigan being more similar to those near the tension zone to the south.
3.3. Site 3
Pellston is in the Presque Isle district which encompasses the northern portion of lower Michigan in Region II (Fig. 1; Albert et al., 1986). Scenario 1 projected an

E.A. Jones et al. / Agricultural and Forest Meteorology 72 (1994) 31-46 41
annual temperature of 5.6°C and a May to September temperature of 15.6°C for Pellston. These temperatures correspond to those detailed by Albert et al. (1986) for the Presque Isle district. They are also similar to temperatures in the Dickinson district of Region IV. Scenario 2 resulted in an annual temperature in Pellston of 6.6°C which was similar to temperatures in two districts directly south (Leelanau and Highplains). May to September temperatures under Scenario 2 were projected to be 16.0°C for Pellston as compared with 15.9°C which was defined for the Presque Isle district by Albert et al. (1986). Scenario 3 projected an annual temperature of 7.5°C in Pellston which was similar to the Arenac and Newaygo districts and a May to September temperature of 17.5°C in Pellston which was similar to those in the Manistee district. These districts are just north of the tension zone in Region II. A May to September temperature was projected to be 18.0°C under Scenario 4. This temperature was similar to the Arenac district, and Saginaw and Huron, two districts just south of the tension zone in Region I.
The ratio of potential evaporation to precipitation projected for Pellston was 0.69 under Scenario 1, 0.64 under Scenario 2, and 0.55 under Scenarios 3 and 4. Under the first two scenarios, these ratios were respectively similar to the Presque Isle district and two districts south of the tension zone (Allegan and Washtenaw). The lowest ratio in the state was 0.61 (Saginaw district) and this was higher than that projected under moderate to extreme warming.
Both the mild and the moderate climate change scenarios projected climatic con- ditions similar to districts in or around the Presque Isle district. If these conditions were realized, little change would be expected to occur in forest stands. However, the most severe climate change scenario projected climatic conditions which are similar to those found today south of the tension zone. If more severe climate changes resulted, regional decline and shifts in succesional patterns of some forest species may occur.
3.4. Site 4
The Cadillac NOAA weather station is located in the Highplains district in the central inland portion of Michigan of Region II (Fig. 1; Albert et al., 1986). Moisture and temperature values projected under Scenario 1 resulted in a ratio of potential evaporation to precipitation for Cadillac (0.69) which was the same as that defined for the Highplains district (Albert et al., 1986), but a 6.0°C annual temperature and a 15.8°C May to September temperature which were similar to the Presque Isle district, north of Highplains on Lake Michigan. These projected temperatures for Cadillac were also similar to the Dickinson district in the upper peninsula. Cadillac had an annual temperature of 6.9°C under Scenario 2 which was similar to that found in the Leelanau district. A May to September temperature of 16.3°C for Cadillac compared with the Newaygo district. Scenario 3 projected a May to September temperature of 17.9°C for Cadillac which was comparable with the Arenac and Saginaw districts near or just south of the tension zone, and an annual temperature of 7.5°C for Cadillac which was comparable to temperatures found in the Newaygo district. Scenario 4 projected a 8.5°C annual and a 18.0°C May to September temperature which were comparable with the Ionia and Huron districts, both of which are south of the tension

42 E.A. Jones et al. / Agricultural and Forest Meteorology 72 (1994) 31 46
zone in Region I. Projected potential evaporation to precipitation ratios for Cadillac under Scenarios 1 and 2 were 0.69 which is the same as that which was reported for the Highplains district where Cadillac is found. Scenarios 3 and 4 projected ratios of 0.59 and 0.60, respectively, and these ratios were similar to that in the Saginaw district, the lowest in the state.
Climatic conditions projected under the mildest climate change scenario compared with today's climate in the north-central portion of the lower peninsula of Region II where Cadillac is located. The moderate climate change scenario resulted in con- ditions that matched today's climate in districts on either side of the boundary between Regions I and II. The extreme climate change scenario resulted in a climate that today is found south of the tension zone in Region I. This situation, if realized, could trigger regional decline episodes as well as regeneration failures.
3.5. Si te 5
The Hart NOAA weather station is located in the Manistee district in the northern portion of the lower peninsula on Lake Michigan in Region II (Fig. 1; Albert et al., 1986). Simulations under Scenario 1 resulted in a May to September temperature of 17.8°C for Hart which was the same as that reported in the Arenac and Saginaw districts. Saginaw, as previously mentioned, is just south of the tension zone in Region I. An annual temperature of 8.5°C for Hart under Scenario 1 was similar to the Huron district of Region I. Scenario 2 projected a May to September temperature of 18.3°C for Hart which was comparable with the Ionia and Huron districts which are south of the tension zone, and an annual temperature of 9.4°C for Hart which was similar to the Jackson and AUegan districts which are also south of the tension zone.
Both annual and May to September temperatures resulting from Scenarios 3 and 4 were higher than any detailed by Albert et al. (1986) and thus, not comparable with any districts in the state of Michigan. Any comparable districts were just north of the tension zone (Arenac) or much further south of it (Table 2). All projected ratios of potential evaporation to precipitation were also much lower than any described for the state regardless of the climate change scenario. Even under the mildest climate change scenario, projections indicate that climate would be similar to that found today well below the tension zone which would promote regional decline, pest- pathogen infestation, and regeneration problems with the forest species now comprising this area.
4. Discussion
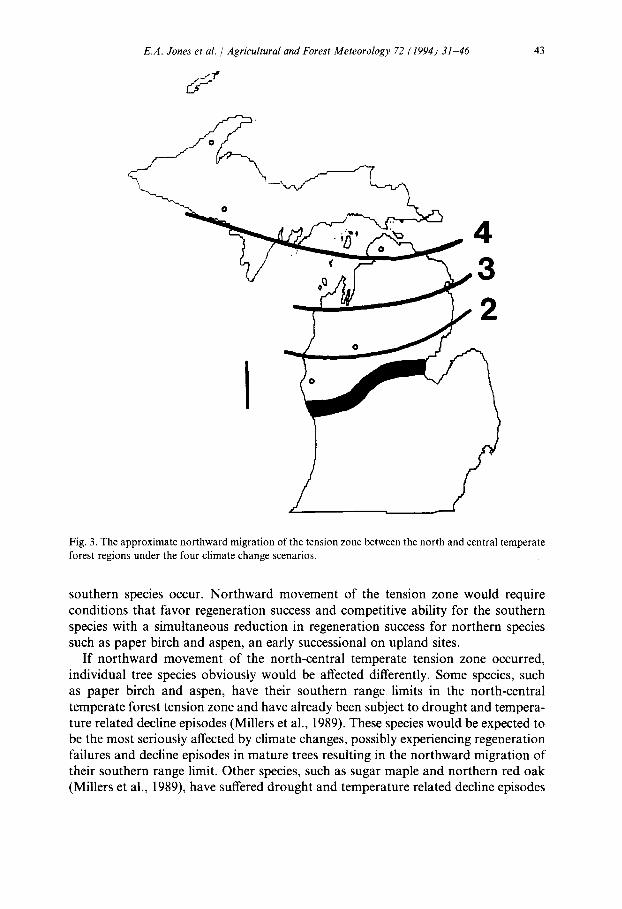
The range of conditions in the scenarios examined were obtained from different global circulation models, when scaled to a global increase of 1.8°C by 2030 (Karl et al., 1991). Even under the mildest climate change scenario (Scenario 2), a northward migration of the north-central temperate tension zone appears likely (Fig. 3). The tension zone is not a clear line of demarcation between the north and central temperate forest zones, but rather an area where many mixtures of northern and
E.A. Jones et al. / Agricultural and Forest Meteorology 72 (1994) 31 46 43
J
(7% 4
2
Fig. 3. The approximate northward migration of the tension zone between the north and central temperate forest regions under the four climate change scenarios.
southern species occur. Northward movement of the tension zone would require conditions that favor regeneration success and competitive ability for the southern species with a simultaneous reduction in regeneration success for northern species such as paper birch and aspen, an early successional on upland sites.
If northward movement of the north-central temperate tension zone occurred, individual tree species obviously would be affected differently. Some species, such as paper birch and aspen, have their southern range limits in the north-central temperate forest tension zone and have already been subject to drought and tempera- ture related decline episodes (Millers et al., 1989). These species would be expected to be the most seriously affected by climate changes, possibly experiencing regeneration failures and decline episodes in mature trees resulting in the northward migration of their southern range limit. Other species, such as sugar maple and northern red oak (Millers et al., 1989), have suffered drought and temperature related decline episodes

44 E.A. Jones et al. / Agricultural and Forest Meteorology 72 (1994) 31-46
in the north temperate forest zone, but they are found on both sides of the tension zone. These species might be expected to suffer decline episodes owing to increased drought and temperature. It is unlikely that they would be eliminated from stands where they are found today although they might become a less dominant component in the stands.
Species migration is not determined solely by climate. Jack pine is a species which occurs on a wide range of sites, but is an edaphic climax species on harsh glacial outwash plains, such as those found in the Highplains district in Region II. These sites are much harsher than indicated by the climatic norms of the regional landscape ecosystems. It is unlikely that any of the southern species expected to migrate north- ward would be able to compete successfully with jack pine on these harsh sites. It is important to remember that landforms or bodies of water may form barriers to species migration and that one must consider the silvical characteristics of individual species when making projections of these responses to climate change.
Genetic diversity within species may also affect the way a particular species responds to climate change. Carter (1991) examined provenance tests on six northern species (balsam fir, red maple (Acer rubrum), white ash (F. americana), green ash (Fraxinus pennsylvanica), white spruce, and eastern white pine (Pinus strobus)). For these six species, growth of northern provenances either did not respond or decreased under warmer growing conditions. Based on these results, there not only could be shifts in species' geographical ranges, but one could expect widespread reductions in productivity and episodes of forest decline at locations far from the boundaries of shifting geographical ranges for a wide range of species.
Thus, if a northward migration of the north-central temperate tension zone were realized, species composition in the affected forest stands could change. One would need to examine individual species requirements for regeneration as well as their ability to compete. Another factor one must consider is how species' growth and their ability to compete may be affected by the physiography of the region.
5. Conclusion
A range of scenarios were examined for climate change in central North America which could result from a gobal increase of 1.8°C in annual temperature by 2030. This study utilized a stochastic daily weather simulation model which projected climatic conditions under each scenario for five selected NOAA weather stations (Houghton, Crystal Falls, Pellston, Cadillac, and Hart). These stations were located from the north to the south in the northern temperate forest zone in Michigan. Of primary concern was the possible northward migration of the north-central temperate forest tension zone located today at approximately 44°N latitude. Projections were placed in a regional framework utilizing an integrated regional landscape ecosystem classification system (Albert et al., 1986).
The model projected climatic conditions for each location that are similar to conditions now found in districts much further south. The more extreme warming scenarios projected conditions in Houghton and Crystal Falls in the upper peninsula

E.A. Jones et al. / Agricultural and Forest Meteorology 72 (1994) 31-46 45
of Michigan which are similar to current conditions in the lower peninsula of Michigan just north of the tension zone. Projected climatic conditions for Pellston and Cadillac which are located in the northern part of the lower peninsula are similar to districts just south of the tension zone. Climatic conditions projected for Hart (also in the northern part of the lower peninsula) under the mild climate change scenario were similar to districts south of the tension zone, and under the moderate and extreme climate change scenarios were not even comparable with districts in the state. In summary
1. Even under the mildest climate change scenario (Scenario 2), the climatic con- ditions prevalent today at the north-central temperate forest tension zone are expected to occur north of Hart (43°42'N).
2. Under the more extreme scenarios (Scenarios 3 and 4), the conditions at the tension zone may occur as far north as Pellston (45°27'N).
It is not possible to predict the timing of decline episodes, changes in regeneration success, or even the sequence of the occurrance by species. Much depends on the variability of year-to-year weather patterns, the frequency of seed crop production, and the status of insect and disease outbreaks. Improved systems for long-term monitoring of forest condition should be undertaken in order to establish data which can be used to examine specific hypotheses of species behavior and to be able to detect problems as they occur. In particular, monitoring techniques which assess regeneration and recruitment of overstory species should be implemented. At present, it is probably too soon to begin plans for any mitigation efforts, but it does seem prudent to implement monitoring activities specifically tailored to examine the types of changes in forest conditions, by species, which may be expected if projected climate changes actually occur.
Acknowledgments
This study was funded by the US Navy, Space and Naval Warfare Systems Command through a subcontract with the Illinois Institute of Technology Research Institute (Grant No. E06595-88-C-001) and by the US Department of Agriculture, Forest Service, Northeastern Forest Experiment Station, Northern Stations Global Change Research Program. Any findings, opinions, or recommendations are those of the authors and are not necessarily supported or endorsed by the funding agencies; this manuscript has not been peer-reviewed by the funding agencies.
References
Albert, D.A., Denton, S.R. and Barnes, B.V., 1986. Regional Landscape Ecosystems of Michigan. School of Natural Resources, University of Michigan, Ann Arbor.
Botkin, D.B., Nisbet, R.A. and Reynales, T.E., 1989. The effects of climate change on the forests of the Great Lakes states. Bull. Ecol. Soc. Am., 69: 77.
46 E.A. Jones et al. / Agricultural and Forest Meteorology 72 (1994) 31-46
Burns, R.M. and Honkala, H.H., 1990a. Silvics of North America. Vol. 1. Agricultural Handbook No. 654. US Forestry Service, Washington, DC, 675 pp.
Burns, R.M. and Honkala, H.H., 1990b. Silvics of North America. Vol. 2. Agricultural Handbook No. 654. US Forestry Service, Washington, DC, 877 pp.
Carter, K.K., 1991. Provenance tests as indicators of tree growth response to climate change. In: Emerging Issues in Northern Hardwood Management: Air Pollution, Climate Change, and Bio-diversity. Ford Forestry Center, Michigan Technological University. Houghton, MI. Misc. Publ. 91-1, p. 40.
Davis, M.G., 1989. Insights from paleoecology on global change. Bull. Ecol. Soc. Am., 70: 222-228. Desanker, R.V. and Reed, D.D., 1991. A stochastic model for simulating daily growing season weather
variables for input into ecological models. In: Proceedings of the 1991 Systems Analysis in Forest Resources Symposium, Charleston, SC, pp. 1-10.
Earthinfo., 1990. Climatedata User's Manual. Earthlnfo Inc., Boulder, CO. Gates, D.M., 1990. Climate change and forests. Tree Physiol., 7:1 5. Hepting, G.H., 1971. Diseases of forest and shade trees of the United States. USDA Agricultural Hand-
book No. 386. US Government Printing Office, Washington, DC. Intergovernmental Panel on Climate Change, 1990. Scientific assessment of climate change. World
Meteorological Organization, United Nations Environment Programme, Geneva, Switzerland. Jones, E.A., Reed, D.D., Mroz, G.D., Liechty, H.O. and Cattelino, P.J., 1992. Climate stress as a precursor
to forest decline: paper birch in Northern Michigan, 1990. Can. J. For. Res. (in press). Karl, T.R., Heim, Jr, R.H., and Quayle, R.G., 1991. The greenhouse effect in central North America: if not
now, when? Science, 251: 1058-1061. Manabe, S. and Wetherald, R., 1986. Reduction in summer soil wetness induced by an increase in
atmospheric carbon dioxide. Science, 232: 626-628. Merz, R.W., 1978. Forest atlas of the Midwest. USDA Forest Service, North Central and Northeastern
Forest Experiment Stations, College of Forestry, University of Minnesota, St. Paul, MN. Millers, I.D., Shriner, D.S., and Rizzo, D., 1989. History of hardwood decline in the eastern United States.
USDA Forest Service, General Technical Report NE-126. Overpeck, J.T., Bartlein, P.J., Webb III, T., 1991. Potential magnitude of future vegetation change in
eastern North America: comparisons with the past. Science, 254:692 695. Reed, D.D. and Desanker, P.V., 1992. Ecological implications of projected climate change scenarios in
forest ecosystems in northern Michigan, USA. Int. J. Biometeorology, 36: 99-107. Schneider, S.H., 1989. The greenhouse effect: science and policy. Science, 243: 771-781. Solomon, A.M. and West, D.C., 1987. Simulating forest responses to expected climate change in eastern
North America: applications to decision-making in the forest industry. In: The Greenhouse Effect, Climate Change, and US Forest. The Conservation Foundation, Washington, DC, pp. 189-207.
Solomon, A.M. and Bartlein, P.J. 1992. Past and future climate change: response by mixed-deciduous coniferous forest ecosystems in northern Michigan. Can. J. For. Res., 22: 1727-1738.