EC Economic Outlook Book
150
A DEDEA & Treasury Publication e Eastern Cape ECONOMIC PROFILE AND OUTLOOK
-
Upload
maagathalephoto -
Category
Documents
-
view
73 -
download
5
Transcript of EC Economic Outlook Book

A DEDEA & Treasury Publication
The Eastern CapeE C O N O M I C P R O F I L E
A N D O U T L O O K


The Eastern Cape Economic Profile and Outlook, 2010, is compiled
using the available information from different sources.
Some of the information is subject to revision.


FOREWORDThe Eastern Cape Economic Profile and Outlook – 2010, is the first of a series of
publications that will be released by the Department of Economic Development &
Environmental Affairs (DEDEA) in partnership with the Provincial Treasury on an annual
basis. This initiative seeks to provide reliable, accurate and up to date information on the
economic sector within the Eastern Cape Province. This document is intended to serve
as a point of reference to the public and the private sector for decision making. It is our
hope that this work will be of great value to those involved in the investment space,
economic planning, research, budgeting processes, to name but a few.
Through this publication, our intention is to provide a single point of reference for the
economic profile of the Eastern Cape, including District Municipalities and the Metro, as
well as key economic sectors. The publication is also forward looking in that it provides a
forecast and an outlook of key variables in the economy over a three- year period. This is
very important to us, as the global economy begins to show signs of recovery from the
economic crisis.
As the Department of Economic Development & Environmental Affairs we have a
mandate to provide leadership and guidance in economic development and planning
discourse. With this in mind I invite all our stakeholders to receive, study, and make use
of this publication. As the first of many to come, our stakeholders can look forward to this
being an annual release and can also look forward to other publications in other areas of
economic thought. I must also commend the team that has worked tirelessly to put this
together, under the leadership of the Head of Department.
Hon Mcebisi Jonas, Mr (MPL)
MEC for Finance, Economic Development & Environmental Affairs

ABBREVIATIONS ........................................................................................................................................ II
TABLES ....................................................................................................................................................... IV
FIGURES ..................................................................................................................................................... V
ACKNOWLEDGEMENTS ............................................................................................................................ VI
EXECUTIVE SUMMARY ............................................................................................................................. VII
FORECASTS ............................................................................................................................................... IX
National ..................................................................................................................................................... IX
Eastern Cape .............................................................................................................................................. X
1 GLOBAL ECONOMIC OUTLOOK AND FORECAST METHODOLOGY ............................................. 1
1.1 Global Economic Outlook ................................................................................................................. 1
1.1.1 USA .................................................................................................................................................... 1
1.1.2 JAPAN ............................................................................................................................................... 2
1.1.3 CHINA ............................................................................................................................................... 3
1.1.4 INDIA ................................................................................................................................................. 3
1.1.5 MAJOR EUROPEAN UNION MEMBER STATES ................................................................................ 4
1.1.6 BRAZIL ............................................................................................................................................... 4
1.2 The Theoretical Framework of the South African Macro-model .............................................. 5
1.3 Eastern Cape Model Conceptualisation ........................................................................................ 5
2 NATIONAL ECONOMIC PERFORMANCE AND OUTLOOK .............................................................. 9
2.1 Overview of current situation .......................................................................................................... 9
2.2 Consumer spending .......................................................................................................................... 10
2.3 Public Fixed Investment ................................................................................................................... 11
2.4 Private Fixed Investment ................................................................................................................. 11
2.5 Labour-Market Condition ................................................................................................................. 12
2.6 Inflation ............................................................................................................................................... 13
2.7 Monetary Policy and Interest Rates .............................................................................................. 13
2.8 Fiscal Policy ....................................................................................................................................... 14
3 THE ECONOMY OF THE EASTERN CAPE ......................................................................................... 17
3.1 Profile of the Eastern Cape ............................................................................................................. 17
3.1.1 Overview ........................................................................................................................................... 17
3.1.2 Population size and age distribution ................................................................................................ 18
3.1.3 HIV and AIDS .................................................................................................................................... 19
3.1.4 Migration .......................................................................................................................................... 20
3.2 Economic Outlook of the Eastern Cape ........................................................................................ 20
3.2.1 Economic performance and projections ........................................................................................... 20
3.2.2 Total Investment in the Eastern Cape .............................................................................................. 21
3.2.2.1 Machinery and other equipment ................................................................................................... 22
3.2.2.2 Building and construction .............................................................................................................. 23
3.2.2.3 Transport equipment ..................................................................................................................... 24
3.2.3 Final Consumption Expenditure in the Eastern Cape ....................................................................... 24
3.2.3.1 Consumption of durable goods in Eastern Cape ........................................................................... 26
3.2.3.2 Consumption of non-durable goods in Eastern Cape .................................................................... 27
3.2.3.3 Consumption of semi-durable goods in Eastern Cape .................................................................. 28
3.2.3.4 Consumption of Services in Eastern Cape .................................................................................... 29
3.2.4 Household Consumption, Saving and Debt ..................................................................................... 29
Tabl
E O
F C
On
TEn
Ts
3.2.5 Trade Position .................................................................................................................................... 30
3.2.5.1 Exports of Goods ............................................................................................................................ 30
3.2.5.2 Imports of Goods ............................................................................................................................ 31
3.2.5.3 Balance of Trade ............................................................................................................................. 32
3.3 Sectoral Analysis of the Eastern Cape .......................................................................................... 33
3.3.1 Sectoral Contribution Analysis in Eastern Cape ............................................................................... 33
3.3.1.1 Primary Sector ................................................................................................................................ 33
3.3.1.2 Secondary Sector ........................................................................................................................... 34
3.3.1.3 Tertiary Sector ................................................................................................................................ 34
3.3.2 Sectoral Growth Analysis in the Eastern Cape ................................................................................. 34
3.3.2.1 Primary Sector ................................................................................................................................ 34
3.3.2.2 Secondary Sector ........................................................................................................................... 35
3.3.2.3 Tertiary Sector ................................................................................................................................ 35
3.4 Labour-Market Analysis in Eastern Cape ..................................................................................... 36
3.4.1 Employment ....................................................................................................................................... 38
3.4.1.1 Employment by province ................................................................................................................ 38
3.4.1.2 Employment Sectoral Analysis ....................................................................................................... 39
3.4.1.2.1 Employment Industry’s Contribution to Total Employment ......................................................... 39
3.4.1.2.2 Formal Employment by Industry .................................................................................................. 39
3.4.1.2.3 Informal Employment by Industry ............................................................................................... 41
3.4.1.3 Employment by Occupation and by Skills ...................................................................................... 42
3.4.1.3.1 Employment by Occupation ......................................................................................................... 42
3.4.1.3.2 Employment by Skills .................................................................................................................. 43
3.4.2 Unemployment Rate in Eastern Cape ............................................................................................... 43
3.4.3 Labour Remuneration ........................................................................................................................ 44
3.4.3.1 Remuneration by Gender ............................................................................................................... 45
3.4.3.2 Remuneration by Age Group .......................................................................................................... 46
3.4.3.3 Remuneration by sector ................................................................................................................. 46
4 ECONOMIC PERFORMANCE OF DISTRICT MUNICIPALITIES ...................................................... 49
4.1 Amatole District Municipality ......................................................................................................... 49
4.1.1 Total Population by Age Group ......................................................................................................... 49
4.1.2 Total Population Affected by HIV ...................................................................................................... 50
4.1.3 Household Income and Expenditure ................................................................................................. 50
4.1.4 Sectoral Contribution Analysis ......................................................................................................... 51
4.1.5 Sectoral Growth Analysis ................................................................................................................. 52
4.1.6 Access to Services ............................................................................................................................ 53
4.1.6.1 Access to Water ............................................................................................................................. 53
4.1.6.2 Access to Energy ............................................................................................................................ 54
4.1.6.3 Access to Sanitation ...................................................................................................................... 54
4.1.6.4 Access to Telephones .................................................................................................................... 55
4.1.6.5 Access to Refuse ........................................................................................................................... 55
4.1.7 Types of Dwelling ............................................................................................................................. 56
4.1.8 Formal Employment by Sector .......................................................................................................... 56
4.1.9 Informal and Formal Employment by Skill ........................................................................................ 57
4.1.10 Dependency Ratio ........................................................................................................................... 57
4.1.11 Level of Education ........................................................................................................................... 57

Tabl
E O
F C
On
TEn
Ts
4.1.12 Number of People in Poverty .......................................................................................................... 58
4.1.13 Distribution of Households by Income ........................................................................................... 58
4.1.14 Human Development Indicator (HDI) .............................................................................................. 59
4.1.15 Urbanisation ................................................................................................................................... 59
4.2 Alfred Nzo District Municipality ..................................................................................................... 60
4.2.1 Total Population by Age Group ......................................................................................................... 60
4.2.2 Total Population Affected by HIV ..................................................................................................... 60
4.2.3 Household Income and Expenditure ................................................................................................. 61
4.2.4 Sectoral Contribution Analysis ......................................................................................................... 61
4.2.5 Sectoral Growth Analysis ................................................................................................................. 62
4.2.6 Access to Services ........................................................................................................................... 63
4.2.6.1 Access to Water ............................................................................................................................ 63
4.2.6.2 Access to Energy ........................................................................................................................... 63
4.2.6.3 Access to Sanitation ..................................................................................................................... 64
4.2.6.4 Access to Telephones .................................................................................................................... 64
4.2.6.5 Access to Refuse ........................................................................................................................... 65
4.2.7 Types of Dwelling ............................................................................................................................. 65
4.2.8 Formal Employment by Sector .......................................................................................................... 66
4.2.9 Informal and Formal Employment by Skill ........................................................................................ 66
4.2.10 Dependency Ratio .......................................................................................................................... 67
4.2.11 Level of Education .......................................................................................................................... 67
4.2.12 Number of people in poverty .......................................................................................................... 68
4.2.13 Distribution of Households by Income ........................................................................................... 68
4.2.14 Human Development Indicator (HDI) .............................................................................................. 68
4.2.15 Urbanisation ................................................................................................................................... 69
4.3 Cacadu District Municipality .......................................................................................................... 70
4.3.1 Total Population by Age Group ......................................................................................................... 70
4.3.2 Total Population by Affected HIV ..................................................................................................... 70
4.3.3 Household income and expenditure ................................................................................................ 71
4.3.4 Sectoral Contribution Analysis ......................................................................................................... 71
4.3.5 Sectoral Growth Analysis ................................................................................................................. 72
4.3.6 Access to Services ........................................................................................................................... 73
4.3.6.1 Access to Water ............................................................................................................................ 73
4.3.6.2 Access to Energy ........................................................................................................................... 74
4.3.6.3 Access to Sanitation ..................................................................................................................... 74
4.3.6.4 Access to Telephones .................................................................................................................... 74
4.3.6.5 Access to Refuse ........................................................................................................................... 75
4.3.7 Type of Dwelling ............................................................................................................................... 75
4.3.8 Formal Employment by Sector .......................................................................................................... 76
4.3.9 Informal and Formal Employment by Skill ........................................................................................ 77
4.3.10 Dependency Ratio .......................................................................................................................... 77
4.3.11 Level of Education .......................................................................................................................... 78
4.3.12 Number of People in Poverty ......................................................................................................... 78
4.3.13 Distribution of Households by Income ........................................................................................... 79
4.3.14 Human Development Indicator (HDI) .............................................................................................. 79
4.3.15 Urbanisation ................................................................................................................................... 79
4.4 Chris Hani District Municipality ..................................................................................................... 80
4.4.1 Total Population by Age Group ......................................................................................................... 80
4.4.2 Total Population Affected by HIV ..................................................................................................... 80
4.4.3 Household Income and Expenditure ................................................................................................. 81
4.4.4 Sectoral Contribution Analysis ......................................................................................................... 82
4.4.5 Sectoral Growth Analysis ................................................................................................................ 82
4.4.6 Access to Services ............................................................................................................................ 83
4.4.6.1 Access to Water ............................................................................................................................ 83
4.4.6.2 Access to Energy ........................................................................................................................... 84
4.4.6.3 Access to Sanitation ..................................................................................................................... 84
4.4.6.4 Access to Telephones .................................................................................................................... 84
4.4.6.5 Access to Refuse ........................................................................................................................... 85
4.4.7 Types of Dwelling ............................................................................................................................. 85
4.4.8 Formal Employment by Sector .......................................................................................................... 85
4.4.9 Informal and Formal Employment by Skill ........................................................................................ 86
4.4.10 Dependency Ratio ........................................................................................................................... 87
4.4.11 Level of Education .......................................................................................................................... 87
4.4.12 Number of People in Poverty .......................................................................................................... 88
4.4.13 Income Distribution ........................................................................................................................ 88
4.4.14 Human Development Indicator (HDI) .............................................................................................. 88
4.4.15 Urbanisation ................................................................................................................................... 89
4.5 Nelson Mandela Bay Metropolitan ............................................................................................... 90
4.5.1 Total Population by Age Group ......................................................................................................... 90
4.5.2 Total Population Affected by HIV ..................................................................................................... 90
4.5.3 Household Income and Expenditure ................................................................................................. 91
4.5.4 Sectoral Contribution Analysis ......................................................................................................... 92
4.5.5 Sectoral Growth Analysis ................................................................................................................. 92
4.5.6 Access to services ............................................................................................................................ 94
4.5.6.1 Access to water ............................................................................................................................. 94
4.5.6.2 Access to Energy ........................................................................................................................... 94
4.5.6.3 Access to Sanitation...................................................................................................................... 94
4.5.6.4 Access to telephones .................................................................................................................... 95
4.5.6.5 Access to Refuse ........................................................................................................................... 95
4.5.7 Type of dwelling ............................................................................................................................... 96
4.5.8 Formal Employment by sector .......................................................................................................... 96
4.5.9 Informal and Formal Employment by skill ........................................................................................ 97
4.5.10 Dependency Ratio .......................................................................................................................... 97
4.5.11 Level of Education .......................................................................................................................... 97
4.5.12 Number of People in Poverty .......................................................................................................... 98
4.5.13 Distribution of Households by Income ........................................................................................... 98
4.5.14 Human Development Indicator (HDI) ............................................................................................. 99
4.5.15 Urbanisation ................................................................................................................................... 99
4.6 O.R. Tambo District Municipality ................................................................................................... 100
4.6.1 Total Population by Age Group ........................................................................................................ 100
4.6.2 Total Population Affected by HIV ..................................................................................................... 100
4.6.3 Household income and expenditure ................................................................................................ 101
4.6.4 Sectoral Contribution Analysis ........................................................................................................ 102
4.6.5 Sectoral Growth Analysis ................................................................................................................. 102
Tabl
E O
F C
On
TEn
Ts
4.6.6 Access to Services ............................................................................................................................ 103
4.6.6.1 Access to Water ............................................................................................................................. 103
4.6.6.2 Access to Energy ............................................................................................................................ 104
4.6.6.3 Access to Sanitation ...................................................................................................................... 104
4.6.6.4 Access to Telephones .................................................................................................................... 105
4.6.6.5 Access to Refuse ........................................................................................................................... 105
4.6.7 Types of dwelling .............................................................................................................................. 105
4.6.8 Formal Employment by sector .......................................................................................................... 106
4.6.9 Informal and Formal employment by skill ........................................................................................ 107
4.6.10 Dependency Ratio ........................................................................................................................... 107
4.6.11 Level of Education .......................................................................................................................... 108
4.6.12 Number of people in poverty .......................................................................................................... 109
4.6.13 Distribution of households by income ............................................................................................ 109
4.6.14 Human Development Indicator (HDI) .............................................................................................. 109
4.6.15 Urbanisation .................................................................................................................................... 110
4.7 UKhahlamba District ........................................................................................................................ 111
4.7.1 Total Population by Age Group ......................................................................................................... 111
4.7.2 Total Population Affected by HIV ...................................................................................................... 111
4.7.3 Household Income and Expenditure ................................................................................................. 112
4.7.4 Sectoral Contribution Analysis ......................................................................................................... 112
4.7.5 Sectoral Growth Analysis ................................................................................................................. 113
4.7.6 Access to Services ............................................................................................................................ 114
4.7.6.1 Access to Water ............................................................................................................................ 114
4.7.6.2 Access to Energy ............................................................................................................................ 115
4.7.6.3 Access to Sanitation ...................................................................................................................... 115
4.7.6.4 Access to Telephones .................................................................................................................... 115
4.7.6.5 Access to Refuse ............................................................................................................................ 116
4.7.7 Types of Dwelling ............................................................................................................................. 116
4.7.8 Formal Employment by Sector .......................................................................................................... 117
4.7.9 Informal and Formal Employment by Skill ........................................................................................ 117
4.7.10 Dependency Ratio ........................................................................................................................... 118
4.7.11 Level of Education ........................................................................................................................... 118
4.7.12 Number of People in Poverty .......................................................................................................... 119
4.7.13 Distribution of Household by Income ............................................................................................. 119
4.7.14 Human Development Indicator ....................................................................................................... 119
4.7.15 Urbanisation .................................................................................................................................... 120
5 STRATEGIC IMPLICATIONS ................................................................................................................ 123
APPENDIX .................................................................................................................................................. 126
II
AFF Agriculture, Forestry and Fishing
AIDS Acquired Immune Deficiency Syndrome
COICOP Classification of Individual Consumption by Purpose
CON Construction
Cons. Consumption
CPI Consumer Price Index
CPIX Consumer Price Index Excluding Mortgage
CSPS Community, Social and Other Personal Services
DM District Municipality
Dur. Goods Durable Goods
EAP Economically Active Population
EC Eastern Cape
EGW Electricity, Gas and Water
EMEs Emerging Market Economies
Equip. Equipment
FCEH Final Consumption Expenditure by Household
FET Further Education and Training
FIBS Finance, Insurance and Business Services
GDP Gross Domestic Product
GDP_R Gross Domestic Product by Region
GGS General Government Services
GVA Gross Value Added
HDI Human Development Indicator
HIV Human Immune Virus
ILO International Labour Office
IMF International Monetary Fund
Inv. Investment
ITC International Trade Classification
MAN Manufacturing
MDG Millennium Development Goal
MPC Monetary Policy Committee
MQ Mining and Quarrying
NCA National Credit Act
Non-Dur. Goods Non-Durable Goods
OGSS Other General Government Services
PPI Producer Price Index
ABB
REVI
ATIO
NS

III
PPP Public-Private Partnerships
Priv. Private
Prop. Cons. Propensity to Consume
Prop. Sav. Propensity to Save
PSBR Public Sector Borrowing (Budget) Requirement
Pub. Public
Q-Q/Q-on-Q Quarter to Quarter / Quarter on Quarter
SA South Africa
SARB South African Reserve Bank
SEC Sector
Semi- Dur. Goods Semi-Durable Goods
Serv. Services
STATSSA Statistics South Africa
TSC Transport Storage and Communication
US United States
VCI Visual Condition Index
WRTCA Wholesale & Retail Trade, Catering and Accommodation
IV
TABl
ES
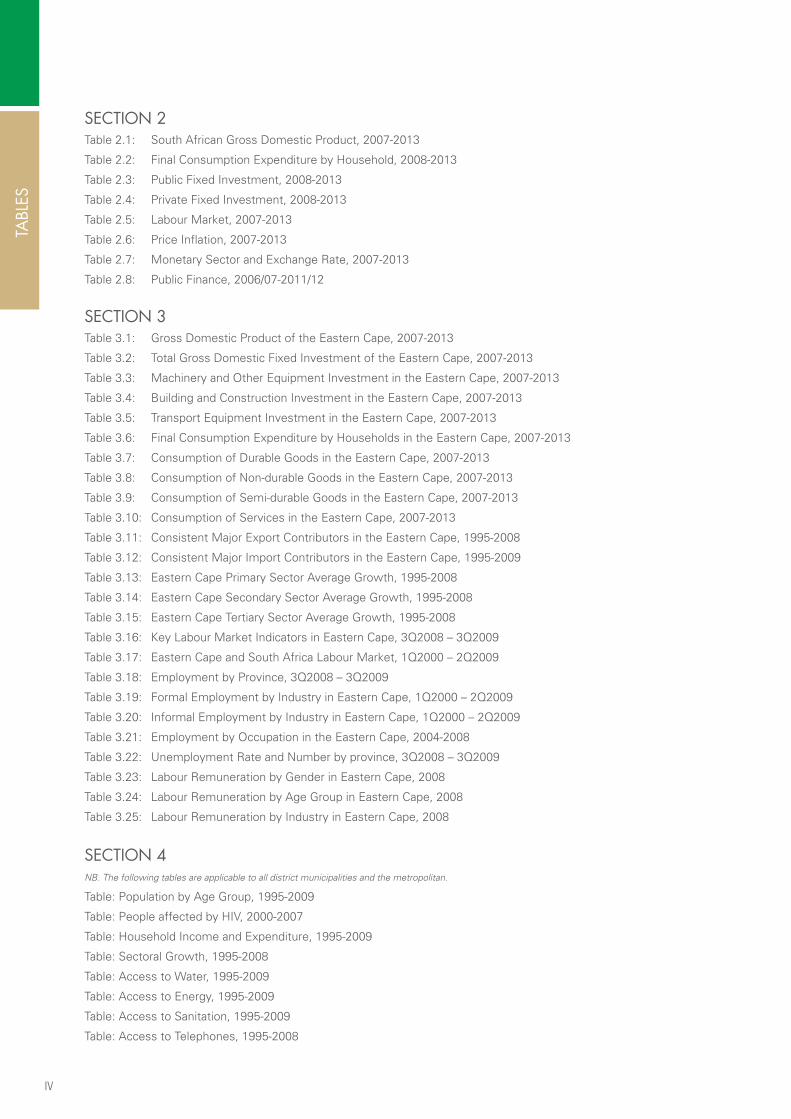
SEcTION 2Table 2.1: South African Gross Domestic Product, 2007-2013
Table 2.2: Final Consumption Expenditure by Household, 2008-2013
Table 2.3: Public Fixed Investment, 2008-2013
Table 2.4: Private Fixed Investment, 2008-2013
Table 2.5: Labour Market, 2007-2013
Table 2.6: Price Inflation, 2007-2013
Table 2.7: Monetary Sector and Exchange Rate, 2007-2013
Table 2.8: Public Finance, 2006/07-2011/12
SEcTION 3Table 3.1: Gross Domestic Product of the Eastern Cape, 2007-2013
Table 3.2: Total Gross Domestic Fixed Investment of the Eastern Cape, 2007-2013
Table 3.3: Machinery and Other Equipment Investment in the Eastern Cape, 2007-2013
Table 3.4: Building and Construction Investment in the Eastern Cape, 2007-2013
Table 3.5: Transport Equipment Investment in the Eastern Cape, 2007-2013
Table 3.6: Final Consumption Expenditure by Households in the Eastern Cape, 2007-2013
Table 3.7: Consumption of Durable Goods in the Eastern Cape, 2007-2013
Table 3.8: Consumption of Non-durable Goods in the Eastern Cape, 2007-2013
Table 3.9: Consumption of Semi-durable Goods in the Eastern Cape, 2007-2013
Table 3.10: Consumption of Services in the Eastern Cape, 2007-2013
Table 3.11: Consistent Major Export Contributors in the Eastern Cape, 1995-2008
Table 3.12: Consistent Major Import Contributors in the Eastern Cape, 1995-2009
Table 3.13: Eastern Cape Primary Sector Average Growth, 1995-2008
Table 3.14: Eastern Cape Secondary Sector Average Growth, 1995-2008
Table 3.15: Eastern Cape Tertiary Sector Average Growth, 1995-2008
Table 3.16: Key Labour Market Indicators in Eastern Cape, 3Q2008 – 3Q2009
Table 3.17: Eastern Cape and South Africa Labour Market, 1Q2000 – 2Q2009
Table 3.18: Employment by Province, 3Q2008 – 3Q2009
Table 3.19: Formal Employment by Industry in Eastern Cape, 1Q2000 – 2Q2009
Table 3.20: Informal Employment by Industry in Eastern Cape, 1Q2000 – 2Q2009
Table 3.21: Employment by Occupation in the Eastern Cape, 2004-2008
Table 3.22: Unemployment Rate and Number by province, 3Q2008 – 3Q2009
Table 3.23: Labour Remuneration by Gender in Eastern Cape, 2008
Table 3.24: Labour Remuneration by Age Group in Eastern Cape, 2008
Table 3.25: Labour Remuneration by Industry in Eastern Cape, 2008
SEcTION 4NB. The following tables are applicable to all district municipalities and the metropolitan.
Table: Population by Age Group, 1995-2009
Table: People affected by HIV, 2000-2007
Table: Household Income and Expenditure, 1995-2009
Table: Sectoral Growth, 1995-2008
Table: Access to Water, 1995-2009
Table: Access to Energy, 1995-2009
Table: Access to Sanitation, 1995-2009
Table: Access to Telephones, 1995-2008
V
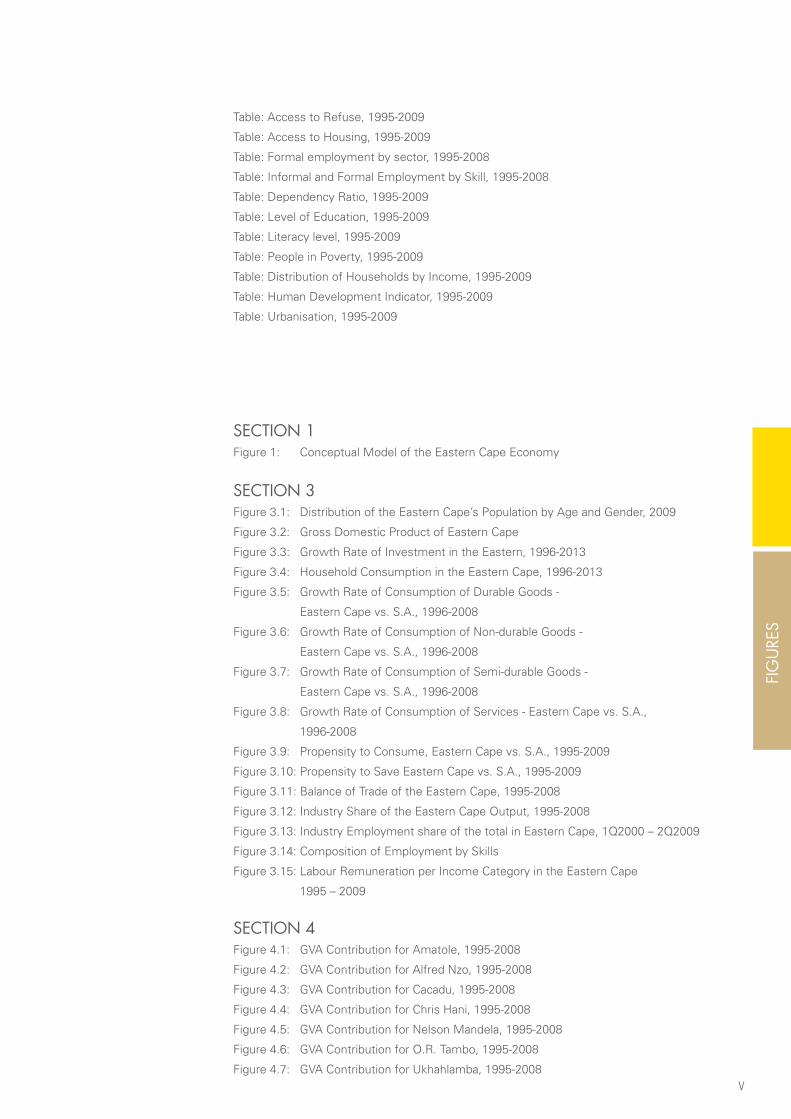
Table: Access to Refuse, 1995-2009
Table: Access to Housing, 1995-2009
Table: Formal employment by sector, 1995-2008
Table: Informal and Formal Employment by Skill, 1995-2008
Table: Dependency Ratio, 1995-2009
Table: Level of Education, 1995-2009
Table: Literacy level, 1995-2009
Table: People in Poverty, 1995-2009
Table: Distribution of Households by Income, 1995-2009
Table: Human Development Indicator, 1995-2009
Table: Urbanisation, 1995-2009
SEcTION 1Figure 1: Conceptual Model of the Eastern Cape Economy
SEcTION 3Figure 3.1: Distribution of the Eastern Cape’s Population by Age and Gender, 2009
Figure 3.2: Gross Domestic Product of Eastern Cape
Figure 3.3: Growth Rate of Investment in the Eastern, 1996-2013
Figure 3.4: Household Consumption in the Eastern Cape, 1996-2013
Figure 3.5: Growth Rate of Consumption of Durable Goods -
Eastern Cape vs. S.A., 1996-2008
Figure 3.6: Growth Rate of Consumption of Non-durable Goods -
Eastern Cape vs. S.A., 1996-2008
Figure 3.7: Growth Rate of Consumption of Semi-durable Goods -
Eastern Cape vs. S.A., 1996-2008
Figure 3.8: Growth Rate of Consumption of Services - Eastern Cape vs. S.A.,
1996-2008
Figure 3.9: Propensity to Consume, Eastern Cape vs. S.A., 1995-2009
Figure 3.10: Propensity to Save Eastern Cape vs. S.A., 1995-2009
Figure 3.11: Balance of Trade of the Eastern Cape, 1995-2008
Figure 3.12: Industry Share of the Eastern Cape Output, 1995-2008
Figure 3.13: Industry Employment share of the total in Eastern Cape, 1Q2000 – 2Q2009
Figure 3.14: Composition of Employment by Skills
Figure 3.15: Labour Remuneration per Income Category in the Eastern Cape
1995 – 2009
SEcTION 4Figure 4.1: GVA Contribution for Amatole, 1995-2008
Figure 4.2: GVA Contribution for Alfred Nzo, 1995-2008
Figure 4.3: GVA Contribution for Cacadu, 1995-2008
Figure 4.4: GVA Contribution for Chris Hani, 1995-2008
Figure 4.5: GVA Contribution for Nelson Mandela, 1995-2008
Figure 4.6: GVA Contribution for O.R. Tambo, 1995-2008
Figure 4.7: GVA Contribution for Ukhahlamba, 1995-2008
FIG
URE
S

VI
Ac
KNO
WlE
DG
EMEN
TS
This publication was commissioned by the Honorable MEC Mcebisi Jonas, and
prepared by the CDC Research Unit under the overall guidance of Njabulo Sithebe.
Invaluable comments were received from Sybert Liebenberg, Ronney Ncwadi,
Phumla Ndaba, Pepi Silinga, Khwezi Tiya and Idriss Mouchili.
TEAMNjabulo Sithebe (Head: CDC Research Unit)
Senzeni Mtetwa (Senior Economist / Study Leader)
Semiyou Rafiou (Senior Economist / Study Leader)
Nonesi Golotile (Research Assistant)
Mawande Jiyana (Research Assistant)
Nomzamo Kolo (Research Assistant)
Unathi Lutshaba (Research Assistant)
Vukani Nkasa (Research Assistant)
Vuyokazi Tyida (Research Assistant)
VII
THE GlOBAl EcONOMYIn 2008, the growth of the world economy fell from 3.8 percent in 2007 to 2.2 percent.
At the beginning of the year 2009, the common expectation was that global growth
would slow further to reach the lowest rate since World War II. Global output and trade
plummeted in the last months of 2008 as the contagion set off by the United States (US)
financial crisis spread from the developed world to emerging economies.
The world economy has started to enter recovery due to high-frequency indicators
pointing to stronger growth in the second half of the year and global activity rising by
3 percent during the second quarter of 2009, from a 6.5 percent contraction in the first
quarter. However, employment continues to drop, household wealth continues to decline
and consumer demand continues to go down owing to the high rate of bankruptcies
in companies. Worldwide, disruption in the provision of credit has curtailed household
spending and business investment.
THE SOUTH AFRIcAN EcONOMYIn the mid 2000s, South Africa experienced unprecedented levels of growth which were
underpinned by favorable external conditions coupled with strong domestic demand and
rapid credit extension. These conducive conditions raised growth to 5 percent on average
in 2004 to 2007 and lowered the rate of unemployment by approximately 5 percentage
points, while strengthening public finances and maintaining single-digit inflation, and
improving external reserves.
Despite these positive results yielded by prudent economic policies, South Africa still
faces a number of medium-term challenges. The country’s output growth has remained
lower than in many Emerging Market Economies (EMEs), even during the economic
expansion. Strong employment growth over the same period failed to bring down a very
high unemployment rate of over 23 percent despite the lower labor-force participation
compared to other emerging economies. Another challenge that plagued South Africa
was increasing income inequality, which is still among the highest in the world.
Output and demand remain weak in spite of the slow recovery in the economy. In the
fourth quarter of 2008, output contracted by 1.8 percent quarter-on-quarter (Q-on-Q)
and by more than 6.7 percent in the first quarter of 2009. The annual output for 2009 is
expected to contract further by about 2 percent, with a slow recovery towards the end of
the year. It would not be until 2011 before output starts to show strong signs of recovery,
when it is expected to tread at about 3.8 percent before climbing to about 4.2 percent in
2012 and 4.5 percent in 2013. While the projected growth may be disappointing in light of
the experience of the mid-2000s, it is still encouraging given the severity of the external
shocks.
THE EASTERN cAPE EcONOMYThe Eastern Cape output is expected to remain fragile in spite of the slow recovery in the
economy. The outlook shows that by 2010, the Eastern Cape Province would again start
seeing positive growth as global recovery and consumption levels improve to those last
seen before the financial crisis. The province’s output would start showing relative strong
signs of recovery by 2011, when it is expected to tread at about 3.5 percent before rising
ExEc
UTI
VE S
UM
MA
RY

VIII
ExEc
UTI
VE S
UM
MA
RY
to about 3.9 percent in 2012 and 4.2 percent in 2013.
Growth in fixed investment spending contracted in 2009, registering an annual growth
rate of 2.04 percent from 12.44 percent in 2007. Nevertheless, while the growth rates
in investment in assets remain relatively strong, the trend is clearly declining. While
total fixed investment spending for 2009 is likely to disappoint, forecasts pronounce a
rebound in 2011, 2012 and 2013 due to government’s investment plan. In line with the
total investment in the Eastern Cape, machinery and other equipment would contract in
2009 and bounce back from 2010 onwards due to the global economic recovery and rising
investment confidence.
Building and construction was the second-largest contributor to the total gross domestic
fixed investment in the Eastern Cape for the past 14 years. In 2009/10, a decline is
expected as most construction projects would be completed for the 2010 World Cup.
Given the rural development priorities of national government, investment in building and
construction is expected to start showing signs of improvement from 2011 and pick up
further in 2012 before declining slightly in 2013.
The average annual contribution of transport equipment to the total gross domestic fixed
investment was about 14 percent between 1995 and 2008. In 1996, this sector of fixed
investment observed negative growth of about minus 2 percent associated with the first
South African currency crisis, before an all-time low of approximately minus 27 percent
in 1999 from 11 percent growth the previous year. This sector proves susceptible to both
domestic and international macroeconomic shocks. Projections show that investment in
transport equipment would improve from 2009 onwards, with robust growth rates from
2010 to 2013.
The Eastern Cape is ranked fourth in terms of consumption expenditure after KwaZulu-
Natal. The total spending growth in the province declined from 8.9 percent in 2006 to 8.6
percent in 2007, before plummeting to 0.9 percent in 2008 and is expected to contract by
0.7 percent in 2009. Final consumption is expected to start improving from 2010, given
the easing in monetary policy and the improving economic climate.
STRATEGIc INITIATIVESThe Eastern Cape Province faces a number of challenges such as underdevelopment,
high unemployment, high dependency ratios, high poverty levels, and a skewed economic
structure. This is a province which is more than 60 percent rural and yet is driven by
the tertiary sector, with a total contribution of more than 70 percent to the economy
– a serious anomaly. There is a dire need to reconfigure the structure of the provincial
economy. The starting point in this undertaking is to consider the natural comparative
advantage of the province such as land endowment and favourable climatic conditions.
The province needs to revive its primary sector and invest in market-oriented agricultural
infrastructure. This includes infrastructure that supports on-farm production (irrigation,
energy, transportation, pre- and post-harvest storage), ensures efficient trading and
exchange (telecommunications, covered markets), adds value to the domestic economy
(agro-processing and packaging facilities), and enables produce to move rapidly and
efficiently from farmgate to processing facilities, and on to wholesalers (transportation
and bulk storage).

IX
NB. All figures are at constant 2000 prices
NATIONAl
SOUTH AFRIcAN GROSS DOMESTIc PRODUcT FOREcASTS
2007 2008 2009 2010 2011 2012 2013
Annual Growth Rate (%) 5.1 3.1 -2.0 2.0 3.8 4.2 4.5
GDP* (Rm) 1,233,930 1,271,717 1,246,111 1,270,787 1,319,577 1,375,619 1,437,222
FINAl cONSUMPTION ExPENDITURE BY HOUSEHOlD FOREcASTS
2008 2009 2010 2011 2012 2013
Annual Growth Rate (%) -2.2 2.3 3.8 4.2 4.5
FCEH* (Rm) 864,346 845,330 864,773 897,633 935,335 977,426
PUBlIc FIxED INVESTMENT FOREcASTS
2008 2009 2010 2011 2012 2013
Annual Growth Rate (%) 7.1 5.7 7.5 7.8 -0.1
Gross Fixed Pub. Inv.* (Rm) 95,379 102,182 108,017 116,123 125,181 125,038
PRIVATE FIxED INVESTMENT FOREcASTS
2008 2009 2010 2011 2012 2013
Annual Growth Rate (%) 1.3 1.3 3.8 5.6 5.2
Gross Fixed Priv. Inv.* (Rm) 189,416 191,902 194,430 201,896 213,221 224,206
PRIcE (ANNUAl PERcENTAGE cHANGE)
FOREcASTS
2007 2008 2009 2010 2011 2012 2013
CPI inflation (annual average) 7.1 11.5 7.1 5.9 5.1 4.4 4.5
GDP deflator 9 10.8 7.5 8.6 7.1 6 5.9
PPI (annual average) 10.9 14.3 1.4 5.3 5.8 5.6 5.5
MONETARY SEcTOR AND ExcHANGE RATE FOREcASTS
2007 2008 2009 2010 2011 2012 2013
Repo Rate (year-end %) 11 11.5 7 8.5 7 7 7
USD / ZAR (annual average) 7.06 8.25 8.62 8.26 8.58 9 9.44
EUR / ZAR (annual average) 9.66 12.13 11.7 11.5 12.15 13.12 13.5
lABOUR MARKET (ANNUAl PERcENTAGE cHANGE)
FOREcASTS
2007 2008 2009 2010 2011 2012 2013
Population Growth Rate 1.1 1.1 1.07 1.04 1.04 1.05 1.05
Unemployment Growth Rate 22.7 21.9 24.9 24.3 23.4 22.1 20.7
Employment Growth Rate 0 10.2 1.1 0.4 1.4 1.8 1.8
Nominal Unit Labour Cost 4.2 11.5 9.2 8.6 5.3 5.2 5.1(excluding agriculture sectors)
Labour Productivity 2.4 1.1 0.6 0.9 2.3 2.3 2.5 (excluding agriculture sectors)
FORE
cA
STS

X
PUBlIc FINANcE DATA FOREcASTS
2006/7 2007/8 2008/9 2009/10 2010/11 2011/12
Feb 2008 Revised Actual Actual Budget Estimates Medium Term Estimates
National Government (Rb)
Deficit ( - ) / Surplus ( + ) 11 18.3 14.3 -22.8 -95.6 -83.3 -67.7
Revenue 481.2 559.8 625.4 611.1 643 7.9.1 781.2
Expenditure 470.2 541.5 611.1 633.9 738.6 792.4 849
As a percentage of GDP
Deficit ( - ) / Surplus ( + ) 0.6 0.9 0.6 -1 -3.9 -3.1 -2.3
State Debt Cost 2.9 2.6 2.2 2.4 2.2 2.2 2.3
Total Net Loan Debt 26.4 23.4 19.7 22.6 25.6 27.1 27.4
PSBR* -0.3 -0.6 1.2 3.9 7.5 6.5 5.3
FORE
cA
STS
EASTERN cAPE
GDP_R FOREcASTS
2007 2008 2009 2010 2011 2012 2013
Annual Growth Rate (%) 2.7 -2.4 1.6 3.5 3.9 4.2
GDP_R* (Rm) 96,704 99,269 96,922 98,499 101,954 105,973 110,424
GROSS DOMESTIc FIxED INVESTMENT (GDFI) FOREcASTS
2007 2008 2009 2010 2011 2012 2013
GDFI Growth Rate (%) 7.3 2.7 2 8.1 9.4 7.3
GDFI share of GDP (%) 19.2 20 21.1 21.1 22.1 23.3 24
GDFI (Rm) 18,521 19,879 20,408 20,825 22,521 24,646 26,453
GROSS DOMESTIc FIxED INVESTMENT: MAcHINERY AND OTHER EqUIPMENT FOREcASTS
2007 2008 2009 2010 2011 2012 2013
Annual Growth Rate (%) 10 -0.2 7.6 10.8 9.7 10
Machinery and Other Equipment (Rm) 7,418 8,157 8,137 8,852 9,696 10,637 11,696
GROSS DOMESTIc FIxED INVESTMENT: BUIlDING AND cONSTRUcTION FOREcASTS
2007 2008 2009 2010 2011 2012 2013
Annual Growth Rate (%) 11.4 3 -0.9 0.6 8.3 7.6
Buildings and Construction Works (Rm) 7,670 8,545 8,797 8,721 8,774 9,505 10,231
GROSS DOMESTIc FIxED INVESTMENT: TRANSPORT EqUIPMENT FOREcASTS
2007 2008 2009 2010 2011 2012 2013
Annual Growth Rate (%) -3.9 1.8 3.8 10.3 11.3 9.2
Transport Equipment (Rm) 2,910 2,796 2,847 2,955 3,260 3,629 3,962
XI
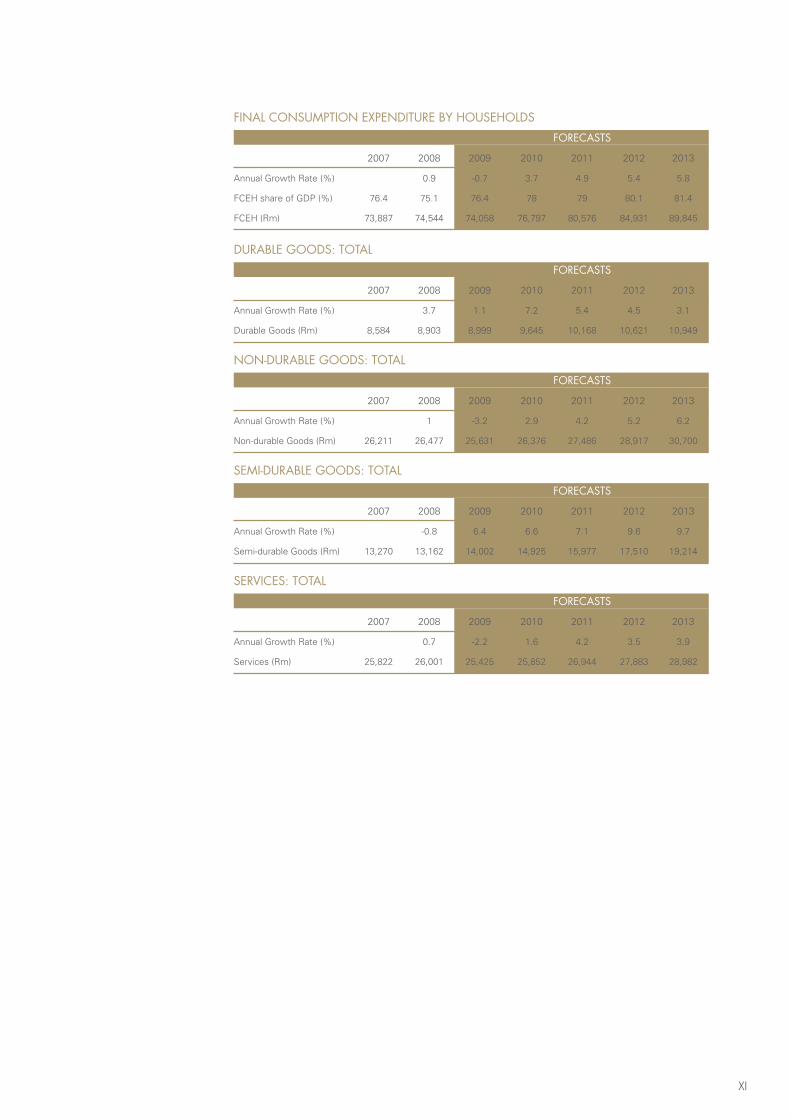
FINAl cONSUMPTION ExPENDITURE BY HOUSEHOlDS FOREcASTS
2007 2008 2009 2010 2011 2012 2013
Annual Growth Rate (%) 0.9 -0.7 3.7 4.9 5.4 5.8
FCEH share of GDP (%) 76.4 75.1 76.4 78 79 80.1 81.4
FCEH (Rm) 73,887 74,544 74,058 76,797 80,576 84,931 89,845
DURABlE GOODS: TOTAl FOREcASTS
2007 2008 2009 2010 2011 2012 2013
Annual Growth Rate (%) 3.7 1.1 7.2 5.4 4.5 3.1
Durable Goods (Rm) 8,584 8,903 8,999 9,645 10,168 10,621 10,949
NON-DURABlE GOODS: TOTAl FOREcASTS
2007 2008 2009 2010 2011 2012 2013
Annual Growth Rate (%) 1 -3.2 2.9 4.2 5.2 6.2
Non-durable Goods (Rm) 26,211 26,477 25,631 26,376 27,486 28,917 30,700
SEMI-DURABlE GOODS: TOTAl FOREcASTS
2007 2008 2009 2010 2011 2012 2013
Annual Growth Rate (%) -0.8 6.4 6.6 7.1 9.6 9.7
Semi-durable Goods (Rm) 13,270 13,162 14,002 14,925 15,977 17,510 19,214
SERVIcES: TOTAl FOREcASTS
2007 2008 2009 2010 2011 2012 2013
Annual Growth Rate (%) 0.7 -2.2 1.6 4.2 3.5 3.9
Services (Rm) 25,822 26,001 25,425 25,852 26,944 27,883 28,982

1
1 GLOBAL ECONOMIC OUTLOOK AND FORECAST METHODOLOGY
1.1 GLOBAL ECONOMIC OUTLOOKThe economic data showed that in 2008, the growth of the world economy fell from 3.8
percent in 2007 to 2.2 percent. At the beginning of the year 2009, the common expectation
was that global growth would slow further this year to reach the lowest rate since World
War II. Global output and trade plummeted in the last months of 2008 as the contagion set
off by the United States (US) financial crisis spread from the developed world to emerging
economies.
According to the October 2009 World Economic Outlook, the world economy has started
to enter recovery due to high-frequency indicators pointing to stronger growth in the
second half of the year and global activity rising by 3 percent during the second quarter of
2009 from a 6.5 percent contraction in the first quarter. However, employment continues
to drop, household wealth continues to decline and consumer demand continues to go
down owing to the high rate of bankruptcy in companies. Worldwide, disruption in the
provision of credit has curtailed household spending and business investment.
1.1.1 USA
The US economy is forecast to contract by 2.75 percent in 2009 due to the sharp
contraction during the first half of the year. As 2009 progressed, output data confirms that
the U.S. economy is stabilising owing to the result of the monetary, financial and fiscal
policy interventions which helped stabilise consumer spending, the housing default rate
and financial markets. Despite these positive upshots, business investment continues to
sink, the savings rate is still climbing and the markets remain stressed.
These events will collectively depress investment and consumption. Intertwining these
occurrences with the impact of rising unemployment, it is apparent that growth will remain
lethargic, reaching 1.5 percent for the entire year of 2010. The short-lived nature of the
fiscal stimulus and subdued growth in tradingpartnereconomies also play a considerable
role in depressing growth further. A number of developments, including the rise of more
than 10 percent in the level of unemployment in the second half of 2010 and a core
inflation of below 1 percent through the greater part of the year, are expected.
2
There is great uncertainty around the near-term outlook for the economy, which
is underpinned by the scale of shocks and the hazy outlook for the rest of the world.
However, the strong policy response and a rapid recovery in emerging markets could
reverse the uncertainty that has plagued the U.S. economy, leading to a healthy rise
in confidence, improving financial conditions and promoting strong aggregate demand
growth. Although the economic turmoil is easing, downside risks still remain a concern.
In particular, continued cutting down on household debt, also known as deleveraging,
and rising unemployment, may have serious ramifications on consumption than initially
forecast. Also, accelerating corporate and commercial property defaults could delay the
improvement in financial conditions.
The medium-term outlook sees potential growth likely to fall below 2 percent for a
considerable time. History tells that previous financial crises are followed by large
permanent output losses relative to precrisis trends due to the nature of impaired financial
systems, which generally take time to heal. In return, this slows down investment and
innovation. High cyclical unemployment could also raise structural unemployment. On the
demand side, although the personal saving rate has already climbed to about 5 percent, it
may have to rise further given the need to rebuild the balance sheets of households.
The fiscal legacy of the crisis is a high and rising debt trajectory that could become
unsustainable without significant medium-term measures. Such financial crises give birth
to high and rising debt trails that also pose the risk of being unsustainable if no adequate
medium-term measures are put in place.
Forecasts show that deficits will be around 10 percent of gross domestic product
(GDP) for the period 2009/10 and 2010/11. However, it’s not all gloom and doom; the
economic climate shows that these deficits will gradually decline to levels below 10
percent afterwards, while the level of gross government debt will continue rising swiftly,
reaching 108.2 percent of GDP by 2014 from 84.8 percent of GDP in 20091. In light of
the impending healthcare and pension pressures brought about by aging population,
this is bad news for the US economy. These pressures are made more transparent by
the current budget proposal, which augments medium-term forecasts by using growth
assumptions that tend to be optimistic. Adjustments may become a necessity to ensure
long-term fiscal sustainability, particularly on the revenue side, considering that non-
defence optional spending is approaching historical lows. The critical state of the U.S.
healthcare system cannot be ignored. It is plagued by inefficiencies, as proven by the fact
that similar healthcare results are achieved at different costs across the U.S. states. This
necessitates that coverage be expanded in a budget-neutral manner, and that measures
to curb the rate of cost growth be put in place to help preserve debt sustainability.
1.1.2 JAPAN
Japan’s ongoing dependence on exports is the primary cause of the abrupt impact of the
global downturn on its economy. As the worldwide credit crunch pinched off external
demand, export of goods and services plunged by 35 percent in December 2008 from
the previous year. Industrial output fell by 9.4 percent in December following a decrease
of 8.5 percent in November. Industries which were particularly hit are transport (including
automotive), machinery and electrical-equipment manufacturing.
1 IMF World Economic Outlook, October 2009
3
Firmly entrenched in recession territory last year, Japan’s economy returned to growth
(2.3 percent) in the second quarter of 2009 after a range of fiscal stimulus measures by
the government. On average, Japan’s economy is expected to shrink by 5.4 percent in real
terms in 2009, with sluggish growth of 1.7 percent in 2010. Inflation will remain negative
until 2012, given the significant slack in the economy.
1.1.3 CHINA
China’s economic growth rate would slow in 2009. GDP growth fell to 6.8 percent in the
fourth quarter of 2008, down from 9 percent in the third quarter. Growth is forecast to
chug along at 8.5 percent in 2009 and 9.0 percent in 2010. While this appears positively
robust compared to the rest of the world, it is less than the strong 13-percent rate the
country achieved in 2007. Exports to the West have slowed, but a number of other factors
have contributed to China’s economic deceleration. The housing construction industry has
come to a virtual standstill as a result of the government’s efforts to deflate a potential
real-estate bubble. The government has introduced a number of fiscal stimulus measures,
such as transportation investment (which is expected to be expanded by 70 percent in
2009), public housing spending, rebates on purchases of consumer goods and additional
healthcare. The inflation rate is expected to be around an annual average of minus 0.1 in
2009 and 0.6 percent in 2010. The current-account surplus would remain substantial, but
is likely to fall to 7.8 percent of GDP in 2009 and rise to 8.6 percent in 2010.
1.1.4 INDIA
India’s economy is expected to slow in 2009. After dropping from a growth rate of 9.4
percent in 2007 to 7.3 percent in 2008, 2009 is expected to post gains of only 5.4 percent,
while the growth rate for the coming year is expected to be about 6.4 percent. India
continues to face inflationary pressures from high resource utilisation and strong credit
growth. The inflation rate jumped from 6.4 percent in 2007 to 8.3 percent in 2008, and is
expected to reach 8.7 percent in 2009 before decreasing slightly to around 8.4 percent in
2010. The country’s current-account balance stood at minus 2.2 percent of GDP in 2008. It
is expected to be flat in 2009 and drop to minus 2.5 percent of GDP in 2010. In an attempt
to boost liquidity, the government has eased restrictions on lending in the property sector
and increased the availability of export credit finance.
In summary, the risks associated with growth are steadily becoming domesticated. Most
of the improvement in activity is still owed to measures that could turn out to be short-
lived, such as the rebounding capital markets, adjustment in inventory, and expansionary
fiscal and monetary policy. The risk that these factors bring is a recovery that will not be
self-sustaining unless activity spreads to other regions. On the positive side, the policy
stimulus in China could shore up recoveries in other parts of Asia.
The greatest challenge that still lies ahead is the timing of the withdrawal of policy support.
Two questions that would need careful consideration are when and how to withdraw
policy support while ensuring a successful transition to more balanced, medium-term
growth. The dependence of Asia on export demand has resulted in the global imbalances
that have made the region susceptible to developments in demand. This in turn would
force the growth composition to be driven by internal demand as global demand proves
unlikely to pick up in the short-term.
4
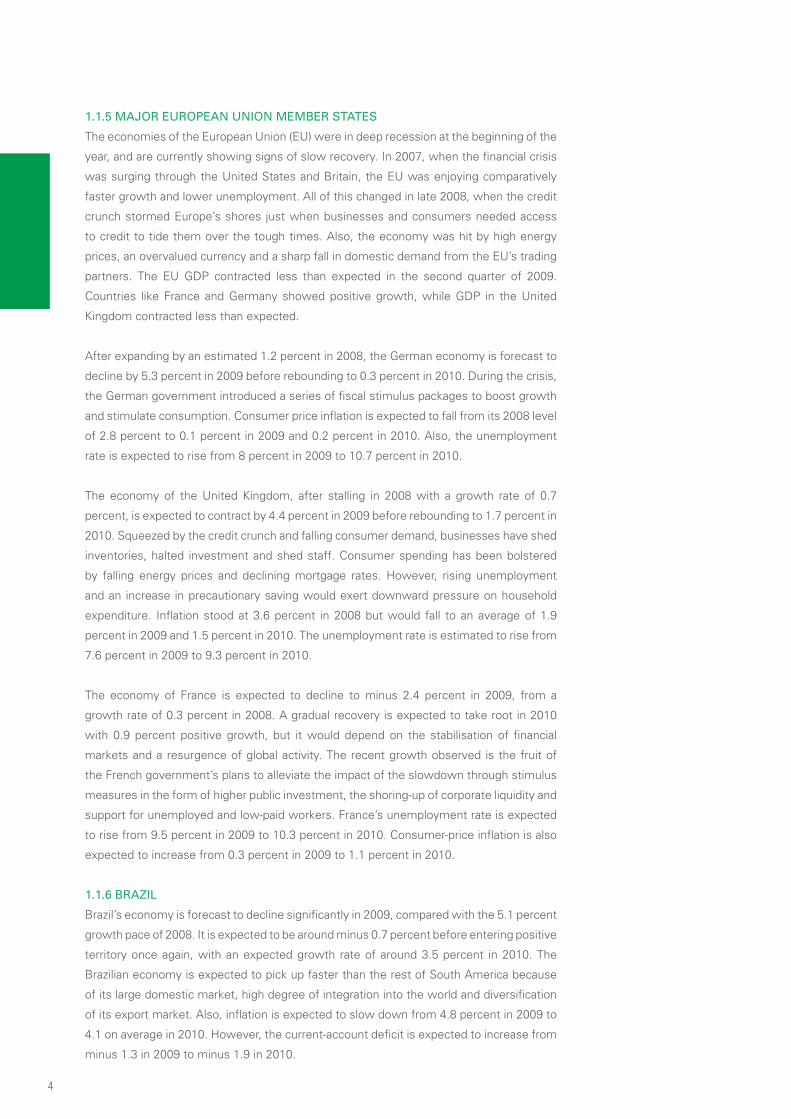
1.1.5 MAJOR EUROPEAN UNION MEMBER STATES
The economies of the European Union (EU) were in deep recession at the beginning of the
year, and are currently showing signs of slow recovery. In 2007, when the financial crisis
was surging through the United States and Britain, the EU was enjoying comparatively
faster growth and lower unemployment. All of this changed in late 2008, when the credit
crunch stormed Europe’s shores just when businesses and consumers needed access
to credit to tide them over the tough times. Also, the economy was hit by high energy
prices, an overvalued currency and a sharp fall in domestic demand from the EU’s trading
partners. The EU GDP contracted less than expected in the second quarter of 2009.
Countries like France and Germany showed positive growth, while GDP in the United
Kingdom contracted less than expected.
After expanding by an estimated 1.2 percent in 2008, the German economy is forecast to
decline by 5.3 percent in 2009 before rebounding to 0.3 percent in 2010. During the crisis,
the German government introduced a series of fiscal stimulus packages to boost growth
and stimulate consumption. Consumer price inflation is expected to fall from its 2008 level
of 2.8 percent to 0.1 percent in 2009 and 0.2 percent in 2010. Also, the unemployment
rate is expected to rise from 8 percent in 2009 to 10.7 percent in 2010.
The economy of the United Kingdom, after stalling in 2008 with a growth rate of 0.7
percent, is expected to contract by 4.4 percent in 2009 before rebounding to 1.7 percent in
2010. Squeezed by the credit crunch and falling consumer demand, businesses have shed
inventories, halted investment and shed staff. Consumer spending has been bolstered
by falling energy prices and declining mortgage rates. However, rising unemployment
and an increase in precautionary saving would exert downward pressure on household
expenditure. Inflation stood at 3.6 percent in 2008 but would fall to an average of 1.9
percent in 2009 and 1.5 percent in 2010. The unemployment rate is estimated to rise from
7.6 percent in 2009 to 9.3 percent in 2010.
The economy of France is expected to decline to minus 2.4 percent in 2009, from a
growth rate of 0.3 percent in 2008. A gradual recovery is expected to take root in 2010
with 0.9 percent positive growth, but it would depend on the stabilisation of financial
markets and a resurgence of global activity. The recent growth observed is the fruit of
the French government’s plans to alleviate the impact of the slowdown through stimulus
measures in the form of higher public investment, the shoring-up of corporate liquidity and
support for unemployed and low-paid workers. France’s unemployment rate is expected
to rise from 9.5 percent in 2009 to 10.3 percent in 2010. Consumer-price inflation is also
expected to increase from 0.3 percent in 2009 to 1.1 percent in 2010.
1.1.6 BRAZIL
Brazil’s economy is forecast to decline significantly in 2009, compared with the 5.1 percent
growth pace of 2008. It is expected to be around minus 0.7 percent before entering positive
territory once again, with an expected growth rate of around 3.5 percent in 2010. The
Brazilian economy is expected to pick up faster than the rest of South America because
of its large domestic market, high degree of integration into the world and diversification
of its export market. Also, inflation is expected to slow down from 4.8 percent in 2009 to
4.1 on average in 2010. However, the current-account deficit is expected to increase from
minus 1.3 in 2009 to minus 1.9 in 2010.
5
1.2 THE THEORETICAL FRAMEWORK OF THE SOUTH AFRICAN MACRO-MODELThe model used is a Keynesian demand-side model, and was built to provide a theoretical
structure for understanding the linkages between key macro-economic variables. The
following four sectors of the South African economy are modelled:
The real sector, including the external sector, estimates private consumption and •
investment, total government expenditure, and exports and imports to determine an
aggregate demand function for the economy;
The monetary sector deals with the estimation of the main monetary variables, •
namely the broad monetary aggregate;
The price-sector estimates equations, which try to capture the influencing factors on •
the domestic price level; and
The labour sector could not be estimated because of the poor quality of available •
data.
The starting point for specifying the real sector of a comprehensive macro-econometric
model for any economy is the national identity from the national accounts. The national
identity, or aggregate demand for domestic consumption, is the sum of consumption,
investment, government expenditure and the trade balance:
Y = C + I + G + (X - M)
where,
Y is the real GDP; C is the final consumption expenditure by household; I is the real
private investment expenditure and G is the real government expenditure. X denotes real
exports and M real imports. Additional equations provide links between these demand-
side equations. These linking equations would include the consumer-price index and the
producer-price index; the GDP deflator (measuring the general price level in the economy);
various Rand exchange rates; interest rates; and employment and the associated wages.
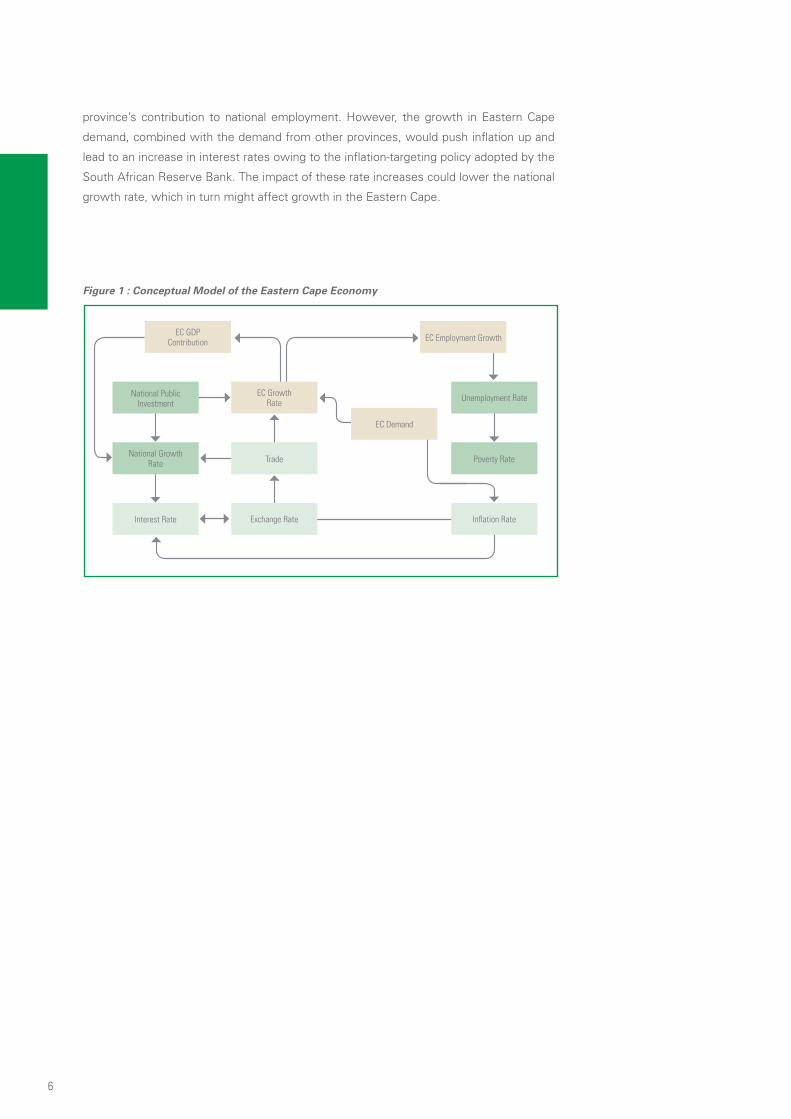
1.3 EASTERN CAPE MODEL CONCEPTUALISATIONThe Eastern Cape economy is not modelled explicitly due to data constraints, but is
inferred from the core target variables generated by the national macro-economic model.
The signs between the variables specify the nature of the expected relationship between
those variables, with the direction of the arrow representing the direction of causality
among variables.
The simple conceptualised model is structured taking into account that the province is part
of the national economy. For this reason, any national developments regarding interest
rates, exchange rates, imports and exports, and the growth rates of other provinces,
would have an impact on the Eastern Cape economy. The increase in the growth rate
and employment would lead to an increase in workers’ incomes, which would stimulate
provincial demand, investment and hence national economic growth. The continued rise
in employment, if sustainable, would reduce the unemployment rate, which in turn would
cumulatively reduce the poverty rate. The growth rate of the province’s output, if it was
more than the national average, would lead to an increase in the province’s contribution
to national output. The rise in Eastern Cape employment would lead to an increase in the
6
province’s contribution to national employment. However, the growth in Eastern Cape
demand, combined with the demand from other provinces, would push inflation up and
lead to an increase in interest rates owing to the inflation-targeting policy adopted by the
South African Reserve Bank. The impact of these rate increases could lower the national
growth rate, which in turn might affect growth in the Eastern Cape.
Figure 1 : Conceptual Model of the Eastern Cape Economy
EC GDPContribution
National PublicInvestment
National GrowthRate
Interest Rate Exchange Rate
Trade
EC GrowthRate
EC Demand
EC Employment Growth
Unemployment Rate
Poverty Rate
Inflation Rate

7

8
9
2 NATIONAL ECONOMIC PERFORMANCE AND OUTLOOK
2.1 OVERVIEW OF CURRENT SITUATIONIn the mid 2000s, South Africa experienced unprecedented levels of growth which were
buoyed by favorable external conditions, coupled with strong domestic demand and rapid
credit extension. These conducive conditions raised growth to 5 percent on average in
2004 to 2007 and lowered the rate of unemployment by approximately 5 percentage
points, while strengthening public finances, maintaining single-digit inflation and improving
the level of external reserves. The favorable economic climate is attributed to sound
macroeconomic policies, which were firmly supported by a consistent and transparent
policy framework.
Despite these positive results, South Africa still faces a number of medium-term
challenges. The country’s output growth has remained lower than in many Emerging
Market Economies (EMEs), even during the 2004 to 2007 economic expansion. Strong
employment growth over the same period failed to bring down a very high unemployment
rate of over 23 percent, even though labour-force participation remains lower than in
other emerging economies. Another challenge that plagued South Africa was increasing
income inequality, which, despite modest improvement, remains among the highest in
the world.
Output and demand remain weak in spite of the slow recovery in the economy. In the
fourth quarter of 2008, output contracted by 1.8 percent quarter-on-quarter (Q-on-Q) and
by more than 6.7 percent in the first quarter of 2009. The contraction in output can be
traced to the dramatic slump in manufacturing and mining output. Residential property
prices continued trending downwards. Consumer spending has fallen, and the short-
term outlook for South Africa remains constricted. Annual output for 2009 is expected to
contract further by about 2 percent, with a slow recovery towards the end of the year as
shown in Table 2.1. The recovery is supported by policy measures that government has
put in place aimed at countering the cycle of the crisis, which have also been dampened
by the weak recovery of demand in trading-partner countries. Projections show that by
2010, the country would again start seeing positive growth as global recovery improves
and commodity prices recede to levels last seen before the crisis. It would not be until
2011 before output starts to show strong signs of recovery, when it is expected to tread
10
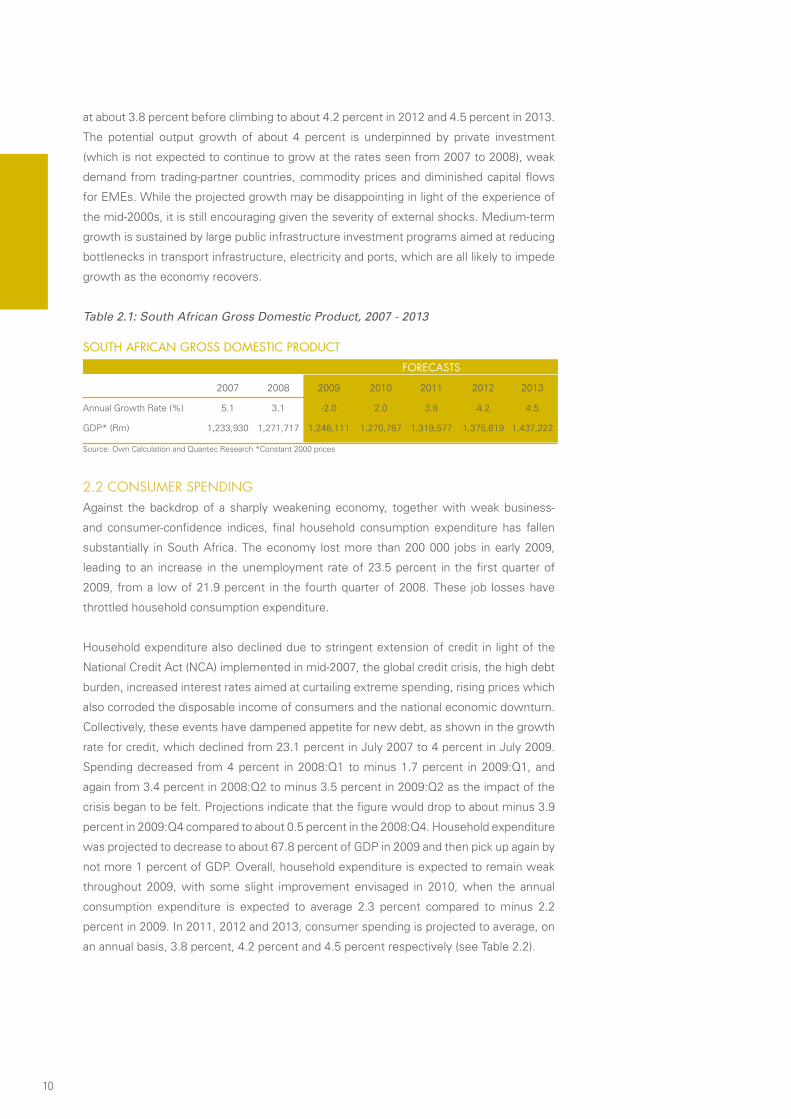
SOUTH AFRICAN GROSS DOMESTIC PRODUCT FORECASTS
2007 2008 2009 2010 2011 2012 2013
Annual Growth Rate (%) 5.1 3.1 -2.0 2.0 3.8 4.2 4.5
GDP* (Rm) 1,233,930 1,271,717 1,246,111 1,270,787 1,319,577 1,375,619 1,437,222
Source: Own Calculation and Quantec Research *Constant 2000 prices
at about 3.8 percent before climbing to about 4.2 percent in 2012 and 4.5 percent in 2013.
The potential output growth of about 4 percent is underpinned by private investment
(which is not expected to continue to grow at the rates seen from 2007 to 2008), weak
demand from trading-partner countries, commodity prices and diminished capital flows
for EMEs. While the projected growth may be disappointing in light of the experience of
the mid-2000s, it is still encouraging given the severity of external shocks. Medium-term
growth is sustained by large public infrastructure investment programs aimed at reducing
bottlenecks in transport infrastructure, electricity and ports, which are all likely to impede
growth as the economy recovers.
Table 2.1: South African Gross Domestic Product, 2007 - 2013
2.2 CONSUMER SPENDINGAgainst the backdrop of a sharply weakening economy, together with weak business-
and consumer-confidence indices, final household consumption expenditure has fallen
substantially in South Africa. The economy lost more than 200 000 jobs in early 2009,
leading to an increase in the unemployment rate of 23.5 percent in the first quarter of
2009, from a low of 21.9 percent in the fourth quarter of 2008. These job losses have
throttled household consumption expenditure.
Household expenditure also declined due to stringent extension of credit in light of the
National Credit Act (NCA) implemented in mid-2007, the global credit crisis, the high debt
burden, increased interest rates aimed at curtailing extreme spending, rising prices which
also corroded the disposable income of consumers and the national economic downturn.
Collectively, these events have dampened appetite for new debt, as shown in the growth
rate for credit, which declined from 23.1 percent in July 2007 to 4 percent in July 2009.
Spending decreased from 4 percent in 2008:Q1 to minus 1.7 percent in 2009:Q1, and
again from 3.4 percent in 2008:Q2 to minus 3.5 percent in 2009:Q2 as the impact of the
crisis began to be felt. Projections indicate that the figure would drop to about minus 3.9
percent in 2009:Q4 compared to about 0.5 percent in the 2008:Q4. Household expenditure
was projected to decrease to about 67.8 percent of GDP in 2009 and then pick up again by
not more 1 percent of GDP. Overall, household expenditure is expected to remain weak
throughout 2009, with some slight improvement envisaged in 2010, when the annual
consumption expenditure is expected to average 2.3 percent compared to minus 2.2
percent in 2009. In 2011, 2012 and 2013, consumer spending is projected to average, on
an annual basis, 3.8 percent, 4.2 percent and 4.5 percent respectively (see Table 2.2).

11
FINAL CONSUMPTION EXPENDITURE BY HOUSEHOLD FORECASTS
2008 2009 2010 2011 2012 2013
Annual Growth Rate (%) -2.2 2.3 3.8 4.2 4.5
FCEH* (Rm) 864,346 845,330 864,773 897,633 935,335 977,426
Source: Own Calculation and Quantec Research *Constant 2000 prices
Table 2.2: Final Consumption Expenditure by Household, 2008-2013
2.3 PUBLIC FIXED INVESTMENTSouth Africa faces a grave challenge because of the ageing of its key infrastructure such
as roads, water and sanitation, and electricity, all of which requires either rehabilitation,
replacement or both. Government has responded to the imminent infrastructure crisis
by investing R787 billion over a period of 3 years. Public Fixed Investment is expected
to increase to a peak of about 9.1 percent as a percentage of GDP in 2012 in order to
relieve critical bottlenecks in electricity and transportation; this includes the purchasing
of locomotives and the upgrading of the main airports and ports. It is then expected to
gradually slow down afterwards to about 8.7 percent as a share of GDP in 2013 with
longrun fiscal multipliers. The investment would help support output in the short term,
creating jobs in 2009 and 2010 while maintaining the confidence of both domestic and
external sources of finance that fund the Public Sector Borrowing Requirement (PSBR).
Spending could also be prioritised to speed up service delivery, given the widespread
protests against the sluggish delivery of basic services. This infrastructure investment
is made possible by fiscal policies adopted during the previous economic expansion that
resulted in a sharp decline of public debt and debt-servicing costs.
PUBLIC FIXED INVESTMENT FORECASTS
2008 2009 2010 2011 2012 2013
Annual Growth Rate (%) 7.1 5.7 7.5 7.8 -0.1
Gross Fixed Pub. Inv.* (Rm) 95,379 102,182 108,017 116,123 125,181 125,038
Source: Own Calculation and Quantec Research *Constant 2000 prices
Table 2.3: Public Fixed Investment, 2008-2013
2.4 PRIVATE FIXED INVESTMENTPrivate Fixed Investment is expected to average about 15 percent of GDP from 2009 to
2013. This reflects the conservative stance adopted by the private sector, as well as risk-
aversion and low business confidence. The sluggish growth in private fixed investment
is largely due to the cancellation of a number of planned private-sector capital-investment
programmes; deteriorating demand faced by retailers, manufacturers, dealerships and
wholesalers; limited access to credit facilities; concerns over the supply of electricity; and
a weakening residential property market as inventories and production capacities adjust
to weak demand. Figures for the second quarter of 2009 show that loans and advances to
the private sector are expected to approach low levels last seen in the 1960s. The private
sector accounts for approximately 70 percent of total fixed investment in South Africa.
The pressure experienced by the private sector can also be seen in the deceleration of
bank loans and advances to the private sector, from 7.3 percent in March 2009 to 2.2
percent in June 2009.

12
PRIVATE FIXED INVESTMENT FORECASTS
2008 2009 2010 2011 2012 2013
Annual Growth Rate (%) 1.3 1.3 3.8 5.6 5.2
Gross Fixed Priv. Inv.* (Rm) 189,416 191,902 194,430 201,896 213,221 224,206
Source: Own Calculation and Quantec Research *Constant 2000 prices
Table 2.4: Private Fixed Investment, 2008-2013
2.5 LABOUR-MARKET CONDITIONThe unemployment rate in South Africa, which was currently estimated to be 23 percent
and forecast to average about 24.9 percent at the end of 2009, still remains obstinately high
despite the low labourforce participation compared to other emerging-market economies.
Figures published by Statistics South Africa in the Labour Force Survey show that 267 000
jobs were lost between the first two quarters of 2009, with most of the losses recorded in
private households, followed by the informal sector. This decrease in employment did not
translate into an increase in unemployment. However, it increased the number of people
who are not economically active, the majority of whom were discouraged workseekers.
When comparing the employment figures of the second quarter of 2009 to those of
the same period in 2008, there is a decrease of about 2.6 percent in the employment
numbers: an 11 000 increase in the number of unemployed persons and a 724 000
increase in the number of persons who are not economically active, 60 percent of whom
were discouraged work-seekers. As outlined above, most of the job losses were in private
households (105 000), followed by trade (59 000) and agriculture (28 000). All industries
experienced job losses, with the exception of community and social services.
When looking at the year-on-year figures, data shows that trade accounted for 143 000 job
losses, followed by manufacturing (95 000) and agriculture (80 000). Despite the overall
decline in jobs between Q2:2008 and Q2:2009, there were sectors that experienced gains,
such as community and social services (29 000), finance (23 000) and private households
(9 000). The employment growth rate is forecast to average 1.1 percent by the end of
2009, which is very low when compared to the average employment growth rate of 10.2
percent in 2008. Projections reveal that this growth rate would drop to 0.4 percent in
2010, and start picking up in 2011 to slightly above 1 percent and move closer to 2 percent
towards the end of 2012 (see Table 2.5).
The annual nominal unit labour cost in the formal non-agricultural sector of the economy
has exceeded 10 percent since 2008. It averaged 11.5 percent in 2008 after decelerating
from a peak of 13.2 percent in Q3:2008. In the private sector, the average nominal unit
labour cost decreased to 10.5 percent in 2008 till the first quarter of 2009, and to 11.7
percent in the public sector. In the private sector, the annual nominal unit labour cost
exceeded the upper band of the inflation target. Forecasts indicate that the average
nominal labour cost would fall from 2009, in line with the economic downturn, reaching
levels of about 5.1 percent in 2013.
In response to the contraction in the economy, labour productivity is forecast to decrease
to an average of 0.6 percent in 2009 due to a sharp decline in external demand and a
slump in the prices of major export commodities brought about by the global economic

13
LABOUR MARKET (ANNUAL PERCENTAGE CHANGE)
FORECASTS
2007 2008 2009 2010 2011 2012 2013
Population Growth Rate 1.1 1.1 1.07 1.04 1.04 1.05 1.05
Unemployment Growth Rate 22.7 21.9 24.9 24.3 23.4 22.1 20.7
Employment Growth Rate 0 10.2 1.1 0.4 1.4 1.8 1.8
Nominal Unit Labour Cost 4.2 11.5 9.2 8.6 5.3 5.2 5.1(excluding agriculture sectors)
Labour Productivity 2.4 1.1 0.6 0.9 2.3 2.3 2.5(excluding agriculture sectors)
Source: Own Calculation and Quantec Research
Table 2.5: Labour Market, 2007-2013
Table 2.6: Price Inflation, 2007-2013
downturn. However, in 2011, labour productivity is expected to pick up as the global
economic recovery becomes more apparent, with the demand for goods and services
returning to pre-crash levels.
2.6 INFLATIONWeak economic activity and falling commodity prices have lowered inflation, albeit at a
much slower rate than anticipated. Inflation has been out of the 3-to-6 percent target band
set by the reserve bank since 2007, and picked up to an annual average of 11.5 percent
in 2008. Consumer Price Index (CPI) inflation is expected to return to an annual average
of 7.1 percent, the rate last observed in 2007, although it still remained sticky above the
inflation target. The slower rate of disinflation reflects a combination of factors, including
the larger-than-expected exchange-rate depreciation in the fourth quarter of 2008, the
strong oil-price increases in the first six months of 2009 and retrospective wage indexation
that resulted in substantial wage increases. In 2009, annual wages grew by more than
10 percent, with entities such as Eskom recording 23 percent. Among other things that
contributed to the stubborn inflation rate was price-fixing by some companies, as noted
by the Competition Commission. The electricity tariffs requested by Eskom contributed
significantly to the high rate of producer-price inflation, despite the significant decreases
in the overall Producer Price Index (PPI) inflation, as observed in Table 2.6 below.
PRICE (ANNUAL PERCENTAGE CHANGE) FORECASTS
2007 2008 2009 2010 2011 2012 2013
CPI inflation (annual average) 7.1 11.5 7.1 5.9 5.1 4.4 4.5
GDP deflator 9 10.8 7.5 8.6 7.1 6 5.9
PPI (annual average) 10.9 14.3 1.4 5.3 5.8 5.6 5.5
Source: Own Calculation and Quantec Research
2.7 MONETARY POLICY AND INTEREST RATESOn 19th July 2009, the new Governor of the South African Reserve Bank (SARB),
Ms. Gill Marcus, was appointed. Marcus is no stranger to the SARB, as she served as
Deputy-Governor from 1999 to 2004 before her departure in 2004.

14
A number of changes on the monetary policy front were observed in 2009. The inflation
measure targeted by the SARB was changed from CPIX to a revamped CPI. The revamped
CPI was reweighted with the introduction of new expenditure weights and rebased so that
2008 = 100. It also marked the introduction of the Classification of Individual Consumption
by Purpose (COICOP), which replaces the International Trade Classification (ITC).
The feeble economic activity in 2009 hampered the global prices of commodities and
helped to lower inflation, albeit at a much slower pace. Despite remaining outside the
3-to-6 percent target band since 2007, inflation is projected to return to the band only in
2010, when the annual average is expected to hover around 5.9 percent. The currency
depreciation, the increases in the oil price and wage indexation created inflationary
pressures in 2008 and 2009. With all these challenges, the SARB responded by easing
monetary policy, which resulted in a 450-basis-point cut in the repo rate between December
2008 and June 2009. These policy rate cuts have yielded positive effects in reviving the
real economy. Further rate cuts were anticipated after June 2009, but the Monetary Policy
Committee (MPC) chose to tread carefully by leaving the repo rate unchanged, arguing
that inflation-related risks still remained.
There are still a number of challenges facing South Africa. First, the current-account deficit
is expected to widen from about minus 6 percent of GDP in 2009 to about minus 7.4
percent of GDP in 2014, which would lead to South Africa relying on portfolio inflows
to make up for the deficit2. Second, the inflation-targeting framework has come under
attack from labour unions, who argue that the mandate of the SARB should be expanded
to include growth and employment. As a result of some of these burning issues, the
Minister of Finance has extended an invitation to key stakeholders to deliberate on the
pros and cons of the inflation-targeting framework currently pursued by the SARB.
Table 2.7: Monetary Sector and Exchange Rate, 2007-2013
MONETARY SECTOR AND EXCHANGE RATE FORECASTS
2007 2008 2009 2010 2011 2012 2013
Repo Rate (year-end %) 11.0 11.5 7.0 8.5 7.0 7.0 7.0
USD / ZAR (annual average) 7.06 8.25 8.62 8.26 8.58 9.00 9.44
EUR / ZAR (annual average) 9.66 12.13 11.70 11.50 12.15 13.12 13.50
Source: Own Calculation and Quantec Research
2.8 FISCAL POLICYThe fiscal policies pursued in previous years, which resulted in a surplus of R14.3 billion in
the 2008/09 financial year and a consistently exceeded tax-revenue target, have yielded a
number of benefits such as: a) a counter-cyclical impact on the economic downturn, b) a
sharp decline in debt-servicing costs and c) the creation of a fiscal space to invest in public
infrastructure and widen the social network. These investment plans, which were drafted
before the global economic downturn, would relieve critical infrastructure challenges with
long-run fiscal multipliers. They are also expected to support demand in the short-term.
However, the anticipated decline in revenue collection and the increase in government
2 IMF 2009
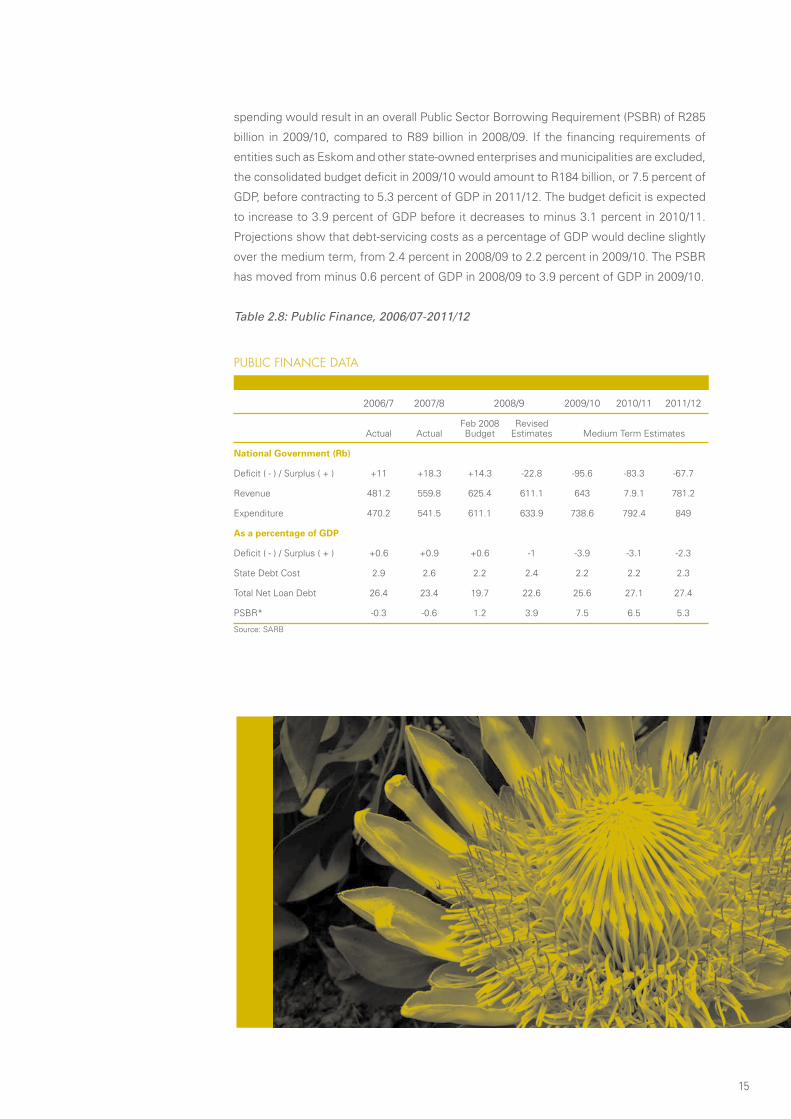
15
spending would result in an overall Public Sector Borrowing Requirement (PSBR) of R285
billion in 2009/10, compared to R89 billion in 2008/09. If the financing requirements of
entities such as Eskom and other state-owned enterprises and municipalities are excluded,
the consolidated budget deficit in 2009/10 would amount to R184 billion, or 7.5 percent of
GDP, before contracting to 5.3 percent of GDP in 2011/12. The budget deficit is expected
to increase to 3.9 percent of GDP before it decreases to minus 3.1 percent in 2010/11.
Projections show that debt-servicing costs as a percentage of GDP would decline slightly
over the medium term, from 2.4 percent in 2008/09 to 2.2 percent in 2009/10. The PSBR
has moved from minus 0.6 percent of GDP in 2008/09 to 3.9 percent of GDP in 2009/10.
Table 2.8: Public Finance, 2006/07-2011/12
PUBLIC FINANCE DATA
2006/7 2007/8 2008/9 2009/10 2010/11 2011/12
Feb 2008 Revised Actual Actual Budget Estimates Medium Term Estimates
National Government (Rb)
Deficit ( - ) / Surplus ( + ) +11 +18.3 +14.3 -22.8 -95.6 -83.3 -67.7
Revenue 481.2 559.8 625.4 611.1 643 7.9.1 781.2
Expenditure 470.2 541.5 611.1 633.9 738.6 792.4 849
As a percentage of GDP
Deficit ( - ) / Surplus ( + ) +0.6 +0.9 +0.6 -1 -3.9 -3.1 -2.3
State Debt Cost 2.9 2.6 2.2 2.4 2.2 2.2 2.3
Total Net Loan Debt 26.4 23.4 19.7 22.6 25.6 27.1 27.4
PSBR* -0.3 -0.6 1.2 3.9 7.5 6.5 5.3
Source: SARB

16
17
3 THE ECONOMY OF THE EASTERN CAPE
3.1 PROFILE OF THE EASTERN CAPE
3.1.1 OVERVIEW
The Eastern Cape is located in the south-eastern part of South Africa and is divided into six
district municipalities, namely: Alfred Nzo, Amatole, Cacadu, Chris Hani, O.R. Tambo, and
Ukhahlamba, and a metropolitan area called Nelson Mandela Bay. More than 60 percent
of the province is rural, a reversal of the national urban/rural average split of 63/37, and
comprises the former homelands of Transkei and Ciskei. It produces about 70 percent
of the world’s mohair. The Eastern Cape provides easy access to four other provinces in
South Africa, namely the Western Cape, the Northern Cape, the Free State and KwaZulu-
Natal, and also shares an international border with the Kingdom of Lesotho.
The province is richly endowed with farming land. The province boasts the deepest
container terminal port in Africa, the newly built deep-water port of Ngqura, adjacent to
the Coega Industrial Development Zone (IDZ), and two other harbours located in East
London River Port and Port Elizabeth. Of the ten principal airports in South Africa, two
are located in this province: one in Port Elizabeth and the other in East London. A total
of 48 582 kilometers of South Africa’s 596 234 kilometers of road, or 14 percent of the
country’s road network, is located in the Eastern Cape. According to the Visual Condition
Index (VCI), a measure used to assess road conditions, the Eastern Cape’s VCI was 51 in
2008, which is considered fair. The condition of road infrastructure has deteriorated over
the past 20 years, falling from an index point of 69 in 1988, which is considered as good,
to 51 in 2008. The rail infrastructure also requires attention as 37 percent of it has been
abandoned, 23 percent is still in good condition, 18 percent is considered fair and 22
percent is in poor condition.
Some of the challenges the province faces include the availability of electricity, water
and sanitation infrastructure. In 2009/10, government set aside a budget of R16.8 billion
for infrastructure development in the province, which would cover roads and logistics
infrastructure, healthcare facilities, education and other social infrastructure.
On the social infrastructure side, there are 23 school districts and further education and
training (FETs) institutions in the province under the Department of Education, making the
18
total number of both school and FETs 6 078. The province has four universities: Nelson
Mandela Metropolitan, Rhodes, Walter Sisulu, and Fort Hare. Access to comprehensive
public healthcare remains one of the key social-health policies of the current administration.
This commitment is reflected by the increasing expenditure on public health. Between
the 2005/06 and 2008/09 financial years, total public health expenditure increased by
16.7 percent annually. By 2009/10, public health spending made up 9 percent of non-
interest spending and 3.7 percent of GDP (PBER, 2009). These financial commitments are
expected to be sustained over the medium term. Despite these rising financial allocations
and progress made in the delivery of public health services, the public healthcare system
continues to face significant challenges, including the increasing burden of diseases
such as HIV and TB, and slow progress towards the achievement of the Millennium
Development Goals, particularly those pertaining to child- and maternal mortality.
In spite of employment challenges in the province, sectors employing the largest proportion
of the province’s population in the second quarter of 2009 were community, social and
personal services (31.7%); wholesale (23.6%); manufacturing (14.8%) and finance,
insurance and business services (9.5%). The province’s unemployment rate dropped from
27.4 percent in the third quarter of 2008 to 26.8 percent in the third quarter of 2009, while
the number of discouraged job-seekers increased over the same period.
Eastern Cape is one of the choice destinations in South Africa, with immaculate city
recreations. In the northern part of the province lie the Drakensberg Mountains, the Great
Karoo, beaches of the Sunshine Coast and the indigenous forests of the Wild Coast.
East London and Port Elizabeth are ideal for family holidays because of their size and
welcoming environment. The province boasts, among other things, the annual winter
cultural festival that takes place in Grahamstown, premier surf spots, South Africa’s only
ski resort, a museum dedicated to Nelson Mandela, a waterfall plunging into the sea and
the rock art of the San people.
3.1.2 POPULATION SIZE AND AgE DISTRIBUTION
The Eastern Cape is the second-largest province in South Africa, covering a total land area
of 169 056 km2, that is, 13.8 percent of South Africa. With its capital, Bisho, 70 kilometers
from East London, the province is home to approximately 6.6 million people, 87.6 percent
of whom are African, 7.5 percent Coloured, 4.7 percent White and 0.3 percent Asian.
Eastern Cape is the third-most populous province in the country (13.5 percent of the total
population3) after Gauteng and KwaZulu-Natal.
The proportional size (5.3 percent or 716 000) of the population in the 5-9 age cohort is
startlingly much smaller than the proportional size (5.6 percent or 734 000) in the 0-4 age
cohort. Though the population size increases progressively all the way from 10-14 to 15-19
age cohorts, it plunges in the 20-24 to 30-34 age groups and then starts to fall at marginal
rates throughout the rest of the other age cohorts. The age distribution indicates that
children in the 10 to 19 years age cohort constitute the largest proportion (24.3 percent or
approximately 1.6 million) of the provincial population.
Collectively children between the ages of 0 and 19 years constitute about 3.1 million, or
46.9 percent of the total population in the province. If this number is added to the 20-34
3 Mid-year population estimates, 2009
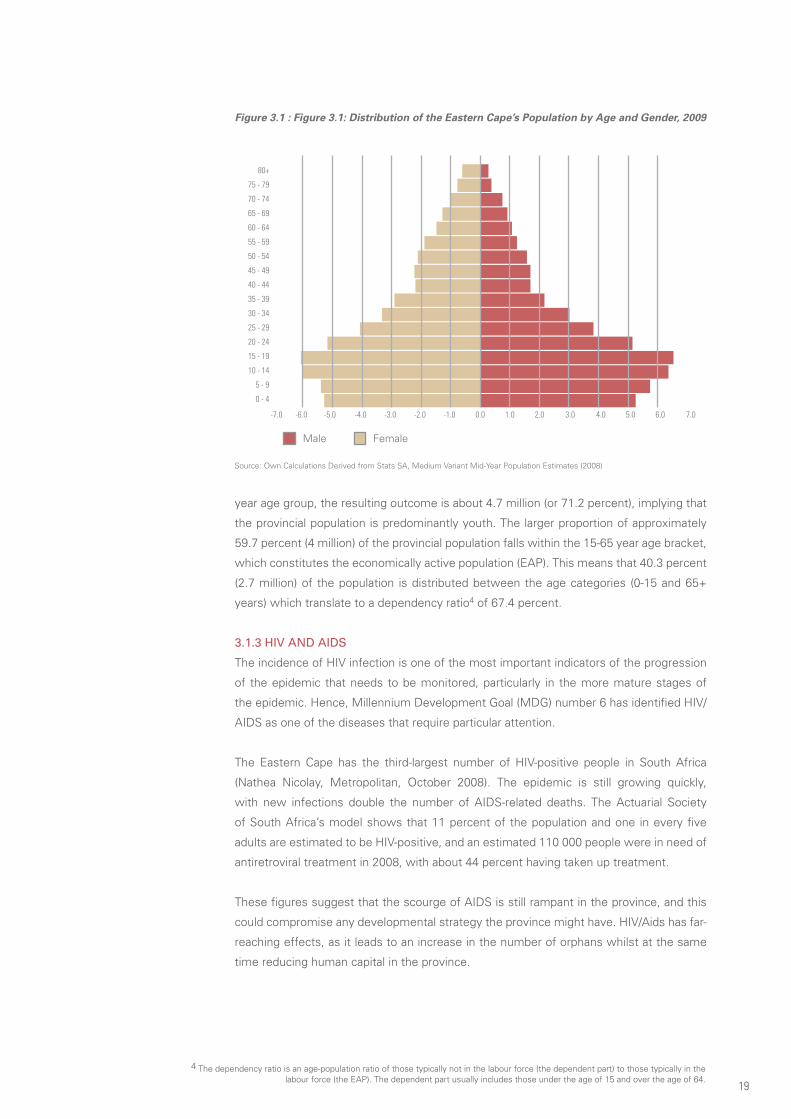
19
Figure 3.1 : Figure 3.1: Distribution of the Eastern Cape’s Population by Age and Gender, 2009
Male Female
Source: Own Calculations Derived from Stats SA, Medium Variant Mid-Year Population Estimates (2008)
year age group, the resulting outcome is about 4.7 million (or 71.2 percent), implying that
the provincial population is predominantly youth. The larger proportion of approximately
59.7 percent (4 million) of the provincial population falls within the 15-65 year age bracket,
which constitutes the economically active population (EAP). This means that 40.3 percent
(2.7 million) of the population is distributed between the age categories (0-15 and 65+
years) which translate to a dependency ratio4 of 67.4 percent.
3.1.3 HIV AND AIDS
The incidence of HIV infection is one of the most important indicators of the progression
of the epidemic that needs to be monitored, particularly in the more mature stages of
the epidemic. Hence, Millennium Development Goal (MDG) number 6 has identified HIV/
AIDS as one of the diseases that require particular attention.
The Eastern Cape has the third-largest number of HIV-positive people in South Africa
(Nathea Nicolay, Metropolitan, October 2008). The epidemic is still growing quickly,
with new infections double the number of AIDS-related deaths. The Actuarial Society
of South Africa’s model shows that 11 percent of the population and one in every five
adults are estimated to be HIV-positive, and an estimated 110 000 people were in need of
antiretroviral treatment in 2008, with about 44 percent having taken up treatment.
These figures suggest that the scourge of AIDS is still rampant in the province, and this
could compromise any developmental strategy the province might have. HIV/Aids has far-
reaching effects, as it leads to an increase in the number of orphans whilst at the same
time reducing human capital in the province.
4 The dependency ratio is an age-population ratio of those typically not in the labour force (the dependent part) to those typically in the labour force (the EAP). The dependent part usually includes those under the age of 15 and over the age of 64.

20
3.1.4 MIgRATION
According to the Stats SA Mid-Year Population Estimates for 2008 and 2009, the Eastern
Cape’s estimates and projections for the period 2006-2011 suggest the total number
of about 415 000 people estimated to have emigrated from the Eastern Cape Province
dropped to approximately 390 000 people in 2009. Over the same period, the estimated
number of immigrants declined slightly, from about 120 000 people to about 117 000
people. This implies that the province’s net loss to other provinces, estimated at about
295 000 people in the 2008 mid-year estimates, is projected to have dropped to
approximately 274 000 people in the 2009 mid-year estimates.
3.2 ECONOMIC OUTLOOK OF THE EASTERN CAPE
3.2.1 ECONOMIC PERfORMANCE AND PROJECTIONS
The Eastern Cape is the fourth-largest economy in South Africa after Gauteng, the Western
Cape and KwaZulu-Natal. It contributed about 7.8 percent to the total economy in 2008,
and showed a strong comovement in terms of growth in the national economy, except for
the period 2001 to 2003.
Figure 3.2: Gross Domestic Product of Eastern Cape
The Eastern Cape economy’s growth has been characterised by upward and downward
cycles from 1996 to 2009, resulting in a combination of possible poverty-level increases
and reductions. On average, the real growth rate for the period 1996 to 2009 was
estimated at 2.6 percent, an indication of a potential reduction in poverty levels during this
period. In line with the unprecedented level of growth in South Africa in the mid-2000s,
the Eastern Cape economy performed relatively well during 1998 to 2000 and 2002 to
2006, registering growth rates from minus 0.4 percent to 4.3 percent and 1.7 percent
to 5.2 percent respectively. This period was characterised by an upswing phase of the
cycle, indicating an increase in initiatives of poverty reduction, and in the income- and
consumption levels of the poor. Between 2000 and 2002, the province registered positive
growth and later on a downswing phase of the cycle, indicating a possible increase in
poverty levels, and a decrease in income- and consumption levels that are linked to a
significant decrease in living standards. From 2006 to 2009, growth in the economy of
the Eastern Cape plummeted from 5.2 percent to minus 2.4 percent owing to the world

21
GDP_R FORECASTS
2007 2008 2009 2010 2011 2012 2013
Annual Growth Rate (%) 2.7 -2.4 1.6 3.5 3.9 4.2
GDP_R* (Rm) 96,704 99,269 96,922 98,499 101,954 105,973 110,424
Source: Own Calculation and Quantec Research
financial crisis and the provincial economy’s dominance by the automotive sector and its
vulnerability to external shocks.
Table 3.1 shows the outlook of the Eastern Cape economy from 2009 to 2013.
Table 3.1: Gross Domestic Product of the Eastern Cape, 2007-2013
The Eastern Cape output is expected to remain fragile in spite of the slow recovery in
the economy. The improvement of the provincial economy would be supported by the
policy measures put in place by the national and provincial governments, and an increase
in consumer confidence levels. Spending related to the 2010 FIFA World Cup, tourism
and tax income generated would support the recovery. Also, the medium-term growth
of the Eastern Cape would be sustained by the large public infrastructure investment
programmes by the national government. These are aimed at easing bottlenecks in
construction and transport infrastructure, electricity, ports and rural development, all of
which are likely to constrict growth as the provincial economy recovers.
The outlook in Table 3.1 shows that by 2010, the Eastern Cape Province would again start
seeing positive growth as global recovery and consumption levels improve to those last
seen before the financial crisis. The province’s output would start showing relative strong
signs of recovery by 2011, when it is expected to tread at about 3.5 percent before rising
to about 3.9 percent in 2012 and 4.2 percent in 2013.
3.2.2 TOTAL INVESTMENT IN THE EASTERN CAPE
The total gross domestic fixed investment (fixed capital formation) in the Eastern Cape
has been underpinned by two sectors, namely machinery and other equipment as well as
building and construction, with a joint contribution of about 83 percent.
The figure below depicts how the growth rate of investment in the Eastern Cape has
evolved from 1996 to 2008, and provides an outlook for 2009 to 2013.
Growth in fixed-investment spending contracted in 2009, registering an annual growth
rate of 2.04 percent, from 12.4 percent in 2007. This is in contrast with the strong and
sustained growth in fixed investment that occurred between 2003 and 2007, which
averaged about 11 percent. The aggressive growth in total fixed investment spending
between 2003 and 2007 is attributed to the combined growth of investment in building
and construction work, transport equipment, machinery and other equipment.
The following table highlights the outlook for the total investment in the Eastern Cape.

22
Figure 3.3: Growth Rate of Investment in the Eastern, 1996-2013
Table 3.2: Total Gross Domestic Fixed Investment of the Eastern Cape, 2007-2013
GROSS DOMESTIC FIXED INVESTMENT (GDFI) FORECASTS
2007 2008 2009 2010 2011 2012 2013
GDFI Growth Rate (%) 7.3 2.7 2 8.1 9.4 7.3
GDFI share of GDP (%) 19.2 20 21.1 21.1 22.1 23.3 24
GDFI (Rm) 18,521 19,879 20,408 20,825 22,521 24,646 26,453
Source: Own Calculation and Quantec Research
Nevertheless, while the growth rates in fixed investment in assets remain relatively
strong, the trend is clearly declining. This is in part indicative of the fact that public-sector
fixed-investment spending is already on a downward trend until 2010. The inability of
some public-sector entities to spend allocated capital budgets efficiently may also affect
the total fixed investment of the province. However, the outlook for total fixed investment
is encouraging. While total fixed-investment spending for 2009 is
likely to disappoint, forecasts pronounce a rebound in 2011, 2012 and 2013 due to
government’s investment plan as outlined in the medium-term strategic framework, as
well as private investment flowing from Coega and the East London IDZ.
3.2.2.1 Machinery and other equipment
Machinery and other equipment has been the leading contributor to total gross domestic
fixed investment in the Eastern Cape, with an annual average contribution of about
44 percent between 1995 and 2008. For the years 1997 to 2004, the annual average
contribution of this sector to total gross domestic fixed investment was around 46 percent,
reaching a historical high of 48 percent in 2002, before reverting back to an annual average
contribution of 42 percent between 2005 and 2008. The annual average growth for the
period 1995 to 2000 was about 8.3 percent, with a growth rate of about
16 percent recorded in 1995, before declining to 4.2 percent in 2000. In 1998, the average
growth in machinery-and-other-equipment investment dropped to a record low of about
0.1 percent before rebounding in 1999 to about 4.2 percent. Overall, the growth of
investment in machinery and other equipment has been characterized by unsteadiness
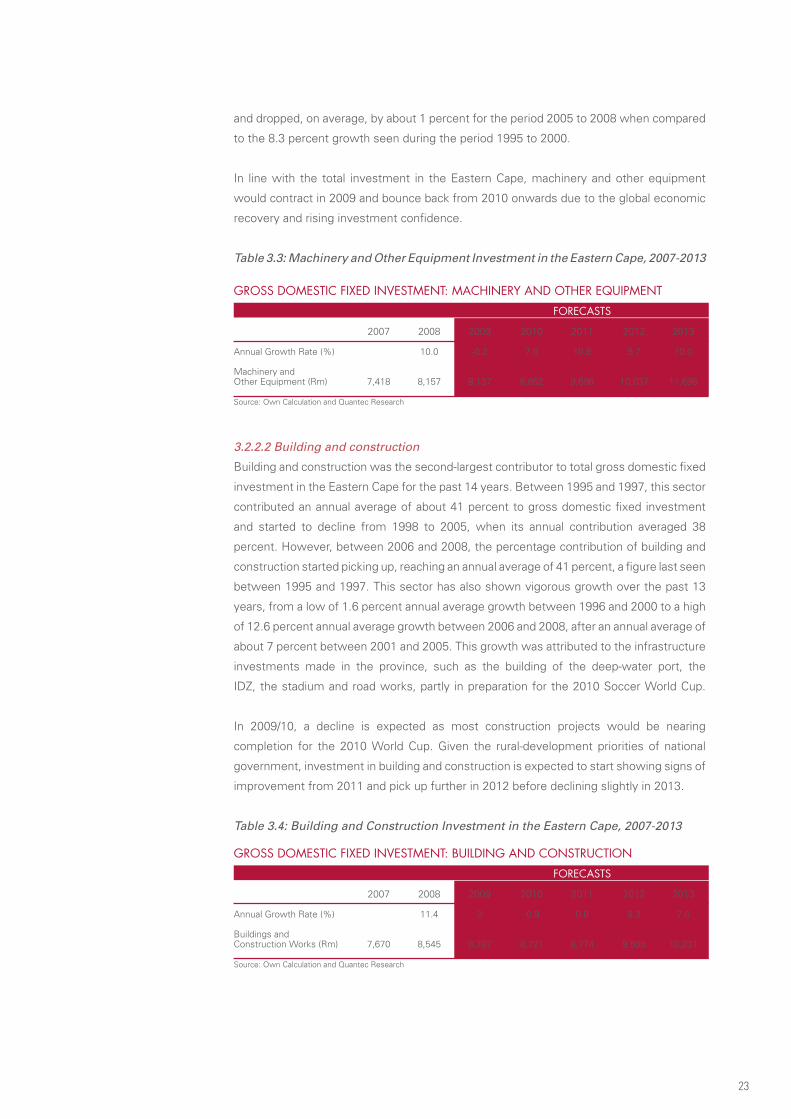
23
and dropped, on average, by about 1 percent for the period 2005 to 2008 when compared
to the 8.3 percent growth seen during the period 1995 to 2000.
In line with the total investment in the Eastern Cape, machinery and other equipment
would contract in 2009 and bounce back from 2010 onwards due to the global economic
recovery and rising investment confidence.
Table 3.3: Machinery and Other Equipment Investment in the Eastern Cape, 2007-2013
GROSS DOMESTIC FIXED INVESTMENT: MACHINERY AND OTHER EqUIPMENT FORECASTS
2007 2008 2009 2010 2011 2012 2013
Annual Growth Rate (%) 10.0 -0.2 7.6 10.8 9.7 10.0
Machinery and Other Equipment (Rm) 7,418 8,157 8,137 8,852 9,696 10,637 11,696
Source: Own Calculation and Quantec Research
3.2.2.2 Building and construction
Building and construction was the second-largest contributor to total gross domestic fixed
investment in the Eastern Cape for the past 14 years. Between 1995 and 1997, this sector
contributed an annual average of about 41 percent to gross domestic fixed investment
and started to decline from 1998 to 2005, when its annual contribution averaged 38
percent. However, between 2006 and 2008, the percentage contribution of building and
construction started picking up, reaching an annual average of 41 percent, a figure last seen
between 1995 and 1997. This sector has also shown vigorous growth over the past 13
years, from a low of 1.6 percent annual average growth between 1996 and 2000 to a high
of 12.6 percent annual average growth between 2006 and 2008, after an annual average of
about 7 percent between 2001 and 2005. This growth was attributed to the infrastructure
investments made in the province, such as the building of the deep-water port, the
IDZ, the stadium and road works, partly in preparation for the 2010 Soccer World Cup.
In 2009/10, a decline is expected as most construction projects would be nearing
completion for the 2010 World Cup. Given the rural-development priorities of national
government, investment in building and construction is expected to start showing signs of
improvement from 2011 and pick up further in 2012 before declining slightly in 2013.
Table 3.4: Building and Construction Investment in the Eastern Cape, 2007-2013
GROSS DOMESTIC FIXED INVESTMENT: BUILDING AND CONSTRUCTION FORECASTS
2007 2008 2009 2010 2011 2012 2013
Annual Growth Rate (%) 11.4 3 -0.9 0.6 8.3 7.6
Buildings and Construction Works (Rm) 7,670 8,545 8,797 8,721 8,774 9,505 10,231
Source: Own Calculation and Quantec Research

24
3.2.2.3 Transport equipment
The average annual contribution of transport equipment to total gross domestic fixed
investment was about 14 percent between 1995 and 2008. The annual contribution to
total gross domestic fixed investment fluctuated between 16 and 14 percent in 1995 and
2008, respectively. In 1996 this sector of fixed investment observed negative growth
of about minus 2 percent associated with the first South African currency crisis, before
an all-time low of approximately minus 27 percent in 1999, from 11 percent growth the
previous year. The negative growth observed in 1999 coincided with the East Asian crisis
of 1997/1998, when South Africa witnessed large-scale withdrawals by non-residents of
portfolio investments previously made in the country5. The growth in this sector was
also in response to the events of 11 September 2001, which led to growth slumping to
about minus 2 percent. Investment in this sector grew aggressively between 2002 and
2005, reaching 22 percent in 2005. Apart from the slight decline from the 2005 figures,
investment remained high until the 2008 financial crisis. The annual average growth
between 2001 and 2005 was slightly more than 10 percent. Growth started to slow down
in 2006 and 2007, and declined to about minus 4 percent in 2008 amidst the threat of a
global economic crisis. This sector proves susceptible to both domestic and international
macroeconomic shocks.
Projections show that investment in transport equipment would improve from 2009
onwards, with robust growth rates from 2010 to 2013.
Table 3.5: Transport Equipment Investment in the Eastern Cape, 2007-2013
GROSS DOMESTIC FIXED INVESTMENT: TRANSPORT EqUIPMENT FORECASTS
2007 2008 2009 2010 2011 2012 2013
Annual Growth Rate (%) -3.9 1.8 3.8 10.3 11.3 9.2
Transport Equipment (Rm) 2,910 2,796 2,847 2,955 3,260 3,629 3,962
Source: Own Calculation and Quantec Research
3.2.3 fINAL CONSUMPTION ExPENDITURE IN THE EASTERN CAPE
Eastern Cape is ranked fourth in terms of consumption expenditure after KwaZulu-Natal.
The total spending growth in the province declined from 8.9 percent in 2006 to 8.6
percent in 2007, before plummeting to 0.9 percent in 2008, and is expected to contract
by 0.7 percent in 2009 (see Table 3.6). Contraction in overall household consumption
expenditure in 2009 was due to outright reductions in household spending on durable
goods, non-durable goods and services. The largest decline was in household spending
on non-durable goods, which is expected to fall to minus 3.2 percent in terms of growth
compared to 2008 spending (see Figure 3.4).
The decline in household consumption expenditure in the Eastern Cape Province mirrors
the severe pressure on the financial health of South African households that built up in
the course of 2007 and 2008. This was due to a marked deterioration in the fundamental
drivers of household income. The surge in inflation during 2008, rising interest rates,
elevated levels of household indebtedness and negative wealth effects stemming from
the decline in asset prices (particularly residential property) and equity prices also had a
detrimental impact on real household disposable income. 5 Reserve Bank of South Africa: The South African Economy in a World of Volatile Financial Markets, BER,University of Stellenbosch, 1999.

25
Table 3.6: Final Consumption Expenditure by Households in the Eastern Cape, 2007-
2013
FINAL CONSUMPTION EXPENDITURE BY HOUSEHOLDS FORECASTS
2007 2008 2009 2010 2011 2012 2013
Annual Growth Rate (%) 0.9 -0.7 3.7 4.9 5.4 5.8
FCEH share of GDP (%) 76.4 75.1 76.4 78 79 80.1 81.4
FCEH (Rm) 73,887 74,544 74,058 76,797 80,576 84,931 89,845
Source: Own Calculation and Quantec Research
On average, the contribution of durable goods to total household consumption from 1995
to 2009 was 10 percent. Non-durable goods was expected to contribute around 34.6
percent of total spending by households in 2009, a 3.2 percent fall in 2009 followed by a
decline of 1.01 percent the previous year.
Household spending on services, which represented about 35 percent of total household
expenditure, fell by 0.7 percent in 2008 and is expected to contract to 2.2 percent in
2009. In conclusion, movements in spending on non-durable goods and services have a
considerable pressure on total household spending, given their substantial weighting in
household budgets.
Table 3.6 shows the outlook of final consumption expenditure by households in the
Eastern Cape. Final consumption is expected to start improving from 2010, given the
easing in monetary policy and the improving economic climate.
Figure 3.4: Household Consumption in the Eastern Cape, 1996-2013
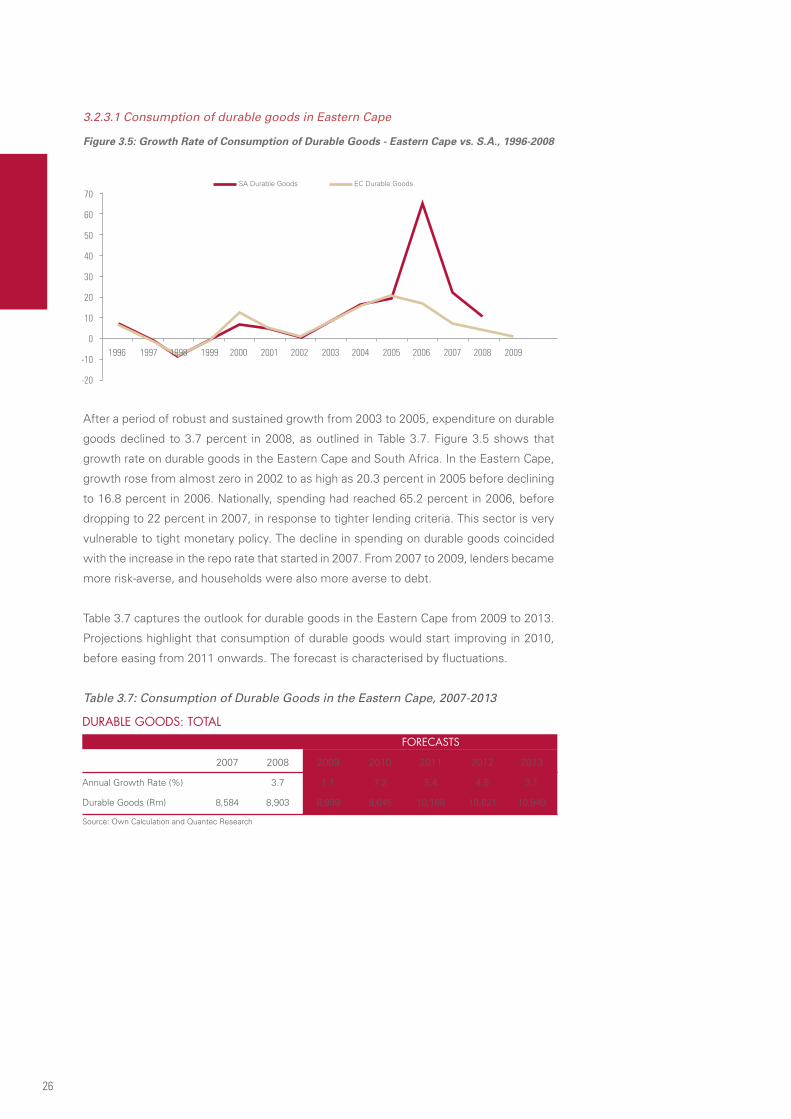
26
3.2.3.1 Consumption of durable goods in Eastern Cape
Figure 3.5: Growth Rate of Consumption of Durable Goods - Eastern Cape vs. S.A., 1996-2008
After a period of robust and sustained growth from 2003 to 2005, expenditure on durable
goods declined to 3.7 percent in 2008, as outlined in Table 3.7. Figure 3.5 shows that
growth rate on durable goods in the Eastern Cape and South Africa. In the Eastern Cape,
growth rose from almost zero in 2002 to as high as 20.3 percent in 2005 before declining
to 16.8 percent in 2006. Nationally, spending had reached 65.2 percent in 2006, before
dropping to 22 percent in 2007, in response to tighter lending criteria. This sector is very
vulnerable to tight monetary policy. The decline in spending on durable goods coincided
with the increase in the repo rate that started in 2007. From 2007 to 2009, lenders became
more risk-averse, and households were also more averse to debt.
Table 3.7 captures the outlook for durable goods in the Eastern Cape from 2009 to 2013.
Projections highlight that consumption of durable goods would start improving in 2010,
before easing from 2011 onwards. The forecast is characterised by fluctuations.
Table 3.7: Consumption of Durable Goods in the Eastern Cape, 2007-2013
DURABLE GOODS: TOTAL FORECASTS
2007 2008 2009 2010 2011 2012 2013
Annual Growth Rate (%) 3.7 1.1 7.2 5.4 4.5 3.1
Durable Goods (Rm) 8,584 8,903 8,999 9,645 10,168 10,621 10,949
Source: Own Calculation and Quantec Research
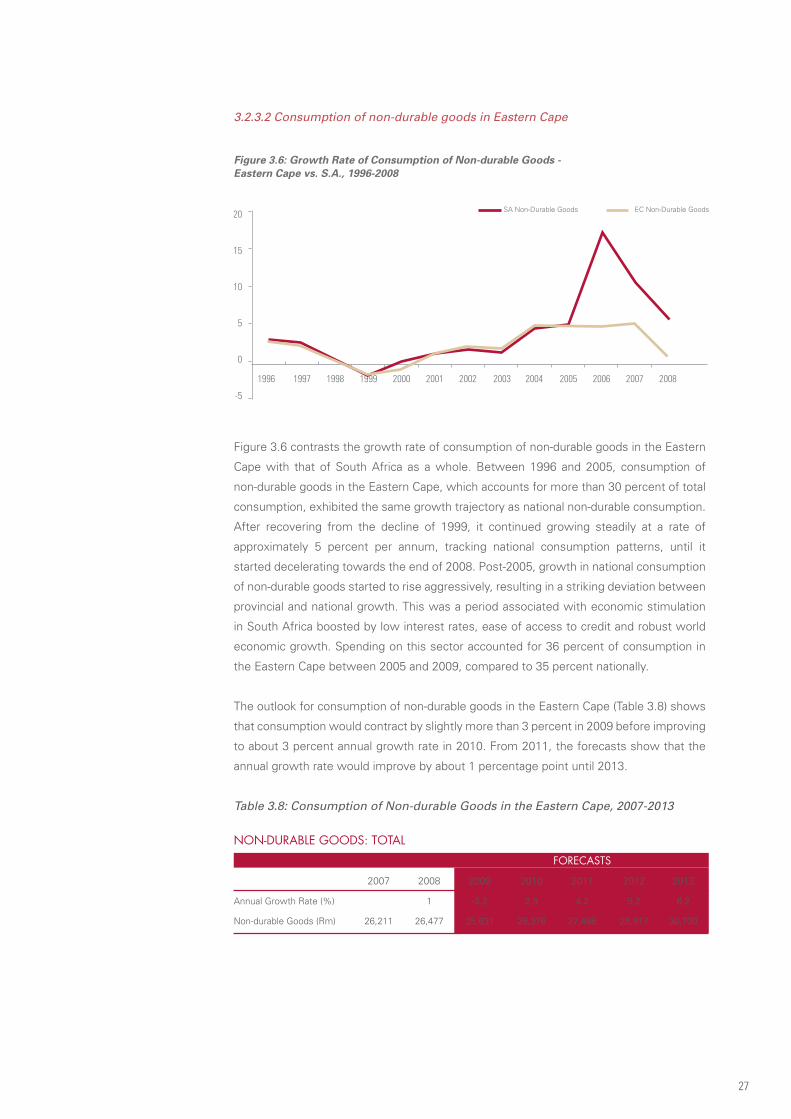
27
3.2.3.2 Consumption of non-durable goods in Eastern Cape
Figure 3.6: Growth Rate of Consumption of Non-durable Goods - Eastern Cape vs. S.A., 1996-2008
Figure 3.6 contrasts the growth rate of consumption of non-durable goods in the Eastern
Cape with that of South Africa as a whole. Between 1996 and 2005, consumption of
non-durable goods in the Eastern Cape, which accounts for more than 30 percent of total
consumption, exhibited the same growth trajectory as national non-durable consumption.
After recovering from the decline of 1999, it continued growing steadily at a rate of
approximately 5 percent per annum, tracking national consumption patterns, until it
started decelerating towards the end of 2008. Post-2005, growth in national consumption
of non-durable goods started to rise aggressively, resulting in a striking deviation between
provincial and national growth. This was a period associated with economic stimulation
in South Africa boosted by low interest rates, ease of access to credit and robust world
economic growth. Spending on this sector accounted for 36 percent of consumption in
the Eastern Cape between 2005 and 2009, compared to 35 percent nationally.
The outlook for consumption of non-durable goods in the Eastern Cape (Table 3.8) shows
that consumption would contract by slightly more than 3 percent in 2009 before improving
to about 3 percent annual growth rate in 2010. From 2011, the forecasts show that the
annual growth rate would improve by about 1 percentage point until 2013.
Table 3.8: Consumption of Non-durable Goods in the Eastern Cape, 2007-2013
NON-DURABLE GOODS: TOTAL FORECASTS
2007 2008 2009 2010 2011 2012 2013
Annual Growth Rate (%) 1 -3.2 2.9 4.2 5.2 6.2
Non-durable Goods (Rm) 26,211 26,477 25,631 26,376 27,486 28,917 30,700
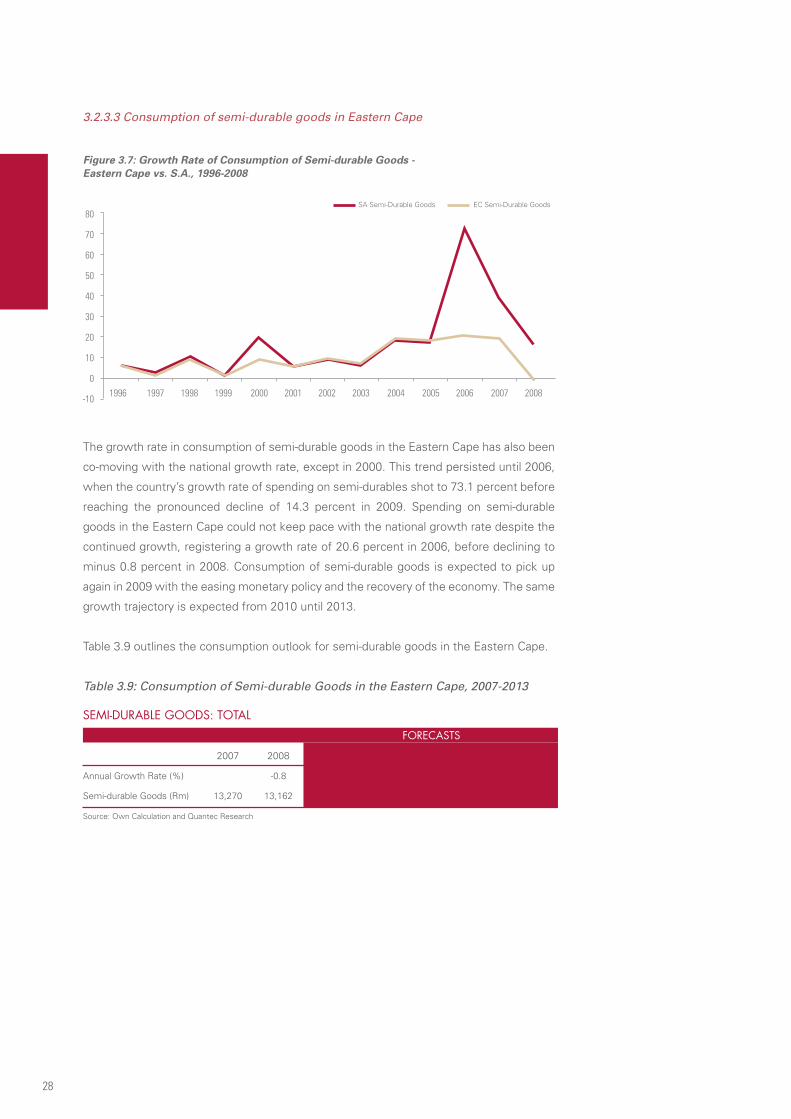
28
3.2.3.3 Consumption of semi-durable goods in Eastern Cape
Figure 3.7: Growth Rate of Consumption of Semi-durable Goods - Eastern Cape vs. S.A., 1996-2008
The growth rate in consumption of semi-durable goods in the Eastern Cape has also been
co-moving with the national growth rate, except in 2000. This trend persisted until 2006,
when the country’s growth rate of spending on semi-durables shot to 73.1 percent before
reaching the pronounced decline of 14.3 percent in 2009. Spending on semi-durable
goods in the Eastern Cape could not keep pace with the national growth rate despite the
continued growth, registering a growth rate of 20.6 percent in 2006, before declining to
minus 0.8 percent in 2008. Consumption of semi-durable goods is expected to pick up
again in 2009 with the easing monetary policy and the recovery of the economy. The same
growth trajectory is expected from 2010 until 2013.
Table 3.9 outlines the consumption outlook for semi-durable goods in the Eastern Cape.
Table 3.9: Consumption of Semi-durable Goods in the Eastern Cape, 2007-2013
SEMI-DURABLE GOODS: TOTAL FORECASTS
2007 2008 2009 2010 2011 2012 2013
Annual Growth Rate (%) -0.8 6.4 6.6 7.1 9.6 9.7
Semi-durable Goods (Rm) 13,270 13,162 14,002 14,925 15,977 17,510 19,214
Source: Own Calculation and Quantec Research
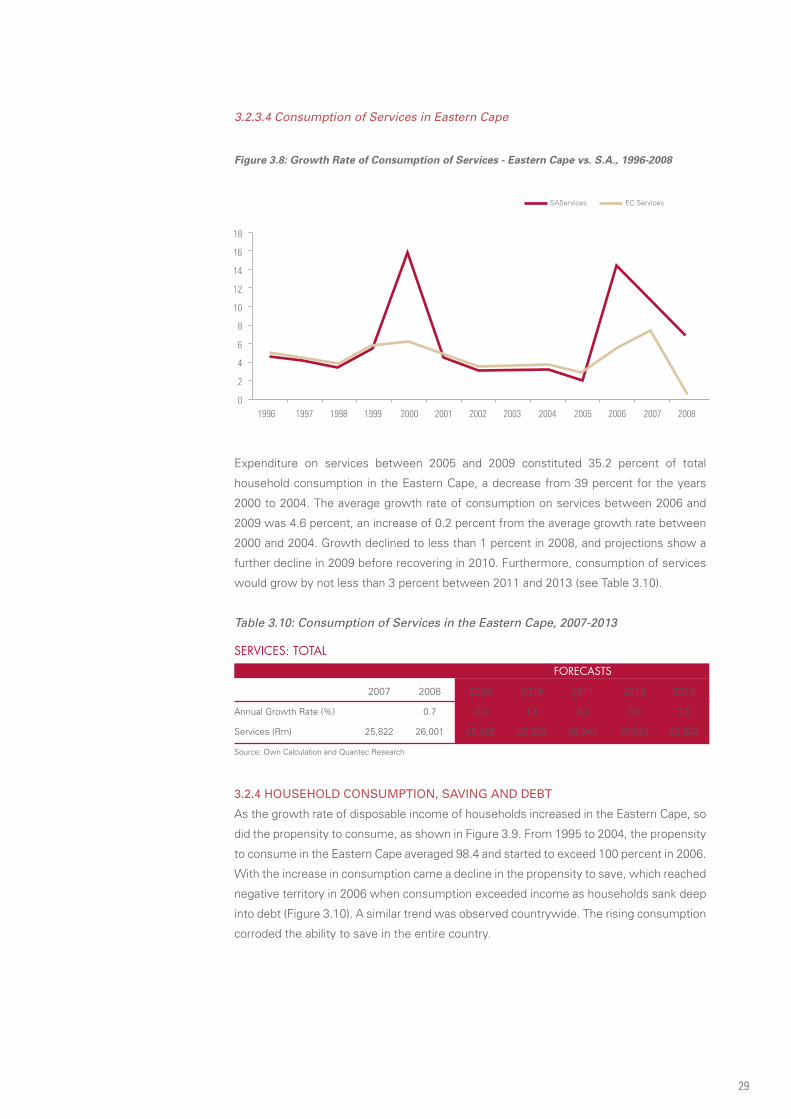
29
3.2.3.4 Consumption of Services in Eastern Cape
Figure 3.8: Growth Rate of Consumption of Services - Eastern Cape vs. S.A., 1996-2008
Expenditure on services between 2005 and 2009 constituted 35.2 percent of total
household consumption in the Eastern Cape, a decrease from 39 percent for the years
2000 to 2004. The average growth rate of consumption on services between 2006 and
2009 was 4.6 percent, an increase of 0.2 percent from the average growth rate between
2000 and 2004. Growth declined to less than 1 percent in 2008, and projections show a
further decline in 2009 before recovering in 2010. Furthermore, consumption of services
would grow by not less than 3 percent between 2011 and 2013 (see Table 3.10).
Table 3.10: Consumption of Services in the Eastern Cape, 2007-2013
SERVICES: TOTAL FORECASTS
2007 2008 2009 2010 2011 2012 2013
Annual Growth Rate (%) 0.7 -2.2 1.6 4.2 3.5 3.9
Services (Rm) 25,822 26,001 25,425 25,852 26,944 27,883 28,982
Source: Own Calculation and Quantec Research
3.2.4 HOUSEHOLD CONSUMPTION, SAVINg AND DEBT
As the growth rate of disposable income of households increased in the Eastern Cape, so
did the propensity to consume, as shown in Figure 3.9. From 1995 to 2004, the propensity
to consume in the Eastern Cape averaged 98.4 and started to exceed 100 percent in 2006.
With the increase in consumption came a decline in the propensity to save, which reached
negative territory in 2006 when consumption exceeded income as households sank deep
into debt (Figure 3.10). A similar trend was observed countrywide. The rising consumption
corroded the ability to save in the entire country.

30
Figure 3.9: Propensity to Consume, Eastern Cape vs. S.A., 1995-2009
Figure 3.10: Propensity to Save Eastern Cape vs. S.A., 1995-2009
3.2.5 TRADE POSITION
3.2.5.1 Exports of Goods
The Eastern Cape has contributed an average of only 6.3 percent to national exports of
goods since 1995. The province’s contribution exhibited fluctuations between 1995 and
2008, with a jump from 3 percent in 1995 to 11.1 percent in 2000 before experiencing a
long downward trend between 2000 and 2007. In 2008, the province’s contribution was
6.9 percent, and approximately the same contribution is expected in 2009.
Motor vehicles, parts and accessories; machinery and equipment; textile; food; and
agriculture, forestry and fishing constitute the top five export-contributing industries in the
Eastern Cape. The composition of exports in the province has changed over the last 14
years, with motor vehicles, parts and accessories taking the lead. This industry increased
its share of total exports from 20.6 percent in 1995 to 60.2 percent in 2005, and 57.6
percent in 2008. Machinery and equipment represents the second-largest contributor
since 2000, with an increase in contribution for the past 9 years, from 9.5 percent in 2000
to 26.4 percent in 2008. Textiles, food and rubber products have shown a declining trend

31
from 1995 to 2009. In 1995, these industries’ contribution was about 38 percent, while in
2008 it was only 6.4 percent of the province’s total exports.
Agriculture, forestry and fishing industry contributed 9.3 percent and 10.1 percent in 1995
and 1996, respectively. Since 1996, the industry’s contribution to the province’s exports
started declining, reaching 1.6 percent in 2000 and 2.8 percent in 2001. The contribution
of agriculture, forestry and fishing fluctuated between 3 and 4.8 percent in the last 4 years.
This industry is far behind the contribution of motor vehicles, parts and accessories, and
machinery and equipment. Table 3.11 illustrates the contribution of the top five sectors in
the Eastern Cape Province.
Table 3.11: Consistent Major Export Contributors in the Eastern Cape, 1995-2008
MAJOR EXPORT CONTRIBUTORS (%)
1995 2000 2005 2008
Motor vehicles, parts and accessories 20.6 21.8 60.2 57.6
Machinery and equipment 12.8 9.5 17.9 26.4
Agriculture, forestry and fishing 9.3 1.6 3 4
Food 15.2 2.4 3.5 2.5
Textiles 17.3 3.7 3.3 2
Rubber products 5.5 2.6 3.2 1.9
Source: Own Calculation and Quantec Research
3.2.5.2 Imports of Goods
The weighting of the Eastern Cape’s imports relative to national imports was about 5.9
percent in 2008, while its contribution between 1995 and 2008 was an average of 7.4
percent. Over the period 1996 to 2008, the growth rate of imports in the Eastern Cape was
characterised by moments of sharp decline, which were accompanied by a contraction in
growth between 1997 and 2003.
Manufacturing is the dominant industry in the Eastern Cape. Within this sector, motor
vehicles, parts and accessories represents the highest contributor to imports in the
province. This industry contributed about 63.2 percent to provincial imports in 1995, 56.4
percent in 2000 and reached 72.7 percent in 2005 before declining to 67.2 percent in 2008.
The contribution of machinery and equipment imports to provincial imports fluctuated
between 7.1 percent and 5.1 percent from 1995 to 2009. Also, agriculture, forestry and
fishing; and chemicals and electrical machinery, which are part of the top ten industries
contributing the most in the Eastern Cape, had a collective contribution of 14.1 percent in
1995. The contribution of the former sectors was 9.7 percent in 2000, 8.5 percent in 2005
and 11.1 percent in 2008. Table 3.12 illustrates the contribution of the top five sectors in
the Eastern Cape.

32
Table 3.12: Consistent Major Import Contributors in the Eastern Cape, 1995-2009
MAJOR IMPORT CONTRIBUTORS (%)
1995 2000 2005 2008
Motor vehicles, parts and accessories 63.2 56.4 72.7 67.2
Machinery and equipment 7.1 8.8 4.4 5.1
Basic chemicals 4 3.2 3 4.1
Agriculture, forestry and fishing 3.8 2.1 1.1 2.4
Other chemicals and man-made fibres 3.7 2.8 2.2 2.9
Food 1.7 1.9 1.3 1.5
Source: Own Calculation and Quantec Research
3.2.5.3 Balance of Trade
Figure 3.11: Balance of Trade of the Eastern Cape, 1995-2008
Figure 3.11 shows that the Eastern Cape trade deficit reached R5.1 billion in 1995 and
increased to R5.6 billion in 1996. The trade deficit shrank to a low level of R0.2 billion in
2004, and grew again to a record high of R6 billion in 2006. The trade deficit of 1996 and
2006 was due to the fact that the growth rate of automotive vehicles exported declined
to minus 13.6 and minus 11.6 respectively, while parts and accessories grew rapidly
between 1995 and 2008. The positive trade balance observed in 2008 could be due to
the decrease in the machinery and equipment imported by the province. In general, the
movement of the provincial trade balance is characterised by the gap between the imports
and exports of the automotive sector. Even if the current trade deficit is a concern, an
acknowledgement needs to be made that, on average, between 1995 and 2008, exports
by motor vehicles, parts and accessories; and machinery and equipment grew by 43.2 and
33.4 percent respectively, while the growth rate of imports was on average 15.3 and 12.7
percent, respectively.
Most academic research has shown that immediate concerns regarding the trade deficit
have been compounded by more long-term anxieties that the deficit is “unsustainable.”
However, continual and rising deficits would burden future generations with a crushing
“foreign debt,” leave the province vulnerable to foreign pressure, undermine foreign-
investor confidence, and produce a “hard landing” for the provincial economy.
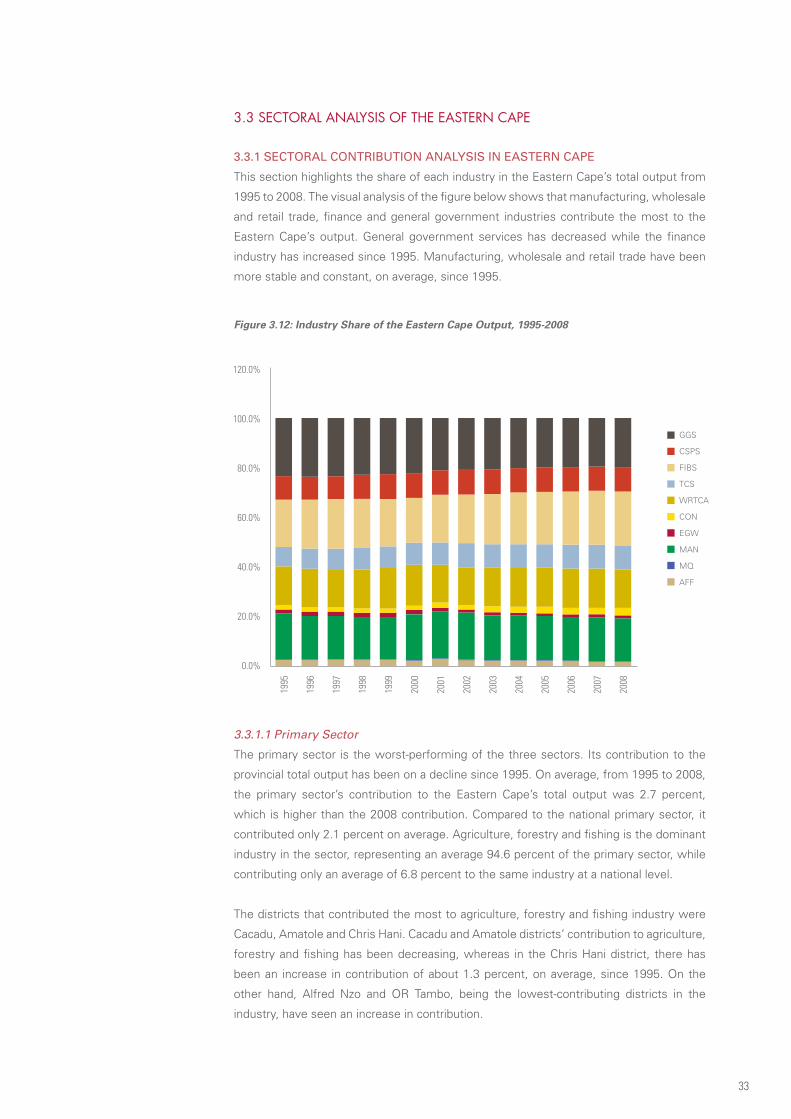
33
3.3 SECTORAL ANALYSIS OF THE EASTERN CAPE
3.3.1 SECTORAL CONTRIBUTION ANALySIS IN EASTERN CAPE
This section highlights the share of each industry in the Eastern Cape’s total output from
1995 to 2008. The visual analysis of the figure below shows that manufacturing, wholesale
and retail trade, finance and general government industries contribute the most to the
Eastern Cape’s output. General government services has decreased while the finance
industry has increased since 1995. Manufacturing, wholesale and retail trade have been
more stable and constant, on average, since 1995.
Figure 3.12: Industry Share of the Eastern Cape Output, 1995-2008
3.3.1.1 Primary Sector
The primary sector is the worst-performing of the three sectors. Its contribution to the
provincial total output has been on a decline since 1995. On average, from 1995 to 2008,
the primary sector’s contribution to the Eastern Cape’s total output was 2.7 percent,
which is higher than the 2008 contribution. Compared to the national primary sector, it
contributed only 2.1 percent on average. Agriculture, forestry and fishing is the dominant
industry in the sector, representing an average 94.6 percent of the primary sector, while
contributing only an average of 6.8 percent to the same industry at a national level.
The districts that contributed the most to agriculture, forestry and fishing industry were
Cacadu, Amatole and Chris Hani. Cacadu and Amatole districts’ contribution to agriculture,
forestry and fishing has been decreasing, whereas in the Chris Hani district, there has
been an increase in contribution of about 1.3 percent, on average, since 1995. On the
other hand, Alfred Nzo and OR Tambo, being the lowest-contributing districts in the
industry, have seen an increase in contribution.

34
3.3.1.2 Secondary Sector
In the Eastern Cape, the secondary sector has contributed an average of 21.5 percent to
the total economy, while its share in this sector at the national level has remained flat at
around 7.2 percent since 1995. Manufacturing has dominated the sector over the past
14 years, representing 83.4 percent of the secondary sector in the province, but only
contributing an average of 7.8 percent to the national manufacturing industry. Electricity,
gas and water is the least contributor, with 6.5 percent of the secondary sector, while
construction industry accounts for 10.1 percent.
Approximately 86.1 percent of the manufacturing industry in the Eastern Cape comes
from the Nelson Mandela Bay Metro and the Amatole districts. Even though their share
in the provincial manufacturing industry has declined over the years, they’re still playing
a leading role in this industry. Alfred Nzo and UKhahlamba are the lowest-contributing
districts in electricity, gas and water since 1995.
3.3.1.3 Tertiary Sector
The tertiary sector in the Eastern Cape had an average contribution of 75.8 percent to the
total economy, while contributing 9.3 percent to the national tertiary sector. From 1995 to
2003, general government services (29.4 percent) has played a leading role, followed by
finance, insurance, real estate and business services (25.6 percent), and wholesale and
retail (20.7 percent) in third place. Since 2004, there is a shift in the ranking, with finance,
insurance, real estate and business services (28.0 percent) taking the top position, followed
by general government services (25.9 percent). Transport, storage and communication
has lagged behind, with only 11.9 percent over the period 1995-2008.
Amatole district and Nelson Mandela Bay Metro represent 63.7 percent of the total
sector in the province. However, their contribution has declined over the years. General
government industry dominates in Amatole district, while finance, insurance, real estate
and business services leads in Nelson Mandela Metro. Alfred Nzo and Ukhahlamba
contributed less to this sector on average.
3.3.2 SECTORAL gROWTH ANALySIS IN THE EASTERN CAPE
3.3.2.1 Primary Sector
During the period 1995 to 2008, the primary sector in the Eastern Cape contributed less than
3 percent to the economy. Equally, growth in this sector, both nationally and provincially,
has been disappointing for the past 14 years. In fact, there is a dive in the sector’s growth,
from 1.3 percent in 1995-2000 to 0.9 percent in 2001-2008. Provincially, the sector grew
from an average rate of minus 0.2 percent in 1995-2000 to an average of 3.1 percent in
2001-2005. In light of the negative growth experienced provincially throughout 1995-2000
and the sluggish growth nationally, the average growth of 1.7 percent for 2001- 2008 may
not seem so bad as it also exceeds the national level for that period. Agriculture, forestry
and fishing (AFF) has exhibited the same characteristics of growth shown by the provincial
primary sector. This is not surprising given that agriculture, forestry and fishing contributed
more than 95 percent to the primary sector’s output for the Eastern Cape.

35
Table 3.13: Eastern Cape Primary Sector Average Growth, 1995-2008
AVERAGE GROWTH (%)
1995 - 2000 2001 - 2005 2001 - 2008
SA 1.3 1.6 0.9
PRIMARY SEC. EC -0.2 3.1 1.7
SA 6.1 1.6 2.8
AFF EC -0.2 3.1 1.8
Source: Own Calculation and Quantec Research
3.3.2.2 Secondary Sector
The secondary sector in the Eastern Cape has been dominated by the manufacturing
industry, followed by the construction industry. Jointly, these two industries contributed
more than 90 percent of the sector’s output, with manufacturing contributing more than
80 percent of this figure. The growth rate of manufacturing has been slightly below that of
South Africa during the two latter periods investigated, that is, 2001-2005 and 2001-2008.
Oddly, the period 2001-2005, which was typified by sustained economic growth in the
country, shows no improvement in the growth rate of manufacturing sector.
The growth of manufacturing in the Eastern Cape appears to lag the national growth for
all periods considered. Turning to the construction industry, growth rose to a remarkable
11.1 percent in 2001- 2005 from 2.1 percent in 1995-2000, and has remained above the
11-percent margin for the period spanning 2001 and 2008. This increased growth level
in the construction industry, although above the national growth, has been aligned to the
national growth rate.
Table 3.14: Eastern Cape Secondary Sector Average Growth, 1995-2008
AVERAGE GROWTH (%)
1995 - 2000 2001 - 2005 2001 - 2008
SA 2.3 3.2 3.9
SECONDARY SEC. EC 2.6 2.8 3.2
SA 2.5 2.8 3.1
MAN EC 2.6 2.4 2.6
SA 0.8 8.2 10.7
CON EC 2.1 11.1 11.4
Source: Own Calculation and Quantec Research
3.3.2.3 Tertiary Sector
The tertiary sector in the Eastern Cape contributes more than 75 percent to the economy
of the province. The periods investigated in Table 3.15 show that, both provincially and
nationally, the sector has experienced steady growth. This is despite the fact that provincial
growth has always lagged national growth, by almost 1 percent. Industries that have
driven growth in this sector were finance, insurance, real estate and business services
(FIBS); community, social and personal services (CSPS); and transport, storage and
communications (TSC), despite showing signs of decline during the period 2001 to 2005
with the exception of finance, insurance, real estate and business services. Provincial

36
growth in finance, real estate and business services has shown enormous growth after
jumping from an average growth of a mere 1.2 percent in 1995-2000 to 6.3 percent in
2001-2005, and has remained within the 6-percent level of growth for the period 2001-
2008. Growth in this industry has closely tracked national growth. Analysis shows that
average growth in community, social and personal services in the province experienced a
marginal decline in 2001-2005, but overall has been growing at an almost similar rate with
the national level. The transport, storage and communications industry declined slightly in
growth in 2001-2005 to 4.8 percent when compared to the growth level of 1995- 2000,
which averaged 5.1 percent. The decline in growth is even more apparent when comparing
the average growth rate in 2001- 2008 with that of 1995-2000.
Table 3.15: Eastern Cape Tertiary Sector Average Growth, 1995-2008
AVERAGE GROWTH (%)
1995 - 2000 2001 - 2005 2001 - 2008
SA 3.4 4.5 4.7
TERTIARY SEC. EC 2.5 3.3 3.6
SA 4.4 6.3 6.3
FIBS EC 1.2 6.3 6
SA 3.5 3.1 3.6
CSPS EC 3.6 2.9 3.5
SA 6.5 6.2 5.9
TSC EC 5.1 4.8 4.6
Source: Own Calculation and Quantec Research
3.4 LABOUR-MARKET ANALYSIS IN EASTERN CAPEThe main objective of any government (provincial or national) is to develop a policy which
can assure both economic growth and job creation. However, since 1990, South Africa’s
rate of job creation in general, and the Eastern Cape’s in particular, have risen more slowly
than economic growth during economic upturns, and fallen more rapidly during downturns.
This puzzle of economic growth and job creation has given rise to a phenomenon that
some economists term “jobless growth”. Over the years, economic growth has largely
benefited sectors that rely more on relatively educated labour, while the sectors which can
absorb significant unskilled labour have declined, creating a loss in semi- and unskilled jobs.
This section provides vital information about the labour-force data in the Eastern Cape.
The analyses are based on the official definition of labour force and unemployment used
by StatsSA.
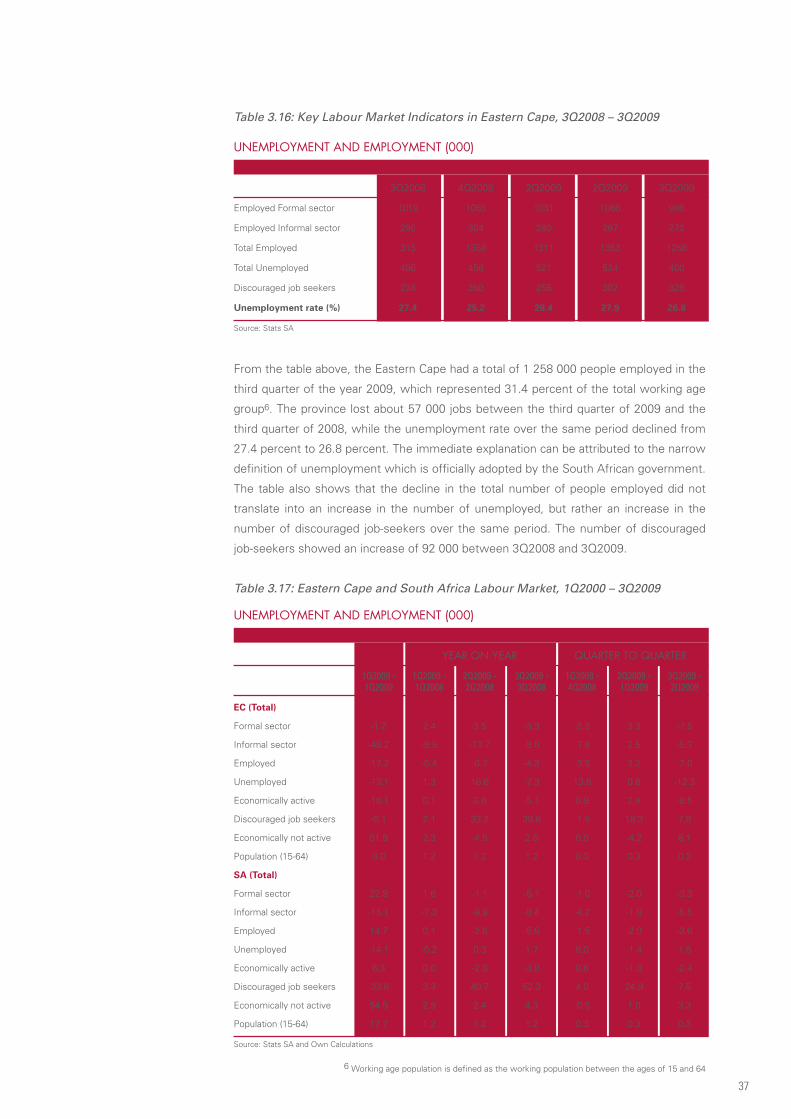
37
UNEMPLOYMENT AND EMPLOYMENT (000)
YEAR ON YEAR qUARTER TO qUARTER
1Q2009 - 1Q2009 - 2Q2009 - 3Q2009 - 1Q2009 - 2Q2009 - 3Q2009 - 1Q2000 1Q2008 2Q2008 3Q2008 4Q2008 1Q2009 2Q2009
EC (Total)
Formal sector -1.2 2.4 3.5 -3.3 -2.2 3.3 -7.5
Informal sector -48.2 -9.5 -13.7 -8.0 -7.8 2.5 -5.3
Employed -17.2 -0.4 -0.7 -4.3 -3.5 3.2 -7.0
Unemployed -13.1 1.3 16.6 -7.3 13.8 0.6 -12.3
Economically active -16.1 0.1 3.6 -5.1 0.9 2.4 -8.5
Discouraged job seekers -0.1 2.1 33.2 39.6 -1.5 18.3 7.8
Economically not active 51.9 2.3 -4.8 2.6 0.0 -4.2 8.1
Population (15-64) 8.0 1.2 1.2 1.2 0.3 0.3 0.3
SA (Total)
Formal sector 22.8 1.6 -1.1 -5.1 -1.0 -2.0 -3.3
Informal sector -15.1 -7.3 -9.9 -8.4 -4.2 -1.9 -5.5
Employed 14.7 0.1 -2.6 -5.6 -1.5 -2.0 -3.6
Unemployed -14.1 -0.2 0.3 1.7 8.0 -1.4 1.6
Economically active 6.3 0.0 -2.0 -3.9 0.6 -1.8 -2.4
Discouraged job seekers -33.6 3.3 40.7 52.3 4.0 24.9 7.5
Economically not active 54.5 2.9 2.4 4.3 -0.5 1.0 3.3
Population (15-64) 17.7 1.2 1.2 1.2 0.3 0.3 0.3
Source: Stats SA and Own Calculations
Table 3.16: Key Labour Market Indicators in Eastern Cape, 3Q2008 – 3Q2009
UNEMPLOYMENT AND EMPLOYMENT (000)
3Q2008 4Q2008 2Q2009 2Q2009 3Q2009
Employed Formal sector 1019 1055 1031 1066 986
Employed Informal sector 296 304 280 287 272
Total Employed 315 1358 1311 1353 1258
Total Unemployed 496 458 521 524 460
Discouraged job seekers 234 260 256 302 326
Unemployment rate (%) 27.4 25.2 28.4 27.9 26.8
Source: Stats SA
From the table above, the Eastern Cape had a total of 1 258 000 people employed in the
third quarter of the year 2009, which represented 31.4 percent of the total working age
group6. The province lost about 57 000 jobs between the third quarter of 2009 and the
third quarter of 2008, while the unemployment rate over the same period declined from
27.4 percent to 26.8 percent. The immediate explanation can be attributed to the narrow
definition of unemployment which is officially adopted by the South African government.
The table also shows that the decline in the total number of people employed did not
translate into an increase in the number of unemployed, but rather an increase in the
number of discouraged job-seekers over the same period. The number of discouraged
job-seekers showed an increase of 92 000 between 3Q2008 and 3Q2009.
Table 3.17: Eastern Cape and South Africa Labour Market, 1Q2000 – 3Q2009
6 Working age population is defined as the working population between the ages of 15 and 64
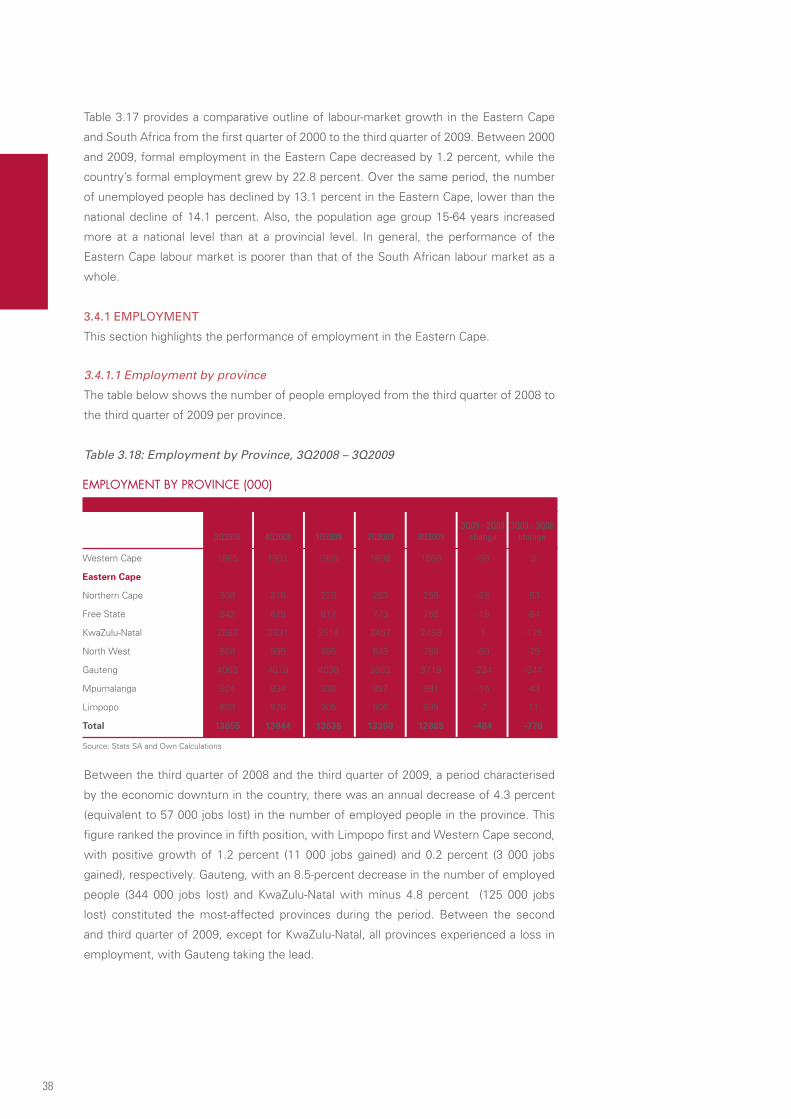
38
Table 3.17 provides a comparative outline of labour-market growth in the Eastern Cape
and South Africa from the first quarter of 2000 to the third quarter of 2009. Between 2000
and 2009, formal employment in the Eastern Cape decreased by 1.2 percent, while the
country’s formal employment grew by 22.8 percent. Over the same period, the number
of unemployed people has declined by 13.1 percent in the Eastern Cape, lower than the
national decline of 14.1 percent. Also, the population age group 15-64 years increased
more at a national level than at a provincial level. In general, the performance of the
Eastern Cape labour market is poorer than that of the South African labour market as a
whole.
3.4.1 EMPLOyMENT
This section highlights the performance of employment in the Eastern Cape.
3.4.1.1 Employment by province
The table below shows the number of people employed from the third quarter of 2008 to
the third quarter of 2009 per province.
Table 3.18: Employment by Province, 3Q2008 – 3Q2009
EMPLOYMENT BY PROVINCE (000)
3Q09 - 2Q09 3Q09 - 3Q08 3Q2008 4Q2008 1Q2009 2Q2009 3Q2009 change change
Western Cape 1865 1931 1965 1898 1868 -30 3
Eastern Cape 1315 1358 1311 1353 1258 -95 -57
Northern Cape 308 316 278 283 255 -28 -53
Free State 842 829 812 773 758 -15 -84
KwaZulu-Natal 2583 2631 2514 2457 2458 1 -125
North West 868 895 885 849 789 -60 -79
Gauteng 4063 4079 4030 3953 3719 -234 -344
Mpumalanga 924 934 936 897 881 -16 -43
Limpopo 888 870 905 906 899 -7 11
Total 13655 13844 13636 13369 12885 -484 -770
Source: Stats SA and Own Calculations
Between the third quarter of 2008 and the third quarter of 2009, a period characterised
by the economic downturn in the country, there was an annual decrease of 4.3 percent
(equivalent to 57 000 jobs lost) in the number of employed people in the province. This
figure ranked the province in fifth position, with Limpopo first and Western Cape second,
with positive growth of 1.2 percent (11 000 jobs gained) and 0.2 percent (3 000 jobs
gained), respectively. Gauteng, with an 8.5-percent decrease in the number of employed
people (344 000 jobs lost) and KwaZulu-Natal with minus 4.8 percent (125 000 jobs
lost) constituted the most-affected provinces during the period. Between the second
and third quarter of 2009, except for KwaZulu-Natal, all provinces experienced a loss in
employment, with Gauteng taking the lead.
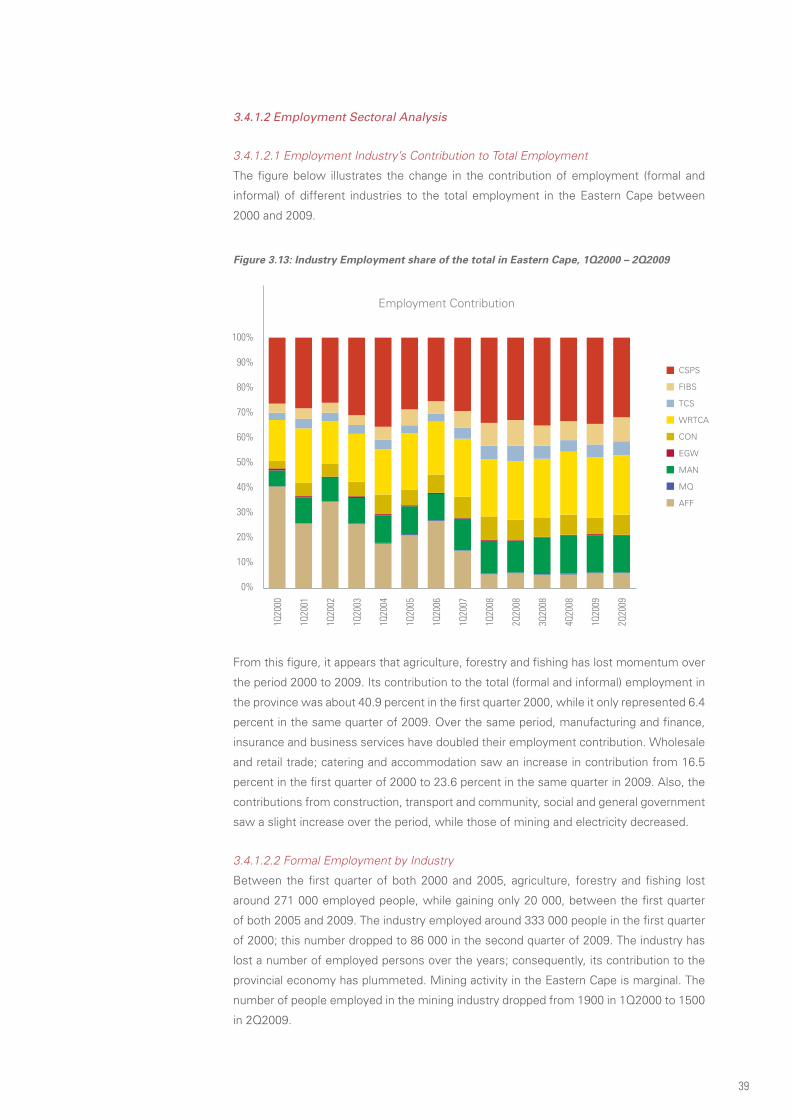
39
3.4.1.2 Employment Sectoral Analysis
3.4.1.2.1 Employment Industry’s Contribution to Total Employment
The figure below illustrates the change in the contribution of employment (formal and
informal) of different industries to the total employment in the Eastern Cape between
2000 and 2009.
Figure 3.13: Industry Employment share of the total in Eastern Cape, 1Q2000 – 2Q2009
From this figure, it appears that agriculture, forestry and fishing has lost momentum over
the period 2000 to 2009. Its contribution to the total (formal and informal) employment in
the province was about 40.9 percent in the first quarter 2000, while it only represented 6.4
percent in the same quarter of 2009. Over the same period, manufacturing and finance,
insurance and business services have doubled their employment contribution. Wholesale
and retail trade; catering and accommodation saw an increase in contribution from 16.5
percent in the first quarter of 2000 to 23.6 percent in the same quarter in 2009. Also, the
contributions from construction, transport and community, social and general government
saw a slight increase over the period, while those of mining and electricity decreased.
3.4.1.2.2 Formal Employment by Industry
Between the first quarter of both 2000 and 2005, agriculture, forestry and fishing lost
around 271 000 employed people, while gaining only 20 000, between the first quarter
of both 2005 and 2009. The industry employed around 333 000 people in the first quarter
of 2000; this number dropped to 86 000 in the second quarter of 2009. The industry has
lost a number of employed persons over the years; consequently, its contribution to the
provincial economy has plummeted. Mining activity in the Eastern Cape is marginal. The
number of people employed in the mining industry dropped from 1900 in 1Q2000 to 1500
in 2Q2009.
Employment Contribution
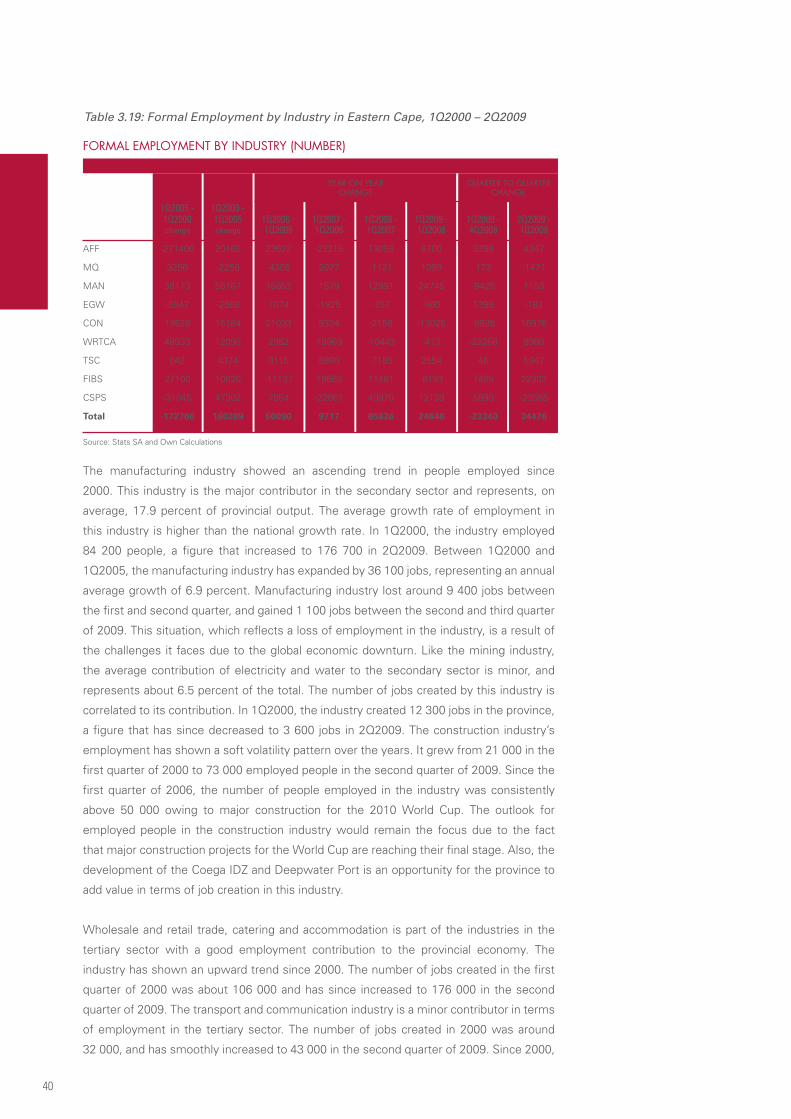
40
FORMAL EMPLOYMENT BY INDUSTRY (NUMBER)
YEAR ON YEAR qUARTER TO qUARTER CHANGE CHANGE
1Q2005 - 1Q2009 - 1Q2000 1Q2005 1Q2006 - 1Q2007 - 1Q2008 - 1Q2009 - 1Q2009 - 2Q2009 - change change 1Q2005 1Q2006 1Q2007 1Q2008 4Q2008 1Q2009
AFF -271406 20165 23622 -23215 13058 6700 3288 4347
MQ 3256 -2250 -4305 2077 -1121 1099 173 -1471
MAN 36173 55167 15852 1579 12991 24745 -9425 1153
EGW -5947 -2568 1074 -1925 -757 -960 1399 -182
CON 19528 15184 21033 9334 -2158 -13025 -8928 16976
WRTCA 48933 12095 2982 19969 -10443 -413 -23268 8988
TSC 642 4374 3115 5890 -7185 2554 46 5947
FIBS 27100 10820 -11137 18669 11481 -8193 7485 22303
CSPS -31045 47302 7854 -22661 49970 12139 5890 -23585
Total -172766 160289 60090 9717 65836 24646 -23340 34476
Source: Stats SA and Own Calculations
Table 3.19: Formal Employment by Industry in Eastern Cape, 1Q2000 – 2Q2009
The manufacturing industry showed an ascending trend in people employed since
2000. This industry is the major contributor in the secondary sector and represents, on
average, 17.9 percent of provincial output. The average growth rate of employment in
this industry is higher than the national growth rate. In 1Q2000, the industry employed
84 200 people, a figure that increased to 176 700 in 2Q2009. Between 1Q2000 and
1Q2005, the manufacturing industry has expanded by 36 100 jobs, representing an annual
average growth of 6.9 percent. Manufacturing industry lost around 9 400 jobs between
the first and second quarter, and gained 1 100 jobs between the second and third quarter
of 2009. This situation, which reflects a loss of employment in the industry, is a result of
the challenges it faces due to the global economic downturn. Like the mining industry,
the average contribution of electricity and water to the secondary sector is minor, and
represents about 6.5 percent of the total. The number of jobs created by this industry is
correlated to its contribution. In 1Q2000, the industry created 12 300 jobs in the province,
a figure that has since decreased to 3 600 jobs in 2Q2009. The construction industry’s
employment has shown a soft volatility pattern over the years. It grew from 21 000 in the
first quarter of 2000 to 73 000 employed people in the second quarter of 2009. Since the
first quarter of 2006, the number of people employed in the industry was consistently
above 50 000 owing to major construction for the 2010 World Cup. The outlook for
employed people in the construction industry would remain the focus due to the fact
that major construction projects for the World Cup are reaching their final stage. Also, the
development of the Coega IDZ and Deepwater Port is an opportunity for the province to
add value in terms of job creation in this industry.
Wholesale and retail trade, catering and accommodation is part of the industries in the
tertiary sector with a good employment contribution to the provincial economy. The
industry has shown an upward trend since 2000. The number of jobs created in the first
quarter of 2000 was about 106 000 and has since increased to 176 000 in the second
quarter of 2009. The transport and communication industry is a minor contributor in terms
of employment in the tertiary sector. The number of jobs created in 2000 was around
32 000, and has smoothly increased to 43 000 in the second quarter of 2009. Since 2000,

41
annual growth has shown some volatility, reaching minus 17.1 percent in the first quarter
of 2008. Finance, insurance and business services has grown rapidly in the province.
The industry’s employed number has doubled between 2000 and 2009, with an annual
average growth of 8.1 percent. This industry has become one of the major employment
contributors in the Eastern Cape. In the second quarter of 2008, the industry created
114 000 jobs, about 60 000 jobs more than in the first quarter of 2000.
Community, social and other personal services represents the major contributor in terms
of employment in the province. Its contribution was flat over the year, with on average
annual growth rate of 1.7 percent between 2000 and 2009. Employment growth in the
community, social and other personal services industry followed the national trend and
showed an upward and downward trend between 2000 and 2009. Between the third
quarter 2008 and the second quarter 2009, the number of jobs in this industry dropped
from 422 000 to 392 000.
3.4.1.2.3 Informal Employment by Industry
Informal employment has been discussed since the early seventies, initiated by the launch
of the International Labour Office (ILO) World Employment Programme, the publication of
the Kenya Report (1972) and the seminal contribution by Hart (1973).
The ILO represents the key international body providing official definitions of informal
employment. The first definition of informal employment agreed upon in 1993 was
reviewed in 2003 due to findings that the definition left out important segments of informal
employment. The broad-understanding explanation adopted in 2003 defined informal
employment as the “total number of informal jobs, whether carried out in formal sector
enterprises, informal sector enterprises, or households” (ILO 2002b). Also, informal jobs
are characterised by poor working conditions, low earnings and are not subject to labour
legislation, social protection, taxes or employment benefits. Statistics South Africa doesn’t
depart from this broad definition in general. The table below gives the broad picture for
informal employment by industry in the Eastern Cape.
Table 3.20: Informal Employment by Industry in Eastern Cape, 1Q2000 – 2Q2009
INFORMAL EMPLOYMENT BY INDUSTRY (NUMBER)
YEAR ON YEAR qUARTER TO qUARTER CHANGE CHANGE
1Q2005 - 1Q2009 - 1Q2000 1Q2005 1Q2006 - 1Q2007 - 1Q2008 - 1Q2009 - 1Q2009 - 2Q2009 - change change 1Q2005 1Q2006 1Q2007 1Q2008 4Q2008 1Q2009
AFF -82631 123054 -205406
MAN 21808 -13042 -2722 5443 -13068 -2695 -2355 3173
CON 320383 -12706 12437 -13419 10509 -22233 -12263 3282
WRTCA -2442 -4665 25747 -33167 -10737 13492 -2407 -4278
TSC 888 14305 4188 -235 13785 -3433 3679 3779
FIBS -893 10661 5501 -6909 17410 -5341 -3039 -674
CSPS 11653 8427 3183 25308 -11582 -8482 -7339 1758
Total -30069 -230365 169581 -228385 -141996 -29565 -23724 7040
Source: Stats SA and Own Calculations

42
EMPLOYMENT BY OCCUPATION
2004 2008
Number Share (%) Male (%) Female (%) Number Share (%) Male (%) Female (%)
Legislators, senior officialsand managers 58492 5.1 75.3 24.7 71417 4.6 70.9 29.1
Professionals 49089 4.3 51.2 48.8 61005 4.0 37.9 62.1
Technicians and associateprofessionals 117889 10.4 37.4 62.6 145189 9.4 33.3 66.7
Clerks 77888 6.8 23.5 76.5 122374 7.9 23.1 76.9
Service workers and shopand market sales workers 139968 12.3 51.0 49.0 184566 12.0 53.5 46.5
Skilled agricultural andfishery workers 152331 13.4 69.9 30.1 152449 9.9 61.1 38.9
Craft and related tradesworkers 167158 14.7 66.1 33.9 234942 15.2 69.5 30.5
Plant and machinery operators and assemblers 61563 5.4 90.9 9.1 110761 7.2 84.2 15.8
Elementary occupations 312830 27.5 58.1 41.9 460684 29.8 43.5 56.5
Total 1137208 100.0 57.8 42.2 1543387 100.0 51.8 48.2
Source: Stats SA and Own Calculations
Agriculture, forestry and fishing industry has played a leading role in the informal
employment sector. But due to lack of data since 2008, its current contribution cannot be
measured accurately. Wholesale, retail trade, hotels and restaurants is ranked in second
position and plays an important role in informal sector employment. Its contribution was
flat over the years, with an annual average growth of 2.8 percent. Community and social
services; transport and communication; construction and manufacturing have also created
an important number of informal jobs in the Eastern Cape.
3.4.1.3 Employment by Occupation and by Skills
An analysis of employment by occupation is essential in the determination of skill groupings
such as highly skilled, skilled, semi- and unskilled. This section examines employment by
occupation between 2004 and 2008 in the Eastern Cape.
3.4.1.3.1 Employment by Occupation
The table below provides employment by occupation and by gender in 2004 and 2008.
Table 3.21: Employment by Occupation in the Easter Cape, 2004-2008
Elementary occupations represent the largest share of employed people from 2004 to
2008, followed by craft and related trades workers. The proportion of legislators, senior
officials and managers decreased over the period, while the share of females increased.
For both years, the smallest number of people employed in the province came from the
professional sector.

43
3.4.1.3.2 Employment by Skills
The graph below provides employment by skills in the Eastern Cape in 2004 and 2008.
Figure 3.14: Composition of Employment by Skills, 2004 and 2008
The figure above reveals a decline of two percentage points within the semi- and unskilled
category over the period of 2004 and 2008. During the same period, skilled jobs in the
formal sector gained the same number of percentage points as those lost in the semi- and
unskilled category, while the number of highly skilled jobs remained unchanged.
Given the state of the distribution of skills in the province, the Eastern Cape government’s
objectives of job creation and poverty reduction would depend on the success of policies
that promote the employment of skilled, semi- and unskilled labour.
3.4.2 UNEMPLOyMENT RATE IN EASTERN CAPE
Unemployment is regarded as one of the most challenging economic problems facing the
Eastern Cape. The structure of the provincial economy is dominated by the tertiary sector,
which requires highly skilled labour, while the Eastern Cape is dominated by skilled, semi-
skilled and unskilled labour. The table below provides a comparison of unemployment
statistics across provinces between the third quarter of 2008 and 2009.
From Table 3.22, the Western Cape and KwaZulu-Natal have managed to keep their
unemployment rates below the national rate since the third quarter of 2008. Estimates
obtained from labour-force surveys indicate that between the third quarter 2008 and 2009,
the unemployment rate in the Eastern Cape ranged from a minimum of 25.2 to a maximum
of 28.4 percent. The Eastern Cape Province’s unemployment rate has always been above
South Africa’s rate, decreasing to 26.8 percent in the third quarter of 2009. Also, the
province had the highest unemployment rate after Limpopo in the third quarter of 2008, and
was in first position in terms of its high unemployment rate in the second quarter of 2009.
The high level of unemployment is due to the fact that the province is mostly rural, while
the growth of its economy is driven by the tertiary sector. The enhancement of the primary
and secondary sectors is needed to dilute the high rate of unemployment in the province.

44
UNEMPLOYMENT
3Q2008 4Q2008 1Q2009 2Q2009 3Q2009
SOUTH AFRICA Unemployment (‘000) 4122 3873 4184 4125 4192
Rate (%) 23.2 21.9 23.5 26.6 24.5
WESTERN CAPE Unemployment (‘000) 457 392 442 490 542
Rate (%) 19.7 16.9 8.4 20.5 22.5
EASTERN CAPE Unemployment (‘000) 496 458 521 524 460
Rate (%) 27.4 25.2 28.4 27.9 26.8
NORTHERN CAPE Unemployment (‘000) 90 87 105 102 109
Rate (%) 22.6 21.6 27.4 26.5 29.9
FREE STATE Unemployment (‘000) 250 242 227 285 304
Rate (%) 22.9 22.6 25.4 26.9 28.6
KWAZULU-NATAL Unemployment (‘000) 729 690 733 586 566
Rate (%) 22 20.8 22.6 19.3 18.7
NORTH WEST Unemployment (‘000) 317 310 326 325 306
Rate (%) 26.8 25.7 26.9 27.7 27.9
GAUTENG Unemployment (‘000) 1131 1062 1119 1188 1294
Rate (%) 21.8 20.7 21.7 23.1 25.8
MPUMALANGA Unemployment (‘000) 279 280 307 324 304
Rate (%) 23.2 23.1 24.7 26.5 25.7
LIMPOPO Unemployment (‘000) 372 353 354 300 308
Rate (%) 29.5 31.7 28.1 24.9 25.5
Source: Stats SA and Own Calculations
Table 3.22: Unemployment Rate and Number by province, 3Q2008 – 3Q2009
3.4.3 LABOUR REMUNERATION
Labour remuneration is defined as the sum of wages, salaries, and fringe benefits paid to
workers. In this section, an analysis of the remuneration of labour (by gender, age group
and sector), divided into different income categories, will be conducted. The following
figure shows the monthly labour remuneration by income group in the Eastern Cape
between 1995 and 2009.
Figure 3.15: Labour Remuneration per Income Category in the Eastern Cape, 1995 – 2009

45
INCOME BY GENDER (%)
Monthly Less orLabour No equal to R501 - R2 501 - R6 001 - R11 001 - R30 001 TotalRemuneration Income R500 R2 500 R6 000 R11 000 R30 000 or more
Male 36.1 4.2 14.4 19.3 13.2 12.3 0.4 100.0
Female 39.8 6.0 8.9 21.0 18.5 5.9 100.0
Total 37.9 5.1 11.7 20.1 15.8 9.2 0.2 100.0
Source: Stats SA and Own Calculations
Figure 3.15 shows that there was an improvement in terms of income redistribution
over the past 14 years. High-income levels have increased, while the distribution of low
incomes has decreased. However, there is an increase in the number of people earning
no income.
For the gender, age group and sector-income distribution analysis, the focus was on the
2008 household survey, and included no-income earning group as a means of figuring out
the impact of this category on income distribution in the province. According to the 2008
household survey in Table 3.23, the Eastern Cape features different income categories,
with the largest portion of employed people earning no income, R500 or less per month
(43 percent). The percentage of employed people falling in the range of R11 001 or more
per month represented approximately only 9.4 percent of the total number of employed
people in the province.
3.4.3.1 Remuneration by Gender
The table below highlights the monthly labour remuneration in 2008, by gender, in the
Eastern Cape.
Table 3.23: Labour Remuneration by Gender in Eastern Cape, 2008
Women are more vulnerable in terms of income redistribution in the province, according
to the 2008 household survey. The results from the above table show that about 39.8
percent of women and 36.1 percent of men have no income. The survey shows the
dominance of women in the R2 501 and R11 000 income categories, while their proportion
has been reduced in income exceeding R11 000.
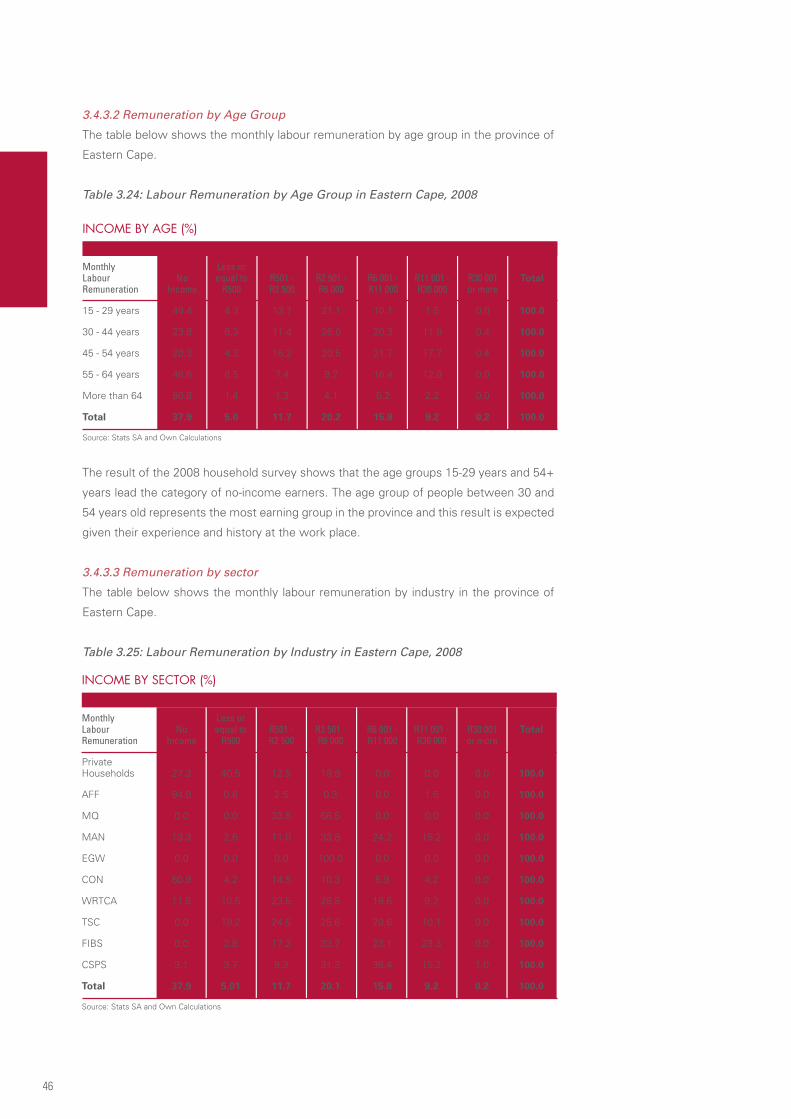
46
INCOME BY SECTOR (%)
Monthly Less orLabour No equal to R501 - R2 501 - R6 001 - R11 001 - R30 001 TotalRemuneration Income R500 R2 500 R6 000 R11 000 R30 000 or more
Private Households 27.3 40.5 12.5 19.8 0.0 0.0 0.0 100.0
AFF 94.8 0.8 2.5 0.3 0.0 1.5 0.0 100.0
MQ 0.0 0.0 33.5 66.5 0.0 0.0 0.0 100.0
MAN 13.3 2.6 11.0 33.8 24.2 15.2 0.0 100.0
EGW 0.0 0.0 0.0 100.0 0.0 0.0 0.0 100.0
CON 60.9 4.2 14.5 10.3 5.9 4.2 0.0 100.0
WRTCA 11.5 10.5 23.5 28.8 16.6 9.2 0.0 100.0
TSC 0.0 19.2 24.5 25.6 20.6 10.1 0.0 100.0
FIBS 0.0 2.8 17.2 33.7 23.1 23.3 0.0 100.0
CSPS 3.1 3.7 9.3 31.3 36.4 15.2 1.0 100.0
Total 37.9 5.01 11.7 20.1 15.8 9.2 0.2 100.0
Source: Stats SA and Own Calculations
INCOME BY AGE (%)
Monthly Less orLabour No equal to R501 - R2 501 - R6 001 - R11 001 - R30 001 TotalRemuneration Income R500 R2 500 R6 000 R11 000 R30 000 or more
15 - 29 years 49.4 4.3 13.7 21.1 10.1 1.5 0.0 100.0
30 - 44 years 23.8 6.3 11.4 26.0 20.3 11.9 0.4 100.0
45 - 54 years 20.3 4.3 15.2 20.5 21.7 17.7 0.4 100.0
55 - 64 years 48.6 6.5 7.4 9.2 16.4 12.0 0.0 100.0
More than 64 90.8 1.4 1.3 4.1 0.2 2.2 0.0 100.0
Total 37.9 5.0 11.7 20.2 15.8 9.2 0.2 100.0
Source: Stats SA and Own Calculations
3.4.3.2 Remuneration by Age Group
The table below shows the monthly labour remuneration by age group in the province of
Eastern Cape.
Table 3.24: Labour Remuneration by Age Group in Eastern Cape, 2008
The result of the 2008 household survey shows that the age groups 15-29 years and 54+
years lead the category of no-income earners. The age group of people between 30 and
54 years old represents the most earning group in the province and this result is expected
given their experience and history at the work place.
3.4.3.3 Remuneration by sector
The table below shows the monthly labour remuneration by industry in the province of
Eastern Cape.
Table 3.25: Labour Remuneration by Industry in Eastern Cape, 2008

47
The agriculture, forestry and fishing industry, followed by the private households and
construction industries, employed the largest share of people earning no income, R500
or less per month in the province. High-skill employment such as financial and business
services lead in the category of people earning between R11 001 and R30 000 per month,
followed by community, social and personal services. Monthly income earnings in the
wholesale and retail trade are proportionally distributed, given the nature of this industry
in terms of skill distribution.

48
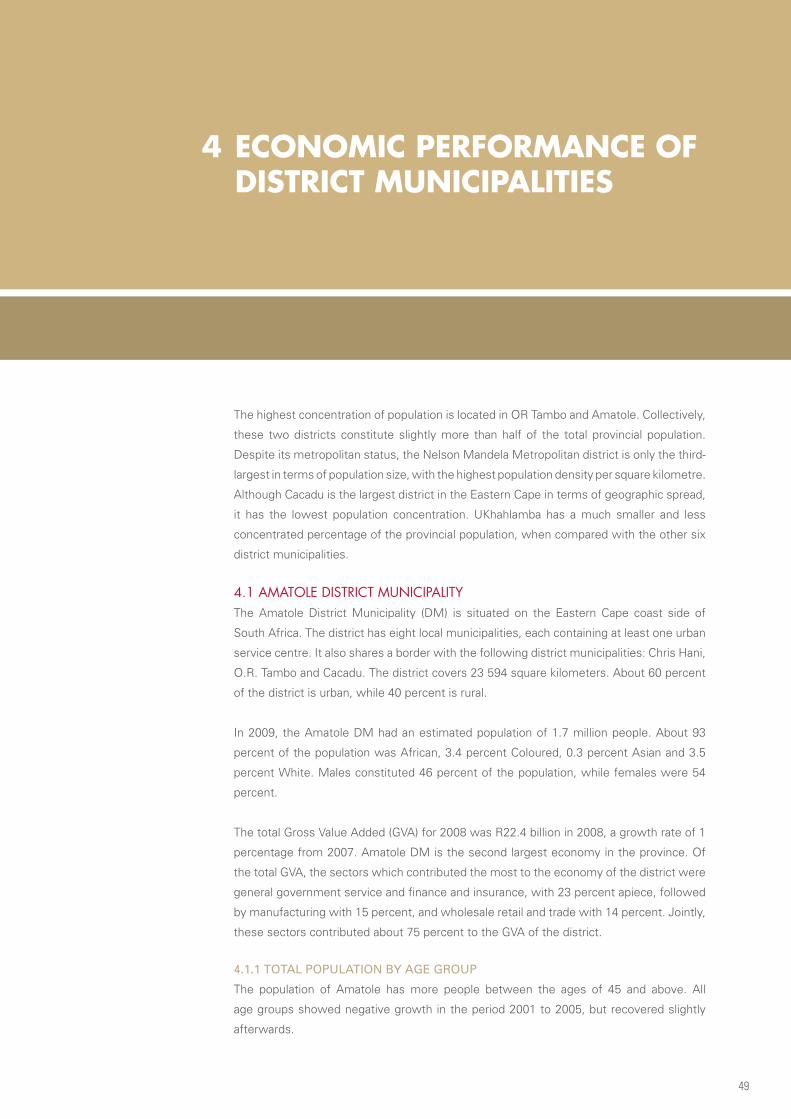
49
4 ECONOMIC PERFORMANCE OF DISTRICT MUNICIPALITIES
The highest concentration of population is located in OR Tambo and Amatole. Collectively,
these two districts constitute slightly more than half of the total provincial population.
Despite its metropolitan status, the Nelson Mandela Metropolitan district is only the third-
largest in terms of population size, with the highest population density per square kilometre.
Although Cacadu is the largest district in the Eastern Cape in terms of geographic spread,
it has the lowest population concentration. UKhahlamba has a much smaller and less
concentrated percentage of the provincial population, when compared with the other six
district municipalities.
4.1 AMATOLE DISTRICT MUNICIPALITYThe Amatole District Municipality (DM) is situated on the Eastern Cape coast side of
South Africa. The district has eight local municipalities, each containing at least one urban
service centre. It also shares a border with the following district municipalities: Chris Hani,
O.R. Tambo and Cacadu. The district covers 23 594 square kilometers. About 60 percent
of the district is urban, while 40 percent is rural.
In 2009, the Amatole DM had an estimated population of 1.7 million people. About 93
percent of the population was African, 3.4 percent Coloured, 0.3 percent Asian and 3.5
percent White. Males constituted 46 percent of the population, while females were 54
percent.
The total Gross Value Added (GVA) for 2008 was R22.4 billion in 2008, a growth rate of 1
percentage from 2007. Amatole DM is the second largest economy in the province. Of
the total GVA, the sectors which contributed the most to the economy of the district were
general government service and finance and insurance, with 23 percent apiece, followed
by manufacturing with 15 percent, and wholesale retail and trade with 14 percent. Jointly,
these sectors contributed about 75 percent to the GVA of the district.
4.1.1 TOTAL POPULATION By AgE gROUP
The population of Amatole has more people between the ages of 45 and above. All
age groups showed negative growth in the period 2001 to 2005, but recovered slightly
afterwards.
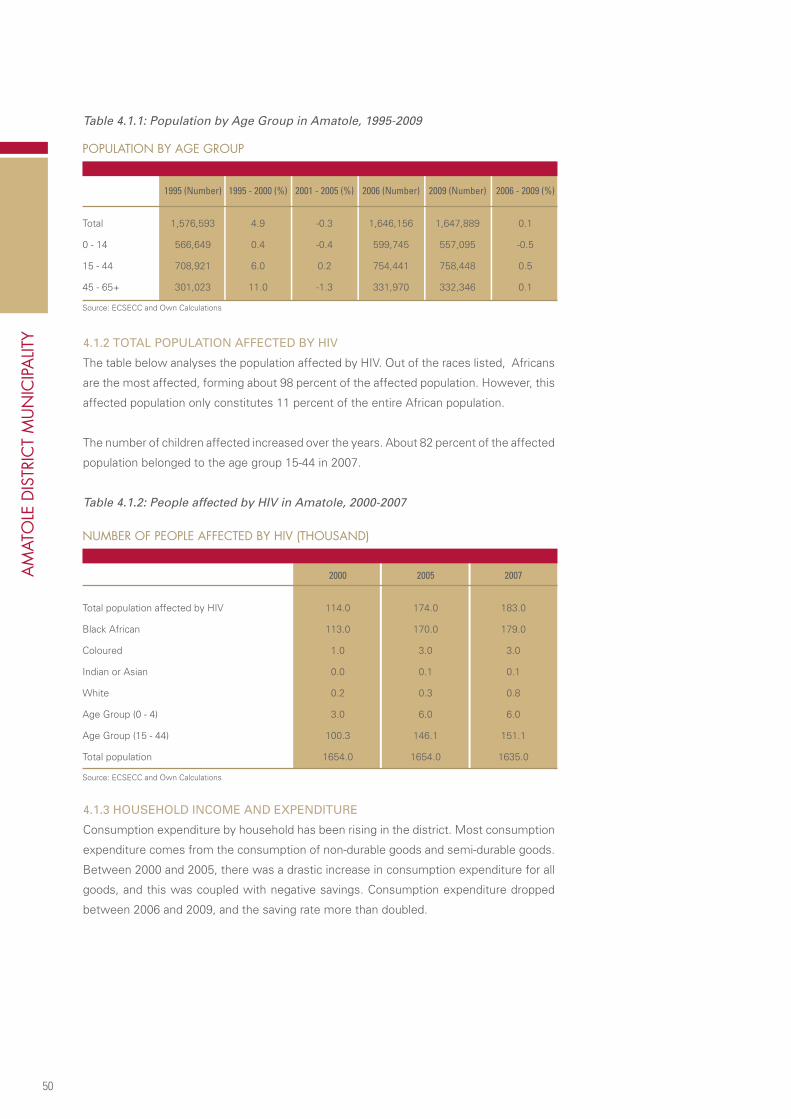
50
NUMBER OF PEOPLE AFFECTED BY HIV (THOUSAND)
2000 2005 2007
Total population affected by HIV 114.0 174.0 183.0
Black African 113.0 170.0 179.0
Coloured 1.0 3.0 3.0
Indian or Asian 0.0 0.1 0.1
White 0.2 0.3 0.8
Age Group (0 - 4) 3.0 6.0 6.0
Age Group (15 - 44) 100.3 146.1 151.1
Total population 1654.0 1654.0 1635.0
Source: ECSECC and Own Calculations
POPULATION BY AGE GROUP
1995 (Number) 1995 - 2000 (%) 2001 - 2005 (%) 2006 (Number) 2009 (Number) 2006 - 2009 (%)
Total 1,576,593 4.9 -0.3 1,646,156 1,647,889 0.1
0 - 14 566,649 0.4 -0.4 599,745 557,095 -0.5
15 - 44 708,921 6.0 0.2 754,441 758,448 0.5
45 - 65+ 301,023 11.0 -1.3 331,970 332,346 0.1
Source: ECSECC and Own Calculations
Table 4.1.1: Population by Age Group in Amatole, 1995-2009
4.1.2 TOTAL POPULATION AffECTED By HIV
The table below analyses the population affected by HIV. Out of the races listed, Africans
are the most affected, forming about 98 percent of the affected population. However, this
affected population only constitutes 11 percent of the entire African population.
The number of children affected increased over the years. About 82 percent of the affected
population belonged to the age group 15-44 in 2007.
Table 4.1.2: People affected by HIV in Amatole, 2000-2007
4.1.3 HOUSEHOLD INCOME AND ExPENDITURE
Consumption expenditure by household has been rising in the district. Most consumption
expenditure comes from the consumption of non-durable goods and semi-durable goods.
Between 2000 and 2005, there was a drastic increase in consumption expenditure for all
goods, and this was coupled with negative savings. Consumption expenditure dropped
between 2006 and 2009, and the saving rate more than doubled.
AM
ATO
LE D
ISTR
ICT
MU
NIC
IPALIT
Y

51
HOUSEHOLD INCOME AND EXPENDITURE
1995 1995 - 2001 - 2006 2009 2006 - (Number) 2000 (%) 2005 (%) (Number) (Number) 2009 (%)
Final consumption expenditure by households 11,316,749 14.1 23.2 17,932,607 20,756,075 15.7
Durable goods 1,112,020 5.7 49.8 2,134,990 2,515,147 17.8
Semi-durable goods 1,129,919 29.7 63.4 3,055,131 4,043,166 32.3
Non-durable goods 5,186,352 3.1 15.0 6,546,488 7,245,846 10.7
Services 3,888,459 26.6 13.4 1,049,813 6,951,917 12.2
Current income 13,075,326 14.5 20.6 19,958,141 20,462,394 15.0
Disposable income 11,479,061 14.3 21.7 17,799,953 20,462,394 15.0
Saving by households 162,312 31.7 -79.3 -132,654 -293,681 121.4
Source: ECSECC and Own Calculations
Table 4.1.3: Household Income and Expenditure in Amatole, 1995-2009
4.1.4 SECTORAL CONTRIBUTION ANALySIS
Amatole is the second-largest contributor to the primary sector, with only 18.3 percent of
the total sector in the province. The primary sector’s contribution in the district economy has
been less than 2 percent on average, with agriculture holding an average of 94.2 percent
of this sector in the entire district. The share of both primary and secondary sectors in the
district economy has decreased over the years. The secondary sector has represented an
average of 21.5 percent of the district production and 27.6 percent of the total sector in the
province. On average, the manufacturing industry alone has contributed 81.3 percent to
the sector, representing 26.9 percent of the provincial manufacturing industry. The tertiary
sector is the dominant sector in the region, with 76.7 percent of the total production.
Finance, insurance, real estate and business services, general government and wholesale
industry are the major industries, with 80 percent of the tertiary sector.
Figure 4.1: GVA Contribution for Amatole, 1995-2008

52
4.1.5 SECTORAL gROWTH ANALySIS
The primary sector contributed less than 2 percent to the economy of the Amatole District
Municipality (DM) in 2008. More than 95 percent of this contribution was derived from the
agriculture, forestry and fishing industry. Between 1995 and 2000, growth in this sector
was negative, in line with provincial growth, and started growing around 2001 and 2005
before declining, although it still remained slightly above 1 percent. The growth rate of the
DM has always been less than that of the province. The growth of agriculture, forestry
and fishing, which has been a mirror image of the entire primary sector in the Amatole DM
despite showing the same trend as the national growth, has always lagged the provincial
growth rate.
The secondary sector, which is the second-largest contributor to the district’s economy,
has experienced negative since 2001. This growth rate is contrary to the one showed by
the province, which has been both positive and growing steadily. This pattern of growth has
been mimicked by manufacturing, which is the leading industry within this sector. There
has been a gradual contraction in the growth of the secondary sector in the Amatole DM.
The tertiary sector, which is the dominant sector in the Amatole DM, is the only one that
has shown resilience from 1995 to 2008. It recorded positive growth, which has been
increasing steadily over the period under review. This has been the case for the provincial
growth of the sector. Out of the three leading industries in terms of growth, only two
have grown without decreasing in momentum, namely, finance, insurance, real estate and
business services and general government services. Growth in finance, insurance, real
estate and business services increased between 2001 and 2005, and also between 2001
and 2008, compared to the growth between 1995 and 2000. General government services
has grown gradually despite the difference in growth recorded between the district and
provincial growth in 2001 and 2006, when provincial growth shot up to just above 6
percent, while the district trailed with 1 percent. Wholesale and retail trade, catering and
accommodation has declined in growth when compared to the period 1995 to 2000. Also,
in relation to the provincial growth, this industry’s growth has dropped.
AM
ATO
LE D
ISTR
ICT
MU
NIC
IPALIT
Y

53
ACCESS TO WATER (%)
Average 1995 - 2005 2006 2007 2008 2009
Piped water inside dwelling 21.1 19.0 18.9 18.6 18.3
Piped water inside yard 15.0 17.2 17.3 17.6 17.8
Piped water on community stand:distance less than 200m from dwelling 20.8 18.6 18.5 18.2 18.0
Piped water on community stand:distance greater than 200m from dwell. 9.7 13.7 13.8 14.4 14.9
Borehole/rain-water tank/well 3.8 4.1 4.1 4.1 4.2
Dam/river/stream/spring 27.3 25.3 25.3 25.0 24.7
Water carrier/tanker/water vendor 0.7 0.4 0.4 0.3 0.3
Other/unspecified/dummy 1.6 1.8 1.8 1.8 1.8
Source: ECSECC and Own Calculations
AMATOLE DM: AVERAGE GROWTH (%)
1995 - 2000 2001 - 2005 2001 - 2008
EC -0.2% 3.1% 1.7%
PRIMARY SEC. Amatole DM -1.7% 2.4% 1.1%
EC -0.2% 3.1% 1.8%
AFF Amatole DM -1.4% 2.6% 1.3%
EC 2.6% 2.8% 3.2%
SECONDARY SEC. Amatole DM 1.2% -0.7% -1.1%
EC -0.2% 3.1% 1.8%
MAN Amatole DM 0.6% -0.8% -1.2%
EC 2.5% 3.3% 3.6%
TERTIARY SEC. Amatole DM 1.8% 2.4% 2.7%
EC 1.2% 6.3% 6.0%
FIBS Amatole DM 1.3% 5.8% 5.3%
EC 1.3% 6.3% 2.0%
GGS Amatole DM 0.9% 1.0% 1.7%
EC 3.7% 2.2% 2.7%
WRTCA Amatole DM 2.4% 0.1% 0.2%
Source: Own Calculation and Quantec Research
Table 4.1.4: Sectoral Growth for Amatole, 1995-2008
4.1.6 ACCESS TO SERVICES
4.1.6.1 Access to Water
The number of households with access to piped water inside their dwellings has increased
from 66.6 percent between 1995 and 2005 to 69.0 percent in 2009. About 31 percent of
households continue to access water through boreholes, dams, rivers, streams and other
modes.
Table 4.1.5: Access to Water in Amatole, 1995-2009

54
4.1.6.2 Access to Energy
The majority of the population uses electricity and paraffin for lighting. Households using
electricity for lighting have increased by approximately 6 percent, which was coupled with
a decrease of about 6 percent in households using paraffin. The number of people using
candles for lighting grew by less than half a percentage point.
Table 4.1.6: Access to Energy in Amatole, 1995-2009
ACCESS TO ENERGY (%)
Average 1995 - 2005 2006 2007 2008 2009
Solar/other/unspecified 0.8 0.6 0.6 0.6 0.6
Electricity 44.9 49.9 49.8 50.5 51.2
Gas 0.6 0.5 0.5 0.4 0.4
Paraffin 47.1 42.0 42.1 41.4 40.7
Candles 6.6 7.0 7.1 7.1 7.2
Source: ECSECC and Own Calculations
4.1.6.3 Access to Sanitation
A growth rate of less than 1 percentage point was observed in the number of households
using flushed or chemical toilets between 2005 and 2009. Households using pit latrines,
bucket latrines, and other forms of waste removal have remained above 60 percent since
the period 1995 and 2005.
Table 4.1.7: Access to Sanitation in Amatole, 1995-2009
ACCESS TO SANITATION (%)
Average 1995 - 2005 2006 2007 2008 2009
Flush or chemical toilet 37.8 38.4 38.4 38.5 38.6
Pit latrine 31.0 29.7 29.6 29.4 29.2
Bucket latrine 2.8 2.7 2.6 2.6 2.6
None of the above 28.3 29.2 29.4 29.5 29.6
Unspecified/dummy 0.2 0.1 0.1 0.1 0.1
Source: ECSECC and Own Calculations
AM
ATO
LE D
ISTR
ICT
MU
NIC
IPALIT
Y
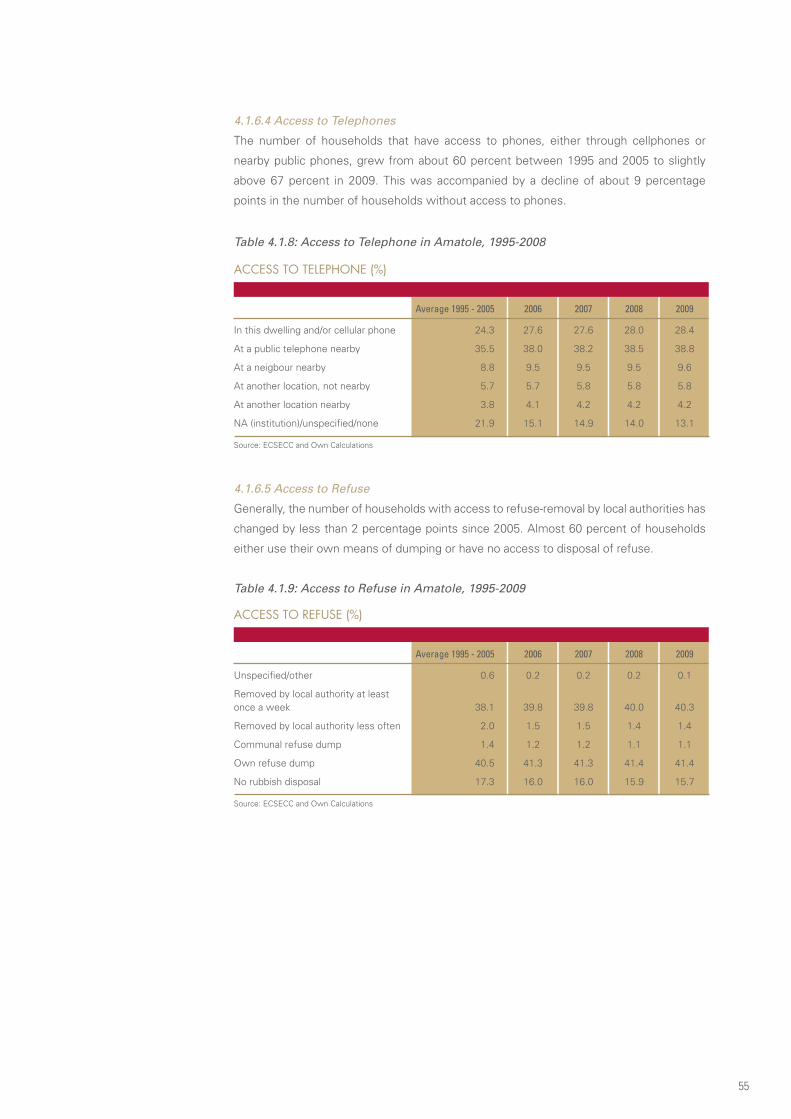
55
4.1.6.4 Access to Telephones
The number of households that have access to phones, either through cellphones or
nearby public phones, grew from about 60 percent between 1995 and 2005 to slightly
above 67 percent in 2009. This was accompanied by a decline of about 9 percentage
points in the number of households without access to phones.
ACCESS TO TELEPHONE (%)
Average 1995 - 2005 2006 2007 2008 2009
In this dwelling and/or cellular phone 24.3 27.6 27.6 28.0 28.4
At a public telephone nearby 35.5 38.0 38.2 38.5 38.8
At a neigbour nearby 8.8 9.5 9.5 9.5 9.6
At another location, not nearby 5.7 5.7 5.8 5.8 5.8
At another location nearby 3.8 4.1 4.2 4.2 4.2
NA (institution)/unspecified/none 21.9 15.1 14.9 14.0 13.1
Source: ECSECC and Own Calculations
ACCESS TO REFUSE (%)
Average 1995 - 2005 2006 2007 2008 2009
Unspecified/other 0.6 0.2 0.2 0.2 0.1
Removed by local authority at least once a week 38.1 39.8 39.8 40.0 40.3
Removed by local authority less often 2.0 1.5 1.5 1.4 1.4
Communal refuse dump 1.4 1.2 1.2 1.1 1.1
Own refuse dump 40.5 41.3 41.3 41.4 41.4
No rubbish disposal 17.3 16.0 16.0 15.9 15.7
Source: ECSECC and Own Calculations
Table 4.1.8: Access to Telephone in Amatole, 1995-2008
4.1.6.5 Access to Refuse
Generally, the number of households with access to refuse-removal by local authorities has
changed by less than 2 percentage points since 2005. Almost 60 percent of households
either use their own means of dumping or have no access to disposal of refuse.
Table 4.1.9: Access to Refuse in Amatole, 1995-2009

56
4.1.7 TyPES Of DWELLINg
The numbers of people with access to a house on a separate stand or a traditional
dwelling, are the highest in the district. They account for approximately 70 percent of the
population. But there has not been much change in growth since 1995.
Table 4.1.10: Access to Housing in Amatole, 1995-2009
TYPES OF DWELLING (%)
Average 1995 - 2005 2006 2007 2008 2009
House or brick structure on a separate stand or yard 41.2 41.2 41.1 41.1 41.1
Traditional dwelling/hut/structure madeof traditional materials 33.2 31.9 31.8 31.6 31.5
Flat in a block of flats 3.2 3.4 3.5 3.5 3.5
Town/cluster/semi-detached house(simplex, duplex or triplex) 1.2 1.1 1.1 1.1 1.1
House/flat/room in backyard 2.4 2.2 2.2 2.2 2.1
Informal dwelling/shack in backyard 3.5 3.4 3.4 3.4 3.4
Informal dwelling/shack, NOT in back-yard, e.g. in an informal settlement 12.5 14.0 14.2 14.5 14.7
Room/flatlet not in backyard, but ona shared property 1.0 0.8 0.8 0.8 0.7
Other/unspecified/NA 1.8 1.9 1.9 1.9 1.9
Source: ECSECC and Own Calculations
4.1.8 fORMAL EMPLOyMENT By SECTOR
Economic sectors were dealt a huge blow between 1995 and 2000, with nine of the
11 sectors recording job losses. There were slight improvements between 2001 and
2005, with five sectors shedding jobs. About 80 percent of the people in the district
were employed in the tertiary sector, followed by the secondary and primary sectors.
The propensity to shed jobs has continued to plague the sectors in this district, with the
highest rate of losses registered in agriculture, forestry and fishing.
Table 4.1.11: Formal employment by sector in Amatole, 1995-2008
NUMBER OF PEOPLE EMPLOYED BY SECTOR
1995 1995 - 2001 - 2006 2008 2006 - (Number) 2000 (%) 2005 (%) (Number) (Number) 2008 (%)
AFF 12,973 -14.9 14.0 9,006 8,064 -10.5
MQ 2,086 -53.4 -17.1 747 716 -4.1
MAN 46,800 -15.0 -6.2 36,143 34,695 -4.0
EGW 1,095 -10.5 -3.2 931 918 -1.4
CON 14,496 -28.0 0.8 11,036 10,638 -3.6
WRTCA 26,014 13.4 9.9 33,756 35,214 4.3
TSC 8,714 -28.1 0.4 6,175 6,072 -1.7
FIBS 17,534 41.2 20.2 33,451 36,596 9.4
CSPS 90,753 -6.2 -2.4 81,834 81,412 -0.5
OGSS 33,446 2.0 -3.6 32,241 32,064 -0.5
GSS 57,307 -10.9 -1.6 49,593 49,348 0.5
Source: ECSECC and Own Calculations
AM
ATO
LE D
ISTR
ICT
MU
NIC
IPALIT
Y

57
DEPENDENCY RATIO
1995 (%) 2000 (%) 2005 (%) 2009 (%)
73.3 69.3 67.9 67.1
Source: ECSECC and Own Calculations
NUMBER OF PEOPLE EMPLOYED BY SKILL
1995 1995 - 2001 - 2006 2008 2006 - (Number) 2000 (%) 2005 (%) (Number) (Number) 2008 (%)
Formal and informal
employment 269,885 -3.1 -1.0 259,003 256,709 -0.9
Informal employment 49,419 6.3 -10.0 45,925 42,384 -7.7
Formal employment 220,466 -5.3 1.1 213,078 214,326 0.6
High skilled 33,738 -11.3 -1.5 29,135 28,726 -1.4
Skilled 86,304 1.7 5.9 95,854 98,548 2.8
Semi- and unskilled 100,424 -9.2 -2.7 88,089 87,052 -1.2
Source: Quantec Research and Own Calculations
4.1.9 INfORMAL AND fORMAL EMPLOyMENT By SkILL
Since 2001, the informal sector has been shedding jobs, with about 10 percent of losses
recorded between 2001 and 2005. Most people are employed in the formal sector, with
most jobs being shed in those industries requiring highly skilled individuals.
Table 4.1.12: Informal and Formal Employment by Skill in Amatole, 1995-2008
4.1.10 DEPENDENCy RATIO
The dependency ratio in the district has been decreasing since 1995, and was 67.1 percent
in 2009. This is indicative of the fact that the number of people who are not economically
active has decreased proportionally. However, more than half of the households still earn
not more than R3 500 per month.
Table 4.1.13: Dependency Ratio in Amatole, 1995-2009
4.1.11 LEVEL Of EDUCATION
The majority of the people in the district have no education, and the rate of growth
still remains negative. Since 2000, there has been no significant change in the number
of people with Grade 12. Between 1995 and 2000, the number of pupils that have a
Bachelor’s degree and a diploma doubled, and there was 85% growth in the number of
people who pursued an Honours degree. On the other hand, the growth rate of illiterate
pupils has also been negative.

58
LEVEL OF EDUCATION
1995 1995 - 2001 - 2006 2009 2006 - (Number) 2000 (%) 2005 (%) (Number) (Number) 2009 (%)
Total 1,576,593 4.9 -0.3 1,646,156 1,647,889 0.1
Grade 0 / No schooling 313,490 -11.9 -1.0 259,528 252,083 -2.9
Grade 12 111,420 22.8 0.2 142,141 145,270 2.2
Less than matric and certificate / diploma 11,211 -29.2 -3.2 6,754 6,182 -8.5
Certificate with Grade 12 6,906 56.0 1.4 11,835 12,402 4.8
Diploma with Grade 12 26,137 21.8 0.9 33,231 34,043 2.4
Bachelor’s Degree 8,446 6.8 1.2 9,159 9,255 1.1
Bachelor’s Degree and Diploma 1,626 104.7 2.3 3,825 4,087 6.8
Honours Degree 1,030 84.1 2.5 2,158 2,295 6.4
Higher Degree (Master’s /
Doctorate) 1,178 60.1 1.2 2,073 2,172 4.8
Other (unspecified) 191,186 -12.1 -0.5 158,957 154,943 -2.5
Source: ECSECC and Own Calculations
LITERATE / ILLITERATE
1995 1995 - 2001 - 2006 2009 2006 - (Number) 2000 (%) 2005 (%) (Number) (Number) 2009 (%)
Illiterate 313,490 -11.9 -1.0 259,528 252,083 -2.9
Literate 540,933 11.4 -0.3 609,129 614,448 0.9
Source: ECSECC and Own Calculations
Table 4.1.14: Level of Education in Amatole, 1995-2009
AM
ATO
LE D
ISTR
ICT
MU
NIC
IPALIT
Y
Table 4.1.15: Literacy level in Amatole, 1995-2009
4.1.12 NUMBER Of PEOPLE IN POVERTy
The district saw a rise in the number of people living in poverty between 1995 and 2005,
before it fell to 55.1 percent of the total population in 2009. Despite this decrease, more
than half of the population is still categorised as poor in the second-largest economy in
the province.
Table 4.1.16: People in Poverty in Amatole, 1995-2009
NUMBER OF PEOPLE IN POVERTY
1995 (%) 2000 (%) 2005 (%) 2009 (%)
53.1 63.0 64.98 55.1
Source: ECSECC and Own Calculations
4.1.13 DISTRIBUTION Of HOUSEHOLDS By INCOME
The household distribution per income group indicates that the income levels of the
population have improved over the years, with most households earning between R1 001
and R3 500. There has been a reduction in the number of households earning less than
R3 500, from about 78 percent in 1995 to about 52 percent in 2009. This was coupled with
an increase in households earning more than R3 500, from approximately 22 percent in
1995 to almost 48 percent in 2009.
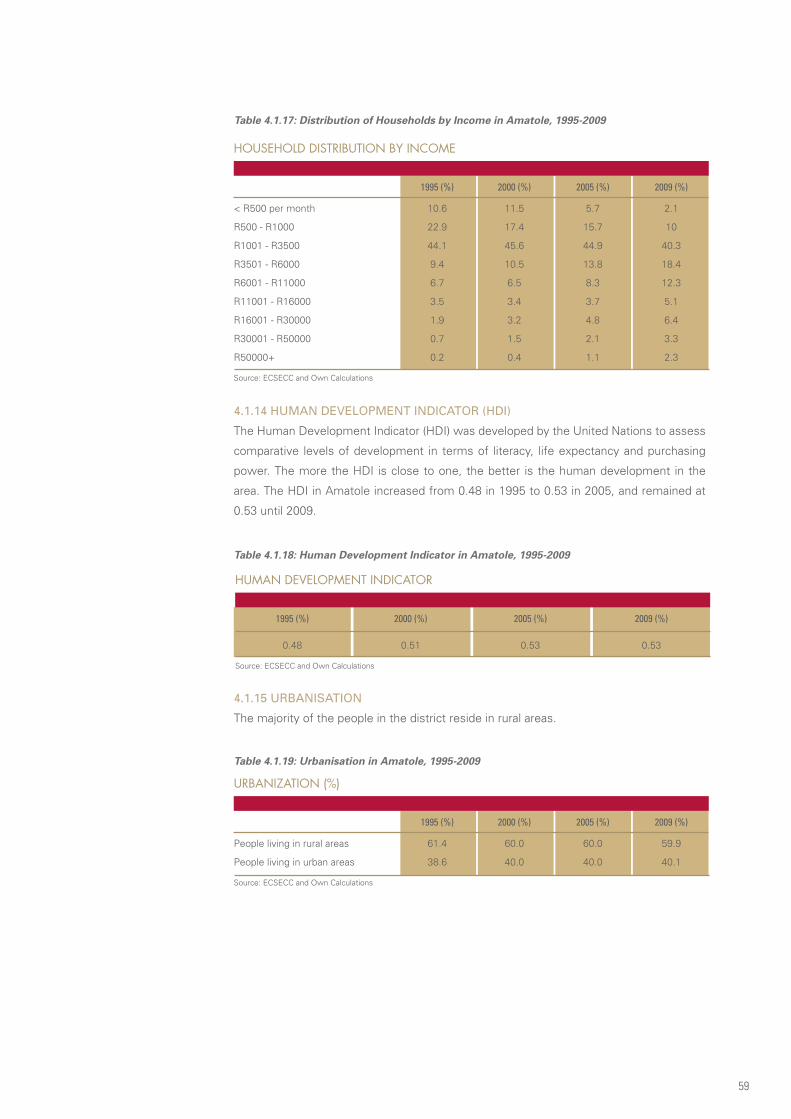
59
HOUSEHOLD DISTRIBUTION BY INCOME
1995 (%) 2000 (%) 2005 (%) 2009 (%)
< R500 per month 10.6 11.5 5.7 2.1
R500 - R1000 22.9 17.4 15.7 10
R1001 - R3500 44.1 45.6 44.9 40.3
R3501 - R6000 9.4 10.5 13.8 18.4
R6001 - R11000 6.7 6.5 8.3 12.3
R11001 - R16000 3.5 3.4 3.7 5.1
R16001 - R30000 1.9 3.2 4.8 6.4
R30001 - R50000 0.7 1.5 2.1 3.3
R50000+ 0.2 0.4 1.1 2.3
Source: ECSECC and Own Calculations
URBANIZATION (%)
1995 (%) 2000 (%) 2005 (%) 2009 (%)
People living in rural areas 61.4 60.0 60.0 59.9
People living in urban areas 38.6 40.0 40.0 40.1
Source: ECSECC and Own Calculations
Table 4.1.17: Distribution of Households by Income in Amatole, 1995-2009
4.1.14 HUMAN DEVELOPMENT INDICATOR (HDI)
The Human Development Indicator (HDI) was developed by the United Nations to assess
comparative levels of development in terms of literacy, life expectancy and purchasing
power. The more the HDI is close to one, the better is the human development in the
area. The HDI in Amatole increased from 0.48 in 1995 to 0.53 in 2005, and remained at
0.53 until 2009.
Table 4.1.18: Human Development Indicator in Amatole, 1995-2009
HUMAN DEVELOPMENT INDICATOR
1995 (%) 2000 (%) 2005 (%) 2009 (%)
0.48 0.51 0.53 0.53
Source: ECSECC and Own Calculations
4.1.15 URBANISATION
The majority of the people in the district reside in rural areas.
Table 4.1.19: Urbanisation in Amatole, 1995-2009

60
4.2 ALFRED NZO DISTRICT MUNICIPALITYThe Alfred Nzo District Municipality consists of two local municipalities, namely, Umzimkulu
and Umzimvubu local municipalities. It is situated on the north-eastern part of the Eastern
Cape and shares a border with KwaZulu-Natal, the Kingdom of Lesotho and the two other
Eastern Cape district municipalities, namely, Ukhahlamba and O.R. Tambo. The district
covers 6 859 square meters. The Umzimkulu local municipality is an island within KwaZulu-
Natal. About 94 percent of the population is rural, while 6 percent is urban.
The total population of the Alfred Nzo District Municipality consisted of 437 707 people in
2008 and increased to 442 050 in 2009. These figures were made up of 98.9 percent of
Africans, 0.7 percent of Coloureds, 0.1 percent of Asians and only 0.3 percent of Whites.
About 45 percent of the 2009 total population was male and the remaining 55 percent was
female. There has been no increase in gender proportion since 2008.
The total Gross Value Added for 2008 was R2.1 billion, a growth of almost 3 percent.
Alfred Nzo is the smallest economy in the province. Of this total, the sectors which
contributed the most to the economy of the district were general government services
with 35 percent, followed by community, social and personal services with 18 percent,
finance and insurance with 14 percent, and wholesale and retail trade with 11 percent.
4.2.1 TOTAL POPULATION By AgE gROUP
The age group of people between 45 years and above has been growing faster than any
other age group in the district municipality. However, all population groups recorded a
decline in growth for the period 2006 to 2009 compared to the previous two periods. The
total population growth declined to just above 4 percent in 2006 to 2009.
Table 4.2.1: Population by Age Group in Alfred Nzo, 1995-2009
ALF
RED
NZO
DIS
TRIC
T M
UN
ICIPA
LITY
POPULATION BY AGE GROUP
1995 (Number) 1995 - 2000 (%) 2001 - 2005 (%) 2006 (Number) 2009 (Number) 2006 - 2009 (%)
Total 367,880 5.0 6.5 424,580 442,050 4.1
0 - 14 165,582 1.9 6.2 183,484 190,120 3.6
15 - 44 139,170 7.0 6.9 165,231 172,678 4.5
45 - 65+ 63,128 8.5 6.6 75,865 79,252 4.5
Source: ECSECC and Own Calculations
4.2.2 TOTAL POPULATION AffECTED By HIV
The total number of people affected by HIV increased from about 23 000 to 41 000 between
2000 and 2007. Africans are the most affected, forming an alarming 99 percent of the
total affected population, followed by Coloureds, Whites and Asians. Despite a decrease
from about 87 percent to about 77 percent in the number of people aged between 15 and
44 years who were affected by HIV, this group remains the most affected.
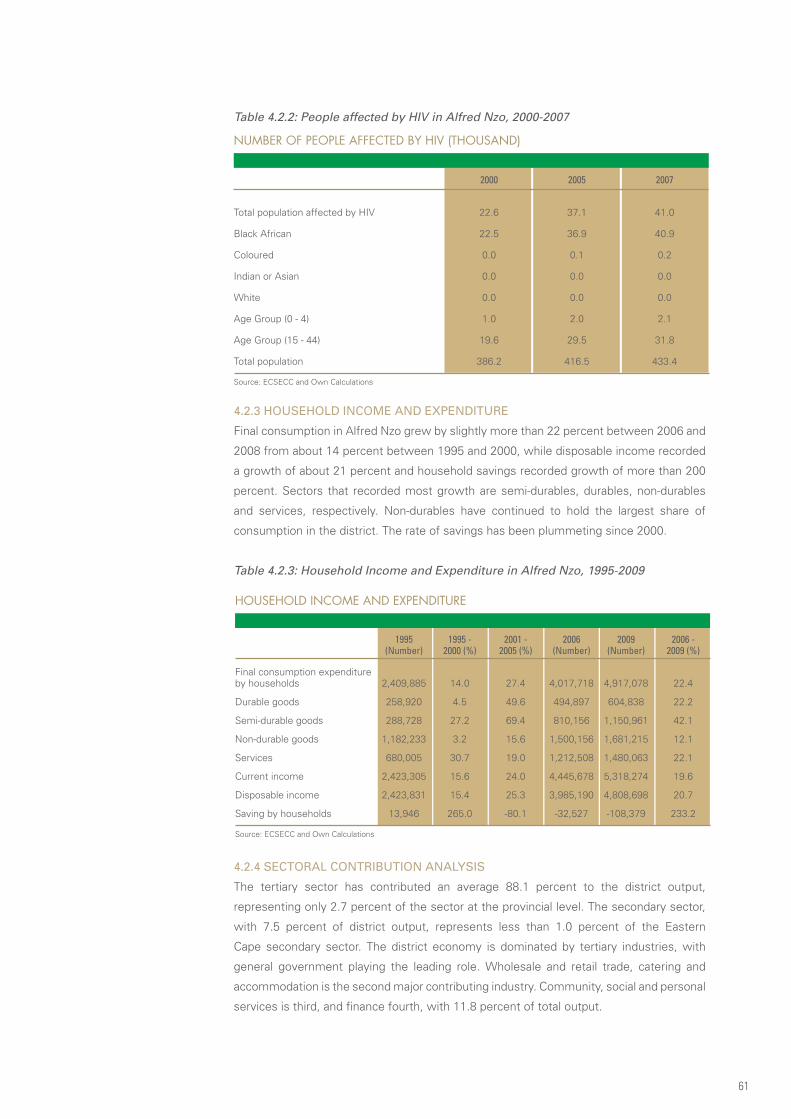
61
Table 4.2.2: People affected by HIV in Alfred Nzo, 2000-2007
HOUSEHOLD INCOME AND EXPENDITURE
1995 1995 - 2001 - 2006 2009 2006 - (Number) 2000 (%) 2005 (%) (Number) (Number) 2009 (%)
Final consumption expenditure by households 2,409,885 14.0 27.4 4,017,718 4,917,078 22.4
Durable goods 258,920 4.5 49.6 494,897 604,838 22.2
Semi-durable goods 288,728 27.2 69.4 810,156 1,150,961 42.1
Non-durable goods 1,182,233 3.2 15.6 1,500,156 1,681,215 12.1
Services 680,005 30.7 19.0 1,212,508 1,480,063 22.1
Current income 2,423,305 15.6 24.0 4,445,678 5,318,274 19.6
Disposable income 2,423,831 15.4 25.3 3,985,190 4,808,698 20.7
Saving by households 13,946 265.0 -80.1 -32,527 -108,379 233.2
Source: ECSECC and Own Calculations
NUMBER OF PEOPLE AFFECTED BY HIV (THOUSAND)
2000 2005 2007
Total population affected by HIV 22.6 37.1 41.0
Black African 22.5 36.9 40.9
Coloured 0.0 0.1 0.2
Indian or Asian 0.0 0.0 0.0
White 0.0 0.0 0.0
Age Group (0 - 4) 1.0 2.0 2.1
Age Group (15 - 44) 19.6 29.5 31.8
Total population 386.2 416.5 433.4
Source: ECSECC and Own Calculations
4.2.3 HOUSEHOLD INCOME AND ExPENDITURE
Final consumption in Alfred Nzo grew by slightly more than 22 percent between 2006 and
2008 from about 14 percent between 1995 and 2000, while disposable income recorded
a growth of about 21 percent and household savings recorded growth of more than 200
percent. Sectors that recorded most growth are semi-durables, durables, non-durables
and services, respectively. Non-durables have continued to hold the largest share of
consumption in the district. The rate of savings has been plummeting since 2000.
Table 4.2.3: Household Income and Expenditure in Alfred Nzo, 1995-2009
4.2.4 SECTORAL CONTRIBUTION ANALySIS
The tertiary sector has contributed an average 88.1 percent to the district output,
representing only 2.7 percent of the sector at the provincial level. The secondary sector,
with 7.5 percent of district output, represents less than 1.0 percent of the Eastern
Cape secondary sector. The district economy is dominated by tertiary industries, with
general government playing the leading role. Wholesale and retail trade, catering and
accommodation is the second major contributing industry. Community, social and personal
services is third, and finance fourth, with 11.8 percent of total output.
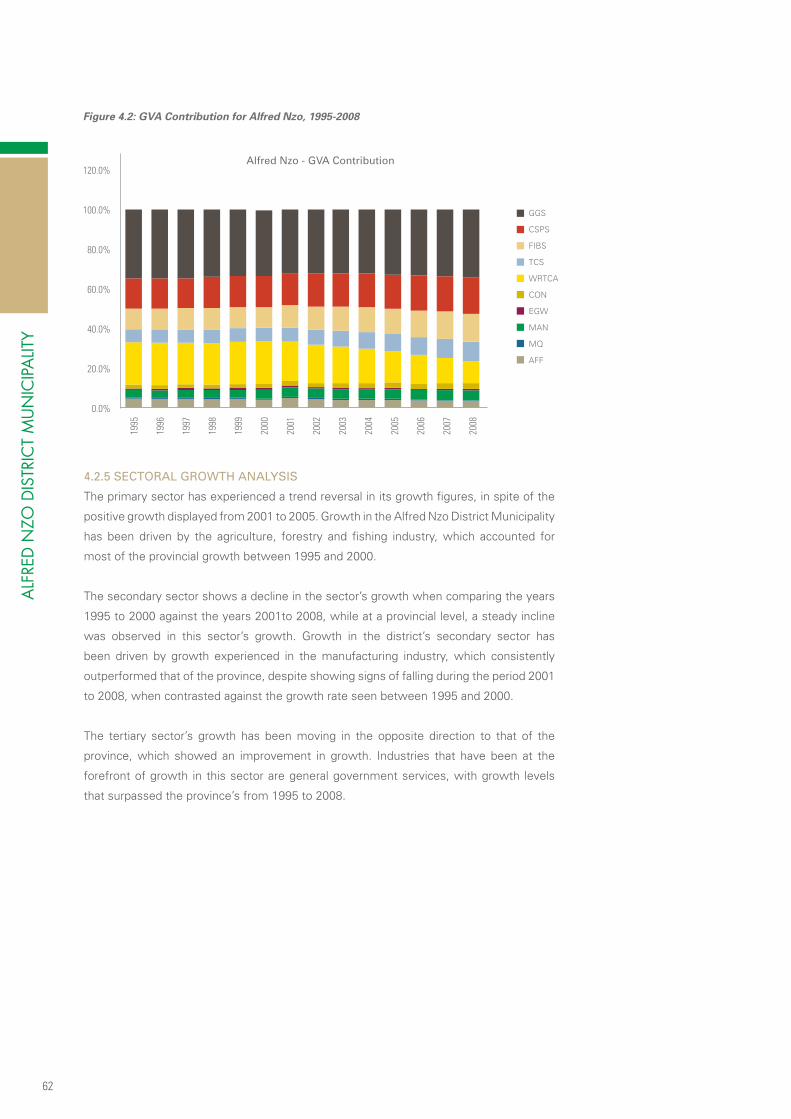
62
Figure 4.2: GVA Contribution for Alfred Nzo, 1995-2008
4.2.5 SECTORAL gROWTH ANALySIS
The primary sector has experienced a trend reversal in its growth figures, in spite of the
positive growth displayed from 2001 to 2005. Growth in the Alfred Nzo District Municipality
has been driven by the agriculture, forestry and fishing industry, which accounted for
most of the provincial growth between 1995 and 2000.
The secondary sector shows a decline in the sector’s growth when comparing the years
1995 to 2000 against the years 2001to 2008, while at a provincial level, a steady incline
was observed in this sector’s growth. Growth in the district’s secondary sector has
been driven by growth experienced in the manufacturing industry, which consistently
outperformed that of the province, despite showing signs of falling during the period 2001
to 2008, when contrasted against the growth rate seen between 1995 and 2000.
The tertiary sector’s growth has been moving in the opposite direction to that of the
province, which showed an improvement in growth. Industries that have been at the
forefront of growth in this sector are general government services, with growth levels
that surpassed the province’s from 1995 to 2008.
ALF
RED
NZO
DIS
TRIC
T M
UN
ICIPA
LITY

63
ALFRED NZO DM: AVERAGE GROWTH (%)
1995 - 2000 2001 - 2005 2001 - 2008
EC -0.2% 3.1% 1.7%
PRIMARY SEC. Alfred Nzo DM 2.0% 2.4% 0.8%
EC -0.2% 3.1% 1.8%
AFF Alfred Nzo DM 2.1% 3.1% 1.6%
EC 2.6% 2.8% 3.2%
SECONDARY SEC. Alfred Nzo DM 7.3% 4.8% 4.9%
EC -0.2% 3.1% 1.8%
MAN Alfred Nzo DM 8.4% 4.4% 4.3%
EC 2.5% 3.3% 3.6%
TERTIARY SEC. Alfred Nzo DM 4.5% 2.5% 2.7%
EC 1.3% 1.0% 3.0%
GGS Alfred Nzo DM 3.7% 2.3% 4.3%
Source: Own Calculation and Quantec Research
Table 4.2.4: Sectoral Growth for Alfred Nzo, 1995-2008
4.2.6 ACCESS TO SERVICES
4.2.6.1 Access to Water
In 2009, about 43 percent of households had access to piped water, an increase of more
than 6 percent from the 1995 to 2005 figure. This was accompanied by a decrease of
about 7 percent in the number of people who drew water from dams, streams, springs,
tankers and other modes.
Table 4.2.5: Access to Water in Alfred Nzo, 1995-2009
ACCESS TO WATER (%)
Average 1995 - 2005 2006 2007 2008 2009
Piped water inside dwelling 3.8 4.8 5.0 2.1 5.2
Piped water inside yard 7.6 7.9 7.8 7.9 7.9
Piped water on community stand:distance less than 200m from dwelling 13.9 13.5 13.4 13.4 13.4
Piped water on community stand:distance greater than 200m from dwell. 11.8 15.9 15.9 16.4 16.8
Borehole/rain-water tank/well 7.1 5.6 5.5 5.3 5.2
Dam/river/stream/spring 53.7 50.3 50.4 50.0 49.6
Water carrier/tanker/water vendor 0.6 0.4 0.4 0.4 0.4
Other/unspecified/dummy 1.6 1.6 1.6 1.6 1.6
Source: ECSECC and Own Calculations
4.2.6.2 Access to Energy
The majority of households in Alfred Nzo use candles for energy. The number of households
that have access to electricity increased from 16.1 percent between 1995 and 2005 to
19.8 percent in 2009. This increase was associated with a decrease of about 3 percent in
households using candles for energy.
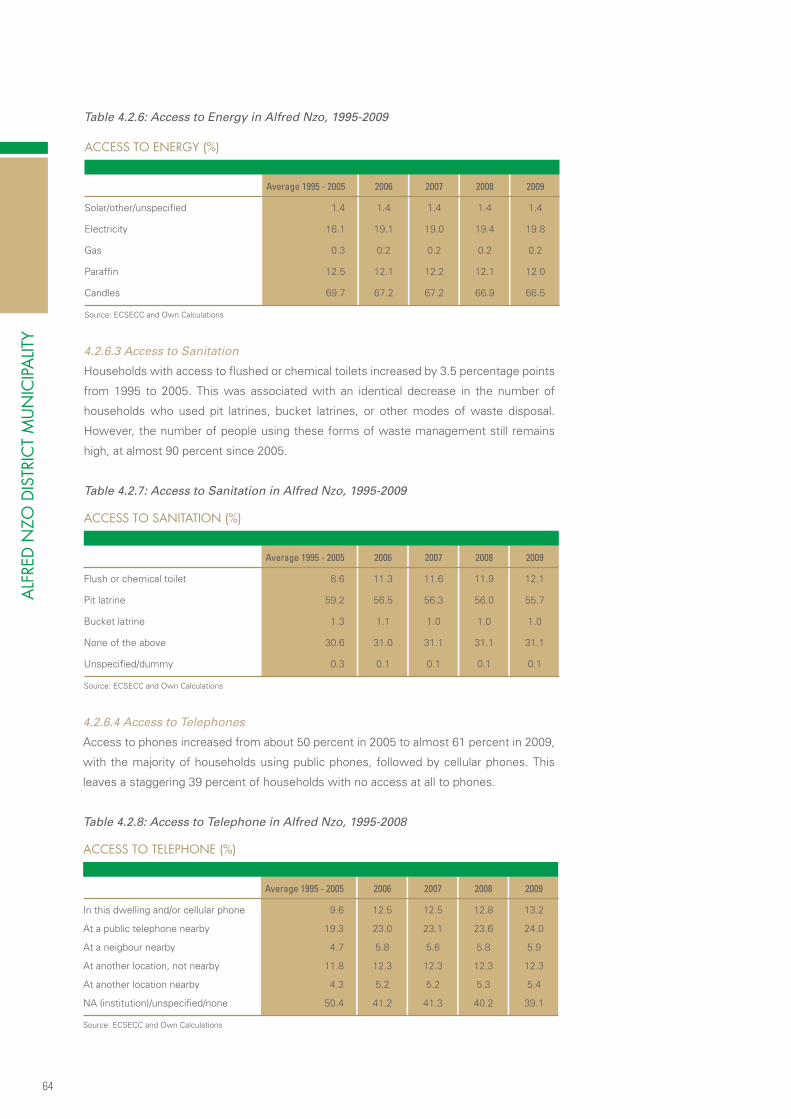
64
ALF
RED
NZO
DIS
TRIC
T M
UN
ICIPA
LITY
Table 4.2.6: Access to Energy in Alfred Nzo, 1995-2009
ACCESS TO ENERGY (%)
Average 1995 - 2005 2006 2007 2008 2009
Solar/other/unspecified 1.4 1.4 1.4 1.4 1.4
Electricity 16.1 19.1 19.0 19.4 19.8
Gas 0.3 0.2 0.2 0.2 0.2
Paraffin 12.5 12.1 12.2 12.1 12.0
Candles 69.7 67.2 67.2 66.9 66.5
Source: ECSECC and Own Calculations
ACCESS TO SANITATION (%)
Average 1995 - 2005 2006 2007 2008 2009
Flush or chemical toilet 8.6 11.3 11.6 11.9 12.1
Pit latrine 59.2 56.5 56.3 56.0 55.7
Bucket latrine 1.3 1.1 1.0 1.0 1.0
None of the above 30.6 31.0 31.1 31.1 31.1
Unspecified/dummy 0.3 0.1 0.1 0.1 0.1
Source: ECSECC and Own Calculations
ACCESS TO TELEPHONE (%)
Average 1995 - 2005 2006 2007 2008 2009
In this dwelling and/or cellular phone 9.6 12.5 12.5 12.8 13.2
At a public telephone nearby 19.3 23.0 23.1 23.6 24.0
At a neigbour nearby 4.7 5.8 5.6 5.8 5.9
At another location, not nearby 11.8 12.3 12.3 12.3 12.3
At another location nearby 4.3 5.2 5.2 5.3 5.4
NA (institution)/unspecified/none 50.4 41.2 41.3 40.2 39.1
Source: ECSECC and Own Calculations
4.2.6.3 Access to Sanitation
Households with access to flushed or chemical toilets increased by 3.5 percentage points
from 1995 to 2005. This was associated with an identical decrease in the number of
households who used pit latrines, bucket latrines, or other modes of waste disposal.
However, the number of people using these forms of waste management still remains
high, at almost 90 percent since 2005.
Table 4.2.7: Access to Sanitation in Alfred Nzo, 1995-2009
4.2.6.4 Access to Telephones
Access to phones increased from about 50 percent in 2005 to almost 61 percent in 2009,
with the majority of households using public phones, followed by cellular phones. This
leaves a staggering 39 percent of households with no access at all to phones.
Table 4.2.8: Access to Telephone in Alfred Nzo, 1995-2008
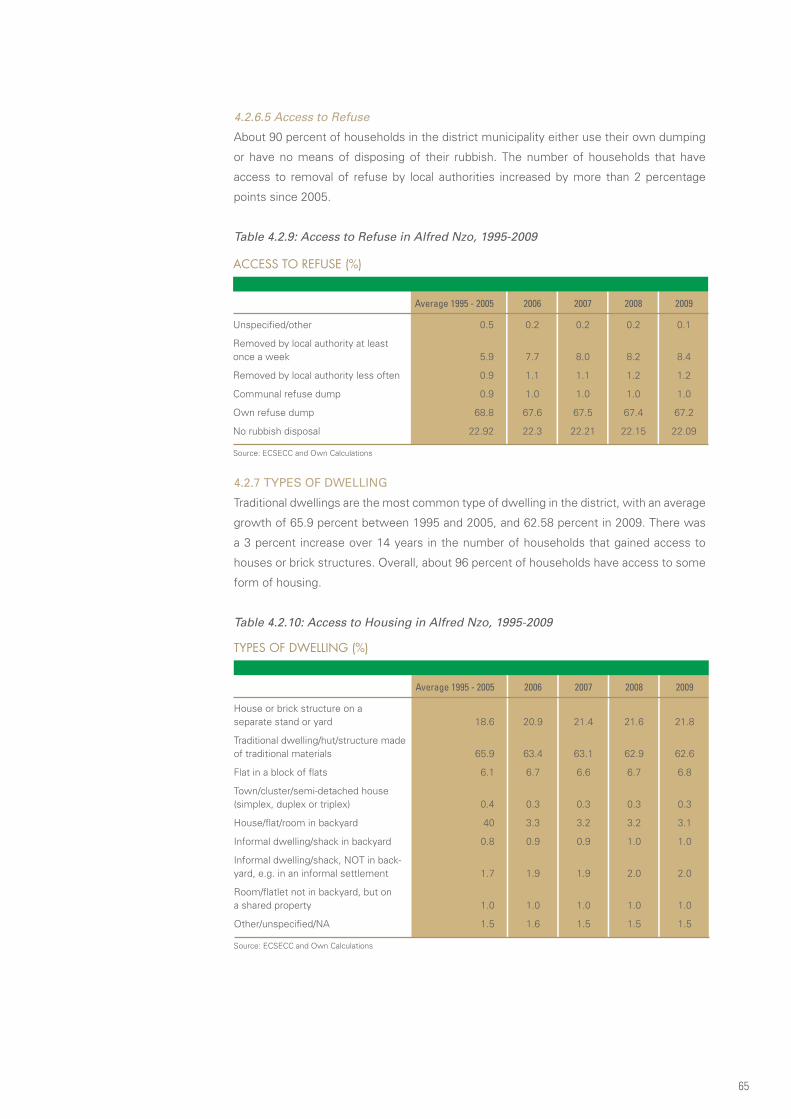
65
ACCESS TO REFUSE (%)
Average 1995 - 2005 2006 2007 2008 2009
Unspecified/other 0.5 0.2 0.2 0.2 0.1
Removed by local authority at least once a week 5.9 7.7 8.0 8.2 8.4
Removed by local authority less often 0.9 1.1 1.1 1.2 1.2
Communal refuse dump 0.9 1.0 1.0 1.0 1.0
Own refuse dump 68.8 67.6 67.5 67.4 67.2
No rubbish disposal 22.92 22.3 22.21 22.15 22.09
Source: ECSECC and Own Calculations
4.2.6.5 Access to Refuse
About 90 percent of households in the district municipality either use their own dumping
or have no means of disposing of their rubbish. The number of households that have
access to removal of refuse by local authorities increased by more than 2 percentage
points since 2005.
Table 4.2.9: Access to Refuse in Alfred Nzo, 1995-2009
4.2.7 TyPES Of DWELLINg
Traditional dwellings are the most common type of dwelling in the district, with an average
growth of 65.9 percent between 1995 and 2005, and 62.58 percent in 2009. There was
a 3 percent increase over 14 years in the number of households that gained access to
houses or brick structures. Overall, about 96 percent of households have access to some
form of housing.
Table 4.2.10: Access to Housing in Alfred Nzo, 1995-2009
TYPES OF DWELLING (%)
Average 1995 - 2005 2006 2007 2008 2009
House or brick structure on a separate stand or yard 18.6 20.9 21.4 21.6 21.8
Traditional dwelling/hut/structure madeof traditional materials 65.9 63.4 63.1 62.9 62.6
Flat in a block of flats 6.1 6.7 6.6 6.7 6.8
Town/cluster/semi-detached house(simplex, duplex or triplex) 0.4 0.3 0.3 0.3 0.3
House/flat/room in backyard 40 3.3 3.2 3.2 3.1
Informal dwelling/shack in backyard 0.8 0.9 0.9 1.0 1.0
Informal dwelling/shack, NOT in back-yard, e.g. in an informal settlement 1.7 1.9 1.9 2.0 2.0
Room/flatlet not in backyard, but ona shared property 1.0 1.0 1.0 1.0 1.0
Other/unspecified/NA 1.5 1.6 1.5 1.5 1.5
Source: ECSECC and Own Calculations

66
ALF
RED
NZO
DIS
TRIC
T M
UN
ICIPA
LITY
4.2.8 fORMAL EMPLOyMENT By SECTOR
Growth in formal employment in Alfred Nzo has improved over the past fourteen years,
with some industries ceasing to shed jobs. Between 2001 and 2005, manufacturing,
construction, wholesale and retail, transport and communication, and general government
services all recorded an increase in job creation.
Table 4.2.11: Formal employment by sector in Alfred Nzo, 1995-2008
NUMBER OF PEOPLE EMPLOYED BY SECTOR
1995 1995 - 2001 - 2006 2008 2006 - (Number) 2000 (%) 2005 (%) (Number) (Number) 2008 (%)
AFF 1,808 -12.2 -5.3 1,573 1,521 -3.3
MQ 325 -45.2 -1.8 168 172 2.4
MAN 910 -7.4 3.5 893 891 -0.2
EGW 132 -6.8 -5.9 118 116 -1.3
CON 931 -16.7 8.2 946 975 3.1
WRTCA 2,716 10.8 4.9 3,142 3,211 2.2
TSC 552 -16.5 10.7 525 541 3.0
FIBS 979 44.0 20.0 1,905 2,075 9.0
CSPS 8,870 0.5 3.6 9,317 9,509 2.1
OGSS 3,287 8.8 1.2 3,625 3,703 2.2
GSS 5,583 -4.5 5.4 5,692 5,806 2.0
Source: ECSECC and Own Calculations
4.2.9 INfORMAL AND fORMAL EMPLOyMENT By SkILL
The formal and informal sectors of employment in the district created jobs, even though
the growth rate has been declining. Formal employment by skill recorded a growth in the
number of jobs created. The one sector to experience significant growth between 2001
and 2005 was the skilled sector, followed by the semi- and unskilled sectors. However, job
losses continued to be observed afterwards among skilled workers. The entire informal
employment sector has decreased since 2000 and has been shedding jobs.
Table 4.2.12: Informal and Formal Employment by Skill in Alfred Nzo, 1995-2008
NUMBER OF PEOPLE EMPLOYED BY SKILL
1995 1995 - 2001 - 2006 2008 2006 - (Number) 2000 (%) 2005 (%) (Number) (Number) 2008 (%)
Formal and informal
employment 21,781 1.6 1.9 22,988 23,144 0.7
Informal employment 4,558 6.1 -8.2 4,401 4,131 -6.1
Formal employment 17,223 0.4 4.7 18,587 19,013 2.3
High skilled 2,781 -9.9 -0.3 2,460 2,425 -1.4
Skilled 6,623 7.0 9.4 8,081 8,403 4.0
Semi- and unskilled 7,819 -1.5 2.0 8,046 8,185 1.7
Source: Quantec Research and Own Calculations

67
DEPENDENCY RATIO
1995 (%) 2000 (%) 2005 (%) 2009 (%)
73.3 69.3 67.9 67.1
Source: ECSECC and Own Calculations
4.2.10 DEPENDENCy RATIO
The dependency ratio in Alfred Nzo has been decreasing over the years, but still remains
high at almost 98 percent. The number of households earning not more than R3 500
remains high at about 72 percent.
Table 4.2.13: Dependency Ratio in Alfred Nzo, 1995-2009
4.2.11 LEVEL Of EDUCATION
The number of persons with no schooling increased between 2001 and 2008, when
compared to the number recorded between 1995 and 2000. Figures show growth in
the number of people who completed matric since 2000. Between 1995 and 2000, the
number of people with Honours degrees recorded the highest growth, followed by those
with Bachelor’s degrees and diplomas, and those with higher degrees. The number
of people attaining post-matric qualifications has been growing since 2000, with most
candidates being awarded diplomas, Bachelor’s degrees and post-graduate degrees. The
illiteracy rate has still been growing, although at a much slower rate.
Table 4.2.14: Level of Education in Alfred Nzo, 1995-2009
LEVEL OF EDUCATION
1995 1995 - 2001 - 2006 2009 2006 - (Number) 2000 (%) 2005 (%) (Number) (Number) 2009 (%)
Total 367,880 5.0 6.5 424,580 442,050 4.1
Grade 0 / No schooling 69,260 -7.1 4.3 66,390 67,254 1.3
Grade 12 10,524 26.7 7.9 15,189 16,509 6.6
Less than matric and certificate / diploma 1,689 -23.8 3.7 1,235 1,206 -2.4
Certificate with Grade 12 550 61.0 4.1 1,016 1,081 6.5
Diploma with Grade 12 3,425 27.8 6.0 4,978 5,263 5.7
Bachelor’s Degree 466 44.1 3.3 744 700 4.9
Bachelor’s Degree and Diploma 126 162.0 6.3 412 452 9.8
Honours Degree 47 167.0 10.8 167 186 11.7
Higher Degree (Master’s /
Doctorate) 53 95.9 11.6 134 150 11.3
Other (unspecified) 56,284 -8.5 5.5 53.989 55,014 1.9
Source: ECSECC and Own Calculations
LITERATE / ILLITERATE
1995 1995 - 2001 - 2006 2009 2006 - (Number) 2000 (%) 2005 (%) (Number) (Number) 2009 (%)
Illiterate 69,268 -7.1 4.3 66,390 67,254 1.3
Literate 89,874 8.5 7.2 109,021 114,295 4.8
Source: ECSECC and Own Calculations
Table 4.2.15: Literacy level in Alfred Nzo, 1995-2009

68
ALF
RED
NZO
DIS
TRIC
T M
UN
ICIPA
LITY
4.2.12 NUMBER Of PEOPLE IN POVERTy
The number of people living in poverty in the Alfred Nzo district grew by 5.3 percentage
points between 1995 and 2009. In 2009, more than two-thirds of the district population
is categorised as poor.
Table 4.2.16: People in Poverty in Alfred Nzo, 1995-2009
NUMBER OF PEOPLE IN POVERTY
1995 (%) 2000 (%) 2005 (%) 2009 (%)
67.4 81.9 88.9 72.7
Source: ECSECC and Own Calculations
4.2.13 DISTRIBUTION Of HOUSEHOLDS By INCOME
In 1995, about 92 percent of households were earning not more than R3 500, with almost
52 percent of this group earning not more than R1 000. The majority of households in this
district municipality were earning slightly above R1 000, and not more than R3 500. This
income group grew from just below 40 percent in 1995 to slightly more than 51 percent
in 2009. The group earning between R3 501 and R11 000 increased from 7 percent in
2000 to about 22 percent in 2009. This was accompanied by a decline since 2005 in
those groups earning less than R500; and more than R500 but not more than R1 000.
Households earning more than R11 000 recorded growth of about 4 percent from 1995
to 2009.
Table 4.2.17: Distribution of Households by Income in Alfred Nzo, 1995-2009
HOUSEHOLD DISTRIBUTION BY INCOME
1995 (%) 2000 (%) 2005 (%) 2009 (%)
< R500 per month 16.7 19 9.8 4.2
R500 - R1000 34.9 27.9 25.4 16.5
R1001 - R3500 39.5 43.2 49.4 51.1
R3501 - R6000 4.5 5.1 8.5 15.4
R6001 - R11000 2.4 5.1 8.5 15.4
R11001 - R16000 1.5 0.9 1.3 2.2
R16001 - R30000 0.3 0.7 1.3 2.2
R30001 - R50000 0.1 0.3 0.5 0.9
R50000+ 0.0 0.1 0.2 0.4
Source: ECSECC and Own Calculations
4.2.14 HUMAN DEVELOPMENT INDICATOR (HDI)
The Human Development Indicator (HDI) in Alfred Nzo has shown minimal growth over
the past 14 years. HDI increased from 0.40 in 1995 to 0.42 in 2009, indicating that the
district remains underdeveloped with low life expectancy, high illiteracy rates and low
standards of living.
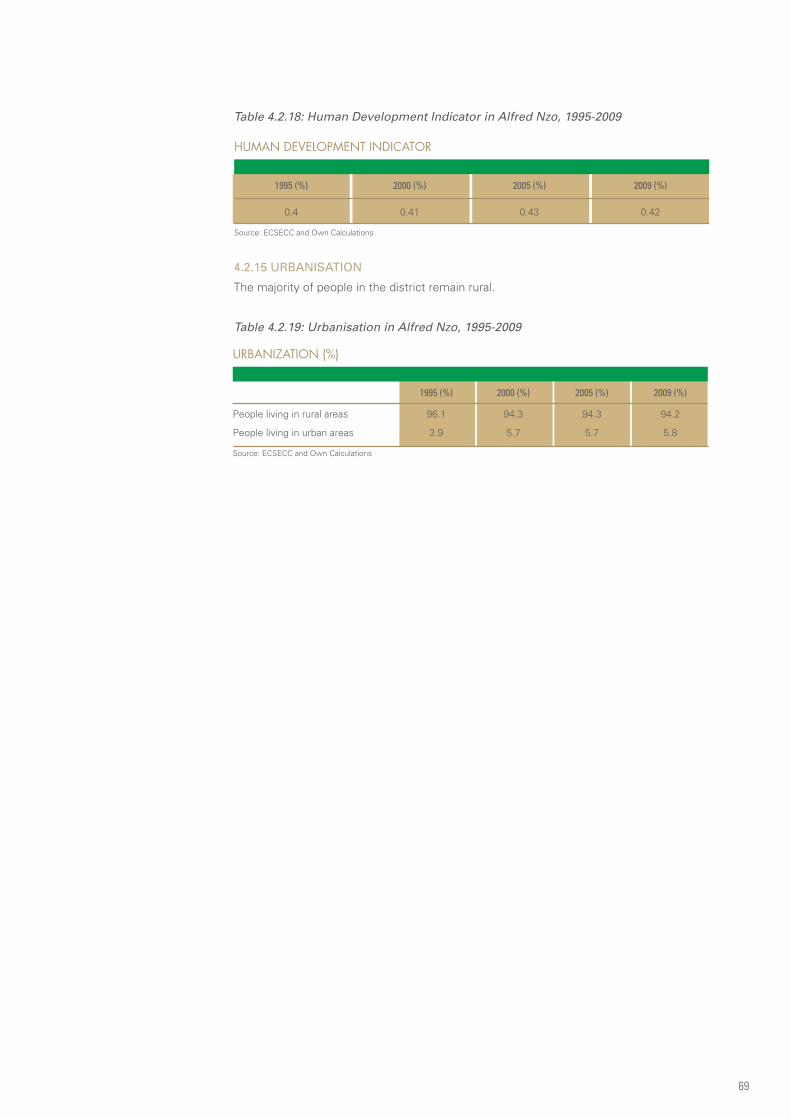
69
URBANIZATION (%)
1995 (%) 2000 (%) 2005 (%) 2009 (%)
People living in rural areas 96.1 94.3 94.3 94.2
People living in urban areas 3.9 5.7 5.7 5.8
Source: ECSECC and Own Calculations
HUMAN DEVELOPMENT INDICATOR
1995 (%) 2000 (%) 2005 (%) 2009 (%)
0.4 0.41 0.43 0.42
Source: ECSECC and Own Calculations
Table 4.2.18: Human Development Indicator in Alfred Nzo, 1995-2009
4.2.15 URBANISATION
The majority of people in the district remain rural.
Table 4.2.19: Urbanisation in Alfred Nzo, 1995-2009

707 Ratio is defined as the number of affected people in each race group divided by the total affected population
4.3 CACADU DISTRICT MUNICIPALITYThe Cacadu District Municipality consists of nine local municipalities. It shares a border
with the Western Cape and the Northern Cape, as well as two Eastern Cape district
municipalities, namely, Chris Hani and Amatole. Cacadu covers an area of 58 272 square
meters. About 71 percent of its population is rural, while 29 percent is urban.
Total population increased from 385 019 in 2008 to 386 875 in 2009. These totals constitute
53.2 percent of Africans, 36 percent of Coloureds, 0.2 percent of Asians and 10.6 percent
of Whites. About 48 percent of the population is male and 52 percent is female.
The Gross Value Added was R11.4 billion in 2008, making it the third-largest economy
in the region. The 2008 GVA saw growth of 8 percent from 2007. Finance and insurance
contributed 24 percent, wholesale and retail trade 18 percent, general government 16
percent and manufacturing 12 percent.
4.3.1 TOTAL POPULATION By AgE gROUP
The table below shows the population by age group in the Cacadu DM from 1995 to
2009.
Table 4.3.1: Population by Age Group in Cacadu, 1995-2009
CA
CA
DU
DIS
TRIC
T M
UN
ICIPA
LITY
POPULATION BY AGE GROUP
1995 (Number) 1995 - 2000 (%) 2001 - 2005 (%) 2006 (Number) 2009 (Number) 2006 - 2009 (%)
Total 364,710 5.7 0.0 385,448 386,875 0.4
0 - 14 112,157 0.9 -0.1 111,776 111,480 -0.3
15 - 44 175,033 6.3 0.1 186,705 187,646 0.5
45 - 65+ 77,521 11.1 0.0 86,967 87,749 0.9
Source: ECSECC and Own Calculations
The total population in Cacadu DM has been growing since 1995, although at a much
slower rate. The group that recorded the highest growth is the 45 years-and-above, while
the age group 0 to 14 has been declining since 2001. The population weight composition
has not changed that much since 1995, with the age group 15 to 44 accounting for almost
50 percent of the population and the age group 0 to 14 accounting for 29 percent of the
population.
4.3.2 TOTAL POPULATION By AffECTED HIV
There has been an increase in the number of people affected by HIV, with the percentage
composition of the population affected showing variation with time. The growth rate
between 2000 and 2007 was 61 percent among Africans, with the ratio7 exceeding 80
percent in 2000 and 2007. People in the age group 15 to 44 were the most affected,
contributing about 86 percent in 2007 to the total affected. This was a growth rate of
about 72 percent between 2000 and 2007.
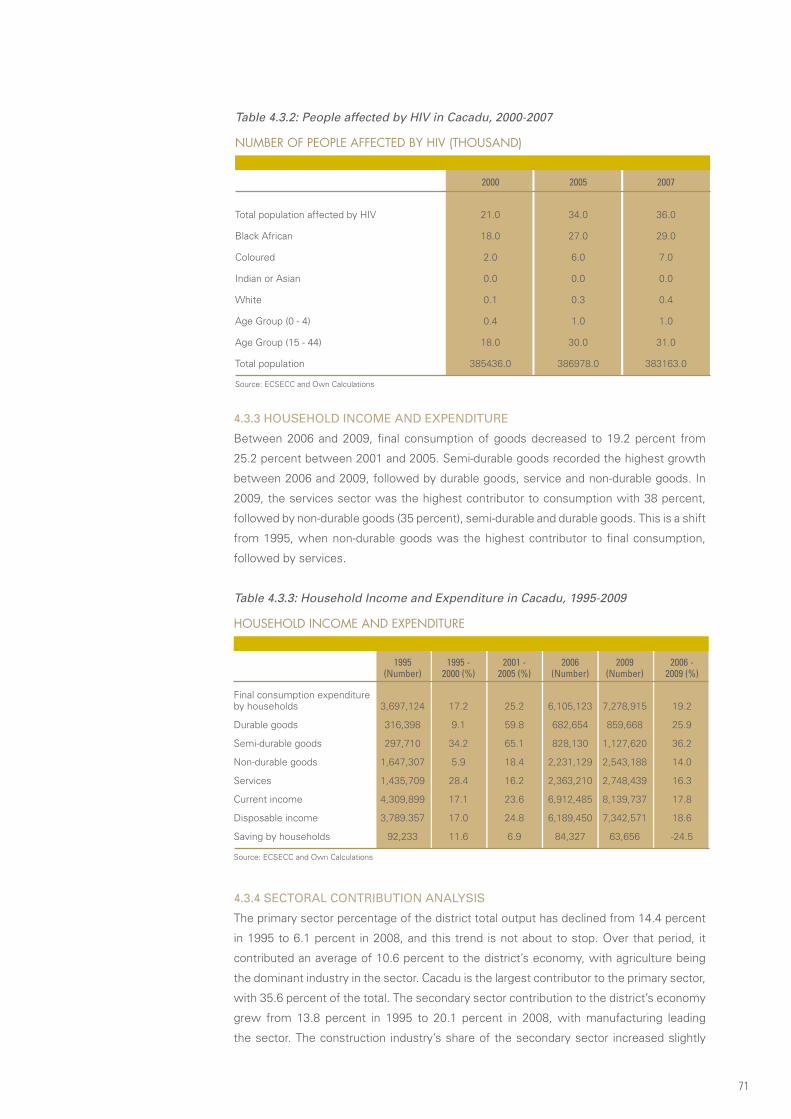
71
Table 4.3.2: People affected by HIV in Cacadu, 2000-2007
HOUSEHOLD INCOME AND EXPENDITURE
1995 1995 - 2001 - 2006 2009 2006 - (Number) 2000 (%) 2005 (%) (Number) (Number) 2009 (%)
Final consumption expenditure by households 3,697,124 17.2 25.2 6,105,123 7,278,915 19.2
Durable goods 316,398 9.1 59.8 682,654 859,668 25.9
Semi-durable goods 297,710 34.2 65.1 828,130 1,127,620 36.2
Non-durable goods 1,647,307 5.9 18.4 2,231,129 2,543,188 14.0
Services 1,435,709 28.4 16.2 2,363,210 2,748,439 16.3
Current income 4,309,899 17.1 23.6 6,912,485 8,139,737 17.8
Disposable income 3,789.357 17.0 24.8 6,189,450 7,342,571 18.6
Saving by households 92,233 11.6 6.9 84,327 63,656 -24.5
Source: ECSECC and Own Calculations
NUMBER OF PEOPLE AFFECTED BY HIV (THOUSAND)
2000 2005 2007
Total population affected by HIV 21.0 34.0 36.0
Black African 18.0 27.0 29.0
Coloured 2.0 6.0 7.0
Indian or Asian 0.0 0.0 0.0
White 0.1 0.3 0.4
Age Group (0 - 4) 0.4 1.0 1.0
Age Group (15 - 44) 18.0 30.0 31.0
Total population 385436.0 386978.0 383163.0
Source: ECSECC and Own Calculations
4.3.3 HOUSEHOLD INCOME AND ExPENDITURE
Between 2006 and 2009, final consumption of goods decreased to 19.2 percent from
25.2 percent between 2001 and 2005. Semi-durable goods recorded the highest growth
between 2006 and 2009, followed by durable goods, service and non-durable goods. In
2009, the services sector was the highest contributor to consumption with 38 percent,
followed by non-durable goods (35 percent), semi-durable and durable goods. This is a shift
from 1995, when non-durable goods was the highest contributor to final consumption,
followed by services.
Table 4.3.3: Household Income and Expenditure in Cacadu, 1995-2009
4.3.4 SECTORAL CONTRIBUTION ANALySIS
The primary sector percentage of the district total output has declined from 14.4 percent
in 1995 to 6.1 percent in 2008, and this trend is not about to stop. Over that period, it
contributed an average of 10.6 percent to the district’s economy, with agriculture being
the dominant industry in the sector. Cacadu is the largest contributor to the primary sector,
with 35.6 percent of the total. The secondary sector contribution to the district’s economy
grew from 13.8 percent in 1995 to 20.1 percent in 2008, with manufacturing leading
the sector. The construction industry’s share of the secondary sector increased slightly

72
over the years, and was at 28.3 percent in 2008. The tertiary sector is the dominant
sector in the district, representing 73.6 percent of its output. The contribution of finance,
insurance, real estate and business services has increased over the years, and since 2003
has become the leading industry in the sector. Transport, storage and communications is
the lowest-contributing industry in the sector.
Figure 4.3: GVA Contribution for Cacadu, 1995-2008
CA
CA
DU
DIS
TRIC
T M
UN
ICIPA
LITY
4.3.5 SECTORAL gROWTH ANALySIS
Similar to the province’s primary sector’s growth, the primary sector in the Cacadu District
Municipality rose from negative territory between 1995 to 2000 to an average growth
of almost 3 percent in 2001 and 2008. Overall, the period 2001 to 2008 experienced
positive growth in the district, with a trend that closely resembled that of the province.
This sector’s growth was driven by agriculture, forestry and fishing, with almost similar
growth rates. Despite lagging provincial growth, this industry’s growth has tracked the
provincial trend.
The secondary sector showed impressive growth from 1995 to 2008, with growth
levels rising from about 6 percent between the years 1995 to 2000 to almost 14 percent
between 2001 and 2008. This growth rate was fuelled by the construction industry
and manufacturing, which recorded growth figures of about 19 percent and 12 percent
respectively between 2001 and 2008. These growth figures were above those of the
province by a considerable margin.
The tertiary sector has shown resilient growth since 1995, and continued to grow between
2001 and 2008, reaching almost 9 percent, compared to 4 percent for the province.
Industries that have been the cornerstone of this growth were transport, storage and
communication; finance, insurance and business services; and wholesale and retail trade,
catering and accommodation. These industries, at a provincial level, have failed to keep
pace with the district’s growth levels, and in some instances even recorded a decline in
growth, as can be observed in wholesale and retail trade, catering and accommodation;
and transport, storage and communication.

73
Table 4.3.4: Sectoral Growth for Cacadu, 1995-2008
CACADU DM: AVERAGE GROWTH (%)
1995 - 2000 2001 - 2005 2001 - 2008
EC -0.24% 3.10% 1.68%
PRIMARY SEC. Cacadu DM -0.4% 2.7% 1.2%
EC -0.2% 3.1% 1.8%
AFF Cacadu DM -0.4% 2.7% 1.2%
EC 2.6% 2.8% 3.2%
SECONDARY SEC. Cacadu DM 5.7% 12.5% 13.3%
EC 2.1% 11.1% 11.4%
CON Cacadu DM 4.9% 18.5% 19.2%
EC 3.2% -1.9% -0.5%
EGW Cacadu DM 9.5% 9.9% 13.3%
EC 2.6% 2.4% 2.6%
MAN Cacadu DM 5.5% 11.3% 11.5%
EC 2.5% 3.3% 3.6%
TERTIARY SEC. Cacadu DM 5.3% 8.0% 8.7%
EC 3.7% 2.2% 2.7%
WRTCA Cacadu DM 6.7% 8.0% 8.8%
EC 5.1% 4.8% 4.6%
TSC Cacadu DM 8.2% 13.3% 13.5%
EC 1.2% 6.3% 6.0%
FIRBS Cacadu DM 5.4% 13.3% 13.2%
Source: Own Calculation and Quantec Research
ACCESS TO WATER (%)
Average 1995 - 2005 2006 2007 2008 2009
Piped water inside dwelling 34.3 32.8 32.9 32.7 32.5
Piped water inside yard 37.2 40.7 40.6 41.0 41.5
Piped water on community stand:distance less than 200m from dwelling 13.7 11.1 11.1 10.7 10.4
Piped water on community stand:distance greater than 200m from dwell. 5.4 8.1 8.3 8.6 9.0
Borehole/rain-water tank/well 4.5 3.3 3.3 3.1 2.9
Dam/river/stream/spring 3.4 2.7 2.6 2.5 2.4
Water carrier/tanker/water vendor 0.4 0.2 0.2 0.2 0.1
Other/unspecified/dummy 1.1 1.2 1.2 1.2 1.2
Source: ECSECC and Own Calculations
4.3.6 ACCESS TO SERVICES
4.3.6.1 Access to Water
Between 1995 and 2000, about 91 percent of the population in the district had access to
piped water, with the number increasing to 93 percent in 2009. This was complemented
by a 2 percent decrease in the number of households that access water through other
modes such as dams, tanks and water vendors, etc.
Table 4.3.5: Access to Water in Cacadu, 1995-2009

74
CA
CA
DU
DIS
TRIC
T M
UN
ICIPA
LITY
4.3.6.2 Access to Energy
In 2009, about 71 percent of households had access to electricity for energy, which is an
increase of about 2 percentage points over the average figure recorded between 1995
and 2005. This was coupled with a decrease in the number of households using other
modes of energy such as candles, gas and paraffin, from an average of almost 30 percent
between 1995 to 2005, to 25 percent in 2009.
Table 4.3.6: Access to Energy in Cacadu, 1995-2009
ACCESS TO ENERGY (%)
Average 1995 - 2005 2006 2007 2008 2009
Solar/other/unspecified 0.9 0.7 0.7 0.7 0.6
Electricity 68.9 70.4 70.4 70.6 70.8
Gas 0.5 0.4 0.4 0.4 0.4
Paraffin 21.5 20.4 20.5 20.3 20.2
Candles 8.2 8.0 8.1 8.0 8.0
Source: ECSECC and Own Calculations
ACCESS TO SANITATION (%)
Average 1995 - 2005 2006 2007 2008 2009
Flush or chemical toilet 48.0 51.9 52.3 52.9 53.4
Pit latrine 23.9 21.9 21.7 21.4 21.2
Bucket latrine 17.1 15.0 14.8 14.6 14.3
None of the above 10.9 11.1 11.1 11.1 11.1
Unspecified/dummy 0.1 0.1 0.1 0.0 0.0
Source: ECSECC and Own Calculations
4.3.6.3 Access to Sanitation
The 2009 figures show that about 36 percent of households in the district used pit-and-
bucket latrines, which is a decline when compared to the 41 percent recorded between
1995 and 2005, on average. About 53 percent of households in the district had access to
flushed or chemical toilets.
Table 4.3.7: Access to Sanitation in Cacadu, 1995-2009
4.3.6.4 Access to Telephones
About 59 percent of households in the district had access to public telephones as a way
of telecommunication. The number of households with access to cellular phones was
recorded at 37 percent in 2009, which is an increase of about 1.3 percentage points when
compared to the figure recorded between 1995 and 2005.
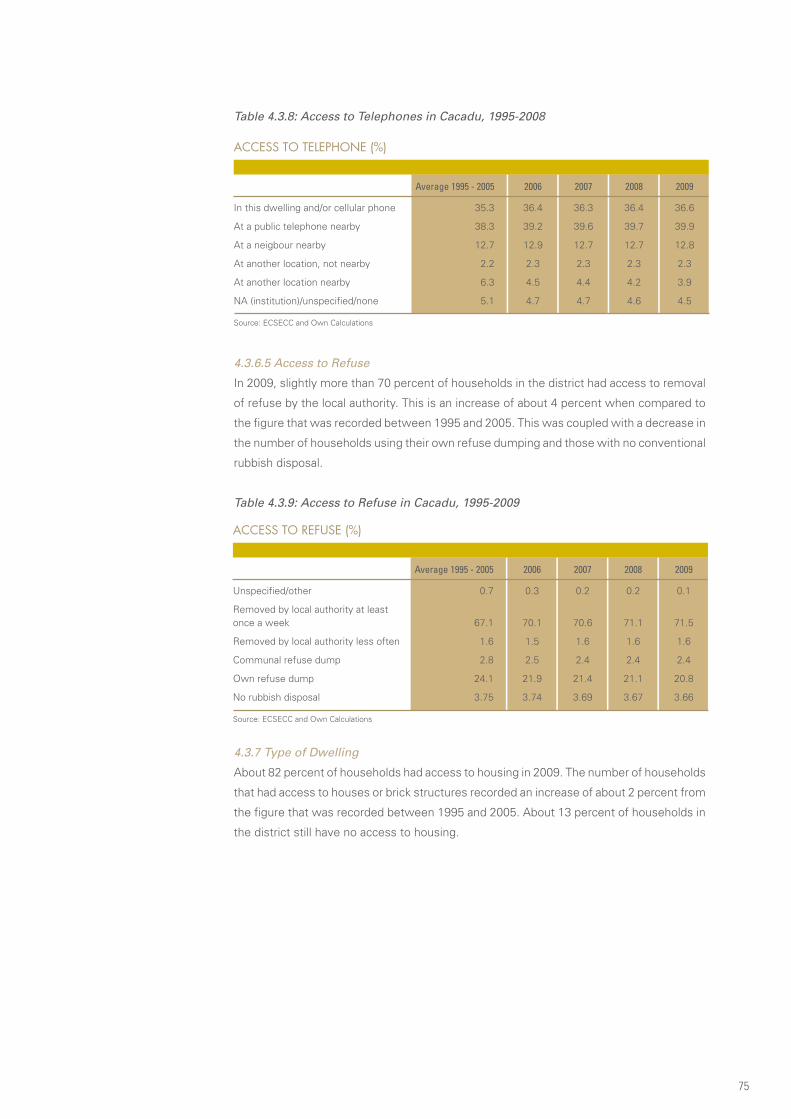
75
ACCESS TO TELEPHONE (%)
Average 1995 - 2005 2006 2007 2008 2009
In this dwelling and/or cellular phone 35.3 36.4 36.3 36.4 36.6
At a public telephone nearby 38.3 39.2 39.6 39.7 39.9
At a neigbour nearby 12.7 12.9 12.7 12.7 12.8
At another location, not nearby 2.2 2.3 2.3 2.3 2.3
At another location nearby 6.3 4.5 4.4 4.2 3.9
NA (institution)/unspecified/none 5.1 4.7 4.7 4.6 4.5
Source: ECSECC and Own Calculations
ACCESS TO REFUSE (%)
Average 1995 - 2005 2006 2007 2008 2009
Unspecified/other 0.7 0.3 0.2 0.2 0.1
Removed by local authority at least once a week 67.1 70.1 70.6 71.1 71.5
Removed by local authority less often 1.6 1.5 1.6 1.6 1.6
Communal refuse dump 2.8 2.5 2.4 2.4 2.4
Own refuse dump 24.1 21.9 21.4 21.1 20.8
No rubbish disposal 3.75 3.74 3.69 3.67 3.66
Source: ECSECC and Own Calculations
Table 4.3.8: Access to Telephones in Cacadu, 1995-2008
4.3.6.5 Access to Refuse
In 2009, slightly more than 70 percent of households in the district had access to removal
of refuse by the local authority. This is an increase of about 4 percent when compared to
the figure that was recorded between 1995 and 2005. This was coupled with a decrease in
the number of households using their own refuse dumping and those with no conventional
rubbish disposal.
Table 4.3.9: Access to Refuse in Cacadu, 1995-2009
4.3.7 Type of Dwelling
About 82 percent of households had access to housing in 2009. The number of households
that had access to houses or brick structures recorded an increase of about 2 percent from
the figure that was recorded between 1995 and 2005. About 13 percent of households in
the district still have no access to housing.

76
Table 4.3.10: Access to Housing in Cacadu, 1995-2009
CA
CA
DU
DIS
TRIC
T M
UN
ICIPA
LITY
TYPES OF DWELLING (%)
Average 1995 - 2005 2006 2007 2008 2009
House or brick structure on a separate stand or yard 65.9 67.0 66.9 67.1 67.2
Traditional dwelling/hut/structure madeof traditional materials 11.5 10.2 10.1 9.9 9.7
Flat in a block of flats 2.1 1.9 1.9 1.9 1.9
Town/cluster/semi-detached house(simplex, duplex or triplex) 1.5 1.1 1.1 1.0 1.0
House/flat/room in backyard 3.0 2.9 2.9 2.9 2.9
Informal dwelling/shack in backyard 3.1 3.2 3.1 3.2 3.2
Informal dwelling/shack, NOT in back-yard, e.g. in an informal settlement 9.6 10.3 10.5 10.6 10.6
Room/flatlet not in backyard, but ona shared property 0.8 0.7 0.6 0.6 0.6
Other/unspecified/NA 2.4 2.8 2.8 2.9 2.9
Source: ECSECC and Own Calculations
4.3.8 fORMAL EMPLOyMENT By SECTOR
Formal employment in the district improved from 2001, as most of the sectors eased up
on shedding jobs. The sector providing most jobs is the tertiary sector, with a 68-percent
contribution in 2008, up from 58 percent in 1995. This was followed by the primary
sector with 21 percent, down from 29 percent in 1995; and the secondary sector with 12
percent, a percentage-point decrease from 1995. Finance and business services, mining
and wholesale had the highest growth rates in 2009, which represent a decline from
those seen between 2001 and 2005.
Table 4.3.11: Formal employment by sector in Cacadu, 1995-2008
NUMBER OF PEOPLE EMPLOYED BY SECTOR
1995 1995 - 2001 - 2006 2008 2006 - (Number) 2000 (%) 2005 (%) (Number) (Number) 2008 (%)
AFF 34,730 -11.5 -10.6 26,181 24,058 -8.1
MQ 298 -16.4 14.1 290 312 7.6
MAN 8,045 -11.6 -0.9 6,945 6,814 -1.9
EGW 448 -9.4 1.0 415 422 1.8
CON 7,121 -21.1 7.9 6,443 6,486 0.7
WRTCA 8,560 15.9 13.4 11,826 12,464 5.4
TSC 1,962 -27.2 1.3 1,427 1,407 -1.4
FIBS 4,003 46.7 22.9 8,305 9,146 10.1
CSPS 27,428 1.3 1.0 28,297 28,709 1.5
OGSS 11,829 13.5 3.6 14,092 14,577 3.4
GSS 15,599 -8.0 -1.5 14,205 14,132 -0.5
Source: Quantec Research and Own Calculations
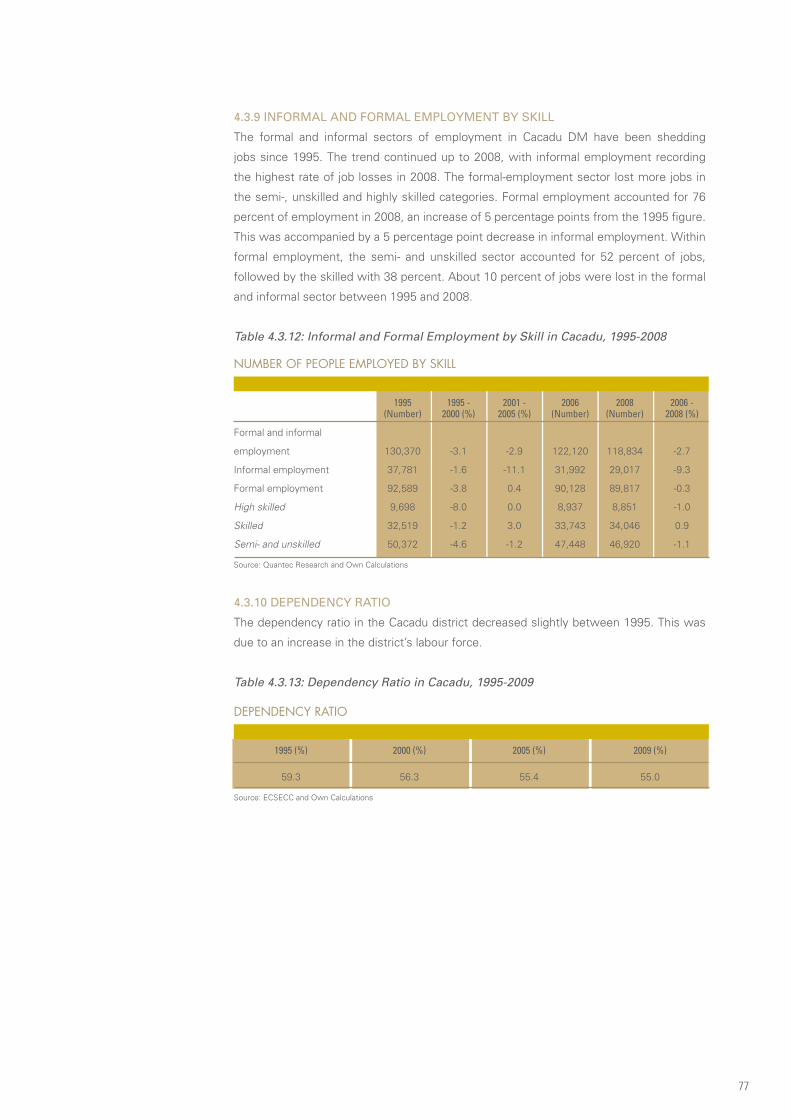
77
4.3.9 INfORMAL AND fORMAL EMPLOyMENT By SkILL
The formal and informal sectors of employment in Cacadu DM have been shedding
jobs since 1995. The trend continued up to 2008, with informal employment recording
the highest rate of job losses in 2008. The formal-employment sector lost more jobs in
the semi-, unskilled and highly skilled categories. Formal employment accounted for 76
percent of employment in 2008, an increase of 5 percentage points from the 1995 figure.
This was accompanied by a 5 percentage point decrease in informal employment. Within
formal employment, the semi- and unskilled sector accounted for 52 percent of jobs,
followed by the skilled with 38 percent. About 10 percent of jobs were lost in the formal
and informal sector between 1995 and 2008.
Table 4.3.12: Informal and Formal Employment by Skill in Cacadu, 1995-2008
NUMBER OF PEOPLE EMPLOYED BY SKILL
1995 1995 - 2001 - 2006 2008 2006 - (Number) 2000 (%) 2005 (%) (Number) (Number) 2008 (%)
Formal and informal
employment 130,370 -3.1 -2.9 122,120 118,834 -2.7
Informal employment 37,781 -1.6 -11.1 31,992 29,017 -9.3
Formal employment 92,589 -3.8 0.4 90,128 89,817 -0.3
High skilled 9,698 -8.0 0.0 8,937 8,851 -1.0
Skilled 32,519 -1.2 3.0 33,743 34,046 0.9
Semi- and unskilled 50,372 -4.6 -1.2 47,448 46,920 -1.1
Source: Quantec Research and Own Calculations
4.3.10 DEPENDENCy RATIO
The dependency ratio in the Cacadu district decreased slightly between 1995. This was
due to an increase in the district’s labour force.
Table 4.3.13: Dependency Ratio in Cacadu, 1995-2009
DEPENDENCY RATIO
1995 (%) 2000 (%) 2005 (%) 2009 (%)
59.3 56.3 55.4 55.0
Source: ECSECC and Own Calculations
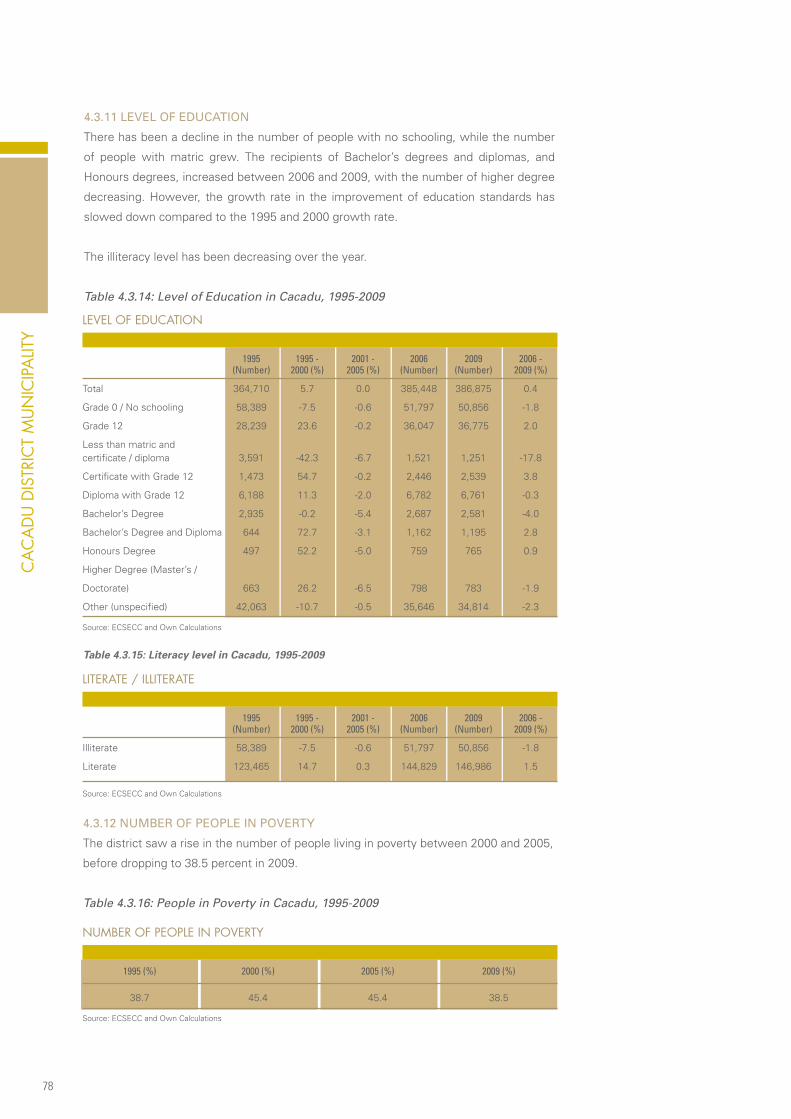
78
LEVEL OF EDUCATION
1995 1995 - 2001 - 2006 2009 2006 - (Number) 2000 (%) 2005 (%) (Number) (Number) 2009 (%)
Total 364,710 5.7 0.0 385,448 386,875 0.4
Grade 0 / No schooling 58,389 -7.5 -0.6 51,797 50,856 -1.8
Grade 12 28,239 23.6 -0.2 36,047 36,775 2.0
Less than matric and certificate / diploma 3,591 -42.3 -6.7 1,521 1,251 -17.8
Certificate with Grade 12 1,473 54.7 -0.2 2,446 2,539 3.8
Diploma with Grade 12 6,188 11.3 -2.0 6,782 6,761 -0.3
Bachelor’s Degree 2,935 -0.2 -5.4 2,687 2,581 -4.0
Bachelor’s Degree and Diploma 644 72.7 -3.1 1,162 1,195 2.8
Honours Degree 497 52.2 -5.0 759 765 0.9
Higher Degree (Master’s /
Doctorate) 663 26.2 -6.5 798 783 -1.9
Other (unspecified) 42,063 -10.7 -0.5 35,646 34,814 -2.3
Source: ECSECC and Own Calculations
LITERATE / ILLITERATE
1995 1995 - 2001 - 2006 2009 2006 - (Number) 2000 (%) 2005 (%) (Number) (Number) 2009 (%)
Illiterate 58,389 -7.5 -0.6 51,797 50,856 -1.8
Literate 123,465 14.7 0.3 144,829 146,986 1.5
Source: ECSECC and Own Calculations
Table 4.3.15: Literacy level in Cacadu, 1995-2009
CA
CA
DU
DIS
TRIC
T M
UN
ICIPA
LITY
4.3.11 LEVEL Of EDUCATION
There has been a decline in the number of people with no schooling, while the number
of people with matric grew. The recipients of Bachelor’s degrees and diplomas, and
Honours degrees, increased between 2006 and 2009, with the number of higher degree
decreasing. However, the growth rate in the improvement of education standards has
slowed down compared to the 1995 and 2000 growth rate.
The illiteracy level has been decreasing over the year.
Table 4.3.14: Level of Education in Cacadu, 1995-2009
4.3.12 NUMBER Of PEOPLE IN POVERTy
The district saw a rise in the number of people living in poverty between 2000 and 2005,
before dropping to 38.5 percent in 2009.
Table 4.3.16: People in Poverty in Cacadu, 1995-2009
NUMBER OF PEOPLE IN POVERTY
1995 (%) 2000 (%) 2005 (%) 2009 (%)
38.7 45.4 45.4 38.5
Source: ECSECC and Own Calculations

79
4.3.13 DISTRIBUTION Of HOUSEHOLDS By INCOME
In 1995, almost 72 percent of households earned R3 500 or less, with approximately
28 percent of this group earning not more than R1 000. This changed in 2009, with 42
percent of households earning R3 500 or less. Households earning more than R3 500
increased from 28 percent in 1995 to 58 percent in 2009.
Table 4.3.17: Distribution of Households by Income in Cacadu, 1995-2009
HOUSEHOLD DISTRIBUTION BY INCOME
1995 (%) 2000 (%) 2005 (%) 2009 (%)
< R500 per month 4 5.5 3.3 1.6
R500 - R1000 16.5 12.9 11.4 7.8
R1001 - R3500 51.6 49.8 42 32.7
R3501 - R6000 12 14 17.2 19.6
R6001 - R11000 8.3 7.6 11.4 16.4
R11001 - R16000 4.1 4.2 4.9 7
R16001 - R30000 2.3 3.8 6 8
R30001 - R50000 0.8 1.7 2.4 4
R50000+ 0.4 0.5 1.4 2.9
Source: ECSECC and Own Calculations
4.3.14 HUMAN DEVELOPMENT INDICATOR (HDI)
The Human Development Indicator (HDI) in the Cacadu district has experienced slow
growth, recording a 7-percent increase between 1995 and 2009. The low increase in
HDI reflects a slow growth rate in the access of households to services, education and
adequate income distribution in the district.
Table 4.3.18: Human Development Indicator in Cacadu, 1995-2009
URBANIZATION (%)
1995 (%) 2000 (%) 2005 (%) 2009 (%)
People living in rural areas 96.1 94.3 94.3 94.2
People living in urban areas 3.9 5.7 5.7 5.8
Source: ECSECC and Own Calculations
HUMAN DEVELOPMENT INDICATOR
1995 (%) 2000 (%) 2005 (%) 2009 (%)
0.5 0.54 0.56 0.57
Source: ECSECC and Own Calculations
4.3.15 URBANISATION
There has been a slow increase in the number of people moving to urban areas in the
district, with 70 percent of households in this district urbanised.
Table 4.3.19: Urbanisation in Cacadu, 1995-2009

80
CH
RIS
HA
NI D
ISTR
ICT
MU
NIC
IPALIT
Y
4.4 CHRIS HANI DISTRICT MUNICIPALITYThe Chris Hani district municipality lies in the heart of Eastern Cape, between the
coastline and the Drakensberg mountains, and consists of eight local municipalities. Chris
Hani is surrounded by Amatole DM, O.R Tambo DM, Ukhahlamba DM and Cacadu DM.
The district covers 37 294 square kilometers of land, 67 percent of which is rural and
33 percent urban.
The total population of Chris Hani was 783 652 in 2008, and increased to 786 637. Africans
were 94.2 percent of the total, Coloureds 3.9 percent, Whites 1.8 percent and Asians 0.1
percent. About 46 percent of this population was male and 54 percent female.
The total Gross Value Added for 2008 was about R8 billion, a growth rate of 6 percent.
Chris Hani DM is the fifth-largest economy in the region. Industries in the tertiary sector
contributed the most, totaling 84 percent of GVA. These were general government with
28 percent, finance and insurance with 17 percent, wholesale and trade with 16 percent,
community services with 13 percent and transport and communications with 10 percent.
4.4.1 TOTAL POPULATION By AgE gROUP
The population of the Chris Hani District Municipality has been decreasing since the period
2001 and 2005, with the age group 0 to 14 recording the second-largest decline. The age
group 15 to 44 contributed 40 percent to the population, followed by the age group 0 to
14, with 39 percent in 2009 — a decline of about 2 percentage points on 1995.
Table 4.4.1: Population by Age Group in Chris Hani, 1995-2009
POPULATION BY AGE GROUP
1995 (Number) 1995 - 2000 (%) 2001 - 2005 (%) 2006 (Number) 2009 (Number) 2006 - 2009 (%)
Total 766,773 5.0 -1.2 789,954 786,637 -0.4
0 - 14 317,699 1.0 -1.3 311,637 308,655 -1.0
15 - 44 305,483 6.0 -1.1 319,129 318,480 -0.2
45 - 65+ 143,591 11.6 -1.4 159,187 159,503 0.2
Source: ECSECC and Own Calculations
4.4.2 TOTAL POPULATION AffECTED By HIV
There has been an increase in the number of people affected by HIV. The growth rate
between 2000 and 2007 was 57 percent among Africans, with the ratio exceeding 95
percent in both 2000 and 2007. People in the age group 15 to 44 were the most affected,
contributing about 78 percent in 2007 to the total. This was a growth rate of 38 percent
between 2000 and 2007.

81
Table 4.4.2: People affected by HIV in Chris Hani, 2000-2007
HOUSEHOLD INCOME AND EXPENDITURE
1995 1995 - 2001 - 2006 2009 2006 - (Number) 2000 (%) 2005 (%) (Number) (Number) 2009 (%)
Final consumption expenditure by households 3,771,944 13.6 23.6 5,950,003 6,995,950 17.6
Durable goods 367,703 4.8 49.0 695,639 833,903 19.9
Semi-durable goods 403,239 27.8 63.5 1,067,406 1,445,155 35.4
Non-durable goods 1,830,728 2.9 14.1 2,270,844 2,506,864 10.4
Services 1,170,273 28.4 14.8 1,916,114 2,210,028 15.3
Current income 4,326,827 14.9 20.9 6,622,950 7,637,866 15.3
Disposable income 3,838,917 14.7 21.9 5,966,548 6,924,548 16.1
Saving by households 66,973 77.2 -39.4 16,545 -71,402 -531.6
Source: ECSECC and Own Calculations
NUMBER OF PEOPLE AFFECTED BY HIV (THOUSAND)
2000 2005 2007
Total population affected by HIV 46.0 71.0 74.0
Black African 45.9 69.2 72.0
Coloured 1.0 1.0 2.0
Indian or Asian 0.0 0.0 0.0
White 0.0 0.1 0.2
Age Group (0 - 4) 2.0 3.0 3.0
Age Group (15 - 44) 42.2 60.1 58.2
Total population 385436.0 386978.0 383163.0
Source: ECSECC and Own Calculations
4.4.3 HOUSEHOLD INCOME AND ExPENDITURE
Final consumption grew by almost 18 percent in 2006 and 2009, with the highest growth
of about 24 percent recorded in 2001 and 2005. This was supported by growing current
incomes and disposable incomes. This growth in consumption came with increasing
levels of debt as savings plummeted into negative territory, and was at its worst in 2009.
Consumption of semi-durable goods in 2009 showed the highest growth rate, followed
by durable goods, services and non-durable goods. Despite dropping from 49 percent to
36 percent respectively in 1995 and 2009, consumption of non-durable goods had the
highest consumption weight of 36 percent, followed by services with 32 percent, semi-
durable goods with 21 percent (an increase of 11 percent from 1995) and lastly durable
goods, with a contribution of about 12 percent in 2009.
Table 4.4.3: Household Income and Expenditure in Chris Hani, 1995-2009

82
CH
RIS
HA
NI D
ISTR
ICT
MU
NIC
IPALIT
Y
4.4.4 SECTORAL CONTRIBUTION ANALySIS
The tertiary sector, with an average of 84.6 percent of the total production in the district,
is the highest contributor, followed by the secondary sector, with only 10.8 percent of
district output. General government is the most dominant industry, representing 31.9
percent of district output. Wholesale and retail trade, catering and accommodation is the
second-largest, followed by finance and business services with 14.4 percent of district
output. Since 1995, finance has increased, while wholesale and retail trade has stagnated.
As a consequence, in 2008, finance was the second-largest contributor to the district.
The primary sector, which represents less than 5 percent of district output, has been on
a downward trend since 2001.
Figure 4.4: GVA Contribution for Chris Hani, 1995-2008
Chris Hani - GVA Contribution
4.4.5 SECTORAL gROWTH ANALySIS
Growth in the Chris Hani District Municipality’s primary sector has improved when
compared to the declines experienced during the period 1995 to 2000, recording an
average of about 5 percent between 2001 and 2008, while the province registered growth
of 1.7 percent for the same period. This growth has been supported by growth in the
agriculture, forestry and fishing industry.
The secondary sector has shown sustained growth levels that have marginally exceeded
the province’s growth rate, moving from 2.6 percent during 1995 and 2000 to 8.1 percent
between 2001 and 2008, while the province itself rose from 2.6 percent between 1995 and
2000 to 3.2 percent in 2001 and 2008. The backbone of this sector is manufacturing and
construction. However, growth in the construction industry has followed the province’s
growth for the periods discussed.
Growth in the tertiary sector exceeded provincial growth from 1995 to 2008. This growth
was underpinned by three industries, namely, general government services, wholesale
and retail trade, catering and accommodation; and finance, insurance, and business
services.
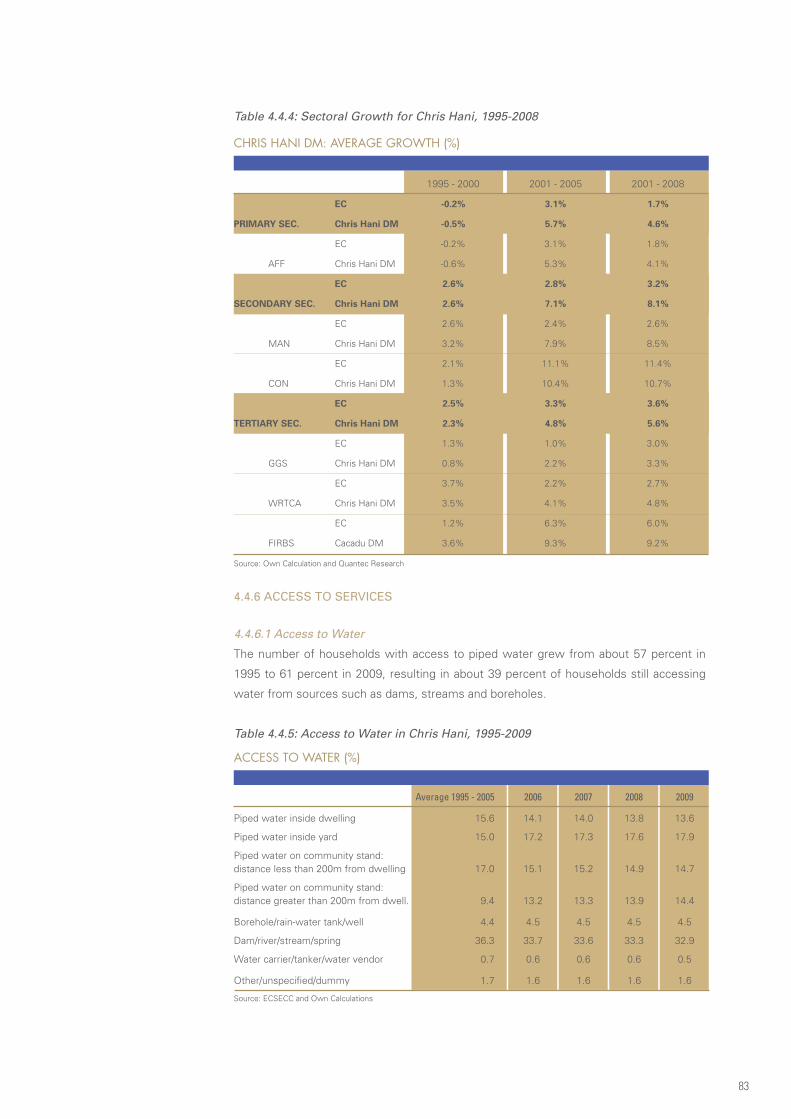
83
Table 4.4.4: Sectoral Growth for Chris Hani, 1995-2008
CHRIS HANI DM: AVERAGE GROWTH (%)
1995 - 2000 2001 - 2005 2001 - 2008
EC -0.2% 3.1% 1.7%
PRIMARY SEC. Chris Hani DM -0.5% 5.7% 4.6%
EC -0.2% 3.1% 1.8%
AFF Chris Hani DM -0.6% 5.3% 4.1%
EC 2.6% 2.8% 3.2%
SECONDARY SEC. Chris Hani DM 2.6% 7.1% 8.1%
EC 2.6% 2.4% 2.6%
MAN Chris Hani DM 3.2% 7.9% 8.5%
EC 2.1% 11.1% 11.4%
CON Chris Hani DM 1.3% 10.4% 10.7%
EC 2.5% 3.3% 3.6%
TERTIARY SEC. Chris Hani DM 2.3% 4.8% 5.6%
EC 1.3% 1.0% 3.0%
GGS Chris Hani DM 0.8% 2.2% 3.3%
EC 3.7% 2.2% 2.7%
WRTCA Chris Hani DM 3.5% 4.1% 4.8%
EC 1.2% 6.3% 6.0%
FIRBS Cacadu DM 3.6% 9.3% 9.2%
Source: Own Calculation and Quantec Research
4.4.6 ACCESS TO SERVICES
4.4.6.1 Access to Water
The number of households with access to piped water grew from about 57 percent in
1995 to 61 percent in 2009, resulting in about 39 percent of households still accessing
water from sources such as dams, streams and boreholes.
Table 4.4.5: Access to Water in Chris Hani, 1995-2009
ACCESS TO WATER (%)
Average 1995 - 2005 2006 2007 2008 2009
Piped water inside dwelling 15.6 14.1 14.0 13.8 13.6
Piped water inside yard 15.0 17.2 17.3 17.6 17.9
Piped water on community stand:distance less than 200m from dwelling 17.0 15.1 15.2 14.9 14.7
Piped water on community stand:distance greater than 200m from dwell. 9.4 13.2 13.3 13.9 14.4
Borehole/rain-water tank/well 4.4 4.5 4.5 4.5 4.5
Dam/river/stream/spring 36.3 33.7 33.6 33.3 32.9
Water carrier/tanker/water vendor 0.7 0.6 0.6 0.6 0.5
Other/unspecified/dummy 1.7 1.6 1.6 1.6 1.6
Source: ECSECC and Own Calculations

84
CH
RIS
HA
NI D
ISTR
ICT
MU
NIC
IPALIT
Y
4.4.6.2 Access to Energy
Slightly more than 50 percent of households used candles and paraffin in 2009, compared
to 57 percent in 1995 and 2005. This was complemented by an increase of about 6 percent
in households using electricity in the district.
Table 4.4.6: Access to Energy in Chris Hani, 1995-2009
ACCESS TO ENERGY (%)
Average 1995 - 2005 2006 2007 2008 2009
Solar/other/unspecified 0.9 0.8 0.8 0.7 0.7
Electricity 42.0 46.5 64.4 47.0 47.6
Gas 0.4 0.4 0.4 0.3 0.3
Paraffin 36.5 31.7 31.8 31.1 30.5
Candles 20.2 20.7 20.8 20.8 20.9
Source: ECSECC and Own Calculations
ACCESS TO SANITATION (%)
Average 1995 - 2005 2006 2007 2008 2009
Flush or chemical toilet 22.7 23.8 23.8 23.9 24.1
Pit latrine 29.1 27.7 27.6 27.4 27.2
Bucket latrine 5.9 5.4 5.4 5.4 5.3
None of the above 42.0 43.0 43.1 43.2 43.4
Unspecified/dummy 0.3 0.1 0.1 0.0 0.0
Source: ECSECC and Own Calculations
ACCESS TO TELEPHONE (%)
Average 1995 - 2005 2006 2007 2008 2009
In this dwelling and/or cellular phone 17.7 21.2 21.2 21.7 22.1
At a public telephone nearby 29.1 33.1 33.3 33.9 34.5
At a neigbour nearby 11.9 13.7 13.7 13.9 14.2
At another location, not nearby 7.4 7.1 7.1 7.1 7.1
At another location nearby 5.1 5.5 5.5 5.5 5.6
NA (institution)/unspecified/none 28.8 19.4 19.2 17.9 16.6
Source: ECSECC and Own Calculations
4.4.6.3 Access to Sanitation
Slightly more than 75 percent of households continued to use pit-and bucket-latrines,
and other unspecified ways of waste management. Of this 75 percent, 43 percent used
pit-and-bucket latrines, while 57 percent used unspecified waste-management methods.
Conditions have not improved since the period 1995 to 2005.
Table 4.4.7: Access to Sanitation in Chris Hani, 1995-2009
4.4.6.4 Access to Telephones
More than 80 percent of households had access to phones in 2009, 27 percent of whom
were using cellular phones compared to 25 percent between 1995 and 2005.
Table 4.4.8: Access to Telephone in Chris Hani, 1995-2008

85
ACCESS TO REFUSE (%)
Average 1995 - 2005 2006 2007 2008 2009
Unspecified/other 0.7 0.3 0.3 0.2 0.1
Removed by local authority at least once a week 25.4 25.8 25.8 25.8 25.9
Removed by local authority less often 1.1 1.0 1.0 0.9 0.9
Communal refuse dump 1.6 1.4 1.4 1.4 1.4
Own refuse dump 42.0 43.8 43.8 44.0 44.3
No rubbish disposal 29.31 27.77 27.81 27.61 27.4
Source: ECSECC and Own Calculations
4.4.6.5 Access to Refuse
In 2009, about 72 percent of households used either their own refuse dump or could
not dispose of their refuse. This has been the case since the period 1995 and 2005,
when approximately 27 percent of households had their refuse disposed of by the local
authority.
Table 4.4.9: Access to Refuse in Chris Hani, 1995-2009
4.4.7 TyPES Of DWELLINg
About 93 percent of households had access to housing in 2009, a figure similar to that
of the period 1995 and 2005. However, 45 percent of this population still used traditional
dwellings. Only 5.4 percent of the population used informal dwellings such as shacks.
Table 4.4.10: Access to Housing in Chris Hani, 1995-2009
TYPES OF DWELLING (%)
Average 1995 - 2005 2006 2007 2008 2009
House or brick structure on a separate stand or yard 44.1 44.7 44.7 44.8 44.8
Traditional dwelling/hut/structure madeof traditional materials 42.4 42.3 42.3 42.3 42.3
Flat in a block of flats 3.1 3.1 3.1 3.1 3.1
Town/cluster/semi-detached house(simplex, duplex or triplex) 0.7 0.7 0.7 0.7 0.7
House/flat/room in backyard 2.2 1.9 1.9 1.8 1.8
Informal dwelling/shack in backyard 1.3 1.2 1.2 1.2 1.2
Informal dwelling/shack, NOT in back-yard, e.g. in an informal settlement 4.2 4.2 4.3 4.3 4.3
Room/flatlet not in backyard, but ona shared property 0.8 0.7 0.7 0.6 0.6
Other/unspecified/NA 1.3 1.3 1.4 1.4 1.4
Source: ECSECC and Own Calculations
4.4.8 fORMAL EMPLOyMENT By SECTOR
The tertiary sector is the biggest employer in the district, with a contribution of about 83
percent in 2008 compared to 78 percent in 1995. This was followed by the secondary
sector, with a 9-percent contribution from 11 percent in 1995, and the primary sector with
an 8-percent contribution from 11 percent in 1995. These sectors were not without job
losses. The sector with the highest job losses was the primary sector, with a 27-percent

86
CH
RIS
HA
NI D
ISTR
ICT
MU
NIC
IPALIT
Y
NUMBER OF PEOPLE EMPLOYED BY SECTOR
1995 1995 - 2001 - 2006 2008 2006 - (Number) 2000 (%) 2005 (%) (Number) (Number) 2008 (%)
AFF 9,854 -8.2 -7.9 7,932 7,462 -5.9
MQ 1,153 -47.1 -5.9 556 563 1.3
MAN 4,777 -13.1 -1.3 4,046 3,958 -2.2
EGW 292 -4.5 0.4 283 284 0.5
CON 5,543 -28.4 0.6 4,167 4,027 -3.4
WRTCA 7,667 14.7 10.2 10,097 10.554 4.5
TSC 1,866 -20.6 10.5 1,658 1,699 2.5
FIBS 4,257 43.2 20.0 8,234 8,993 9.2
CSPS 31,229 -5.0 -0.7 29,251 29,314 0.2
OGSS 11,097 2.1 -3.7 10,731 10,675 -0.5
GSS 20,132 -0.9 1.2 18,520 18,639 0.6
Source: Quantec Research and Own Calculations
NUMBER OF PEOPLE EMPLOYED BY SKILL
1995 1995 - 2001 - 2006 2008 2006 - (Number) 2000 (%) 2005 (%) (Number) (Number) 2008 (%)
Formal and informal
employment 85,415 -2.4 -0.4 83,137 82,472 -0.8
Informal employment 18,777 2.6 -9.5 16,915 15,615 -7.7
Formal employment 66,638 -3.8 2.2 66,222 66,858 1.0
High skilled 10,180 -12.5 -1.8 8,594 8,437 -1.8
Skilled 24,911 3.6 7.3 28,630 29,565 3.3
Semi- and unskilled 31,547 -6.9 -1.1 28,998 28,855 -0.5
Source: Quantec Research and Own Calculations
4.4.9 INfORMAL AND fORMAL EMPLOyMENT By SkILL
The number of people in formal and informal employment has been dropping over the
years, with job losses of about 3 percent between 1995 and 2008. Informal employment
accounted for most job losses, with about 17 percent of jobs lost between 1995 and
2008. In total, informal employment contributed 19 percent to employment in 2008 from
22 percent in 1995, while formal employment contributed 81 percent in 2008 from 78
percent in 1995. Within formal employment, the highly skilled sector shed jobs faster
than any other sector between 1995 and 2008, recording a decline of slightly more than
17 percent, with an average of about 2 percent between 2006 and 2008. The only sector
that experienced growth was the skilled sector, with total growth of about 19 percent
between 1995 and 2008, while growing by 3.3 percent between 2006 and 2008.
Table 4.4.12: Informal and Formal Employment by Skill in Chris Hani, 1995-2008
loss between 1995 and 2008, followed by the secondary sector, with a 22-percent loss
between 1995 and 2008. Construction was the hardest-hit industry in the secondary
sector. The only sector that experienced growth was the tertiary sector, with 5 percent
between 1995 and 2008. Wholesale and finance experienced the highest growth.
Table 4.4.11: Formal employment by sector in Chris Hani, 1995-2008
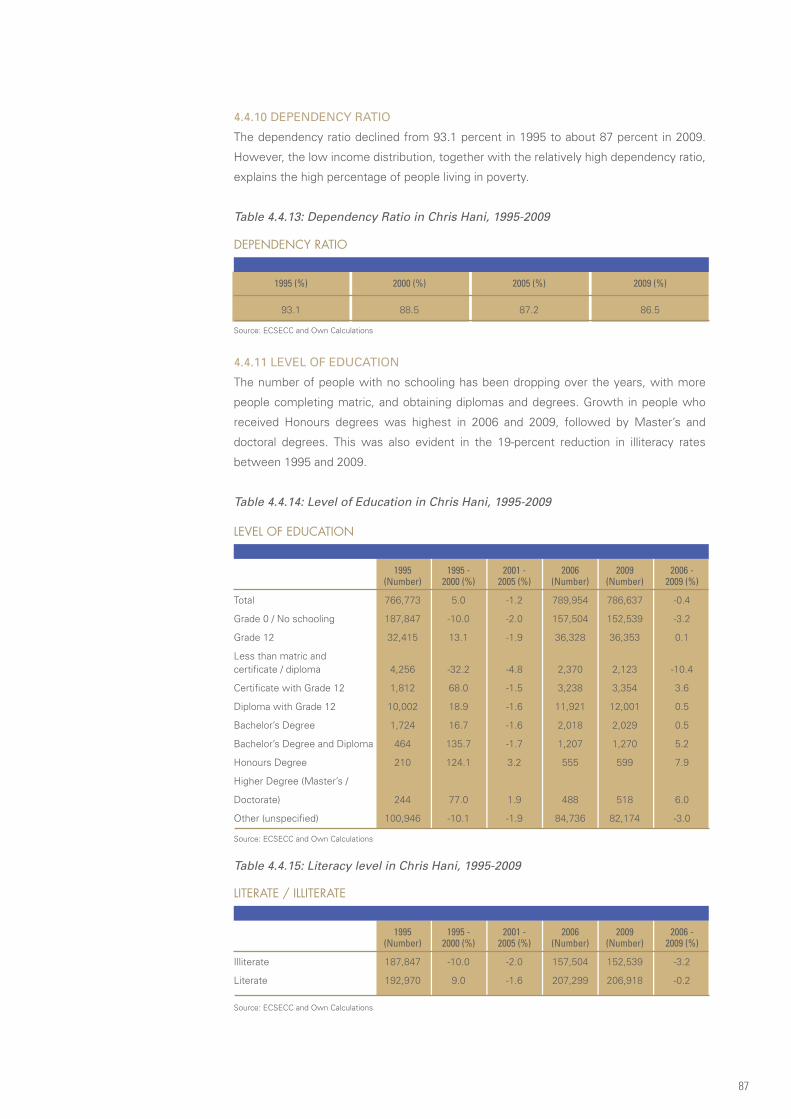
87
DEPENDENCY RATIO
1995 (%) 2000 (%) 2005 (%) 2009 (%)
93.1 88.5 87.2 86.5
Source: ECSECC and Own Calculations
4.4.10 DEPENDENCy RATIO
The dependency ratio declined from 93.1 percent in 1995 to about 87 percent in 2009.
However, the low income distribution, together with the relatively high dependency ratio,
explains the high percentage of people living in poverty.
Table 4.4.13: Dependency Ratio in Chris Hani, 1995-2009
4.4.11 LEVEL Of EDUCATION
The number of people with no schooling has been dropping over the years, with more
people completing matric, and obtaining diplomas and degrees. Growth in people who
received Honours degrees was highest in 2006 and 2009, followed by Master’s and
doctoral degrees. This was also evident in the 19-percent reduction in illiteracy rates
between 1995 and 2009.
Table 4.4.14: Level of Education in Chris Hani, 1995-2009
LEVEL OF EDUCATION
1995 1995 - 2001 - 2006 2009 2006 - (Number) 2000 (%) 2005 (%) (Number) (Number) 2009 (%)
Total 766,773 5.0 -1.2 789,954 786,637 -0.4
Grade 0 / No schooling 187,847 -10.0 -2.0 157,504 152,539 -3.2
Grade 12 32,415 13.1 -1.9 36,328 36,353 0.1
Less than matric and certificate / diploma 4,256 -32.2 -4.8 2,370 2,123 -10.4
Certificate with Grade 12 1,812 68.0 -1.5 3,238 3,354 3.6
Diploma with Grade 12 10,002 18.9 -1.6 11,921 12,001 0.5
Bachelor’s Degree 1,724 16.7 -1.6 2,018 2,029 0.5
Bachelor’s Degree and Diploma 464 135.7 -1.7 1,207 1,270 5.2
Honours Degree 210 124.1 3.2 555 599 7.9
Higher Degree (Master’s /
Doctorate) 244 77.0 1.9 488 518 6.0
Other (unspecified) 100,946 -10.1 -1.9 84,736 82,174 -3.0
Source: ECSECC and Own Calculations
Table 4.4.15: Literacy level in Chris Hani, 1995-2009
LITERATE / ILLITERATE
1995 1995 - 2001 - 2006 2009 2006 - (Number) 2000 (%) 2005 (%) (Number) (Number) 2009 (%)
Illiterate 187,847 -10.0 -2.0 157,504 152,539 -3.2
Literate 192,970 9.0 -1.6 207,299 206,918 -0.2
Source: ECSECC and Own Calculations
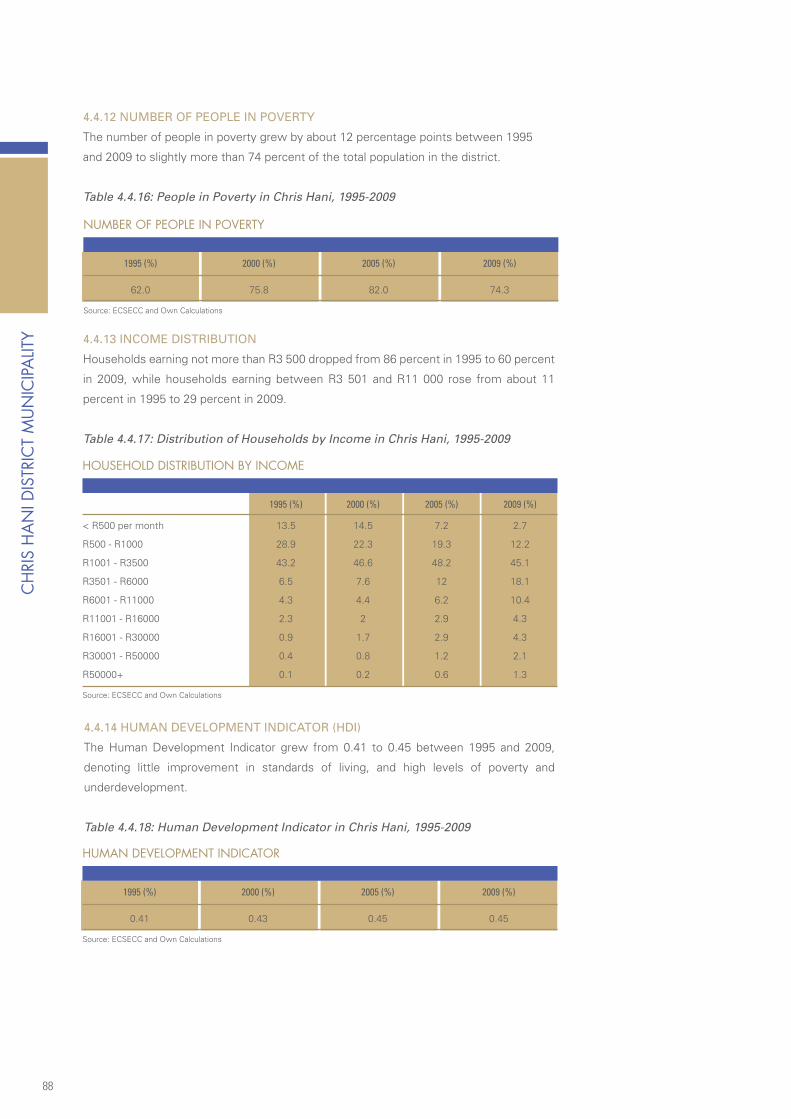
88
CH
RIS
HA
NI D
ISTR
ICT
MU
NIC
IPALIT
Y
4.4.12 NUMBER Of PEOPLE IN POVERTy
The number of people in poverty grew by about 12 percentage points between 1995
and 2009 to slightly more than 74 percent of the total population in the district.
Table 4.4.16: People in Poverty in Chris Hani, 1995-2009
NUMBER OF PEOPLE IN POVERTY
1995 (%) 2000 (%) 2005 (%) 2009 (%)
62.0 75.8 82.0 74.3
Source: ECSECC and Own Calculations
HOUSEHOLD DISTRIBUTION BY INCOME
1995 (%) 2000 (%) 2005 (%) 2009 (%)
< R500 per month 13.5 14.5 7.2 2.7
R500 - R1000 28.9 22.3 19.3 12.2
R1001 - R3500 43.2 46.6 48.2 45.1
R3501 - R6000 6.5 7.6 12 18.1
R6001 - R11000 4.3 4.4 6.2 10.4
R11001 - R16000 2.3 2 2.9 4.3
R16001 - R30000 0.9 1.7 2.9 4.3
R30001 - R50000 0.4 0.8 1.2 2.1
R50000+ 0.1 0.2 0.6 1.3
Source: ECSECC and Own Calculations
HUMAN DEVELOPMENT INDICATOR
1995 (%) 2000 (%) 2005 (%) 2009 (%)
0.41 0.43 0.45 0.45
Source: ECSECC and Own Calculations
4.4.13 INCOME DISTRIBUTION
Households earning not more than R3 500 dropped from 86 percent in 1995 to 60 percent
in 2009, while households earning between R3 501 and R11 000 rose from about 11
percent in 1995 to 29 percent in 2009.
Table 4.4.17: Distribution of Households by Income in Chris Hani, 1995-2009
4.4.14 HUMAN DEVELOPMENT INDICATOR (HDI)
The Human Development Indicator grew from 0.41 to 0.45 between 1995 and 2009,
denoting little improvement in standards of living, and high levels of poverty and
underdevelopment.
Table 4.4.18: Human Development Indicator in Chris Hani, 1995-2009

89
URBANIZATION (%)
1995 (%) 2000 (%) 2005 (%) 2009 (%)
People living in rural areas 68.8 68.3 68.2 67.7
People living in urban areas 31.2 31.7 31.8 32.3
Source: ECSECC and Own Calculations
4.4.15 URBANISATION
In 2009, about 68 percent of the people still remained rural.
Table 4.4.19: Urbanisation in Chris Hani, 1995-2009
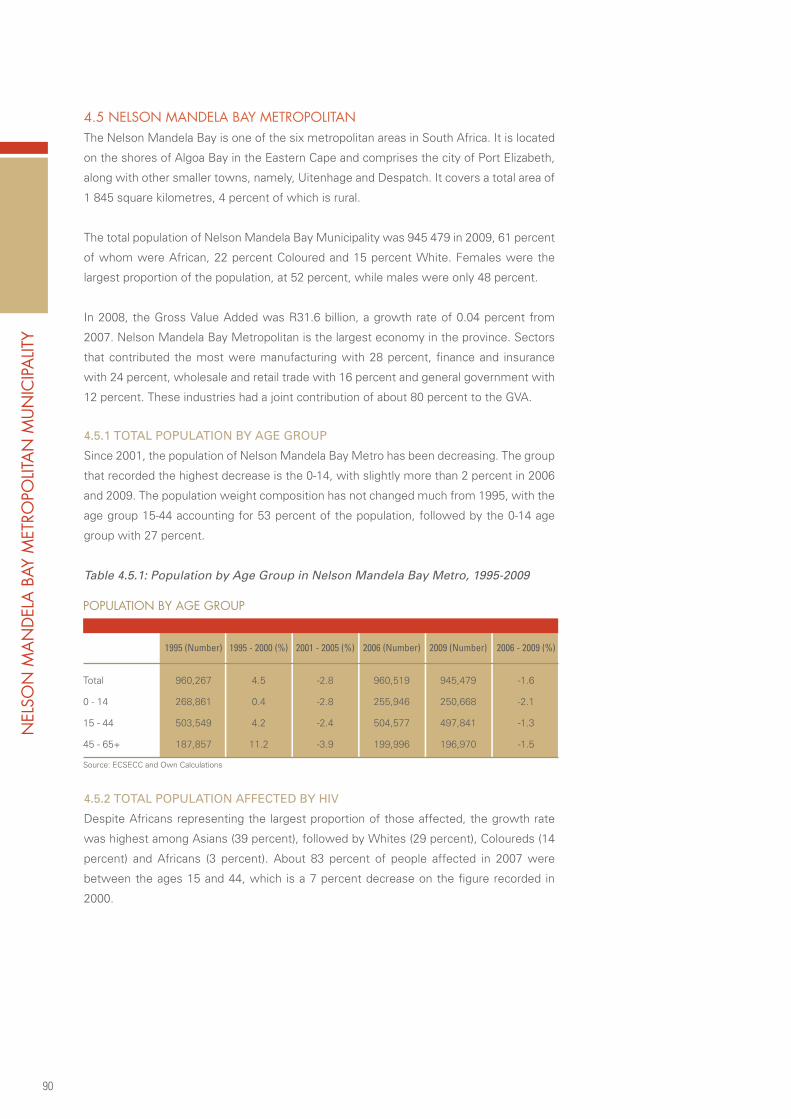
90
NEL
SON
MA
ND
ELA
BAY
MET
ROPO
LITA
N M
UN
ICIPA
LITY
4.5 NELSON MANDELA BAY METROPOLITANThe Nelson Mandela Bay is one of the six metropolitan areas in South Africa. It is located
on the shores of Algoa Bay in the Eastern Cape and comprises the city of Port Elizabeth,
along with other smaller towns, namely, Uitenhage and Despatch. It covers a total area of
1 845 square kilometres, 4 percent of which is rural.
The total population of Nelson Mandela Bay Municipality was 945 479 in 2009, 61 percent
of whom were African, 22 percent Coloured and 15 percent White. Females were the
largest proportion of the population, at 52 percent, while males were only 48 percent.
In 2008, the Gross Value Added was R31.6 billion, a growth rate of 0.04 percent from
2007. Nelson Mandela Bay Metropolitan is the largest economy in the province. Sectors
that contributed the most were manufacturing with 28 percent, finance and insurance
with 24 percent, wholesale and retail trade with 16 percent and general government with
12 percent. These industries had a joint contribution of about 80 percent to the GVA.
4.5.1 TOTAL POPULATION By AgE gROUP
Since 2001, the population of Nelson Mandela Bay Metro has been decreasing. The group
that recorded the highest decrease is the 0-14, with slightly more than 2 percent in 2006
and 2009. The population weight composition has not changed much from 1995, with the
age group 15-44 accounting for 53 percent of the population, followed by the 0-14 age
group with 27 percent.
Table 4.5.1: Population by Age Group in Nelson Mandela Bay Metro, 1995-2009
POPULATION BY AGE GROUP
1995 (Number) 1995 - 2000 (%) 2001 - 2005 (%) 2006 (Number) 2009 (Number) 2006 - 2009 (%)
Total 960,267 4.5 -2.8 960,519 945,479 -1.6
0 - 14 268,861 0.4 -2.8 255,946 250,668 -2.1
15 - 44 503,549 4.2 -2.4 504,577 497,841 -1.3
45 - 65+ 187,857 11.2 -3.9 199,996 196,970 -1.5
Source: ECSECC and Own Calculations
4.5.2 TOTAL POPULATION AffECTED By HIV
Despite Africans representing the largest proportion of those affected, the growth rate
was highest among Asians (39 percent), followed by Whites (29 percent), Coloureds (14
percent) and Africans (3 percent). About 83 percent of people affected in 2007 were
between the ages 15 and 44, which is a 7 percent decrease on the figure recorded in
2000.

91
Table 4.5.2: People affected by HIV in Nelson Mandela Bay Metro, 2000-2007
NUMBER OF PEOPLE AFFECTED BY HIV (THOUSAND)
2000 2005 2007
Total population affected by HIV 62.0 96.1 100.6
Black African 57.1 83.8 86.3
Coloured 4.4 10.7 12.2
Indian or Asian 0.1 0.2 0.3
White 0.4 1.5 1.9
Age Group (0 - 4) 1.1 2.1 2.1
Age Group (15 - 44) 55.9 81.6 84.0
Total population 1003.2 974.2 943.8
Source: ECSECC and Own Calculations
4.5.3 HOUSEHOLD INCOME AND ExPENDITURE
Since 1995, consumption expenditure has been increasing, with the highest increase
recorded in the period 2001 and 2005. Consumption of semi-durable goods had the
highest growth, followed by durable goods, non-durable goods and services. However,
the sector with the highest consumption weight was services with 38 percent, followed
by non-durable goods, semi-durable goods and durable goods. The saving rate has been
decreasing from minus 5.7 percent in 1995 to minus 18.5 percent between 2006 and
2009. The growth rates in income and disposable income were highest in 2001 and 2005,
and started easing between 2006 and 2009.
Table 4.5.3: Household Income and Expenditure in Nelson Mandela Bay Metro, 1995-
2009
HOUSEHOLD INCOME AND EXPENDITURE
1995 1995 - 2001 - 2006 2009 2006 - (Number) 2000 (%) 2005 (%) (Number) (Number) 2009 (%)
Final consumption expenditure by households 12,971,681 16.0 21.5 20,372,163 23,391,890 14.8
Durable goods 1,108,056 9.1 54.8 2,281,461 2,752,824 20.7
Semi-durable goods 1,022,702 34.0 59.7 2,735,878 3,581,933 30.9
Non-durable goods 5,654,727 4.3 15.8 7,313,719 8,149,510 11.4
Services 5,186,196 26.6 12.3 8,041,106 8,907,623 10.8
Current income 15,094,161 15.6 20.0 22,927,955 26,101,190 13.8
Disposable income 13,370,322 15.3 20.9 20,577,856 23,559,500 14.5
Saving by households 398,641 -5.7 -9.5 205,693 167,610 -18.5
Source: ECSECC and Own Calculations
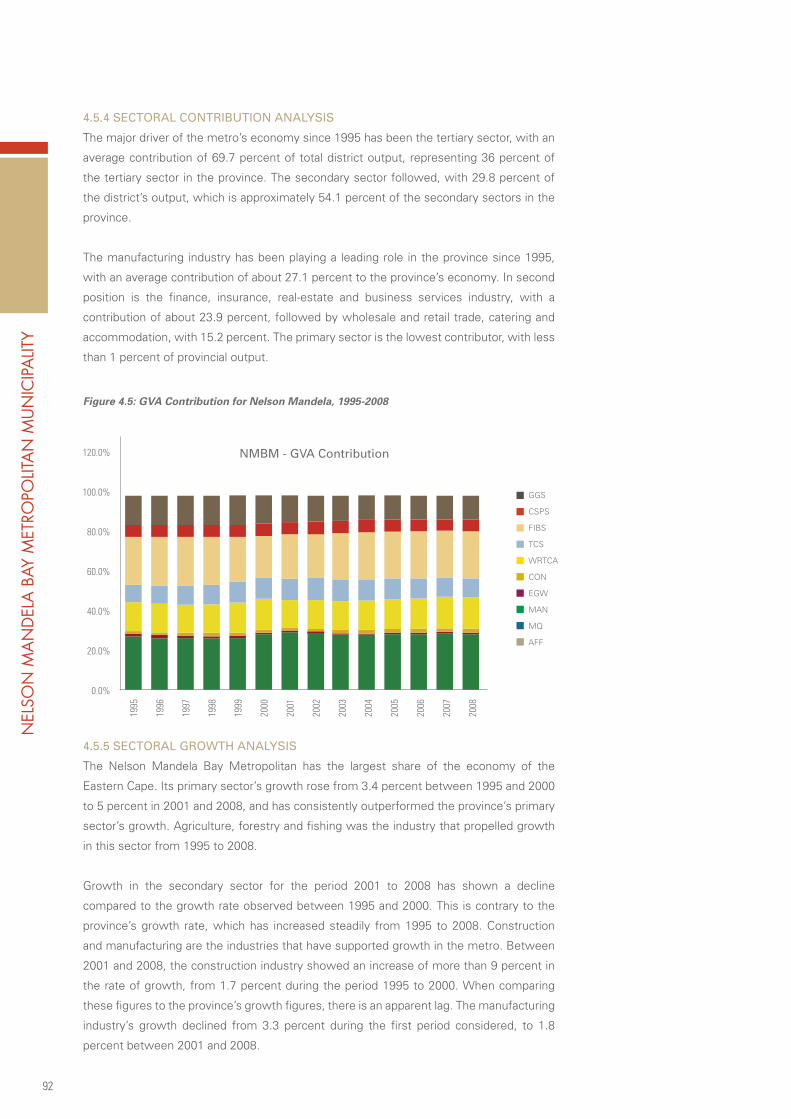
92
4.5.4 SECTORAL CONTRIBUTION ANALySIS
The major driver of the metro’s economy since 1995 has been the tertiary sector, with an
average contribution of 69.7 percent of total district output, representing 36 percent of
the tertiary sector in the province. The secondary sector followed, with 29.8 percent of
the district’s output, which is approximately 54.1 percent of the secondary sectors in the
province.
The manufacturing industry has been playing a leading role in the province since 1995,
with an average contribution of about 27.1 percent to the province’s economy. In second
position is the finance, insurance, real-estate and business services industry, with a
contribution of about 23.9 percent, followed by wholesale and retail trade, catering and
accommodation, with 15.2 percent. The primary sector is the lowest contributor, with less
than 1 percent of provincial output.
Figure 4.5: GVA Contribution for Nelson Mandela, 1995-2008
NEL
SON
MA
ND
ELA
BAY
MET
ROPO
LITA
N M
UN
ICIPA
LITY
4.5.5 SECTORAL gROWTH ANALySIS
The Nelson Mandela Bay Metropolitan has the largest share of the economy of the
Eastern Cape. Its primary sector’s growth rose from 3.4 percent between 1995 and 2000
to 5 percent in 2001 and 2008, and has consistently outperformed the province’s primary
sector’s growth. Agriculture, forestry and fishing was the industry that propelled growth
in this sector from 1995 to 2008.
Growth in the secondary sector for the period 2001 to 2008 has shown a decline
compared to the growth rate observed between 1995 and 2000. This is contrary to the
province’s growth rate, which has increased steadily from 1995 to 2008. Construction
and manufacturing are the industries that have supported growth in the metro. Between
2001 and 2008, the construction industry showed an increase of more than 9 percent in
the rate of growth, from 1.7 percent during the period 1995 to 2000. When comparing
these figures to the province’s growth figures, there is an apparent lag. The manufacturing
industry’s growth declined from 3.3 percent during the first period considered, to 1.8
percent between 2001 and 2008.
NMBM - gVA Contribution

93
The tertiary sector, which is the main driver of the economy in the metro, experienced
a decline in growth from 2.2 percent between 1995 and 2000 to 1.5 percent between
2001 and 2008. At a provincial level, an increase of 1.2 percent in growth was observed
between 2001 and 2008. The decline observed in 2001 and 2008 was indicative of the
slump in growth from 2006 to 2008, as growth was around 1.8 percent between 2001
and 2005. Between 1995 and 2000, finance, insurance, real estate and business services
registered negative growth in the metro, while the province had a positive growth rate
of just above 1 percent. Conditions improved between 2001 and 2005, when the metro
had a growth rate of almost 4 percent while the province registered a figure of more than
6 percent. From 2001 to 2008, wholesale and retail trade, catering and accommodation;
and general government services experienced a slump in growth of 2.2 percent and 1.4
percent respectively after the period 1995 and 2000, in line with provincial growth.
Table 4.5.4: Sectoral Growth for Nelson Mandela Bay Metro, 1995-2008
NELSON MANDELA BAY METRO: AVERAGE GROWTH (%)
1995 - 2000 2001 - 2005 2001 - 2008
EC -0.2% 3.1% 1.7%
PRIMARY SEC. NMBM 3.4% 6.4% 5.0%
EC -0.2% 3.1% 1.8%
AFF NMBM 3.7% 6.5% 5.3%
EC 2.6% 2.8% 3.2%
SECONDARY SEC. NMBM 2.8% 1.9% 2.0%
EC 2.1% 11.1% 11.4%
CON NMBM 1.7% 9.6% 9.5%
EC 2.6% 2.4% 2.6%
MAN NMBM 3.3% 1.8% 1.8%
EC 2.5% 3.3% 3.6%
TERTIARY SEC. NMBM 2.2% 1.8% 1.5%
EC 1.2% 6.3% 6.0%
FIBS NMBM -0.1% 3.9% 3.2%
EC 3.7% 2.2% 2.7%
WRTCA NMBM 3.8% 1.4% 1.6%
EC 1.3% 1.0% 3.0%
GGS NMBM 1.1% -0.9% -0.3%
Source: Own Calculation and Quantec Research

94
ACCESS TO WATER (%)
Average 1995 - 2005 2006 2007 2008 2009
Piped water inside dwelling 52.9 48.1 47.8 47.1 46.5
Piped water inside yard 27.7 29.8 29.5 29.8 30.1
Piped water on community stand:distance less than 200m from dwelling 11.6 11.4 11.7 11.6 11.6
Piped water on community stand:distance greater than 200m from dwell. 6.1 9.2 9.5 9.9 10.4
Borehole/rain-water tank/well 0.4 0.3 0.3 0.3 0.3
Dam/river/stream/spring 0.1 0.2 0.2 0.2 0.2
Water carrier/tanker/water vendor 0.1 0.1 0.1 0.1 0.1
Other/unspecified/dummy 1.0 0.9 0.9 0.9 0.9
Source: ECSECC and Own Calculations
4.5.6 ACCESS TO SERVICES
4.5.6.1 Access to water
Since the period 1995 and 2000, slightly more than 98 percent of households had
access to piped water.
Table 4.5.5: Access to Water in Nelson Mandela Bay Metro, 1995-2009
NEL
SON
MA
ND
ELA
BAY
MET
ROPO
LITA
N M
UN
ICIPA
LITY
4.5.6.2 Access to Energy
Electricity is the most common source of energy, with more than 70 percent of households
using it. Households relying on paraffin and candles increased to 2 percent in 2009 when
compared to the figure recorded between 1995 and 2005.
Table 4.5.6: Access to Energy in Nelson Mandela Bay Metro, 1995-2009
ACCESS TO ENERGY (%)
Average 1995 - 2005 2006 2007 2008 2009
Solar/other/unspecified 0.4 0.3 0.3 0.3 0.3
Electricity 72.2 71.8 71.2 71.1 71.1
Gas 0.3 0.4 0.4 0.4 0.4
Paraffin 25.1 25.6 26.2 26.2 26.3
Candles 1.7 1.9 1.9 2.0 2.0
Source: ECSECC and Own Calculations
4.5.6.3 Access to Sanitation
The number of households with access to flushing or chemical toilets decreased from
an average of 80.3 percent between 1995 and 2005 to 75.8 percent in 2009. This was
coupled with an increase in the number of people using pit- and bucket latrines, and
unspecified forms of waste management.

95
ACCESS TO SANITATION (%)
Average 1995 - 2005 2006 2007 2008 2009
Flush or chemical toilet 80.3 77.3 76.6 76.2 75.8
Pit latrine 2.5 3.5 3.8 3.9 4.0
Bucket latrine 13.3 14.2 14.3 14.5 14.6
None of the above 3.8 5.0 5.3 5.4 5.5
Unspecified/dummy 0.1 0.1 0.1 0.0 0.0
Source: ECSECC and Own Calculations
ACCESS TO TELEPHONE (%)
Average 1995 - 2005 2006 2007 2008 2009
In this dwelling and/or cellular phone 48.4 49.3 49.0 49.1 49.3
At a public telephone nearby 37.9 37.1 37.3 37.2 37.1
At a neigbour nearby 7.6 7.8 7.7 7.7 7.8
At another location, not nearby 1.1 1.0 1.0 1.0 1.0
At another location nearby 1.8 2.1 2.2 2.2 2.2
NA (institution)/unspecified/none 3.2 2.8 2.8 2.7 2.7
Source: ECSECC and Own Calculations
ACCESS TO REFUSE (%)
Average 1995 - 2005 2006 2007 2008 2009
Unspecified/other 0.5 0.2 0.2 0.2 0.1
Removed by local authority at least once a week 87.6 84.9 84.4 84.1 83.8
Removed by local authority less often 2.5 3.0 3.0 3.1 3.2
Communal refuse dump 1.7 1.9 2.0 2.0 2.0
Own refuse dump 4.9 6.1 6.3 6.4 6.6
No rubbish disposal 2.71 3.86 4.14 7.27 4.4
Source: ECSECC and Own Calculations
Table 4.5.7: Access to Sanitation in Nelson Mandela Bay Metro, 1995-2009
4.5.6.4 Access to telephones
About 97 percent of households had access to telephones, a figure similar to the
average of 1995 and 2005.
Table 4.5.8: Access to Telephones in Nelson Mandela Bay Metro, 1995-2008
4.5.6.5 Access to Refuse
More than 80 percent of households had access to refuse removal, with about 11 percent
either using their own dumping or having no standard way of dumping.
Table 4.5.9: Access to Refuse in Nelson Mandela Bay Metro, 1995-2009

96
TYPES OF DWELLING (%)
Average 1995 - 2005 2006 2007 2008 2009
House or brick structure on a separate stand or yard 58.1 57.9 57.5 57.5 57.5
Traditional dwelling/hut/structure madeof traditional materials 1.3 1.6 1.6 1.6 1.7
Flat in a block of flats 5.2 4.9 4.9 4.8 4.8
Town/cluster/semi-detached house(simplex, duplex or triplex) 4.7 4.3 4.3 4.2 4.1
House/flat/room in backyard 3.0 2.8 2.8 2.8 2.8
Informal dwelling/shack in backyard 3.4 3.1 3.0 3.0 2.9
Informal dwelling/shack, NOT in back-yard, e.g. in an informal settlement 21.6 22.6 23.2 23.3 23.5
Room/flatlet not in backyard, but ona shared property 0.9 0.9 0.9 0.9 0.9
Other/unspecified/NA 1.9 1.9 1.9 1.9 1.9
Source: ECSECC and Own Calculations
NEL
SON
MA
ND
ELA
BAY
MET
ROPO
LITA
N M
UN
ICIPA
LITY
4.5.7 TyPE Of DWELLINg
More than 70 percent of households had access to housing in 2009, 2 percent of which
were using traditional dwellings. About 26 percent of the population live in informal
settlements. There is no departure from the figures recorded between 1995 and 2005.
Table 4.5.10: Access to Housing in Nelson Mandela Bay Metro, 1995-2009
4.5.8 fORMAL EMPLOyMENT By SECTOR
The biggest employer in the district is the tertiary sector, providing 78 percent of employment,
with the secondary sector contributing 21 percent to employment and the primary sector 1
percent. Sixty percent of employment in the tertiary sector comes from community, social and
other services, government and social services, and other government and social services.
Besides most industries recording job losses, mining, finance, and wholesale recorded the
highest growth rates.
Table 4.5.11: Formal employment by sector in Nelson Mandela Bay Metro, 1995-2008
NUMBER OF PEOPLE EMPLOYED BY SECTOR
1995 1995 - 2001 - 2006 2008 2006 - (Number) 2000 (%) 2005 (%) (Number) (Number) 2008 (%)
AFF 6,564 -0.5 -4.5 3,298 3,170 -3.9
MQ 476 -26.7 9.2 377 400 6.1
MAN 71,670 -13.8 -5.1 57,122 55,395 -3.0
EGW 1,009 -9.0 -4.2 860 848 -1.4
CON 10,086 -25.8 3.5 8,133 7,971 -2.0
WRTCA 27,466 18.1 13.7 38,941 41,167 5.7
TSC 11,524 -19.5 7.5 10,008 10,158 1.5
FIBS 26,406 29.1 12.3 41,220 43,721 6.1
CSPS 75,741 -4.7 -0.6 71,039 71,193 0.2
OGSS 34,374 -0.5 -5.3 31,510 31,015 -1.6
GSS 41.367 -8.1 3.8 39,529 40,178 1.6
Source: Quantec Research and Own Calculations
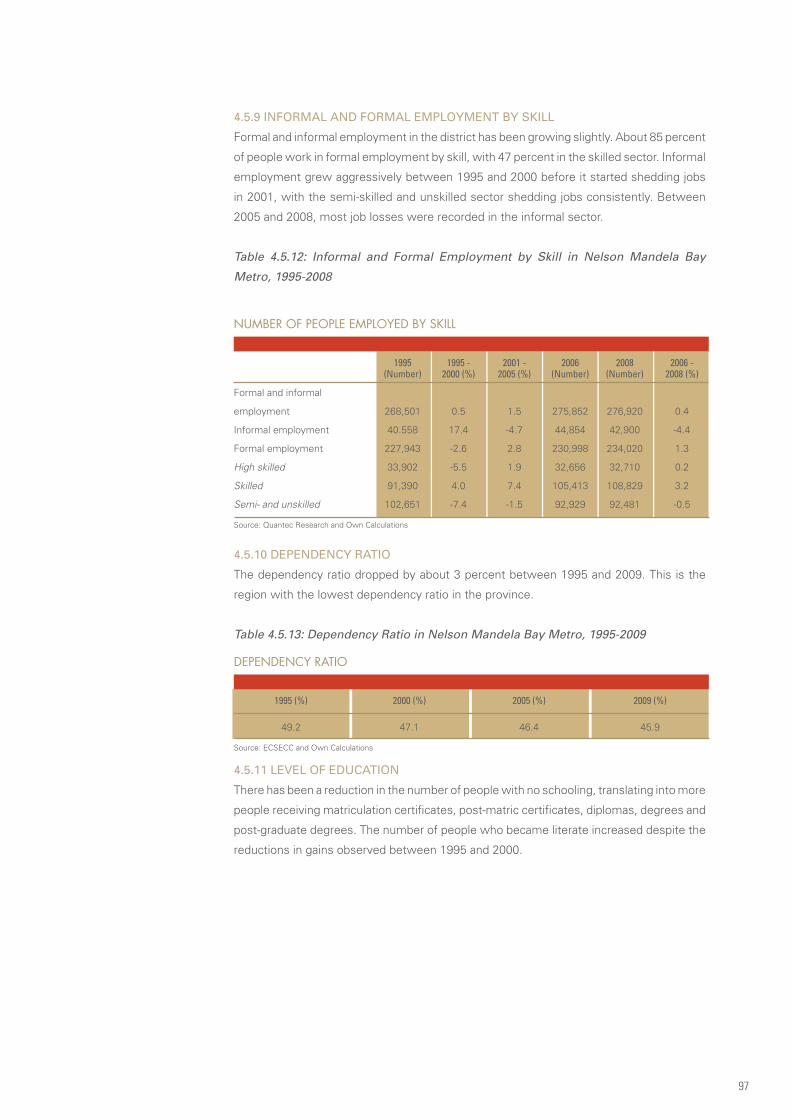
97
NUMBER OF PEOPLE EMPLOYED BY SKILL
1995 1995 - 2001 - 2006 2008 2006 - (Number) 2000 (%) 2005 (%) (Number) (Number) 2008 (%)
Formal and informal
employment 268,501 0.5 1.5 275,852 276,920 0.4
Informal employment 40.558 17.4 -4.7 44,854 42,900 -4.4
Formal employment 227,943 -2.6 2.8 230,998 234,020 1.3
High skilled 33,902 -5.5 1.9 32,656 32,710 0.2
Skilled 91,390 4.0 7.4 105,413 108,829 3.2
Semi- and unskilled 102,651 -7.4 -1.5 92,929 92,481 -0.5
Source: Quantec Research and Own Calculations
DEPENDENCY RATIO
1995 (%) 2000 (%) 2005 (%) 2009 (%)
49.2 47.1 46.4 45.9
Source: ECSECC and Own Calculations
4.5.9 INfORMAL AND fORMAL EMPLOyMENT By SkILL
Formal and informal employment in the district has been growing slightly. About 85 percent
of people work in formal employment by skill, with 47 percent in the skilled sector. Informal
employment grew aggressively between 1995 and 2000 before it started shedding jobs
in 2001, with the semi-skilled and unskilled sector shedding jobs consistently. Between
2005 and 2008, most job losses were recorded in the informal sector.
Table 4.5.12: Informal and Formal Employment by Skill in Nelson Mandela Bay
Metro, 1995-2008
4.5.10 DEPENDENCy RATIO
The dependency ratio dropped by about 3 percent between 1995 and 2009. This is the
region with the lowest dependency ratio in the province.
Table 4.5.13: Dependency Ratio in Nelson Mandela Bay Metro, 1995-2009
4.5.11 LEVEL Of EDUCATION
There has been a reduction in the number of people with no schooling, translating into more
people receiving matriculation certificates, post-matric certificates, diplomas, degrees and
post-graduate degrees. The number of people who became literate increased despite the
reductions in gains observed between 1995 and 2000.
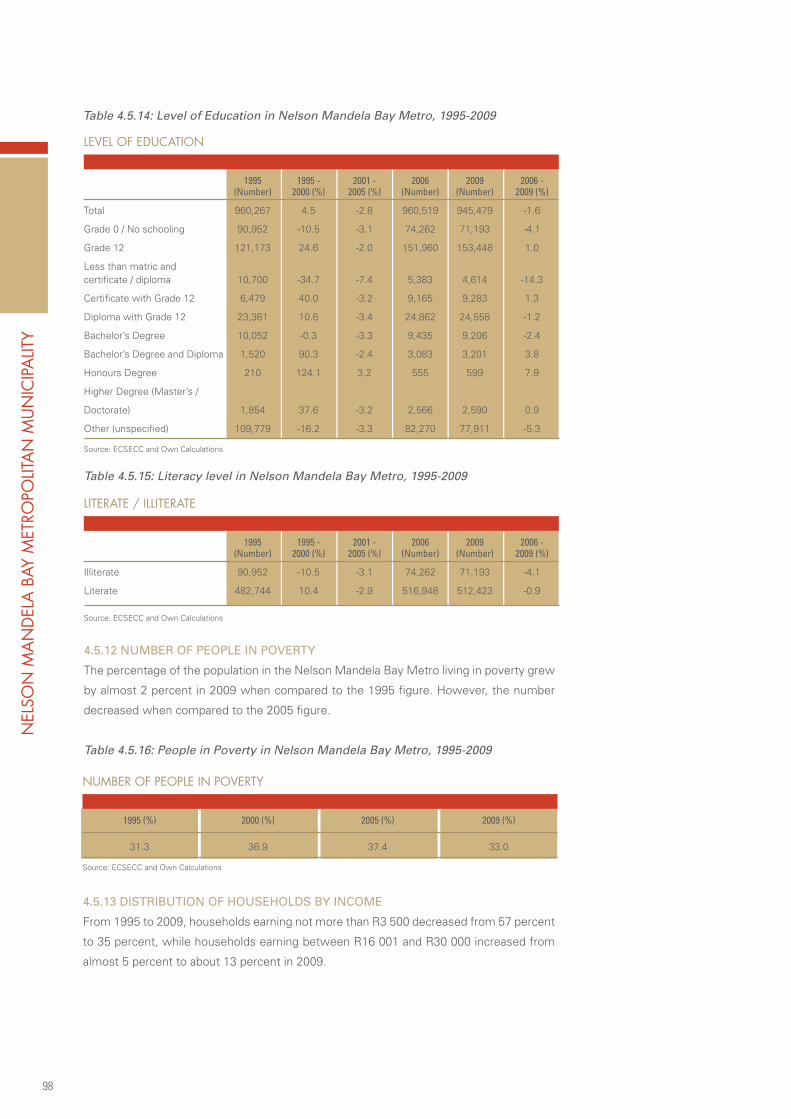
98
Table 4.5.14: Level of Education in Nelson Mandela Bay Metro, 1995-2009
NEL
SON
MA
ND
ELA
BAY
MET
ROPO
LITA
N M
UN
ICIPA
LITY
LEVEL OF EDUCATION
1995 1995 - 2001 - 2006 2009 2006 - (Number) 2000 (%) 2005 (%) (Number) (Number) 2009 (%)
Total 960,267 4.5 -2.8 960,519 945,479 -1.6
Grade 0 / No schooling 90,952 -10.5 -3.1 74,262 71,193 -4.1
Grade 12 121,173 24.6 -2.0 151,960 153,448 1.0
Less than matric and certificate / diploma 10,700 -34.7 -7.4 5,383 4,614 -14.3
Certificate with Grade 12 6,479 40.0 -3.2 9,165 9,283 1.3
Diploma with Grade 12 23,361 10.6 -3.4 24,862 24,558 -1.2
Bachelor’s Degree 10,052 -0.3 -3.3 9,435 9,206 -2.4
Bachelor’s Degree and Diploma 1,520 90.3 -2.4 3,083 3,201 3.8
Honours Degree 210 124.1 3.2 555 599 7.9
Higher Degree (Master’s /
Doctorate) 1,854 37.6 -3.2 2,566 2,590 0.9
Other (unspecified) 109,779 -16.2 -3.3 82,270 77,911 -5.3
Source: ECSECC and Own Calculations
Table 4.5.15: Literacy level in Nelson Mandela Bay Metro, 1995-2009
LITERATE / ILLITERATE
1995 1995 - 2001 - 2006 2009 2006 - (Number) 2000 (%) 2005 (%) (Number) (Number) 2009 (%)
Illiterate 90,952 -10.5 -3.1 74,262 71,193 -4.1
Literate 482,744 10.4 -2.9 516,948 512,423 -0.9
Source: ECSECC and Own Calculations
4.5.12 NUMBER Of PEOPLE IN POVERTy
The percentage of the population in the Nelson Mandela Bay Metro living in poverty grew
by almost 2 percent in 2009 when compared to the 1995 figure. However, the number
decreased when compared to the 2005 figure.
Table 4.5.16: People in Poverty in Nelson Mandela Bay Metro, 1995-2009
NUMBER OF PEOPLE IN POVERTY
1995 (%) 2000 (%) 2005 (%) 2009 (%)
31.3 36.9 37.4 33.0
Source: ECSECC and Own Calculations
4.5.13 DISTRIBUTION Of HOUSEHOLDS By INCOME
From 1995 to 2009, households earning not more than R3 500 decreased from 57 percent
to 35 percent, while households earning between R16 001 and R30 000 increased from
almost 5 percent to about 13 percent in 2009.

99
HOUSEHOLD DISTRIBUTION BY INCOME
1995 (%) 2000 (%) 2005 (%) 2009 (%)
< R500 per month 5.8 7.3 3.8 1.5
R500 - R1000 14 10.5 10 6.9
R1001 - R3500 37.1 35.9 31.9 26.9
R3501 - R6000 16.2 15.7 15.2 15.6
R6001 - R11000 13.3 11.8 13.9 16
R11001 - R16000 7 7.5 7.6 9
R16001 - R30000 4.6 7.3 10.9 12.7
R30001 - R50000 1.5 3.2 4.4 6.7
R50000+ 0.4 0.8 2.3 4.7
Source: ECSECC and Own Calculations
URBANIZATION (%)
1995 (%) 2000 (%) 2005 (%) 2009 (%)
People living in rural areas 1.9 4.2 4.2 4.1
People living in urban areas 98.1 95.8 95.6 95.9
Source: ECSECC and Own Calculations
HUMAN DEVELOPMENT INDICATOR
1995 (%) 2000 (%) 2005 (%) 2009 (%)
0.63 0.65 0.67 0.68
Source: ECSECC and Own Calculations
Table 4.5.17: Distribution of Households by Income in Nelson Mandela Bay Metro,
1995-2009
4.5.14 HUMAN DEVELOPMENT INDICATOR (HDI)
The Human Development Indicator in the metro grew from 0.6 to 0.7 between 1995 and
2009, signaling better standards of living, relatively low levels of poverty and improving
life expectancy in the region.
Table 4.5.18: Human Development Indicator in Nelson Mandela Bay Metro,
1995-2009
4.5.15 URBANISATION
Despite the fact that the majority of the population in the district live in urban areas, there
has been a slight increase in the number of people moving to rural areas.
Table 4.5.19: Urbanisation in Nelson Mandela Bay Metro, 1995-2009

100
O.R
. TA
MBO
DIS
TRIC
T M
UN
ICIPA
LITY
4.6 O.R. TAMBO DISTRICT MUNICIPALITYThe O.R. Tambo district municipality is located in the former Transkei homeland area of
the Eastern Cape. It is within the well-known Wild Coast and located on the north-eastern
side of the Eastern Cape. It has seven local municipalities, namely, Qaukeni, King Sabata
Dalindyebo, Mbizana, Mhlontlo, Ntabankulu, Nyandeni and Port St. Johns, and covers
both the Wild Coast and the Pondo land. The district has a land area of 15 535 square
kilometers, 92 percent of which is rural and 8 percent urban.
The population in the O.R. Tambo DM increased from an estimated 1 751 820 people in
2008 to 1 771 788 in 2009. Africans constituted 93.3 percent of the total, Coloureds 0.4
percent, Asians 0.1 percent and Whites 0.2 percent. There has been no change in terms
of gender proportion since 2008; in 2009, 45 percent of the population was male and 55
percent was female.
The Gross Value Added for 2008 was R9 billion, a growth rate of 3 percent from 2007.
This made O.R. Tambo the fourth-largest economy in the province. About 84 percent
of GVA came from the tertiary sector. Sectors that contributed the most were general
government with 29 percent, community services with 16 percent, finance and insurance
with 15 percent, wholesale and retail with 13 percent, and transport and communication
with 11 percent.
4.6.1 TOTAL POPULATION By AgE gROUP
In the past 14 years, growth in all age groups has been decreasing. Between 1995 and
2000, the total population grew by 8.6 percent, with the age group 45–65+ experiencing
the highest growth of 11.29 percent, while the age group 0–14 had the lowest growth,
with 6.27 percent. However, all age groups have experienced a decline in growth over the
last two periods considered on the table below.
Table 4.6.1: Population by Age Group in O.R. Tambo, 1995-2009
POPULATION BY AGE GROUP
1995 (Number) 1995 - 2000 (%) 2001 - 2005 (%) 2006 (Number) 2009 (Number) 2006 - 2009 (%)
Total 1,523,133 8.6 3 1,728,596 1,771,778 2.5
0 - 14 707,147 6.3 2.9 780,067 797,025 2.2
15 - 44 586,713 10.2 3.3 681,315 700,560 2.8
45 - 65+ 229,273 11.3 2.7 267,214 274,192 2.6
Source: ECSECC and Own Calculations
4.6.2 TOTAL POPULATION AffECTED By HIV
The total number of people affected by HIV in the O.R. Tambo DM grew from 6 percent
of the population to almost 10 percent from 1995 to 2007. The most-affected group
was African, with a startling figure of more than 99 percent of the affected population,
followed by the Coloureds, Whites and Indians. People in the age group 15 to 44 are the
most affected, despite the decline in their contribution from 89 percent in 2000 to 79
percent in 2007.
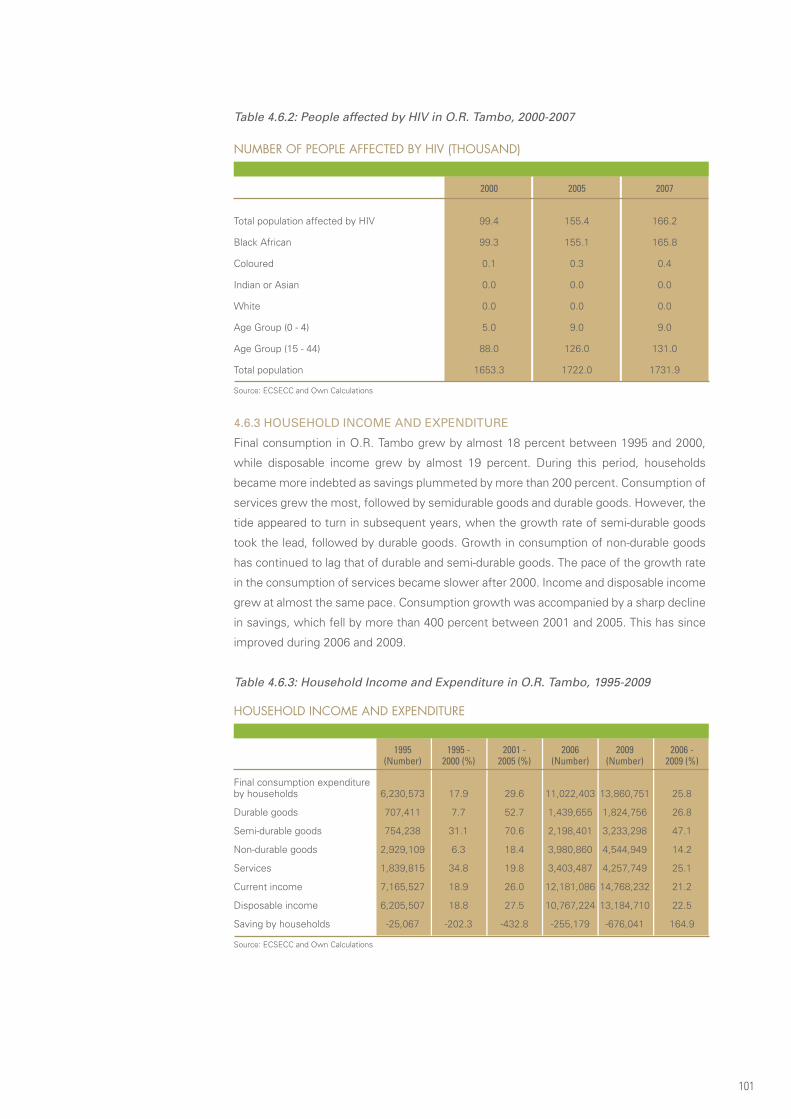
101
Table 4.6.2: People affected by HIV in O.R. Tambo, 2000-2007
NUMBER OF PEOPLE AFFECTED BY HIV (THOUSAND)
2000 2005 2007
Total population affected by HIV 99.4 155.4 166.2
Black African 99.3 155.1 165.8
Coloured 0.1 0.3 0.4
Indian or Asian 0.0 0.0 0.0
White 0.0 0.0 0.0
Age Group (0 - 4) 5.0 9.0 9.0
Age Group (15 - 44) 88.0 126.0 131.0
Total population 1653.3 1722.0 1731.9
Source: ECSECC and Own Calculations
4.6.3 HOUSEHOLD INCOME AND ExPENDITURE
Final consumption in O.R. Tambo grew by almost 18 percent between 1995 and 2000,
while disposable income grew by almost 19 percent. During this period, households
became more indebted as savings plummeted by more than 200 percent. Consumption of
services grew the most, followed by semidurable goods and durable goods. However, the
tide appeared to turn in subsequent years, when the growth rate of semi-durable goods
took the lead, followed by durable goods. Growth in consumption of non-durable goods
has continued to lag that of durable and semi-durable goods. The pace of the growth rate
in the consumption of services became slower after 2000. Income and disposable income
grew at almost the same pace. Consumption growth was accompanied by a sharp decline
in savings, which fell by more than 400 percent between 2001 and 2005. This has since
improved during 2006 and 2009.
Table 4.6.3: Household Income and Expenditure in O.R. Tambo, 1995-2009
HOUSEHOLD INCOME AND EXPENDITURE
1995 1995 - 2001 - 2006 2009 2006 - (Number) 2000 (%) 2005 (%) (Number) (Number) 2009 (%)
Final consumption expenditure by households 6,230,573 17.9 29.6 11,022,403 13,860,751 25.8
Durable goods 707,411 7.7 52.7 1,439,655 1,824,756 26.8
Semi-durable goods 754,238 31.1 70.6 2,198,401 3,233,298 47.1
Non-durable goods 2,929,109 6.3 18.4 3,980,860 4,544,949 14.2
Services 1,839,815 34.8 19.8 3,403,487 4,257,749 25.1
Current income 7,165,527 18.9 26.0 12,181,086 14,768,232 21.2
Disposable income 6,205,507 18.8 27.5 10,767,224 13,184,710 22.5
Saving by households -25,067 -202.3 -432.8 -255,179 -676,041 164.9
Source: ECSECC and Own Calculations

102
O.R
. TA
MBO
DIS
TRIC
T M
UN
ICIPA
LITY
4.6.4 SECTORAL CONTRIBUTION ANALySIS
The contribution of the primary sector to O.R Tambo district output has stagnated over
the last 14 years, with an average percentage of 2.5. The tertiary sector contributes most
to the district economy with an average percentage of 88, followed by the secondary
sector with 9.5 percent. Although the tertiary sector dominates the district economy,
it represented only 11.1 percent of the tertiary sector of the province in 2008, a decline
of 12.4 percent on 1995. The tertiary industries are the most dominant in the district
economy, with general government in front, followed by community and social services,
with industry and finance in third position.
Figure 4.6: GVA Contribution for O.R. Tambo, 1995-2008
OR Tambo - gVA Contribution
4.6.5 SECTORAL gROWTH ANALySIS
The primary sector in the O.R. Tambo District Municipality experienced growth levels
that exceeded 4 percent after emerging from negative territory between 1995 and 2000.
Growth in this sector was driven by agriculture forestry and fishing, which rose above 5
percent between 2001 and 2005 before declining between 2001 and 2008.
The secondary sector in the DM has grown robustly, from less than 3 percent between
1995 and 2000 to more than 10 percent between 2001 and 2008. This is significantly
higher than the province’s growth. Manufacturing and construction contributed the most
in terms of growth, both registering more than 10 percent, while electricity, gas and water
declined from 2001 to 2008. This industry was growing at almost 9 percent between 1995
and 2000, and has since dropped to minus 2 percent. The negative growth level in the
electricity, gas and water industry prevailed at provincial level as well.
Growth in the tertiary sector, in line with the provincial tertiary sector, has been steady since
1995. Industries that recorded positive growth in this district were general government
services; community, social and personal services; wholesale, retail and trade, catering
and accommodation; and finance, insurance and business services. Growth in the
community, social and personal-services industry has been around 3 percent since 1995,

103
while finance, insurance and business services grew from less than 1 percent during the
years 1995 to 2000 to almost 5 percent between 2001 and 2008. General government
services experienced gradual growth towards the latter part of the period 2001 and 2008,
while wholesale, retail and trade, catering and accommodation experienced a decline in
growth compared with 1995 to 2000.
Table 4.6.4: Sectoral Growth for O.R. Tambo, 1995-2008
O.R. TAMBO: AVERAGE GROWTH (%)
1995 - 2000 2001 - 2005 2001 - 2008
EC -0.2% 3.1% 1.7%
PRIMARY SEC. O.R Tambo -1.4% 4.3% 3.3%
EC -0.2% 3.1% 1.8%
AFF O.R Tambo 1.9% 5.7% 4.9%
EC 2.6% 2.8% 3.2%
SECONDARY SEC. O.R Tambo 2.7% 9.8% 10.5%
EC 2.6% 2.4% 2.6%
MAN O.R Tambo 0.8% 13.0% 13.3%
EC 2.1% 11.1% 11.4%
CON O.R Tambo 3.2% 11.1% 11.2%
EC 3.2% -1.9% -0.5%
EGW O.R Tambo 8.9% -2.2% -2.0%
EC 2.5% 3.3% 3.6%
TERTIARY SEC. O.R Tambo 1.7% 2.2% 2.6%
EC 1.3% 1.0% 3.0%
GGS O.R Tambo 0.5% 0.5% 1.5%
EC 3.6% 2.9% 3.5%
CSPS O.R Tambo 3.2% 2.7% 3.3%
EC 3.7% 2.2% 2.7%
WRTCA O.R Tambo 2.0% 0.3% 0.5%
EC 1.2% 6.3% 6.0%
FIBS O.R Tambo 0.9% 5.2% 4.7%
Source: Own Calculation and Quantec Research
4.6.6 ACCESS TO SERVICES
4.6.6.1 Access to Water
In 2009, about 65 percent of households in the O.R Tambo DM had access to water through
dams, rivers, streams or springs. Despite the decline in the number of such households,
the figure remains stubbornly high. Approximately 9 percent of households have access
to water inside their dwellings. Since 1995, there has been very little improvement in
bringing water closer to households.

104
O.R
. TA
MBO
DIS
TRIC
T M
UN
ICIPA
LITY
Table 4.6.5: Access to Water in O.R. Tambo, 1995-2009
ACCESS TO WATER (%)
Average 1995 - 2005 2006 2007 2008 2009
Piped water inside dwelling 3.7 3.2 3.1 3.1 3.0
Piped water inside yard 6.1 6.4 6.4 6.5 6.5
Piped water on community stand:distance less than 200m from dwelling 8.0 7.2 7.1 7.0 7.0
Piped water on community stand:distance greater than 200m from dwell. 6.6 9.8 9.9 10.2 10.6
Borehole/rain-water tank/well 4.5 5.4 5.5 5.6 5.7
Dam/river/stream/spring 68.8 65.7 65.5 65.2 64.9
Water carrier/tanker/water vendor 0.9 0.8 0.9 0.9 0.8
Other/unspecified/dummy 1.5 1.6 1.6 1.6 1.6
Source: ECSECC and Own Calculations
4.6.6.2 Access to Energy
In 2009, about 25 percent of households use electricity as a form of energy, representing
an increase of 5 percentage points when compared to the years 1995 to 2005. The
majority of households in the district municipality still rely on candles for lighting, and this
has been the case since 1995.
Table 4.6.6: Access to Energy in O.R. Tambo, 1995-2009
ACCESS TO ENERGY (%)
Average 1995 - 2005 2006 2007 2008 2009
Solar/other/unspecified 1.4 1.3 1.3 1.3 1.3
Electricity 20.3 24.1 24.0 24.5 25.0
Gas 0.4 0.3 0.3 0.3 0.3
Paraffin 18.1 15.1 15.2 14.8 14.4
Candles 59.8 59.2 59.2 59.1 59.1
Source: ECSECC and Own Calculations
4.6.6.3 Access to Sanitation
The average percentage of households that use pit latrines, bucket latrines and other
forms of waste management has never changed, remaining above 90 percent since 1995.
Less than 10 percent of households have access to flush- or chemical toilets.
Table 4.6.7: Access to Sanitation in O.R. Tambo, 1995-2009
ACCESS TO SANITATION (%)
Average 1995 - 2005 2006 2007 2008 2009
Flush or chemical toilet 9.1 9.7 9.7 9.7 9.8
Pit latrine 38.6 37.3 37.3 37.1 37.0
Bucket latrine 1.8 1.4 1.4 1.3 1.3
None of the above 50.2 21.4 51.6 51.7 51.9
Unspecified/dummy 0.4 0.2 0.2 0.1 0.1
Source: ECSECC and Own Calculations

105
4.6.6.4 Access to Telephones
Access to telephones by households in O.R Tambo has been increasing since 1995, with
public telephones taking the lead. This type of access to telephones by households has
increased from an average of 25.9 percent between 1995 and 2005 to 32.7 percent in
2009. The percentage of households using cellular phones in O.R Tambo increased from
an average of 12.15 percent during the years 1995 to 2005, to 17.13 percent in 2009,
despite the less-than-1-percentage point increase from 2006.
Overall, the number of households that have access to telephones increased from an
average of 58.8 between 1995 and 2005 to 76.9 in 2009.
Table 4.6.8: Access to Telephone in O.R. Tambo, 1995-2009
ACCESS TO TELEPHONE (%)
Average 1995 - 2005 2006 2007 2008 2009
In this dwelling and/or cellular phone 12.2 16.1 16.2 16.7 17.1
At a public telephone nearby 26.0 31.2 31.4 32.0 32.7
At a neigbour nearby 5.4 7.1 7.1 7.3 7.5
At another location, not nearby 9.7 11.3 11.3 11.5 11.8
At another location nearby 5.7 7.4 7.4 7.6 7.8
NA (institution)/unspecified/none 41.2 27.0 26.7 24.8 23.1
Source: ECSECC and Own Calculations
4.6.6.5 Access to Refuse
More than 90 percent of households in the district either use their own refuse dumps or
have no means of disposing of refuse. Households appeared to adopt their own refuse
dumps, as the removal of refuse by local authorities declined since 1995.
Table 4.6.9: Access to Refuse in O.R. Tambo, 1995-2009
ACCESS TO REFUSE (%)
Average 1995 - 2005 2006 2007 2008 2009
Unspecified/other 0.7 0.3 0.2 0.2 0.2
Removed by local authority at least once a week 7.1 6.6 6.5 6.4 6.4
Removed by local authority less often 1.0 0.9 0.9 0.8 0.8
Communal refuse dump 0.9 0.9 0.9 0.9 0.8
Own refuse dump 60.6 63.6 63.8 64.2 64.5
No rubbish disposal 29.74 27.82 27.77 27.53 27.3
Source: ECSECC and Own Calculations
4.6.7 TyPES Of DWELLINg
Traditional dwellings have been the most common type of accommodation for households
in the O.R Tambo district, representing an average of 68 percent of the total for the years
1995 to 2005 and 66.8 percent in 2009, followed by houses or brick structures, which
represented an average of 16.9 percent of all dwellings between 1995 and 2005, and 18.0
percent in 2009. Informal dwellings or shacks in backyards have been the least common

106
type of accommodation, accounting for less than 1 percent of
the total.
Table 4.6.10: Access to Housing in O.R. Tambo, 1995-2009
O.R
. TA
MBO
DIS
TRIC
T M
UN
ICIPA
LITY
TYPES OF DWELLING (%)
Average 1995 - 2005 2006 2007 2008 2009
House or brick structure on a separate stand or yard 16.9 17.7 17.8 17.9 18.0
Traditional dwelling/hut/structure madeof traditional materials 68.0 67.1 66.9 66.8 66.8
Flat in a block of flats 4.6 5.3 5.3 5.3 5.4
Town/cluster/semi-detached house(simplex, duplex or triplex) 1.5 1.0 1.0 0.9 0.9
House/flat/room in backyard 3.7 3.2 3.2 3.1 3.1
Informal dwelling/shack in backyard 0.8 0.8 0.9 0.9 0.9
Informal dwelling/shack, NOT in back-yard, e.g. in an informal settlement 2.0 2.2 2.3 2.3 2.3
Room/flatlet not in backyard, but ona shared property 1.2 1.1 1.1 1.1 1.1
Other/unspecified/NA 1.5 1.6 1.6 1.6 1.6
Source: ECSECC and Own Calculations
4.6.8 fORMAL EMPLOyMENT By SECTOR
Formal employment in O.R Tambo DM has improved in growth over the past 14 years.
Some industries have improved from high negative growth rates to positive rates.
Industries that have grown in terms of formal employment include finance and business
services; wholesale and retail trade, catering and accommodation; and general government
services. The primary sector, which includes agriculture, forestry and fishing, and mining,
has been shedding jobs heavily since 1995. The same trend prevailed in the secondary
sector for the period 1995 to 2000, with some slight improvements in electricity gas and
water. Although the tertiary sector has been able to create jobs during the periods 2001 to
2005 and 2006 to 2008, there were job losses during the period 1995 to 2000 in industries
such as transport, storage and communication and general government services.

107
NUMBER OF PEOPLE EMPLOYED BY SECTOR
1995 1995 - 2001 - 2006 2008 2006 - (Number) 2000 (%) 2005 (%) (Number) (Number) 2008 (%)
AFF 4,454 -18.4 -17.5 2,835 2,457 -13.4
MQ 2,779 -52.0 -11.0 1,133 1,122 -0.9
MAN 6,252 -19.7 -9.0 4,344 4,056 -6.6
EGW 372 -10.5 0.9 345 351 1.7
CON 5,104 -21.9 6.8 4,484 4,478 -0.1
WRTCA 11,345 4.8 7.1 13,033 13,421 3.0
TSC 2,539 -22.2 9.0 2,164 2,203 1.8
FIBS 5,914 43.1 20.0 11,503 12,591 9.5
CSPS 46,757 -2.9 3.1 47,148 48,058 1.9
OGSS 16,873 8.2 0.4 18,312 18,634 1.8
GSS 29,884 -9.1 4.9 28,836 29,425 2.0
Source: Quantec Research and Own Calculations
Table 4.6.11: Formal employment by sector in O.R. Tambo, 1995-2008
4.6.9 INfORMAL AND fORMAL EMPLOyMENT By SkILL
The formal and informal sectors of employment in the O.R. Tambo DM lost jobs during
1995 and 2001. From 2001, there was only a spark of growth. More jobs were shed in
formal employment, especially in the highly skilled sector. The propensity to shed jobs
in the highly skilled sector continued despite the overall growth in formal employment
from 2001. The one sector that experienced growth was the skilled sector, especially
between 2001 and 2005. Informal employment shrunk after 2000, and has continued to
shed jobs.
Table 4.6.12: Informal and Formal Employment by Skill in O.R. Tambo, 1995-2008
NUMBER OF PEOPLE EMPLOYED BY SKILL
1995 1995 - 2001 - 2006 2008 2006 - (Number) 2000 (%) 2005 (%) (Number) (Number) 2008 (%)
Formal and informal
employment 102,943 -2.2 1.7 103,424 103,956 0.5
Informal employment 17,418 7.2 -9.2 16,436 15,222 -7.4
Formal employment 85,525 -4.1 4.1 86,988 88,734 2.0
High skilled 14,708 -14.5 -1.2 12,216 12,011 -1.7
Skilled 32,981 2.7 9.7 38,829 40,456 4.2
Semi- and unskilled 37,836 -5.9 0.4 35,943 36,266 0.9
Source: Quantec Research and Own Calculations
4.6.10 DEPENDENCy RATIO
The dependency ratio in the O.R Tambo district decreased by about 5 percentage points
between 1995 and 2009. Be that as it may, this district still has the highest dependency
ratio in the entire province, implying that the number of people who are not economically
active exceeds those who are active by a great margin. The high dependency ratio, with
about 67 percent of households earning not more than R3 500 per month, contributes to
the high poverty levels in the district.

108
O.R
. TA
MBO
DIS
TRIC
T M
UN
ICIPA
LITY
Table 4.6.13: Dependency Ratio in O.R. Tambo, 1995-2009
4.6.11 LEVEL Of EDUCATION
The number of persons with no schooling has been declining since 1995 and 2000 –
despite an uptick in the years 2001 and 2006 which later dropped – resulting in an increase
in the number of people with Grade 12. This translated into almost 80 percent growth in
the number of people with matric. At postmatric level, the number of people awarded
certificates, diplomas and degrees grew significantly with those awarded Bachelor’s
degrees and diplomas taking the lead, followed by Honours degrees, certificates,
Master’s and doctoral degrees. However, post-1995 and 2000 there has been a decline
in the growth rates of the graduates. The total level of education in O.R Tambo grew by
8.6 percent between 1995 and 2000 and declined between 2001 and 2005, and 2006 and
2009. Growth in illiteracy levels dropped has been declining since 1995.
Table 4.6.14: Level of Education in O.R. Tambo, 1995-2009
DEPENDENCY RATIO
1995 (%) 2000 (%) 2005 (%) 2009 (%)
107.1 103.8 102.7 102.1
Source: ECSECC and Own Calculations
LEVEL OF EDUCATION
1995 1995 - 2001 - 2006 2009 2006 - (Number) 2000 (%) 2005 (%) (Number) (Number) 2009 (%)
Total 1,523,133 8.5 3.0 1,728,596 1,771,778 2.5
Grade 0 / No schooling 461,519 -8.4 2.2 417,690 416,357 -0.3
Grade 12 52,032 21.2 3.3 68,023 70,652 3.9
Less than matric and certificate / diploma 5,091 -20.8 0.2 3,714 3,570 -3.9
Certificate with Grade 12 2,698 78.9 7.2 5,842 6,350 8.7
Diploma with Grade 12 12,683 24.6 3.4 17,111 17,810 4.1
Bachelor’s Degree 3,875 12.6 1.9 4,540 4,642 2.3
Bachelor’s Degree and Diploma 751 125.8 5.2 2,052 2,236 9.0
Honours Degree 391 119.2 -5.1 1,035 1,126 8.8
Higher Degree (Master’s /
Doctorate) 570 43.9 1.4 890 928 4.2
Other (unspecified) 247.236 -5.0 2.5 235,726 236,814 0.5
Source: ECSECC and Own Calculations
Table 4.6.15: Literacy level in O.R. Tambo, 1995-2009
LITERATE / ILLITERATE
1995 1995 - 2001 - 2006 2009 2006 - (Number) 2000 (%) 2005 (%) (Number) (Number) 2009 (%)
Illiterate 461,519 -8.4 2.2 417,690 416,357 -0.3
Literate 317,439 13.0 3.1 378,883 390,193 3.0
Source: ECSECC and Own Calculations

109
4.6.12 NUMBER Of PEOPLE IN POVERTy
The share of the population living in poverty in the O.R Tambo district increased from
65.5 percent to 76.1 percent between 1995 and 2005, before declining to 63.3 percent
in 2009.
Table 4.6.16: People in Poverty in O.R. Tambo, 1995-2009
NUMBER OF PEOPLE IN POVERTY
1995 (%) 2000 (%) 2005 (%) 2009 (%)
65.5 74.1 76.1 63.3
Source: ECSECC and Own Calculations
4.6.13 DISTRIBUTION Of HOUSEHOLDS By INCOME
From 1995, almost 90 percent of households earned R3 500 or less, with approximately
50 percent of this group earning not more than R1 000. The majority of households in
this district municipality were earning slightly above R1 000 and not more than R3 500.
This income group has grown from just below 40 percent in 1995 to almost 50 percent in
2009. In 2005, the group earning between R3 501 and R11 000 increased from less than
10 percent in 2000 to almost 15 percent, and increased to just under 25 percent in 2009.
This was accompanied by a decline in those groups earning less than R500 and more than
R500, but not more than R1 000, since 2005. Households earning more than R11 000
grew from about 3 percent in 1995 to almost 10 percent in 2009.
Table 4.6.17: Distribution of Households by Income in O.R. Tambo, 1995-2009
HOUSEHOLD DISTRIBUTION BY INCOME
1995 (%) 2000 (%) 2005 (%) 2009 (%)
< R500 per month 16.3 17.2 8.4 3.2
R500 - R1000 32.2 25.1 22.9 14.8
R1001 - R3500 39.7 44.0 48.4 48.6
R3501 - R6000 5.3 6.3 9.9 16.3
R6001 - R11000 3.4 3.6 4.8 8.2
R11001 - R16000 2.0 1.5 1.9 2.9
R16001 - R30000 0.8 1.4 2.3 3.5
R30001 - R50000 0.3 0.7 0.9 1.6
R50000+ 0.1 0.2 0.5 0.9
Source: ECSECC and Own Calculations
4.6.14 HUMAN DEVELOPMENT INDICATOR (HDI)
The Human Development Indicator (HDI) in the O.R Tambo district has shown no
remarkable improvement over the past 14 years. HDI increased from 0.38 in 1995 to 0.40
in 2009. The low increase of HDI is a concern as it reflects low access to services, high
illiteracy and low standards of living. The measurement of the average achievements in
the O.R Tambo district in the three basic dimensions of human development (a long and
healthy life, knowledge and a decent standard of living) showed no significant change,
with a very low rate for the development of people.
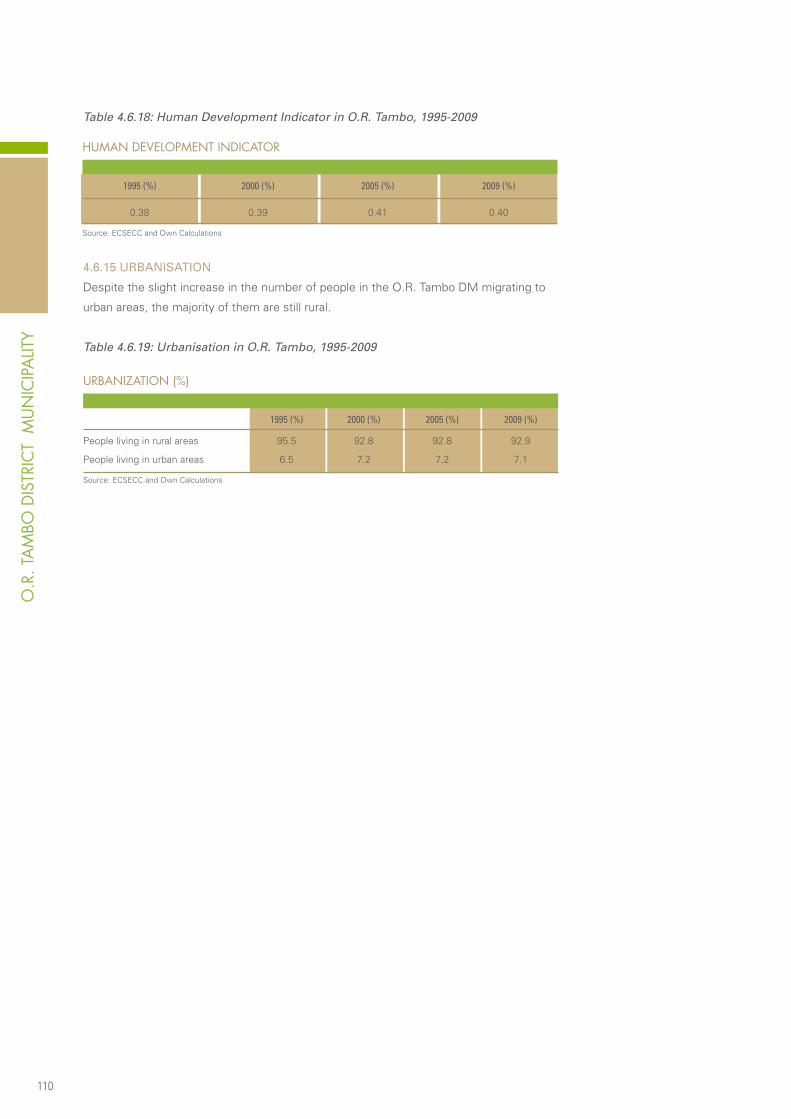
110
Table 4.6.18: Human Development Indicator in O.R. Tambo, 1995-2009
O.R
. TA
MBO
DIS
TRIC
T M
UN
ICIPA
LITY
HUMAN DEVELOPMENT INDICATOR
1995 (%) 2000 (%) 2005 (%) 2009 (%)
0.38 0.39 0.41 0.40
Source: ECSECC and Own Calculations
4.6.15 URBANISATION
Despite the slight increase in the number of people in the O.R. Tambo DM migrating to
urban areas, the majority of them are still rural.
Table 4.6.19: Urbanisation in O.R. Tambo, 1995-2009
URBANIZATION (%)
1995 (%) 2000 (%) 2005 (%) 2009 (%)
People living in rural areas 95.5 92.8 92.8 92.9
People living in urban areas 6.5 7.2 7.2 7.1
Source: ECSECC and Own Calculations
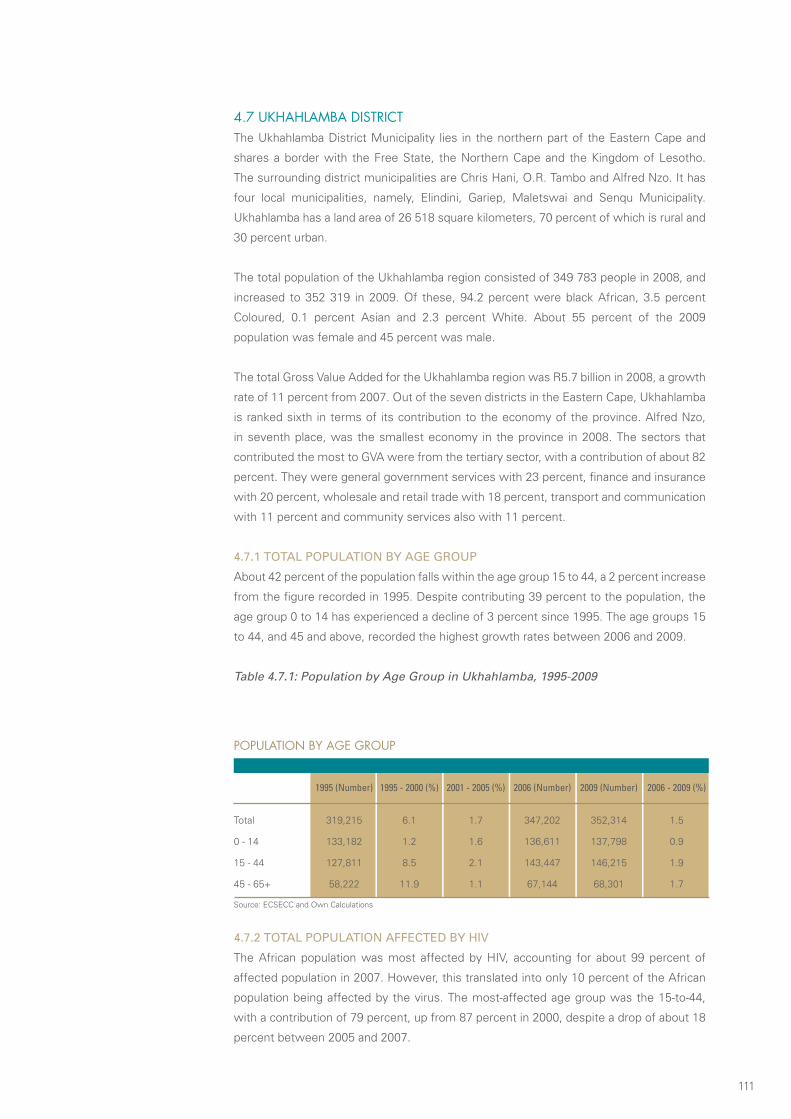
111
4.7 UKHAHLAMBA DISTRICTThe Ukhahlamba District Municipality lies in the northern part of the Eastern Cape and
shares a border with the Free State, the Northern Cape and the Kingdom of Lesotho.
The surrounding district municipalities are Chris Hani, O.R. Tambo and Alfred Nzo. It has
four local municipalities, namely, Elindini, Gariep, Maletswai and Senqu Municipality.
Ukhahlamba has a land area of 26 518 square kilometers, 70 percent of which is rural and
30 percent urban.
The total population of the Ukhahlamba region consisted of 349 783 people in 2008, and
increased to 352 319 in 2009. Of these, 94.2 percent were black African, 3.5 percent
Coloured, 0.1 percent Asian and 2.3 percent White. About 55 percent of the 2009
population was female and 45 percent was male.
The total Gross Value Added for the Ukhahlamba region was R5.7 billion in 2008, a growth
rate of 11 percent from 2007. Out of the seven districts in the Eastern Cape, Ukhahlamba
is ranked sixth in terms of its contribution to the economy of the province. Alfred Nzo,
in seventh place, was the smallest economy in the province in 2008. The sectors that
contributed the most to GVA were from the tertiary sector, with a contribution of about 82
percent. They were general government services with 23 percent, finance and insurance
with 20 percent, wholesale and retail trade with 18 percent, transport and communication
with 11 percent and community services also with 11 percent.
4.7.1 TOTAL POPULATION By AgE gROUP
About 42 percent of the population falls within the age group 15 to 44, a 2 percent increase
from the figure recorded in 1995. Despite contributing 39 percent to the population, the
age group 0 to 14 has experienced a decline of 3 percent since 1995. The age groups 15
to 44, and 45 and above, recorded the highest growth rates between 2006 and 2009.
Table 4.7.1: Population by Age Group in Ukhahlamba, 1995-2009
4.7.2 TOTAL POPULATION AffECTED By HIV
The African population was most affected by HIV, accounting for about 99 percent of
affected population in 2007. However, this translated into only 10 percent of the African
population being affected by the virus. The most-affected age group was the 15-to-44,
with a contribution of 79 percent, up from 87 percent in 2000, despite a drop of about 18
percent between 2005 and 2007.
POPULATION BY AGE GROUP
1995 (Number) 1995 - 2000 (%) 2001 - 2005 (%) 2006 (Number) 2009 (Number) 2006 - 2009 (%)
Total 319,215 6.1 1.7 347,202 352,314 1.5
0 - 14 133,182 1.2 1.6 136,611 137,798 0.9
15 - 44 127,811 8.5 2.1 143,447 146,215 1.9
45 - 65+ 58,222 11.9 1.1 67,144 68,301 1.7
Source: ECSECC and Own Calculations

112
UKH
AH
LAM
BA D
ISTR
ICT
MU
NIC
IPALIT
Y
Table 4.7.2: People affected by HIV in Ukhahlamba, 2000-2007
NUMBER OF PEOPLE AFFECTED BY HIV (THOUSAND)
2000 2005 2007
Total population affected by HIV 19.9 31.2 33.3
Black African 20.0 31.0 33.0
Coloured 0.2 0.5 33.0
Indian or Asian 0.0 0.0 0.6
White 0.0 0.0 0.0
Age Group (0 - 4) 0.8 1.4 1.4
Age Group (15 - 44) 17.4 30.3 26.3
Total population 338.6 346.7 347.3
Source: ECSECC and Own Calculations
4.7.3 HOUSEHOLD INCOME AND ExPENDITURE
Current income and disposable income have been growing since 1995 and 2000, reaching
the highest growth rate in the period 2001 and 2005. These increases in income were
accompanied by growth in final consumption which recorded the highest growth rate
between 2001 and 2005. With this came a huge slump in the rate of savings, from 74
percent in 1995 and 2000 to about minus 70 percent in 2006 and 2009. Consumption of
semi-durable goods recorded the highest growth rate between 2006 and 2009, followed
by durable goods, services and non-durable goods. However, expenditure on nondurable
goods had the highest weighting with 36 percent, followed by services with 33 percent,
semidurable goods with 19 percent and durable goods with 12 percent.
Table 4.7.3: Household Income and Expenditure in Ukhahlamba, 1995-2009
HOUSEHOLD INCOME AND EXPENDITURE
1995 1995 - 2001 - 2006 2009 2006 - (Number) 2000 (%) 2005 (%) (Number) (Number) 2009 (%)
Final consumption expenditure by households 1,538,306 18.3 26.9 2,604,775 3,076,113 18.1
Durable goods 152,523 8.9 52.5 305,933 363,458 18.8
Semi-durable goods 161,042 32.5 66.3 445,502 596,067 33.8
Non-durable goods 727,089 6.8 18.2 984,969 1,112,007 12.9
Services 497,651 33.6 17.7 868,370 1,004,580 15.7
Current income 1,770,578 19.3 24.6 2,925,640 3,423,897 17.0
Disposable income 1,560,040 19.1 25.6 2,616,075 3,079,517 17.7
Saving by households 21,734 73.8 -37.7 11,300 3,404 -69.9
Source: ECSECC and Own Calculations
4.7.4 SECTORAL CONTRIBUTION ANALySIS
In the Ukhahlamba district, the primary and secondary sectors have lagged the tertiary
sector. It occupied an average 80.5 percent of the total production of the district, followed
by the secondary sector with 10.6 percent and the primary sector with 8.9 percent. While
the tertiary sector is the largest contributor in the district, it only represents an average 4
percent of the tertiary sector at the provincial level. Also, the primary sector’s contribution

113
to district output declined from 13.7 percent in
1995 to 2.5 percent in 2008, making the area more vulnerable to any external shock.
Figure 4.7: GVA Contribution for Ukhahlamba, 1995-2008
Ukhahlamba - gVA Contribution
4.7.5 SECTORAL gROWTH ANALySIS
Ukhahlamba District Municipality is the only district that experienced negative growth in
the primary sector, from 0.5 percent between 1995 and 2000 to minus 4 percent between
2001 and 2008. The industry that drives growth in this sector is agriculture, forestry and
fishing, as it holds the largest share of output in this sector. Growth in this industry dropped
to almost minus 5 percent during 2001 and 2008.
The secondary sector grew from less than 8 percent between 1995 and 2000 to over
20 percent between 2001 and 2008. Manufacturing; construction; and electricity, gas
and water all achieved growth in excess of 20 percent from 2001 to 2008. Provincially,
growth in manufacturing has remained constant, with construction growing aggressively.
However, electricity, gas and water contracted to minus 0.5 percent.
The tertiary sector in the district has grown aggressively, from almost 7 percent between
1995 and 2000 to 14 percent between 2001 and 2008. The industries that contributed
to growth were general government services; wholesale, retail and trade, catering and
accommodation and community, social and personal services, which all had positive
growth. Provincially, wholesale, retail and trade, catering and accommodation experienced
a decline in growth.

114
Table 4.7.4: Sectoral Growth for Ukhahlamba, 1995-2008
UKH
AH
LAM
BA D
ISTR
ICT
MU
NIC
IPALIT
Y
UKHAHLAMBA: AVERAGE GROWTH (%)
1995 - 2000 2001 - 2005 2001 - 2008
EC -0.2% 3.1% 1.7%
PRIMARY SEC. Ukhahlamba 0.5% -1.2% -4.0%
EC -0.2% 3.1% 1.8%
AFF Ukhahlamba 0.6% -1.6% -4.6%
EC 2.6% 2.8% 3.2%
SECONDARY SEC. Ukhahlamba 7.9% 22.2% 21.5%
EC 2.6% 2.4% 2.6%
MAN Ukhahlamba 7.4% 22.0% 20.3%
EC 2.1% 11.1% 11.4%
CON Ukhahlamba 6.0% 25.0% 25.1%
EC 3.2% -1.9% -0.5%
EGW Ukhahlamba 14.1% 20.5% 22.5%
EC 2.5% 3.3% 3.6%
TERTIARY SEC. Ukhahlamba 6.8% 13.4% 14.0%
EC 1.3% 1.0% 3.0%
GGS Ukhahlamba 4.3% 7.0% 8.1%
EC 3.6% 2.9% 3.5%
CSPS Ukhahlamba 10.8% 13.7% 14.0%
EC 3.7% 2.2% 2.7%
WRTCA Ukhahlamba 6.3% 8.8% 9.6%
Source: Own Calculation and Quantec Research
4.7.6 ACCESS TO SERVICES
4.7.6.1 Access to Water
In 2009, around 40 percent of households still had access to water through dams,
boreholes and other modes. Almost 60 percent of households had access to piped water,
an increase of 3 percentage points when compared to the period 1995 to 2005.
Table 4.7.5: Access to Water in Ukhahlamba, 1995-2009
ACCESS TO WATER (%)
Average 1995 - 2005 2006 2007 2008 2009
Piped water inside dwelling 9.6 8.8 8.7 8.6 8.5
Piped water inside yard 15.4 18.4 18.7 19.1 19.5
Piped water on community stand:distance less than 200m from dwelling 19.6 16.3 16.1 15.7 15.3
Piped water on community stand:distance greater than 200m from dwell. 10.4 13.8 13.8 14.3 14.8
Borehole/rain-water tank/well 6.9 5.3 5.2 5.0 4.7
Dam/river/stream/spring 35.4 34.4 34.4 34.0 34.0
Water carrier/tanker/water vendor 0.5 0.4 0.4 0.4 0.4
Other/unspecified/dummy 2.2 2.7 2.7 2.8 2.9
Source: ECSECC and Own Calculations

115
4.7.6.2 Access to Energy
Almost 60 percent of the population use candles and paraffin, with slightly more than 40
percent using electricity in 2009, an increase of about 4 percentage points compared to
the period between 1995 and 2005.
Table 4.7.6: Access to Energy in Ukhahlamba, 1995-2009
ACCESS TO ENERGY (%)
Average 1995 - 2005 2006 2007 2008 2009
Solar/other/unspecified 1.1 1.1 1.1 1.1 1.1
Electricity 36.8 40.2 40.1 40.6 41.0
Gas 0.4 0.3 0.3 0.3 0.3
Paraffin 23.4 20.9 20.9 20.6 20.3
Candles 38.3 37.5 37.6 37.5 37.3
Source: ECSECC and Own Calculations
4.7.6.3 Access to Sanitation
Households with access to flushed or chemical toilets increased from about 16 percent
to 19 percent during the period 1995 and 2005, and 2009. The percentage of households
using pit- and bucket latrines, and unspecified waste management mechanisms, is still
slightly above 80 percent.
Table 4.7.7: Access to Sanitation in Ukhahlamba, 1995-2009
ACCESS TO SANITATION (%)
Average 1995 - 2005 2006 2007 2008 2009
Flush or chemical toilet 15.5 18.1 18.4 9.7 19.0
Pit latrine 34.3 32.2 31.9 37.1 31.5
Bucket latrine 9.3 9.3 9.3 1.3 9.3
None of the above 40.6 40.3 51.6 40.2 40.1
Unspecified/dummy 0.3 0.1 0.1 0.1 0.1
Source: ECSECC and Own Calculations
4.7.6.4 Access to Telephones
The number of households with access to telephones increased from 66 percent in
1995 and 2005 to about 73 percent in 2009.
Table 4.7.8: Access to Telephones in Ukhahlamba, 1995-2008
ACCESS TO TELEPHONE (%)
Average 1995 - 2005 2006 2007 2008 2009
In this dwelling and/or cellular phone 14.0 16.8 16.8 17.2 17.6
At a public telephone nearby 29.1 31.3 31.4 31.7 32.0
At a neigbour nearby 7.7 8.6 8.5 8.6 8.7
At another location, not nearby 9.7 8.9 8.9 8.8 8.7
At another location nearby 5.5 5.8 5.8 5.8 5.9
NA (institution)/unspecified/none 34.1 28.7 28.7 27.9 27.2
Source: ECSECC and Own Calculations
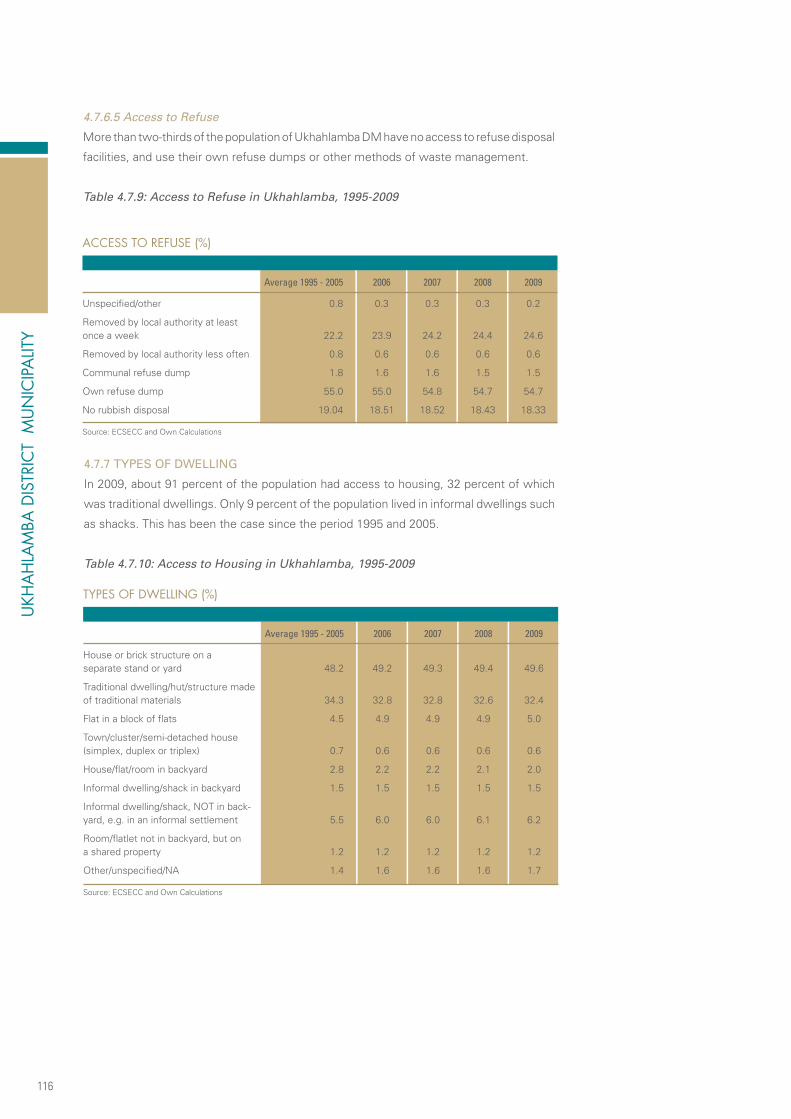
116
UKH
AH
LAM
BA D
ISTR
ICT
MU
NIC
IPALIT
Y
4.7.6.5 Access to Refuse
More than two-thirds of the population of Ukhahlamba DM have no access to refuse disposal
facilities, and use their own refuse dumps or other methods of waste management.
Table 4.7.9: Access to Refuse in Ukhahlamba, 1995-2009
ACCESS TO REFUSE (%)
Average 1995 - 2005 2006 2007 2008 2009
Unspecified/other 0.8 0.3 0.3 0.3 0.2
Removed by local authority at least once a week 22.2 23.9 24.2 24.4 24.6
Removed by local authority less often 0.8 0.6 0.6 0.6 0.6
Communal refuse dump 1.8 1.6 1.6 1.5 1.5
Own refuse dump 55.0 55.0 54.8 54.7 54.7
No rubbish disposal 19.04 18.51 18.52 18.43 18.33
Source: ECSECC and Own Calculations
4.7.7 TyPES Of DWELLINg
In 2009, about 91 percent of the population had access to housing, 32 percent of which
was traditional dwellings. Only 9 percent of the population lived in informal dwellings such
as shacks. This has been the case since the period 1995 and 2005.
Table 4.7.10: Access to Housing in Ukhahlamba, 1995-2009
TYPES OF DWELLING (%)
Average 1995 - 2005 2006 2007 2008 2009
House or brick structure on a separate stand or yard 48.2 49.2 49.3 49.4 49.6
Traditional dwelling/hut/structure madeof traditional materials 34.3 32.8 32.8 32.6 32.4
Flat in a block of flats 4.5 4.9 4.9 4.9 5.0
Town/cluster/semi-detached house(simplex, duplex or triplex) 0.7 0.6 0.6 0.6 0.6
House/flat/room in backyard 2.8 2.2 2.2 2.1 2.0
Informal dwelling/shack in backyard 1.5 1.5 1.5 1.5 1.5
Informal dwelling/shack, NOT in back-yard, e.g. in an informal settlement 5.5 6.0 6.0 6.1 6.2
Room/flatlet not in backyard, but ona shared property 1.2 1.2 1.2 1.2 1.2
Other/unspecified/NA 1.4 1.6 1.6 1.6 1.7
Source: ECSECC and Own Calculations

117
4.7.8 fORMAL EMPLOyMENT By SECTOR
The tertiary sector provides 79 percent of employment, followed by the secondary sector
with 9 percent and the primary sector with 11 percent. Community services provided
about 38 percent of employment, while wholesale and finance recorded the highest
growth rates in 2008. The primary sector had the highest rate of job losses between 2006
and 2009. The tertiary sector grew from 68 percent in 1995 to 79 percent in 2008, with
the primary sector dropping from 20 percent in 1995 to 12 percent in 2008. The secondary
sector dropped by 3 percentage points, from 12 percent in 1995 to 9 percent in 2008.
Table 4.7.11: Formal employment by sector in Ukhahlamba, 1995-2008
NUMBER OF PEOPLE EMPLOYED BY SECTOR
1995 1995 - 2001 - 2006 2008 2006 - (Number) 2000 (%) 2005 (%) (Number) (Number) 2008 (%)
AFF 7,351 -15.9 -13.8 5,390 4,953 -8.1
MQ 555 -48.8 -7.2 255 256 0.5
MAN 2,444 -10.2 -1.2 2,186 2,144 -1.9
EGW 147 -8.8 -3.1 132 132 -0.3
CON 2,082 -21.6 7.4 1,870 1,896 1.4
WRTCA 2,663 30.7 23.7 4,717 5,132 8.8
TSC 9.1 -28.4 2.1 654 649 -0.8
FIBS 1,272 41.8 20.7 2,493 2,710 8.7
CSPS 11,230 5.4 7.8 13,069 13,586 4.0
OGSS 4,635 14.4 4.2 5,614 5,825 3.8
GSS 6,595 -0.9 10.9 7,455 7,761 4.1
Source: Quantec Research and Own Calculations
4.7.9 INfORMAL AND fORMAL EMPLOyMENT By SkILL
There has been growth in both formal and informal employment between 2006 and 2008.
Despite this growth, informal employment has been shedding jobs and only accounts for
21 percent of employment, down from 25 percent in 1995. This was accompanied by an
increase in the number of jobs in formal employment by skill. In 1995 the contribution was
75 percent, and increased by 4 percentage points in 2008. The contribution of the highly
skilled, semi-skilled and unskilled sectors declined since 1995.
Table 4.7.12: Informal and Formal Employment by Skill in Ukhahlamba, 1995-2008
NUMBER OF PEOPLE EMPLOYED BY SKILL
1995 1995 - 2001 - 2006 2008 2006 - (Number) 2000 (%) 2005 (%) (Number) (Number) 2008 (%)
Formal and informal
employment 38,200 -0.9 1.6 39,825 39,968 0.4
Informal employment 9,552 1.2 -8.1 9,058 8,505 -6.1
Formal employment 28,648 -1.6 4.9 30,767 31,463 2.3
High skilled 3,606 -6.9 4.5 3,546 3,571 0.7
Skilled 10,118 4.7 10.7 12,432 12,973 4.4
Semi- and unskilled 14,924 -4.5 0.7 14,789 14,920 0.9
Source: Quantec Research and Own Calculations

118
Table 4.7.13: Dependency Ratio in Ukhahlamba, 1995-2009
UKH
AH
LAM
BA D
ISTR
ICT
MU
NIC
IPALIT
Y
DEPENDENCY RATIO
1995 (%) 2000 (%) 2005 (%) 2009 (%)
93.4 89.2 86.5 85.7
Source: ECSECC and Own Calculations
4.7.11 LEVEL Of EDUCATION
The number of people with no schooling has been decreasing over the years, resulting in
an increase of people receiving matric, and obtaining diplomas and degrees. The growth
rate of people who received Honours and higher degrees was almost 10 percent between
2006 and 2009. Overall, the literacy rate has increased in the district.
Table 4.7.14: Level of Education in Ukhahlamba, 1995-2009
LEVEL OF EDUCATION
1995 1995 - 2001 - 2006 2009 2006 - (Number) 2000 (%) 2005 (%) (Number) (Number) 2009 (%)
Total 319,215 6.1 1.7 347,202 352,314 1.5
Grade 0 / No schooling 71,575 -5.8 0.6 66,103 65,572 -0.8
Grade 12 10,435 31.7 3.4 15,038 15,735 4.6
Less than matric and certificate / diploma 1,685 -30.5 -3.1 985 895 -9.1
Certificate with Grade 12 749 58.8 5.1 1,375 1,470 6.9
Diploma with Grade 12 3,428 23.6 3.7 4,592 4,789 4.3
Bachelor’s Degree 646 24.2 5.9 898 947 5.5
Bachelor’s Degree and Diploma 171 138.5 4.8 491 535 9.0
Honours Degree 67 150.8 4.8 203 222 9.3
Higher Degree (Master’s /
Doctorate) 65 97.1 5.0 151 164 8.3
Other (unspecified) 42,198 -7.8 1.2 38,225 37,967 -0.7
Source: ECSECC and Own Calculations
Table 4.7.15: Literacy level in Ukhahlamba, 1995-2009
LITERATE / ILLITERATE
1995 1995 - 2001 - 2006 2009 2006 - (Number) 2000 (%) 2005 (%) (Number) (Number) 2009 (%)
Illiterate 71,575 -5.8 0.6 66,103 65,572 -0.8
Literate 74,091 13.8 2.3 88,404 90,706 2.6
Source: ECSECC and Own Calculations
4.7.10 DEPENDENCy RATIO
The dependency ratio was about 86 percent in 2009, reflecting the huge percentage of
people who are dependent, and a very small labour force. The combination of this with
low income distribution results in high poverty levels, which is the case with Ukhahlamba
DM.

119
4.7.12 NUMBER Of PEOPLE IN POVERTy
The percentage of the population characterised as poor decreased to almost 63 percent
in 2009, after reaching 79 percent in 2005.
Table 4.7.16: People in Poverty in Ukhahlamba, 1995-2009
NUMBER OF PEOPLE IN POVERTY
1995 (%) 2000 (%) 2005 (%) 2009 (%)
63.8 76.4 79.0 62.8
Source: ECSECC and Own Calculations
4.7.13 DISTRIBUTION Of HOUSEHOLD By INCOME
Households earning not more than R3 500 decreased from slightly more than 87 percent
in 1995 to 67 percent in 2009. The number of households within the income bracket of
more than R3 500 and R30 000 increased from 12 percent in 1995 to about 31 percent in
2009. This saw a 2 percent increase in households earning more than R30 000, from 0.5
percent in 1995.
Table 4.7.17: Distribution of Households by Income in Ukhahlamba, 1995-2009
HOUSEHOLD DISTRIBUTION BY INCOME
1995 (%) 2000 (%) 2005 (%) 2009 (%)
< R500 per month 13.9 15.2 7.7 3.3
R500 - R1000 30.9 25.1 23.0 14.8
R1001 - R3500 42.6 46.0 49.5 48.9
R3501 - R6000 5.6 6.2 9.6 16.2
R6001 - R11000 3.8 3.6 4.7 8.1
R11001 - R16000 2.1 1.6 1.9 2.9
R16001 - R30000 0.8 1.3 2.3 3.3
R30001 - R50000 0.3 0.7 0.9 1.6
R50000+ 0.1 0.2 0.4 0.9
Source: ECSECC and Own Calculations
4.7.14 HUMAN DEVELOPMENT INDICATOR
The Human Development Indicator in the district has remained constant at around 0.4,
signaling that the standard of living has remained unchanged since 1995. The district still
remains underdeveloped, with low life expectancy, high illiteracy rates and low standards
of living.
Table 4.7.18: Human Development Indicator in Ukhahlamba, 1995-2009
HUMAN DEVELOPMENT INDICATOR
1995 (%) 2000 (%) 2005 (%) 2009 (%)
0.40 0.42 0.44 0.43
Source: ECSECC and Own Calculations

120
4.7.15 URBANISATION
Between 1995 and 2009 there was a 5 percentage point increase in the number of people
moving from rural areas to urban areas.
Table 4.7.19: Urbanisation in Ukhahlamba, 1995-2009
UKH
AH
LAM
BA D
ISTR
ICT
MU
NIC
IPALIT
Y
URBANIZATION (%)
1995 (%) 2000 (%) 2005 (%) 2009 (%)
People living in rural areas 75.8 71.1 70.9 70.6
People living in urban areas 24.2 29.0 29.1 29.4
Source: ECSECC and Own Calculations

121

122

123
5 STRATEGIC IMPLICATIONS
The data contained in this economic profile and outlook shows that the economy requires
drastic responses from both the private and the public sector. The impact of the 2008-
2009 economic crisis poses a threat of the reversal of the gains that have been made in
the past 10 years. The productive capacity that the economy has developed during this
period is under threat of being eroded; the projected long spells of unemployment have
serious implications for the skills base of the province.
The current trends in the economy require a well-resourced and capacitated developmental
state that responds to the challenges in practical terms. The public sector itself can go
a long way in intervening in the economy through refining the way it operates. Further
action is needed in facilitating:
Increased demand for local infrastructure inputs•
industrial development of labour absorbing and growth potential sectors •
Crowding in of private investment through more effective infrastructure•
Advancing a more inclusive economic growth, decent work and sustainable •
livelihoods
Rural development, food security and land reform•
Access to quality education•
Improved health care•
The fight against crime and corruption•
The fact is that we can’t afford not to act, our society needs strong action. If high
unemployment is allowed to persist, it will push millions more families into poverty, put
a drag on economic growth for years to come, and do serious damage to the province’s
long-term outlook. The collapse in global demand has caused businesses to scale back
activities and in some cases, shut down. A half-hearted economic programme of action
will only serve to extend the slowness of the recovery and will place the province behind
the curve of economic recovery.
124
Thus, balancing the imperative of closing socio-economic gaps and the need to mobilize
resources requires a strong development vision. The nature of economic interventions
within the province must derive from the socio-economic character of the province. This
report goes a long way in describing the character of our sectors.
The numbers show that this province is more than 60 percent rural and yet is driven by
the tertiary sector, which contributes more than 70 percent to the economy – a serious
anomaly. There is a dire need to reconfigure the structure of the provincial economy. The
starting point in this undertaking is to consider the natural comparative advantages of
the province, such as land endowment and favourable climatic conditions. In brief, the
province needs to reinvest in agriculture, forestry and fishing, and the following initiatives
need to be considered:
Investment in market-oriented agricultural infrastructure. This includes infrastructure •
that supports on-farm production (irrigation, energy, transportation, pre- and post-
harvest storage), ensures efficient trading and exchange (telecommunications,
covered markets), adds value to the domestic economy (agro-processing and
packaging facilities), and enables produce to move rapidly and efficiently from farmgate
to processing facilities, and on to wholesalers (transportation and bulk storage);
Building the economic case for developing road infrastructure to link elements in the •
agricultural value chain – suppliers, farmers, extension services, collection points,
wholesalers, agro-processors, and end-user markets. This would help to create new
corridors and to improve existing ones, and involve the development of strategies for
Public-Private Partnerships (PPPs) and farm-to-market roads;
Develop a framework for Public-Private Partnerships and water for irrigation; and•
Develop a framework for the participation of Public-Private Partnerships in wholesale •
markets and trading centres.
This is underpinned by a renewed commitment of government and donors to investment
in rural infrastructure, and an emerging bull market for global trade in cereals, horticulture,
meat and milk products – as well as experimentation with new forms of infrastructure
financing and contracting. There are real opportunities to broaden the role of the private
sector in infrastructure for agricultural development through PPP models.
Also, because of the absence of a mining sector in the Eastern Cape, this model would help
absorb unskilled labour and diversify the secondary and tertiary sectors in the province,
thus making households less susceptible to unemployment.

125
126
APPENDIX
FORECAST METHODOLOGYThe methodology adopted in this study to forecast the provincial macro-economy variable
is twofold. Given the scarcity of data availability at the provincial level, we have updated
our macro-econometric model and used the output at the national level to forecast the
Eastern Cape macro-variable. The first reason for such a methodology was based on the
fact that we found a strong correlation between the Eastern Cape macro-data and the
national one. The second motive is based on a strong, long-running relationship between
the Eastern Cape and national variables. From the two empirical evidences, and using
historical data, we derived and forecast the contribution of each variable to the national
macro-variable.
We then forecast the national macro-variable, using our in-house macro-econometric
model, and then estimated the province’s macro-variable from the forecast national
macro-variable. The estimations and forecasts of macro-data in this study are based
on a statistical technique called Seemingly Unrelated Regression (SUR). This statistical
technique allows for different error variances in each decade, and for the correlation of
these errors over time in a system of stochastic equations. Below is the outline of the
technique used to forecast the national macro-variables.
ESTIMATION TECHNIqUES
A seemingly unrelated regression (SUR) is a system comprising several stochastic
equations that are linked by the fact that their disturbances are correlated. There are
two main motivations for the use of SUR. The first is to gain efficiency in estimation
by combining information on different equations, while the second is to impose or test
restrictions that involve parameters in different equations. Below is a technical explanation
of the model.

127
Suppose that yit is a dependent variable, xit = (1, xit,1, xit,2, ..., xit,Ki−1)’ is a Ki-vector of
explanatory variables for observational unit i, and uit is an unobservable error term, where
the double index it denotes the tth observation of the ith equation in the system. Often t
denotes time and we will refer to this as the time dimension, but in some applications, t
could have other interpretations, for example as a location in space. A classical nonlinear
NSUR model is a system of nonlinear regression equations;
y1t = h1(βx1t) + u1t
...
yNt = hN(βxNt) + uNt
where i = 1, · · · ,N, and t = 1, ..., T. Denote L = K1+· · ·+KN.
Further simplification in notation can be accomplished by stacking the observations either
in the t dimension or for each i. For example, if we stack for each observation t, let Yt =
[y1t, ..., yNt]’, H(β,Xt) = [h1(β,x1t), …, hN(β,xNt)], Ut = [u1t, ...uNt]’ , and β = [β’1, ..., β’N]’.
Then, we write the NSUR model in a multivariate nonlinear regression form,
Yt = H(β,Xt) + Ut
In our case, we have estimated β using a Gaussian quasi-maximum likelihood estimator
(QMLE) assuming that Yt are Gaussian-conditioned on Xt for any measurable transformation
g of Xt.
DATA USED
The quarterly data used in the estimation of the model were obtained from Statistics South
Africa (StatsSA), the South African Reserve Bank and International Financial Statistics as
published by the WInternational Monetary Fund (IMF).

128

129