eBook(Cross Cultural.behaviour.in.Tourism)
362
-
Upload
djetelina18 -
Category
Documents
-
view
81 -
download
0
description
knjiga
Transcript of eBook(Cross Cultural.behaviour.in.Tourism)


Cross-Cultural Behaviour inTourism: Concepts and Analysis


Cross-CulturalBehaviour in Tourism:Concepts and Analysis
Yvette Reisinger PhD
and
Lindsay W Turner PhD
OXFORD AMSTERDAM BOSTON LONDON NEW YORK PARIS
SAN DIEGO SAN FRANCISCO SINGAPORE SYDNEY TOKYO

Butterworth-Heinemann
An imprint of Elsevier Science Limited
Linacre House, Jordan Hill, Oxford OX2 8DP
200 Wheeler Road, Burlington MA 01803
First published 2003
# Copyright 2003, Yvette Reisinger and Lindsay Turner. All rights reserved
The right of Yvette Reisinger and Lindsay Turner as the authors of this
work has been asserted in accordance with the Copyright, Designs and
Patents Act 1988
No part of this publication may be reproduced in any material form (including
photocopying or storing in any medium by electronic means and whether or not
transiently or incidentally to some other use of this publication) without the written
permission of the copyright holder except in accordance with the provisions of the
Copyright, Designs and Patents Act 1988 or under the terms of a licence issued by
the Copyright Licensing Agency Ltd, 90 Tottenham Court Road, London, England
W1T 4LP. Applications for the copyright holder’s written permission to reproduce
any part of this publication should be addressed to the publishers
British Library Cataloguing in Publication Data
A catalogue record for this book is available from the British Library
Library of Congress Cataloging in Publication Data
A catalog record for this book is available from the Library of Congress
ISBN 0 7506 56689
Typeset by Keyword Typesetting Services Ltd
Printed and bound in Great Britain
For information on all Butterworth-Heinemann publications visit our website at
www.bh.com

Contents
Foreword xi
Preface xiii
List of tables xvii
List of figures xix
Introduction xxi
The aim xxiii
The main users xxiii
Structure and content xxiv
Part 1 Concepts of Cross-Cultural Behaviour in Tourism 1
1 Culture 3
Introduction 4
Concept and definitions 4
Purpose of culture 12
Characteristics of culture 13
Subcultures 14
Cultural differences 16
Cultural dimensions 22
Inter-cultural interaction model 26
Importance of understanding the cross-cultural
differences in behaviour 28
Tourism cross-cultural studies 29
Culture and tourism marketing management 31
Summary 32
Discussion points and questions 32
Further reading 33
2 Social contact 34
Introduction 35

Concept and definitions 35
Contact hypothesis 39
Determinants of tourist–host contact 43
Types of intercultural tourist–host contact 52
Interaction difficulties in inter- and cross-cultural tourist–
host contact 54
Culture shock 56
Measurement of tourist–host contact 63
Importance of the cultural background analysis 68
Tourist–host contact studies 69
Summary 70
Discussion points and questions 71
Further reading 71
3 Values 73
Introduction 74
Concept and definitions 74
Values and culture 77
The relationship between values and other related concepts 78
Types of values and their classification 80
Measurement of values 81
Differences in cultural value patterns between Asian, US,
European, and Australian societies: empirical and non-
empirical evidence 86
Summary 130
Discussion points and questions 130
Further reading 131
4 Rules of social interaction 132
Introduction 133
Concept and definitions 134
Cross-cultural differences in rules of social interaction 141
Summary 145
Discussion points and questions 146
Further reading 146
5 Perception 147
Introduction 148
Concept and definitions 149
Relationship between culture, social interaction and
perception 152
Contents
vi

Measurement of perception 157
Tourists’ and hosts’ perceptions of each other – Asia,
Europe, US and Australia 158
Perception versus attitude, image and attribution 166
Stereotyping 169
Ethnocentrism 172
Summary 173
Discussion points and questions 173
Further reading 174
6 Satisfaction 175
Introduction 176
Concept and definitions 176
Satisfaction versus customer service quality 181
Measurement of satisfaction 192
Summary 196
Discussion points and questions 197
Further reading 197
Part 2 Methods for Cross-Cultural Analysis in Tourism 199
7 Principal Components and Factor Analysis for cross-cultural
analysis 201
Introduction 202
Principal Components Analysis 203
Tests of significance 204
Segmental correlation 205
Simple representation of correlation and component
extraction 207
Communality 215
Scores 215
Factor Analysis 217
The difference between Principal Components Analysis and
Factor Analysis 218
Factor rotation 221
Factor scores 227
Controlling the input matrix in both Principal Components
and Factor Analysis 228
Alternative input matrix modes for both Principal
Components and Factor Analysis 230
Contents
vii

Example: cultural analysis using Principal Components
Analysis 231
Example: component interpretation 239
Summary 240
Discussion points and questions 241
Further reading 241
8 Structural equation modelling for cross-cultural analysis 243
Introduction 244
What is structural equation modelling? 244
Objective of structural equation modelling 244
Applications of structural equation modelling 246
Application in tourism 247
Types of LISREL modelling 250
The stages involved in structural equation modelling 254
Stage 1 255
Stage 2 256
Stage 3 257
Stage 4 258
Stage 5 259
Stage 6 264
Stage 7 274
Stage 8 276
Summary 277
Discussion points and questions 278
Further reading 278
Part 3 Applications of Cultural Analysis in Tourism 279
9 Cultural analysis: marketing and management implications 281
Introduction 282
Brief conceptual summary 282
Cultural model of conceptual relationships 282
The attributes of the model 283
Importance of the Asian tourist market 284
Research objectives 285
Study methodology 287
Results of the Mann-Whitney U-test 288
Results of the Principal Components Analysis 288
Interpretation of the cultural dimensions 291
Contents
viii

Structural equation modelling analysis 304
Summary 317
Discussion points and questions 318
End notes 318
Further reading 318
Part 4 Conclusion 321
Additional web-based support material and references 324
References 325
Index 335
Contents
ix


Foreword
In recent years the interest in cultural tourism has boomed, emerging as a
large and growing segment of the tourism industry. Yet, in spite of its
global and local implications, the area has not been adequately explored
by tourism researchers, who first studied cultural tourism by measuring
visitors to cultural attractions such as museums, festivals, fairs, exhibi-
tions, plays, concerts, dance performances, etc. They reported on atten-
dance, expenditure, demographics, and the economic impact of these
events.
In today’s global environment, however, the impact of culture must be
examined in all its forms and dimensions because it has a significant
impact on tourism policy, planning, development, management, and
marketing. A country presents itself to visitors through many cultural
factors. These can be entertainment, food, drink, work, dress, architec-
ture, handicrafts, media, history, language, religion, education, tradition,
humor, art, music, dance, hospitality, and all the other characteristics of a
nation’s way of life.
The deeper effects of the many aspects of national cultures on tourism
need to be researched because for many countries tourism has become an
important means of promoting cultural relations, international co-opera-
tion, and economic sustainability. Tourism not only promotes knowledge
and understanding, but also builds a favourable image among interna-
tional travellers by providing an enjoyable and comfortable experience so
essential for repeat visitation. In short, tourism requires diverse cultures
to understand and appreciate each other.
Successful tourism requires more than having good transportation,
hotels, and resorts. It thrives on a spirit of hospitality – that particular
national flavour that shares traditional ways of life and projects a favour-
able image to tourists purchasing goods and services.

Today, as globalization continues, diverse cultures are being brought
together more and more. The Asian tourist markets are currently major
sources of international outbound tourism. These culturally diverse
visitors are the fastest growing market.
To date, few scholars have studied the culturally diverse visitor and the
role of national cultural characteristics. Cross-cultural awareness and
sensitivity to cultural differences seem to be missing in the tourism
literature. Consequently, Reisinger and Turner’s book Cross-cultural
Behaviour in Tourism makes a major contribution to understanding
cultural differences across nations and the impact of host and guest
behaviour. The book provides insight into the concepts, definitions,
and measures of cultural components that encourage tourism. It untan-
gles the complex role of cultural behaviour and illustrates statistical tools
available to analyse cross-cultural behaviour.
The book needs to find its way into the libraries and hands of govern-
ment tourism public policy officials, cultural tourism professionals, tour-
ism managers, tourism marketers, tourism scholars, and other interested
individuals. Reisinger and Turner’s work on this complicated and multi-
dimensional subject will be invaluable to those who follow.
Charles R. Goeldner
Professor Emeritus of Marketing and Tourism
Editor, Journal of Travel Research
Foreword
xii

Preface
There is a widespread and urgent need to improve the ability of those
working in the tourism industry to understand and appreciate cultural
differences and to translate that understanding into effective communica-
tion and interaction, and appropriate management and marketing stra-
tegies. There is also a need to enhance the ability of students and
academics to measure and analyse cultural differences in the tourism
context using a scientific research approach.
Some cultural differences that are reflected in food, music, artefacts
or social behaviour are visible and easily recognizable during a rela-
tively short visitation to a foreign country. Other cultural differences
such as kinship systems, social organizations and many day-to-day
practices are hidden deeply in culture and require total immersion in
culture, prolonged social contacts with locals and often adaptation.
However, not many prospective tourists seek total immersion in a dif-
ferent culture and have a desire to understand the culture of others, and
not many host societies seek to adapt to the needs of tourists
(Robinson, M. 1999, Cultural conflicts in tourism: inevitability and
inequality. In Robinson, M. and Boniface, P. (eds), Tourism and
Cultural Conflicts, London: CABI Publishing). In tourism many of
the deep cultural differences are not relevant and are not emphasized.
The differences that draw the attention of most tourists are the differ-
ences in surface culture. These are often packaged and presented to
tourists during their short stay without the need to learn and under-
stand a foreign culture (Robinson, 1999).
Cultural experiences can be either satisfying or rewarding, or they can
be unpleasant and generate stress and even conflict. The higher the
demand for international tourism, the more opportunities there are for
cross-cultural contact and the greater the potential for cultural conflict. A
lessening of this potential conflict is the key to tourist satisfaction and
repeat visitation. Consequently, there is a need to learn and understand
the impact of cultural differences on tourist behaviour.

This book represents a timely contribution to the understanding of
tourist behaviour in a cross-cultural context. An important feature of the
book is that it represents a theoretical synthesis of the literature findings
in the area of the impact of cultural differences on tourist behaviour
rather than a critical assessment of specific findings. Evidence shows
that cross-cultural differences do exist and can be observed, recorded,
measured and statistically tested. The availability of sophisticated analy-
tical techniques to measure cultural differences allows for comparability
of these differences and aids in substantive theory testing. Unfortunately,
appropriate methodological approaches have not been widely used or
understood in tourism, marketing and management studies. The aim of
this book is to overcome some of the methodological problems associated
with analysing cultural differences, provide an illustration of how such
research can be satisfactorily carried out and show how substantive the-
ory can be tested.
This book focuses on quantitative research methods, which involve the
collection and analysis of numerical rather than qualitative data. The aim
is to present how scientific research methods can be used to identify
cultural differences and similarities, confirm or reject prior hypotheses
about their existence, logically interpret empirical evidence, and then
make inferences and conclusions about the phenomena that may lead
to the establishment of general laws for solving decision-making prob-
lems. In this way findings can be generalizable and replicable. The use of
scientific methods in applied tourism research assures objectivity in gath-
ering facts and also allows for testing creative qualitative ideas.
This book is also written under the assumption that many readers don’t
use quantitative methods due to their statistical complexity and user non-
friendly manuals. It is anticipated that readers will appreciate receiving
detailed preparation in the more complex empirical methods of scientific
research, in a context of cultural differences analysis. To achieve this
purpose, exposure to the material is presented in a well-ordered, logically
structured and accessible way, without compromising complete coverage
of the major research areas and accuracy of the statistical methods.
This book has been prepared primarily as a research reference book
for tourism educators, students and practitioners looking for information
relevant to the particular problem they currently face. In addition to this
book, an account of Hypothesis Testing, together with a detailed
Glossary and a comprehensive reference list of relevant materials which
Preface
xiv

the reader might like to refer to can be found on the internet at:
www.bh.com/companions/0750656689.
Although there is extensive work on tourism conducted in the
German, French and Spanish languages, the literature presented in this
book is mostly based on work published in English-speaking countries.
We hope that readers will find it interesting and useful.
Preface
xv


List of tables
Page
1.1 The aspects significant for the understanding of cultural
differences (Scollon and Scollon, 1995) 17
1.2 The elements that generate cultural differences (Czinkota
and Ronkainen, 1992; Hofstede, 1991; Trompenaars, 1993) 17
2.1 Components that influence social interaction 36
2.2 Levels of cross-cultural interaction 56
2.3 Patterns of culture shock and adjustment 62
3.1 Comparison of cultural dimensions 89
3.2 Ranking of fifty-three countries on Hofstede’s (2001) four
value dimensions 108
3.3 Schneider and Barsoux’s (1997) cultural assumptions 120
7.1 Correlations, correlations squared and angles for the
component in Figure 7.3 211
7.2 Correlations, correlations squared and angles for the
second component in Figure 7.4 214
7.3 Example loadings matrix for ‘simple structure’ in Factor
Analysis 222
7.4 Six modes of data matrix for input into Principal
Components or Factor Analysis 231
7.5 Total variance explained and significance tests.
Expectations on arrival on the Gold Coast 233
7.6 Principal Components Analysis of expectations on arrival
for the Gold Coast 234
7.7 Total variance explained and significance tests.
Expectations on arrival at Hawaii 235
7.8 Principal Components Analysis of expectations on arrival
for Hawaii 236
7.9 Total variance explained and significance tests.
Satisfaction on departure from the Gold Coast 236

7.10 Principal Components Analysis of satisfaction on
departure for the Gold Coast 237
7.11 Total variance explained and significance tests.
Satisfaction on departure from Hawaii 237
7.12 Principal Components Analysis of satisfaction on
departure for Hawaii 238
8.1 Two-construct measurement model 255
8.2 LISREL notation for the measurement model 257
8.3 Correlation matrix for the hypothesized model 258
8.4 Initial estimates (TSLS) 263
8.5 LISREL estimates (Maximum Likelihood) 263
8.6 Initial results of the measurement model 266
8.7 Measurement error for indicators 266
8.8 Construct loadings (t-values in parentheses) 272
9.1 Results of the Principal Components Analysis in the
total Asian sample for the variables that differed between
Australian hosts and all Asian tourists (significant factor
loadings only) 290
9.2 LISREL fit estimates for all groups 307
List of tables
xviii

List of figures
Page
1.1 Relationships between dominant cultures and minor
subcultures 16
1.2 The intercultural interaction model 27
1.3 Cultural differences among cultures and subcultures
according to Samovar and Porter, 1991 29
2.1 The U-curve and W-curve of cultural change, adaptation
and adjustment over time 60
7.1 Geometric correlation between two variables x1 and x2 208
7.2 Two-dimensional presentation of correlation 209
7.3 Geometric relationship between six variables and one
principal component 211
7.4 Geometric relationship of Figure 7.3 with a second
principal component 214
7.5 The relationship between unique and common variance 218
7.6a Factors for rotation among four variables 221
7.6b Factors for rotation among four variables 221
7.7 Oblique factor rotation 225
7.8 Data body for the description of the six matrix modes
for data input into Principal Components and Factor
Analysis 230
8.1 Path diagram of a hypothetical model: submodel 1 251
8.2 A single regression model 252
8.3 Bivariate model 252
8.4 Recursive model 252
8.5 Non-recursive model 253
8.6 Full LISREL model 253
8.7 Stages involved in the application of structural equation
modelling 254
8.8 The Q-plot for the hypothetical model 274

9.1 Cultural model of conceptual relationships 283
9.2 Model for total Asia (significant paths only) 310
9.3 Model for Japan (significant paths only) 312
9.4 Model for South Korea (significant paths only) 313
9.5 Model for Mandarin-speaking group (significant paths
only) 314
9.6 Model for Thailand (significant paths only) 315
9.7 Model for Indonesia 316
List of figures
xx

Introduction
In recent years there has been a considerable interest in the cultural
aspects of tourism. Culture in its various forms and dimensions has a
significant impact on tourism planning and development, management
and marketing. Unfortunately, literature that examines the impact of
culture on tourism concentrates mostly on expressions of material
forms of culture such as the arts, music, architecture or crafts.
Researchers have neglected to analyse the deeper effects of national
cultures on tourism. The elements of national cultures such as values,
norms or rules have a significant impact on tourists’ behaviour, their
holiday expectations, experiences, satisfaction and, consequently, repeat
visitation.
The examination of cultural differences is especially important to the
tourism industry for several reasons. First, the tourism and travel indus-
try has experienced a growing internationalization in the past decade.
Considerable attention has been paid to the issue of cultural diversity
and its relevance to tourism. The days when tourism was considered as
simply confined to Westerners are gone. Contemporary tourism and
increasing mobility expose people to culturally different societies. It is
imperative for the industry representatives, who operate in the interna-
tional business environment, to understand the influence of national cul-
tures on their consumers, in order to compete successfully for market
share. Many people visit foreign destinations to experience different
ways of living, traditions and customs. Also, tourism is a service industry
where people from different nationalities meet. The quality of their inter-
action contributes to their holiday experiences and perceptions of the
visited destination.
Unfortunately, information on the nature of the cultural differences
between international tourists and local hosts is not readily available.
There is a need for tourism academic literature that analyses cultural

differences across nations and determines their impact on tourist beha-
viour. Such literature could help to identify similarities and differences
among tourists and local providers and decision-makers in different
countries. It could contribute to more adequate and effective marketing
and management strategies.
There also seems to be a failure by some researchers and tourism
practitioners to realize the importance of cultural differences for tourist
holiday experiences, satisfaction and, consequently, repeat visitation. It
is generally assumed that tourist holiday satisfaction is determined by
material and physical needs and derives from operational buying
motives such as the purchase of a product and the level of service
provision. In fact, the ability to attract and satisfy specific markets
often depends on psychological needs and is highly dependent upon
psychological buying motives such as cultural and psychological inter-
pretation of the product purchased.
A significant part of the international tourist holiday is contact
with local hosts – people who are associated with the tourism and
travel industry such as hoteliers, restaurateurs, shop assistants, cus-
toms officials, tour guides and many others who provide services to
tourists. These people greatly contribute to the perceptions tourists
develop of the visited destination. Thus, the cultural differences,
which influence the quality of the interpersonal interaction between
tourists and hosts, can significantly add to tourist holiday experiences
and satisfaction.
The large Asian tourist markets will be the future targets of the inter-
national tourism industry. As a result, the culturally diverse tourist is the
focus of this book. A fundamental theme of this book is that holiday
satisfaction and repeat visitation of the culturally different tourist are
determined by the quality of their interpersonal experiences with cultur-
ally different hosts.
Given all of the above, it was felt that the most effective and appro-
priate response to the current and future international tourism needs was
to prepare a research book, which would focus on cross-cultural differ-
ences in tourist behaviour, and which would draw upon evidence from
the broad past and current literature about the present and future inter-
cultural tourist.
Introduction
xxii

The aim
The major aims of this book are as follows.
1. To review the literature on the concepts related to cross-cultural
behaviour in tourism.
2. To identify and discuss the major differences between Eastern and
Western national cultures and their influence on tourist and host
social behaviour.
3. To show how cultural differences influence tourist holiday percep-
tions and satisfaction.
4. To present the fundamental quantitative methods of cross-cultural
analysis.
5. To provide an in-depth analysis of five Asian cultures (Indonesian,
Japanese, Korean, Chinese and Thai) in comparison with European,
US and Australian cultures.
The main users
This book provides a research reference and text for university aca-
demics, students, researchers and tourism practitioners involved in all
aspects of travel and tourism. It will be of use to academics and stu-
dents who require an overview of the available literature on tourism in
a cultural context, in a simple source combined with an associated
bibliography, that will allow them to pursue more in-depth work
when required.
This book can also be used as a textbook for tourism academic courses
and seminars. From a course perspective, it reinforces a number of
important concepts and provides the student with an integrated view of
interrelated socio-cultural tourism issues. This book is most relevant for
courses in tourist behaviour, cultural and social impacts of tourism, tour-
ism marketing, tourism analysis, tourism management, and cross-cultural
communication. The most suitable academic level is third year under-
graduate and Masters level courses in Tourism Management.
Tourism practitioners form another readership, and in particular,
tourism managers, who have a need to deal face-to-face, interact and
communicate with culturally different tourists. Detailed information
about the fundamental concepts of culture and an analysis of the most
Introduction
xxiii

outstanding cultural differences between Asia, Europe, Australia and the
US is given. This information is essential for improving managerial and
communication skills.
Structure and content
Given the diversity of the literature on social interaction and culture, it is
not surprising that a review of the literature identified several important
concepts to be analysed. These concepts are presented in separate chap-
ters of the book. Each chapter is designed to direct readers to other
related chapters.
Efforts have been made to include the newest approaches to the com-
plex aspects of the analysed concepts. However, because of the enduring
nature of the subject and the diversity of the literature, some findings
have been retained even though they may be regarded as dated.
Introduction
xxiv

Part 1
Concepts of Cross-CulturalBehaviour in Tourism
This part discusses the main general concepts in cross-cultural tourism
behaviour that were identified on the basis of a very extensive and broad
literature review. It has six chapters, as follows:
& Chapter 1, entitled Culture, has been designed to specify clearly what is
meant by the concept of culture and subculture. This chapter introduces
the notion of cultural differences and dimensions, and introduces the
intercultural interaction model. It presents the concepts of cultural dif-
ferences and, subsequently, discusses cultural differences between Asian,
European, US and Australian societies.& Chapter 2 explores the concept of social interaction. The specific
emphasis is on cultural factors and the impact of cultural differences
on tourist–host interaction. This chapter discusses interaction difficulties
in inter- and cross-cultural tourist–host interaction. It also introduces the
concept of culture shock and methods of measuring tourist–host contact.
The intent is to demonstrate and emphasize that tourist–host social inter-
action is a cultural phenomenon.& Chapter 3 provides insights into the nature of cultural values. The purpose
is to demonstrate the ways in which values differentiate cultures and the
role they play in cross-cultural interaction. Different types of values are
discussed and their classification presented. Various cultural dimensions
are presented as identified by various researchers. A measurement of
values is also evaluated. The major literature findings on the differences
in cultural value patterns between Asian, European, US and Australian
societies are illustrated as an example of the differences between various
cultures. Concepts related to cultural values such as behaviour, rules,

norms and attitudes are also briefly discussed and their interrelationships
shown.& Chapter 4 provides an explanation of the concept of rules of social inter-
action. The cross-cultural differences in rules of social interaction are
presented.& Chapter 5 examines the concept of perceptions, and their relationship to
the concept of culture and social interaction. Methods of perception
measurement are introduced and the literature on tourists’ and hosts’
perceptions for Asia, Europe, the US and Australia discussed, along
with cultural stereotyping and ethnocentrism.& Chapter 6 of the book focuses on satisfaction. This chapter deals with
various aspects of satisfaction in relation to tourist holiday experiences,
including satisfaction with interpersonal relations with hosts and the
service provided by hosts. Methods of satisfaction measurement are
presented.
Cross-Cultural Behaviour in Tourism
2

1Culture
Objectives
After completing this chapter the reader should
be able to:
& define culture, its purpose and characteristics
& identify elements of culture
& understand subculture
& identify major cultural differences and
cultural dimensions
& describe the intercultural model and the
influence of cultural differences on an
individual and social interaction
& understand the importance of cultural
differences in behaviour.

Introduction
What is the influence of culture on social interaction? The first step is
to determine what is meant by the concept of culture and how it can
be defined. Various definitions of culture will be discussed and a final
definition written for the purposes of general research use, and the
specific analysis of culture in this book. We will then look at the
relationships between culture and social interaction through the var-
ious dimensions modelled in current literature that define and explain
the differences between various cultures. It is the differences that
make the study of culture both interesting and rewarding so we
will look at the essential nature of these differences, with a close
focus upon the major cultural dichotomy – the difference between
the East and the West.
Concept and definitions
Culture is a complex multidimensional phenomenon that is difficult to
define, and the hundreds of different definitions presented in the lit-
erature reflect this. For example, Kroeber and Kluckhohn (1985)
documented that there are over 160 definitions of culture. Because
culture is broad in its scope, theorists have had difficulties in arriving
at one central definition of culture and have had different views about
what constitutes the meaning of culture. Several scientific fields such
as sociology, psychology, anthropology and intercultural communica-
tion have their own definitions of culture. These definitions range
from viewing culture as an all-inclusive phenomenon (‘it is every-
thing’), to those that take a narrow view of the concept. However,
despite the vast range of definitions of culture, it has been generally
agreed in the literature that culture is a ‘theory’ (Kluckhohn, 1944),
an ‘abstraction’ or a ‘name’ for a very large category of phenomena
(Moore and Lewis, 1952). It has also been accepted that defining
culture is difficult or even impossible (Edelstein et al., 1989).
‘Culture is like a black box which we know is there but not what
it contains’ (Hofstede, 1980, p. 13).
Let us present some definitions of culture. We choose to focus on those
features of culture that contribute most to culture’s influence on social
interaction and to emphasize culture’s multifaceted nature.
Cross-Cultural Behaviour in Tourism
4

Classic definition of culture
The classic definition of culture is:
that complex whole which includes knowledge, beliefs, art, morals, law,
customs, and any other capabilities and habits acquired by man as a
member of society (Tylor, 1924, p. 1).
This definition emphasizes the inclusive nature of the concept of culture
under which many variables are included in ‘a complex whole’.
Human origin of culture
Since Tylor (1924), many anthropologists have redefined the concept of
culture (Kroeber and Kluckhohn, 1952; Kroeber and Parsons, 1958;
Mair, 1972; Piddington, 1960; Schneider and Bonjean, 1973). All defini-
tions commonly point to the same feature of culture: its human origin
(Moore and Lewis, 1952). It was agreed that humans have created cul-
ture. Culture is broadly viewed as ‘the human-made part of the environ-
ment’ (Herskovits, 1948, p. 17; 1955), as holding human groups together
(Benedict, cited in Kluckhohn, 1944), and ‘the most complete human
groups’ (Hofstede, 1980, p. 26). Culture is also viewed as a way of life
of a particular group of people (Harris, 1968; Harris and Moran, 1979;
Kluckhohn, 1951a), a ‘design for living’ (Kluckhohn and Kelly, 1945),
‘standards for deciding what is . . . what can be . . . what one feels about it,
what to do about it, and . . . how to go about doing it’ (Goodenough,
1961, p. 522).
Behavioural anthropologists
The definitions of behavioural anthropologists indicate that culture is
about human behaviour (Schusky and Culbert, 1987). Culture manifests
itself in observable patterns of behaviour associated with particular
groups of people (Bagby, 1953; Barnlund and Araki, 1985; Lundberg
et al., 1968; Merrill, 1965; Spradley, 1972). Culture determines human
behaviour (Barnlund and Araki, 1985; Parsons and Shils, 1951;
Peterson, 1979; Potter, 1989), is ‘indispensable to any understanding
of human behavior’ (Nisbett, 1970, p. 223), it guides behaviour in
interaction (Parsons, 1951), indicates a pattern of social interaction
(Harris, 1983), and it ‘guides behavior and interprets others’ behavior’
(Kim and Gudykunst, 1988, p. 127). However, the behavioural anthro-
Culture
5

pologists’ definitions of culture have been criticized for not distinguish-
ing between patterns for behaviour and patterns of behaviour
(Goodenough, 1957, 1961).
Behaviouralists argued that cultural behaviour is learned, not inher-
ited. Culture is a collection of beliefs, habits and traditions, shared by a
group of people and learned by people who enter the society (Mead,
1951). It is possible to learn new cultural behaviour and unlearn old
behaviour. This means that it is possible to learn cultural traits and
integrate them when generating strategic marketing (Darlington in
Joynt and Warner, 1996).
Functionalists
On the other hand, the definitions of functionalists emphasize the role
of culture in understanding the reasons and rules for certain beha-
viour. Functionalists refer to culture as a set of rules for ‘fitting
human beings together into a social system’ (Radcliffe-Brown, 1957,
p. 102). These rules allow us to better understand and predict how
others will behave and why. Culture is seen as something that ‘gives
directions for the actors and how the actors should play their parts on
the stage’ (Schneider, 1972, p. 38). Some definitions restrict the concept
of culture to mental rules (Harris, 1983). Others stress that culture is
the socially acquired ways of feeling and thinking (Harris, 1988;
Nisbett, 1970; Radcliffe-Brown, 1957), and ways of doing (Sapir,
1921). Some functionalists see culture as the means through which
human needs are met (Malinowski, 1939), and values are commun-
icated (Dodd et al., 1990).
Behaviouralists and functionalists
The behaviouralists and functionalists agree that culture and behaviour
are inseparable because culture not only dictates how we behave, it also
helps to determine the conditions and circumstances under which the
various behaviours occur; it helps to interpret and predict behaviour.
In this way, interactional behaviour is largely dependent upon the culture
in which the interactants have been raised. Consequently, culture is the
foundation of interaction. So we can say that when cultures vary, inter-
action patterns also vary.
Cross-Cultural Behaviour in Tourism
6

Criticism of behaviouralists and functionalists
The behaviouralist and functionalist definitions of culture have been cri-
ticized for not explaining cultural behaviour sufficiently.
& Firstly, different observers may perceive and interpret the same beha-
viour differently.& Secondly, behaviour may change over time across individuals and
within individuals, and may depend on situations.& Thirdly, there may be discrepancies between what people say, what
they would do and what they actually do.& Fourthly, the interpretation of behaviour may be influenced by stereo-
types.
Cognitive anthropologists
The cognitive anthropologists refer to culture as cognitive knowledge,
classifications and categories, existing in the minds of people
(Goodenough, 1964; Merrill, 1965; Schmidt, 1939). Hofstede (1991, p.
5) described culture as ‘the collective programming of the mind, which
distinguishes the members of one group or category of people from
another’. This definition stresses the mental conditions that cultural
experiences impose. Keesing (1974) argued that culture is a ‘system of
knowledge, shaped by . . . the human brain’ (p. 89). He criticized
Schneider (1972) for comparing culture to rules indicating how the actors
should play on the stage. According to Keesing (1974) rules are created by
a culturally patterned mind. Hofstede (1980) argued that culture includes
systems of values; and values build blocks of culture. The cognitive
anthropologists have been criticized for limiting the concept of culture
to knowledge, and excluding people and their emotions from the concept,
whereas in fact, many other senses contribute to peoples’ experiences. For
instance, Cole and Scribner (1974) noted that peoples’ experiences are
shaped by culturally and socially defined meanings and emotions.
Symbolists
The symbolists refer to culture as a system of symbols and meanings
(Kim and Gudykunst, 1988; Radcliffe-Brown, 1957; Schneider, 1976)
that influence experiences. Symbols help to communicate and develop
attitudes toward life (Geertz, 1973) and allow for interaction in a socially
accepted manner that is understood by the group (Foster, 1962).
7
Culture

Although meanings cannot be observed, counted or measured (Geertz,
1973), they help to understand others’ behaviour. The symbolic definition
of culture has also been criticized. Levi-Strauss (1971) argued that
symbols do not create culture because they are created by a culturally
patterned human mind.
Culture as perceptions
Many definitions of culture indicate that culture is ‘the sum of
people’s perceptions of themselves and of the world . . .’ (Urriola,
1989, p. 66). The similarity in people’s perceptions indicates the exist-
ence of similar cultures and sharing and understanding of meanings
(Samovar et al., 1981).
Subjective culture
Triandis (1972) referred to a ‘subjective culture’ as a cultural character-
istic way of perceiving the environment. The main elements of subjective
culture are values, role perceptions, attitudes, stereotypes, beliefs, cat-
egorizations, evaluations, expectations, memories and opinions. The
similarity in perceived subjective culture means similarity in perceiving
all these elements. Members of a similar subjective culture have similar
values, conform to similar rules and norms, develop similar perceptions,
attitudes and stereotypes, use common language, or participate in similar
activities (Samovar et al., 1981; Triandis, 1972). Triandis (1972) emphas-
ized the importance of understanding how the elements of subjective
culture affect interpersonal interactions. He reported that the similarities
in subjective culture lead to frequent interaction among members of
similar cultural groups. Triandis (1972, p. 9) also noted ‘when the similar
behavior patterns obtained in one culture differ from the similar patterns
obtained in another, we infer the existence of some differences in sub-
jective culture’. According to Landis and Brislin (1983, p. 187), differ-
ences in subjective cultures ‘are more likely to occur . . . because of the
differences in norms, roles, attitudes, and values between the . . . cultures’
that infer that ‘individuals belong to different cultures’.
Culture as differences between people
Culture is about differences and cultural differences are obvious
(Wallerstein, 1990). Culture can be referred to as differences between
Cross-Cultural Behaviour in Tourism
8

groups of people who do things differently and perceive the world
differently (Potter, 1989). These differences indicate the existence of
different cultures. As Triandis (1972) noted, if there were no differences,
there would be no cultures. Hofstede (1980) gave evidence of the differ-
ences and similarities among cultures. In a similar way to Triandis
(1972), Landis and Brislin (1983) reported the importance of under-
standing how the cultural differences affect interpersonal interactions.
According to Landis and Brislin (1983), cultural differences can cause
differences in interactional behaviours and misunderstanding in their
interpretations, and thus may create conflict. In cross-cultural contact
they tend to reduce interaction among members of different cultures.
Therefore, the analysis of the interactional behaviour and its inter-
pretation is critical (Albert and Triandis, 1979) for the analysis of
cross-cultural contact.
Culture as information and communication
Culture has also been viewed as information (Kluckhohn and Kelly,
1945) and a communication system (Hall, 1959). Several anthropolo-
gists suggest a relationship between culture and language (Kluckhohn,
1944). Language, ‘the symbolic guide to culture’ (Sapir, 1964, p. 70)
‘transmits values, beliefs, perceptions, norms’ (Samovar et al., 1981, p.
141) and facilitates man’s perceptions of the world (Sapir, 1964).
Cultural differences create differences in verbal communication.
Differences in languages create different ways of expressing beliefs,
values and perceptions.
Other definitions of culture
Culture has also been compared to social interaction, rules about beha-
viour, perceptions, thoughts, language and non-verbal communication.
These aspects of culture affect social interactional behaviour both directly
and indirectly (Argyle, 1978).
Material and non-material culture
Two different forms of culture have been distinguished: material and
non-material. The material form of culture refers to the productive forces
and everything necessary to support human life; the non-material or
spiritual form refers to morality, tradition, and customs (Urriola,
Culture
9

1989). The non-material form includes cultural beliefs and values, atti-
tudes, and perceptions. Some writers referred only to material objects and
artifacts (White, 1959), while others excluded material objects from the
concept of culture (Goodenough, 1971).
Cultural perspectives
Culture has been viewed from two perspectives. One perspective views
culture as an ideological entity encompassing values, norms, customs and
traditions (Rokeach, 1973). The other perspective views culture as a
combination of ideological and material elements such as what and
how people eat, what they wear and what they use (Assael, 1992;
Mowen, 1993).
Tourism studies focus either on the ideological aspects of culture or
a combination of ideological and material aspects of culture. For
example, Pearce (1982b) analysed the social psychology of tourist beha-
viour. Reisinger and Turner (1997a,b; 1998a,b,c; 1999a,b) investigated
cultural aspects of Asian inbound tourism to Australia as well as its
perceptions of Australia’s attributes as a tourism destination (Reisinger
and Turner, 2000).
Tourist, host and tourism culture
Tourist culture is the culture that tourists bring on vacation. It is the
culture of their own or that of their country. Tourist culture explains
tourist behaviour. The host culture is the culture of the host country
with which tourists are in contact (Jafari, 1987). According to Jafari
(1987), the behaviour of all participants involved in the tourism process
creates a distinct ‘tourism culture’, which is distinct from that of their
routine and everyday culture. Tourists behave differently when they are
away from home because they are in a different state of mind and in the
‘play’ mode. Hosts behave differently because they offer the tourists
hospitality services. However, both groups retain a residue of their
own culture when in contact. Thus, the tourist culture should be ana-
lysed in relation to ‘residual culture’, which explains how tourists from
different cultures behave. Jafari (1987) also suggested that tourist, host
and residual cultures mix together and produce a special and distin-
guishing type of culture at each destination, which consists of the beha-
viour of tourists and hosts. Further, Pizam (1999) noted that tourists of
Cross-Cultural Behaviour in Tourism
10

various nationalities possess simultaneously both ‘touristic cultures’
(i.e., the culture of group of tourists, backpackers, etc.) and ‘national
cultures’. He asks the question: to what extent are ‘touristic cultures’
free of national cultures and reflected in the behaviour of all tourists
regardless of nationality?
Industry, professional, functional and corporate culture
Like nations, industries, organizations and occupational groups have
their own cultures. Industries such as tourism, banking, construction,
retailing or pharmaceutical have their own cultures because they share
different world-views on how to manage a business. For example, the
tourism industry culture is more customer-oriented than banking cul-
ture. Corporations have different cultures as well because they are
influenced by the different nature of the industry, business and pro-
duct (Schneider and Barsoux, 1997). Different functions in organiza-
tions – finance, production, marketing, and research and development
– are also characterized by distinct cultures: they have different task
requirements, time frames and customers. For example, researchers
and developers tend to take a more down-to-earth approach, adver-
tisers are more creative. In addition, distinct professions such as doc-
tors, lawyers or engineers also have their unique cultures because they
differ in their beliefs and values and have different dress codes and
codes of conduct.
The focus of this book is upon the national
culture rather than the cultures of businesses,
occupational groups or industries. Since the
majority of definitions of national culture refer
to culture in psychological terms such as values,
norms, rules, behaviour, perceptions, attitudes,
beliefs, symbols, knowledge, ideas, meanings
and thoughts (Argyle, 1978; Bennett and
Kassarjian, 1972; Camilleri, 1985; Ember and
Ember, 1985; Kim and Gudykunst, 1988;
Leighton, 1981; Mill and Morrison, 1985;
Moutinho, 1987; Peterson, 1979; Robinson and
Nemetz, 1988), these definitions have been used
in this book to analyse the national culture of
tourists and hosts. The definition presented here
Culture
11
Culture consists of patterns,explicit and implicit, of and
for behavior acquired andtransmitted by symbols,
constituting the distinctiveachievements of humangroups, including their
embodiments in artifacts; theessential core of culture
consists of traditional (i.e.,historically derived and
selected) ideas and especiallytheir attached values; culturesystems may, on the one hand,be considered as products of
action, and on the other asconditioning elements of
further action (Kroeber and
Kluckhohn, 1952, p. 181).

summarizes all the various interpretations of culture discussed above.
This definition refers to patterns of human behaviour and people’s values
that determine their actions.
The above definition has been widely used by researchers recently.
For example, Berthon’s (1993) saw culture as the result of human
actions and showed the link between the ‘mental programming’ and
the consequences of behaviour derived from this programming.
Herbig (1998) defined culture as ‘the sum of a way of life, including
expected behaviour, beliefs, values, language and living practices shared
by members of a society. It consists of both explicit and implicit rules
through which experience is interpreted’ (p. 11). Similarly, Pizam (1999)
referred to culture as ‘an umbrella word that encompasses a whole set
of implicitly, widely shared beliefs, traditions, values, and expectations
that characterizes a particular group of people’ (p. 393). Potter (1994)
reported that the extent to which people share meanings depends on
their awareness of their own held values and beliefs and their awareness
of others’ values and beliefs. Once they become aware of the differences
in these beliefs and values, they can adjust their behaviour to enhance
their abilities to work successfully with people from other cultures.
According to Herbig (1998), cultural beliefs, values and customs are
followed as long as they yield satisfaction. If a specific standard of
conduct does not fully satisfy the members of a society, it is modified
or replaced. Thus, culture continually evolves to meet the needs of
society.
Purpose of culture
The purpose of culture is to teach how to do things and how to think
in order to organize the world (Dodd, 1998). Its purpose is to ‘establish
modes of conduct, standards of performance, and ways of dealing with
interpersonal and environmental relations that will reduce uncertainty,
increase predictability, and thereby promote survival and growth
among the members of any society’ (Herbig, 1998, p. 11). Culture
indicates how to live. Culture guides people through life. According
to Herbig (1998), culture influences behaviour and determines which
behaviour is helpful and should be rewarded, and which is harmful
and should be discouraged. Culture reinforces values (Dodd, 1998). It
helps to decide what is appropriate and desired, and what is unac-
Cross-Cultural Behaviour in Tourism
12

ceptable. It tells what is correct, true, valuable and important (Kraft,
1978). Culture teaches significant rules, rituals, and procedures (Dodd,
1998). It dictates what clothes to wear, what kind of food to eat, what
to say, how to serve guests or what to do at a dinner party. Culture
dictates ideas and sets the rules that the majority of society obeys. ‘It
creates a hierarchy of codes for regulating human interactions which
offers order, direction and guidance’ (Herbig, 1998, p. 11). Culture
teaches relationships with others and aspects of forming and maintain-
ing relationships (Dodd, 1998). Culture makes the everyday life deci-
sions easier. Cultural rules and norms help to achieve harmony in
society. Without them society would be in disarray (Jandt, 1998).
Culture provides the means for satisfying physiological, personal and
social needs (Herbig, 1998).
Culture also makes it possible for human society to communicate
using verbal and nonverbal systems of expressive behaviour (Herbig,
1998); ‘culture explains how a group filters information’ (p. 12); a cul-
ture encourages a particular communication style; culture has the power
to shape perception, develop feelings, images, and stereotypes (Dodd,
1998).
Culture bonds people together (Dodd, 1998) and identifies the
uniqueness of the group of people. According to Leavitt and Bahrami
(1988), culture identifies the uniqueness of the social unit, its values and
beliefs. Members of the same culture share similar thoughts and experi-
ences. Shared cultural norms give the members of a society a sense of
their common identity (Herbig, 1998). Culture helps to define who they
are (Jandt, 1998). However, few humans are consciously aware of their
own culture. Only when one is exposed to foreign culture and becomes
uncomfortable in it does one become aware of their home culture and
the cultural differences between one’s own and a foreign culture.
Culture is ‘the instrument by which each new generation acquires the
capacity to bridge the distance that separates one life from another’
(Herbig, 1998, p. 11).
Characteristics of culture
According to Herbig (1998), the following provide a set of characteristics
for culture:
Culture
13

1. Functional: each culture has a function to perform; its purpose is to
provide guidelines for behaviour of a group of people
2. A social phenomenon: human beings create culture; culture results
from human interaction and is unique to human society
3. Prescriptive: culture prescribes rules of social behaviour
4. Learned: culture is not inherited and/or received by succession; it is
learned from other members of the society
5. Arbitrary: cultural practices and behaviours are subject to judgment.
Certain behaviours are acceptable in one culture and not acceptable
in other cultures
6. Value laden: culture provides values and tells people what is right and
wrong
7. Facilitates communication: culture facilitates verbal and nonverbal
communication
8. Adaptive/dynamic: culture is constantly changing to adjust to
new situations and environment; it changes as society changes and
develops
9. Long term: culture developed thousands of years ago; it was accu-
mulated by human beings in the course of time and is the sum of
acquired experience and knowledge
10. Satisfies needs: culture helps to satisfy the needs of the members of a
society by offering direction and guidance.
Subcultures
There is a distinction between dominant and variant cultures (Kluckhohn
and Strodtbeck, 1961), or public and private cultures (Goodenough,
1971). Each dominant culture consists of several subcultures.
Subcultures can be based on race, ethnicity, geographic region or eco-
nomic or social class.
Race refers to a genetic or biological similarity among people (Lustig
and Koester, 1993). For example, many western European countries
include people from the Caucasian race. Race also refers to a group of
people descended from the same ancestors. Race is sociohistorical in
nature. It recognizes the evolution of different racial categories over
time and the existence of different racial categories (e.g., white and
black) in different cultures (Jandt, 1998).
Cross-Cultural Behaviour in Tourism
14

Ethnicity refers to a wide variety of groups of people who share a
language, history and religion and identify themselves with a common
nation or cultural system (Lustig and Koester, 1993). Ethnic differences
can be identified by ‘colour, language, religion, or some other attribute of
common origin’ (Horowitz, 1985, p. 41). Since ethnic cultural traits are
passed on to children, ethnicity also refers to the shared descent or herit-
age of a group of people (Jandt, 1998). For example, Slovaks, Croatians
and Serbian represent three ethnic groups, each with their own culture,
who lived as one nation in former Yugoslavia.
Geographical region refers to geographic differences within countries
or similarities between countries. According to Schneider and Barsoux
(1997), regional subcultures evolve due to differences in geography, his-
tory, political and economic forces, language and religion.
Economic and social class recognizes differences in the socio-economic
standing of people. Regional differences evolve due to differences in
people’s income and wealth.
Each subculture community (e.g., racial, ethnic, economic, social or
regional) exhibits characteristic patterns of behaviour that distinguish it
from others within a parent culture. Each subculture provides its mem-
bers with a different set of values and expectations as a result of regional
differences. Therefore, the major dominant culture differs from minor
variant subcultures.
Subcultures can be represented by a small group, such as a few people,
or a large group such as a major religious order. People can be members
of many different groups at the same time. A person might identify with
being a white French-American, a Christian, and a member of the middle
class. Subcultures provide their members with norms and rules that tell
people how to behave, interact and think within these subcultures.
The attempt to distinguish a dominant or typical cultural pattern for
any culture is extremely difficult or even impossible because of the hetero-
geneity of many societies. The ethnic variety can be found in all countries;
for example, Australia and Canada have British, Germans, Italians,
Greeks, Turks, Serbs, Croats, Polish, and many other nationalities.
Some societies like the United States contain over 125 ethnic groups
and nearly 1200 different religions (Samovar et al., 1998). Thus, the
Culture
15

analysis of the whole country’s culture must be limited to the dominant
culture of this country.
Figure 1.1 presents a model of the relationships between two sub-
cultural groups. Each subculture has its own unique pattern of values,
expectations, and interactions yet both groups share dominant cultural
patterns. Moreover, dominant culture directs the form of public social
interaction, whereas the variant minor subcultures indicate the forms
of private social interaction. Therefore, interaction between people who
appear to be from the same dominant culture may not be easy,
because in reality they may be members of various subcultures and
their backgrounds may be so different that they may not be able to
relate appropriately.
The focus of this book is on the dominant culture of the tourists and
hosts and the public social interaction between their cultures. We con-
centrate on the various guidelines in dominant tourists’ and hosts’ cul-
tures that affect their social interaction. The minor subcultures and
private patterns of social interaction are not analysed here.
Cultural differences
Cultural differences manifest themselves in many ways. Scollon and
Scollon (1995) identified numerous aspects of culture that are significant
for the understanding of cultural differences (see Table 1.1).
Czinkota and Ronkainen (1993), Hofstede (1991) and Trompenaars
(1993) suggested a range of elements that generate cultural differences
(see Table 1.2).
Cross-Cultural Behaviour in Tourism
16
DOMINANTCULTURE
Subculture Subculture
Figure 1.1 Relationships between dominant cultures and minor subcultures

Culture
17
Table 1.1 The aspects significant for the understanding of cultural differences
(Scollon and Scollon, 1995)
Ideology
history and
worldview, which
includes:
Socialization Forms of
discourse
Face systems
social
organization,
which includes:
Beliefs
Values
Religion
Education
Enculturation
Acculturation
Functions of
language:
Information and
relationship
Negotiation and
ratification
Group harmony,
individual
welfare
Kinship
Primary and
secondary
socialization
Non-verbal
communication:
Kinesics: body
movement
Proxemics: the
use of space
Concept of time
The concept of
the self
Theories of the
person and of
learning
Ingroup-
outgroup
relationships
Gemeinschaft and
Gesselschaft
Table 1.2 The elements that generate cultural
differences (Czinkota and Ronkainen, 1993; Hofstede,
1991; Trompenaars, 1993)
Language Social institutions
Social strata or classes
Family structure
Customs
Economics Values Material items
Religion Attitudes Aesthetics
Politics Manners Education

Cultural differences in communication
The cultural differences are reflected in communication patterns such
as:
& different patterns of verbal communication (language and para-
language: intonation, laughing, crying, questioning), and& different patterns of non-verbal communication (body language such
as facial expressions, head movements, gestures, use of space, use of
physical distance between people) (Bochner, 1982).
Differences in verbal communication are related to the differences in the
features of language such as:
& phonology (differences in sound)& morphology (differences in meaning units)& semantics (differences in meanings of words)& syntactics (differences in the sequence of the words and their relation-
ships to one another)& pragmatics (differences in effects of language on perceptions) (Lustig
and Koester (1993).
Whorf (1956) hypothesized that there are differences in the manner by
which language influences and determines the ways in which people
think, due to:
& variations in vocabulary (different words are used to express the same
meaning)& variations in linguistic grammar (due to differences in time, social
hierarchy, and cultural characteristics)& linguistic relativity and intercultural communication (differences occur
due to ethnic, social class, generation, political reasons, different dia-
lect, accent and jargon).
Differences in non-verbal communication occur due to differences in:
& body movements (kinesics)* emblems (gestures)* illustrators (visual representation of the verbal message)* affect displays (facial and body movements)* regulators (synchronizers of conversation, e.g., head nods, eye
contact)* adaptors (body movements as a reaction to an individual’s physical
or psychological state)
Cross-Cultural Behaviour in Tourism
18

& space (proxemics)* use of personal space (intimate/personal/social/public)* territoriality
& touch* the meanings of touch* differences in touch (whom, where, when)
& time* time orientations (past/present/future)* time systems (technical, formal/informal)* time perceptions (long/short)* use of time (commitment/no commitment)
& voice* vocal communication (high/low, fast/slow, smooth/staccato, loud/
soft)& other non-verbal codes
* chemical code system (natural body odour, tears, sweat, smells)* dermal code system (blushing, blanching, flesh)* physical code system (facial features, skin and hair colour, body
shape)* artifactual code system (clothing, buildings, furnishing, jewellery,
lighting, cosmetics) (Lustig and Koester, 1993).
Cultural differences also occur in:
& persuasion (presentational/analogical)& argumentation (evidence, warrants, claims, making conclusions)& structure of conversation (topics discussed, the ways topics are
presented, value of talk and silence, rules of conversations) (Lustig
and Koester, 1993).
Cultural differences in social categories
Cross-cultural differences may be noticed in social categories such as role,
status, class, hierarchy, attitudes towards human nature, activity, time,
and relationships between individuals (Kim and Gudykunst, 1988).
Cultural differences can also be found in standing, looking, touching,
perceiving sense of shame, feelings of obligations, responsibility, saving
face, avoidance of embarrassment, confrontation, taking initiatives,
responses, and external appearance (Argyle, 1967, 1978; Damen, 1987;
Dodd, 1987; Gudykunst and Kim, 1984; Hall, 1955, 1959, 1976, 1983;
Taylor, 1974; Thiederman, 1989).
Culture
19

Cultural differences in rules of social behaviour
Cultural differences occur in rules of social behaviour (Argyle, 1967;
Triandis, 1972), particularly in:
& ways of defining interpersonal relations and attributing importance to
social interactions (Wagatsuma and Rosett, 1986)& techniques of establishing and preserving relations (Argyle, 1967)& interaction patterns such as greetings, self-presentations (Argyle, 1967)& beginning a conversation, degree of expressiveness, showing emotions,
frankness, intensity (Jensen, 1970)& persistency and intimacy, as well as volume of interaction (Jensen,
1970)& expressing dissatisfaction and criticism (Nomura and Barnlund, 1983)& describing reasons and opinions (Argyle, 1978)& exaggerations (Argyle, 1978)& moral rules about telling the truth (Argyle, 1978)& joking, asking personal questions, complimenting and complaining,
expressing dislike, showing warmth, addressing people, apologizing,
farewelling, expressing negative opinions and gift giving.
Cultural differences in service
There are also differences in understanding the concept of service. Wei
et al. (1989) emphasized the influence of cultural differences on the
interaction processes between a service provider and a visitor.
‘Interacting with service personnel is a primary way in which visitors
form an impression and make judgments about their hosts’ (Wei et al.,
1989, p. 3). Poor quality service may create unpleasant encounters
between tourists and hosts, low morale, and unfriendly attitudes (Wei
et al., 1989). Sheldon and Fox (1988) identified many cultural differ-
ences in relation to interaction patterns between guests and service
providers. These differences may lead to different perceptions of what
constitutes proper guests’ treatment, and can shape different attitudes
of hosts towards the tourists they serve (Richter, 1983). What is
important for guests from the US may not be of the same level of
importance for Japanese or Chinese customers. For instance, the
Chinese host ignores the expectations of their guests. By escorting
their guests everywhere, providing them with a very tight itinerary,
and not leaving an opportunity to experience the Chinese life style
privately, the Chinese hosts believe they provide their guests with a
Cross-Cultural Behaviour in Tourism
20

courtesy. However, American tourists may view such hospitality as an
intrusion and lack of trust. Japanese hosts, on the other hand, take
care of the affairs of their guests in advance and anticipate the guests’
needs and even fulfil beyond needs (Befu, 1971), believing the host
knows best what the guests’ needs are. Such an attitude may also be
frustrating for American tourists who think they know best what their
needs are. American tourists may regard Japanese hospitality as
uncomfortable. On the other hand, the American tradition of not
anticipating the guests’ needs in advance may negatively affect the
Japanese tourists’ satisfaction with the hospitality of the American
host. As Wei et al. (1989, p. 3) noted, ‘the cultural differences in
expectations regarding service levels between hosts and visitors left
many with negative impressions’.
The cultural differences listed above may be produced by regional,
ethnic, religious, gender, generation and social classes differences.
However, these are not discussed in this book.
Cultural problems
Cultural differences can cause problems in social interaction between
participants of different cultural backgrounds. For instance, different
patterns of verbal and non-verbal communications may create serious
errors and lead to misinterpretation, misunderstanding and confusion
(Argyle, 1967) and affect the perceptions of others (Jensen, 1970;
Samovar et al., 1981; Wolfgang, 1979). If the contact participants do
not conform to each other’s cultural patterns of interaction and expected
standards, and assume that they are culturally the same or similar, they
may reject each other (Argyle, 1967).
Cultural differences have particular influences on tourist–host social
interaction when the tourists have a distinctly different cultural back-
ground from hosts. According to Pizam and Telisman-Kosuta (1989),
in the destinations where the majority of tourists were foreigners, the
residents perceived the tourists to be different from themselves in a vari-
ety of behavioural characteristics, such as attitudes or morality. However,
in the destinations where the majority were domestic tourists, the differ-
ences between the tourists and the residents were perceived as only mini-
mal (Pizam and Telisman-Kosuta, 1989). As such, these differences have
marketing implications for the tourism and hospitality sector.
Culture
21

Cultural dimensions
The examination of cultural differences indicates that there are a very
large number of elements that differ between cultural groups. The ques-
tion is whether these differences can completely and adequately distin-
guish between all cultures. How many of the cultural elements need to be
different in order to determine cultural differences? Also, the cultural
elements vary in their degree of importance and impact on social beha-
viour. Which cultural elements have the most significant effect on social
behaviour and to what degree should they be different in order to indicate
cultural differences between people? Which elements should be used to
successfully compare cultures?
There are many dimensions on which cultures differ (Parsons and
Shils, 1951; Cattell, 1953; Hall, 1965; Mead, 1967; Inkeles and
Levinson, 1969; Ackoff and Emery, 1972; Douglas, 1973, 1978). It
seems that the most frequently used are the Parsons’ (1951) pattern vari-
ables, Kluckhohn and Strodtbeck’s (1961) value orientations, Stewart’s
(1971) cultural patterns, Hall’s (1960, 1966, 1973, 1976/1977, 1983), Hall
and Hall’s (1987) cultural differentiation, Hofstede’s (1980, 1984, 1991,
2001) dimensions of cultural variability, Trompenaars’ (1984, 1993/1997),
Hampden-Turner and Trompenaars’ (1993) and Maznevski’s (1994)
cultural dimensions. These dimensions provide ways to understand
how people’s behaviour and communication differ across cultures and
how they deal with social life and human relationships. They affect social
interaction, the difficulties individuals have in relating to others and
individual perceptions (Gudykunst et al., 1988b). They can also indicate
how the major cultural differences influence the cross-cultural interaction
between international tourists and local hosts. Therefore, these cultural
dimensions are presented below.
Parsons’ (1951) pattern of variables
Parsons differentiated cultures according to the choices an individual
makes prior to engaging in action:
& Affectivity-Affective Neutrality: the degree to which people seek grat-
ification (immediate/self-restraint)& Universalism-Particularism: modes of categorizing people or objects
(general/specific)
Cross-Cultural Behaviour in Tourism
22

& Diffuseness-Specificity: types of responses to people or objects (hol-
istic/particular)& Ascription-Achievement: ways of treating people or objects in terms of
qualities ascribed to them (inherent/group qualities)& Instrumental-Expressive: nature of the goals people seek in interactions
with others (means to another goal/an end goal)& Structural Tightness: the degree to which the norms, rules and con-
straints are placed on people’s behaviour (tight/loose).
Kluckhohn and Strodtbeck’s (1961) cultural dimensions
Kluckhohn and Strodtbeck (1961) differentiated cultures on the basis of
value orientations:
& Toward Humans: human beings may be perceived as good, a mixture
of good and evil, or evil; changeable, unchangeable& Toward Nature: humans may be subjected to nature, live in harmony
with nature or control nature& Toward Activity: cultures may be ‘being’, ‘being-in-becoming’ or
‘doing’& Toward Time: past, present and future& Toward Relationship among People: linear (hierarchical relationship),
collateral (group relationship), individual (the individual goals take
primacy over group goals)& Toward Space: public, private, mixed.
Stewart’s (1971) cultural patterns
The four major elements of Stewart’s cultural patterns are:
& Activity Orientation: how people view actions and how they express
themselves through activities (being/becoming/doing)& Social Relations Orientation: how people relate to one another (formal/
informal, direct/indirect, egalitarian/hierarchical)& Self-orientation: how people view themselves, what motivates their
actions, who is valued and respected (group/self-orientation, change-
able/not changeable)& World Orientation: how people locate themselves in relation to the
spiritual world and nature (subjugation to nature/living in harmony
with nature/controlling nature).
Culture
23

Hall’s (1960, 1966, 1973) and Hall and Hall’s (1987)cultural dimensions
According to Hall, cultures can be differentiated on the basis of orienta-
tion towards:
& Human Nature: agreements& Activity Orientation: monochronic/polychronic& Human Relationships: amount of space, possessions, friendship,
communication& Relation to Time: past/future& Space Orientation: public/private.
Hall’s (1976/1977, 1983) cultural dimensions
Hall also differentiated cultures in terms of:
& Context: the level of information included in a communication mes-
sage (low/high context)& Space: ways of communicating through handling of personal space
(personal/physical)& Time: different perceptions and orientations towards time (mono-
chronic cultures (MTC) versus polychronic cultures (PTC))& Information flow: the structure and speed of messages between indi-
viduals (covert/overt messages)& Language: high context cultures (HCC) versus low context cultures
(LCC).
Hofstede’s (1980, 1984, 1991) cultural dimensions
According to Hofstede, cultures can be compared and contrasted with
one another on five dimensions:
& Power Distance (PD): the way in which interpersonal relationships
develop in hierarchical society& Uncertainty Avoidance (UA): the degree to which people feel threat-
ened by ambiguous situations& Individualism-Collectivism (IC): the degree to which individual goals
and needs take primacy over group goals and needs& Masculinity-Femininity (MF): the degree to which people value work
and achievement versus quality of life and harmonious human
relations
Cross-Cultural Behaviour in Tourism
24

& Confucian Work Dynamism: the extent to which the Chinese values
apply in the country in which they reside (Long-term Time
Orientation).
Adler’s (1986) cultural dimensions
Adler distinguished cultures on the basis of:
& Human activity& Space& Time& Human nature& Relationships with nature& Human relationships.
Argyle’s (1986) cultural differentiation
Argyle differentiated cultures according to the degree of formality and an
acceptable level of physical contact between people:
& Formality: formal/informal cultures& Touch: contact/non-contact cultures.
Schein’s (1992) cultural dimensions
Schein distinguished cultures on the basis of the following dimensions:
& The Nature of Human Relationships: individualism/groupism, parti-
cipation and involvement, role relationships& The Nature of Human Activity: doing/being/being-in-becoming, work/
family/personal& The Nature of Human Nature: evil/good/mixed& The Nature of Relations with Environment: control/harmony/subjuga-
tion& The Nature of Time: past/present/near or far-future, monochronic/
polychronic, planning/development, discretionary time horizons
(function/occupation/rank), temporal symmetry/pacing& The Nature of Reality and Truth: external physical/social/individual
reality, high/low context, moralism/pragmatism& The Nature of Space: intimacy/personal/social/public, high/low status.
Culture
25

Trompenaars’ (1984, 1993) cultural dimensions
Trompenaars compared cultures on orientation towards:
& Human Nature: universalism/particularism& Relation to Nature: internal/external, inner/outer directed& Activity Orientation: achievement/ascription, analysing/integrating& Human Relationships: equality/hierarchy, individualism/collectivism
and communitarianism, affective/neutral& Relation to Time: sequential/synchronic, past/present/future.
Maznevski’s (1994) cultural dimensions
Maznevski differentiated cultures on the basis of orientations towards:
& Human Nature: good/evil, changeable& Relation to Nature: subjugation/mastery/ harmony& Activity Orientation: doing/being, containing and controlling (think-
ing)& Human Relationships: individual/collective, hierarchical.
The ways cultures differ on the above dimensions are discussed in
Chapter 3.
Intercultural interaction model
The intercultural interaction model, which is presented below, is based on
Porter and Samovar’s (1988) model of the differences between three cul-
tures and their members in an intercultural communication process. This
model assists in understanding some of the consequences of culturally
different people interacting together (see Figure 1.2).
Figure 1.2 illustrates the influence of culture on individuals. Three
distinct squares present three distinct cultures: Culture A, B and C.
Within each culture A, B, C there is an inner form, which represents
the individual who is ‘travelling’ between the three cultures and is
influenced by these cultures. The shape of the dominant culture and
the shape of the individual are different. Although culture is the dom-
inating shaping force on an individual there are also other influences
besides culture that affect the individual such as social, economic,
political or environmental.
Cross-Cultural Behaviour in Tourism
26

The differing shadings and shapes of the individual represent the influ-
ence of different cultures on an individual. When an individual from
Culture A leaves its culture and reaches Culture B, his or her behaviour
changes because of the influence of a culturally different society. The
individual’s values, behaviour and communication style differ from
those of Culture B. The degree to which culture influences an individual
from Culture A and an individual from Culture B is a function of the
dissimilarity of Cultures A and B.
In general, all interactions are viewed to a certain extent as ‘intercul-
tural’, and the degree of their ‘interculturalness’ depends upon the degree
of heterogeneity between cultural backgrounds of the individuals
involved in interactions; their patterns of beliefs, verbal and non-verbal
behaviour, perceptions, and attitudes. An underlying assumption is that
individuals who belong to the same culture share greater commonality
than individuals who belong to different cultures.
Culture
27
Culture A
Culture C
Culture B
Figure 1.2 The intercultural interaction model
There are variations in cultural differences during intercultural inter-
action. Intercultural interactions can occur in a wide variety of situations
that range from interactions between people who are members of differ-
ent dominant cultures with extreme cultural differences (e.g., interactions
between Western tourists and Asian hosts) to interactions between people
whose differences are reflected in the values and perceptions of subcul-
tures (e.g., interactions between American tourists and British hosts).
This supports Sutton’s (1967) theory of various degrees of differences
in cultural backgrounds of the contact participants. Samovar and
Porter (1991) presented these differences along a minimum-maximum
dimension and reported that the degree of difference between cultural
groups depends on the comparison of their cultural dissimilarity.
The maximum difference was found between Asian and Western cul-
tures (Samovar and Porter, 1991) (see Figure 1.3). The members of cul-
tural groups with minimal differences had more in common than
members of groups at the middle or maximum end of the scale. The
members of similar cultural groups spoke the same language, shared
the same religion, experiences and perceptions and saw their worlds as
similar. However, it was noted that although these groups were similar,
they were also culturally dissimilar to some extent and had divergent
beliefs, values and attitudes and, therefore, might also differ significantly.
Samovar and Porter’s (1991) scale allows us to examine cultural dif-
ferences between nations and gain insights into the influence of these
differences on social interactions in a cross-cultural context. Examples
of the cultural differences between nations and, in particular, between
Asia, Europe, the US and Australia are discussed in Chapters 3–6.
Importance of understanding the cross-cultural
differences in behaviour
Members of the American, European, Asian and Australian societies have
opposite cultural orientations and expectations due to social interaction.
The cultural differences between the members of these societies can have
a direct impact on their social interaction in the tourism environment.
Due to cultural differences Asian, European, US and Australian societies
may have a different understanding of what constitutes appropriate
behaviour. Qualities such as being yourself, open, friendly, direct,
Cross-Cultural Behaviour in Tourism
28

confident, outspoken and informal, truthful in interpersonal relations
that are admired in the American culture are not admired in Asian
societies that view Americans as aggressive, lacking grace, manners
and cleverness. What one culture regards as normal and acceptable beha-
viour the other one may regard as insulting and irritating. Therefore, it is
important to analyse the cultural differences in behaviour and under-
stand which of these differences have the most detrimental effects.
Tourism cross-cultural studies
The role of cultural differences in determining tourist behaviour has not
been paid much attention in tourism research (Pizam, 1999). This is
unfortunate because cultural differences are especially relevant to the
tourism industry. The tourism industry is increasingly experiencing glo-
balization, cultural characteristics represent an attractive element of the
tourism product itself, and tourism is a service industry where people
from different cultures can meet (Pizam, 1999).
Culture
29
Figure 1.3 Cultural differences among cultures and subcultures according to Samovar andPorter, 1991

In the tourism context, cultural differences have been analysed in
the:
& patterns of recreation (Rodgers, 1977)& amount of leisure time among nations (Ibrahim, 1991, Szalai, 1972)& leisure and travel behaviour (Ritter, 1987, 1989; Cho, 1991; Business
Korea, 1991; Barham, 1989)& vacation travel preferences: (a) availability of vacation time and use of
that time for vacation travel; (b) actual amount of vacation time; (c)
amount of travel undertaken; (d) length; (e) distance; and (f) cost of
the most recent trip (Richardson and Crompton, 1988a,b)& vacation travel patterns (Sussmann and Rashcovsky, 1997;
Groetzbach, 1981, 1988; Chadee and Cutler, 1996)& benefits derived from travelling (Woodside and Lawrence, 1985)& leisure/recreation choice criteria (Pitts and Woodside, 1986)& attitudes towards and preferences for selected vacation travel attri-
butes (Ah, 1993; Yuan and McDonald, 1990; Yang and Brown, 1992)& perceptions/stereotypes/image (Brewer, 1978; Boissevain and Inglott,
1979; McLellan and Foushee, 1983; Pi-Sunyer, 1978; Pizam and
Telisman-Kosuta, 1989; Pizam and Sussmann, 1995; Pizam and
Reichel, 1996; Pizam and Jeong, 1996; Pizam et al., 1997; Pizam et
al., 1994; Reisinger and Waryszak, 1994a,b, c; Wagner, 1977; Wee et
al., 1986)& vacation travel in the US (Goodrich, 1985)& awareness of, and visitation to, selected attractions (Couturier and
Mills, 1984)& values, rules of social interaction, service perceptions, satisfaction
with interaction between Asian tourists and Australian values
(Reisinger and Turner, 1997a,b; 1998a,b, c; 1999a,b; Reisinger and
Turner, 2002a,b)& motivation (Lee, 2000; Mattila, 1999)& destination image (Chaudhary, 2000; Baloglu and Mangaloglu, 2001)& contents of tour packages (Enoch, 1996)& tourists’ role preferences (Yiannakis et al., 1991)& importance of food and foodservice preferences (Sheldon and Fox,
1988)& service quality (Armstrong et al., 1997), and many others.
These and other studies are described in more detail in further chapters.
The major finding of these studies is that national cultures influence
tourist and host behaviour. Therefore, national culture of tourists war-
rants more detailed examination.
Cross-Cultural Behaviour in Tourism
30

Culture
31
Culture and tourism marketing management
One of the most important aspects of successful international tourism
development is to understand the cultural differences between interna-
tional tourists and a host society. These differences are particularly
related to cultural values and the needs and perceptions of international
tourists and hosts. Hosts can regard tourism products and services as
being satisfying for domestic tourists within a cultural context of a host
society. However, international tourists might not regard the same prod-
ucts and services as adequate and satisfying. The aim of tourism market-
ing is to satisfy the needs and wants of various groups of international
tourists. Successful international tourism marketing depends upon the
understanding of the cultural background of tourists whom marketers
attempt to target, and how this background determines the expectations
of these tourists. If the tourism products or services do not adequately
satisfy international tourists’ needs and fail to address adequately the
cultural values of the tourist society, tourism marketers and managers
must revise and/or adjust their product offerings.
It is not suggested here that the total tourism product should be
adjusted to match the international tourists’ expectations. Many interna-
tional tourists travel overseas to experience culture of a host destination
and learn about the cultural differences in traditions, food or dance. Many
travellers are motivated by the cultural uniqueness of the foreign tourism
product. Rather it is suggested that marketers need to address a potential
tourist market from a cultural point of view prior to marketing to it.
Cross-cultural differences are not only limited to language, food or
dance, but are also experienced in a variety of human interactions
between international tourists and local hosts, including their non-verbal
behaviour, religious beliefs, time orientation, attitude to privacy, their
manners, customs, forms of address, body language or gestures. These
cultural elements are potential grounds for cultural misunderstanding
and conflict between international tourists and locals. They can induce
fear often accompanied by stress and generate tourist dissatisfaction with
a tourism product. These experiences and feelings are culturally condi-
tioned, subjective and dependent upon time and space. Marketers and
managers must study them to be able to learn about others and one’s
own, recognize the differences, understand how cultural factors influence
the others’ behaviour, and implement strategies that would successfully
target the particular cultural group.

Discussion points and questions
1. Explain what culture is and what are its major elements.
2. Does culture have a purpose?
3. Can cultural elements completely distinguish between different
cultural groups?
4. How many of the cultural variables need to be different in order to
assess cultural differences? Since they vary in their degree of import-
ance and impact on the interaction patterns, to what degree should
these variables be different to indicate cultural differences in social
interaction?
5. Are there any transcultural variables by which cultures could be
successfully compared?
6. Why is the examination of cultural differences especially relevant to
the tourism industry?
7. Give examples showing the differences in social behaviour between
international tourists and local residents.
8. Is the assessment of cultural differences between international
tourists and hosts always easy and possible?
Cross-Cultural Behaviour in Tourism
32
Summary
Culture is a multivariate concept. There are many definitions of cul-
ture. These definitions are complex, unclear and there is no consensus
definition that can be widely accepted. The majority refer to culture in
psychological terms. There is a dominant culture that influences the
majority of people, and there are subcultures with regional differences.
Any group of people is characterized by various cultures. Members of
the same culture share the same cultural orientation. Cultures differ on
a variety of cultural elements. The maximum cultural differences were
found between Asian and Western societies. Cultures can be distin-
guished on the basis of cultural dimensions. Cultural differences are
especially relevant to the tourism industry. There have been studies
done, which identify cultural differences in the tourism context.
Tourism marketers and managers must be aware of the cultural differ-
ences between international tourists and local hosts to be able to
provide an adequate and satisfying product to tourists.

9. Can one claim that national culture determines tourist behaviour?
10. How important is the understanding of cultural differences for
tourism marketers and managers?
Further reading
Asante, M. W. (1989) Handbook of International and Intercultural
Communication. Newbury Park, CA: Sage Publications.
Brislin, R. (1993) Understanding Culture’s Influence on Behavior. Orlando:
Harcourt Brace Jovanovich.
Jandt, F. (1998) Intercultural Communication: An Introduction.
Thousands Oaks, CA: Sage Publications.
Kroeber, A. and Kluckhohn, C. (1985) Culture: A Critical Review of
Concepts and Definitions. New York: Random House.
Samovar, L., Porter, R. and Stefani, L. (1998) Communication Between
Cultures. Belmont, CA: Wadsworth Publishing Company.
Schein, E. (1992) Organizational Culture and Leadership. San Francisco,
CA: Jossey-Bass Inc.
Culture
33

2Social contact
Objectives
After completing this chapter the reader should
be able to:
& define the concept of social contact, its
purpose and characteristics
& understand social contact in tourism
& identify forms and characteristics of tourist–
host contact
& explain the contact hypothesis and its
outcomes
& identify determinants of tourist–host contact
& identify types of intercultural tourist–host
contact
& understand the interaction difficulties in
inter- and cross-cultural tourist–host contact
& understand the concept of culture shock, its
types, symptoms and stages
& identify measurement techniques of social
contact and measurement problems.

Social contact
35
Introduction
This chapter introduces the concept of social contact with specific empha-
sis on tourist–host contact. The factors that determine tourist–host con-
tact are discussed along with the impact of cultural differences on tourist–
host contact in a cross-cultural setting. The outcomes of tourist–host
contact and the concept of culture shock are presented since they are
ultimate results of the interrelationships between cultural background
and social contact. The measurement of tourist–host contact is also dis-
cussed. For the purpose of this book, contact and interaction are used
interchangeably.
Concept and definitions
Most studies on social contact have been conducted in the United States.
The concept is complex and there are many definitions of social contact
(Cook and Sellitz, 1955). Social contact may refer to the:
Social contact can refer to a multitude of differ-
ent experiences (Cook and Sellitz, 1955). In past
studies the term contact has referred to a very
brief trip as well as long-term friendships. Social
contact can take place in a multitude of different
situations (Cook and Sellitz, 1955). Further, past
studies show that social contact takes place within
the work situation, the residential neighbourhood
and between children, adults, college students, and
so forth. According to Bochner (1982), each social
contact is personal, always occurs between a mini-
mum of two people, and is often referred to as an interpersonal encoun-
ter. Murphy (2000) defined social contact as the everyday encounter with
other people. Each social contact has the potential to be positive, nega-
tive or superficial (Fridgen, 1991).
Two levels of social contact have been identified: co-presence and
focused interaction (Murphy (2000) cites Gahagan (1984) and Goffman
(1967)). Co-presence contact refers to the minimum level of social inter-
action, which occurs ‘when two or more individuals signal (through their
bodily and facial movements, and the use of space) their awareness of one
‘Personal associationtaking place under certain
circumstances; or to theinteraction which covers a
wide range of behaviorsfrom observation of
members of the other groupwithout any
communication, toprolonged intimate
association’ (Cook and
Sellitz, 1955, pp. 52–53).

Cross-Cultural Behaviour in Tourism
36
another’s presence and their accessibility to one another’. Focused-inter-
action occurs ‘when people gather together and cooperate to sustain a
single focus of attention as in conversation, games, and transaction in
shops’. ‘The co-presence may or may not lead to focused interaction in
the form of conversation’ (p. 51).
An important framework, which helps to analyse social contact, is
Analysis of Social Situations (Argyle et al., 1981) theory. This theory
identifies nine core components that influence any social interaction
(see Table 2.1).
Pearce (1980b) emphasized the importance of skills that are needed for
individuals to engage in social interaction and determine the degree of
difficulty the participant has in social interaction. Those who are skilled
socially can interact smoothly.
Table 2.1. Major components that influence social interaction
Analysis of Social Situations theory
Nine features of social interactions have been identified (Argyle, Furnham and
Graham, 1981):
& Goals, which are the purposes that direct and motivate social interaction& Rules, which are shared beliefs that regulate social interaction and generate
actions so that the goals can be achieved& Roles, which include the duties, obligations or rights of the social position of
the contact participants& Repertoire of elements, which is the sum of verbal and non-verbal behaviour
appropriate to the situation& Sequences of behaviour, which is the specific order of actions needed to
behave effectively& Concepts, which are elements that individuals need to possess to behave
effectively in the social situations and attain situational goals& Environmental setting, which is the setting in which the encounter occurs
and consists of spaces, modifiers, boundaries& Language and speech that make individuals understand how to behave in
the interaction, e.g., vocabulary, grammar, codes, voice tone and situation-
specific variations in language& Difficulties and skills, which are social situations that require perceptual,
motor, memory or linguistic skills in order to be successfully understood

Social contact
37
Social contact in tourism
The concept of social contact can be applied in a tourism context. Social
contact with tourists can be:
& Tourist–host& Tourist–tourist& Tourist–potential tourist& Tourist–provider contacts (Fridgen, 1991).
The focus of this book is on the tourist–host contact, which can be
defined as the personal encounter that takes place between a tourist
and a host.
Ambiguity in defining tourists and hosts
There is ambiguity in defining tourists and hosts. Many researchers do
not distinguish between different categories of tourists. They refer to
tourists as sojourners or guests and to tourist–host contact as guest-
host contact (e.g., Nozawa, 1991). Hosts are defined either as (a) local
residents; (b) people of the visited country; or (c) those employed in the
tourism industry who provide a service to tourists.
Nominal definition of a tourist
The nominal definition defines a tourist as a temporary visitor staying at
least 24 hours in the region visited for the purpose of leisure (holiday,
sport, study, recreation), business, family (visiting friends and relatives),
or meeting and conferences (McIntosh and Goeldner, 1997). The term
tourist has a range of meanings that differ by the degree of institutional-
ization, type of encounter exchange, form of travel, traveller’s status
and so forth. The definition of a tourist is further accentuated when
one starts crossing cultural borders. For example, in many parts of the
South Pacific tourists are treated as ‘guests’ rather than tourists
(Vusoniwailala, 1980).
Operational definition of a tourist
The operational definition indicates that the tourist is a culturally differ-
ent temporary overseas visitor, arriving at a holiday destination for
a minimum of 24 hours and maximum 12 months for the purpose of

Cross-Cultural Behaviour in Tourism
38
holiday, business, study, family, sport, or conference. This definition is
used for the purpose of this book.
Definition of a host
The host is a national of the visited country who is employed in the
tourism industry and provides a service to tourists such as hotelier,
front office employee, waiter, shop assistant, custom official, tour
guide, tour manager, taxi and bus driver. Nettekoven (1979) referred to
this type of host as a ‘professional host’.
Physical setting of a tourist–host contact
Tourist–host contact occurs in a wide variety of settings, for example as
the tourist travels in planes and buses, stays in hotels, dines in restaur-
ants, visits tourist attractions, goes shopping or to nightclubs, talks to
tour guides, watches local street life or observes local dances.
Forms of tourist–host contact
Tourist–host contact may take different forms. It may consist either of
business transactions at shops, enquiries in the tourist information cen-
tres or at the front office, or just friendly greetings on a street. Three
major contact situations between tourists and hosts have been identified:
& when tourists purchase goods and services from residents& when tourists and residents find themselves side by side at an attrac-
tion, and& when the two parties come face to face during the process of informa-
tion exchange (DeKadt, 1979).
Contact between tourists and hosts of different culturalbackgrounds
Contact between tourists and hosts of different cultural backgrounds
refers to the direct face-to-face encounter between tourists and hosts
who are members of different cultural groups This type of contact is
experienced by tourists when they travel from a home culture to the
host culture, and by hosts when they serve tourists from a foreign culture.
When the interaction occurs between tourists and hosts from two

Social contact
39
different cultures this type of contact is referred to as intercultural con-
tact, whereas when the interaction occurs between tourists and hosts
from more than two cultural groups it refers to cross-cultural contact.
An example of intercultural contact is the interaction between two cul-
tural groups such as American hosts and Asian tourists. Since both
populations represent several distinct cultural groups, their interaction
can also be of a cross-cultural nature.
Contact hypothesis
Several theories related to social contact between individuals from differ-
ent cultural groups have been developed. One theory, which is related to
the social contact between people from different cultures, is the ‘contact
hypothesis’. Several reviews of the literature on the contact hypothesis
have been published (e.g., Allport, 1954; Cook, 1962; Rose, 1948;
Saenger, 1953; Williams, 1947). The contact hypothesis suggests that
contact between people of different cultural backgrounds may result in
positive as well as negative outcomes.
Positive and negative outcomes of the contact between peoplefrom different cultures
The contact hypothesis states that social contact between individuals from
different cultures results in mutual appreciation, understanding, respect,
tolerance and liking (Bochner, 1982; Fulbright, 1976), develops positive
attitudes (Fisher and Price, 1991), reduces ethnic prejudices, stereotypes,
and racial tension (Cohen, 1971; Mann, 1959; Robinson and Preston,
1976) and improves the social interactions between individuals. It also
contributes to cultural enrichment and learning about others (Li and
Yu, 1974; Nunez, 1963; UNESCO, 1976; Vogt, 1977). However, the
same contact may also develop negative attitudes, stereotypes, prejudices
and increase tension, hostility, suspicion and often violent attacks (Bloom,
1971; Bochner, 1982; Mitchell, 1968; Pi-Sunyer, 1978; Tajfel and Dawson,
1965). Differences in national origin, cultural values (Feather, 1976,
1980a, 1980c, 1986a, 1986b) and cultural gaps (Jackson, 1989) generate
clashes of values, conflict, and disharmonies (Biddlecomb, 1981;
Boissevain, 1979; Choy, 1984; Cooke, 1982; DeKadt, 1979; Hall, 1984;
Ngunjiri, 1985; Peck and Lepie, 1977; Petit-Skinner, 1977; Pi-Sunyer,
1982; Reiter, 1977; Urbanowicz, 1977; Wood, 1984; Young, 1973).

Cross-Cultural Behaviour in Tourism
40
It was strongly argued that contact between people from different
cultural backgrounds leads to tension, misunderstanding and stereotyp-
ing (Albers and James, 1983, 1988; Bochner, 1982; Brewer, 1984; Cohen,
1982; Din, 1982; Evans-Pritchard, 1989; Jordan, 1980; Macnaught, 1982;
Mohamed, 1988; Sutton, 1967); exclusion from mutual activities, feeling
the sense of a social barrier, difficulty of forming personal friendships
(Asar, 1952; Peterson and Neumeyer, 1948; Rathore, 1958; Schmoker,
1954); formality of contact (Taft, 1977); development of superficial
relationships (Watson and Lippitt, 1955); problems of adjustment and
language barriers (Arjona, 1956); feelings of inferiority, self-rejection
(Bettelheim, 1943; Lewin, 1941); resentment (Jordan, 1980); irritation
(Doxey, 1976); frustration and stress (Holmes and Rahe, 1967; Rogers,
1968; Taft, 1977). This contact creates communication problems (Argyle
et al., 1981; Klineberg, 1980; Porter, 1972), leads to the loss of a sense of
security and emotional well being (Lynch, 1960), ethnocentrism and
stereotyping (Triandis and Vassiliou, 1967). When there are differences
in subjective cultures (Taft, 1977; Triandis, 1972) social contact can even
be a threatening experience, participants may feel like outsiders, intrud-
ing, undermining values of the other culture (Bochner, 1982). Such con-
tact may inhibit social interaction (Selltie et al., 1956) and future contact
may even be lost (Kamal and Maruyama, 1990). It has been argued that
the more frequent the social contact is between people of different cul-
tural backgrounds, the more negative the feelings that may develop
(Anant, 1971).
Contact hypothesis in a tourism context: the positive view
The contact hypothesis can be applied in a tourism context. Although
the application of the contact hypothesis to tourism has been criticized
(Turner and Ash, 1975), the theory is still popular as it demonstrates
tourism’s potential for fostering understanding between nations and
peace. For example, in the study of social and cultural impacts of
tourism policy in Tunisia (Bleasdale and Tapsell, 1999) it was noted
that where tourists were friendly and respectful and demonstrated an
interest in Tunisia beyond the beaches, local residents perceived tourists
as guests, developed pride in their Tunisian culture, socialized with
tourists and learned and used other languages. Contact with tourists
and knowledge of each other was seen as being important. Thus, the
contact between tourists and hosts from different cultures can lead to
enhancement of tourists’ and hosts’ attitudes toward each other and

Social contact
41
give them an opportunity to learn about the others’ culture and foster
social interaction (Bochner, 1982). Tourist–host contact results in a
positive attitude change toward hosts (Pearce, 1982b). For instance,
Israelis’ negative pre-holiday attitudes toward Egyptians changed after
holidaying in Egypt (Amir and Ben-Ari, 1985) and Australians devel-
oped positive attitudes towards Israelis (Taft, 1979). It was noted that
the higher the intensity of the social interaction between hosts and
working tourists, the more positive was the change in attitudes towards
hosts (Pizam, Uriely and Reichel, 2000). Those who had longer contact
also developed more favourable attitudes to each other (Li and Yu, 1974).
For instance, those Australians and Papua New Guineans who had more
time to interact, and became familiar with each other, had more positive
attitudes (Feather, 1981). Tourist–host contact may also result in
exchange of correspondence and gifts (Smith, 1957), the development of
an intense personal relationship that persists for years (Smith, 1957), the
development of friendships with hosts (Boissevain, 1979; Pearce, 1988)
and psychological satisfaction (e.g., Stringer, 1981). It was found that
working tourists who intensively interacted with their hosts reported
high satisfaction with their stay at the destination (Pizam et al., 2000).
Contact hypothesis in a tourism context: the negative view
It has been argued that the development of positive attitudes is not
possible since the tourist–host contact is superficial. According to
Hofstede (1997), contact between tourists and hosts of different cultural
backgrounds is ‘the most superficial form of cultural encounter’ (p. 215).
Tourists’ and hosts’ perceptions of each other are highly distorted. Hosts
develop their perceptions of tourists on the basis of symbols such as
clothing or music (Hofstede, 1997). Tourists develop their opinions of
hosts on the basis of host work status, responsibilities and the outcomes
of their mutual commercial exchange. These perceptions are superficial
and may create communication problems. In fact, tourist–host contact
may result in a negative change of attitudes (Anastasopoulos, 1992;
Bloom, 1971; Brewer, 1984). Several studies show that the encounter
between two groups does not contribute to a significant positive attitude
change (Milman et al., 1990; Pizam et al., 1991). Journeys to historically
unfriendly destinations such as travel by Americans to the USSR (Pizam
et al., 1991) and Israelis to Egypt (Milman et al., 1990) can result in only
minor changes in attitude of the tourists towards their hosts, with the
majority of these changes in the negative direction. The results of the

Cross-Cultural Behaviour in Tourism
42
encounter between working tourists and the hosts are less likely to be
positive since their relationships are mainly based on economic exchange,
which may add extra tension to their encounter (Uriely and Reichel,
2000). The encounter between tourists and hosts only confirms previous
attitudes toward each other, regardless of whether these attitudes are
positive or negative (Pearce, 1988). Also, the specific character of tour-
ist–host contact may lead to pressure to develop stereotypes rather than
broaden people’s horizons. Most tourists are just ‘passing through’ rather
than emerging themselves in the life of the host society (MacCannell,
1976).
In addition, tourist–host contact generates clashes of values. For
instance, since tourists have begun visiting Tahiti to see beautiful
women, the Tahitian male has been forced into subservient roles,
which contrasted with the traditional values of Tahitian society where
men are dominant (Petit-Skinner, 1977). Due to the pursuit by tourists
of certain liberal values, which can affront the Islamic religion, host
attitudes toward tourists became negative (Din, 1989). The hosts of
Arab states were not pleased having non-Islamic tourists, because the
woman’s dress, the use of alcohol and the mixing of the sexes were
areas where tourists broke domestic social rules (Ritter, 1975).
Tunisian women found the tourists’ dress offensive and often referred
to other negative aspects of tourist behaviour such as rudeness, drunk-
enness and disrespect for Tunisian culture (Bleasdale and Tapsell, 1999).
It was also strongly suggested that tourist–host contact leads to tourist
isolation, separation and segregation from the host community
(Bochner, 1982; Pearce, 1982b, Pi-Sunyer, 1973; Smith, 1977) and stress.
Tourists also experience victimization and harassment while on holiday.
For instance, British tourists can experience considerably higher rates of
victimization (theft, burglary, violence, threats) than they were likely to
experience while at home (Brunt et al., 2000). Tourists visiting Barbados
experienced harassment (verbal and physical abuse, sexual harassment)
at the beach, in the streets and while shopping (Albuquerque and
McElroy, 2001).
Further, the contact between tourists and hosts from different cultures
can create communication problems due to linguistic, gesture, spatial,
time and status differences (Pearce, 1982b). It can generate orientation,
luggage organization, safety, and health problems (Downs and Stea,
1977; Harmon et al., 1970; Pearce, 1977b). Under such circumstances

Social contact
43
the tourist–host contact creates only disappointment, feelings of discour-
agement and dissatisfaction (Pearce, 1982b).
However, the literature suggests that despite all the negative outcomes,
the advantages of tourist–host contact outweigh the disadvantages.
Tourist–host contact can break the isolation of cultural groups, create
awareness of each group and provide an opportunity to learn each other’s
language and history. It can be a starting point for more fundamental
intercultural encounters (Hofstede, 1997).
Tourist–host contact in less developed countries
In less developed countries where cultural differences between tourists
and hosts are greater than in more developed countries, the negative
effect of direct tourist–host contact is increased (Biddlecomb, 1981;
Boissevain, 1979; DeKadt, 1979; Milman, 1990; Pearce, 1982b). Rich
tourists who visit Third World countries have little respect for local
values (Din, 1989). Tourists are often perceived as aggressive and insen-
sitive (Lind and Lind, 1986). The tourist–host contact often generates
exploitation, assault, victimization (Pearce, 1982b, 1988; Farrell, 1982)
and numerous social problems. Pearce (1982b) suggested that while all of
these processes need not be present at once, they occur due to large
cultural differences that are important elements shaping tourists’ and
hosts’ perceptions of each other.
Determinants of tourist–host contact
The lack of agreement as to the outcomes of the contact between tourists
and hosts raises the possibility of different factors that determine the
results of the tourist–host contact. The literature points to four major
groups of factors that influence tourist–host contact:
& temporal (e.g., time, different roles played by a tourist and a host)& spatial (e.g., physical such as distance, and social such as social posi-
tions of a tourist and a host, social rules they have to conform to)& communication (e.g., different language and non-verbal behaviour)& cultural (e.g., different values, perceptions, attitudes) (Evans, 1978;
Fridgen, 1991).

Cross-Cultural Behaviour in Tourism
44
Temporal and spatial factors
& The ‘nature of the tourist–host contact’ and the social situation in
which this contact occurs determines its outcomes. Literature suggests
that tourist–host contact is:
1. brief (Fridgen, 1991)
2. temporary and non-repetitive (Sutton, 1967)
3. open to deceit, exploitation and mistrust because tourists and hosts
do not have to take into account the consequences of their beha-
viour such as dishonesty, hostility and cheating (Van den Berghe,
1980)
4. asymmetric in terms of meanings for both sides (Hoivik and
Heiberg, 1980), different roles and goals (Sutton, 1967), different
situation status (Din, 1989; Shamir, 1978; Van den Berghe and
Keyes, 1984; Mittelberg, 1988), different motivations and beha-
viour (Cohen and Cooper, 1986), different access to wealth and
information (Van den Berghe and Keyes, 1984), different commit-
ment and responsibilities (Cohen and Cooper, 1986; Hoivik and
Heiberg, 1980), different socio-economic position and cultural
identity (Din, 1989; Jafari, 1989)
5. unbalanced (Fridgen, 1991)
6. superficial (Cohen and Cooper, 1986)
7. not intensive (Hoivik and Heiberg, 1980)
8. lacking spontaneity (Fridgen, 1991)
9. commercial, limited only to business transactions (Fridgen,
1991), transformed into a source for economic gain (DeKadt,
1979)
10. requiring friendliness and strong concern for quality of service from
service providers (Fridgen, 1991) for the purpose of profit (Cohen
and Cooper, 1986; Jafari, 1989)
11. formal (DeKadt, 1979) depending on the situation: (a) tourists
buy goods or services; (b) meet together at the place of tourist
attraction that both use, for example, beach, golf-course; (c) meet
together during the exchange of information and ideas when the
contact is the least formal
12. competitive (Din, 1989)
13. involving an element of dreams and admiration (Hoivik and
Heiberg, 1980)
14. demanding new experiences (Sutton, 1967) that may be positive,
for example, when hosts are professional in offering product, or

Social contact
45
negative when hosts are not capable of meeting tourist demands,
lack product knowledge, choices available, and so forth, and
15. ambiguous (Hoivik and Heiberg, 1980).
& The opportunity for contact determines the occurrence of the contact
(Amir, 1969; Stouffer et al., 1949). The opportunity for contact allows
participants to get to know and understand one another (Cook, 1962).
If no opportunity exists, no contact occurs. The differences in oppor-
tunities for contact are important (Kelman, 1962; Sellitz and Cook,
1962). Different opportunities for contact provide different chances for
interaction (Schild, 1962). Crompton (1979a) found that social contact
is positively related to the opportunity to interact with people. If
opportunities for contact are provided, the contact may even develop
positive attitudes and encourage future contact. Otherwise it may cre-
ate negative attitudes (Kelman, 1962). Sharpley (1994) argued that
tourism as a social process brings people together in the form of social
interaction. However, Brunt and Courtney (1999) disagree suggesting
that only the first situation when tourists purchase goods and services
from residents (DeKadt, 1979) can generate some interaction. Due to
its specific nature and the unfavourable conditions under which it
takes place tourist–host contact provides little opportunity for deep
social interaction between tourists and hosts (Evans, 1978; Fridgen,
1991). ‘Any contact which is transitory, superficial or unequal is a
primary ground for deceit, exploitation, mistrust, dishonesty and
stereotype formation’ (MacCannell, 1984, pp. 384–388).& The place, in which the tourist–host contact occurs, decides about the
opportunity for the tourist–host contact. Nettekoven (1979) argued
that since tourists are highly concentrated in places of tourist attrac-
tions, and are isolated in the ‘tourist ghettos’ that employ most of the
‘professional hosts’, these places offer the maximum opportunities for
tourist–host encounters. Therefore, most tourists’ encounters are with
‘professional hosts’. However, it was also argued that an intensive
interaction is more likely to develop between tourists and tourists. It
is even less likely to develop between tourists and ‘professional hosts’.& The interpersonal attraction of the contact participants to each other
determines social interaction (Triandis, 1977b). Kim (1991) suggested
that attraction is determined by perceived similarity in attitudes. The
greater the similarity, the more likely the contact participants are to
agree with each other’s views and beliefs, and the more likely they are
to interact. Culture influences the level of attraction (Byrne et al.,
1971) and perceived similarity.

Cross-Cultural Behaviour in Tourism
46
& The attributes of the contact participants influence the social contact
(Sutton, 1967). Examples of personal attributes are tolerance, enthu-
siasm, interests, or generosity. The hosts’ welcoming attitudes toward
tourists, efforts to understand tourists’ needs, and the tourists’
willingness to understand and respect the hosts’ culture increase the
chances for their mutual interaction. On the other hand, hosts’ resent-
ment of tourists, lack of appreciation of the tourists’ cultural back-
ground, arrogant behaviour toward tourists, sense of superiority and
the tourists’ lack of respect of the host’s culture decrease the chances
for their interaction (Nozawa, 1991).& Social contact is positively related to social motivators such as the
desire to interact with people of the host community (Cohen, 1971,
1972; Robinson and Preston, 1976; Crompton, 1979a; Schul and
Crompton, 1983; Fisher and Price, 1991). However, many tourists
and hosts may encounter each other with no desire to interact at all.
Also, some tourists may prefer to interact with fellow tourists of the
same national background rather than with foreign hosts (Brislin,
1981). Others may prefer to engage in conversations with foreign
hosts in shops or restaurants and exchange information about their
own countries, but without committing themselves to follow-through
(Schuchat, 1983). Some may prefer participation but without an
assimilation with the locals (Jacobsen, 2000). Only some tourists
may like to interact, engage in deep and long interactions, know
each other better, share personal experiences, and develop long-term
friendships. The motivation to interact socially with other people is
influenced by the cultural orientation towards social relationships.& The touristic orientation may determine tourist–host relations (Uriely
and Reichel, 2000). When the relationships between tourists and hosts
are based on economic exchange personal relations are not empha-
sized (Uriely and Reichel, 2000). In fact, the relationships between
working tourists and hosts based on the employee-employer relation-
ships may even involve elements of tension and conflict and, thus, the
contact can suffer. Consequently, those who are engaged in paid work
as part of their touristic experiences are more likely to be disappointed
with these encounters and avoid social contact with hosts. However,
since they also hold fewer expectations about their encounter with
hosts than those who perceive it as part of their tourist experience,
they may also be less exposed to disappointment from the tourist–host
contact and be more positive about it (Uriely and Reichel, 2000).& Rules of social behaviour determine the variance of behaviour in many
social interactions (Triandis, 1977b). These rules concern introduc-
Social contact
47
tions, greetings and farewells, names and titles, behaviour in public
places, parties and so forth. These rules provide guidelines for social
interactions and they differ between cultures.& The status of the participants is important for the development of
social interaction (Kelman, 1962; Kramer, 1950; Morris, 1956;
Sellitz and Cook, 1962; Triandis and Vassiliou, 1967). If one partici-
pant’s status is lowered, then hatred may develop (Amir, 1969). Social
contact also depends on the degree to which the participants share
mutual ‘interests’, ‘activities’, have common ‘goals’ (Sellitz and
Cook, 1962) and are ‘cooperative’ (Allport, 1954; Williams, 1947).
Social contact will develop when:
1. contact participants have equal status
2. contact occurs between members of a majority group and higher
status members of a minority group
3. there is a favourable social climate that promotes interaction
4. contact is intimate rather than casual or superficial
5. contact is pleasant and mutually rewarding rather than stressful
6. contact participants share common activities, interests and goals of
higher importance with the group rather than the individuals
7. contact participants cooperate rather than compete, and
8. contact participants share the same philosophies (Amir, 1969;
Bochner, 1982; Robinson and Preston, 1976; Triandis and
Vassiliou, 1967).
Perceived status, casualness, intimacy or co-operation varies across
cultures.
& The perceived costs and benefits determine whether or not the interac-
tion is perceived as rewarding; the social interaction increases when it
is perceived as rewarding (Triandis, 1977b). If the perceived costs out-
weigh benefits, the contact is perceived negatively and achieves nega-
tive outcomes. However, if the perceived benefits outweigh costs, the
perceptions of contact are positive, despite initial negative perceptions
(Ap, 1992) and contact can be perceived as rewarding. The greater the
rewards received from the interaction, and the fewer the costs, the
more likely the interaction will take place in the future. Since tour-
ist–host contact can be compared to a social exchange (Sutton, 1967),
the social interaction between tourists and hosts can be assessed in
terms of perceived costs and benefits. Unfortunately, tourist–host con-
tact is often perceived negatively because there is often an imbalance of
benefits and costs for tourists and hosts in terms of psychological

Cross-Cultural Behaviour in Tourism
48
rewards from their mutual contact. The assessment of the perceived
costs and benefits depends upon the cultural similarity and differences
between participants. The more similar interactants are, the more
likely they perceive their interaction as rewarding. The more different
interactants are, the more likely they perceive their interaction as being
costly for them.& The resources that are exchanged determine social interaction (Triandis,
1977b). Six kinds of resources of exchange in an interaction have been
identified, comprising money, goods, services, love, status and informa-
tion (Foa and Foa, 1974). Foa and Foa (1974) argued that the natural
reaction of the receiver of certain resources is to return a resource of the
same kind. The perceived value and significance of the exchanged
resources depends upon cultural beliefs. As Triandis (1977b) noted,
the appropriateness of certain exchanges in response to another’s beha-
viour is governed by culturally determined social rules and norms. For
example, in Polynesia, hospitality is reciprocated by gifts, food, crafts;
a financial contribution to the hosts; and/or by hosting in return
(Berno, 1999). Western tourists do not expect such long-lasting
consequences as a result of their transactions (Van den Berghe, 1994).
Cultural factors
Tourist–host contact is determined by cultural factors (Amir, 1969;
Sutton, 1967; Taft, 1977). However, not much has been done on cultural
variables that determine tourist–host contact. Amir (1969) noted that the
influence of cultural variables is very important for the explanation of
social contact. It is particularly important for analysing tourist–host con-
tact where tourists and hosts are members of different cultural groups,
speak different languages, and have different values and perceptions of
the world (Bochner, 1982; Sutton, 1967).
& Cultural values are of importance because they determine tourist–host
contact (Sutton, 1967; Taft, 1977). Differences in cultural values create
differences in perceptions of status, common goals (Amir, 1969), inter-
ests, activities, and willingness to cooperate or compete. Culture deter-
mines the value of the interpersonal cues for the perceived, and the
extent to which the perceiver considers them to be important
(Triandis, 1977b). Cues are more likely to be perceived as having
value if they are familiar to the perceiver. The cultural environment
determines the extent to which stimuli are familiar (Gibson, 1969). For
example, much social interaction in the South Pacific is based on the

Social contact
49
concepts of social obligation, including reciprocity and generosity
(Berno, 1999). Generosity in a Polynesian context is about investment
in human relationships and establishing an obligation, which will be
reciprocated in the future. The Western style of profit accumulation
and financial motivation conflict with the Polynesian collective sharing
and reciprocity (Berno, 1999). Consequently, financial gains are not
perceived as having value by the Polynesian hosts, and reciprocation is
not regarded as being important by Western hosts. In Western socie-
ties the products and services provided to tourists have been commer-
cialized, the social interactions have been transformed into a source of
economic gain, and the proportion of non-economic relationships
decreased (DeKadt, 1979).& Attitudes towards each other determine the development of social con-
tact of those interacting (Smith, 1955, 1957). Stouffer et al. (1949)
found that American soldiers who had more positive attitudes toward
Germans had more contact with German civilians. Also, the intensity
of attitudes plays an important role in the development of social con-
tact (Amir, 1969; Guttman and Foa, 1951). Festinger and Kelly (1951)
reported that those with more positive attitudes tended to be more
active in social relations, and those with less positive attitudes tended
to be less active. Negative attitudes prevented the development of inter-
actions between the guests and the hosts because they created reserva-
tion, suspicion, dissatisfaction and lack of understanding (Sapir, 1951).
The attitudes within charter tours in the Mediterranean precluded
social interaction with the locals. The anti-tourists and travellers
made new acquaintances during their tour predominantly with fellow
vacationers (Jacobsen, 2000). Levine (1979) called for greater consid-
eration of the hosts’ attitudes, especially positive attitudes that deter-
mine whether the contact will occur. He also agreed that negative
attitudes either jeopardize development of contact, or create an antag-
onistic relationship. Williams (1964) noticed that the more prejudiced a
person is, the less likely the person is to be involved in interaction.
However, prejudice does not mean avoidance of contact. Even highly
prejudiced people seek contact with others, for personal advantage
(Williams, 1964).
In tourism, the development of attitudes is possible only when tourists
purchase goods and services from residents who deal frequently with
tourists in their work. These attitudes mostly represent a mixture of
positive and negative attitudes depending on both parties’ motivation
and status.

Cross-Cultural Behaviour in Tourism
50
& Perceptions of each other determine social contact between interac-
tants. Culture encourages the development of different perceptions
and guides the perception of interpersonal cues. When a person
evaluates another positively, he or she is likely to be evaluated by
the other positively, and vice versa (Triandis, 1977b). Positive percep-
tions enhance social interaction, and negative perceptions reduce it.& The cultural familiarity and similarity facilitates interactions because it
reduces uncertainty (Berger and Calabrese, 1975) and anxiety
(Stephan and Stephan, 1985). Rokeach (1960) argued that the major
factor in the social distance between two people is the degree of the
perceived similarity. According to Pogrebin (1987), people develop
social relations with those who are relatively similar to members of
their own culture and ethnic group. Triandis (1977b) reported that
people who know each other, or who belong to the same race or
tribe are more likely to interact than people who do not know each
other or belong to different tribes. Weingrod (1965) reported that Iraqi
settlers rarely visited the Moroccans, Tunisians and Hungarians who
lived near them, but visited other Iraqi settlers who lived miles away. It
appears that people prefer to develop social contact with their own
national group, or those with a similar background, who speak the
same language even if they are not their friends, rather than with
people from different countries. Therefore, although the opportunities
for tourist–host contact may exist, tourists and hosts may develop
social contact with those of similar backgrounds only. It is the cultural
similarity between tourists and hosts that promotes tourist–host con-
tact (Obot, 1988; Sutton, 1967).
Further, perceived cultural similarity in values is positively related to
positive perceptions and the extent of the social contact (Feather,
1980b). Those with similar values are perceived more positively than
those with dissimilar values. Those who perceive their values to be similar
are also likely to interact more socially than those who perceive their
values to be dissimilar (Feather, 1980b). Large differences in the per-
ceived value system inhibit interaction (Feather, 1980b). Perceived cul-
tural similarity is also positively related to mutual attraction, liking,
decrease in social distance, and increase in familiarity between the contact
participants (Brewer and Campbell, 1976).
However, the similarity in values and beliefs become the most critical
factors only when the relations continue and the interaction intensifies.
Also, cultural similarity does not facilitate friendship formation, which

Social contact
51
requires similarity in interests and attitudes (Rokeach et al., 1960).
Further, Knapp (1978) noted that when the social interaction is brief
and superficial, the differences are few, and the chance of being rejected
is small. Under such conditions dissimilarity could also attract people to
each other. Blau (1977) argued even further, suggesting that although the
rate of social contact between people with different characteristics
decreases as population increases in heterogeneity, at a critical point
increasing heterogeneity and dissimilarity results in reduction in social
barriers and increases the chances of social contact between people who
differ. When differentiation increases, people begin to associate with out-
groups rather than to have no associates at all, thus, social contacts are
enhanced.
Communication
& Cultural similarity facilitates the effectiveness of communication
between people. People enter social interactions with those who
they can communicate with in a similar way. As Rogers and
Bhownik (1971) noted, the communication between people who are
similar is more effective than communication between dissimilar peo-
ple. Consequently, social interaction depends upon the effectiveness
of communication. One reason why individuals do not enter social
contacts with members of other cultural groups is that their initial
interactions with culturally different people are superficial and often
result in ineffective communication. Since this communication is not
as effective as one would wish, people did not try to have contacts
with strangers (Gudykunst and Kim, 1997). However, Simons et al.
(1970) argued that moderate similarities between people might lead
to the most effective communication and satisfying interaction.
In summary, the potential for social interaction and effectiveness of com-
munication between tourists and hosts depend upon the cultural knowl-
edge they have of each other. The more cultural knowledge people have,
the more they know about other cultural groups, the better they can
predict their behaviour (Honeycutt et al., 1983). Consequently, the easier
it is to enter social relationships.
There are other factors that should be taken into account when ana-
lysing the tourist–host contact. Knox (1985) listed 20 factors, which
include language, norms of friendliness, or crowding. Others noted that
the tourist–host contact varies depending on:

Cross-Cultural Behaviour in Tourism
52
& different types of tourists and hosts& different types of travel arrangements (Nozawa, 1991; Sutton, 1967;
Var et al., 1994)& the role of the culture broker (e.g., tour guide) (Nozawa, 1991)& the stage of tourism development and the number of tourists and hosts
at the destination visited (Husbands, 1986; Nozawa, 1991)& the amount of information about each other (Nozawa, 1991) and& types of tourism.
For example, Cohen’s (1972) drifters, Vogt’s (1976) wanderers, Riley’s
(1988) long-term budget travellers, or working tourists (Mittelberg, 1988;
Uriely and Reichel, 2000) have more opportunity for direct and more
meaningful encounters with hosts than institutionalized mass tourists
who travel in organized tours, are taken care of by tour guides and are
surrounded by an atmosphere familiar to them.
However, the factors listed above are not discussed, since their discus-
sion exceeds the scope of this book. Nevertheless, they should be exam-
ined in future cross-cultural tourist–host studies.
Types of intercultural tourist–host contact
Different types of intercultural tourist–host contact have been identified
depending on the degree of interculturalness between tourists and hosts.
Interculturalness
The critical variable that determines the tourist–host contact is the degree
of ‘interculturalness’ in the encounter or the extent of similarity and
differences between participants (Levine, 1979). Encounters in which
individuals are very similar to one another are the least intercultural,
whereas those encounters in which the individuals are very different
from one another are the most intercultural (Lustig and Koester,
1993). However, it is not just the presence or absence of cultural differ-
ences, but the degree of difference between the individuals that influence
their interaction (Kim and Gudykunst, 1988). The degree of difference
might range from very small to extreme. As the degree of difference
increases, the level of interculturalness increases (Sarbaugh, 1988).

Social contact
53
Types of intercultural encounters
The degree of interculturalness allowed distinguishing between three
major types of intercultural encounters (Sutton, 1967), depending on
the similarities and differences in cultural backgrounds of the individuals:
A. where the cultural background of individuals is the same, or similar
B. where the cultural background of individuals is different, but the
differences are small and supplementary
C. where the cultural background of individuals is different, and the
differences are large and incompatible.
In the first two types of contact (A and B) individuals are not separated
by cultural differences. They have similar backgrounds and they share
cultural commonalities. The level of interculturalness in their contact is
low, and they understand each other accurately. Their social contact is
most effective. In the third type of contact (C) participants are separ-
ated by large cultural differences (Sutton, 1967). They have fewer cul-
tural commonalities, their interaction is more difficult and less efficient.
As the differences among the culturally different participants increase,
their encounter leads to friction, misunderstanding and misinterpreta-
tion (Sutton, 1967), and consequently, inhibits interaction. According to
Triandis (1977b), when people belong to different cultures, the more
dissimilar they think they are, the more likely it is that they distort
the meaning of each other’s behaviour. Similarly Sutton (1967, p.
227) stated: ‘the greater the differences among the two cultures, the
greater the probability that encounters . . . will lead to friction and
misunderstanding’, and misinterpretation. As the degree of intercultural
differences between two or more people become wider, communication
is less likely to occur and information exchange is less likely to be
effective (Rogers and Steinfatt, 1999).
The types of intercultural encounters presented above can be applied
in a tourism context to tourist–host contact. The larger degree of differ-
ence between tourists and hosts, which distort their behaviour and create
dissimilar interpretation of this behaviour, the more intercultural is their
contact, and vice versa. According to Pizam and Telisma-Kosuta (1989),
in the destination where the majority of tourists were foreigners, the
residents perceived the tourists to be different from themselves in a vari-
ety of behavioural characteristics. However, in the destinations where the
majority were domestic tourists, the differences between the tourists and
the residents were perceived as only minimal.

Cross-Cultural Behaviour in Tourism
54
Interaction difficulties in inter- and cross-cultural tourist–
host contact
In inter- and cross-cultural tourist–host contact, tourists and hosts are
‘. . . confronted with a culture different from their own in terms of cus-
toms, values, standards and expectations’ (Mishler, 1965, p. 555). Many
situations are unfamiliar to them. They do not know how to interact and
respond to each other. As Brislin (1981) indicated, the behaviour that is
regarded as desirable in one culture may be inappropriate in another. The
cultural differences between tourists and hosts create tourist–host friction
(Bryden, 1973), misunderstanding and even hostility (Bochner, 1982).
Therefore, when there is a meeting of tourists and hosts from cultures
that differ in interpersonal conduct, difficulties can occur with the tourist–
host contact. According to Pearce (1982b), tourists always experience
interaction difficulties in contact with hosts due to the cultural differences
between tourists and hosts. The main interaction difficulties created by
differences in culture were found to be:
& interpersonal communication and behaviour (e.g., language fluency,
polite language usage, expressing attitudes, feelings, emotions);& non-verbal signals (e.g., facial expressions, eye gaze, spatial behaviour,
touching, posture, gesture); and& rules and patterns of interpersonal interaction (e.g., greetings, self-
disclosure, making or refusing requests) (Bochner, 1982).
All of these elements vary across cultures (Furnham, 1979; Hall, 1959)
and are likely to cause misunderstanding.
Communication difficulties
Pearce (1982b) reported that cultural differences between tourists and
hosts create substantial communication difficulties that occur due to
lack of experience with the foreign culture. However, although verbal
and non-verbal communication skills play a very important role in effec-
tively dealing with members of other cultures (Kim and Gudykunst,
1988; Spitzberg and Cupach, 1984), the specific behaviour that reflects
these skills varies across cultures (Ruben, 1976). For instance, Asian
women believe that revealing personal feelings violates cultural rules of
politeness and respect. It is the role of friends and family members to
sense that the other person is hurt or angry, without a person having to
express these negative feelings (Marshall, 1979).

Social contact
55
Rules of social interaction
Most inter- and cross-cultural tourist–host contacts are characterized by
interaction difficulties caused by cultural differences in rules of social
interaction. Each culture has its specific rules of proper introduction,
expression of opinions, showing respect and so forth. For instance,
Bochner (1982) found that the most difficult social situation encountered
by foreign travellers in Britain was developing personal interactions.
Stringer (1981) reported that in bed-and-breakfast establishments even
different customs of handling cutlery and eating habits caused irritations,
and were grounds for interaction difficulties between tourists and hosts.
Further, cultural differences in rules of social interaction influence
mutual perceptions of tourists and hosts. The same rules of social inter-
action may create negative or positive perceptions. Tourists and hosts,
who are skilled socially in rules of their own culture may be socially
unskilled in the rules of a foreign culture because they do not have the
skills to interact smoothly in that culture (Pearce, 1980b). Therefore, they
may feel inadequate, frustrated or embarrassed (Bochner, 1982) and
develop negative perceptions of the nationals of a foreign culture.
According to Pearce (1982b) and Sutton (1967), cultural differences are
very important factors that influence interaction difficulties and shape
perceptions of tourists. However, it can be argued that social interaction
between tourists and hosts does not have to be characterized by difficul-
ties. These difficulties may be significantly minimized or even eliminated
when tourists and hosts are aware of the differences in their cultural
backgrounds. Therefore, the understanding of cultural differences in
background is the key feature for identification of interaction difficulties.
An important theory, which facilitates the analysis of difficulties in
cross-cultural interaction between tourists and hosts, is a Coordinated
Management of Meaning (CMM) theory (Cronen and Shuter, 1983). The
CMM is a theory of human communication that deals with intercultural
communication and comparative patterns of communication. The CMM
places cross-cultural interaction at six different levels of complexity (see
Table 2.2).
The CMM theory suggests that the six levels of cross-cultural difficul-
ties that may occur in tourist–host encounters need attention in order to
solve the problem for the interacting parties of different cultural back-
grounds (Pearce et al., 1998). For the cross-cultural interaction to be

Cross-Cultural Behaviour in Tourism
56
successful and satisfactory it needs to achieve a degree of understanding
in the exchange of messages at various levels. When the CMM theory is
combined with the Analysis of Social Situations theory ‘it is possible to
analyse any single element of difficulty between tourists and hosts accord-
ing to the level of encounter in CMM theory and the key social features in
the Analysis of Social Situations’ (Pearce et al., 1998, p. 354).
Culture shock
Culture shock is one of the most recognized difficulties encountered by
travellers to foreign cultures (Adler, 1975; Bochner, 1982; Lysgaard,
1955; Oberg, 1960; Taft, 1977). Initially, the concept was used for analys-
ing the experiences of sojourners who lived for a significant period of time
(longer than 12 months) in another culture, for example, diplomats or
army officers.
Definition
Culture shock is experienced by an individual who encounters a different
culture. This is a shock caused by an inability to cope in a new cultural
Table 2.2 Levels of cross-cultural interaction (Cronen and Shuter, 1983)
Coordinated Management of Meaning (CMM)
Six levels of complexity of cross-cultural interaction have been identified
(Cronen and Shuter, 1983):
& Verbal and non-verbal behaviour: how clearly people understand one
another’s speech, gestures, posture or signals& Speech acts: the way meaning is attached to forms of address such as status
or level of formality& Episodes: sequence of behaviour, rituals, arrangements for eating, sightseeing,
tipping, gift giving, etc.& Relationship: nature of social relationships, rights and expectations, forma-
tion of friendships& Life script: the way people perceive themselves in their behaviour, their rela-
tionship to others and physical environment& Cultural pattern: the way the larger community is defined, what is perceived
as honesty, justice, reality, truth or equity within a society

Social contact
57
environment, being overloaded with unfamiliar stimuli one cannot com-
prehend, confronted with different ways of life and doing things, inability
to ask questions and understand the answers, or recognize food (Rogers
and Steinfatt, 1999). Culture shock was defined as ‘. . . the reaction of
sojourners to problems encountered in their dealings with host members’
(Bochner, 1982, p. 172), and ‘the loss of equilibrium’ due to ‘loss of
familiar signs and symbols of social intercourse’ because they ‘encounter
. . . differences in an alien culture’ (Craig, 1979, p. 159), lack of familiar
cues about how to behave in a new culture (Oberg, 1960); ‘reaction to
unsuccessful attempts to adjust to new surroundings and people’
(Lundstedt, 1963, p. 8).
Symptoms of culture shock
Hofstede (1997) noted that the visitor in a foreign culture adopts a men-
tality of a child and ‘learns the simplest things over again’, often with
difficulties. This normally ‘leads to feelings of distress, of helplessness . . .
and hostility towards the new environment’ (p. 209). Many symptoms of
culture shock have been reported such as strain, sense of loss arising from
being removed from one’s familiar environment, a feeling of impotence
from being unable to deal competently within the new environment,
embarrassment, humiliation, depression, feelings of being rejected by
the members of the new environment, confusion about one’s own values,
identity, incompetence, frustration, negative feelings toward hosts, refus-
ing to learn a new language, increase in irritation, fatigue, criticism,
decline in initiatives, even preoccupation with cleanliness and worries
(Bochner, 1982; Brislin and Pedersen, 1976; Oberg, 1960; Taft, 1977;
Textor, 1966). Oberg (1960) reported that common symptoms of culture
shock is an excessive washing of hands, extreme concern over drinking
the water, eating local food and the cleanliness of bedding, an absent-
minded and far-away stare, loss of appetite, an over dependence on being
with one’s own nationals, sudden anger over minor problems, great con-
cern over minor skin irritation and slight pains, and a terrible longing to
be back home. Jandt (1998) identified two types of symptoms of culture
shock. Physical symptoms include stress on health and safety, fear of
physical contact with anyone in the new country, craving, use of alcohol
and drugs, over concern about cleanliness, and a decline in work quality.
Psychological symptoms include insomnia, fatigue, isolation, loneliness,
disorientation, frustration, criticism of the new country, nervousness,
self-doubt, irritability, depression, anger, and emotional and intellectual

Cross-Cultural Behaviour in Tourism
58
withdrawal. Hofstede (1997) noted that many visitors to a foreign coun-
try can become physically or mentally ill, commit suicide, or remain so
homesick that they have to return home quickly.
Culture shock and social interaction
Culture shock has an adverse effect on intercultural interaction because
such communication becomes less effective. Participants of intercultural
interaction may interpret their anger and frustration as hostility or hate.
The larger the degree of cultural differences between the contact partici-
pants, the larger culture shock they may experience, the less information
is exchanged and the less effective is their interaction.
Types of culture shock
Several types of culture shock have been distinguished. Byrnes (1966)
identified role shock, which occurs due to lack of knowledge about the
rules of behaviour. Smalley (1963) recognized language shock, which
occurs due to problems with an unfamiliar language and an inability to
communicate properly. Guthrie (1975) and Taft (1977) distinguished
culture fatigue – tiredness, which occurs due to constant adjustment to
a new cultural environment. Bennett (1977) identified transition shock –
negative reaction to change and adjustment to a new cultural environ-
ment, inability to interact effectively within a new environment. The
concept of culture shock and transition shock has been further extended
to include re-entry shock (Gullahorn and Gullahorn, 1963), which refers
to the emotional and physiological difficulties experienced upon returning
home from overseas.
Culture shock in tourism
Many tourists experience culture shock when they travel to a foreign
culture. Encounters with taxi drivers, hotel staff, receptionists, shop assist-
ants, and customs officials may be stressful due to differences between the
tourist culture and the culture visited. Tourists do not know what to
expect from their hosts and hosts often behave in ways that are strange
to tourists. The same behaviour may be considered appropriate in one
culture, and inappropriate or even rude in another. Tourists often do not
know how to greet others in a foreign culture, what is appropriate to say
in conversation or even when and how much to tip the waiter. There are

Social contact
59
many situations that are confusing and make the trip difficult. Therefore,
tourists might have to adapt to new local values, rules and customs in
order to interact successfully with the hosts of a foreign society.
Unfortunately, it has been argued that tourists experience culture
shock to a lesser degree than diplomats or business people. However,
‘this is not always the case and many reactions of tourists are not mark-
edly different from those of foreigners’ (Pearce et al., 1998, p. 350). Pearce
et al. (1998) also suggested that not only tourists experience culture
shock, but the host population also suffers from the same shock. The
encounters may be stressful for both because they are confronted with
new values and behaviour. The socio-cultural and psychological impact
of tourists on hosts is greater when the host population had limited
exposure to other cultures (Pearce, 1982b).
Stages of culture shock
When experiencing a new culture each traveller has to go through
several stages of culture shock (Bochner, 1982). Oberg (1960) identi-
fied four stages of culture shock: (1) a ‘honeymoon’ stage character-
ized by fascination and optimism; (2) a ‘hostility’ stage characterized
by negative attitudes toward the host society and increased contact
with fellow sojourners; (3) a ‘recovery’ stage characterized by an
increased ability to cope in the new environment; and (4) an ‘adjust-
ment’ stage characterized by acceptance and enjoyment of the new
cultural environment.
Gullahorn and Gullahorn (1963) proposed a U-curve of cultural
adjustment or satisfaction with sojourn: initial optimism, the subsequent
disappointment, adaptation and the gradual recovery. The U-curve has
been extended to the W-curve (Gullahorn and Gullahorn, 1963;
Trifonovitch, 1977). An additional stage of a re-entry (return home)
has been adopted. In the first stage, ‘honeymoon’, when the travellers
prepare themselves for travel, they are excited about going to a new
culture and their expectations are high. In the second stage, ‘hostility’,
travellers arrive in a new culture and start experiencing culture shock.
They discover cultural differences between the host and a home culture,
feel frustrated and unable to solve problems in familiar ways, reject the
new culture and seek out people from the home culture. In the third
stage, ‘humour’, visitors adjust to the host culture, begin to appreciate

Cross-Cultural Behaviour in Tourism
60
the new culture, interact with locals, learn the local language, and even
joke in a foreign language. They spend less time with people of the
home country, accept differences, and become adjusted to the host
culture. In the fourth stage, ‘at home’, individuals look forward to
returning home, regret they have to leave the new culture and become
happy about returning home. In the fifth stage, ‘reverse culture shock’,
travellers experience re-entry shock upon return to the home culture.
They feel that the home culture has changed and does not match real-
ity, they can’t find familiar cues in the home environment, feel confused,
alienated, unable to fit into their own culture, and become depressed. In
the sixth ‘readjustment’ stage, tourists learn to cope with the problems
at home (see Figure 2.1).
Hofstede (1997) presented an acculturation curve of a change in
sojourner’s feelings over time. In a short phase 1 ‘euphoria’, individuals
experience the excitement of travelling to and seeing new places. In the
longer phase 2 ‘culture shock’, individuals experience the different way of
living and customs in the new environment. In the longest phase 3 ‘accul-
turation’, the individuals learn about local customs and values, become
more confident to function in a new cultural environment and develop
social relationships. In phase 4, the ‘stable state’, the individuals reach
psychological stability. They may either: (a) maintain negative attitudes
Figure 2.1 The U-curve and W-curve of cultural change, adaptation and adjustment over time

Social contact
61
towards a foreign environment and continue feeling isolated; (b) adjust to
a new environment, feel the same as at home and become biculturally
adapted; or (c) develop more positive attitudes towards a foreign than
home environment and behave like ‘natives’.
Similar patterns of culture shock and adjustment were proposed by
Adler (1975), Smalley (1963), Brein and David (1971) and Jandt (1998)
(see Table 2.3).
Both culture shock and reverse shock show that culture is an extremely
important influence on human behaviour (Rogers and Steinfatt, 1999).
However, it can also be a very useful learning experience. An individual
can gain important understanding about cultural relativism and become
better aware of cultural differences and better prepared for a next
sojourning experience (Rogers and Steinfatt, 1999).
Intensity and duration of culture shock
The intensity of the feelings in each stage and duration of culture shock
depends on the degree of cultural differences between the foreigners and
the receiving culture (Porter, 1972; Stewart, 1966), the cultural knowledge
of the individual, the ability to adjust, the length of stay in the foreign
country, frequency of overseas travel, number of friends in a host com-
munity, type of tourist, type of travel arrangements and many others. For
example, the greater the degree of the cultural differences between tour-
ists and hosts the more intense could be culture shock. Some tourists may
experience culture shock, limited to the initial stage only (Gullahorn and
Gullahorn, 1963; Taft, 1977). Some may never leave the ‘honeymoon
stage’ (Gullahorn and Gullahorn, 1963) or ‘enthusiasm and excitement’
stage (Brein and David, 1971), particularly when their stay in a new
culture is very short. Instead of being frustrated tourists may feel excited
about new experiences in the foreign culture fulfilling their motivations
(Mehrabian and Russell, 1974). Others may find themselves in a constant
stage of confusion. Some others may try to learn about the foreign cul-
ture and realize ‘the weightlessness that comes when your sense of cul-
tural gravity is knocked out’ (Bohannan and Van der Elst, 1998, p. 54).
Those who are more familiar with the foreign culture and/or have a better
knowledge of it can cope better. Also, those who have better social skills
can adjust quicker. However, even those who are highly skilled in adjust-

62
Table 2.3. Patterns of culture shock and adjustment
1 stage 2 stage 3 stage 4 stage 5 stage 6 stage
Oberg (1960) Honeymoon Hostility Recovery Adjustment
Gullahorn and
Gullahorn (1963)
Honeymoon Hostility Humour At home Reverse culture
shock
Readjustment
Brein and David
(1971)
Optimism Experience of
difficulties, frustration
Learning to cope Feeling lost
at home
Hofstede (1997) Euphoria Culture shock Acculturation Stable state
Jandt (1998) Initial euphoria Irritation and hostility Gradual adjustment Adaptation

Social contact
63
ment to new environments in their own culture may find it difficult to
cope and adjust to foreign culture.
Further, individuals who stay in a foreign culture for only a short
period of time (e.g., 1–3 months) can still experience all stages of culture
shock. Others who stay longer (e.g., several years) may experience each
stage of culture shock over a year or more before acculturation occurs.
Taft (1977) argued that tourists who visit a large number of cultures in a
short time could be in constant shock because they have little chance to
adapt to each new culture. Also, those travellers who have at least one
close friend from a host community experience less culture shock than
those with no friends from the host community (Sellitz and Cook, 1962).
It has been argued further that not every type of tourist has to experience
culture shock. Mass tourism offers only limited opportunities for tourist–
host interaction. The short stay, organized in advanced pre-purchased
packaged and guided tours, provide an environmental bubble which pro-
tects mass tourists from direct contact with a new culture and foreign
hosts, stress and anxiety.
Shortcomings of the U-curve and W-curve
The patterns of culture shock have been described in ‘curves’ that
indicate the patterns of adaptive change over time. The U-curve
and W-curve patterns have not always been observed in empirical
research. Church (1982) noted that support for the U-curve hypothesis
is weak, inconclusive and overgeneralized. Not all studies have
reported that sojourners begin their cross-cultural experiences with
optimism (Klineberg and Hull, 1979). Even those who supported
the U-curve pattern noted its significant dependence upon time and
questioned its usefulness. The W-shaped curve has been criticized for
being inaccurate, given the complexity of traveller types and indi-
vidual differences and experiences, and lacking in evidence
(Klineberg and Hull, 1979).
Measurement of tourist–host contact
The literature review indicates that there are a very large number of
variables that can be used to measure social contact in general.
Allport (1954) indicated 30 variables that can measure social contact

Cross-Cultural Behaviour in Tourism
64
including area of contact, social atmosphere, status of the partici-
pants, and the culture of the individuals who are in contact. Cook
(1962) suggested measuring social contact by analysing such aspects
as the characteristics of the contact situation, contact participants,
their attitudes, requirements and expectations from the interpersonal
interaction, and the influence of rules and norms. Cook (1962) called
for the measurement of contact for different subjects for different
characteristics. There are suggestions that social contact should
be measured by the number of people encountered and the status
of individuals (Chadwick-Jones, 1962), nationalities (Triandis and
Vassiliou, 1967), the degree of intimacy (Goldsen et al., 1956), or
number of friends made (Vassiliou et al., 1972). The measurement
of cross-cultural contact is difficult because of the differences in
cultural meanings of the measuring variables such as status, intimacy,
friendship and so forth.
The best-known measurement techniques of social contact are:
Bale’s measurement
Bales (1950) based his measurement of social contact on observation
of interactions. However, this method, although useful, was assessed
as difficult to apply in order to examine all possible types of inter-
actions.
Triandis and Triandis’ Social Distance Scale
A Social Distance Scale developed by Triandis and Triandis (1960) was
rejected as an invalid indirect measure of social contact between people of
different cultural backgrounds due to the differences in social distance
across cultures.
Hall’s Social Distance Zones
Hall (1966) measured social contact by four physical social distance
zones: intimate, personal, social, and public. He observed the depend-
ence of social distance zones on cultural background. Little (1968)
noticed that different cultural groups prefer different social distance.
The distance that is considered intimate in one culture may be consid-
ered more casual in another (Triandis, 1975). McAllister and Moore

Social contact
65
(1991) found that the social distance between Australians and Asian
groups was greater than between Australians and Europeans. The great-
est social distance was observed between Australians and the
Vietnamese group.
Vassiliou et al.’s measures
Vassiliou et al. (1972) measured social contact by the number of intimate
friends made:
& Maximum contact was established with those who had several intimate
friends& Some contact was established with those who had no intimate, but few
close acquaintance, and many remote acquaintance, and& No contact was established with those who had no intimate friends and
no close or remote acquaintances.
Gudykunst’s measures
Gudykunst (1979) analysed cross-cultural contact by developing:
& The Cross-Cultural Interaction Index, which measured the amount and
type of social interaction inferring a level of ‘difficulty’ in interacting
with people from different cultures& The Potential for Cross-Cultural Interaction Index, which measured the
proportion of free time spent with people from different cultures, the
degree of difficulty in understanding people from different cultures,
and the number of hours spent together& The Number of Cross-Cultural Friendships Index, which measured the
number of close and casual friends from another culture, and& The Cross-Cultural Attitude Index.
Feather’s direct measures
Feather (1980b) used direct measures (on the Likert scale) that were
concerned with how often Australian expatriates:
& had been invited into the homes of Papua New Guinean hosts& had been asked to parties& had been invited to play sport& had been invited to share recreation facilities

Cross-Cultural Behaviour in Tourism
66
& mixed at school, and& how many good friends they had among their hosts.
Feather’s indirect measures
Feather (1980b) also used indirect measures (on the Likert scale) that
were concerned with:
& knowledge and use of the host language, and& perceived social distance between tourists and hosts (similarity and
differences in characteristics and behaviour).
Bochner’s measures
The major variables that measure cross-cultural tourist–host contact and
which have been suggested by Bochner (1982) are:
& on whose territory the contact occurs& the time span of the interaction& its purpose& the type of involvement& the frequency of contact& the degree of intimacy, status and power, and& distinguishing characteristics of the participants.
Bochner’s (1982) measurement of tourist–host contact was criticized by
Levine (1979) who argued that the critical variable of contact between
stranger and host is not the length of time a stranger spends in the host
country or the purpose of visit but the extent of stranger-host similarities/
differences and the hosts’ attitudes to the stranger.
Marsh and Henshall’s measures
Marsh and Henshall (1987) measured social contact by:
& the scale, frequency and intensity of interaction (number of people,
length of time)& the person who chooses to interact, and& the style of interaction based on the needs being met (Marsh and
Henshall, 1987).

Social contact
67
Black and Mendenhall’s measures
Black and Mendenhall (1989) measured the intensity of social contact
by:
& frequency& importance& nature (how familiar/novel the interaction is)& the direction of interaction (one-way versus two-ways)& the type of interaction (routine versus unique)& the form of interaction (face-to-face versus mail)& the duration (one year versus five years), and& the format (formal versus informal) (Black and Mendenhall, 1989).
Kamal and Maruyama’s direct measures
Kamal and Maruyama’s (1990) measured the amount of direct contact by
the:
& time spent with hosts& number of host friends& interaction preferences, and& number of parties attended.
Kamal and Maruyama’s indirect measures
Kamal and Maruyama’s (1990) measured the amount of indirect contact
by the:
& free time spent on discretion& length of stay& amount of previous contact with other cultures& difficulties of establishing friendships, and& opinion about treating tourists as equals.
The degree of social interaction was assessed by multiplying the fre-
quency of interaction, importance and nature of interaction (Black and
Mendenhall, 1989).
Degree of social interaction = f (frequency, importance and nature of
interaction)

Cross-Cultural Behaviour in Tourism
68
The ability to speak a foreign language
Social contact was also measured by the ability to speak a foreign lan-
guage and, in particular, whether or not the English language was spoken
in the home country. It was found that Asian groups, composed of
Vietnamese, Chinese and Japanese, and a Middle Eastern group com-
posed of Lebanese and Turks, have no knowledge of the English lan-
guage, therefore they were least popular among Australian born people
(McAllister and Moore, 1991).
Problems in measuring tourist–host contact
Presently, there is not enough information on how to precisely and suc-
cessfully measure cross-cultural tourist–host contact. The techniques
used in past studies to measure tourist–host contact have been limited.
They have been criticized for not measuring data on the number of hosts
the tourists meet, time they spent together, or the amount of contact.
They provide only a general idea of the distributions of frequency and
contact time (Hoivik and Heiberg, 1980). Past studies have been criticized
for not using a reliable and valid technique to measure tourist–host con-
tact. For example, Bystrzanowski (1989) showed that the extent of con-
tact between tourists and hosts in Hungary, Poland, Florida and the
Canary Islands was high and the only differences tourists and hosts per-
ceived between themselves was the way of spending their leisure time, and
attitudes toward nature. Bystrzanowski’s (1989) study was criticized by
Haywood (1990) for lack of appropriate measurement scale. The prob-
lems of developing useful techniques for measuring social interaction
between tourists and hosts of different cultural backgrounds still exist.
Importance of the cultural background analysis
The analysis of the cultural backgrounds of different nations and groups
within each nation is necessary (Feather, 1980b; Sutton, 1967) in order to
determine where differences in value priorities between these groups
occur and what their influence is on individuals and the social contact
within these various groups (Feather, 1980b). Such analysis can provide
important information about the reasons for potential misunderstanding
between different cultural groups. Since the development of international
tourism has significantly increased the contact between people from

Social contact
69
different cultures, research is needed to examine cultural influences on
social interaction in different tourism settings (Murphy, 2000).
Tourist–host contact studies
The literature review reveals that there have been several attempts to
analyse tourist–host contact. Doxey (1975) analysed the effects of host
attitudes toward tourists. DeKadt (1979) examined the nature of contact
with tourists and its influence on attitudes, behaviour and values toward
tourism. Mathieson and Wall (1982) analysed tourist–host contact in
terms of the social and cultural impacts of tourism development.
Pearce (1982b) analysed the effects of social contact between tourists
and hosts and the way in which tourists and hosts view one another.
Pearce and Bochner (1982) examined the effects of intercultural tour-
ist–host contact on tourists and the visited people. Pizam (1982) exam-
ined tourist–host contact as a potential source of crime. Pearce (1984)
analysed tourist-guide interaction, as well as interactions between the
host and guest populations in the New Zealand farm context (Pearce,
1990). Krippendorf (1987) examined tourist–host contact in terms of
understanding and communication. Mittelberg (1988) and Uriely and
Reichel (2000) analysed the tourist–host encounter between working
tourists and their hosts. Pi-Sunyer and Smith (1989) examined the social
processes at work in tourist–host encounters. Ryan (1991) analysed the
disappearance of the local language and dialect as an outcome of tourist–
host contact. Srisang (1991) highlighted the unequal nature of tourist–
host relations by discussing its most extreme form of child prostitution.
McKercher (1993) identified the tourist–host contact as a potential
source of conflict because of the differences in tourists’ and hosts’
demand. Sharpley (1994) examined the host adoption of foreign lan-
guages and development of stereotypical attitudes towards hosts. Burns
and Holden (1995) analysed hosts’ coping behaviour and efforts to avoid
contact. McIntosh et al. (1995) analysed host resentment towards tourists
as the outcome of the economic gaps between tourists and hosts. Pizam
analysed the perceptions of British, Israeli, Korean and Dutch tour
guides of tourists of different nationalities (Pizam and Sussmann, 1995;
Pizam and Jeong, 1996; Pizam and Reichel, 1996; Pizam et al., 1997).
Black et al. (1996) looked at the communicative messages behind the
tourist–host encounter and examined whether host perceptions of their
guests and of themselves change over time. Boniface (1999) addressed the

Cross-Cultural Behaviour in Tourism
70
issue of cultural conflict in the tourist–host encounter. Past studies have
implied that cultural factors affect tourist–host contact. Thus there is a
need to examine the cultural background of tourists and hosts and deter-
mine how the cultural differences in their backgrounds affect their social
interaction.
Summary
The concept of social contact can be used to explain tourist–host
contact. There are different forms of tourist–host contact. The contact
between tourists and hosts from different cultural groups is the focus
of this book. The contact hypothesis suggests that contact between
tourists and hosts of different cultural backgrounds may result in
positive and negative outcomes. The impact of cultural differences
on tourist–host contact in less developed countries is greater.
Several factors determine tourist–host contact: (a) the nature of the
contact itself and the social character of the situation in which the
contact occurs; (b) the opportunity for contact; (c) the place in which
this contact takes place; (d) interpersonal attraction of the contact
participants; (e) personal attributes; (f) social motivations; (g) rules of
social behaviour; (h) attitudes; (i) social skills; (j) perceptions of costs
and benefits derived from interaction; (k) resources that are
exchanged; (l) status, interests, goals and activities. These factors
are culturally influenced. There are also other factors that influence
tourist–host contact such as stage of tourism development or type of
tourism. However, these factors are not discussed, as they do not
directly influence the tourist–host contact in a cross-cultural setting.
The influence of cultural factors is vital for the explanation of
tourist–host contact in the cross-cultural setting. Similarity in cul-
tural background facilitates interaction between tourists and hosts;
dissimilarity reduces it. Tourists and hosts from different cultural
backgrounds can experience difficulties in their social interaction.
Most difficulties occur due to cultural differences in communication
and rules of social interaction. Culture shock is one of the most
recognized difficulties encountered by travellers in a foreign culture.
Tourists experience culture shock when they travel to a foreign cul-
ture. Many symptoms of culture shock have been identified. There are
several stages of culture shock. The theorized stages of culture shock

Social contact
71
Discussion points and questions
1. Explain the concept of social interaction and how it can be applied in
a tourism context.
2. Cite two studies that suggest that the social contact between tourists
and hosts from different cultures results in positive outcomes, and
two others that show that the same tourist–host contact results in
negative outcomes.
3. Describe what characterizes tourist–host contact.
4. Describe the common stages and assumptions of culture shock. Do
you think that every traveller must experience culture shock? Give an
answer illustrating the various arguments.
5. Give some reasons why researchers experience difficulties in measur-
ing social contact between tourists and hosts of different cultural
backgrounds.
Since cultural differences and the difficulties that tourists and hosts face in
their social contact arise from differences in their values (Wei et al., 1989),
the next chapter will discuss the concept of cultural values.
Further reading
Furnham, A. and Bochner, S. (1986) Culture Shock. London: Methuen.
Oberg, K. (1960) Culture shock: adjustment to neo-cultural environment,
Practical Anthropology 17: 177–182.
have not always been supported by empirical research. There have
been several attempts to measure tourist–host contact. However,
this measurement has proved to be difficult because of a very large
number of variables that may be used. The measurement of cross-
cultural tourist–host contact is very difficult because of the differ-
ences in the meanings of the measurement variables across cultures.
The existing measuring techniques can be criticized for being invalid
and unreliable. Currently, there is no standardized, reliable and valid
technique that allows for the successful measurement of cross-cultural
tourist–host contact and there is a need to develop such a technique.

Cross-Cultural Behaviour in Tourism
72
Pearce, P. (1982) The Social Psychology of Tourist Behaviour. Oxford:
Pergamon Press.
Pearce, P., Kim, E. and Lussa, S. (1998) Facilitating tourist–host social
interaction: an overview and assessment of the culture assimilator. In
Laws, E., Faulkner, B. and Moscardo, G. (eds) Embracing and
Managing Change in Tourism: International Case Studies. London:
Routledge.
Smith, V. (1978) Hosts and Guests. Oxford: Blackwell.

3Values
Objectives
After completing this chapter the reader should
be able to:
& define values, value system and values
orientation
& understand the relationship between culture,
values and other related concepts
& identify different types of values
& describe major value dimensions along which
cultures differ
& identify techniques of value measurement
& identify major value patterns and cultural
differences between Asian, European, US and
Australian societies.

Cross-Cultural Behaviour in Tourism
74
Introduction
The previous chapter showed that social interaction is influenced by
differences in cultural background. Since most of these differences arise
from cross-cultural differences in values (Triandis, 1972), it is important
to introduce the concept of values.
Concept and definitions
There have been many attempts to characterize values, their functions,
and the ways in which they differ from other related concepts.
According to Adler (1956), the concept of value is broad, vague and
lacking in real meaning. Every person has a unique set of values. Some
values tend to permeate a culture. These are called cultural values and
derive from the larger philosophical issues that are part of a culture’s
milieu.
The major problem with defining value is a lack of consensus about
what constitutes value and recognizing value priorities. For instance,
values have been defined as the core of culture (Kroeber and
Kluckhohn, 1952); world views (Redfield, 1953); system and core of
meaning (Kluckhohn, 1956; Sapir, 1949); specific preferences and beliefs
about these preferences (Baier, 1969; Catton, 1959); standards and cri-
teria (Rokeach, 1973); attributes of individuals (Barton, 1969) and col-
lectives (Kluckhohn, 1951b). Therefore, attention has to be drawn to
definitions that show an agreement in describing the concept of value
(Feather, 1975; Rokeach, 1973, 1979).
Firstly, it is agreed that values possess a normative dimension. They
inform a member of a culture about what is good and bad, right and
wrong, true or false, positive or negative, and the like. They define what
ought to be or ought not to be, what is useful and useless, appropriate
and inappropriate, what is proper conduct, and what types of events lead
to social acceptance and satisfaction.
Kluckhohn
Kluckhohn (1951b) reported that values are general principles that define
life situations, selection, and decision-making. Without values it would be

Values
75
impossible to measure order in social life as social values predict social
life. Kluckhohn (1951b) saw values as attributes of people; as having
affective, cognitive and conative elements. Kluckhohn (1951b, p. 395)
defined value as ‘a conception, explicit or implicit, distinctive of an indi-
vidual or characteristic of a group, of the desirable which influences the
selection from available modes, means and ends of actions’. Although
Kluckhohn’s (1951b) definition was criticized for being ambiguous and
confusing (Albert, 1968), his definition of value was supported by
Rokeach (1973).
Rokeach
Rokeach (1973) defined value as ‘an enduring belief that a specific mode
of conduct or end-state of existence is personally preferable to an oppo-
site mode of conduct or end-state of existence’ (p. 5). He referred to
values as ‘beliefs about desirable goals and modes of conduct’
(Rokeach, 1979, p. 41) such as to seek truth and beauty, to behave
with sincerity, justice, compassion, humility, respect, honour, and loy-
alty. Rokeach (1973) also stressed that these desirable modes of conduct
are abstract ideals, which represent ideal existence such as security,
happiness, freedom, equality, state of grace, and salvation. In a similar
way to Kluckhohn (1951b), Rokeach (1973) viewed values as ‘means
and ends’. Rokeach (1973) agreed with Kluckhohn (1951b) that values
are socially shared, and are conceptions of the desirable, and with
Williams (1970, 1979) that they are standards or criteria. According
to Rokeach (1979, p. 48), values are criteria that we ‘learn to employ
to guide action . . . to guide self-presentations . . . to evaluate and judge
ourselves and others by; to compare ourselves with others, not only
with respect to competence . . . but also with respect to morality. We
employ values as standards . . . to decide what is worth and not worth
arguing about, worth and not worth persuading and influencing others
to believe in and to do. We employ values to guide . . . justification and
rationalization of action, thought, and judgment. Thus, the ultimate
function of human values is to provide us with a set of standards to
guide us in all our efforts to satisfy our needs and at the same time to
maintain and enhance self-esteem, . . . to make it possible to regard
ourselves and to be regarded by others as having satisfied socially
and institutionally . . . morality and competence.’ Therefore, values are
determinants of social behaviour (Rokeach, 1973).

Cross-Cultural Behaviour in Tourism
76
Smith, Triandis, Williams and Bailey
A similar explanation of values is provided by Smith (1969), who stated
that values play an important role in the evaluation process such as
judging, praising or condemning. Triandis (1972) and Williams (1979)
agreed with Kluckhohn (1951b) that values are preferences for actions
and have strong affective components. Triandis (1972) reported that
values are abstract categories. Also Bailey (1991) agreed with
Kluckhohn (1951b) that ‘values are individual attributes that can affect
such things as the attitudes, perceptions, needs and motivations of peo-
ple’ (p. 78).
Value system
Rokeach (1979, p. 49) believed that the main values could be ordered in a
priority of relative importance with respect to other values to create a
value system (Rokeach, 1973), which is an enduring organization of
beliefs concerning preferable modes of conduct or end-states of existence
along a continuum of relative importance. According to Rokeach (1973),
a value system is the system of criteria by which behaviour is evaluated
and sanctions applied, a system of social guidelines that show the cultural
norms of a society and specify the ways in which people should behave, a
system of standards that permit individuals to make decisions about
relationships with self, others, society, nature and God.
Values over time
A value system is relatively stable over time. However, as a result of
changes in culture the value priorities may be rearranged in the long
term (Rokeach, 1973). Changes in values affect thoughts, actions,
attitudes, beliefs, and social behaviour. However, these changes
depend on the intensity with which individuals within a culture hold
these values.
Value conflicts
Value systems may conflict, and cultural differences in value orientations
may create disagreements. On an individual level, a person may feel a
conflict about being polite versus being dishonest; on a societal level,
members may feel a disagreement on the importance of values. When
two people are from different cultures, value differences may jeopardize

Values
77
the achievement of successful interaction. Violations of expectations
based upon a value system can produce hurt, insult, and general dis-
satisfaction (Samovar and Porter, 1988).
Values and culture
Many writers suggest a relationship between values and culture. Culture
is a system of shared values of its members (Bailey, 1991); culture and
values held by its members are related (Hofstede, 1980); values are the
core of culture (Kroeber and Kluckhohn, 1952); values depend on culture
(Fridgen, 1991); culture is rooted in values (Hofstede, 1980). Values are
psychological variables that characterize people within the same culture
with regard to similarities in people’s psychological make-up. Rokeach
(1973) argued that ‘. . . differences between cultures . . . are concerning
differences in underlying values and value systems’ (p. 26). Rokeach
(1973) provided many examples of value differences between various
cultural groups and concluded that values differentiate significantly
among cultural groups. Differences in values indicate cultural differences
in thinking, acting, perceiving; understanding of attitudes, motivations,
and human needs (Rokeach, 1973). Similarly, Segall (1986) reported that
people from different cultures possess different cultural values. Also,
Chamberlain (1985) noted that differences in values are found between
differing cultural groups and, therefore, they differentiate cultural groups.
Williams (1979) argued that while there are some values that appear to be
universal, societies differ in their patterns of cultural values. However,
these differences involve not only differences in the relative importance of
particular values but also differences in the extent to which members of
each society adhere to particular values, differences in the degree to which
the values are universally accepted within a society, and differences in the
emphasis which each society places on particular values.
Value orientation
There is a distinction between value and value orientation. Value orienta-
tions are ‘complex but . . . patterned-rank ordered principles . . . which
give . . . direction to the . . . human acts . . . the solution of common
human problems’ (Kluckhohn and Strodtbeck, 1961, p. 4). Variations
in value orientations are the most important type of cultural variations
and, therefore, the central feature of the structure of culture (Kluckhohn

Cross-Cultural Behaviour in Tourism
78
and Strodtbeck, 1961). Since different cultures find different solutions to
human problems, the value orientation is a critical variable in the com-
parison of cultures (Zavalloni, 1980). Major cultural orientations along
which cultures differ have been identified (Parson, 1951; Kluckhohn and
Strodtbeck, 1961; Stewart, 1971; Hall, 1976; Hofstede, 1980; Argyle,
1986; Schein, 1992; Trompenaars, 1984, 1993; Hampden-Turner and
Trompenaars, 1993; Maznevski, 1994). These will be described later.
Values as used in this book
In this book it is proposed to treat values as one of the elements of
culture, and to examine whether differences in values differentiate cul-
tural groups. The concept of cultural values as used in this book is similar
to the Rokeach (1973) concept of values. Like Rokeach (1973, 1979), the
authors of this book argue that values influence means and ends, guide
interaction patterns, represent criteria for evaluation of self and others
and standards for these evaluations, can be put in a priority of import-
ance, and can differentiate various cultures. The concept of cultural
values as used in this book is also similar to Kluckhohn’s (1956, 1959)
and Kluckhohn and Strodtbeck’s (1961) value orientation. Since values
may be applied to individuals (personal values) and groups (cultural
values) (Kluckhohn, 1951b) that mutually influence each other (Barth,
1966; Meissner, 1971), cultural values can be seen as yardsticks around
which personal values develop. Therefore, by examining personal values
it is possible to analyse cultural values of a particular society. However, it
has to be noted that dominant cultural values kept by society do not need
to be identical or even similar to individual personal values.
The relationship between values and other related concepts
Many writers suggest relationships between values and other concepts
such as behaviour, attitudes, perceptions, beliefs, rules, norms, interests,
motivations, or needs (e.g., Allport, 1961; Campbell, 1963; Kluckhohn,
1951b; Maslow, 1943, 1959; Moutinho, 1987; Rokeach, 1973; Stewart,
1972; Williams, 1968; Zavalloni, 1980). Values seem to be superior to
other concepts. For the purpose of this book, the relationships between
values and the concepts of behaviour, rules, and perceptions are outlined.
The aim is not only to show the superiority of the value concept to these

Values
79
concepts but also to justify choosing the value concept as a dominant
cultural variable in differentiating cultures.
Values and behaviour
Values are related to behaviour (Kluckhohn, 1951b; Rokeach, 1973)
because they are cultural determinants of behaviour (Zavalloni, 1980).
Values prescribe behaviour that members of the culture are expected to
perform (Samovar and Porter, 1988). They specify which behaviours are
important and which should be avoided within a culture. They guide and
rank behaviour (Fridgen, 1991; Peterson, 1979). Values are superior to
behaviour. Most people follow normative values that indicate how to
behave and failure to do so may be met with sanctions. The differences
in values reflect differences in behaviour (Rokeach, 1973). The similarity
between values predispose a similar way of behaviour.
Values and rules and norms
Values are also related to rules and norms. Values provide a set of rules
for behaviour (Samovar and Porter, 1988) that guide behaviour (Stewart,
1972). Since values refer to desirable modes of behaviour unlike norms
that refer to just modes of behaviour (Stewart, 1972), values decide about
the acceptance or rejection of particular norms (Williams, 1968). Values
are more personal and internal than rules and norms. They can better
explain behaviour than rules and norms; therefore, they are superior to
rules and norms.
Values, attitudes and perceptions
Values are also related to attitudes because they contribute to the devel-
opment and content of attitudes (Samovar and Porter, 1988); they deter-
mine attitudes (Rokeach, 1973). Attitudes are learned within a cultural
context and tend to respond in a consistent manner with respect to value
orientations. For instance, valuing harmony indicates an attitude toward
people and the nature of the relationship between people. Similarity in
terminal values determines harmonious interpersonal interaction (Sikula,
1970). Values are standards, as opposed to attitudes. Values refer to
single beliefs that focus on general situations and objects, as opposed
to attitudes that refer to a number of beliefs and focus on specific objects
and situations. There are fewer values than attitudes because people have

Cross-Cultural Behaviour in Tourism
80
only several values concerning a desirable behaviour, and as many atti-
tudes as encounters. Values determine attitudes (Allport, 1961). Values
are more stable over time than attitudes (Rokeach, 1973). Values provide
more information about persons, groups and cultures than attitudes
(Rokeach, 1968a, 1968b). Therefore, values are more useful than atti-
tudes in understanding and predicting behaviour. In fact, values deter-
mine attitudes and behaviour (Homer and Kahle, 1988). Although
Campbell (1963) argued that value and attitude concepts are similar,
and Newcomb et al. (1965) recognized values as special cases of attitudes,
the literature agrees that values are superior to attitudes. Since attitudes
influence perceptions (Bochner, 1982), values also determine perceptions
(Samovar and Porter, 1988). Therefore, the concept of value is also
superior to the concept of perception. Since values vary from one culture
to another, behaviour, rules and attitudes also differ across various
cultures. In addition, differences between values and attitudes allow for
a clustering of societies (Ronen and Shenkar, 1985) and market segmenta-
tion (Madrigal and Kahle, 1994).
Types of values and their classification
Many researchers have attempted to classify and distinguish various
types of values (Albert, 1956; Allport et al., 1960; Levitin, 1973;
Parsons, 1951, 1953; Parsons and Shils, 1951; White, 1951). One of the
descriptions of value and value differences has been provided by Rokeach
(1968b, 1971, 1973, 1979). Rokeach as well as others (Kluckhohn, 1951b;
Kluckhohn and Strodtbeck, 1961; Lovejoy, 1950; Rokeach, 1973) agreed
that there are two types of values: instrumental (about broad modes of
conduct) and terminal (about end-states of existence), or in other words,
means and ends.
Instrumental values
Instrumental values are concerned with preferable modes of conduct or
means of conduct (to be honest, obedient, ambitious, independent, to
love). These values may be moral (to behave honestly, to be helpful,
loving) and be of a social form; or not be concerned with morality (to
be ambitious, self-controlled, logical, imaginative) but with competency
or self-actualization and be of a personal form (Rokeach, 1973).

Values
81
Terminal values
Terminal values are concerned with goals or the end-state of existence
(salvation, world peace, freedom, comfortable life, true friendship). They
may be personal (individual security, freedom, happiness, salvation) and
social (national security, social recognition, true friendship), and they are
worth striving for. People’s attitudes and behaviour depend on whether
their personal or social values have priority (Rokeach, 1973).
Number of values
The number of values is limited by a man’s biological and social make-up
and his needs. The total number of terminal values that a person pos-
sesses is about 18, instrumental values between 60–72 (Rokeach, 1973).
Primary, secondary and tertiary values
Values can also be classified according to their importance within a
society. Samovar and Porter (1988) distinguished primary, secondary,
and tertiary values. Primary values are at the top of the value hierarchy
because they are the most important. They specify what is worth the
sacrifice of human life, or worth dying for. Secondary values are very
important, but they are not strong enough for the sacrifice of human life.
Tertiary values are at the bottom of the value hierarchy (e.g., hospitality
to guests may be a tertiary value). Whether a value is primary, secondary
or tertiary depends upon the culture in which the person resides.
Measurement of values
There are two types of value measurement: (a) direct, and (b) indirect.
Direct measures
One of the direct measurements is survey research when the respondents
are asked to rank values according to the importance of values (Rokeach,
1973), or rate them on a Likert scale (Millbraith, 1980; Moum, 1980).

Cross-Cultural Behaviour in Tourism
82
Indirect measures
Values can also be measured indirectly by asking the respondents
about their desired values (self-description) and desirable values (ideo-
logical statements), or by describing third people. As Hofstede (1980)
pointed out, the respondents’ perceptions of third people are influ-
enced by the respondents’ values. Values can also be assessed through
open-ended questions, essays, by observing peoples’ choices (Williams,
1978), their interests, type of rewards and punishments for particular
actions, by analysing historical and literary documents, art, myths, and
legends.
Value measures in cross-cultural studies
Values were measured in various cross-cultural studies. Different tech-
niques of measurement have been used. Among well-known techniques
are the following:
& The Allport-Vernon Values Scale (Allport et al., 1951)& The Allport-Vernon-Lindzey Values Scale (Allport et al., 1960)& The Ways to Live Test (Morris, 1956)& The Survey of Interpersonal Values (Gordon, 1960)& The description of value orientations (Kluckhohn and Strodtbeck,
1961)& Personal Value Scales (Scott, 1965)& Ranking procedures (Kohn, 1969; Rokeach, 1973)& The antecedent-consequent procedure (Triandis et al., 1972a)& Osgood’s semantic differential technique (Osgood et al., 1957)& The Value Survey of Rokeach (Rokeach, 1973)& Ideographic procedures (Zavalloni, 1980), and& A variety of questionnaire measures and procedures developed for
specific purposes (Mirels and Garrett, 1971; Scott, 1965).
Shortcomings of the value measures
Not all of these techniques gained universal acceptance. For instance,
Morris’ (1956) ways of living test was criticized for being suited to only
highly educated respondents. Kluckhohn and Strodtbeck’s (1961) value
orientation survey is appropriate only for peasant populations. Scott’s
(1965) Personal Value Scale is a normative rather than an ipsative test
(forced-choice format). Although the Allport-Vernon-Lindzey (AVL)

Values
83
test is regarded as one of the best available tests for the assessment of
values (the test-retest and split-half reliabilities ranged from 0.84 to
0.95, and the validity has also been assessed successfully) (Graham
and Lilly, 1984), this test was also criticized for using an ipsative scor-
ing method. According to Hicks (1970), the ipsative measure is a very
serious limitation of the instrument and should not be used. High scores
on one scale can be obtained only if scores on the other scale are low,
forcing negative intercorrelations among the scales. Since the scores are
dependent, it is also not appropriate to use ipsative scores for prediction
and examination of group differences (Graham and Lilly, 1984).
Therefore, the only way to avoid this shortcoming is to normalize the
scores from the ipsative scale.
Value surveys
Feather (1975) and Rokeach (1973) reported that value surveys are very
useful in studying adult values. The value surveys were praised for not
only measuring a person’s value but also perceived values of others
(Feather, 1970b, 1971, 1972a, 1972c).
Rokeach Value Survey
The Rokeach Value Survey (RVS) (Rokeach, 1973) is considered to be
the best available instrument for measuring human values. In his value
survey Rokeach (1973) introduced two lists of 18 alphabetically arranged
instrumental and terminal values. These two sets of values are accom-
panied by short descriptors that were added after tests showed they
improved the reliability of the instrument. The terminal values that
include such concepts as salvation, equality, world of peace, lasting con-
tributions, comfortable life, exciting life, and social recognition refer to
preferred end-states of existence. The instrumental values that include
such concepts as being courageous, responsible, honest, polite, and
clean describe preferred modes of conduct. Rokeach (1973) asked the
respondents to arrange values in order of importance to them from
1–18. Rokeach (1973) found that the highest valued terminal values
were: world peace, family security, and freedom. The highest valued
instrumental values were: honesty, ambition, and responsibility.
The RVS is ‘based on a well-articulated conceptualization of value’
and its success in ‘finding specific values that differentiate various polit-

Cross-Cultural Behaviour in Tourism
84
ical, religious, economic, generation and cultural groups’ (Braithwaite
and Law, 1985, p. 250). The RV is relatively economical because
respondents have to deal with only thirty-six concepts in all, each
being represented by two or three short phrases. Rokeach (1968b,
1973, 1979) used his value survey in wide-ranging research to investigate
topics such as a relationship between values, attitudes and behaviour;
the distribution of value priorities at different times; political ideologies;
the effect of inconsistencies among the individual values; value educa-
tions, and institutional values.
Several researchers have used the RVS to measure human values (e.g.,
Feather, 1970a, 1970b, 1971, 1972a, 1972b, 1972c, 1980a, 1980b, 1980c,
1986a, 1986b; Ng et al., 1982). The results of the studies indicated numer-
ous cultural differences in values between various Western and Asian
countries. The RVS was also used to construct the ‘List of Values’
(Kahle and Timmer, 1983) that included values such as a sense of belong-
ing; fun and enjoyment; warm relationships with others; self-fulfilment;
being well respected; sense of accomplishments; security; self-respect; and
excitement. The ‘List of Values’ was used several times for marketing
research purposes.
Criticism of value surveys
The value surveys were criticized for their content being removed and
being to far from what is meant by ‘the desirable’. According to
Rokeach (1973), a person’s belief does not imply that the belief is to
be desirable. Therefore, it was argued that the value surveys do not
have high priori validity. Cantril (1965) noted that cross-cultural value
surveys attempting to determine cultural differences in values do not
allow for explanations of these differences either. The RVS was also
criticized for its shortcomings. Kahle (1986) believed that use of the
RVS would be inappropriate in less developed societies and for groups
with low verbal comprehension. Some of the values might be misunder-
stood or irrelevant to some cultures. Rokeach (1973) argued that the
ranking procedure yields a hierarchy of values understandable to
groups with little education. However, many researchers have ques-
tioned the meaningfulness of the ranking procedure (Gorsuch, 1970;
Keats and Keats, 1974; Lynn, 1974). Consequently, the most recent
value studies applied a rating rather than a ranking system (e.g.,
Braithwaite and Law, 1985).

Values
85
Value analysis
Various analytical procedures have been used to analyse values. In the
earlier studies Jones and Bock (1960) applied multiple discriminant ana-
lysis. Bales and Couch (1969) applied factor analysis and reduced 900
different statements of values to four basic values such as authority, self-
restraint, equality, and individuality. In more recent studies researchers
have used multidimensional scaling techniques such as factor analysis,
cluster analysis, discriminatory and smallest space analysis (e.g., Feather
and Peay, 1975; Hofstede and Bond, 1984; Ng et al., 1982; Schwartz and
Bilsky, 1986).
Difficulties in measuring and analysing values
In general, it is difficult to measure and analyse values in cross-cultural
research. Values are abstract constructs, not easily observed, difficult to
translate into different languages and their interpretations depend on the
cultural backgrounds of respondents and researchers. ‘Often values . . .
and evaluations of the behaviours of strangers are based on the values
and belief system of the observers’ (Damen, 1987, p. 192). Therefore,
there is a problem of matching researchers’ value interpretations and
respondents’ behaviour. There is also a problem of confusing values
with other related concepts. A number of studies that claimed to measure
values assessed specific attitudes and interests (Feather, 1980c). Problems
in choosing which particular values should be assessed (Rokeach, 1973)
add to the difficulties in measuring values. Past study findings also sug-
gested that values that are central to the individual receive high rankings.
Atkinson and Murray (1979) found that social values such as love,
family, or friendship were given a higher priority than economic values.
Leisure values have been ranked low (Bharadway and Wilkening, 1977).
Chamberlain (1985) recommended focusing on values that are less central
to the individual.
The choice of technique used to measure values in cross-cultural
research also creates problems. Only techniques that are appropriate to
the cultures that are being compared and that are equivalent across cul-
tures (Feather, 1975), should be chosen. Problems also concern the emic
versus etic approach, the appropriate equivalence of measures and mean-
ings, ways of maximizing reliable and valid measurements, and the logic of
comparative analysis. Studies that use multiple methods of measurement
of values give the best understanding of cultural values (Feather, 1986b).

Cross-Cultural Behaviour in Tourism
86
Value studies in tourism
Not many value studies have been done in tourism. Shih (1986) used a
Values, Attitudes, and Lifestyles (VALS) technique to assess whether
personal values affect the selection of Pennsylvania as a holiday destina-
tion. Four groups of nine lifestyle segments emerged including experien-
tials who focus on interpersonal relationship experiences. Pitts and
Woodside (1986) found values to be useful in describing visitors to tourist
attractions versus non-visitors, and identifying ‘a value profile’ of each
group. They found values to be indicative of the motives and needs a
particular attraction satisfies. Differences in cultural values could predict
visitation to tourist attractions. Pizam and Calantone (1987) developed a
value scale related to tourist vacation behaviour. They used numerous
scales from previous studies measuring values: the RVS; Scott’s Personal
Values Scales (Scott, 1965); Webster, Sanford and Freeman’s New ‘F’
Scale (Webster et al., 1955); Rosenberg’s Self Esteem Scale (Rosenberg,
1965); Bales and Couch’s Value Profile (Bales and Couch, 1969) and
Rehfisch’s Rigidity Scale (Rehfisch, 1958). The original scale consisted
of twenty-three bipolar statements on a 1–9 scale that were related to
various aspects of vacation travel behaviour. Pizam and Calantone (1987)
found that travel behaviour was significantly associated with a person’s
general and vacation-specific values. They concluded that values predict
travel behaviour. Muller (1991) found that different segments of
American tourists to Toronto attached different importance to destina-
tion attributes and, thus, possessed different values. Madrigal and Kahle
(1994) segmented English-speaking tourists to Scandinavia on a basis of
their values and found the differences in vacation activity preferences
among tourists to be based on the relative importance they placed on
four value domains. It appeared that values are important variables in
predicting tourist visitation to a destination and behaviour.
Differences in cutural value patterns between Asian, US,
European and Australian societies: empirical and non-
empirical evidence
An attempt is made to summarize the available empirical and non-
empirical evidence of differences in cultural values between Asian, US,
European and Australian societies. The focus is mostly on the United

Values
87
States, Western Europe and Australia as representative of Western cul-
ture and Southeast Asian countries as representative of Eastern cultures.
Early studies
Several multinational studies have been conducted (Eckhardt, 1971;
Rusett, 1968; Stewart, 1971; Vincent, 1971). There were some attempts
to cluster countries (Cattell, 1950; Hofstede, 1980; Rummel, 1972;
Russett, 1968; Sicinski, 1976; Sirota and Greenswood, 1971):
& Gordon (1967) clustered Chinese, Japanese, Philippino and Indian
together& Ando (1965) clustered together Indian and Philippino; Japanese and
Norwegian, and as distinct, Chinese and American& Hofstede (1980) clustered forty countries into eight cultural areas
including Asian, Near-Eastern and Anglo groups& Russett (1968) and Tung (1989) made a distinction between Eastern
and Western clusters.
The cross-cultural differences in values between the countries belonging
to these clusters were analysed (Ando, 1965). The Eastern clusters were
characterized as more conservative, pessimistic, conformist, compulsive,
socially oriented, nationally dissatisfied, and unstable as opposed to
Western clusters (Eckhardt, 1971).
Religious philosophies
The cultural differences in values between Eastern and Western societies
could be explained by distinct religious philosophies adapted in various
regions of the world. Smart (1968) described Eastern values in terms of
major Eastern religions like Buddhism and Hinduism. Ryan (1985)
assessed how religious philosophies influenced the Chinese way of life,
thinking and behaviour. For instance, Confucius dictated the correct
naming, use of precise words, speaking with a proper degree of hier-
archy, respect and the ability to foresee how their own behaviour affects
others. It restricted the expression of emotions. Taoism stressed emo-
tional calm, being in harmony with nature, discouraged assertiveness
and self-expression. Buddhism emphasized common coexistence.
Buddhists (Chinese, Koreans, Japanese) were described as people,
who do nothing to hurt others, respect life, morality, control one’s
own feelings and thoughts, and practise proper conversation. Taoism

Cross-Cultural Behaviour in Tourism
88
dictated leading a simple, close to nature life, and avoiding social obli-
gations. Shintoism dictated the worship of ancestors. The Eastern cul-
tures stressed belongingness and ego that protects from creating
conflict. The Japanese were presented as people- and society-oriented,
receptive to nature, achievement-oriented, less materialistic (Kikuchi
and Gordon, 1966, 1970; Stoetzel, 1955), independent and open to
experience (Jones and Bock, 1960). The Chinese were presented as
self-sufficient and progress-oriented. Differences between Eastern and
Western approaches to the concept of self were noted (Chung, 1969;
Hsu, 1971a). Western values could be explained by the Christian reli-
gious philosophy, which teaches love, respect and worship of God and
others, and dictates non-violence and caring for one another, and is
based on the Ten Commandments. Unfortunately, many of the
Christian laws have been violated in modern times.
Comparison of cultural orientations
The Western and Eastern cultures exhibit distinct ‘orientations’ towards
the world and other people. According to Kluckhohn and Strodtbeck
(1961), these orientations represent human problems for which people
in all cultures must find solutions: how to relate to (1) human nature;
(2) nature; (3) human activities; (4) other people; and (5) time. Different
cultures may be compared on the basis of how their members solve these
problems. Different leading authors in the field developed different sets of
cultural orientations, however, they all appear to relate to Kluckhohn
and Strodtbeck’s cultural dimensions. Table 3.1 shows a comparison of
the major cultural orientations. The explanation of these orientations,
which follows Table 3.1, indicates the interdependence among various
aspects of culture.
Parson’s pattern variables
Parson (1951) identified six pattern variables, which represent the
choices individuals have to make before engaging in any behaviour: uni-
versalism-particularism, ascription-achievement, diffuseness-specificity,
affectivity-affective neutrality, instrumental-expressive orientation, and
self-orientation–collective orientation.
1. Universalism-Particularism. This dimension differentiates between
cultures depending on the manner by which people describe each
other and objects and the rules they use for this purpose. In cultures

89
Table 3.1 Comparison of cultural dimensions
Human
Nature
Relation
to Nature
Activity
Orientation
Human
Relationships
Relation
to Time
Context Space
Orientation
Information
Flow
Language
Parson (1951) Universalism
Particularism
Achievement
Ascription
Diffuseness
Specificity
Affectivity
Affective neutrality
Instrumental
Expressive
Self-oriented
Collective-
oriented
Kluckhohn
and Strodtbeck
(1961)
Good
Evil
Neutral
Mixed
Changeable
Unchangeable
Subjugation
Harmony
Mastery
Doing
Being
Being-in-
becoming
Individualistic
Collateral
(collectivistic)
Linear
(hierarchical)
Past
Present
Future
Public
Private
Mixed
Stewart (1971) Changeable
Unchangeable
Subjugation
Harmony
Control
Doing
Being
Becoming
Formal
Informal
Egalitarian
Hierarchical
Direct
Indirect
Self-oriented
Group-oriented
Present
Future

90
Human
Nature
Relation
to Nature
Activity
Orientation
Human
Relationships
Relation
to Time
Context Space
Orientation
Information
Flow
Language
Hall
(1960, 1966,
1973, 1976)
Hall and Hall
(1987)
Agreements Monochronic
Polychronic
Amount of
space
Possessions
In- and out-
groups
Friendship
Authority
Past
Future
Monochronic
Polychronic
Low/high
context
Public
Private
Intimate
Personal
Social
Covert/overt
messages
Low/high
context
Hofstede
(1980)
Low/high
Uncertainty
Avoidance
Low/high
Uncertainty
Avoidance
Masculinity
Femininity
Low/high
Power Distance
Individualism
Collectivism
Bond (1987)/
Chinese
Culture
Connection
(1987)
Long/short-
term
Orientation
Argyle (1986) Formal
Informal
Contact
Non-contact
Triandis (1994) Tight/loose cultures
Table 3.1 (continued)

91
Human
Nature
Relation
to Nature
Activity
Orientation
Human
Relationships
Relation
to Time
Context Space
Orientation
Information
Flow
Language
Schein (1992) Evil
Good
Mixed
Subjugation
Harmony
Control
Doing
Being
Being-in-
becoming
Work
Family
Personal
Individualism
Groupism
Participation
Involvement
Role relationships
Planning
Development
Discretionary
time horizons
(function/
occupation/
rank)
Temporary
symmetry
Pacing
Past
Present
Near/Far
Future
Monochronic
Polychronic
Physical
Social
Individual
Moralism
Pragmatism
High/low
context
Intimacy
Personal
Social
Public
High/low
status
Trompenaars
(1984, 1993)
Hampden-
Turner
Trompenaars
(1993)
Universalism
Particularism
Inner/outer
directed
Achievement
Ascription
Analysing
Integrating
Individualism
Communi-
tarianism
Equality
Hierarchy
Affective
Neutral
Sequential
Synchronic
Past
Present
Future
Maznevski
(1994)
Good
Evil
Changeable
Subjugation
Harmony
Mastery
Doing
Being
Containing
Controlling
Individual
Collective
Hierarchical

Cross-Cultural Behaviour in Tourism
92
with a universalistic orientation, people describe themselves and
objects according to universal and general rules by following a stan-
dardized pattern. In cultures with a particularistic orientation people
use particular rules and describe others in specific categories that are
unique to the situation. In universalistic cultures people interact and
communicate with strangers in the same way regardless of social
situations and circumstances, while in particularistic cultures the
interaction and communication patterns with strangers differ
depending upon situations. Bellah (1985) found the US and
Canada the more universalistic cultures on earth, and Japan,
Singapore, Hong Kong, China, Thailand and South Korea more
particularistic (Hampden-Turner and Trompenaars, 1996).
2. Ascription-Achievement. This dimension differentiates between cul-
tures depending on how people assess each other. In ascription orien-
tation people assess others on the basis of the inherent qualities (e.g.,
gender, family heritage, race, ethnic group) and predict others’ beha-
viour on the basis of qualities ascribed to them (India, China, Japan,
Indonesia, France). In the achievement orientation people and
objects are judged on the basis of the performance and measurable
results, and predict others’ behaviour on the basis of their efforts and
occupational status and achievements (US, Britain).
3. Diffuseness-Specificity. This dimension differentiates between cultures
depending on whether people categorize others and objects in a hol-
istic manner by integrating the details, looking for patterns, structures
and theories (collectivistic cultures, diffuseness orientation), or cate-
gorize others according to specific details such as facts, tasks and
numbers and respond to a particular aspect of a person or an object
only, e.g., role or responsibility assigned (individualistic cultures, spe-
cificity cultures). Hampden-Turner and Trompenaars (1996) reported
that Japan, Thailand, Malaysia, China, Hong Kong and Singapore
tend to be holistic oriented. Canada, Australia, France, Germany,
US, Netherlands and UK are more specifics oriented.
4. Affectivity-Affective Neutrality. This dimension differentiates between
cultures depending upon the nature of the gratification people seek
(Parsons, 1951), their association with emotional and non-emotional
responses and the way their decisions are based. In affective orienta-
tion people look for immediate gratification; their behaviour and
decisions are guided by emotions (Latin American cultures such as
Spain, Italy, or Mexico). In affective neutrality orientation people
express self-restraint; their behaviour and decisions are guided by
cognitive information and facts (US, Australia, Great Britain).

Values
93
5. Instrumental-Expressive Orientation. This dimension differentiates
between cultures depending on the nature of the goals people seek
to achieve in their social interactions. In instrumental orientation
social interactions are important because they help to achieve certain
goals (US), while in the expressive orientation social interactions are
valued for their own sake (Latin America, Arab cultures). In the
expressive orientation people value friendships more than in instru-
mental orientation (Gudykunst and Kim, 1997).
6. Self-Orientation–Collective Orientation. This dimension differentiates
between cultures by identifying those cultures that focus on the
enhancement of individuals, their needs and rights and those that
care about the welfare of others and the community. In the self-
oriented cultures the individual goals are emphasized; people are sup-
posed to look after themselves and take initiatives (US,Great Britain).
In the collective cultures people are concerned about the interests and
well being of others (Asia). Americans and Canadians are the most
self-oriented and individualist nations on earth (Bellah, 1985); the
Chinese, Singaporeans, Hong Kong, Malaysians and Koreans are
more concerned with a group of people with whom they work or
interact socially (Hampden-Turner and Trompenaars, 1996).
Kluckhohn and Strodtbeck’s value orientation
Kluckhohn and Strodtbeck (1961) compared cultures on a basis of five
value orientations toward human nature, nature, human activities, time,
and other people.
1. Orientation toward human nature. The human nature orientation
deals with the innate character of human nature. Humans can be
viewed as good, evil or a mixture of good and evil. Western societies
perceive man as good, while Eastern societies perceive man as good
or bad. For instance, the Chinese assume that a man is either born
good or bad. The orientation toward man’s nature has a significant
impact on people’s attitudes to each other and consequently on their
interpersonal contact. However, no studies have been done on the
cultural differences between Eastern and Western value orientation
towards human kind.
2. Orientation toward nature. There are three potential types that exist
between humans and nature: mastery over nature, harmony with
nature, and subjugation to nature. Gudykunst and Kim (1997)
reported that the distinction is not quite that simple. Humans can

Cross-Cultural Behaviour in Tourism
94
also be viewed as able to change (mutable) or not able to change
(immutable). There are numerous combinations of these various
aspects: (a) humans are evil but mutable; (b) humans are evil and
immutable; (c) humans are neutral with respect to good and evil; (d)
humans are a mixture of good and evil; (e) humans are good but
mutable; and (f) humans are good and immutable. Western societies
believe they can control nature and all natural forces can and should
be overcome (e.g., floods, storms). However, it is not always easy to
decide which of the six combinations predominates. For example, in
the United States people see human nature as evil but mutable; they
use discipline and self-control to change their nature. Many believe
that human nature is a mixture of good and evil (Gudykunst and
Kim, 1997). Eastern societies believe people should live in harmony
with nature and worship it (e.g., China, Japan, North American
groups). The Eastern societies see nature as a creation of God and
life as God’s will. They regard members of Western societies, who
imply the alternatives for God and spiritual dimensions as untrust-
worthy, unintelligent, and biased. In cultures such as Spanish
Americans, people are subjugated to nature and believe that nothing
can be done to control nature if it threatens. The orientation towards
nature affects people’s attitudes to religion, aesthetics, material pos-
session, life quality and, consequently, interpersonal relations.
3. Orientation toward human activities. Human activity can be handled
in three ways: doing, being and being-becoming. Western cultures
such as the United States or Germany are ‘doing’ and ‘action’
oriented. They emphasize activity, task completion, goals achieve-
ments, getting things done, and competition. Activities are tangible
and can be externally measured. A common question in the United
States is ‘What do you do for a living?’ Eastern cultures are either
‘being’ or ‘being-in-becoming’ oriented. The being orientation is
opposite to the doing orientation. People engage in spontaneous
activities, indulge in pleasures and reveal their spontaneity as an
expression of their human personality. The examples of this orienta-
tion are most Latin cultures, e.g., Mexico. The being-in-becoming
orientation is concerned with spiritual life more than a material one,
who people are, not what they have. The focus is on self-develop-
ment, contemplation, meditation, and self-improvement (e.g.,
Hinduism, Zen Buddhist monks). In both being and being-in-becom-
ing cultures people emphasize passivity, defensiveness and strive for
social harmony in interpersonal relations at the expense of efficiency.
They are people oriented and harmony oriented. Members of

Values
95
Eastern cultures try to be humble and tolerant and refrain from open
confrontations. They emphasize individual obligations to society and
group harmony. As Beatty et al. (1991) reported, people who value
highly other people and warm relationships with others also give
more gifts and put more effort into gift selection, than people who
exhibit more self-centered and self-concerned values. An understand-
ing of the activity orientation can give insight into the people
approach to work and leisure. In the ‘being’ oriented societies deci-
sions are most likely to be emotional and people oriented. In the
‘doing’ oriented societies decisions are most likely to be economically
driven and task oriented. The activity orientation dimension has a
significant influence on interpersonal relations.
4. Orientation toward time. The focus of human life can be directed on
the past, present and future. Western societies are future time-
oriented. They perceive time as a scarce resource and try to use it
effectively. They value change and see the future as ‘bigger and
brighter’ (e.g., United States). Eastern societies are past and tradition
oriented. They worship ancestors and have strong family traditions
(e.g., China, Japan). They attach relatively small importance to time
schedules and punctuality. They perceive time as circular rather than
linear (e.g., Indonesian). However, in Western influenced Hong
Kong the majority of Chinese act according to precise time sched-
ules. Present-oriented societies believe that the moment has the most
significance. The future is vague and unknown and what really
matters is ‘now’. People pay relatively little attention to what has
happened in the past and history. People believe they must ‘enjoy
their moments’. People of the Philippines, Mexico and Latin
America usually have these beliefs. Also, in societies such as
Navajo Indians of northern Arizona the present orientation predom-
inates. Time orientation has a significant impact on people’s atti-
tudes to tradition, ceremony, etiquette and, consequently, on
interpersonal relations.
5. Orientation towards other people. This dimension appears to be the
most crucial in governing human interactions and the most differ-
entiating between Eastern and Western cultures. Kluckhohn and
Strodtbeck (1961) distinguished three types of orientations towards
other people: (a) individualistic (individual goals take primacy over
group goals); (b) collateral (the individual is part of ‘social order
which results from laterally extended relationships’ (p. 18), e.g.,
preference for group consensus, agreement with group norms); and
(c) linear (stresses the ‘continuity of the group through time in

Cross-Cultural Behaviour in Tourism
96
ordered positional succession’ (p. 19), for example, stresses submis-
sion to the elders or superior position).
(a) Individualistic relationships. According to Hofstede (1980),
Western cultures such as the United States emphasize indiv-
idualism in interpersonal relations. People primarily perceive
themselves as individuals rather than as members of a group.
They maximize efforts to achieve personal benefits and enhance
personal status. Social relations are competitive and self-image
is important. People relate to each other informally.
(b) Collateral relationships. Eastern cultures emphasize both collater-
ality and linearity (hierarchical). Collateral (collectivistic) rela-
tionships are characterized by the strong relationship between
an individual and a group. There are studies that support
Hofstede’s (1980) findings and give evidence that collaterality
in interpersonal relations in Eastern cultures is characterized by
smooth interpersonal relations, group harmony, and concern for
the welfare of others. DeMente (1991c) observed traditional
Chinese values, such as politeness, thrift, and saving face, and
reported that causing someone else embarrassment is regarded as
inappropriate behaviour. Lynch (1964), Bulatao (1962), Jocano
(1966) and Hollnsteiner (1963) emphasized the Philippino pattern
of ‘smooth interpersonal relations’, the importance of ‘being
together’, emotional closeness with the family, and friendly rela-
tions outside the family. Komin (1990) emphasized the Thais
patterns of ‘smooth interpersonal relations’: being polite, kind,
pleasant, conflict-free and superficial. Gardiner (1972) found that
Thai people value smiling as an important element in interper-
sonal relations. Forrest (1971) indicated that the Vietnamese
frequently display affection and they are ready for social contact
with strangers.
(c) Linear relationships. There is also evidence that Eastern cultures
employ linearity in interpersonal relations which are character-
ized by hierarchy of society, obedience and loyalty to authority,
feelings of duty, responsibility, submission to the group and
elders, desire to comply, and respectful conduct. Leung (1991)
reported that the prevalent Confucian value teaches modest
behaviour and that the superiority of higher status cannot be
challenged. Earle (1969) indicated that the Chinese scored highly
on the authoritarianism and dogmatism scales. According to
Meade (1970), the Chinese operate with greater cohesiveness of
judgment under authoritarian leadership. Hare and Peabody

Values
97
(1971) noted that Philippinos agreed with both the anti-author-
itarian and authoritarian scales. According to Ettenson and
Wagner (1991), in Chinese culture politeness and deference to
authority are considered to be virtues. Huyton (1991) noted
that one of the aspects of a Confucian value characteristic for
the Chinese people is that of filial piety – giving of unquestioning
respect to parents and the elderly through understanding and
expectations of authority. Forrest (1971) reported the importance
of filial piety, desire to comply and submissiveness to authority in
the Vietnamese culture. Lynch (1970) stressed the importance of
conformity, endurance and deference with regard to the
Philippino ‘smooth interpersonal relations’. Noesjirwan (1970)
found that Asian students in Australia were significantly more
dependent on authority than Australian students. Doi (1981)
emphasized that Eastern countries are more conforming and
that people depend more on each other. According to Yau
(1988), values, which are important for the Chinese are group
orientation, face saving, deference to age and authority, and
connections. Huyton (1991) noted that the needs to maintain
harmony, saving own and others’ face, the needs for prestige
and social respect manifest themselves by a Chinese student
being both unwilling and unhappy to answer questions in public.
According to the Chinese, it is better to perform acts of self-
effacement rather than break the group harmony. Several studies
have noted the importance of external control in Hong Kong
(Hsieh et al., 1969) and in Thailand (Reitz and Graff, 1972).
Importance of harmony
Harmony in interpersonal relations appears to be an extremely important
value in Eastern cultures. The Eastern cultures emphasize self-restrain,
avoidance of negative emotions, criticism, negative opinions, complaints,
and conflict in interpersonal relations. Members of Eastern cultures try to
‘save face’, avoid embarrassment, and maintain harmony in interpersonal
relations (Dodd, 1987). Openly disagreeing or saying ‘no’ is considered
rude and damaging to social harmony (Elashmawi, 1991). Criticizing in
public makes people lose face and damages their relationships with those
who criticize. For instance, in China one confirms a negative statement
with a ‘yes’ (Leung, 1991). The Thai response to criticism, where criticism
is rare and face saving common, was rigidity and withdrawal as opposed to

Cross-Cultural Behaviour in Tourism
98
the American response, which was an increased cognitive flexibility (Foa et
al., 1969). The Easterners’ (Hong Kong, Japan, Thailand, Vietnam)
admission to failure and criticism were limited to protect the individuals
from loss of face; the Westerners’ reaction to failure was an attempt to
improve performance. Gardiner (1968) found that Thai students regarded
‘keeping calm’ and ‘facial expressions’ as the most acceptable expressions
of anger. Forrest (1971) noted that the Vietnamese talked around the
subject. Ellis and Ellis (1989, p. 24) reported that the ‘Japanese place
more emphasis on good human relationships than on money’. Social rela-
tions are seen in Japan as mutual responsibilities and the smallest favours
put the receiver in debt. Huyton (1991) noted that for the people of Hong
Kong harmony in social relations is paramount. In Western societies
interpersonal relationships are seen as creating frictions and these societies
are less concerned with apologies; they value self-esteem. Lynch (1970)
indicated that Philippinos avoided social disruption, embarrassment or
disagreement, which could bring shame. The Philippine and Indonesian
concept of shame is very similar, as well as the Chinese and Japanese
concept of ‘saving face’. However, these concepts appear to be in contrast
with the Western emphasis on truthfulness or forthrightness.
Importance of apology
In order to maintain social harmony, people in many Asian cultures
frequently apologize. The apologetic and humble attitude is regarded
as a sign of good behaviour in Asian cultures. Wagatsuma and Rosett
(1986) noted that the Japanese apologized by acknowledging their fault
even when the other party was at fault, in order to indicate their will to
maintain or restore relations. On the other hand, Americans blamed
others even when they knew they were at fault. Coulmas (1981) reported
that the Japanese tend to apologize if repayment is not possible. The
Japanese are sensitive to fulfilling their social obligations and are con-
cerned with apologies for not meeting their obligations. Barnlund and
Yoshioka (1990) noted that the Japanese offered compensation for the
other person in order to maintain harmony in relations. Americans, on
the other hand, gave explanations and justified their acts.
Stewart’s cultural patterns
According to Stewart (1971), a culture’s underlying patterns consists of
orientations to activity, social relations, the self, and world.

Values
99
Activity orientationThis orientation is similar to Kluckhohn and Strodtbeck’s (1961) activity
orientation and differentiates between cultures on a basis of how people
view human activities and how they express themselves through activities
(doing/being/becoming). Doing cultures value action and ‘getting
things done’; people seek change and want to control their lives
(Euroamericans). Being cultures focus on non-action (African-
American, Greek); people believe that all events are determined by fate
(Hindus from India). Becoming cultures see human beings as evolving
and changing (Native Americans, South Americans).
According to Lustig and Koester (1993), the activity orientation
determines the pace of people’s life. ‘Doing cultures’ are governed by
time schedules and appointments, and are characterized by a fast pace
of life. ‘Being’ and ‘becoming’ cultures are characterized by a slower
and more relaxed pace of life. The activity orientation also determines
how people measure their own success. In ‘doing’ cultures people set the
goals for their activities and evaluate the results of their activities by
measurable criteria. In ‘being’ and ‘becoming’ cultures the process
rather than final result is more important. Further, the activity orienta-
tion influences the relationship between work and play. In ‘doing’ cul-
tures work is separated from play. Employees are supervised and
controlled. In ‘being’ and ‘becoming’ cultures work is a means to an
end and there is no clear distinction between work and play. Employees
mix together and socialize. Moreover, ‘doing’ cultures challenge and
solve a problem when a difficulty occurs. ‘Being’ and ‘becoming ‘ cul-
tures accept the difficulty rather than challenge and eliminate it.
Further, in ‘doing’ cultures interpersonal interaction and communica-
tion are characterized by accomplishing specific tasks and solving pro-
blems. In ‘being’ and ‘becoming’ cultures social interactions are
characterized by being together.
Social relations orientationThis orientation shows similarity to Parson’s (1951) self-and-group orien-
tation and Kluckhohn and Strodtbeck’s (1961) individualistic-collateral
and linear relationships. It differentiates cultures on a basis of how people
relate to one another (formal/informal; egalitarian/hierarchical; direct/
indirect). In formal cultures people follow rules of social etiquette and
address others in an official way by using appropriate titles (Japan,
Germany). In informal cultures social relations are based on equality
and informal ways of interacting and communicating (US, Australia).

Cross-Cultural Behaviour in Tourism
100
In egalitarian cultures (European and US American) emphasis is on
equality and evenness in interpersonal relationships. In hierarchical cul-
tures such as South Korea, Japan or Mexico emphasis is on status differ-
ences between individuals. Also, in egalitarian cultures focus is on
independence and a minimum number of obligations and responsibilities
(US, Australia, Britain); in hierarchical cultures focus is on obligations
and dependence (Japan, China). The degree of dependency in hierarchical
cultures depends on the social status and formality that exist between
individuals. In direct cultures members emphasize directness and open-
ness in interpersonal interactions and communication (Europe, US). In
indirect cultures an emphasis is on indirectness, ambiquity and the use of
third parties and intermediaries (Japan, Korea, Thailand, China, Africa)
(Lustig and Koester, 1993).
Self-orientationThis orientation, similar to Parson’s (1951) self-orientation and
Kluckhohn and Strodtbeck’s (1961) individualism-collectivism orienta-
tion, differentiates between cultures depending on how people view
themselves, form their identities, whether their nature is changeable,
what motivates their actions and who is valued and respected (self/
group orientation). In self-oriented US and Europe the emphasis is on
individual self, children are encouraged to make their own decisions and
be independent from an yearly age. People seek innovation and change.
Alternatively, in group-oriented Asian cultures people define themselves
through their relationships with others. An individual cannot exist with-
out the group. People depend on each other at work, school and at
home. Members of the group are motivated by loyalty to a group,
duties and responsibilities (e.g., family, company). They also seek advice
from elders who have valuable life experience and are a source of
knowledge.
World orientationThis orientation differentiates between cultures on the basis of how peo-
ple relate to the spiritual world and nature (subjugation/harmony/con-
trol). Europeans, US Americans and Canadians believe in the power of
an individual to control, manipulate and change nature. They also believe
in separate physical and spiritual worlds. Reality is what can be tested
and proved, as opposed to spirituality. On the other hand, Latino cul-
tures believe that humans have very little power to control the forces of
nature and, thus, are subjugated to nature. They also place a great value
on spirituality. According to Stewart (1971), the world orientation deter-

Values
101
mines the way people view time. For example, US Americans and
Europeans are future oriented, Native Americans and Latinos are
present-oriented.
Hall’s cultural differentiation
Hall differentiated cultures on the basis of different styles of communica-
tion (Hall, 1976) and orientation toward the world and people (Hall,
1960, 1966, 1973; Hall and Hall, 1987). In terms of communication
style he distinguished between cultures on the basis of the context the
communication takes place (low/high context), handling personal space
(public/private), information flow (covert/overt messages), and language
(low/high context). In terms of the orientation toward the world and
people, Hall distinguished between cultures on the basis of orientation
toward human nature (agreements), activity (monochronic/polychronic),
human relationships (amount of space, possessions, friendships,
communication) and time (past/future, monochronic/polychronic).
Communication
ContextHall (1976) distinguished between the low-context cultures (LCC) and
high-context cultures (HCC) depending on the level of information
included in a communication message. In the low-context cultures
most of the information is contained in verbal messages, very little in
the contextual message (Hall, 1983; Ting-Tomey, 1985). Messages have
clear meanings. There is a tendency to emphasize line logic, explicit
direct verbal communication and clear intentions. Hofstede (1980) indi-
cated that Western cultures (Germany, Sweden, Switzerland, Australia,
USA, France) belong to LCC where there is a need for explicit instruc-
tions, signs, and procedures that explain how to behave. In the high-
context cultures (China, Japan, Korea, Taiwan, Vietnam, Latin
America, Mexico) very little information is coded in the verbal message
as most information is coded in the non-verbal, contextual message. All
events can be understood only in context, meanings can vary depending
upon circumstances, situations can change. There is a tendency to
emphasize spiral logic, implicit, imprecise indirect non-verbal commu-
nication, non-clear intentions, discretion in expressing own opinions
(Ting-Toomey, 1991), and use of an indirect communications system
(Hall, 1976; Gudykunst et al., 1988b). Since the HCC value face saving,

Cross-Cultural Behaviour in Tourism
102
honour shame and obligations that reflect status, position and power,
they avoid confrontations in groups, and use smoothing strategies to
manage conflicts in interpersonal relations (Kim and Gudykunst, 1988).
Members of HCC are also more cautious in initial interactions and
have a greater tendency to make assumptions based upon a stranger’s
cultural background. They also ask more questions (Gudykunst,
1983b). However, direct questions are considered by Asians to be
rude (Elashmawi, 1991). The Japanese, Chinese, Southeast Asians,
Indonesians, Micronesians, and Indians belong to HCC that expect
others to sense the rules of behaviour (Dodd, 1987).
Information flowCultures have been distinguished on a basis of the structure and speed of
messages between individuals. Members of high-context cultures use cov-
ert messages that are high in context. The focus is on non-verbal codes
and implied meanings. People know the meanings of particular messages
in specific situations and they do not need to be explicit. Little is left for
interpretation. In low-context culture, members use overt messages that
are low in context. People need explicit messages, which include clear
instructions to convey exact meanings. Precise verbal codes and words
are used to transmit the meanings.
LanguageLanguage determines what is said and how it is said. This can be
observed in appropriate subjects of discussion (family, politics, religion)
and the degree of expressiveness. In high-context cultures being direct
and open, using many verbal codes, expressing emotions or showing
feelings may be considered as a sign of immaturity. Silence and reserved
reactions are necessary to maintain social harmony and not to threaten
the face or self-esteem of others. In low-context cultures it is acceptable to
express anger, show excitement, and be noisy and confident.
SpaceHall distinguished cultures depending on the ways people communicate
through handling of personal space. In public space cultures people are
suspicious of activities conducted in secret, social closeness is encouraged
and public meetings are valued. In private space cultures members respect
personal ownership, value privacy, and keep social distance.

Values
103
Orientation toward the world and people
Human natureIn high-context cultures agreements between members tend to be spoken
rather than written. Written contracts are not binding and can be
changed depending on the situation. In low-context cultures agreements
tend to be written rather than spoken. Written agreements are final and
legally binding.
Human relationshipsAmount of space. According to Hall (1966), people differ in their use of
space and interact within four spatial zones or distance ranges: intimate
(for loving, comforting, protecting or fighting), personal (for conversa-
tions with intimates, friends), social (for impersonal and social gather-
ings) and public (for lectures, speeches, concerts, ceremonies, plays). By
following the rules of space people know how far to remain from others
in different social situations without interrupting conversations and
jeopardizing privacy. Space distances are culture-specific. People from
colder climates (Germany, Scandinavia, England) use larger physical dis-
tance when they communicate. They expect others to keep their distances.
People from warm weather climates (Italy, Greece, Spain, Africa) prefer
close distances.
Possessions. In various cultures people differ in their motivations.
Achieving an external success in the form of possessions, positions and
power motivates individualists. Collectivists are motivated by a respon-
sibility and duty to a group, loyalty, and social harmony.
In-groups and out-groups. In high context cultures there is a strong
emphasis on in-groups and a clear distinction between those who belong
to a group (in-groups, insiders), e.g., families, friends, neighbours, work
groups and those who don’t (out-groups, outsiders), e.g., non-members,
clan, organizations, and foreigners. Individuals identify themselves with
only a few groups, with which they have strong bonds (Japan, Korea,
China). In high context cultures people know how they should act
according to rules and situations and what to expect from the behaviour
of others. This is in contrast to the low-context cultures, where the
emphasis is on out-groups (US, Europe); people typically belong to
many groups through lifetimes. Membership in these groups is tempor-
ary; people change groups (e.g., change jobs and companies).

Cross-Cultural Behaviour in Tourism
104
Friendship. In high context-cultures relationships are relatively long
lasting, based on the individual’s commitment to each other, loyalty,
trust, and obligations. In low-context cultures relationships are relatively
shorter in duration and more casual, the bonds between people are fra-
gile, and the extent of involvement to long-term relationship is low. Deep
personal involvement with others is valued less.
Authority. In high-context cultures people are personally responsible
for the actions of subordinates. In low-context cultures authority is
diffused and personal responsibility is difficult to determine.
Relation to timeCultural attitudes to time differ in the relative importance attached to
past and future. Americans are not concerned about the past, which is
relatively unimportant when compared to the future. In contrast, in
Europe and Asia people have a long history and deeply rooted traditions,
thus they pay attention to the past and follow traditions. In high-context
cultures time is viewed as open, less structured, more responsive to the
needs of people and less to external goals. In low-context cultures time is
highly organized in order to be able to live and work with others.
Assumptions about time indicate cultural differences in perceiving
time. Similarly to Kluckhohn and Strodtbeck (1961), Hall (1983) also
acknowledged the importance of time in differentiating cultures.
According to Hall (1983), monochronic cultures such as Anglo-Saxon
(US, Canada, Australia, Britain) and northern European cultures
(Sweden, Norway, Finland, Germany) are task, time schedules and pro-
cedures oriented. Time is seen as limited, treated as money and regarded
as a finite resource, which can be spent, saved, borrowed, lost or even
killed. Activities are synchronized with a watch and can be stopped
because ‘time is up’ (Gudykunst and Kim, 1997). Human relations are
time dependent, and compartmentalize their time and activities. Time is
used in a structured, sequential and linear fashion. There is a concern
about punctuality, time, and appointments schedules. On the other hand,
polychronic cultures such as southern Europe (Spain, Italy, Portugal),
and the Middle East experience time as unlimited and expandable.
People are human relations and family oriented. Human relations are
not time dependent. Being late and interruptions are excusable for the
sake of the relationship. Punctuality is not as important, focus is on task
completion rather than adherence to time schedules. Time can be sacri-
ficed (Latin America, Arab states). Thus, the polychronic cultures are

Values
105
more effective for building relationships and solving human problems
(Schein, 1992). Further, Asian cultures believe in a cyclical concept of
time as phases, rather than circular in form. One season follows the next;
one life leads into another (Sithi-Amnuai, 1968).
Relation to activityTime orientation also influences attitudes to activities and change. In
high-context cultures people are cautious of change. In low-context cul-
tures people desire change, they live faster and change their cultural
behaviour faster. For example, US Americans tend to view change as
good and desirable, they constantly search for new and better ways of
doing things. Europeans may view change as risky since it can threaten
traditions. In Asia change may be seen as dangerous since it brings
uncertainty that needs to be avoided (Schneider and Barsoux, 1997). In
monochronic cultures only ‘one thing can be done at a time’. In poly-
chronic cultures people engage in several activities at the same time
because time is expandable.
Hofstede’s dimensions of cultural variability
Hofstede (1980, 2001) distinguished between cultures by analysing work-
related value orientations in different countries. There is empirical evi-
dence of cultural differences between societies as related to Hofstede’s
(1980, 2001) dimensions of cultural variability. These dimensions reflect
value differences that influence interpersonal interactions.
Power Distance. The Power Distance (PD) dimension refers to the
extent to which a society accepts the unequal distribution of power in
institutions and organizations. Hofstede (2001) reported that in the high
PD cultures (Malaysia, Guatemala, Panama, Philippines, Mexico,
Venezuela, Arab countries, Ecuador, Indonesia, India) societies hold
that people are not equal but that everyone has a rightful place.
Societies value obedience, conformity, authority, supervision, and co-
operation; there is a social hierarchy and inequality. In low PD cultures
(Austria, Israel, Denmark, New Zealand, Ireland, Sweden, Norway,
Finland, Switzerland, Great Britain) societies hold that inequality should
be minimized. They value independence, personality, and consultancy
instead of autocratic decision-making; there is a strong ethic of competi-
tion. It was found that members of low PD cultures respect equality as
antecedents to freedom, while members of high PD cultures view servi-

Cross-Cultural Behaviour in Tourism
106
tude and money as antecedents to freedom (Triandis, 1972). Australia,
United States and Canada scored relatively low on the PD scale.
Uncertainty Avoidance. The Uncertainty Avoidance (UA) dimension
refers to the extent to which a society feels threatened by uncertain and
ambiguous situations and tries to avoid them. In the high UA cultures
(Greece, Portugal, Guatemala, Uruguay, Belgium, Salvador, Japan,
Yugoslavia, Peru, Spain) societies feel that uncertainty in life is a threat
that must be fought. Therefore, they try to avoid uncertainty and ambi-
guity by avoiding conflict, disapproving competition, not tolerating devi-
ant behaviours and ideas that are considered dangerous, providing
greater stability with little risk. A high level of anxiety, aggressiveness,
emotional restraint, loyalty, consensus, and group decisions characterizes
societies. People believe in absolute truths, knowledge and the attainment
of expertise. They emphasize a need for hard work; they are achievement
motivated, and desire law and order. They have a strong need for written
rules, are nationalistic, suspicious toward foreigners, conservatist, and
concerned with security in life. They are pessimistic about the future.
Japan scored the highest among all Asian countries on the UA
dimension. This indicates that the Japanese avoid ambiguous and
uncertain situations (Gudykunst et al., 1988a). In the low UA cultures
(Singapore, Jamaica, Denmark, Sweden, Hong Kong, Ireland, Great
Britain, Malaysia, India, Philippines) societies tolerate ambiguity and
uncertainty, take more risk, accept deviant behaviours, and do not find
new ideas threatening. People are less stressed. Societies focus on
advancement, individualism, and competition. There are as few rules as
possible. Societies believe not so much in expertise as in common sense.
Conflict is natural. People are optimistic about the future and accept
foreigners with different ideas. However, the degree of uncertainty avoid-
ance varies in collectivistic cultures (Kim and Gudykunst, 1988).
Australia, United States and Canada scored relatively low on the UA
dimension.
Individualism/Collectivism. The Individualism/Collectivism (I/C)
dimension refers to the extent to which people emphasize their own
needs. In the highly individualistic cultures (United States, Australia,
Great Britain, Canada, Netherlands, New Zealand, Italy, Belgium,
Denmark, Sweden) societies emphasize individual goals, concerns, rights,
needs, self-actualization and development. Importance is attached to
freedom, challenge, autonomy, initiative, individual decisions, activity,
achievement, own opinion, pleasure, and financial security. People are

Values
107
self-oriented and emphasize the right to private life and opinion. The
social ties are loose. In highly collectivistic cultures (Guatemala,
Ecuador, Panama, Venezuela, Colombia, Indonesia, Pakistan, Costa
Rica, Peru, Taiwan) societies emphasize group goals, rights, needs, deci-
sions, consensus, and cooperation. Individual initiative is discouraged
and people are ‘we’ oriented. The social and family ties are tight. There
is a distinction between in-groups and out-groups. The in-group members
are expected to look after the other members, in exchange for absolute
loyalty. Friendships are predetermined by long, stable relationships.
Hofstede (1980) found that East Asian countries are particularly high
on collectivism and English-speaking countries are particularly high on
individualism.
Triandis (1995) argued that individualistic and collectivistic cultures
could differ according to whether relations among people in the culture
are horizontal or vertical. In horizontal cultures people are treated
equally, and there is an emphasis on valuing equality. In vertical cultures
people see themselves as different from others, and equality is not valued
highly. Also, in horizontal collectivistic cultures little value is placed on
freedom and members of those cultures are not expected to stand out
(e.g., Japan). In vertical collectivistic cultures (e.g., India) individuals are
expected to fit into the group and at the same time they are allowed and
expected to stand out in the group. In vertical, individualistic cultures
(e.g., the United States, Britain, France, Germany) people are expected to
act as individuals and stand out from others. In horizontal, individualis-
tic cultures (e.g., Sweden, Norway) people are expected to act as indivi-
duals, and at the same time, not stand out from others.
Masculinity/Femininity. The Masculinity/Femininity (M/F) dimen-
sion refers to the extent to which a culture values masculine behaviours
such as assertiveness, acquisition of money and material possessions, and
lack of care for others and the quality of life. In the highly masculine
cultures (Japan, Austria, Venezuela, Italy, Switzerland, Mexico, Ireland,
Jamaica, Great Britain, Germany) societies are money and possessions
oriented. Emphasis is on performance, growth, ambition, independence,
living to work, successful achievement, excellence, dominance, and asser-
tiveness. People accept the company’s interference in their private lives.
There is high job stress; sex roles are differentiated and unequal. Japan
scored the highest on the masculinity index, 95/100 among all Asian
countries. In the high feminine cultures (Sweden, Norway, Netherlands,
Denmark, Costa Rica, Yugoslavia, Finland, Chile, Portugal, Thailand)

Cross-Cultural Behaviour in Tourism
108
societies are people oriented. The emphasis is on quality of life, welfare of
others, and sympathy for the unsuccessful. Sex roles are equal. Australia
and United States scored relatively high on the masculinity index,
Canada scored between high and low.
Table 3.2 presents a ranking of fifty-three countries on Hofstede’s
(2001) four value dimensions.
Table 3.2 Ranking of fifty-three countries on Hofstede’s (2001) four value
dimensions
Country Power distance Uncertainty
avoidance
Individualism Masculinity
Arab countries 7 27 26/27 23
Argentina 35/36 10/15 22/23 20/21
Australia 41 37 2 16
Austria 53 24/25 18 2
Belgium 20 5/6 8 22
Brazil 14 21/22 26/27 27
Canada 39 41/42 4/5 24
Chile 24/25 10/15 38 46
Colombia 17 20 49 11/12
Costa Rica 42/44 10/15 46 48/49
Denmark 51 51 9 50
East Africa 21/23 36 33/35 39
Ecuador 8/9 28 52 13/14
Finland 46 31/32 17 47
France 15/16 10/15 10/11 35/36
Germany 42/44 29 15 9/10
Great Britain 42/44 47/48 3 9/10
Greece 27/28 1 30 18/19
Guatemala 2/3 3 53 43
Hong Kong 15/16 49/50 37 18/19
India 10/11 45 21 20/21
Indonesia 8/9 41/42 47/48 30/31
Iran 29/30 31/32 24 35/36
Ireland 49 47/48 12 7/8
Israel 52 19 19 29
Italy 34 23 7 4/5
Jamaica 37 52 25 7/8
Japan 33 7 22/23 1
Malaysia 1 46 36 25/26

Values
109
Weaknesses of Hofstede’s theory
The Hofstede’s (1980) theory of cultural differentiation has been often
criticized for: (a) assuming that a national territory corresponds with a
cultural group (many countries include a range of culture groups); (b)
data being collected in a single industry (computer industry) and a single
multinational corporation; (c) data not being representative of other
members of the cultures; (d) the questionable validity of the items used
to construct the indices; (e) the western bias because of the methodology
used in collecting the data; and (f) not being exhaustive.
Strengths of Hofstede’s theory
Although the Hofstede’s (1980) study has been criticized, his four cultural
dimensions embraced major cultural values and made comparisons
Mexico 5/6 18 32 6
Netherlands 40 35 4/5 51
New Zealand 50 39/40 6 17
Norway 47/48 38 13 52
Pakistan 32 24/25 47/48 25/26
Panama 2/3 10/15 51 34
Peru 21/23 9 45 37/38
Philippines 4 44 31 11/12
Portugal 24/25 2 33/35 45
Salvador 18/19 5/6 42 40
Singapore 13 53 39/41 28
South Africa 35/36 39/40 16 13/14
South Korea 27/28 16/17 43 41
Spain 31 10/15 20 37/38
Sweden 47/48 49/50 10/11 53
Switzerland 45 33 14 4/5
Taiwan 29/30 26 44 32/33
Thailand 21/23 30 39/41 44
Turkey 18/19 16/17 28 32/33
Uruguay 26 4 29 42
USA 38 43 1 15
Venezuela 5/6 21/22 50 3
West Africa 10/11 34 39/41 30/31
Yugoslavia 12 8 33/35 48/49
Source: Hofstede, G. (2001) Culture’s Consequences: Comparing Values, Behaviors,
Institutions and Organisations Across Nations. 2nd ed. London: Sage Publications.
Note: A low ranking (e.g. 3) indicates a high rating on that dimension.

Cross-Cultural Behaviour in Tourism
110
between national cultures possible (Mead, 1998). Hofstede’s cultural
dimensions gained acceptance as distinguishing cultural groups according
to differences in cultural values. Hofstede’s (1980) cultural dimensions
were related to various concepts, e.g., the power distance dimension was
related to the concepts of freedom, power, respect, and wealth in
Triandis’ (1972) study. Evidence suggests that Hofstede’s (1980) cultural
dimensions are applicable not only to work-related values but to cultural
values generally (Forgas and Bond, 1985; Hofstede and Bond, 1984) and
are cross-culturally universal. Most importantly, Hofstede’s (1980) study
has been replicated more than 60 times (Sondergaard (1994) and the
results confirmed on different samples. Thus, Hofstede’s (1980) method
has proved to have considerable life (Mead, 1998).
Studies based on Hofstede’s cultural dimensions
Many studies have been done on cross-cultural differences based on
Hofstede’s (1980) cultural dimensions. Hofstede’s (1980) dimensions
are very useful in explaining the cross-cultural differences in interpersonal
interactions. The differences between British, Hong Kong, Malaysian,
and Indonesian cultures have been researched (Wright et al., 1978;
Wright and Phillips, 1980). The four cultures scored similarly on
Hofstede’s (1980) UA and M/F; and differently on the PD and I/C
dimensions. The Asian cultures differed on power distance. These find-
ings were supported by Hofstede (1980) who also indicated differences in
the PD and I/C dimensions in Hong Kong Chinese and other Asian
cultures. Some studies indicated differences in PD and I/C in the
Chinese and Australian cultures (Hofstede, 1980; Kroger et al., 1979).
Chinese culture was characterized by high power distance and authority
differences with strong collectivist social structure, accepting inequality,
solidarity, and group orientation. The Australian culture was character-
ized by small power distance and strong individualism, low tolerance of
inequality and authority, loose social networks, and weak sense of social
obligations. The Chinese also seemed to emphasize social values in
human interactions, while Australians favoured competitiveness and
individualism. Hsu (1971a) showed that in the Chinese culture individu-
alistic behaviour is regarded to be at the expense of others, therefore, the
concept of personality does not exist at all. Hsu (1953, 1971b, 1972,
1981) also noted that the Chinese are very socially and psychologically
dependent on others. They give support for parents, tradition, duty,
obligations, acquiring wisdom; they are emotionally restrained, and par-

Values
111
tially socially withdrawn. They are concerned with self-control and social
conformity accompanied by shyness.
Importance of I/C and M/F dimensions
According to studies that analysed the I/C dimension (Kim and
Gudykunst, 1988; Schwartz, 1990; Triandis, 1988), this dimension is
the major dimension that differentiates cultures. The I/C dimension
explains the cross-cultural differences in interaction patterns (Hui and
Triandis, 1986). Its understanding enables us to predict implications for
social interactions (Triandis, 1988). For instance, individualists confront
others, feel responsible for their own success and failures (Hui and
Triandis, 1986), and are concerned only with self-face maintenance
(Kim and Gudykunst, 1988). Therefore, they experience separation and
distance from their in-groups (Hui and Triandis, 1986). Collectivists con-
sider the implications of their own behaviour for others, share material
and non-material resources with others, are controlled by shame, empha-
size harmony in relations with others (Hui and Triandis, 1986), are con-
cerned with both self- and other face maintenance, and also with
reciprocal obligations (Kim and Gudykunst, 1988). Therefore, they
experience closeness with their in-groups.
According to Triandis et al. (1988) and Schwartz (1994), the dimension
of I/C and M/F can explain communication differences between cultures.
Noesjirwan (1978) examined communication in in-group and out-group
relationships and found that Indonesian members of the group could
adapt to the group (collectivism). In Australia the group members are
expected to ‘do their own thing’ even if they must go against the group
(individualism). The literature indicates evidence of cultural differences in
communication between Japanese and Americans (Barnlund, 1989;
Gudykunst and Nishida, 1983; Okabe, 1983). Markus and Kitayama
(1991) argued that cultural variations in individualism and collectivism
are linked to the ways members of cultures see themselves and behave,
e.g., whether they feel as part of social relationship or emphasize the self.
Gudykunst and Ting-Toomey (1988) argued that low- and high-context
communication styles are also a function of individualism-collectivism.
For example, members of individualistic cultures are more emotion and
pleasure oriented, members of collectivistic cultures are more concerned
with avoiding hurting others and imposing on them. Members of indi-
vidualistic cultures use direct requests as the most effective strategy for

Cross-Cultural Behaviour in Tourism
112
accomplishing their goals, while members of collectivistic cultures perceive
direct requests as the least effective strategy (Kim and Wilson, 1994).
Other studies
There are other empirical studies concerning cultural differences in inter-
personal interactions between Eastern and Western societies that use
Hofstede’s (1980) cultural dimensions. It was shown that since interper-
sonal relationships are culture bound (Ting-Toomey, 1991), different
values are placed on interpersonal styles in different cultures (Argyle,
1972). Individualistic cultures are concerned with individualized relation-
ships; collectivistic cultures with group relationships (Hui and Triandis,
1986; Triandis, 1988). A further example, interpersonal relationships in
Japan differ depending on the role of the individual and group interaction
(Damen, 1987). In Japan there is a distinction between the omote (public,
formal) and ura (private, informal) style of interaction (Okabe, 1983).
Argyle (1986) and Argyle et al. (1986) found that in the collectivistic
Japan and Hong Kong cultures maintaining harmonious relations is
highly endorsed. These cultures perceive in-group relationships as more
intimate than individualistic cultures (Gudykunst and Nishida, 1986). In
Japan and Korea human relations are treated as more personal than in
individualistic cultures (Gudykunst et al., 1987). The importance of time
invested in building trustful relationships is crucial to the Japanese
(Elashmawi, 1991).
Cultural differences were found in network patterns (Yum, 1985).
Asians develop close networks and Confucianism provides them with
basic rules for social relationships (Yum, 1985, 1987). Successful relation-
ships begin with the establishment of a personal bond between particip-
ants, and thereafter are based on the careful maintenance of these
personal ties. Personal face-to-face contact is a vital aspect of all relation-
ships in China (DeMente, 1991c).
There are cultural differences in self-presentation (Tu, 1985). In indi-
vidualistic cultures (e.g., Australia) self-presentation is of importance. In
collectivistic cultures (e.g., China, Korea and Japan) self-presentation
depends on the situation.
Cultural differences also exist in self-disclosure. Members of individu-
alistic cultures tend to self-disclose more in intimate topics than members

Values
113
of collectivistic cultures (Ting-Toomey, 1991) and they use open com-
munication systems in relationships. For instance, the Japanese are more
subtle and discrete in managing relationships than Americans or French,
as they put emphasis on group harmony and cohesion (Ting-Toomey,
1991).
Several studies suggest that there are cultural differences in interacting
with strangers and with in-group members (Leung and Bond, 1984;
Triandis, 1972).
There is evidence that cultural differences exist in experiencing emo-
tions (Schrerer et al., 1986) and anxiety. For instance, Asians experience
greater anxiety in interaction with strangers and guilt compared to
Caucasians, regardless of whether they are less assertive or not, because
they emphasize preserving harmony in relationships, particularly in those
that involve conflict and are threats to interpersonal harmony (Zane et
al., 1991).
There is also evidence of cultural differences in the feelings of respons-
ibility for the other people (Argyle, 1972). In individualistic cultures peo-
ple help those who depend on them; in collectivistic cultures helpfulness is
a function of reciprocity (Berkowitz and Friedman, 1967).
The understanding of morality is different. The Koreans emphasize
personal welfare and Americans puritanical morality (Retting and
Pasamanick, 1962). The Chinese show a great moral ethic value and a
strong group orientation (Hsu, 1953).
Cultural groups also differ in accepting compliments. The Japanese are
less likely to accept compliments and complain less often in interactions
than Americans (Barnlund and Araki, 1985).
Perceptions of social interactions are also different in different cultures.
Social interactions in China are perceived in terms of collectivism and
social usefulness as opposed to Western societies that perceive social
interactions in light of competitiveness, self-confidence, and freedom
(Kim and Gudykunst, 1988). Similar interaction episodes also have dif-
ferent meanings for people from different cultures (Kim and Gudykunst,
1988).

Cross-Cultural Behaviour in Tourism
114
Bond’s Confucian cultural patterns
Michael Bond, a Canadian who lived in Asia for twenty-five years, organ-
ized a group of researchers from Hong Kong and Taiwan called the
Chinese Culture Connection (CCC) (1987). The CCC developed a
Chinese Value Survey to overcome a Western bias of the previous studies
developed by scholars from Europe and the United States that measured
cultural values. The instrument was developed on a basis of forty im-
portant Chinese values and was administered to university students
in twenty-three countries around the world. The aim was to test
Hofstede’s (1980) findings and see whether there is any association
between the Hofstede’s and CCC instruments. The CCC found four
dimensions of cultural variability: integration (social stability, tolerance,
harmony with others, non-competitiveness, interpersonal harmony,
group solidarity, intimate friendships), human heartedness (patience,
courtesy, compassion, sense of righteousness, kindness toward others),
moral discipline (restraint, moderation, keeping oneself disinterested and
pure, having few desires, prudence), and Confucian Work Dynamism
(persistence, thriftiness, a sense of shame, status differences, ordering
relationships, reciprocation and protecting face, importance of tradition).
According to Bond (1987), the values of the Confucian work dy-
namism describe patterns that are consistent with the teachings of
Confucius (social order, unequal relationships between people ordered
by status, importance of family, proper social behaviour, education, hard
work, modesty, patience, persistence and perseverance). Four of the
Confucian work dynamism values that are associated positively with
the dimension are: ordering relationships, thrift, persistence, and having
a sense of shame. The CCC argued that these values reflect a hierarchical
dynamism present in Chinese society. Hofstede (2001) argued these and
other values such as adaptability to new circumstances, reciprocation,
education, hard work, importance of the future, and savings characterize
people who have a long-term orientation toward life. The other four
values such as protecting the face of self and others, personal steadiness,
respect for tradition, and reciprocation are negatively associated with the
dimension and reflect distractions to the Confucian work dynamism
(Hofstede, 1991). According to Hofstede (2001), these and other values
such as tolerance, leisure, importance of the past and present, and spend-
ing characterize people who have a short-term orientation toward life. The
six major countries that scored highly on the Confucian values dimension
were China, Hong Kong, Taiwan, Japan, South Korea, and Brazil. The

Values
115
six major countries that scored low on the Confucian values dimension
were Pakistan, Nigeria, Philippines, Canada, Zimbabwe, and Great
Britain (Hofstede, 2001). Australia, the US and Great Britain scored
relatively low on the Confucian values dimension (Hofstede, 2001).
The first three dimensions of CCC corresponded to dimensions of
cultural patterns described by Hofstede (1980). The integration dimen-
sion was closely related to Hofstede’s (1980) individualism-collectivism
and masculinity-femininity dimensions, the human heartedness dimen-
sion was similar to Hofstede’s (1980) masculinity-femininity dimension,
and moral discipline was correlated with Hofstede’s power distance
dimension. Only the Confucian Work Dynamism did not relate to any
of Hofstede’s (1980) four dimensions.
Argyle’s and Triandis’ cultural differentiation
Argyle (1986) differentiated cultures according to the degree of formality
in interpersonal interactions and an acceptable level of physical contact
between people.
FormalityArgyle (1986) and Samovar and Porter (1988) reported that cultures tend
to range from very formal to very informal (e.g., US). The degree of
formality associated with a culture may be recognized by the way in
which people are able to interact with one another. In formal cultures
(Japan, Korea, China, Egypt, Turkey, Iran, Germany) all human beha-
viour, greeting, addressing, dressing, talking, sitting and even eating
reflects their adherence to the strict social rules of behaviour and status
differences. For example, people use formal titles in face-to-face encoun-
ters to identify people and their positions in society. In informal cultures
(US, Australia) little attention is paid to formal rules of behaviour. People
treat each other informally, address directly by first names, dress casually
and do not focus much on hierarchical positions in social structures.
TouchIn contact cultures people touch more, face each other more directly and
stand closer. Western societies belong to contact cultures. In non-contact
cultures people touch less, face each other less directly, and stand further
apart (Argyle and Cook, 1976). Asian cultures are non-contact cultures.
For instance, in Japan people do not look each other in the eye much

Cross-Cultural Behaviour in Tourism
116
(Morsbach, 1973). Toomuch gaze is regarded as disrespectful, threatening,
or insulting by Asians (Argyle and Cook, 1976). However, too little gaze is
interpreted as not paying attention, impolite, insincere, dishonest or shy.
Structural tightnessTriandis (1994) reported that in tight cultures there are many rules and
constraints imposed on social behaviour. In tight cultures the rules and
norms are clear and people are expected to follow them (Pelto, 1968).
Sanctions are imposed on people if they violate the norms and rules of
culture. Japan is an example of a tight culture where one must carry out
‘all the rules of good behavior’ (Benedict (1946), p. 225). In loose cultures
there are few rules and constraints. Rules and norms are vague and
flexible and people are allowed to deviate from them. The sanctions for
violating rules in loose cultures are not as severe as they are in tight
cultures (Pelto, 1968). Thailand is an example of a loose culture where
the behaviour of people lacks discipline and regularity (Phillips, 1965).
Schein’s, Trompenaars’ and Maznevski’s culturaldifferentiation
Schein’s cultural dimensionsSchein (1992) distinguished cultures on the basis of the following
dimensions: Human Nature (evil, good, mixed), Relationship with
Nature (subjugation, harmony, control), Human Activity (doing, being,
being-in-becoming; work, family, personal), Human Relationships (indi-
vidualism, groupism; participation and involvement; role relationships),
Time (planning, development; discretionary time horizons (function,
occupation, rank); temporary symmetry, pacing; past, present, near or
far-future; monochronic, polychronic), Reality and Truth (physical,
social, individual; high/low context; moralism, pragmatism), and Space
(intimacy, personal, social, public; high/low status).
The Nature of Human Nature This dimension defines what it means to
be human and the attributes of human beings, and is similar to the one
of Kluckhohn and Strodtbeck (1961). Western and Asian societies have
very different concepts about self. Asians are less focused on separating
the individual from the group and pay less attention to self-actualiza-
tion, whereas Eastern societies have a strong sense of the individual
and the self (Redding and Martyn-Johns, 1979).
The Nature of Relations with Environment This dimension defines what
is the right thing for human beings to do in relation to the natural en-

Values
117
vironment and is similar to one of Kluckhohn and Strodtbeck’s (1961)
and Stewart’s (1971) dimensions. The environment can be subjugated
and controlled (the Western tradition), harmonized with (the assump-
tion of Oriental religions and societies), or subjugated to nature (the
assumption of South-east Asian societies).
The Nature of Human Activity This defines the appropriate level of
human activity, and also the relationship between work, play, family
and personal concerns, and is similar to one of Kluckhohn and
Strodtbeck’s (1961) and Stewart’s (1971) dimensions.
The Nature of Human Relationships This dimension distinguishes
various assumptions about the right way for people to relate to each
other and distribute power and love. It resembles Parson’s (1951) and
Stewart’s (1971) self- and group-orientation. Kluckhohn and Strodt-
beck (1961) distinguished between individualistic and competitive (US),
collateral and group cooperative (Japan), and linear, hierarchical and
authoritarian (Latin countries) cultures. Hofstede’s (1980) dimensions
of ‘power distance’ identified a related variable. Stewart also referred to
hierarchical relationships. Schein (1992) referred to a number of ways
authority can be used and what level of participation is expected: auto-
crative, paternalistic, consultative or democratic, participative and
power sharing, delegative and abdicative.
The Nature of Time This dimension defines the basic concept of time,
kinds of time and its importance and measurement. According to
Schein (1992), monochronic cultures are characterized by time planning;
people believe that time can be treated as an object and manipulated;
the length of activities can be measured in terms of the time they take
to complete. Polychronic cultures are characterized by development
time; people believe that time cannot be slowed-down or speeded up,
and ‘things will take as long as they will take’. Time is open-ended and
can be extended into the future.
According to Schein (1992), people in different cultures work with
totally different time horizons. They use different measurements of time
in relation to given tasks (annual, monthly, hourly). ‘On time’ or ‘soon’
may mean completely different things depending upon situations. Time
horizons differ by function, occupation and rank. The period of time is
dependent upon the time needed for doing one’s basic job. Time is also
determined by the way activities are paced and the degree to which the
pacing of the activities are similar or symmetric at different occupations,
ranks and levels.

Cross-Cultural Behaviour in Tourism
118
The Nature of Reality and Truth This dimension distinguishes cultures
on a basis of their assumptions about what constitutes reality and
truth. Reality can exist at physical, social and individual levels, and the
assessment of what is real depends on scientific tests, social consensus
or individual experience. The Anglo-Saxon cultures believe that physi-
cal reality or truth is in facts and figures, and can be established only if
logically proven and assessed by scientific tests. Other cultures rely
more on feelings, intuition, and spirituality (Brazil, Asia). They regard
a spiritual world as external reality. Social reality refers to the things
that members of a cultural group agree upon, i.e., group identity, its
values, nature of relationships, the distribution of power, meaning of
life, ideology, religion, and culture itself. Individual reality refers to
what an individual has learned from one’s own experience and believes
to be true. Individual reality may not be shared with anyone else.
Members of moralistic cultures seek truth and validation in a general
philosophy, moral system, religion and tradition; pragmatic cultures
seek truth and validation in own experience, wisdom based on author-
ity, and legal system. Europeans were found to be more moralistic
while Americans tended to be more pragmatic.
The Nature of Space This dimension introduces assumptions about
space, how it is allocated and owned, its meaning and role in relation-
ships, and influence on intimacy and privacy. It resembles Hall’s (1966)
space dimension.
Trompenaars’ cultural dimensionsTrompenaars (1984, 1993) and Hampden-Turner and Trompenaars
(1993) provided a set of parameters to differentiate cultures according
to the relationship to human nature (universalism/particularism), nature
(inner-directed/outer-directed), activity (achievement status/ascription,
analysing specifics/integrating wholes), human relationships (individual-
ism/communitarianism, equality/hierarchy, affective/neutral), and time
(sequence/synchronization, past/present/future). The universalism versus
particularism orientation to human nature is similar to Parson’s (1951)
universalism/particularism dimension. The achieved status versus ascribed
orientation towards activity is similar to Parson’s (1951) achievement ver-
sus ascription dimension. The analysed specifics versus integrated wholes
resembles Parson’s (1951) diffuseness versus specificity dimension.
Individualism and communitarianism orientation towards human relation-ships This dimension is similar to Parson’s (1951) self- and group-
orientation, Kluckhohn and Strodtbeck’s (1961) individualistic versus

Values
119
collateral and linear dimensions, Stewart’s (1971) egalitarian versus
hierarchical relations and self- and group-orientation, Hofstede’s (1980)
individualism and collectivism, and Schein’s (1992) individualism and
groupism dimensions.
Inner-directed versus outer-directed orientation to nature This dimen-
sion differentiates between those who are inner-directed, use internal
motives to guide their behaviour and believe they can and should con-
trol nature (US, Britain, Canada), and those who are outer-directed,
use external motives to direct their behaviour and go along with nature
(Hong Kong, Japan, Korea, China).
Equality versus hierarchy orientation towards human relationships This
dimension differentiates between those who focus on equality (US,
Canada, Netherlands, Sweden, UK) and those who base their decisions
on the basis of authority to judge and elicit from others the best they
have to give (Pakistan, Hong Kong, Indonesia, Thailand, Turkey).
Time as sequence versus time as synchronization This dimension shows
the differences between those for whom it is important to plan, do
things fast in a sequential manner, and in-time (US, English-speaking
countries) and those who synchronize all efforts to get things done, do
many things simultaneously, treat time as elastic and use the past to
advance the future (China).
Maznevski’s cultural dimensionsMaznevski (1994) used a modified version of Kluckhohn and Strodtbeck’s
(1961) Value Orientations Instrument to distinguish cultures on a basis of
orientation toward: Human nature (good/evil, changeable), Nature (sub-
jugation/mastery/harmony), Activity (doing/being, containing and con-
trolling), and Human relationships (individual/collective, hierarchical).
Schneider and Barsoux’s cultural assumptions
Schneider and Barsoux (1997) organized cultural assumptions according
to ‘relationships with the environment’, which include assumptions
regarding control and uncertainty, the nature of human activity, and
the nature of truth and reality (external adaptation), and ‘relationships
among people’. These include assumptions regarding the importance of
relationships over task achievement, relationships with superiors and
subordinates (hierarchy), and relationships with peers (individualism
and collectivism) (internal adaptation). The assumptions, which relate

Cross-Cultural Behaviour in Tourism
120
to both relationships with nature as well as relationships with people, are
those regarding time, space, and language (see Table 3.3).
Asian cultures and values
Japanese cultural characteristicsThe review of popular literature revealed that much has been written on
Japanese culture and values (Argyle, 1975; Agrusa, 1998; Befu, 1980;
Benedict, 1946, 1974; Doi, 1971, 1973a, 1973b; Fontaine and Severance,
1990; Graburn, 1983; Hendry, 1987; Izard, 1969; Lebra, 1976; Lundberg,
1990; Moeran, 1983, 1984; Morsbach, 1981; Nakane, 1973; Neustupny,
1987; Ramsey, 1984; Vogel, 1965; Zimmerman, 1985). It is agreed that
there are cultural differences between Japanese and Western societies in:
& cultural motivations& morality& displaying emotions& courtesy& shame& humility& non-verbal communication& gift giving& correct protocol of presentation
& meanings of concepts such as duty
(giri) and face (kao)& sense of obligation& loyalty to others (gimur)& situational interaction& rituals& attitudes to strangers& importance of status
Table 3.3 Schneider and Barsoux’s (1997) cultural assumptions
External adaptation Internal adaptation Linking assumptions
Relationship with nature Human nature Space
Control Good versus evil Personal and physical
Uncertainty avoidance
Nature of human activity
Doing versus being
Achievement versus
ascription
Nature of human
relationships
Social versus task
orientation
Particularism/
universalism
Hierarchical
Individualism/
collectivism
Language
High-low context
Nature of reality and
truth
Time
Monochronic/
polychronic
Past, present, future

Values
121
It was reported that the Japanese value peacefulness, passivity, collec-
tivism, reciprocal obligation, and hierarchical structure (Isomura et al.,
1987). They are expected to conform and cooperate with one another, to
avoid conflict and competition. They emphasize harmony and their beha-
viour is formal to reduce conflict and embarrassment. Japanese subordi-
nate individual interests to group goals and remain loyal to the group
(Moeran, 1984). Seishin spirit teaches them order, individual sacrifice,
self-discipline, dedication, hierarchy, loyalty, devotion, discipline, respon-
sibility, goodwill, group activity, be ‘beautiful’ for themselves and others,
disregard for material disadvantages (Moeran, 1984). It stresses the
importance of duty (giri), indebtedness (on) and obligation (Lebra,
1976). Buddhism teaches the Japanese to be integrated with nature,
that a stranger is not an enemy but a friend, and the aim is to reach
consensus and compromise (Schinzinger, 1983).
Confucianism and Buddhism prescribe collectivism, a hierarchical
structure of authority, status, and obedience of superiors (Chinese,
Japanese, Korean and Indo-Chinese). Differences in status influence the
differences in non-verbal behaviour (Matsumoto and Kudoh, 1987). The
importance of status was explained in terms of high scores on power dis-
tance and masculinity, and low scores on individualism. Benedict (1946),
Lebra (1976) and Nakane (1973) described Japanese culture as collectivis-
tic emphasizing conformity, belongingness, empathy and dependence,
however, with the tendency tomore individualistic attitudes, and achieving
individual goals and profits. Triandis (1972) reported that the Japanese
value courage, sense of justice, love, companionship, trust, friendship, and
are concerned with war and peace. Laughter is not only associated with
funny events but also satisfaction and happiness. Responsibility, achieve-
ment, aesthetic and general satisfaction are emphasized, and to lie is crim-
inal. Rules are desired and success depends upon thinking, learning,
research, cooperation, high motivation, and will power. Comfort is not
valued, as opposed to self-adjustment, advancement, and serenity.
However, Frager (1970) reported a high degree of anticonformity
among the Japanese (inability to adapt) that correlated with a measure
of alienation. Mouer and Sugimoto (1979) indicated that the Japanese are
group oriented, emphasize harmony in interpersonal relations, solidarity,
loyalty, belongingness to society, an informal level of socialization, and
that society is closed to outsiders. Kracht and Morsbach (1981) reported
reciprocal dependency, passivity in being loved, cooperation and con-
formity, suppression of open conflict and competition, formal behaviour,

Cross-Cultural Behaviour in Tourism
122
harmonious relationships, support for group welfare, perceptions of
Westerners as ‘odd’ people due to their focus on individualism, differen-
tiation between what people say and actually do, between tatemae (out-
side behaviour) and honne (real intentions), between formal and informal
behaviour, dependence of attitudes and behaviour in situations.
Japanese touristsMuch has been written on Japanese tourists (Kennedy, 1988; Leiper, 1985,
1987; Lethlean, 1988; Maurer, 1988; McArthur, 1988; McGee, 1988a,
1988b; McGown et al., 1988; Moeran, 1983; Morris, 1988; Polunin,
1989; Reisinger, 1992a; Reisinger and Turner, 1999a, 2000, 2002c;
Reisinger and Waryszak, 1994a,b,c, 1996; Warner, 1986; Watson, 1986).
For instance, Ziff-Levine (1990) noted that the Japanese evaluate new ideas
(e.g., product/service) by giving consideration to the effect on others and
relations with them. He emphasized that Japanese tourists are not leisure
oriented but activity-oriented unlike the Western tourists who travel to do
nothing on their holidays. He reported the importance of shopping to the
Japanese tourists while on a vacation, obligatory gift giving, polite
inexplicitness motivated by not wanting to humiliate, offend or disturb
the harmony of the group. He stressed the importance of trust and rela-
tionship building. Reisinger (1990) noted the importance of the service
providers’ attributes to the Japanese tourists in Australia. Unfortunately,
no empirical evidence about the Japanese tourist values system was found.
Other Asian cultures and values
Past studies also indicate that there is some work done on Korean values
(Kim, Q. Y., 1988). For instance, Koreans believe in inequality among
people based on virtue, loyalty to authority, filial piety to parents, and
sincerity to friends. The fundamental value is secular personalism – a
commitment to personal relations (Kim, Q. Y., 1988). There is little
evidence for individualism (Bellah, 1970). Thai values were also described
and the nine major Thai values are: the ego, grateful relationships,
smooth interpersonal relationships, flexibility and adjustment, religion-
psychical orientation, education and competence, interdependence, fun
and pleasure, achievement-task orientation (Komin, 1990). There is work
done on the expression of anger among Thais (Gardiner, 1968). There is
research on Vietnamese values (Iwao, 1986; Redick and Wood, 1982;
Truny, 1988); Chinese values (Bond and Wang, 1983; Craig, 1979;
Eberhard, 1971; Hsu, 1981; Redick and Wood, 1982; Shenkar and

Values
123
Ronen, 1987); and Singapore Malay and Indian values (Craig, 1979). A
number of values have been found that are common to all Asian cultures:
respect for elders, parents, ancestors, importance of the family as a source
of personal self-worth, a sense of obligation and shame, harmony, face-
saving, consensus, cooperation, ambiguity and silence, indirectness and
respect for tradition, differentiation between in-groups and out-groups,
loyalty to a group, hierarchy contrasts, emotional restraint (Dodd, 1995),
patience, avoiding strong emotions, having connections, self-respect, and
reputation (Tung, 1996).
US and European cultures and values
The United StatesSeven major values that guide behaviour of a majority of people in the
United States were identified by Vander Zanden (1965).
1. Materialism: people are consumption oriented and evaluate things
in material and monetary terms. They often judge people by their
material possessions (Samovar et al., 1998).
2. Success: people believe in another chance, achievement and goals
attainment. They believe that all people have a right to succeed in
life and be materially well off. They are very competitive and assert-
ive and they always rank, grade, classify and evaluate to know if they
are the best (Samovar et al., 1998). McClelland (1976) noted that
Americans have a high need for achievement and want to excel.
3. Work and activity: people are motivated by work values and believe
in ‘doing’ things; people are valued as long as they work. In con-
versation among Americans one has to know what the other does for
a living. Work is a means for recognition, money, and power.
Activities and performance determine self-identity and self-worth
(Samovar et al., 1998).
4. Progress: people place great importance on progress and change
representing the major tool for improving and understanding life.
They desire ‘the new’ and ‘the best’. Americans are optimistic and
focus on the future rather than present and the past because the
future is ‘bigger and brighter’. Americans are confident, take new
chances, and explore new possibilities (Samovar et al., 1998).
5. Rationality: people believe in the rational approach to life and that
humans should act on the basis of reasons; they search for reasons,
and more efficient and effective ways of doing things. Everything is
possible to accomplish when scientists, researchers and inventors get

Cross-Cultural Behaviour in Tourism
124
together. Scientific methods allow people to predict and control life
(Samovar et al., 1998).
6. Democracy: there is a belief that all people are equal and all have a
right to freedom of expression, success, material well-being, and the
power of their government (Samovar et al., 1998).
7. Humanitarianism: people pay a lot of attention to social welfare,
charity, and voluntary work.
According to Samovar et al. (1998), for Americans each individual is
unique, special and completely different from all other individuals, thus
the interests of the individual are paramount. People in the United States
believe that individual satisfaction comes from personal achievement.
They are successful in controlling the natural environment; they attempt
to dominate space as well. According to Jandt (1998), people in the United
States place a high value on time, efficiency, good planning, organization,
and practicality. They believe in the scientific method of solving problems.
They think that human nature can be changed and education is an import-
ant element in improving human nature. Importance is placed on learning
to be an individual, independent, self-motivated and achievement
oriented. The US Americans view time as a commodity and believe that
the future can be planned and controlled (Mead, 1998). The majority of
US Americans are optimistic and believe that everything is possible if
worked for. However, ‘the dependence upon legal remedies to forestall
conflict indicates pessimism’ (Mead, 1998, p. 24). Lipset (1963) indicated
that the United States are achievement, egalitarian, universal, and spe-
cificity oriented. Dodd (1995) noted that US Americans value equality
of people, personal freedom, humanitarianism, directness, work, time,
success, individualism, and material well-being.
EuropeLessem and Neubauer (1994) attempted to characterize the European
values and philosophies that dominate European culture. They deter-
mined the four most significant European values as pragmatism, ration-
alism, holism, and humanism. However, they also noted that European
countries are quite different from each other in terms of their value
orientations. According to Hofstede (1996), Europeans are different in
their mental programming and the differences are quite large. Table 3.2
shows the ranking scores, which represent the relative positions of the
selected European countries on Hofstede’s (2001) cultural dimensions.
According to Hofstede (2001), the most individualistic European coun-
tries are Great Britain, Netherlands, Italy, Belgium and Denmark; the

Values
125
most collectivistic are Portugal, former Yugoslavia, Greece and Turkey.
Most of the Western European countries are low on power distance.
High power distance values are characteristic of former Yugoslavia and
France only. The highest on uncertainty avoidance and the most threat-
ened are Greece, Portugal, Belgium, Yugoslavia and Spain; the lowest on
uncertainty avoidance are Denmark, Sweden, Ireland and Great Britain.
The most masculine are Austria, Italy, Switzerland, Ireland, Great
Britain and Germany; the most feminine are Sweden, Norway,
Netherlands, Denmark, former Yugoslavia, Finland and Portugal.
Hofstede (2001) reported that on individualism the extreme countries
are Britain and Greece; Greece scored very highly on collectivism. Greece
also scored extremely highly on uncertainty avoidance. Sweden is the
most feminine country; Austria the most masculine. The Germanic coun-
tries (Britain, Denmark, Germany, Ireland, Luxembourg and the
Netherlands, all speaking a German language) are characterized by smal-
ler power distance and weak to medium uncertainty avoidance. In the
Germanic group the extreme country is Denmark, characterized by very
small power distance and very weak uncertainty avoidance. Belgium, on
the other hand, is characterized by a quite high uncertainty avoidance.
Britain and Ireland are low on both power distance and uncertainty
avoidance dimensions. Germany occupies a middle position on the
scale and is characterized by small power distance and medium uncer-
tainty avoidance. Germany is seen as more collectivistic than Britain. It
was noted that Germans value cooperation, mutual support, team spirit,
avoidance of conflict, and punctuality. However, the degree of formality
in Germany is extreme. Germans address others and conduct themselves
in a very formal manner; they use titles and identify people by their
positions in social structures (Samovar et al., 1998). Further, the Latin
countries (Belgium, France, Italy, Portugal, Spain, all speaking a Roman
language, plus Greece) are characterized by medium to large power
distance and medium to strong uncertainty avoidance.
In terms of the Confucian Work Dynamism dimension Netherlands,
Sweden, Poland and Germany are in the middle rank on the Confucius
Long-Term Orientation (Hofstede, 2001). Their value orientations are in
between the long-term orientation (persistence, ordering relationships by
status, thrift, having a sense of shame) and short-term orientation (per-
sonal stability, protecting ‘face’, respect for traditions, reciprocation,
adaptation).

Cross-Cultural Behaviour in Tourism
126
According to Hampden-Turner and Trompenaars (1993), in Europe
the most universalistic cultures can be found in Britain, Germany and
Sweden, and the most particularistic in France. The most individualistic
are Britain, Netherlands and Sweden; the most collectivistic France and
Germany. The most equitable are Germany, Britain and Netherlands, the
most hierarchical is France. Countries in which people are inner directed
are Britain and Germany, countries with outer-orientation are Sweden,
Netherlands and France. The most analytical are Britain, Netherlands
and Sweden; the most integrative are France and Germany. Countries in
which status is gained by achievement are Britain, Sweden, Germany and
Netherlands; the country in which status is ascribed is France. Countries
which view time as sequential are Sweden, Netherlands, Britain and
Germany; the country which views time as synchronized is France.
According to Hofstede (1996), the Eastern European countries are
extremely diverse and very heterogeneous in terms of their populations,
traditions, history, and cultural values. Although they all experienced
communism, which failed nearly a decade ago after forty-five years of
domination, communism was a native development in Russia only. In all
other Eastern European countries it was forcefully imposed by the mili-
tary. Today many elders in the Eastern European bloc believe that living
under communism was better and easier than in the free market economy
that encourages an individualistic mentality and demands looking after
one’s own existence. In these countries a national materialism, based on
group collectivism, is highly developed. People do not want to accept the
responsibility for making their own living and being responsible for their
own existence, and demand financial and social support from govern-
ment. Since many members of the Eastern European countries experi-
enced wars and lived for many decades in insecurity, they don’t want risk
in their lives, and seek security and order. National materialism is less
developed in the Czech Republic, Poland and Hungary. These countries
have the best chances to develop capitalism, free market economies, and
individualist entrepreneurship. These countries are more individualistic,
risk-takers, and masculine.
RussiaAccording to Jandt (1998), in Russia individualism, personal gains, and
self-orientation have been discouraged. People had to subjugate to a state
that totally controlled their lives. In schools and at universities Russians
were taught discipline, subordination and sacrifice of their well being for
the welfare of the state. The society was very hierarchical; power distance

Values
127
between the communist leadership and the people was great. There were
different rules and rights for those who were in government and those
who weren’t. Russian values reflect more feminine than masculine cul-
tural values. Importance is attached to friends, family life, social relations
and cultural life rather than money and material possessions. Love,
ethics, morality, feelings and friendships are taught as being important
values in human life. Currently, Russia is at a transition stage after the
collapse of the Soviet Union where people are attempting to rebuild their
rich Russian tradition and culture. However, the distance between the
working class and those in government is now even greater than under
communism. A distribution of wealth is inequitable. The Russian econ-
omy is chaotic, generating a fear of the unexpected, particularly for those
who are at the bottom level of social class.
According to Jandt (1998), Russian values reflect both Asian and
European values. For example, Russian people attach importance to
family, relationships with others and social harmony, and seek Western
values of personal rights and freedom. They are passive in nature and
autocratic, and believe in the governing class. They need some authority
to establish social and economic order. They distrust outsiders, particu-
larly foreigners. They respect the past; they worship history and traditions,
and respect elders. They attach importance to the present. They are pessi-
mistic about the future due to experiencing hardship and insecurity for
long decades. They believe that people are bad or a mixture of good and
evil, and they believe they cannot control the environment (Jandt, 1998).
Australian cultural pattern
There have been some studies done on Australian values and Australian
identity (Bennett et al., 1977; Carroll, 1984; England, 1975; Feather,
1975; Hofstede, 1980; Spillane, 1984; White, 1981). Australian contem-
porary values have been described as those of: achievement, success,
activity, work, humanitarianism, democracy, equality, aggressiveness
and independence, all deriving from a value of self-reliance
(Elashmawi, 1991). Many commentators have referred to egalitarianism
in Australian society and the Australian concern for mateship (Encel,
1970; Hancock, 1930; Lipset, 1963; Taft and Walker, 1958; Ward,
1958). Mateship was related to true friendship, loneliness, hardship of
outback life, need for companionship, joint activities, support, equality,
reciprocal favours, and conformity to group norms. According to some

Cross-Cultural Behaviour in Tourism
128
theorists, mateship is related to collectivistic and egalitarian values and
contradicts a successful achievement value. However, Lipset (1963) found
no evidence for this. He found that Australians are more egalitarian but
less achievement oriented, universalistic and specific than Americans.
Other theorists have noted the tendency for Australians to appraise
those successful in sport, to be critical and less respectful of successful
intellectuals ‘tall poppies’, and to play down and devalue their accom-
plishments (Encel, 1970; Sharp, 1992). Others found a tendency for
admiration for the ‘Aussie battler’ and those who stand out against
authority (Feather, 1986b). Feather (1985) noted that in Australia there
is a conflict between collectivistic ideology that favours mateship, group
solidarity and equality, and a system that rewards personal accomplish-
ments and individual enterprise. There is also a conflict between mascu-
line, assertive values and feminine, communal values (Feather, 1986a).
Australia’s affluence and stability promotes less concern for safety and
security at the personal and national levels and more concern with love,
affiliation, self-definition, and self-fulfilment (Feather, 1975, 1980a,
1986a; Feather and Hutton, 1973).
Australian value studies
Several studies on Australian values have been conducted by Feather
(1970a, 1972a, 1972b, 1972c, 1980a, 1986a, 1986b) and Rim (1970).
The results of these studies showed that Australians place importance
on friendships and equality more than Americans and Israelis.
Australians are less achievement oriented than Americans but more
than Canadians and Israelis. Australians ranked family, security, happi-
ness and intellectual values lower than do the other groups. Australians
ranked exciting life, world of beauty, inner harmony, mature love, friend-
ship, and being cheerful higher than Americans; and a comfortable life,
salvation, and ambition lower than Americans (Feather, 1975).
The value differences between Australians, Papua New Guineans and
Chinese have been compared. Australians are concerned with love,
accomplishments, self-respect, friendships, happiness, pleasure, and
being cheerful when compared with Papua New Guineans. The Chinese
assigned more importance to scholarship (wisdom, being capable, ima-
gination, intellect, and logic), respect, hard work and self-restraint (e.g.,
social recognition, being ambitious, self-controlled), and national security
than Australians (Feather, 1986a). These differences were consistent with
the study by Hsu (1972) who reported that the Chinese are more situa-

Values
129
tion-oriented, more concerned with appropriate behaviour in relation to
others, and more emotionally restrained. They are more socially and
psychologically dependent on others and they form a big network of
relationships. They support respect for parents, tradition, duty, obliga-
tions, and the getting of wisdom. Scholarship is the most important
criterion for membership in the highest social class. Therefore, it brings
power, prestige, and wealth. The Chinese are also more concerned with
freedom. Australians, as compared with the Chinese, are more individu-
ally centred, less concerned with scholarship and ranked self-related
values and excitement (happiness, inner harmony, exciting life) as more
important, and they emphasized affiliate and altruistic values (being
cheerful, forgiving, helpful and loving).
The most and least important values
It was found that the four most important terminal values for the
Australian sample were happiness, inner harmony, freedom, and true
friendship. For instance, friendship emerged as a strong value, reflecting
the cultural emphasis on mateships. The four least important terminal
values for the Australian sample were pleasure, social recognition,
national security, and salvation. For the Chinese sample, the four most
important terminal values were true friendship, wisdom, freedom, and
mature love. The four least important terminal values were family secur-
ity, a comfortable life, an exciting life, and salvation. The four most
important instrumental values for the Australian sample were being
honest, loving, broadminded, and cheerful. The four least important
instrumental values were being logical, polite, clean, and obedient. The
four most important instrumental values for the Chinese were being
ambitious, broadminded, intellectual, and courageous. The four least
important instrumental values were being forgiving, helpful, clean, and
obedient. Some of these differences overlap with findings for the
Australian and Papua New Guineans students (Feather, 1976, 1980a)
and are consistent with those that one would expect on the basis of the
analysis of cultural differences between Western and Eastern cultures
presented previously.
Further, Feather and Hutton (1973) applied the RVS to compare
Australians and Papua New Guineans students’ values. The Australian
students showed concern with self-definition and self-fulfilment and gave
much lower priorities to equality, national security, salvation, social

Cross-Cultural Behaviour in Tourism
130
recognition, and comfortable life. Noesjirwan (1977) studied differences
between Indonesian and Australian values. Maxwell (1979) and Nurmi
(1986) analysed the similarities and differences between the Australian
and Finish values. Hofstede (1980) found that there are value differences
between South Asians and Australians.
Discussion points and questions
1. Why do we use cultural dimensions to explain similarities and differ-
ences in behaviour across cultures?
2. What are the major cultural differences between collectivistic and
individualistic cultures?
3. Why is status a major issue in high power distance cultures, but not
in low power distance cultures?
4. What are the major differences in communication in individualistic
and collectivistic cultures?
5. How do you explain the influence of cultural differences on inter-
personal relations?
Summary
Values are culturally determined standards of socially desirable beha-
viour. They determine rules of social behaviour. They characterize
people within the same culture and distinguish those from other cul-
tures. They are superior in differentiating cultures and explaining
cultural differences. There are two types of values: instrumental and
terminal. There are direct and indirect methods and techniques for
measuring values. The Rokeach Value Survey (1973) is accepted to be
the best method for measuring values. According to Kluckhohn and
Strodtbeck (1961), different cultures can be compared on a basis of
how their members relate to human nature, nature, human activities,
other people, and time. Different researchers in the field have devel-
oped different sets of cultural orientations, however, they all appear to
be related and interdependent. Cultural value patterns in Asia,
Europe, the United States and Australia are identified based on the
value orientations that differentiate cultures.

Values
131
6. How does uncertainty influence the way people communicate?
7. Which cultural orientation is the most influential on the development
of social relations in all cultures?
8. Are there any similarities in cultural value patterns between Asia,
Europe, US and Australia?
9. Find two examples that demonstrate how Hofstede’s (1980) dimen-
sions can cause clashes in tourist–host interaction.
Since cultural values determine the rules of social interaction (e.g., Argyle
et al., 1986), which indicate what is permitted or not between those in
contact (e.g., Argyle and Henderson, 1984), the next chapter examines
the concept of rules, and their influence on social interaction.
Further reading
Hofstede, G. (1980) Culture’s Consequences. Beverly Hills, CA: Sage
Publications.
Kluckhohn, F. and Strodtbeck, F. (1961) Variations in Value
Orientations. New York: Row, Petersen.
Lustig, M and Koester, J. (1993) Intercultural Competence: Interpersonal
Communication Across Cultures. New York: Harper College
Publishers.
Schein, E. (1992) Organizational Culture and Leadership. San Francisco,
CA: Jossey-Bass Publishers.
Triandis, H. (1995) Individualism-Collectivism. Boulder, Co.: Westview.

4Rules of social interaction
Objectives
After completing this chapter the reader should
be able to:
& define rules of social interaction, their role
and types
& understand the difference between rules,
commands, laws and norms
& understand the relationship between rules and
culture
& understand differences between universal and
specific rules
& describe the reasons and consequences of
rules violations
& identify techniques of rules measurement
& identify cultural differences in rules of social
interaction as based on Hofstede’s (1980)
cultural dimensions.

Rules of social interaction
133
Introduction
The aim of this chapter will be to introduce the concept of rules of social
interaction and to present the cultural differences in rules of social inter-
action between culturally different societies.
Concept and definitions
The literature review indicates that the concept of rule is widely used and
has been discussed by many writers: Berne (1966), Garfinkel (1967),
Goffman (1961, 1969), Harre (1972, 1974), Harre and Secord (1972),
Segal and Stacey (1975), Toulmin (1974). Since cultural systems can be
analysed in terms of the rules (Kim and Gudykunst, 1988), this concept is
presented below.
Definitions
Rules were defined as directives for people’s behaviour and guidelines for
their actions (Harre and Secord, 1972). Rules apply to most social rela-
tionships; they indicate to participating persons what actions are appro-
priate or inappropriate in social interaction and how people ought or
ought not to behave (Argyle and Henderson, 1985b). They define the
responsibilities and obligations within a given social relationship (Kim
and Gudykunst, 1988). Rules allow coordination and exclusion of certain
behaviours (Argyle et al., 1986). Kim Y. Y. (1988, see p. 34) defined rule
as a system of expected patterns of behaviour that serves to organize
interaction between individuals in the host country. ‘Knowing the rule
. . . provides some ground for expectations one may have of the behavior
of other people who accept the rule’ (Harre and Secord, 1972, p. 182).
Since rules determine expectations (Harre and Secord, 1972) and ‘frame
the expectational levels of the interactants in terms of what constitute
appropriate or inappropriate behaviors in a situation’ (Gudykunst et al.,
1988b, p. 68), the rules are future oriented and can predict behaviour.
In this book, rules are conceptualized as guidelines that direct beha-
viour of the individuals in relationships and make actions consistent with
the expectations of the other members of the relationship (Moghaddam
et al., 1993); prescriptions for obligated, preferred, or prohibited beha-
viour (Shimanoff, 1980); and regulations in the sense that they are

Cross-Cultural Behaviour in Tourism
134
prescriptions that are used to regulate, evaluate, and predict social
conduct (Searle, 1969).
Role of rules
Rules are developed to understand events, actions and behaviour; to
define the meaning of a situation and behaviour within that situation.
Rules provide recipes of how to achieve an end-state (Kim, Y. Y., 1988)
of existence. Thus, rules are developed to achieve certain goals in situa-
tions and relationships such as harmony of interaction (Moghaddam et
al., 1993), satisfaction with interaction, or as Goffman (1971) puts it, to
achieve ‘public order’. Rules solve problems of social behaviour and
make interaction easier, more predictable (Cohen, J. B., 1972), and
more understandable to others (Kim, Y. Y., 1988). They set up expecta-
tions and provide meanings and standards of evaluation. ‘Without a
knowledge of the rules, we cannot understand the intention and meaning
of an act’ (Noesjirwan and Freestone, 1979, p. 20) and cannot evaluate
the behaviour of others.
Rules creation
Rules are created by mutual consent of society and, therefore, they are
socially accepted. Behaviour that conforms to socially accepted and
shared rules is more predictable (Shimanoff, 1980). However, rules are
conditional. They can be followed, or can be broken (McLaughlin, 1984).
They may be modified, changed, or ignored.
Types of rules
There are many types of rules: interpersonal (should be nice to each
other) and task rules (should help). There are rules that require reward
(should support) and rules that prevent conflict (should cooperate). There
are rules for actions and rules for conduct (Martin, 1971). There are
enabling rules (for actions that create episodes) and restricting rules
(that limit the appropriate behaviour). There are explicit (e.g., school
and work rules) and implicit rules (e.g., rules of etiquette). Rules can
explain formal episodes and enigmatic episodes that are social acts not
governed by explicit and formal rules (Harre and Secord, 1972). There
are specific and general rules (Collier et al., 1986).

Rules of social interaction
135
Situation rules
Situation rules indicate how people should or should not behave in cer-
tain situations e.g., how to greet each other, exchange gifts, how to
initiate conversation, what to talk about during conversations, or the
mood that is appropriate. Rules may relate to general or specific social
situations. Rules also indicate how people should or should not behave in
relation to others such as guests, strangers, or friends. Rules govern
verbal and non-verbal behaviour.
Relationship rules
Rules are important components of relationships (Argyle and
Henderson, 1985a,b). Relationship rules can be explicit, formally coded
within the written or spoken language and directly stated, and are usually
well known, as in the case of public or institutional regulations. They can
also be implicit, informal, not visible, coded in non-verbal behaviour or
indirectly stated, and are usually learned through the process of sociali-
zation, observing the actions of others, as in the case of rules related to
intimacy levels, status, and dominance (Kim, Y. Y., 1988; Moghaddam et
al., 1993). In voluntary relationships, there is less need for the behaviours
to be regulated by explicit rules, as opposed to involuntary or permanent
behaviours where there is greater need for explicit rules to guide interac-
tions. Therefore, it is common that in cultures where the relationships are
involuntary (collectivistic), there is a need for more explicit relationship
rules, as opposed to individualistic cultures. Since the tourist–host con-
tact is a form of voluntary relationship, there is less need to regulate it by
explicit rules; the implicit rules play a more important role in this contact
(Kim, Y. Y., 1988; Moghaddam et al., 1993).
Universal and specific rules
Some of the social interaction rules are universal and apply to nearly all
situations and cultures, while others apply to specific situations and cul-
tures only. Argyle et al. (1979) studied the rules of twenty-five social
situations and found that rules ‘should be friendly’, ‘should keep to
pleasant topics of conversation’, apply to all social situations. Pearce
(1988) reported that the universal social rules tourists and hosts agreed
to follow are: to be polite, honest, open, friendly, and genuine. Hosts
reported that visitors should treat them with respect. These will be dis-
cussed later.

Cross-Cultural Behaviour in Tourism
136
Three orders of rules
There are three orders of rules (Harre, 1974):
& First order rules ‘constitute the etiquette for social situations’ (p. 162).
Rules of etiquette differ across cultures.& The second order rules ‘construct social relations . . . by maintaining
hierarchy’ (p. 163). These rules specify ‘how rights and privileges . . .
are to be socially distributed’ (Goodenough, 1971). The first and
second order rules define what is appropriate.& The third order rules apply to self-presentation or self-performance
and create a self-image (Goffman, 1969).
In this book reference is made to only the first and second order rules
because these rules provide guidelines for socially accepted behaviour and
indicate how people should or should not behave in relations with others.
Rules variations
Rules vary in respect to clarity and range (Gudykunst et al., 1988b). For
instance, the high context cultures have a more specific and greater range
of rules because these cultures need more rules to coordinate activity and
accuracy with implicit understanding than the low-context cultures (Hall,
1976). Rules also vary with respect to the degree of consensus. For
instance, in high context cultures there is a need for more accurate under-
standing of rules in a communication system (Cushman and Whiting,
1972).
Rules versus commands, laws and norms
There is a distinction between rules, commands, laws, and norms. Rules
are general and can be followed; commands are specific and must be
followed (Harre and Secord, 1972). Rules are not enforceable; law is
enforceable (Harre and Secord, 1972). Rules show reasons for behaviour
and can be changed whereas laws show causes of behaviour and cannot
be changed. Norms are special rules and refer to regularities in behaviour.
They are ‘generalizations which guide behavior’ (Moutinho, 1987, p. 7).
The violation of a norm brings sanctions. The violation of a rule has only
consequences because rules may be subjected to different interpretations.
Like rules, norms describe how a person is expected to act in various
situations in interactional contact (Brislin, 1981). Norms contain a state-
ment of the ideal behaviour. They involve beliefs related to values

Rules of social interaction
137
(Triandis, 1972). They are ‘specifications of values relating to behavior in
interaction’ (Peterson, 1979, p. 137).
Fundamental norms
There are two fundamental norms that influence cultural interaction:
1. Norm of justice
2. Norm of reciprocity.
Norms of justice
There are two norms of justice: norm of equity (indicates the concept of
deservingness) accepted in individualistic cultures and norm of equality
(indicates even distribution regardless of the contribution) accepted in
collectivistic cultures. These two types of norms explain the cultural dif-
ferences in the meaning of fairness. The individualistic cultures reward
people on a basis of their contribution. The collectivistic cultures reward
people regardless of their contributions (Gudykunst et al., 1988b).
Norm of reciprocity
The norm of reciprocity means that people should help and not injure
those who have helped them (Gouldner, 1960). Members of individualis-
tic cultures stress a voluntary reciprocity norm (Ting-Toomey, 1986b).
Members of collectivistic cultures emphasize an obligatory reciprocity
norm (the debtors should repay the debt and engage in face-saving activ-
ities). They practise long-term reciprocity unlike those in individualistic
cultures who practise short-term reciprocity (based on monochronic
values of time) (Hall, 1983). Also, the individualistic cultures with low
power distance follow symmetrical reciprocity that does not reflect status,
unlike the collectivistic cultures with high power distance that follow the
complementary reciprocity that reflects role, status, and power (Gouldner,
1960).
Rules are culturally determined
Rules that govern social situations and interactions are culturally deter-
mined. Culture provides the ‘rules of the game’ (Kim, Y. Y., 1988). Rules
vary along cultural dimensions, or as Harre (1972) puts it, rules have

Cross-Cultural Behaviour in Tourism
138
cultural dimensions. Rules are ordered and patterned by underlying prin-
ciples of cultural values (Barth, 1966; Noesjirwan and Freestone, 1979).
Therefore, rules vary according to the dominant values and culture
(Mann, 1986) and together with values they define the dominant culture
(Goodenough, 1971). Consequently, members of the same culture gen-
erally understand the social interaction rules of their culture (Gudykunst
et al., 1988b). However, the members of different cultures that have
different rules may not understand them. For instance, in different cul-
tures there are different rules for defining interpersonal relations and
attributing importance to social interactions (Wagatsuma and Rosett,
1986), establishing and maintaining relations, greetings, self-presenta-
tions (Argyle, 1967), beginning of conversation, degree of expressiveness,
frankness, intensity, persistency, intimacy, volume of interaction (Jensen,
1970), understanding of what constitutes friendship (Wei et al., 1989),
expressing dissatisfaction and criticism (Nomura and Barnlund, 1983),
describing reasons and opinions, exaggerations and telling the truth
(Argyle, 1978). There are differences in the use of space, physical proxi-
mity, and privacy (Argyle, 1972; Hall, 1966), gestures, facial expressions,
expressions of intimacy, status, and politeness (Argyle, 1972), eye and
body movements (Goffman, 1963), expressing negative opinions, joking,
showing warmth, apologizing, farewelling, use of time, perceiving sense
of shame, feelings of obligations, responsibility, avoiding embarrassment,
confrontation, taking initiatives, responses, and external appearance
(Argyle, 1972, 1978; Dodd, 1987; Gudykunst and Kim, 1984a; Hall,
1983). There are cultural differences in rules regarding social distance,
bodily contact, and self-presentation (Argyle, 1972). There are cultural
differences in gift giving, tipping, eating, and drinking. Certain cultures
have developed specific rules related to entertaining guests (Argyle, 1972).
Cultural differences in travel behaviour
Cultural differences were found in the travelling behaviour of the Asian
markets (March, 1997). The differences included: (1) the ability and the
desire to speak English (Indonesians speak better English than Koreans);
(2) eating patterns dependent upon religious factors (Koreans have
strong preference for their own cuisine, Indonesians require halal
food); (3) level of adventurous spirit (Koreans are more adventurous
than Japanese); (4) degree of overseas travel experience; (5) consumer
expectations from overseas travel; (6) different travelling patterns and
demands in terms of desired accommodation (luxury versus budget),

Rules of social interaction
139
purpose of travel, seasonality due to different school holiday calendars,
and shopping behaviour (big versus moderate spenders). It was found
that when deciding about their vacation destinations, the Japanese relied
more heavily on the print medium as an information source, while the
Germans relied more on word-of-mouth advice from family and friends
(Mihalik et al., 1995). In response to unsatisfactory service in a hotel
Americans were more likely to stop patronizing the hotel, complain to
hotel management and warn family and friends. Japanese, on the other
hand, were more likely to take no action (Huang et al., 1996). Pizam and
Sussmann (1995) noted that behavioural differences between tourists
from Japan, France, Italy and the US were attributable to cultural influ-
ences. Ibrahim (1991) reported that these differences were caused by the
differences in value systems.
Impact of the cultural differences in rules on social behaviour
Since different cultures have different rules of interaction, the expecta-
tions and meanings of rules also differ across cultures. The rules that are
socially accepted in one culture may have quite different meanings in
another. Thus, members of different cultures may misunderstand and
misinterpret the rules of other cultures that can cause difficulty interact-
ing with those from different cultures, lead to confusion, generate tension,
and even conflict. This is specifically relevant to tourist–host contact.
Many tourists and hosts reported interaction difficulties due to cultural
differences in rules of social interaction (Pearce, 1982b). Stringer (1981)
noted that in bed-and-breakfast establishments even different customs of
handling cutlery and eating habits caused irritation. Difficulties also
occur because rules are not written but held unconsciously
(Noesjirwan, 1978). Consequently, an analysis of the rules governing
contact with foreigners is important (Argyle et al., 1986) and can facil-
itate the improvement of social relationships (Argyle, 1981) in tourism.
Breaking rules
People often break the rules, either because they ignore them or because
they are unaware of the cultural differences in the meanings of rules, and
breaking rules disrupts interaction (Goffman, 1963). Tourists often break
social rules on the streets, in shops, banks, at meal times, at religious
services by inappropriate clothes or gestures. Pearce (1988) reported that
American tourists often seriously breach social rules by excessive drink-
Cross-Cultural Behaviour in Tourism
140
ing, which was embarrassing to hosts in New Zealand farms. Tourists
break the social rules because they do not know what rules apply to social
encounters in the receiving countries, and they are socially unskilled in
culturally different countries. Unfortunately, due to the special character
of the tourist–host contact, tourists have little opportunity to learn about
the rules and proper interaction with culturally different hosts. The lack
of cultural awareness in social rules develops stereotypes of tourists as
ignorant and abusing and with little respect for the host community. Such
stereotypes add to a negative tourist evaluation by hosts and develop-
ment of negative hosts’ attitudes toward tourists. Unfortunately, cultural
awareness of the differences in rules develops when they are already
broken (Argyle, 1972).
Consequences of rules violations
Cultural differences exist not only in rules but also in the expected con-
sequences for action due to different rules (Applegate and Sypher, 1988;
Cronen et al., 1988). In every culture the rules have specific consequences,
and these consequences are visible and measurable (Kim, Y. Y., 1988).
For instance, there are sanctions for violations of the rules. These
sanctions are clearly defined for the violations of the explicit rules.
They are not clearly defined for violations of implicit rules. However,
since compliance with implicit rules is also necessary for developing
and maintaining smooth relationships, violations of both explicit and
implicit rules lead to disruption and deterioration of the relationships.
Learning rules
Learning rules of the host culture requires a deep cultural understanding,
not only of the verbal and non-verbal patterns, but also how and why the
natives interact the way they do. Cultural understanding can make a
stranger able to share and understand the experiences of the natives
(Kim, Y. Y., 1988). Such deep understanding of the foreign interaction
rules requires a broad knowledge of historical, political, economic, reli-
gious, and educational practices as well as the natives’ values, beliefs,
attitudes, and thought patterns. Without such knowledge it is impossible
to make sense of the rules and behaviours of those who are culturally
different, and understand and deal successfully with them (Kim, Y. Y.,
1988). Knowledge of the cultural rules of social interaction can facilitate
an understanding of tourists’ and hosts’ behaviour in tourism social situa-

Rules of social interaction
141
tions (Levine, 1979). However, such knowledge can never be complete,
and the knowledge of others’ rules can be understood only in relative
terms (Kim, Y. Y., 1988). Since tourism development creates increasing
opportunities for cross-cultural contact between tourists and hosts who
will be interacting on a regular face-to-face basis (Machlis and Burch,
1983), there is a need to develop cultural awareness and learn the rules
of social interaction within cultures in order to facilitate this contact.
Measuring rules
There are several ways of investigating and measuring the rules of social
interaction. For instance, one can ask to rate the appropriateness of the
social rules in a specific situation. If there is an agreement between
respondents one can conclude that a rule exists (Argyle et al., 1981). In
order to ascertain the existence of interaction rules in communication
between tourists and hosts, one can also ask them to rate the social
rules. One can also refer to the rules applied in social interactions with
strangers (Pitt-Rivers, 1968) since the concept of a tourist is similar to the
concept of a stranger. However, since people from different cultures hold
different beliefs about the appropriateness of rules in interaction, tourists
and hosts may also apply different interaction rules, each according to
their own standards.
Cross-cultural differences in rules of social interaction
There are many studies done on rules of social relationships. These
studies indicate that there are cultural differences in the rules of social
relationship between Eastern and Western societies (e.g., Hofstede, 1980;
Foa et al., 1969; Nakamura, 1964).
Rules of social relationships in Japan
Many empirical and non-empirical writers have discussed the rules of
social relationships in Japan (Argyle et al., 1978; Befu, 1971; Benedict,
1967; Lebra, 1976; Morsbach, 1977; Nakane, 1973; Shimoda et al., 1978),
and in Hong Kong (Bond and Wang, 1983; Dawson et al., 1972; Meade
and Barnard, 1973; Whitney, 1971). They reported that there are a num-
ber of rules specific to each culture. For instance, the Japanese have more
rules of endorsement than other cultures (Argyle et al., 1986). They have

Cross-Cultural Behaviour in Tourism
142
many rules in respect of public criticism, about the exchange of obliga-
tions, repaying debt, and rewards (Befu, 1971), gift-giving and receiving,
etiquette (Benedict, 1967; Morsbach, 1977), restraining emotions and sup-
pressing natural feelings (Argyle et al., 1986). However, rules concerning
emotions are difficult to decode because of the so-called Japanese ‘display
rules’ (Shimoda et al., 1978). The Japanese also have more specific rules
related to human interaction and situation rather than to person (Argyle
et al., 1978). According to Doi (1973a), the Japanese have more formal
rules regulating public interactions than rules guiding private interactions
because they control themselves more in public and more things are pro-
hibited in public. The Japanese also have more work and group relational
rules. Lebra (1976) stated that the Japanese have more rules regulating
relations with supervisors and subordinates that concern roles and specific
behaviour in particular situations. The reason for this is the Japanese
concern with order and hierarchy in society. The Japanese have more
rules about restraints and obedience since they endorse obedience signifi-
cantly more than other cultures. They also have more rules concerned with
loyalty and group harmony since they emphasize loyalty to group and
concern for harmonious relations. According to Lebra (1976), the Japan-
ese have more rules of conflict avoidance and they value ‘face saving’ to
maintain harmony in interpersonal relations. In Hong Kong there are
more rules respecting privacy, parents, ancestors, and obligations.
Rules of social relationships in Hong Kong
In general, Eastern cultures such as Hong Kong have many rules dealing
with public and human interaction, regulating conflict, avoiding public
disagreement and criticism, maintaining group harmony, restraining
emotional expressions, saving face, hierarchy and power differences,
obeying people in authority, prohibiting jokes, teasing, and teaching
positive regard (Argyle et al., 1986).
Rules of social relationships and Hofstede’s (1980) culturaldimensions
The findings of the past studies are related to Hofstede’s (1980) cultural
dimensions. They indicate that Eastern cultures endorse rules underlying
collectivistic values. Members of collectivistic cultures high on uncer-
tainty avoidance (who desire less ambiguity in relationships, are more
cautious about strangers, draw sharper distinctions between in-groups

Rules of social interaction
143
and out-groups, and perceive in-group relationships to be more intimate)
need more rules concerning the out-groups than members of individu-
alistic cultures. In collectivistic high power distant cultures (where the
relationships between superiors and subordinates differ) there is a need
for more formal rules for hierarchical work relations. In high-context
cultures (where members are more cautious in initial interactions with
strangers, make more assumptions about strangers based on their back-
grounds, and ask more questions about strangers than do members of
low-context cultures) (Gudykunst, 1983a), there is a need for more rules
concerned with strangers. Members of collectivistic cultures (who tend to
not commit themselves in relationships with individuals from out-groups)
use indirect forms of communication and tend to have less self-disclosure
in the relationships. In masculine cultures there are more rules of per-
formance, than rules maintaining harmonious relations. Members of col-
lectivistic cultures who emphasize multiple relationships need more rules
regulating social relations. In collectivistic cultures with high power dis-
tance (where members are willing to spend more time to cultivate social
relationships and reciprocate social information) there are more rules
governing these relationships, unlike in individualistic cultures with low
power distance (where most of the time is spent on developing person-
alized relationships, self-disclosure, and risk-taking in exchanging infor-
mation on one’s private life (Gudykunst et al., 1988b). In collectivistic
cultures (Hong Kong, Japan) rules of public criticism are endorsed by
avoiding public confrontations and negative criticism, unlike in indi-
vidualistic cultures where people are less concerned with public criticism.
In collectivistic cultures that emphasize group harmony more rules are
related to harmonious relations, unlike in individualistic cultures that
emphasize self-assertion and self-reliance (DeRiviera, 1977). Members
of high uncertainty avoidance cultures (Japan) also support rules of con-
forming behaviour and they need more formal rules to maintain social
order, unlike the members of low uncertainty avoidance cultures who
tolerate violation of rules of behaviour and deviation from the formal
rules of interaction.
Importance of universal relationship rules
The important role of rules in the relationships of people within various
cultures was demonstrated by British researchers (Argyle and Henderson,
1984, 1985a, 1985b; Argyle et al., 1985b; Argyle et al., 1986). Several
years later Argyle and his colleagues examined the presence and nature

Cross-Cultural Behaviour in Tourism
144
of relationship rules in England, Italy, Hong Kong and Japan (Argyle et
al., 1986). Subjects were asked to rate the importance of common and
relationship specific rules on a 9-point bipolar scale. The results showed
that all cultures had rules for social relationships. These rules were seen as
important elements of interpersonal relationships in all four cultures, and
there were numerous similarities among the cultures in relation to certain
rule endorsement. For instance, there were consistent rules for profes-
sional formal relationships such as watching one’s personal appearance,
showing courtesy and respect, and avoiding social intimacy.
It was found that the universal rules that are highly endorsed across
most of the social relationships and common to all situations are as
follows:
1. one should respect others’ privacy
2. one should look the other person in the eye during conversation
3. one should not discuss what is said in confidence
4. one should or should not indulge in sexual activity
5. one should not criticize the other in public
6. one should repay debts, favours, or compliments no matter how
small (Argyle and Henderson, 1984; Argyle et al., 1985b).
The only rule endorsed in all four cultures for all social relationships was
respect for privacy (Argyle et al., 1985b). However, this rule might have
different meanings in different cultures.
Specific rules
Argyle et al. (1986) found that there are also specific rules for social
relationships in the four cultures: England, Italy, Hong Kong and
Japan. For instance, the rules for close friendships endorsed in Japan
were quite different from those endorsed in Italy. The Japanese placed
less emphasis on the expression of emotion, opinions, showing affection,
and requesting help and advice than did Italians. There was a noticeable
difference in rules relating to intimacy. Further, there were differences in
rules between Eastern and Western clusters. In the Eastern clusters there
were more rules about obedience, avoidance of conflict and saving face,
maintaining harmonious relations in groups, and restraining emotional
expressions. For instance, in Eastern cultures there are more rules regard-
ing ‘losing face’ than in Western cultures because self-presentation is of
great importance. However, the cultural differences were less noticed in

Rules of social interaction
145
Hong Kong due to the influence of Western cultural values. In Hong
Kong rules about showing respect for parents were important. In Japan
there were more rules for hierarchical work relations, fewer for family
and more rules concerned with avoidance of conflict and out-groups.
Although reward and control rules were found in each culture, the
Japanese did not have many rules about exchange of rewards (Argyle
et al., 1986). This finding is not supported by the well-known custom of
gift exchange in Japan (Morsbach, 1977), and may result from a bias due
to not including all Japanese culture-specific rules in the measuring
instrument.
The findings for Hofstede’s (1980) masculinity, power distance, and
uncertainty avoidance dimensions were not supported in Argyle’s et al.
(1986) study, probably, due to the wider range of relationships examined
by Argyle and the fact that Hofstede’s (1980) study was limited to work
relationships only. The Argyle et al. (1986) study had a British origin and
it did not include many Japanese specific rules such as: should express
humility, should use indirect form of refusal, can ask strangers personal
questions, and should not express personal opinions (Naotsuka and
Sakamoto, 1981).
Summary
Rules of social relationship play a central role in human interactions.
Their role is to maintain harmonious interactions. They create the
framework for stable relationships by coordinating behaviour and
avoiding conflict (Argyle et al., 1986). There are universal and culture
specific rules of social relationships. There are differences in rules of
social relationships between various cultures. Argyle et al. (1986)
suggested an analysis of the rules governing contact with strangers
such as foreigners, including international tourists. Such an analysis
would be useful for understanding and interpreting social interaction
between culturally different tourists and hosts. Knowledge of the rules
of social relationship governing cross-cultural tourist–host interaction
would be an important element for improving tourists’ and hosts’
relationships with each other (Argyle, 1981; Brislin and Pedersen,
1976). It would also positively influence the tourists’ and hosts’
mutual perceptions.

Cross-Cultural Behaviour in Tourism
146
Discussion points and questions
1. What is the role of rules of social interaction?
2. Why are the rules of social interaction determined by culture?
3. Identify five rules of social interaction, which are universal in all
cultures, and five that are different.
4. Identify universal rules of behaviour that should be followed by
tourists and hosts in their social interaction.
5. Why do people break rules of social behaviour? Why do tourists
break social rules when on a vacation in different countries?
6. Identify cultural differences in rules of social behaviour that are
related to Hofstede’s (1980) four cultural dimensions, i.e., individu-
alism and collectivism, power distance, uncertainty avoidance, and
masculinity and femininity.
Because the concept of perception is inherent within tourist–host contact,
this concept will be reviewed in the following chapter.
Further reading
Argyle, M. (1986). Rules for social relationships in four cultures.
Australian Journal of Psychology 38(3): 309–318.
Argyle, M. and Henderson, M. (1984). The rules of friendship. Journal of
Personal and Social Relationships 1: 211–237.
Argyle, M. and Henderson, M. (1985). The Anatomy of Relationships:
and the Rules and Skills Needed to Manage Them Successfully.
London: Heinemann.
Argyle, M., Graham, J. and White, P. (1979). The rules of different
situations. New Zealand Psychologist 8: 13–22.
Argyle, M., Henderson, M. and Furnham, A. (1985) The rules of social
relationships. British Journal of Social Psychology 24: 125–139.
Argyle, M., Henderson, M., Bond, M., Iizuka, Y. and Contarello, A.
(1986). Cross-cultural variations in relationship rules. International
Journal of Psychology 21: 287–315.
Harre, R. and Secord, P. (1972). The Explanation of Social Behavior.
Oxford: Basil Blackwell.

5Perception
Objectives
After completing this chapter the reader should
be able to:
& understand the concept of perception and its
key characteristics
& understand the influence of culture on
perception
& understand the influence of perception on
tourist–host social interaction
& identify major techniques for measuring
perceptions
& identify major studies of tourists’ and hosts’
perceptions
& understand the relationships between
perceptions, attitudes, image, attribution,
stereotyping and ethnocentrism.

Cross-Cultural Behaviour in Tourism
148
Introduction
This chapter concentrates on the concept of perception and will present
studies on its various aspects. The aim is to explain the concept of per-
ception with specific reference to tourist–host contact. The relationship
between culture, social interaction and perception will be discussed. A
brief review of the concepts related to perception such as attitude, image,
attribution, stereotyping and ethnocentrism, that can also determine
tourist–host contact, will also be presented in this chapter. However,
for a full and more comprehensive review of these concepts references
will be made to various authors. Techniques for measuring perception
along with numerous studies analysing tourists’ and hosts’ perceptions
will be outlined.
Reasons for choosing perceptions instead of attitudes
The concept of perception was chosen for the analysis as its use is most
appropriate and can be used more effectively in the analysis of tourist–
host contact than the concept of attitude (Ap, 1992). There are several
reasons why this is so.
& Firstly, there is a clear distinction between the terms perception and
attitude. By definition, perception represents the process by which
meaning is attributed to an object, event or person encountered in the
environment, whereas attitude represents a predisposition to think and
act in a certain way towards an object, event or person (Kurtz and
Boone, 1984). An attitude, as opposed to perception, is created on the
basis of experience during the process of learning, and acquiring know-
ledge (Moutinho, 1987). Perception can be created without experience
and knowledge of the object/person. This is often the case when tourists
develop perceptions of a destination prior to its visitation.& Secondly, tourists and hosts may attribute meanings to each other
(perceive each other) without having previous experience and knowl-
edge of each other. Consequently, they develop perceptions rather
than attitudes to each other.& Thirdly, not all tourists and hosts meet and experience each other.
Those who do may have only very limited experience, which does
not allow for the acquiring of a complete and accurate knowledge of
each other and, consequently, attitude development.& Fourthly, the decision to travel comes from a perception in the first
instance, and attitudes develop later after travel has commenced.

Perception
149
Concept and definitions
In general terms, perception is the process through which people see the
world around themselves (Schiffman and Kanuk, 1987). In academic
terms, perception is a ‘process by which an individual selects, organizes,
and interprets stimuli into a meaningful and coherent picture of the
world’ (Schiffman and Kanuk, 1987, p. 174). Samovar and Porter
(1991) defined perception as the process by which stimuli are selected
from the external environment and interpreted into meaningful internal
experiences. Mitchell (1978) referred to perceptions as the processes that
shape and produce what we actually experience. Similar definitions have
been introduced by Moutinho (1987) and Markin (1974). Cole and
Scribner (1974) reported that ‘. . . perceptions, memory, and thinking
all develop as part of the general socialization . . . and are inseparably
bound up with . . . social relations . . .’ (p.11). Perceptions were also
defined as ‘the impressions people form of one another and how inter-
pretations are made concerning the behaviour of others’ (Hargie, 1986, p.
47). Particularly important are first impressions because they decide
whether one associates with others (Huston and Levinger, 1978). For
instance, first impressions of taxi drivers, security officers, airline hos-
tesses, baggage assistants, registration staff and so on, decide whether
or not tourists will be willing to interact with hosts in the future.
Subjectivity of perceptions
Perceptions and their meanings are subjective. The meaning of the object
or event differs depending on the perceiver. People differ in their percep-
tions because they have different views of the world (Krech and
Crutchfield, 1948; Robertson, 1970). These views reflect the environment
in which people live. For instance, the perceptions of tourists and hosts
may vary depending on the external and internal environment in which
they live. The environment and culture determine which stimuli will be
chosen, and how they will be interpreted and judged. According to
Schiffman and Kanuk (1987) and Cohen, J. B. (1972), perceptions depend
on people’s value orientations, expectations, experiences, and interests
that are culturally determined. The stronger the cultural value orienta-
tion, the higher awareness of stimuli relevant to the value. For instance,
those who value the most interpersonal interaction with other people are
very highly aware of the stimuli relevant to their interpersonal values.
Therefore, it is vital to understand the individual value orientation that
affects perceptions.

Cross-Cultural Behaviour in Tourism
150
Subjective versus objective perceptions
Subjective perceptions also differ from objective reality. For instance, the
perceptions of tourists who had never experienced the product before (or
had very limited experience of it), and whose perceptions are mostly
created on the basis of the knowledge gained from promotion instead
of first-hand experience, may differ from the perceptions of tourists who
had experienced the product. In the absence of experience (for example,
first-time visitors), the product is assessed on the basis of subjective per-
ceptions, not reality. The same applies to the perceptions of people. In the
absence of experience with hosts, tourists evaluate their hosts on the basis
of their subjective perceptions. The construction of perceptual mapping
allows for finding out individual subjective perceptions and deciding what
can be done to maintain, change, or use the perceptions as criteria for
evaluation.
Importance of perceptions for social interaction
The concept of perception is very important for social interaction (Cook,
1979), its initiation, maintenance and termination (Forgas, 1985) because
the way people perceive each other determines the way they interact with
each other. As Singer (1982, p. 54) pointed out, ‘individuals . . . can only
act or react on the basis of their perceptions . . .’. This means that percep-
tions influence social interaction and, thus, are vital for the analysis of
tourist–host interaction.
Key aspects of perceptions that influence social interaction
According to Gudykunst and Kim (1997), there are three key aspects of
perceptions that may influence social interaction and communication.
Firstly, perceptions are highly selective and limited to one person or one
situation only in the specific context in which social interaction takes
place. Secondly, perceptions involve categorization, that is, grouping
people or objects according to their common characteristics, which allows
drawing distinctions among them. Thirdly, there are sharp distinctions
between categories, which inhibit the development of accurate percep-
tions. The individual variations within the categories cannot be easily
recognized and thus create perceptual bias. In order to increase the
accuracy of the predictions and interpretation of others’ behaviour
Gudykunst and Kim (1997) suggested perception checking, which consists
of three processes: describing others’ behaviour, telling others one’s own

Perception
151
interpretation of others’ behaviour, and asking others if one’s own percep-
tions are accurate. Perception checking should be used when one thinks
that one’s perceptions may not be accurate and one needs to base one’s
own behaviour on accurate perceptions (Gudykunst and Kim, 1997).
Types of perceptions
There are three types of perceptions that play an important role in social
interaction.
1. Perceptions of other people (for example, tourist perceptions of hosts
and host perceptions of tourists)
2. Perceptions of one’s own (tourists’ perceptions of themselves and
hosts’ perceptions of themselves)
3. Perceptions of the perceptions, called metaperceptions, indicate how
others perceive they are perceived (tourist perceptions of how they
are perceived by hosts).
According to Hargie’s (1986) theory of metaperceptions, if the tourists
like their hosts, tourists will perceive that their hosts like tourists, and vice
versa. Similarly, if tourists perceive hosts positively, tourists will also
perceive that hosts perceive tourists positively, and vice versa. This theory
has vital consequences for the assessment of tourist and host perceptions.
Similarity in perceptions may determine tourist and host mutual accept-
ance, affiliation, treatment (Huston and Levinger, 1978; Rokeach et al.,
1960) and, consequently, satisfaction with interaction. In this book the
perceptions of other people (tourist and host perceptions of each other)
are analysed.
Importance of positive perceptions
Perceptions may be negative or positive, and vary in intensity depending
on the environmental influences on judgment. It is critical to develop
positive perceptions in the minds of potential tourists. For instance, the
tourists’ positive perceptions determine the selection of the tourist desti-
nation (McLellan and Foushee, 1983). The more favourable perceptions,
the greater the likelihood of choosing a product from similar alternatives
(Goodrich, 1978). Similarly, tourists’ positive perceptions of hosts deter-
mine the decision to interact with hosts. The more favourable the percep-
tion of the host, the greater the probability of choosing particular hosts
from others for social interaction.

Cross-Cultural Behaviour in Tourism
152
Perceptions versus satisfaction
Perception affects satisfaction. As Mayo (1975) reported, tourists
usually do not have knowledge about the destinations they have not
previously visited. However, they hold perceptions of alternative and
ideal destinations. The differences between their perceptions and reality
affect tourist holiday satisfaction (Phelps, 1986). The smaller the differ-
ences between actual and ideal perceptions, the higher the tourist satis-
faction. The perceptions of a destination, which promise to be similar to
an ideal, provide tourists with the greatest satisfaction (Mayo, 1975).
On the other hand, the greater the gap between actual and ideal percep-
tions, the less likely the destination provides tourists with satisfaction
and the less likely tourists will choose the destination for visitation
(Crompton, 1979b).
The same rule applies to tourist–host contact. The perceptions of hosts
may determine the degree of tourist holiday satisfaction and the actual
selection of a holiday destination. The smaller the gap between the actual
and ideal perceptions of hosts, the greater the satisfaction tourists can
achieve from interacting with hosts, and the more likely tourists opt for
repeat visitation, and vice versa. The destination that promises interac-
tion with ideal hosts and provides tourists with the greatest satisfaction
has the greatest chance for repeat visitation. Consequently, it is vital to
analyse the tourists’ perceptions of their hosts.
Relationship between culture, social interaction and
perception
Perceptions are shaped by a number of external (e.g., economic, social,
cultural, geographical) and internal (e.g., demographic, psychographic,
behaviouristic) environmental factors. These factors are often related
to each other. Many researchers have noted the relationship between
culture, social interaction and perception.
The influence of culture on perception
One of the major elements that directly influences the meaning of percep-
tion is culture (Samovar and Porter, 1991). Culture strongly influences
the environment in which people are raised, it exposes them to experi-

Perception
153
ences and produces meanings. Culture teaches people how to perceive
experiences and interpret meanings. The ways in which people learn to
perceive the world indicate how they should behave. People usually
behave in the way they learned to perceive the world. In the judgmental
processes of own and others’ behaviour, people respond to stimuli
learned from their culture. Which stimuli reach awareness and influence
the judgmental aspect of perceptions and the attachment of meaning to
the stimuli depends upon culturally determined perceptual processes
(Samovar and Porter, 1988). People respond to stimuli that are important
to them. Culture determines which stimuli and criteria of the perceptions
are important. In similar cultures people are exposed to similar experi-
ences and respond to similar stimuli. Different cultures tend to expose
themselves to dissimilar experiences as people respond to different stimuli
and their perceptions of the external world vary.
Cultural variations in perception
There are cross-cultural variations in the perceptions of social objects and
events. These cross-cultural variations in perceptions create barriers to
social interaction (Samovar and Porter, 1988). Since social interaction is
based on the culturally conditioned perceptions of other people, people
bring their unique perceptions of the world to their social contact with
others. They are affected in their interaction processes by their culture,
which teaches them to perceive others from their own unique perspec-
tives. The way they perceive others is determined by cultural values they
have adopted as they grew. Therefore, cultural variations can explain
differences in perceptions. Often, culturally determined perceptual differ-
ences create problems in cross-cultural social interaction. Only a knowl-
edge and understanding of cultural factors can facilitate social interaction
across cultural boundaries.
Empirical studies: the influence of culture on perception
Several empirical studies have been done on the influence of culture on
perceptions (Mayo and Jarvis, 1981; Schneider and Jordan, 1981).
Redding (1980) and Mayo and Jarvis (1981) pointed out that culture
causes different nationalities to perceive differently. People who grow up
in different environments perceive differently because they interpret
causes differently (Segall et al., 1990). Richardson and Crompton
(1988a) suggested that differences in perception between French and

Cross-Cultural Behaviour in Tourism
154
English Canadians were caused by the differences in their cultures
resulting in a different response to market strategies. Keown et al.
(1984) reported the influence of culture on differences in tourist percep-
tions of retail stores in twelve selected countries. Singer (1982) pointed
out, that differences in cultural values created differences in people’s
perceptions. For instance, culturally determined aesthetic values deter-
mined the perception of physical appearance and attractiveness. Ritchie
(1974) found significant differences in individual perceptions of leisure
activities that were caused by differences in personal values and cultural
backgrounds. People with significant differences in personal values had
significantly different perceptions.
Perceived cultural similarity and social interaction
Tajfel (1969) reported that perceptions are influenced by cultural similar-
ity and familiarity. According to Robinson and Nemetz (1988), cultural
similarities bring people together and dissimilarities separate people.
Perceived cultural similarity and familiarity in values decides about
acceptance (Rokeach et al., 1960) and the liking of others (Byrne, 1961;
Byrne and Nelson, 1964; Freedman et al., 1981; Robinson and Nemetz,
1988). The interaction is more likely to progress when people come from
similar backgrounds (Forgas, 1985). The cultural familiarity of physical
appearance generates positive affiliation between people. According to
Huston and Levinger (1978), people desire to associate with those who
are physically attractive to them and will give such people preferential
treatment. Perceived cultural dissimilarity and lack of familiarity results
in negative perceptions and inhibits affiliation (Robinson and Nemetz,
1988).
Similarity of attitudes
Perhaps the most important influence on perceptions and initial contact is
the similarity of attitudes. Those with positive attitudes toward each
other perceive more of the others’ behaviour because more signals can
be filtered (Hargie, 1986). Those with positive perceptions receive and
understand more signals about others’ behaviour, than those with nega-
tive perceptions. The receiving of these signals and their judgments
depends on their meanings to the receiver. If the meanings are culturally
similar and familiar, positive perceptions develop. If the meanings are
culturally dissimilar, negative perceptions result.

Perception
155
Perception of verbal and non-verbal signals
The verbal signals that directly influence perceptions of others in social
interaction may be perceived differently in different cultures. The more
someone else’s language is familiar and culturally similar, the more
positive is the perception of the language and the user of that
language, and the reverse (Robinson and Nemetz, 1988). However,
the same verbal signals may contain different cultural messages. In
one culture loudness may be perceived as strength, in another as
aggressiveness.
The meanings of non-verbal signals such as use of time, space, ges-
ture, or expressions of emotions may be perceived positively or nega-
tively, depending on culture. For instance, the Japanese may be
perceived as happy, whereas, their smiles or giggles may also be per-
ceived as embarrassment (Robinson and Nemetz, 1988). The sequence
of events and the appropriateness of the behaviour in social interaction
can also be perceived differently (Robinson and Nemetz, 1988). For
instance, in some cultures gifts should be opened and shown
(France), in other cultures gifts should be acknowledged and put
away (Japan). People who behave according to rules of appropriate
social behaviour are liked more than those who violate such norms
(Huston and Levinger, 1978). Those who do not comply with the
rules and do not follow the expected sequence of events might be
perceived as bad mannered.
Perception of interaction patterns
Interaction patterns can be perceived differently in various cultures. For
instance, Australians might perceive the formality of Japanese social
behaviour negatively because it is associated with a negative value,
and informality with a positive value. Also, the expectations from inter-
actions as well as experiences with interactions (Freedman et al., 1981;
Zimbardo and Ruch, 1977) can differ. In addition, interaction skills and
the skills necessary to avoid difficulties in social situations; as well as
personalities, motivations, and many other aspects (Shibutani, 1962)
can vary across cultures and create differences in perceptions.
However, as Robinson and Nemetz (1988) pointed out, the perceptions
of culturally different people might be inaccurate because of situation
and environmental factors.

Cross-Cultural Behaviour in Tourism
156
Perceptions and media
Perceptions depend also on the source of information and the way the
information is interpreted in various cultures. Marketing efforts such as
advertising (Gartner and Hunt, 1987), travel agents (Perry, 1978), and
travel brochures (Phelps, 1986) play important roles in the development
of tourist perceptions. Unfortunately, there is often a disparity between
information presented in travel brochures and reality (Phelps, 1986). The
culturally influenced media and the need for a certain type of information
only to be sent to tourists can cause this disparity. Thus, the information
presented in the media can also influence the perceptions of others.
Perception distortion
Perceptions can be distorted by biased sources of information, culturally
influenced media, stereotypes, ethnocentrism, physical appearance, quick
jumping to a conclusion, or ‘hallo effect’. Therefore, perceptions can be
inaccurate (Cook, 1979), often negative and often do not reflect reality.
However, if necessary, they can be changed by culturally correct and
unbiased advertising through media, personal communication or persua-
sion, or perception checking (Gudykunst and Kim, 1997).
Negative perceptions
The development of negative perceptions of culturally different people
depends upon: (1) the degree of cultural dis/similarity in the signals and
meanings; and (2) the knowledge of the others’ culture and its influence
on the meanings of the signals (Robinson and Nemetz, 1988). When there
are great cultural dissimilarities between perceivers, the probability of
negative perceptions of each other is high. Perceived cultural dissimilarity
in values generates perceptual mismatching in interpretations (Robinson
and Nemetz, 1988), and consequently cross-cultural misunderstanding.
Negative perceptions last longer and it is very difficult to change them
once they are developed (Robinson and Nemetz, 1988).
Importance of cultural understanding
In order to avoid negative perceptions of people with different cultural
backgrounds it is important to understand the target culture, how and why
people from other cultures perceive the way they do and the reasons for
cultural dissimilarities, and consequently modify one’s own cultural

Perception
157
understanding (Robinson and Nemetz, 1988). It is particularly important
to know how differences in cultural backgrounds determine differences in
perceptions, and which cultural factors create positive and negative per-
ceptions. Such understanding could facilitate the development of positive
perceptions and deepen understanding between culturally different people.
Measurement of perception
Measurement of perception focuses on the measurement of a respond-
ent’s feelings or beliefs about the object, event or person. The most
common measurement techniques are:
& Open-ended questions& Interviews& Likert Scale (requires indication of degree of agreement or disagree-
ment with a variety of statements related to the perception of an
object/person)& Thurstone Scale (requires generation of a large number of statements
or adjectives reflecting all degrees of favourableness toward an object/
person and for classification of them according to their degree of
favourableness or unfavourableness, usually on a bipolar scale, with
‘very favourable’ at one end, ‘very unfavourable’ at the other end, and
neutral in the middle)& Semantic Differential Scale (requires rating of perceptions on a num-
ber of five- or seven-point rating scales bounded at each end by polar
adjectives or phrases (monopolar or bipolar)& Multidimensional scaling (gives a visual comparison of the perceptions
of different objects/people by plotting the mean ratings for each
object/person on each scale).
Difficulties in measuring social perceptions
Social perceptions (perceptions of people) differ from the perceptions of
physical objects and are more difficult to measure. The perception of
objects is directed at surface characteristics, which are immediately
observable such as size, or volume. The perception of people is concerned
with characteristics, which are not immediately observable, but must be
inferred such as intelligence and attitude. Therefore, social perception
judgments are more complex and difficult to make than judgments

Cross-Cultural Behaviour in Tourism
158
about physical objects. Since social perception is based on inferences
about hidden qualities, more mistakes are made in perceiving people
than in perceiving objects (Forgas, 1985). Additionally, perceived simila-
rities and differences between perceivers and the people perceived can
be sources of bias. The personal bias and the difficulty of detecting
them and then correcting mistakes present serious threats to the accuracy
of judgment and the measurement of social perceptions.
Pre- and post-travel perceptions
One technique, which has been introduced to avoid bias in measuring
social perceptions, is a comparison of pre- and post-travel perceptions.
This technique allows for understanding how perceptions develop and
change over time and has been used numerous times within the tourism
context (Pearce, 1980a; Reisinger, 1990; Cottrell et al., 1999). Researchers
found that tourist pre-travel perceptions of the visited hosts change as a
result of their holiday experience. However, Yum (1988) argued that the
travel experience couldn’t bring changes in post-travel perceptions.
Tourists can modify their perceptions of hosts (Pearce, 1982c) regardless
of whether their perceptions are negative or positive. This view suggests
that pre- and post-travel perceptions are similar and the apparent change
in post-travel perceptions is not significant. For example, Pizam et al.
(1991) found that the travel experience did not change the attitudes of US
students towards the USSR and the Soviet people. Similarly, Milman et
al. (1990) found that the travel experience did not change the attitudes of
Israelis towards Egypt and the Egyptian people. Consequently, tourist–
host contact does not always result in positive/negative change in percep-
tions/attitudes.
Tourists’ and hosts’ perceptions of each other – Asia,
Europe, US and Australia
Tourists’ perceptions of hosts
There are some studies that suggest that tourists form perceptions of their
hosts. Although most of these studies did not distinguish between differ-
ent types of travellers they emphasize the importance of the perceptions
tourists develop of hosts in the overall destination perception.

Perception
159
Importance of the tourists’ perceptions of hostsHosts represent an important part of the tourism product. Thus, the per-
ception of hosts is an important part of the overall tourist perception of
their holiday. Perceptions of hosts are important (Gee et al., 1989) because
the perceptionsmay detract from, or contribute to the success of the tourist
destination (Hunt, 1975). They can influence the tourists’ choice of holiday
destination and may motivate repeat visitation. Tourists are inclined to
visit a destination where they believe the hosts are friendly and courteous
(Gee et al., 1989). For instance, when hotel employees are perceived as
professional and welcoming, tour guides as knowledgeable about their
product, shop assistants as concerned with tourists’ needs and helpful,
then the tourism product quality is enhanced, the tourists’ needs are satis-
fied, and their repeat visitation is encouraged. However, when hosts are
perceived negatively, tourists are discouraged from visitation. Therefore,
negative perceptions of hosts influence tourist dissatisfaction (Mill and
Morrison, 1985) and lead to criticism and a decrease in visitation.
Empirical studiesSeveral studies on international tourist perceptions of their hosts have
been done. Many have emphasized the importance of tourist perceptions
of the host community. According to Hoffman and Low (1978), the
tourist’s perception of local people was the important variable in the
decision to return to the destination. The tourists to Phoenix, Arizona,
who perceived residents as friendly were likely to rate the destination as
excellent, whereas those who perceived the locals as neutral were less
likely to rate it as excellent. Similarly, Ross (1991) reported similar find-
ings for tourists who visited North Queensland, Australia. Pearce (1980a)
pointed out that the degree of liking or disliking of people encountered
on holidays influences the tourists’ perceptions of the region visited.
Pearce (1980a, 1982b) also suggested that the tourist pre-travel favour-
ability toward the visited nationality influenced the tourists’ more posi-
tive post-travel evaluation. ‘When the pre-travel favourability is initially
high, tourists will be mentally prepared . . . to evaluate visited people
positively’ (Pearce, 1980a, p. 14). In other words, the post-travel evalua-
tion of the host community depends on the tourists’ pre-travel percep-
tions. If the pre-travel perceptions are favourable, the evaluation and
attitudes towards the host community will also be favourable, and the
probability of achieving tourist satisfaction high.
One of the largest studies was carried out by the British Tourist
Authority (BTR) (1972a,b,c) in which American (1972a), Canadian

Cross-Cultural Behaviour in Tourism
160
(1972b), and European tourists (1972c) were surveyed about their percep-
tions of the British people. Shipka (1978) surveyed European tourists
about their perceptions of Americans. These studies showed that many
tourists have clear perceptions of the hosts and the countries they visit.
In Australia, the most relevant research on international tourist market
perceptions was conducted by the Australian Tourist Commission (ATC,
1989, 1990). During airline disruptions Australian hosts were perceived as
not caring and unable to serve tourists properly. For this reason many
Japanese tourists chose other destinations for their holiday. Wilson
(1988, p. 49) reported that the ‘Japanese perceptions of anti-Asian atti-
tudes held by some Australians’ deterred Asian tourists from visiting
Australia. Kennedy (1988) reported that Japanese tourists perceived
Australian hosts as rude, bad mannered, and lazy. McArthur (1988)
reported that Japanese tourists were dissatisfied with the lack of profes-
sional service at restaurants and shops, language and communication dif-
ficulties, and poor organization of tours. However, the ATC study (1990)
challenged many negative opinions and showed that not only do
Australian hostsmeet Japanese expectations but they surpass them, declar-
ing that 90 per cent of surveyed Japanese tourists were satisfied with
Australian friendliness, politeness, sincerity and helpfulness, and 82 per
cent of Japanese tourists were impressed by the tour guides performance.
Furthermore, most Japanese tourists wanted to interact with Australian
hosts. These findings were supported by the BTR (1995) study indicating
that 95 per cent of Japanese tourists were satisfied with the service provided
in hotels and restaurants, while 31 per cent were dissatisfiedwith the service
provided in shops and 10 per cent with the availability of service providers
with Japanese language skills. Similarly, Reisinger’s (1990) study showed
that Japanese tourists perceived Australian hosts as professional, friendly,
honest, patient, polite, helpful, concerned about customers, punctual,
good looking, with humour, formal, and not exploitative financially,
although less able to speak the Japanese language than expected. As per
other Asian tourist markets, 99 per cent were satisfied with the service
provided in hotels and restaurants, while 30 per cent were dissatisfied
with the service in shops and 29 per cent with the availability of service
providers with Asian language skills (BTR, 1995).
Indonesians perceived Australians as more friendly and less naive,
arrogant, or insular than in the past (Broinowski, 1992). However,
Hong Kong tourists perceived Australian hosts as unfriendly (Lam, 1992).

Perception
161
Importance of Australian studiesThe important element of the ATC study (1989, 1990) was the presenta-
tion of the vital role of tourist perceptions of Australian people as one of
the motives for tourist visitation to Australia. Tourists’ perceptions
involved hosts with whom tourists came into direct contact while holi-
daying in Australia, and their abilities to serve the tourists and to develop
positive tourist–host relationships that make tourists feel happy and wel-
come. Until the ATC study findings, there was little research done on
tourist perceptions of hosts and detailed information on the Asian tourist
market available to the Australian tourist industry. The ATC study was
most innovative in its approach to Asian tourist market research. The
findings showed that the ‘people factor’ and the issue of satisfaction with
service are of great significance to the Australian tourism industry.
However, there are many other aspects that could have been covered in
this study such as factors influencing the perceptions of the interpersonal
element of service provision. Such analysis would enable a deeper under-
standing of the important factors influencing the interaction between
tourists and hosts, and the service provided to tourists.
Future research issuesThe rapid development of tourism and its internationalization calls for
more studies on tourist behaviour in a cross-cultural environment. Since
the majority of international tourists are from totally different cultural
backgrounds from their hosts, the influence of culture on the interper-
sonal contact between culturally different tourists and hosts needs to be
analysed. Dimanche (1994) called for more studies that explore other
cultures and test cultural differences in a tourism context. ‘We have
much to learn about international tourists and the differences they
show in terms of behaviour, attitudes toward destinations, spending pat-
terns, motivations, satisfaction levels, etc.’ (p. 127). Dimanche (1994)
noted that researchers in consumer behaviour and marketing should
examine the impact of cultural differences on the quality of cross-cultural
interactions between tourists and locals working in the tourism industry.
What do international tourists perceive as most important in social con-
tact with hosts? How do they relate to and perceive hosts who are cultur-
ally different? Do they want to interact with the hosts? Are there any
obstacles to their interaction? What causes international tourist dissatis-
faction with interpersonal contact? These are only a few of the questions
that should be answered in order to respond better to culturally different
tourists.

Cross-Cultural Behaviour in Tourism
162
Another important issue is to recognize that the influence of culture on
the tourist and host behaviour varies depending on different types of
tourists and hosts, and different types of travel arrangements (Nozawa,
1991; Sutton, 1967), the role of culture broker such as tour guide
(Nozawa, 1991), the stage of tourism development and the number of
tourists and hosts, at the destination visited (Husbands, 1986; Nozawa,
1991), amount of information both parties have on each other (Nozawa,
1991), or types of tourism. The distinction between different types of
tourists such as day-trippers, psychocentrics and allocentrics, wanderers,
explorers, etc.; their motivation, length of stay, travel arrangements (indi-
vidual versus group) or type of tourism (e.g., cultural, sport or visiting
friends and relatives tourism) affects the way culture differences influence
tourist behaviour and interaction with hosts. Unfortunately, not many
researchers took these factors into account in their perception studies.
More studies that examine the impact of the above factors on tourist and
host behaviour in a cross-cultural context are needed. Also, the tourism
industry officials, marketers and managers must learn about the differ-
ences in the international tourist behaviour caused by different demo-
graphic and psychographic characteristics of tourists and hosts, and
explore whether the differences, if any, are observed or are attributable
to cultural background or perhaps to socio-economic or demographic
variables. Are all international tourists influenced by cultural differences
in the same way regardless of their age, occupation or socio-economic
status? Are all international tourists influenced by cultural differences to
the same degree regardless of their personality, interests, and preferences
for activities or life style? Are there any cultural obstacles to their satis-
faction and repeat visitation? What does stop international tourists from
repeat visitation of the same destination? These are again only a few of
the questions that should be answered, to be able to respond better to
culturally different tourist needs.
Hosts’ perceptions of tourists
The hosts’ perception of tourists refers to how tourists are seen by their
hosts. Host perceptions of tourists have been studied more frequently
than the tourists’ perceptions of hosts (Pearce, 1982b). However, the
examination of the literature reveals major drawbacks in past studies.
& Firstly, there is a problem in defining the concept of hosts. Some
studies refer to hosts as host communities or local residents, others
to service providers and people in the tourism trade. Therefore, there is

Perception
163
a major conceptual problem in the previous studies analysing host
perceptions.& Secondly, many studies used tourists’ nationality to differentiate
among tourists. The nationality variable was criticized for not ade-
quately reflecting the cultural differences between tourists.& Thirdly, many studies are concerned with perceptions in developed
economies only (Doxey, 1974, 1975; Perrin et al., 1975; Pizam, 1978)
and little is known about perceptions in the developing countries.
Importance of tourists’ nationalityThe literature review indicates that many host communities perceive tour-
ists of different nationalities to be different and behave in different ways
from themselves. It was found that in the destinations where the majority
of the tourists were of different nationality, tourists were perceived to be
different on a variety of characteristics such as behaviour, attitudes, ways
of spending leisure time and morality (Pizam and Telisman-Kosuta,
1989). For example, Wagner (1977) noted that locals saw Scandinavian
tourists as a completely different group of people, with different life style,
behaviour, and dress. However, in destinations that were visited mostly
by domestic tourists, the residents perceived only small differences
between themselves and the tourists (Pizam and Telisman-Kosuta, 1989).
Several studies have been conducted to analyse the influence of nation-
ality on tourist behaviour (Pizam and Sussmann, 1995; Pizam and Jeong,
1996; Pizam and Reichel, 1996; Pizam et al., 1997; Pizam, 1999). These
studies investigated the perception that British, Israeli, Korean and
Dutch tour guides had of tourists of different nationalities on escorted
motor-coach tours. These studies showed that nationality influences the
tourist culture and that there was a significant perceived difference
between the nationalities. For example, in the study of the Dutch tour-
guides’ perceptions of French, Italian, Japanese and American tourists in
the Netherlands the results showed that in eighteen out of the twenty
behavioural characteristics there was a significant perceived difference
between the four nationalities. The Americans were perceived to be the
most distinct from and the Italians the most similar to other nationalities.
The Italians-Americans were perceived by the tour guides as being the
most similar to each other in their behaviour, followed by French-
Italians, Japanese-French, Japanese-Italians, Japanese-Americans and
French-Americans, who were perceived to be the most dissimilar
(Pizam et al., 1997).

Cross-Cultural Behaviour in Tourism
164
In the study of the Israeli tour guides’ perceptions of American,
British, German and French tourists the results also showed that in
eighteen out of twenty behavioural characteristics there was a significant
difference between the four nationalities. The Americans, again, were
perceived to be the most different and the French the most similar to
other nationalities. The tour guide perceived the French-British to be the
most similar to each other in their behaviour, followed by French-
Germans, French-Americans and British-Americans, who were perceived
to be the most dissimilar (Pizam and Reichel, 1996).
Similarly, the study of the Korean tour guides’ perceptions of Japanese
and American tourists showed that in eighteen out of twenty behavioural
characteristics there was a significant perceived difference between the
three nationalities. Korean tour guides perceived the Americans to be
the most distinct among the three. The Japanese were perceived to be
the most similar to other nationalities. The Koreans and Japanese were
perceived to be the most similar to each other, followed by Japanese-
Americans. The least similar were perceived to be the Koreans and
Americans (Pizam and Jeong, 1996).
Dann (1993) criticized the studies that used nationality as a basis for
explaining cultural differences in tourist behaviour. He argued that it is
difficult to define nationality. Nationality of tourists is not always an
indication of their culture. Many tourists may belong to several cultural
groups and/or may have more than one nationality regardless of their
country of birth, ethnic background, and country of origin. Also, the
rapid globalization of the world and increasing growth in multiculturalism
of generating and receiving countries diminishes the validity of nationality
as a differentiating variable; the nationality concept slowly disappears.
Positive perceptions in developed countriesThe perceptions of tourists vary from negative to positive (Belisle and
Hoy, 1980; Cohen, 1971; Pearce, 1982b; Pi-Sunyer, 1978; Pizam, 1978;
Sethna and Richmond, 1978; Smith, 1989; Thomason et al., 1979). Many
positive perceptions of tourists have been noted in technologically devel-
oped countries. For instance, despite negative social effects of tourism
development, Londoners were happy about the tourist presence (English
Tourist Board, 1978). Although Americans complained about the
increase in the number of tourists, they developed friendships with tour-
ists (Rothman, 1978). Arab males developed friendships with Western
tourist girls visiting Israel (Cohen, 1971). Perceptions were found to be

Perception
165
significantly more positive if the traveller had a strong affiliation with a
country visited (Langlois et al., 1999). Positive perceptions of tourists and
the development of friendships between tourists and hosts have also been
noted in technologically unsophisticated countries (Boissevain, 1979).
According to Sutton (1967), these positive perceptions have been devel-
oped because the opportunity for exploitation and mistrust did not exist,
and a sense of a welcoming and pleasant atmosphere was created.
Negative perceptions in developed countriesNegative perceptions of tourists have also been noted in technologically
developed countries. Catalans perceived English hosts as stiff and
dependable. French tourists were perceived as pushy, Germans as stingy,
and Italians as untrustworthy (Pi-Sunyer, 1978). Tourists did not seem to
be welcome in Bali. The Balinese hosts’ friendly attitude to tourists was
superficial (Francillon, 1975). The Basques found tourists unpleasant and
conflictful (Greenwood, 1972).
Destinations with a great number of touristsA number of studies indicated that hosts developed negative perceptions
of tourists in the destinations receiving a great number of tourists such as
Spain, Greece, Hawaii, and the Caribbean (Bryden, 1973; Kent, 1977;
Matthews, 1977) and that due to tourism development the hosts’ percep-
tions of tourists became complex (Schild, 1962; Yum and Wang, 1983).
According to Butler (1980), as tourism expands ‘the large numbers of
visitors and the facilities provided for them can be expected to arouse
some opposition and discontent among permanent residents’ (p. 8).
Feelings of anxiety, jealousy, xenophobia, disinterest, rudeness, and
even physical hostility develop among host communities (Pearce,
1982b; Smith, 1977, 1989). Smith (1977) reported that as the tourist
numbers increased, Eskimo hosts began to resent tourists due to lost
privacy. Hosts felt social stress when tourists invaded their day-to-day
life (Smith, 1977). There was a perception that tourists were responsible
for the deterioration in the hosts’ standard of living. Negative perceptions
of tourists were also emphasized (Taft, 1977). Many studies indicated
that with the development of mass tourism, tourists are no longer seen
as individuals but as an exploitative out-group. Mass tourism results in a
growing lack of concern, loss of empathy, and even intolerance toward
outsiders (Pi-Sunyer, 1978). The positive perceptions of tourists disap-
pear and turn into negative stereotypes (Pi-Sunyer, 1978). The Catalan
community locals showed dislike towards tourists (Pi-Sunyer, 1978).
Negative perceptions justified discrimination of tourists in the area of

Cross-Cultural Behaviour in Tourism
166
services and prices (Pi-Sunyer, 1978). Similarly, as the number of
Japanese tourists increased in Australia, the public became hysteric,
intolerant, and biased against the Japanese, who were being abused
and insulted (White, 1988). People in the service sector displayed negative
attitudes toward Japanese tourists on the Gold Coast in 1988 and 1989.
Many Japanese tourists were going home complaining (McArthur, 1988),
dissatisfied, with negative perceptions of Australian hosts.
Perception versus attitude, image and attribution
The concept of perception is related to the concept of attitude, image and
attribution that can also influence tourist–host contact.
AttitudeAttitude is formed on a basis of perception (Chon, 1989) and consists of
similar components to perception (Krech and Crutchfield, 1948;
McGuire, 1969; Moutinho, 1987; Newcomb et al., 1965). It is possible
to predict attitude from perception. Attitude as perception may be posi-
tive or negative, and may vary in intensity.
Attitude measurementA well-known technique for attitude measurement is Bogardu’s (1925)
Social Distance Scale, in which subjects are asked to indicate whether
they would be willing to be in close relationships with members of a
particular group. The Semantic Differential technique is also a well-
known, accepted and reliable method of measuring attitudes (Snider
and Osgood, 1969). In addition, several multi-attribute models have
been developed in an attempt to relate attitudes to behaviour (Fishbein
and Ajzen, 1975).
Attitude studiesThe literature reveals that there are many studies done on attitudes and
they can give some insights into the analysis of tourist–host contact. Much
of the research has been done on the hosts’ attitude toward tourists
(Pi-Sunyer, 1978; Rothman, 1978), tourists’ post-travel attitude change
(Anastasopoulos, 1992; British Tourist Authority, 1972a, 1972b, 1972c;
Chon, 1991; Cort and King, 1979; Milman et al., 1990; Pearce, 1980a,
1982b, 1988; Pizam et al., 1991; Shipka, 1978; Smith, 1955, 1957;
Steinkalk and Taft, 1979; Stringer and Pearce, 1984), local residents’

Perception
167
attitudes to the impact of tourism and tourists (Bystrzanowski, 1989;
Milman and Pizam, 1988; Pizam, 1978; Sheldon and Var, 1984;
Thomason et al., 1979; Akis et al., 1996), students-tourists attitudes to
hosts (Pizam et al., 1991; Steinkalk and Taft, 1979; Smith, 1955, 1957),
influence of social interaction on tourists’ attitudes (Sheldon and Var,
1984), influence of seasonality on attitudes (Sheldon and Var, 1984),
influence of tourist–host ratio on attitudes (Long et al., 1990), tourists’
attitudes to foodservice styles (Cai and Ninemeier, 1993), and the tour-
ists’ attitudes to tourist destinations (Weber and Mikacic, 1995). Some
studies demonstrated the existence of anti-tourists attitudes (Jacobsen,
2000). The interesting finding was that those employed directly in the
tourism industry have more positive attitudes towards tourists than
those not so employed (King et al., 1993; Milman and Pizam, 1988),
probably due to greater experience with dealing with tourists and easier
access to information about tourists. However, Liu and Var (1986) did
not agree that dependence on tourism is a significant factor in developing
positive attitudes toward tourists. Some researchers tried to explain the
positive and negative attitudes to tourists as a function of the stage of
tourism development (Belisle and Hoy, 1980). Several researchers
explained the role of positive attitudes towards tourists in determining
a tourist visitation to a destination (Hoffman and Low, 1978; Ritchie and
Zins, 1978) and evaluation of tourist destination (Gearing et al., 1974).
Pleasant attitudes to tourists ranked second in a list of ten tourism attri-
butes of a holiday destination (Goodrich, 1978).
Limitations of the attitude studiesThe major limitation of the past studies is that most of them are descrip-
tive in nature and focus on differences in attitudes. Also, there has been
little attention paid to explanations of these differences. In addition, most
of the studies have small sample sizes and focus on students rather than
tourists. Moreover, the concepts of an attitude and perception have been
used interchangeably, often mistakenly. Many researchers have not
acknowledged the differences between these two concepts.
Further, the use of an attitude concept might be limited in the analysis
of tourist–host contact. Firstly, it is difficult to predict behaviour from
attitudes (Cialdini et al., 1981; Fishbein and Ajzen, 1975, 1980; Fridgen,
1991; Robertson, 1985). For instance, what people did do and what they
said they would do is not the same thing (LaPiere, 1934). Secondly, a
stay-at-home control sample is needed to evaluate the effect of contact on
attitudes (Campbell and Stanley, 1966). Finally, travel motivations

Cross-Cultural Behaviour in Tourism
168
should be analysed to understand attitudes and their effect on social
contact, clarify its purpose and its meanings for the participants
(Triandis and Vassiliou, 1967).
ImageThe importance of image has been recognized in the tourism literature
(Ashworth and Goodall, 1988; Ahmed, 1991; Britton, 1979; Baloglu and
McCleary, 1991; Bojanic, 1991; Bignon et al., 1998; Baloglu and
Mangaloglu, 2001; Crompton, 1979b; Chon, 1990, 1991, 1992; Choi et
al., 1991; Chen and Kerstetter, 1999; Chaudhary, 2000; Dimanche and
Moody, 1998; Echtner and Ritchie, 1991, 1993; Fakeye and Crompton,
1991; Goodrich, 1978; Hunt, 1975; Hall et al., 1999; Jenkins, 1999; Lubbe,
1998; Mayo, 1973, 1975; McLellan and Foushee, 1983; Moutinho, 1984;
MacKay and Fesenmaier, 1997; Pearce, 1982a; Phelps, 1986; Schmoll,
1977; Telisman-Kosuta et al., 1989; Woodside and Lysonski, 1989). It
was noted that image determines destination choice, successful tourism
development, tourism marketing strategies, and travel decision-making.
Further, image plays an important role in evaluating tourist behaviour
and satisfaction. Therefore, image is a useful concept in analysing social
interaction between tourists and hosts, and satisfaction with this inter-
action.
The most common method for measuring image is to ask the respond-
ents to choose adjectives from a given list that best describe various
national groups or destinations (Katz and Braly, 1933). However, this
method has been criticized for forcing respondents to choose from a
given list. Another method requires respondents to judge how far apart
different groups are on a scale from very similar (1) to very different (9).
AttributionAttribution is a process of ascribing characteristic qualities to people or
things. Tourists and hosts attribute certain qualities to their behaviour
and try to explain what causes their behaviour. The process of attribu-
tion is not only important for an understanding of social interaction
between tourists and hosts but also their satisfaction with each other.
According to Valle and Wallendorf (1977), tourist behaviour may be
attributed either to the tourist (an internal attribution such as person-
ality), or the situation or environment (an external attribution such as
cultural environment). Tourists who attribute their dissatisfaction to the
external environment can be more dissatisfied than tourists who attrib-
ute their dissatisfaction to themselves (Francken and Van Raaij, 1981).
However, Bochner (1982) noted that hosts and tourists might be biased

Perception
169
in their attributes because they have less knowledge about those who
are perceived than about them. This particularly applies to culturally
different tourists and hosts who have little access to information about
each other. Therefore, since people attribute differently, misunderstand-
ing may occur (Triandis, 1975). The scope for misunderstanding may be
particularly great when tourists and hosts from different cultures make
different attributions.
Stereotyping
The concept of perception is also related to the concept of stereotype
(Fridgen, 1991; Lippman, 1965; Pool, 1978; Triandis, 1972). Stereotyping
refers to the attribution of certain traits, labelling, and perceptions of
people on the basis of common characteristics. Jandt (1988) referred to
stereotyping as judgments about others on the basis of their ethnic group
membership. Stereotypes can also be developed in the basis of culture,
occupation, age, or sex. Scollon and Scollon (1995) noted that stereotyp-
ing is simply another word for overgeneralization. Stereotypes generalize
about a group of people on the basis of a few individuals belonging to
only that group. People use stereotypes when they face a new situation
and lack deep knowledge of each other.
Importance of stereotypesStereotypes are important for the study of tourist–host contact because
they are useful in the description of tourists (Brewer, 1984) as well as
hosts. Brewer (1984) made the distinction between general and specific
stereotypes. Stereotypes often form the core of the perceptions tourists
and hosts use to interact with each other. MacCannell (1984) noted that
tourists and hosts are vulnerable to stereotypes that can easily influence
perceptions tourists and hosts hold of each other, and even decide about
tourist visitation. Positive stereotypes may attract tourists. For example,
stereotypes of Tahitian women as beautiful helped to attract many tour-
ists (Petit-Skinner, 1977). Stereotypes are also useful in distinguishing
various categories of tourists (Pi-Sunyer, 1978). They can be used to
explain tourist and host behaviour, and guide hosts and tourists in
their mutual interaction. They can show a convenient way of how to
interact during superficial and short-term relationships, and can establish
a base for later understanding (Frankowski-Braganza, 1983). They pro-
vide a model for the tourist–host interaction (Frankowski-Braganza,

Cross-Cultural Behaviour in Tourism
170
1983) because they provide an effective way of dealing with unknown
people and managing unfamiliar interactions (Lippman, 1922).
Stereotypes studiesNumerous studies have investigated the stereotypes of national groups
and different types of stereotypes have been identified (Brewer, 1978,
1984; Boissevain and Inglott, 1979; Buchanan and Cantril, 1953; Callan
and Gallois, 1983; Chandra, 1967; Jahoda, 1959; Laxson, 1991; Nunez,
1977; Pi-Sunyer, 1978; Pi-Sunyer and Smith, 1989; Triandis, 1972;
Triandis and Vassiliou, 1967; Turner and Ash, 1975). In many destina-
tions residents have been found to have specific stereotypes of the tourists
by nationality. Tourism industry employees also suggested that tourists of
different nationality behave differently. For instance, the Japanese were
always described as travelling in groups, bowing to everybody they meet,
spending, and photographing heavily (Cho, 1991). Ritter (1989) described
the Japanese as those who prefer to travel in groups for a short time only,
because a long holiday and being away from a group and family means
painful separation and psychological lack of well-being. Koreans were
portrayed as being proud of their own identity, willing to accept every-
thing that has similarities to the Korean way of life, insisting on going to
Korean restaurants, preferring to travel in groups, and proud of travelling
to Asian countries with Confucian philosophy (Business Korea, 1991).
According to Kitano (1981), Asians were perceived as exotic people,
who all looked alike. ‘Koreans were mistaken for Japanese, who in turn
were taken for Chinese, who in turn were seen as still another nationality’
. . . ‘even though their languages and cultures may be totally different’
(Kitano, 1981, p. 126). American tourists were stereotyped according to
the general traits, which Mexicans assigned to all Americans such as being
cautious, calculated, purposeful, and careful with money (Brewer, 1984).
Americans were also described as loving originality and being close to
nature, desiring freedom, and social acceptance (Ritter, 1987). Swedish
tourists were characterized by the Maltese residents as being misers, and
French and Italians as excessively demanding (Boissevain and Inglott,
1979). Catalans stereotyped English tourists as stiff, honest, dependable,
and socially conscious (Pi-Sunyer, 1978).
Weaknesses of stereotypingAlthough stereotypes have a ‘kernel of truth’ in their description of the
characteristic of the group, they are in many cases inaccurate (Brislin,
1981). ‘Stereotyping is a way of thinking that does not acknowledge
internal differences within a group and does not acknowledge excep-

Perception
171
tions to its general rules’ (Scollon and Scollon, 1995, p. 156). This
results in a tendency to regard all members of a particular group in a
similar way without acknowledging the differences between them. Many
stereotypes are wrong and exaggerated. Often the negative attributes are
emphasized, while the positive are ignored (Lustig and Koester, 1999).
As a result, stereotyping leads to errors in interpretation and the judg-
ing of human behaviour. This has harmful consequences for the label-
ling of a group of people and interpreting their behaviour (Lustig and
Koester, 1999). Stereotyping limits the understanding of human beha-
viour (Scollon and Scollon, 1995). Stereotypes may promote prejudice
and discrimination of members from cultures other than one’s own
(Lustig and Koester, 1995).
Further, stereotypes develop without any proof in reality (Katz and
Braly, 1933; LaPiere, 1936; Pepitone, 1986). For example, hosts develop
stereotypes from gossip, government propaganda, observing tourists, and
personal past experience in dealing with tourists. Tourists develop stereo-
types of hosts from tourist literature, the media, educational sources,
prior travel experience, or other holidaymakers.
Negative stereotypesA large number of stereotypes are negative and refer to unfavourable traits
(Pepitone, 1986). For instance, the common stereotype of the tourist is one
who is rich, loud and insensitive to host community needs, being devoid of
human qualities, and faceless strangers (Pi-Sunyer, 1978). The classic
stereotype of the host is one who is poor and has power to exploit guests
during economic transactions (Frankowski-Braganza, 1983). Negative
stereotypes are harmful because they create distrust, lead to discrimination
and rude and hostile behaviour (Fridgen, 1991), and impede social inter-
action (Jandt, 1998). It is difficult to foster interaction if stereotypes are
negative. Negative stereotypes are usually maintained when social contact
is minimal.When social contact is prolonged, stereotypes may be adjusted.
They can be adjusted in accordancewith observed behaviour (Frankowski-
Braganza, 1983). However, it was also argued that stereotypes are recipro-
cal and difficult to change. They are inflexible and long lasting.
Positive stereotypesAlthough a large number of studies describe negative stereotypes
(Kitano, 1981) there have also been a few studies on positive stereotypes.
For example, the Chinese and Japanese were perceived as hard-working,
quiet, achievement oriented, and with a minimum number of social

Cross-Cultural Behaviour in Tourism
172
problems. Australians were perceived (by the Japanese) as significantly
more friendly, good, pleasant, beautiful, trustworthy, kind, powerful, and
strong (Pittam et al., 1990). The Japanese were perceived (by the
Australians) as significantly more gentle, educated, rich, powerful, suc-
cessful, and ambitious than themselves. The Japanese were also perceived
to be progressive, alert, scientifically minded, courteous, and artistic.
Australians perceived themselves as happy-go-lucky and pleasure loving
(Callan and Gallois, 1983; Kippax and Bridgen, 1977). Australians were
also perceived to be materialistic and ambitious. The Japanese perceived
themselves as reserved, formal, cautious, and evasive (Barnlund, 1975).
Iwawaki and Cowen (1964) suggested that the Japanese are suppressive,
cautious, and meticulous.
Ethnocentrism
Ethnocentrism is a belief in one’s own cultural superiority; that the cus-
toms, traditions, beliefs and behavioural practices of one’s own culture are
better to those of other cultures. The concept of ethnocentrism comes from
the Greek words ethos, people or nation, and ketron, centre, which mean
being centred on one’s cultural group. Judgments of others and interpreta-
tion of others is done according to the categories of one’s own culture.
Those from other cultures who behave and do things differently are per-
ceived as being badmannered andwrong. Assessment of others andwhat is
right or wrong often creates negative responses to those who are culturally
different. Their cultures are treated as deviations from normality.
Ethnocentrism generates emotional reactions to cultural differences
and reduces people’s willingness to understand different cultures
(Lustig and Koester, 1999). People who believe in cultural superiority
are not able to objectively assess other cultures and those who are dif-
ferent, and interpret and judge others’ behaviour. Ethnocentrism limits
peoples’ ability to understand the symbols and meanings used by other
cultures. Ethnocentrism also tends to exaggerate cultural differences by
highlighting the most distinct differences in beliefs and practices and
ignoring others. Ethnocentrism blocks effective intercultural interaction
and communication because it does not allow for understanding those
who are different. Ethnocentrism leads to cultural arrogance, avoidance,
withdrawal, faulty attribution, and faulty categorization (Dodd, 1995). It
can also lead to prejudice and discrimination. Extreme ethnocentrism
may lead to conflict and even warfare (Rogers and Steinfatt, 1999).

Perception
173
Discussion points and questions
1. Explain why the concept of an attitude is less effective in the analysis
of tourist–host contact than the concept of perception.
2. Identify major characteristics of the perception concept.
Summary
Perception refers to the process of attributing meanings to the envir-
onmental stimuli, internal experience, impression, and interpretation
of others’ behaviour. Perceptions are subjective and they differ from
reality. Perceptions are selective, involve categorization and don’t
recognize individual variations. The concept of perception is import-
ant for social interaction. Perceptions of others may be positive or
negative. The positive perceptions of others encourage social interac-
tion and affect satisfaction with this interaction. There is a relation-
ship between culture, social interaction and perception. Perceptions
are determined by culture. Differences in culture create barriers to
social interaction. Cultural similarity generates positive perceptions,
dissimilarity results in perceptual mismatches. Knowledge of the
others’ culture and its influence on social behaviour is necessary to
avoid negative perceptions of others. There are several techniques for
measuring perceptions. Perceptions of people are more difficult to
measure than perceptions of physical objects as they may be subject
to more bias. The tourists’ perceptions of hosts are an important part
of holiday perception. They may determine tourist holiday satisfaction
and attract or deter tourists from a destination. There are studies that
show the vital role of tourists’ perceptions of hosts. Many studies have
been done on hosts’ perceptions of tourists. The importance of tour-
ists’ nationality for differentiating tourists was acknowledged. More
studies on hosts’ perceptions of tourists have been done in developed
countries than in developing countries.
The concept of perception is also related to the concept of an
attitude, image, and attribution. The use of an attitude is limited in
the analysis of tourist–host contact. Stereotyping leads to errors and
limits the understanding of human behaviour. Ethnocentrism is a
belief of cultural superiority and limits people’s ability to understand
other cultures.

Cross-Cultural Behaviour in Tourism
174
3. Give three examples of the international tourists’ perceptions of the
locals at the destination visited. Compare these perceptions with the
locals’ perceptions of the international tourists at the same destina-
tion.
4. Explain the ways culture influences perceptions.
5. Do you agree with the statement that perceived cultural similarity
and familiarity enhances social interaction? Give three examples of
the cultural differences between people that make them attractive to
each other and enhance their social interaction.
6. Identify five objections to using nationality as a variable for differ-
entiating tourists from different cultural backgrounds.
7. Give five examples of the positive and negative stereotypes of inter-
national tourists. Do you agree that these stereotypes reflect the real
characteristics of these tourists?
8. Why do we use stereotypes? Why are stereotypes often inaccurate?
Why are stereotypes helpful? Why are stereotypes dangerous? Can
we modify and/or eliminate stereotypes?
9. Why is ethnocentrism a problem in a tourism context? Why do we
cling to ethnocentrism? How can we overcome ethnocentrism: (a)
why learn about others? (b) Why learn about us?
Since perceptions affect satisfaction, the last part of the literature review
examines the concept of tourist satisfaction in reference to tourist–host
contact.
Further reading
Allport, G. (1954/1979) The Nature of Prejudice. New York: Doubleday
Anchor; Reading, MA, Addison-Wesley.
Brewer, M. and Campbell, D. (1976) Ethnocentrism and Intergroup
Attitudes. New York: Wiley.
Brislin, R. (1981) Cross-Cultural Encounters: Face-to-Face Interaction.
New York, Pergamon.
Macrae, N., Stangor, C. and Hewstone, M. (1996) Stereotypes and
Stereotyping. New York: Guilford.
Robinson, J. and Nemetz, L. (1988) Cross-Cultural Understandings. UK:
Prentice-Hall International.
Van Dijk, T. (1987) Communicating Racism: Ethnic Prejudice in Thought
and Talk. Newbury Park, CA: Sage Publications.

6Satisfaction
Objectives
After completing this chapter the reader should
be able to:
& understand the multi-faceted nature of
satisfaction and difficulties in defining
satisfaction
& identify dimensions of satisfaction
& understand the concept of service and service
quality
& identify dimensions of service quality
& understand the relationship between service
quality and satisfaction
& understand the importance of the
interpersonal element of service
& identify major techniques for measuring
satisfaction and the difficulties involved in
this process.

Cross-Cultural Behaviour in Tourism
176
Introduction
The aim of this chapter will be to explain the concept of satisfaction.
Reference will be made to satisfaction with service, in particular, satisfac-
tion with the quality of interpersonal interaction between a tourist and a
service provider in the process of service delivery. The techniques for
measuring satisfaction will be introduced.
Concept and definitions
Although the literature review indicates that some efforts have been made
to analyse the concept of satisfaction (e.g. Allen et al., 1988; Bowen, 2001;
Cho, 1998; Chon, 1987; Dorfman, 1979; Geva and Goldman, 1991;
Hughes, 1991; Lewis and Pizam, 1982; Lopez, 1980; Loundsbury and
Hoopes, 1985; Mayo and Jarvis, 1981; Mossberg, 1995; Pearce, 1980a,
1984; Pizam et al., 1978, 1979; Pizam, 1994; Pizam and Milman, 1993; Qu
and Li, 1997; Rimmington and Yuksel, 1998; Ryan, 1991, 1995; Weber,
1997; Whipple and Thach, 1998; Zalatan, 1994), this concept is still
‘undefined and methods of measurement are not provided’ (Engledow,
1977, p. 87). There is a lack of research in forming a definition of satis-
faction (Swan and Combs, 1976) and ignorance of consumer satisfaction
studies in general (Pizam et al., 1978). The definitions of satisfaction
(given below) show the difficulty of defining satisfaction.
Expectations versus experiencesAccording to the normative standard definition (Cadotte et al., 1982),
satisfaction refers to the comparison of expectations with experiences in
terms of performance: when experiences differ negatively from expecta-
tions, dissatisfaction occurs. In tourism, satisfaction is primarily referred
to as a function of pre-travel expectations and post-travel experiences
(LaTour and Peat, 1980; Moutinho, 1987; Swan and Martin, 1981;
Whipple and Thach, 1988). Tourist satisfaction has been defined as the
result of the comparison between expectations about the destination and
a tourist’s experience at the destination visited (Pizam et al., 1978). When
experiences compared to expectations result in feelings of gratification,
the tourist is satisfied; when they result in feelings of displeasure, the
tourist is dissatisfied (Pizam et al., 1978). Similarly, Hughes (1991)
noted that tourists whose expectations are fulfilled by their experiences
report satisfaction, while those whose expectations are not fulfilled report
dissatisfaction. ‘The greater the disparity between expectations and

Satisfaction
177
experiences, the greater the likelihood of dissatisfaction’ (Hughes, 1991,
p. 168). According to Shames and Glover (1988), satisfaction results only
when the expectations are met or exceeded. According to Knutson
(1988), the best way to satisfy customers is to exceed their expectations.
Knutson (1988) cited ten laws that help to achieve customer satisfaction
such as focusing on customers’ perceptions, creating positive first impres-
sions, and fulfilling guests’ expectations.
Relativity of the satisfaction conceptHughes (1991) and Olander (1977) reported the relativity of the satisfac-
tion concept. Hughes (1991) found that even though experiences did not
fulfil tourists’ expectations, tourists might still be satisfied. He distin-
guished three levels of positive satisfaction: very satisfied, quite satisfied
and satisfied. Hughes (1991) noted that those who rate their expectations
and experiences as very similar express high satisfaction; those who rate
their expectations and experiences as only somewhat alike report a lower
level of satisfaction. The level of satisfaction decreases when expectations
are not fulfilled. Pearce (1988) suggested that satisfaction or fulfilment of
expectations might also depend on how much people value the outcome
or result of those expectations. In other words, satisfaction depends on
people’s values or beliefs. This notion was supported by Olander (1977)
who pointed out that satisfaction should be assessed in relation to certain
standards such as values or beliefs.
Expectations versus performanceSatisfaction was also defined as differences between expectations and
(experiences of) performance (Oliver, 1989; Van Raaij and Francken,
1984). However, this definition was criticized for assuming that expecta-
tions are adequate predictors of satisfaction. In fact, the most satisfying
experiences are those not expected. Therefore, the definitions of satisfac-
tion based on experiences and expectations are regarded as inadequate.
Expectations versus perceptionsMany scholars agreed that satisfaction derives from the differences
between expectations and perceptions (Nightingale, 1986; Parasuraman
et al., 1985). Moutinho (1987) and Van Raaij and Francken (1984)
referred to satisfaction as the degree of disparity between expectations
and perceptions of performance. Chon (1989) defined tourist satisfaction
as the fit between expectations and perceived outcome of the experience.
Hughes (1991) noted that satisfaction is primarily determined by tourists’
perceptions.

Cross-Cultural Behaviour in Tourism
178
Input versus output of social exchangeSatisfaction is also referred to as the process of comparison between what
one expects with what one receives (Oliver, 1989). If one gets what one
expects, then one is satisfied, and vice versa. The equity definition of
satisfaction (Swan and Mercer, 1981) compares perceived input-output
(gains) in a social exchange: if the gains are unequal, the larger is dis-
satisfaction. For instance, if tourists receive less than they pay for, the
input-output balance is inequitable, and tourists are dissatisfied.
Satisfaction is, therefore, a ‘mental state of being adequately or inade-
quately rewarded . . .’ (Moutinho, 1987, p. 34). However, as it was
pointed out before, satisfaction depends on how much people value the
result of such exchange (Pearce, 1988).
Fit between expectations and environmentTourist satisfaction is related to the fit between expectations and fit to the
environment (Hughes, 1991). The degree of fit depends on the tourists’
expectations and the ability of the environment to meet these expecta-
tions. For instance, the fit between tourists and hosts increases when
hosts are able to meet tourists’ expectations. As the degree of fit increases,
tourist satisfaction also increases. According to Hughes (1991, p. 166),
the optimal fit between individuals’ expectations and the environment
occurs when the attributes of the environment are congruent with
the individuals’ beliefs attitudes, and values. In other words, the optimal
fit between tourists and their environment is achieved when the host
environment reflects the values of its visitors (Hughes, 1991).
Fit between the tourist and the host value systemAccording to Pearce and Moscardo (1984), tourist satisfaction is higher if
the value system of the tourist fits into the value system of the host.
Where values and value orientations do not fit, mismatch can lead to
feelings of stress, anxiety, uncertainty, and result in dissatisfaction.
Therefore, one condition of tourist satisfaction with hosts is the match
between tourists’ and hosts’ value systems.
Satisfaction versus attributionThe process of attribution has also explained the satisfaction concept. An
attribution definition of satisfaction refers to positive or negative discon-
firmation of expectations. ‘A negative disconfirmation (when actual is not
as expected) results in dissatisfaction. A positive disconfirmation (when
actual is better than expected) results in satisfaction’ (Hunt, 1991, p. 109).
A disconfirmed expectation can be attributed to external forces (e.g.,

Satisfaction
179
specific situation) or internal forces (e.g., characteristics of an individual)
(Pearce and Moscardo, 1986).
Internal and external attributionTourist satisfaction may be attributed either to the tourist (an internal
attribution) or the situation and environment (an external attribution)
(Valle and Wallendorf, 1977). Tourists who attribute their dissatisfaction
to external factors (e.g., facilities, service) can be more dissatisfied than
tourists who attribute their dissatisfaction to internal factors (e.g., them-
selves) (Van Raaij and Francken, 1984). Consequently, those tourists and
hosts who attribute their dissatisfaction to external attribution (e.g., dif-
ferences in cultural values) can be more dissatisfied than those who attri-
bute their dissatisfaction to internal attribution (e.g., own personality).
One can argue that cultural values could be seen as internal attributes.
However, since culture belongs to the external environment that influ-
ences tourist behaviour it is assumed that the influence of cultural differ-
ences on the tourist experiences is attributed to external forces.
Understanding the attribution process is extremely important in explain-
ing the concept of tourist dissatisfaction because it allows for gaining
more insight into its causes.
Pre-travel favourability versus post-travel evaluationIt was also noted that tourist satisfaction is dependent on the pre-travel
favourability toward the destination visited, which contributes to the
post-travel evaluation of the destination (Pearce, 1980a). If the pre-travel
favourability is initially high, tourist post-travel evaluation is positive
(Pearce, 1980a). In other words, positive pre-travel perceptions result in
satisfaction and positive post-travel evaluation. This observation sup-
ports Hughes’ (1991) view that satisfaction depends on perception.
However, according to Pearce (1980a), the initial favourability is not
always a guarantee of satisfaction, since the pre-travel perceptions can
change due to travel experience. In addition, the holidays that leave the
tourist a little unsatisfied, generate more return visits than holidays with
the highest satisfaction scores. Although Japanese tourists were dissatis-
fied with some areas of service, they wished to come back to Australia for
a holiday (Reisinger, 1990).
Satisfaction as a multi-faceted conceptThere is an assumption by many researchers that satisfaction is a uni-
faceted concept. However, this is mistaken because satisfaction is a multi-

Cross-Cultural Behaviour in Tourism
180
faceted concept that consists of a number of independent components
(Hughes, 1991; Pizam et al., 1978). Thus, holiday satisfaction is also a
multi-faceted concept that consists of many independent aspects of the
holiday experiences such as facilities, natural environment or services,
and which needs to be analysed separately. The identification of satisfac-
tion with separate components of a total tourist holiday can indicate the
dissatisfying aspects of the holiday experiences. It can also reduce mis-
understanding of which component causes dissatisfaction within the
whole product (Whipple and Thach, 1988).
Satisfaction with hostsThe vital component of tourist holiday satisfaction is satisfaction with
hosts. In this book hosts are referred to as service providers. Service
providers are part of a tourist holiday and they are the first contact
point for tourists, and remain in direct contact with tourists through
an entire visit. Consequently, the tourist’ satisfaction with service provid-
ers may significantly affect total holiday satisfaction. Satisfaction with
hosts can increase international visitation, generate repeat purchases of
the same tourism product, increase tourist expenditures, and extend the
tourist stay.
Dimensions of satisfactionIn order to assess tourist satisfaction it is necessary to analyse different
dimensions of satisfaction (Pizam et al., 1978). The two major dimensions
of satisfaction are the instrumental dimension that represents satisfaction
with physical performance (e.g., loudness) and expressive dimension that
represents satisfaction with psychological performance (e.g., comfort)
(Swan and Combs, 1976). Satisfaction with hosts should be analysed
by measuring satisfaction with both the hosts’ physical (e.g., appearance,
promptness) and psychological (e.g., hospitality) performance.
Importance of psychological dimension of satisfactionBy identifying various performance dimensions of satisfaction, it is pos-
sible to analyse the causes of dissatisfaction (Ojha, 1982). According to
Ojha (1982, p. 23), there are tourists who are satisfied in spite of the
problems with physical product, and there are tourists who are dissatis-
fied in spite of the best product. The best physical product may not
compensate for psychological dissatisfaction. Therefore, the psychologi-
cal dimension of satisfaction is extremely important. As Ojha (1982, p.
24) pointed out, satisfaction ‘does not come only from good sights but
from the behaviour one encounters, the help one receives, the informa-

Satisfaction
181
tion one gets and the efficiency with which his needs are served’.
Similarly, Pizam et al. (1978) emphasized the vital role of the psycholog-
ical dimension of satisfaction such as hospitality of the host community,
which was defined as willingness to help tourists, friendliness, and cour-
tesy toward tourists. The procedural fairness definition of satisfaction
(Goodwin and Ross, 1989) indicates that satisfaction derives from the
perceptions of being treated fairly. Therefore, the expressive dimension of
satisfaction (satisfaction with psychological performance) should be
measured when analysing tourist satisfaction with hosts.
Outcomes of dissatisfactionThe outcomes of dissatisfaction may be various. According to
Moutinho’s (1987) theory, tourists may either change destination or
continue visitation, with or without interaction with hosts. Extremely
dissatisfied tourists may choose to change a destination for their holi-
day. The dissatisfied tourists may either change a destination or decide
to continue visitation with no intention for further interaction with
hosts. Satisfied and extremely satisfied tourists may either continue vis-
itation with the intention of further interaction or may change a desti-
nation. According to Pearce’s (1988) theory, the satisfied tourists may
return to a destination, recommend it to other tourists, or express
favourable comments about it. The dissatisfied tourists may not return
to a destination and may not recommend it to other tourists. They may
also express negative comments about a destination and damage its
market reputation.
Satisfaction versus customer service quality
The concept of satisfaction is often discussed in relation to satisfaction
with social relationships (Dorfman, 1979) and customer services
(Whipple and Thach, 1988). It seems that tourist satisfaction can also
be explained in terms of satisfaction with service. As Urry (1991) pointed
out, services offered to tourists are high contact services and are char-
acterized by a direct person-to-person interaction. The satisfaction with
service depends on the quality of services offered to tourists (Urry, 1991).
Therefore, the concept of service quality and satisfaction with service is
discussed below.

Cross-Cultural Behaviour in Tourism
182
The concept of serviceThe concept of service has received substantial attention in the fields of
tourism (Fick and Ritchie, 1991; Ostrowski et al., 1993; Augustyn and
Ho, 1998; Lam et al., 1999), hospitality (Lewis and Chambers, 1989;
Saleh and Ryan, 1991; Bojanic and Rosen, 1994), and recreation
(MacKay and Crompton, 1988). Service has been defined as ‘any activ-
ity or benefit one party can offer to another that is essentially intangible
and does not result in the ownership of anything. Production may or
may not be tied to a physical product’ (Kotler et al., 1989, p. 725).
Characteristics of serviceThe unique characteristics of services such as intangibility, perishability,
inseparability of production and consumption, and heterogeneity are
constantly acknowledged in the services marketing literature (e.g.,
Berry, 1980; Eiglier and Langeard, 1975; Lovelock, 1991). These charac-
teristics make it difficult to evaluate services (Zeithaml, 1981). The mar-
keting and consumer behaviour literature provides discussion on the
differences between goods and services.
Service encounterWithin the service industry the focus of activities and operations is on
the service process or encounter. Service encounter has been defined as
the moment of interaction between the customer and the provider, or the
dyadic interaction between customer and service provider (Czepiel et al.,
1985; Shostack, 1985; Solomon et al., 1985; Surprenant and Solomon,
1987). Shostack (1985) defined the service encounter as a period of time
during which a consumer directly interacts with a service. The extent of
personal interaction and time involved in service provision greatly varies
among services.
Moments of truthNorman (1984) reported that a service encounter represents several con-
secutive and simultaneous ‘moments-of-truth’ in an interpersonal envir-
onment, which are assessed by how closely expectations are met.
Consequently, service quality is delivered over several ‘moments-of-
truth’ or encounters between service staff and customers, and depends
upon the interpersonal skills and the environment in which the service is
delivered.

Satisfaction
183
Service classificationThere are numerous classification schemes and definitional frameworks
for analysing services (Cowell, 1984; Lovelock, 1991; Shostack, 1987).
Different service types have been distinguished depending on the extent
of personal contact required in the service encounter. Mills’ (1986) work
is often cited in this regard. He divides services into three primary cate-
gories: (1) maintenance-interactive, (2) task-interactive, and (3) personal-
interactive. Maintenance-interactive services are of a simple nature and
are characterized by little uncertainty in transactions (e.g., fast food res-
taurant services). Task-interactive services are characterized by greater
risk in transactions, depend upon the service providers for information
and expertise (e.g., banking services, brokerage firms) and, consequently,
require a more intense interaction between the service provider and the
customer. Personal-interactive services represent the most intense inter-
action of the three types. As Mills noted (1986), these services are char-
acterized by professionalism, a transaction binding contract, a high
degree of customization, information exchange, and trust underlying
the service encounter. Tourism and hospitality services are characterized
by a very intense personal contact between service providers and a cus-
tomer, which determines the quality of services offered to tourists and is
the focus of service quality analysis.
Service qualityMany theorists discussed the concept of service quality (e.g. Gronroos,
1978, 1982, 1984; Lehtinen and Lehtinen, 1982; Lewis and Booms, 1983;
Sasser and Arbeit, 1978; Sasser et al., 1978; Parasuraman et al., 1985,
1986, 1988). Parasuraman et al. (1985) noted service quality is an elusive
construct, not precisely defined, and not easily expressed by consumers.
The criteria of service quality are still not adequately determined.
Defining service quality and providing techniques for its measurement
is a major concern of service providers and researchers. This becomes a
particularly complex issue in a high contact service industry such as
tourism and hospitality.
Dimensions of service qualityThere are many dimensions of service quality. According to Lehtinen and
Lehtinen (1982), there are three distinct service quality dimensions:
1. physical that includes the physical aspects of the service
2. corporate that involves the service organization’s image or profile,
and

Cross-Cultural Behaviour in Tourism
184
3. interactive that derives from the interaction between contact per-
sonnel and the customer.
Researchers agree that the interactive dimension of service quality is
central to service. Service quality occurs during the interaction between
a consumer and a service provider, or the service encounter. The quality
of the customer-provider interaction is vital in the assessment of overall
quality of service (Crosby and Stephens, 1987; Parasuraman et al., 1985,
1988; Solomon et al., 1985; Urry, 1991).
Gronroos (1984) distinguished technical and functional service qual-
ity. Technical quality represents what the consumer receives from the
service as a result of the interaction with the service provider.
Functional quality represents the manner (or performance) in which a
service provider delivers service to a customer. Gronroos (1984) also
stressed the vital role of the service providers in service delivery.
Martin (1987) distinguished two other dimensions of service quality:
procedural and convivial. The procedural dimension is mechanistic in
nature and deals with systems of selling and distributing a product to a
customer. The convivial dimension is interpersonal in nature and emphas-
izes the service provider’s positive attitudes to customers, behaviour, and
appropriate verbal and non-verbal skills. It also deals with the service
provider’s personal interest in the customer, being friendly, appreciative
of the customer, suggestive, being able to fulfil the customer’s psycholo-
gical needs and meet expectations, naming names, gracious problem sol-
ving, appreciating of the customers’ needs, tactfulness, courtesy,
attentiveness, guidance, and tone of voice. This dimension stresses the
customer’s need to be liked, respected, relaxed, feel comfortable, import-
ant, pampered, and welcomed (Martin, 1987).
Importance of service providers’ attributesThe service providers’ attributes are the vital elements of service quality.
Callan (1990, p. 48) referred to service quality as ‘a responsive, caring and
attentive staff’, ‘staff who get things done promptly and provide honest
answers to problems’, ‘treating others in a kindly fashion’, ‘hospitality
which leads the guest to feel at home, well cared for and anxious to
return’, ‘the elimination of all criticism’, ‘making the recipient feel
thoughtful, efficient, correct and magnanimous’. According to
Hochshild (1983), service also requires the need to smile, in a pleasant
and involved way to customers. Pizam et al. (1978) emphasized the role of
the hospitality factor in service provision: (a) employees’ willingness to

Satisfaction
185
help tourists, courtesy toward tourists, and friendliness; and (b) residents’
willingness to help, be courteous, and hospitable. Knutson (1988) indic-
ated prompt and courteous service as important for clients’ satisfaction
with service quality. Saleh and Ryan (1992) noted that staff appearance is
even more important than the range of facilities being offered.
Importance of service providers’ perceptionsPerceptions of service providers are part of the overall perceptions of a
tourism product quality. These perceptions determine the success of the
tourism and hospitality operations, which rely very heavily on the devel-
opment of positive perceptions of service providers. Pearce (1982b) illu-
strated the important role of many people associated with the travel and
hospitality industry such as restaurateurs, salesmen, and hoteliers who
contribute to the overall tourist perceptions of services offered to tourists.
Sutton (1967) reported that competency in providing services is an im-
portant element influencing tourist perceptions of service quality. Pearce
(1982b) indicated that annoyance by not being able to achieve a certain
standard of service, impoliteness, or feelings of discontent create negative
tourist perceptions of service. The positive perceptions of the service such
as the service providers’ friendliness, responsibility, or courtesy encour-
age repeat visitation of the host region and repeat purchase of the same
tourism product. Negative perceptions of service deter visitation and
discourage repeat purchasing. Therefore, the way tourists perceive service
quality influences the success of a tourist destination. Mossberg (1995),
who investigated tourist satisfaction with tour leaders and their import-
ance in charter tours in Rhodes, Bulgaria/Turkey and Sri Lanka, found
that the tour leader was important to the tourist’s perceptions of the tour,
and different performances and duties of the guide influenced the tourist’s
perceptions. The service that a tour guide offered depended on his/her
experience that influenced the tourist’s level of satisfaction.
Subjectivity of service qualityService quality is a multidimensional concept. Each dimension of service
quality can be perceived differently depending whether it is perceived by a
customer/tourist, a provider or management. The subjective nature of
service quality makes it difficult to evaluate. Lewis and Booms (1983)
highlighted the subjective nature of service quality by noting that there
is an element of ‘appropriateness’ about service quality. They noted that
evaluation of service quality depends upon ‘what is acceptable and what
is not’ (p. 100). This idea was supported by Parasuraman et al. (1988)
who reported that service quality is determined by a subjective customer

Cross-Cultural Behaviour in Tourism
186
perception of service. Consequently, service quality is often related to the
perception of service by a customer.
Service quality versus expectationsGronroos (1982) reported that consumers compare service expectations
with perceptions of the service they receive in evaluating service quality.
Lewis and Booms (1983) noted that delivering quality service means
conforming to customer expectations. Eiglier and Langeard (1987) stated
that service quality is the capacity to meet customers’ expectations. When
customer expectations are not met, service quality is perceived as poor.
When customer expectations are met or exceeded, service quality is per-
ceived as high. However, according to Lewis (1987), the differences
between perceptions and expectations can measure the existence or
non-existence of quality regardless of what quality is.
Parasuraman et al.’s SERVQUAL model of service qualityParasuraman et al. (1985, 1986, 1988, 1990) and Berry et al. (1990) con-
ducted important research that resulted in the development of the
SERVQUAL model of service quality. The SERVQUAL model contrib-
uted to service quality theory in two ways. Firstly, it incorporated aspects
of consumer behaviour into the concept of service quality. Secondly, it
identified and explained specific dimensions or factors that both consu-
mers and service providers use to assess and evaluate service performance
and quality standards. From the standpoint of consumer behaviour, the
Parasuraman et al. (1985, 1988) model defines service quality as the
differences between one’s expectations from the service provider com-
pared to the perceptions of the outcomes of the service performance.
Parasuraman et al.’s (1985) conceptual model of service quality was
based on the gaps in service quality between perceptions and expectations
on the part of management, consumers, and service providers. They
identified five gaps in service quality:
& management perceptions of consumer expectations and consumer
expectations& management perceptions of consumer expectations and service quality
specifications& service quality specifications and service delivery& service delivery and service quality communicated externally to cus-
tomers, and& consumer perceptions of service and consumer expectations from
service.

Satisfaction
187
The above five gaps have an impact on the consumer’s evaluation of
service quality (Parasuraman et al., 1985). Service quality as perceived
by a consumer depends on the size and direction of the fifth gap, which
by itself, is a function of the other four gaps.
Since it is a consumer who defines quality, the evaluation of service
quality largely depends on the consumer. It is a challenge for the service
providers to understand the process by which service quality is evaluated
by customers.
Criteria of service qualityThe ten most important criteria of service quality were distinguished
by Parasuraman et al. (1985, 1986) in his SERVQUAL model, namely,
reliability, responsiveness, competence, access, courtesy, communication,
credibility, security, understanding and knowing the customer, and tang-
ibles. These criteria are used by consumers in assessing service quality.
Since many of these criteria were dependent they were reduced to five
dimensions of service quality: tangibles, reliability, responsiveness, assur-
ance, and empathy. The reliability dimensionwas assessed by consumers as
the most important criterion in assessing service quality. However, the
importance attached by consumers to the service quality dimensions may
differ prior to and after service delivery. Evaluation of service quality is not
only based on the outcome of a service, but also on the process of service
delivery (Parasuraman et al., 1985, 1988). Therefore, the significance of the
service quality dimensions lies in the fact that they apply to the process by
which the service is delivered rather than an outcome of a service.
SERVQUAL applicationThe SERVQUAL model has been widely applied in empirical studies in
various disciplines and been shown to be highly valuable and appropriate
for a wide range of services (e.g., retail, securities, brokerage, product
repair and maintenance). Fick and Ritchie (1991) tested the SERVQUAL
instrument with customers in four tourism service sectors: airline, hotel,
restaurant, and skiing. They found that the measurement scale was useful
to compare between travel sectors, or across firms within the same sector.
However, the scale did not appear to be entirely valid for all tourism
service sectors. Saleh and Ryan (1991) applied a modified version of the
SERVQUAL to the hotel industry. In both studies it was shown that
experiences with service transactions in the service encounter depended
upon the perceptions of the quality of service offered by the hospitality
and tourism industry employees (hosts) who were responsible for creating

Cross-Cultural Behaviour in Tourism
188
and delivering service. Particularly, the quality of services depended on
the ability of hosts to assess the tourist’s needs and satisfaction, and to
deliver individualized service.
SERVQUAL criticismDespite its growing popularity and widespread application SERVQUAL
has been subjected to a number of criticisms. SERVQUAL has been
criticized for being based on a disconfirmation model rather than an
attitudinal model. In the first model customer satisfaction is operational-
ized in terms of the relationships between expectations and outcomes.
Cronin and Taylor (1992) claimed that perceived quality is best concep-
tualized as an attitude. They criticized Parasuraman et al. (1988) for their
hesitancy to define perceived quality in attitudinal terms, even though they
had claimed that service quality was similar in many ways to an attitude.
The SERVQUAL has also been criticized for: (a) little evidence that
customers assess service quality in terms of perception-expectation gaps;
(b) focusing on the process of service delivery, not the outcomes of the
service encounter; (c) an unstable and contextual number of dimensions
(the number of dimensions comprising service quality vary across situa-
tions and industries); (d) items that do not always load on to the factors
which one would a priori expect; (e) inappropriate operationalization of
the term expectations; (f) its four to five item scale that does not capture
the variability within each dimension; (g) a standardized clustered item
order that generates a systematic order bias; (h) assessing services that are
delivered during only one encounter; (i) the reversed polarity of items in
the scale that causes respondent error; (j) a 7-point scale, lack of verbal
labelling for points 2 through to 6, for problems with interpretation of the
meaning of the midpoint of the scale; (k) double administration of the
instrument that causes boredom and confusion; and (l) the overall
SERVQUAL score that accounts for a disappointing proportion of
item variances (Buttle, 1996). This criticism should be of concern to
users of the instrument. However, SERVQUAL undoubtedly has had a
major impact on business and academic communities, and it may be
useful in a revised form depending on the situation.
Properties of consumer goodsNelson (1974) distinguished two categories of properties of consumer
goods:
1. Search properties that are attributes a consumer can determine prior
to purchasing a product (e.g., size, colour, feel)

Satisfaction
189
2. Experience properties that are attributes that can be assessed only
after purchase or during consumption (e.g., taste, wearability).
Darby and Karni (1973) added to Nelson’s properties a third category
credence properties that the consumer finds impossible to evaluate even
after purchase and consumption (e.g., medical care, education).
These properties facilitate the evaluation of service quality and define
the degree of difficulty of service evaluation. Those services that are high
in experience properties are difficult to evaluate; and those services that
are high in credence properties are the most difficult to evaluate. Since
most services contain a high percentage of experiences and credence
properties, service quality is more difficult to evaluate than the quality
of goods (Zeithaml, 1981) that contain a high percentage of search prop-
erties. Most of Parasuraman et al.’s (1985, 1988) ten service quality
criteria, except tangibles and credibility, contain a high percentage of
experience properties and, therefore, can be evaluated only after the
purchase. Two of the service quality criteria, those of competence and
security, contain a high percentage of credence properties and thus
cannot be evaluated even after purchase.
Service quality versus satisfactionThe services marketing literature indicates that there is a difference
between the concepts of service quality and satisfaction with service.
Service quality is concerned with the attributes of the service itself
(Crompton and MacKay, 1989). Satisfaction is a psychological outcome
deriving from an experience. It is an ‘emotional state that occurs in
response to an evaluation of the interactional experiences’ (Westbrook,
1981, p. 68). Service quality is related to customer satisfaction and is a
way of thinking about how to satisfy customers so that they hold positive
perceptions of the service (Ostrowski et al., 1993). Satisfaction depends
on the quality of service attributes (Crompton and MacKay, 1989).
Usually a high quality of service attributes results in high satisfaction.
Service quality is essential in the determination of customer dissatis-
faction (Bitner et al., 1990). Service quality depends vastly on the inter-
personal element of service performance (Bitner et al., 1990). The quality
of interpersonal interaction between customer and service provider is an
important element in the assessment of overall satisfaction with service
quality (Crosby and Stephens, 1987; Parasuraman et al., 1985, 1988).
Therefore, the quality of the interpersonal interaction between a tourist

Cross-Cultural Behaviour in Tourism
190
and a service provider is an important determinant of tourist dissatisfac-
tion with services. According to Jacinto et al. (1999), holiday satisfaction
is positively influenced by the intercultural interaction and the quality of
services.
Positive and negative disconfirmationSince service quality depends on the customer perception of service,
the positive perception of service quality enhances customer satisfaction,
and a negative perception creates dissatisfaction with the service.
Parasuraman et al. (1985) reported that the perception of service quality
could range from ideal through satisfactory to totally unacceptable qual-
ity. The range depends on the discrepancy between the service expecta-
tions (ES) and service perceptions (PS) so that when ES>PS, perception
of service quality is less than satisfactory and tends toward totally unac-
ceptable quality; when ES=PS, perception of service quality is satis-
factory; and when ES<PS, perception of service quality is more than
satisfactory and tends toward ideal quality. Similarly, Smith and
Houston (1982) claimed that when expectations from service are not
fulfilled, dissatisfaction with service results (negative disconfirmation);
when expectations are met or exceeded, satisfaction with service results
(positive disconfirmation). Thus, customer satisfaction (CS/D) typically
is modelled as a function of disconfirmation arising from discrepancies
between prior expectations and actual performance (Cardozo, 1965;
Oliver, 1989).
Importance of interpersonal dimension of serviceIt is possible that a perceived high quality service may result in low
satisfaction. The mechanistic system of service delivery may be of high
quality, however, the interpersonal dimension of service may be of a low
quality and result in low satisfaction with total service. On the other
hand, the service provider’s attitudes, behaviour and verbal skills may
give the customer more satisfaction than the pure mechanistic system of
delivery of service. As Crompton and MacKay (1989) indicated, the
positive social interaction between a consumer and a service provider
may compensate even the low quality of service and result in high satis-
faction. The high quality convivial dimension of service (interpersonal)
may compensate the low quality procedural dimension of service
(Martin, 1987). Therefore, the perception of the interpersonal element
of service delivery is an essential element in the determination of tourist
satisfaction with service.

Satisfaction
191
Importance of understanding the customer’s needsService quality and satisfaction depend on the differences between the
customer’s and the provider’s perceptions of the customer experiences
and specifically, the extent to which the service provider accurately under-
stands the nature of the tourist’s needs. Saleh and Ryan (1991) found that
hotel providers and their guests evaluated service performance much the
same way. However, they reported differences between providers and
guests for gaps between expectations and performance. Vogt and
Fesenmaier (1995) found that service providers did not understand the
level at which customers evaluated their experiences. They reported that
it is important who delivers the service as opposed to what is delivered.
They argued that it is vital to consider both the customer and the provi-
der in defining service quality, be more aware of the tourists’ needs, and
include all types of employees involved in delivering services to tourists.
Cultural influences on service satisfactionCulture determines expectations and perceptions of service quality that,
in turn, determine satisfaction with service. For example, Mok and
Armstrong (1998) found significant differences in expectations from
hotel service quality among guests from the UK, USA, Australia,
Japan and Taiwan. Tourists from these countries had different expecta-
tions for two of the service quality dimensions, namely tangibles and
empathy. The Japanese tourists, for instance, had the lowest expectation
for the tangibles. Both the Japanese and Taiwanese tourists also had
significantly lower expectations for the empathy dimension than western
tourists. The findings implied that tourists from different cultures might
have different expectations of the physical facilities, equipment, and
appearance of the tourism and hospitality industry’s personnel.
Therefore, understanding the differences in cultural orientations would
help to determine the type of services expected.
Choi and Chu (2000) investigated Asian and Western travellers’ per-
ceptions of service quality in Hong Kong hotels. The results suggested
that Asian travellers’ satisfaction derived from the value factor, whereas
Western travellers’ satisfaction was influenced by the room quality factor.
Choi and Chu (2000) concluded that the differences in the perceptions
could be explained by cultural factors.
Furrer et al. (2000) argued that cultural orientations determine
perceptions of service quality. They tested a conceptual link between all
five cultural dimensions developed by Hofstede (1980, 1991) and Bond

Cross-Cultural Behaviour in Tourism
192
(1987), and variations in the relative importance of all five service quality
dimensions developed by Parasuraman et al. (1985, 1988), Parasuraman
et al. (1991) and Zeithaml et al. (1988, 1993). They developed a Cultural
Service Quality Index (CSQI) that evaluates the relative importance of
each SERVQUAL dimension as a function of the five cultural dimen-
sions and that can be used to segment multicultural markets.
Feather (1982) noted that cultural values influence satisfaction.
Winsted (1999) analysed the importance of service dimensions to consu-
mer satisfaction in two different countries: the United States and Japan.
Formality was found to be more important in status-conscious societies
than in egalitarian societies, and personalization was more important in
individualistic countries than in collectivistic countries. Authenticity was
more important for professional services, while courtesy and promptness
were more important for generic services. Caring and courtesy received the
highest ratings as most important to satisfaction with service encounters.
Service perception and satisfaction studiesService perceptions and, in particular, the perceptions of a customer-
service provider interaction in the process of service delivery and satisfac-
tion with this interaction have still not received enough research attention
in the area of tourism. There is a need to analyse the tourists’ perceptions
of services in their host destinations. Such analysis would provide valuable
information for hospitality and marketing strategists, particularly if the
differences in perceptions are observable and they are generated by the
differences in cultural background. Differences in cultural values would
help to identify the factors contributing to differences in perceptions, and
in turn, to assess the effectiveness of the service providers’ performance
from the perspective of the culturally different customer. The examination
of the tourist perceptions of the service performance would also enable
detection of negative perceptions and change or modify them if necessary,
and therefore better respond to culturally different tourists’ needs.
Measurement of satisfaction
There are two distinct approaches to the measurement of satisfaction
(Maddox, 1985): (1) measurement of overall satisfaction, and (2) meas-
urement of satisfaction with its various dimensions.

Satisfaction
193
Measurement of overall satisfactionThe first approach is to measure the overall satisfaction with the object or
person. Such measurement is normally easy and requires a minimum
respondents’ effort (Maddox, 1985). However, the problem is in choosing
from among a number of techniques measuring overall satisfaction.
Usually a scaling technique is used. However, there are many discussions
about the appropriateness of measuring scales. Pizam et al. (1978) argued
that satisfaction should be measured on an interval scale. Dann (1978)
criticized this type of measurement for being highly skewed because tour-
ists may express various degrees of satisfaction with various components
of their holiday experiences. The other measurement techniques such as
interviewing or asking direct questions related to satisfaction were also
criticized for being responsible for skewed answers. Dann (1978) argued
that indirect rather than direct techniques are more useful. Maddox
(1985) examined the construct validity of several methods and scales
measuring satisfaction. Respondents were asked to indicate their satisfac-
tion on graphic, face, and delighted-terrible (DT) scales. The DT (verbal)
appeared to be better than graphic and face scales (non-verbal scales).
Measuring overall satisfaction with people appears to be more com-
plex than measuring satisfaction with physical objects. The physical char-
acteristics such as size or volume can be directly observed and quantified.
The psychological characteristics such as intelligence or hospitality must
be inferred. As a result, the measurement of people’s psychological traits
vastly depends on the perceptions of these traits by observers. Personal
biases may occur due to the different assessment of the inferred qualities
by observers. These biases are threats to the accuracy of measurement.
Measuring satisfaction with a tourism product is difficult because the
tourism product consists mostly of services that are intangible and perish-
able in nature. In addition, the measurement of satisfaction with the
expressive performance of services (e.g., atmosphere of hospitality, repu-
tation) is even more difficult than with the instrumental performance of
service (e.g., speed, correctness).
Measurement of satisfaction with various dimensionsThe second approach to measuring satisfaction is to measure satisfaction
with various dimensions contributing to overall satisfaction (Maddox,
1976; Smith et al., 1969). In addition, since the tourism product is a
composite of many interrelated components, the measurement of satis-
faction with the tourism product requires first of all the identification of

Cross-Cultural Behaviour in Tourism
194
individual components of this product and measurement of satisfaction
with each component (Pizam et al., 1978). For instance, satisfaction with
the total tourism product can be analysed by measuring satisfaction with
facilities, natural environment or services offered. Satisfaction with ser-
vices can be evaluated by measuring satisfaction with the interpersonal
element of service. The interpersonal element of a service can be further
analysed by measuring satisfaction with individual service providers such
as tour guides, shop assistants, waitresses, and customs officials, and their
attributes such as politeness, friendliness, and professionalism. For
instance, satisfaction with a tour guide can be measured by the satisfac-
tion with the tour guide’s knowledge of the historical, geographical and
cultural environment (Almagor, 1985), knowledge of the culture being
visited and the visitor culture, organizational and communication skills
(Hughes, 1991; Pearce, 1984). As Hughes (1991) noted, satisfaction is a
multifaceted concept.
Importance of satisfaction with tourism componentsMeasuring tourist satisfaction with a particular component of the tour-
ism product is important because this measurement has a significant
impact on tourist satisfaction with the total tourism product. If the indi-
vidual components of a tourism product are not identified and satisfac-
tion with the total product only is measured, a ‘spill over’ effect may
occur. This means that dissatisfaction with one component may lead to
dissatisfaction with the total product. The measurement of separate com-
ponents of satisfaction can help to develop an understanding of which
component of tourism product creates dissatisfaction and which one
should be changed or modified. More adequate definition of the satisfac-
tion concept can also be developed.
ComplaintsOne of the common measures of dissatisfaction is complaint. However,
this measure is very subjective and may present a biased view due to high
dissatisfaction rates that may not lead to many complaints (Gronhaug,
1977). According to Roth et al. (1990), the most frequent consumer
response to dissatisfaction is to ‘do nothing’ (Roth et al., 1990).
However, complaints should be monitored because dissatisfied guests
complain widely to friends (Maddox, 1985), and the consequences of
such complaints can be very negative. The complaints from the ‘matched’
tourists (whose expectations can be met by tourism management) (Pearce
and Moscardo, 1984, p. 23) are easier to handle, and the needs of the
‘matched’ tourists can be satisfied quickly. The expectations and needs of

Satisfaction
195
the ‘mismatched’ tourists are more difficult to meet and satisfy (Pearce
and Moscardo, 1984, p. 23). Such ‘mismatched’ tourists can be tourists
from different cultural backgrounds.
Another reason why complaints should not be used as a measure of
satisfaction is because they do not always indicate real dissatisfaction.
Complaints can be caused by misunderstandings arising out of intercul-
tural differences encountered during an overseas trip (Hanningan, 1980).
International tourism more than any other area is affected by cross-
cultural differences (Hanningan, 1980). Thus, the complaints of inter-
national tourists do not always express tourist dissatisfaction. Many
complaints often express the intercultural difficulties encountered in a
foreign country rather than dissatisfaction. Therefore, an understanding
of the cultural factors that influence the international tourists’ dissatisfac-
tion is vital for any international tourism study.
Criticism of satisfaction measurementSome researchers question the usefulness of satisfaction measurement at
all. Some argue that the measurement of satisfaction with actual experi-
ences is not useful. Instead satisfaction should be measured on the basis
of expectations. ‘The expectations indicators are three times as powerful
in explaining satisfaction than objective conditions’ (Gauthier, 1987,
p. 1). Others argue that satisfaction should be measured over time.
However, the lack of a stable technique for satisfaction measurement
makes the measurement over time difficult. Pizam et al. (1978) high-
lighted many difficulties in measuring tourist satisfaction. Pizam et al.
(1979) questioned Dann’s (1978) approach to satisfaction measurement
and, in particular: (a) overlooking the measurement of various elements
of tourism satisfaction; (b) confusing the terms of motivation to travel,
objective of travel and satisfaction from travel; (c) not providing infor-
mation about the ‘push factors’ that greatly influence the tourist’s
experiences; (d) assuming that tourism satisfaction is not a function
of satisfaction with the services but a function of overall life satisfac-
tion; and (e) ignoring Likert type scales as appropriate instruments for
measuring tourism satisfaction.
Importance of satisfaction measurementDespite the difficulties and criticism of satisfaction measurement, tourism
managers should be concerned with measuring tourist satisfaction.
‘Vacation dissatisfaction . . . underlines the vacationer’s decision process’
(Van Raaij, 1986; Van Raaij and Francken, 1984, p. 105) and influences

Cross-Cultural Behaviour in Tourism
196
the purchase intention (Moutinho, 1987). Satisfaction determines
whether the tourist becomes a repeat visitor. Monitoring tourist satisfac-
tion can provide invaluable information for detecting problems that
cause dissatisfaction with holidays and have negative impact on future
visitation. ‘Remedial action could be initiated before a crisis occurs’
(Maddox, 1985, p. 2). It is important to know the possible consequences
of tourist dissatisfaction.
Summary
There are many definitions of satisfaction. However, none of the def-
initions gives a clear explanation of the concept of satisfaction.
Satisfaction was defined as an outcome of the comparison between
expectations and experiences; a difference between expectations and
perceptions of performance; a fit between expectations and the envir-
onment; a fit between the tourist and the host value systems; and
input-output of social exchange. Satisfaction was explained by the
attribution process. Satisfaction is a relative, subjective and multi-
faceted concept. Total holiday satisfaction should be assessed by mea-
suring satisfaction with the individual components of the holiday
experiences. Satisfaction with hosts is an important element of the
total holiday satisfaction and should be measured with the host’s
physical and psychological performance.
The concept of tourist satisfaction can be analysed in terms of
satisfaction with the service offered to tourists. Satisfaction with ser-
vice depends on the quality of service that is determined by the quality
of the interpersonal interaction between a service provider and a cus-
tomer. Major dimensions of service quality have been identified of
which the majority are related to the interpersonal element of service.
The positive perceptions of the interpersonal element of service are
extremely important because they may compensate for the low
mechanistic process of service delivery, and result in high satisfaction.
There are two approaches for measuring satisfaction: measurement
of overall satisfaction and measurement of satisfaction with various
elements contributing to overall satisfaction. Measuring satisfaction
with people requires the observer to infer the psychological traits of
people and is very subjective. Measuring satisfaction with a tourism

Satisfaction
197
Discussion points and questions
1. Explain why is it difficult to define the concept of satisfaction.
2. Identify major causes and outcomes of tourist dis/satisfaction with
their holidays.
3. Why is tourist satisfaction with service providers a vital component
of the overall holiday satisfaction?
4. Identify the major criteria of service quality. Which criteria appear
to be the most important in assessing service quality in tourism?
Why?
5. Explain the relationship between service quality and satisfaction.
6. What is the influence of culture on service quality and tourist holiday
satisfaction?
7. Which technique of satisfaction measurement does appear to be the
most adequate; why should international tourist complaints not
always be used in assessing holiday satisfaction?
Further reading
Bitner, M. J., Booms, B. H. and Tetreault, M. (1990) The service encoun-
ter: diagnosing favourable and unfavourable incidents. Journal of
Marketing 54: 71–84.
Gronroos, C. (1982) Service quality model and its marketing implica-
tions. European Journal of Marketing 18(4): 36–44.
product is complex because the tourism product consists mostly of
intangible services, requires the identification of individual compon-
ents of service, and measurement of satisfaction with each component.
There are various techniques for measuring satisfaction. Many of
these techniques have been criticized. Indirect rather than direct tech-
niques were found to be more useful. Complaints are not good mea-
sures of dissatisfaction as they often express intercultural difficulties
rather than dissatisfaction. Tourist satisfaction should be measured
because such measurement can detect the causes of tourist dissatis-
faction and predict its consequences.

Cross-Cultural Behaviour in Tourism
198
Parasuraman, A., Zeithaml, V. A. and Berry, L. L. (1985) A conceptual
model of service quality and its implications for future research.
Journal of Marketing 49: 41–50.
Parasuraman, A., Zeithaml, V. A. and Berry, L. L. (1986) SERVQUAL:
A Multiple-Scale Item for Measuring Consumer Perceptions of Service
Quality. Cambridge, MA: Marketing Institute.
Parasuraman, A., Zeithaml, V. and Berry, L. L. (1988) SERVQUAL: A
multiple-scale item for measuring consumer perceptions of service
quality. Journal of Retailing 64: 12–40.
Parasuraman, A., Zeithaml, V. and Berry, L. (1990) An Empirical
Examination of Relationships in an Extended Service Quality Model.
Cambridge, MA: Marketing Science Institute.
Pizam, A., Neumann, Y. and Reichel, A. (1978) Dimensions of tourist
satisfaction with a destination area. Annals of Tourism Research 5(3):
314–322.
Pizam, A., Neumann, Y. and Reichel, A. (1979) Tourist satisfaction: uses
and misuses. Annals of Tourism Research 6(1): 195–197.
Shostack, G. L. (1985) Planning the service encounter. In Czepiel, J. A.,
Solomon, M. R. and Surprenant, C. F. (eds) The Service Encounter.
Lexington, MA: Lexington Books: pp. 243–254.
Surprenant, C. F. and Solomon, M. R. (1987) Predictability and person-
alization in the service encounter. Journal of Marketing 51: 73–80.

Part 2
Methods for Cross-CulturalAnalysis in Tourism
The methods detailed in this part are selected as a combination of scientific
techniques that provide a wide and sophisticated inter-related set of analysis
tools that can be applied to cross-cultural research. Although non-quanti-
tative methods are useful, in particular as theory building exploratory tools,
researchers working in the field of cross-cultural research need and should
be able to use hypothesis testing scientific method. It is insufficient to say
that the issues of cross-cultural research are too complex for analysis by
rigorous statistical methods. The modern techniques described and applied
in Part 2 are suitable for studying the complexities of cross-cultural inter-
action, while at the same time providing both exploratory theory-building
tools and in depth investigative processes.
The particular advantage of such an approach is that it is replicative and
comparative. Given sufficient research the results can be tested in different
scenarios and meaningfully compared over time, aiding in a specific man-
ner, with the general building of one research outcome upon another.
The use of non-quantitative methods are not specifically included, partly
because they are well documented elsewhere and partly because they are
relatively well known. Although the quantitative methods described here
have been well used before, their precise mathematical foundation and
detailed application is not contained elsewhere in the tourism literature.
Furthermore, the application of these methods to studies in cross-cultural
analysis in tourism provides a new approach.

Cross-Cultural Behaviour in Tourism
200
& Chapter 7 introduces factor analysis for cross-cultural structural analy-
sis. It explains the basic terminology, stages of analysis and the differ-
ence between Factor Analysis and Principal Components Analysis. An
example of the application of Factor Analysis in the area of cross-cultural
behaviour is provided.& Chapter 8 defines and explains the concept of structural equation model-
ling (SEM), its objectives, application in cross-cultural tourism beha-
viour, types and stages of SEM modelling, and interpretation of its
statistical results.

7Principal components and
factor analysis for cross-
cultural analysis
Objectives
After completing this chapter the reader should
be able to:
& understand the difference between Principal
Components and Factor Analysis
& understand the process by which factor
analytic methods operate
& define the meaning of the statistics produced
by factor analytic methods
& understand the different forms of Factor
Analysis
& use factor analytic methods correctly for
analysing cross-cultural tourism research
data.

Cross-Cultural Behaviour in Tourism
202
Introduction
Factor Analysis was developed to specifically test a hypothesis of com-
plete independence of dimensions, commonly termed ‘simple structure’.
Principal Components Analysis on the other hand, while developed for
the same reasons as Factor Analysis is less specific and does not test a
hypothesis of simple structure or any other hypothesis. Principal
Components merely finds the dimensions of a large data set on the
basis of dividing total variance into as many distinguishable groups as
possible and in this regard it is essentially descriptive.
Therefore, Factor Analysis differs from Principal Components
Analysis in both computation and more importantly in the objective of
the analysis. Whereas Principal Components is useful for determining
dimensions among the total variability of a data set (which can be divided
between unique variance to one variable and common variance shared by
several variables), Factor Analysis focuses on the variance common
(shared) to several variables. The distinction between shared and com-
mon variance is discussed in more detail in the section on the differences
between Principal Components Analysis and Factor Analysis. Moreover,
Factor Analysis has the added capability of testing hypotheses that can
be stated in the form of intercorrelations between variables.
It is not possible to discuss just one method completely in a realm
divorced from the other technique. The processes of one method are
similar to the other. This has led to considerable confusion in the literature
and sometimes the confusion of each technique labelled as the other
method, most usually Principal Components Analysis is mistakenly called
Factor Analysis. In order to attempt a clear presentation an effort has
been made to totally divide the techniques with Principal Components
Analysis discussed first, followed by Factor Analysis. At the beginning
of the discussion on Factor Analysis the difference between the two meth-
ods is discussed in more detail. Also, in the Factor Analysis discussion
where rotation of factors is discussed, the question of rotating principal
components (not strictly part of Principal Components Analysis) is dis-
cussed. At the end of the chapter some common variations of the input of
data into both Principal Components and Factor Analysis are outlined.
Factor analytic methods are particularly useful in cultural analysis
because of the questions raised by cultural differences. Do differences
exist and in what form? To what degree do tourists perceive cultural

Principal components and factor analysis for cross-cultural analysis
203
differences and how important are these differences to their motivations
to travel and satisfaction with travel experiences? Factor Analysis and
Principal Components Analysis can be used to measure cultural attitudes
and to help in assessing the existence and extent of such differences.
Principal Components Analysis
Principal Components Analysis is a method of classification that derives
dimensions among a set of variables measuring the same population
(using samples of the same size). Thus it takes a group of variables
measured over a sample or population of observations, and examines
the interrelationships among them. The result of the analysis is a new
set of variables (which replace the original variables) and which show a
set of interrelated variable (meaning original variable) relationships.
Hence the new set of variables becomes the focus of interpretation. The
reasons for searching out the possible combinations of original variables
to create the new variables are three-fold:
1. To remove collinearity.
The new variables could be generated in such a manner as to reorgan-
ize the original variables into groups having as little collinearity as
possible.
2. To reduce the number of original variables.
If significant collinearity exists among a set of variables, a reduction
in the number of meaningful variables may be possible. Collinearity
suggests that two or more variables are measuring the same charac-
teristic. The new variables generated can be used to indicate a reduced
set of variables (since the new variables are generated stepwise in
order of significance) eliminating redundancy and aiding in the iden-
tification of the most useful variables for prediction.
3. To identify dimension or classes (groups) among the set of
observations on the basis of a set of variable measures.
The analysis can be used to search for order (dimensions) in a large
data set. Each new variable forms a dimension in the data set upon

Cross-Cultural Behaviour in Tourism
204
Tests of significance
Although Factor Analysis and Principal Components Analysis are essen-
tially statistical techniques, they are also essentially descriptive rather
than statistically inferential. Hypotheses can be generally tested and
detailed description can be formed into inference, but not statistical infer-
ence in the sense that a statistical test of significance is applied. Factor
analytic techniques do not rely upon a statistical test of significance.
There is an assumption that a representative sample will be analysed (a
requirement of research design) but the requirement of a normal distri-
bution is rarely met. Tests on the statistical significance of component
loadings are rarely used.
A rudimentary precaution is to use the sphericity test on the correla-
tion matrix. This tests the null hypothesis that the population correlation
matrix is an identity matrix (diagonal terms equal 1 and off diagonal
terms equal 0), which means that the variance for each variable are
uncorrelated in the population from which the sample was drawn, and
the observed correlations differ from zero only by chance. The name of
the test derives from the notion that the population space of the
standardized variables will be spherical. The test therefore assumes the
sample population is distributed as a multivariate normal distribution.
Bartlett (1950) originated the test, which is a Chi-square test of the null
hypothesis. The consequence is that a nonsignificant Chi-square at 95 per
cent indicates the correlation matrix should not be analysed.
Another measure of sample adequacy is the Kaiser-Meyer-Olkin
(KMO) measure that is expressed as an index between zero and one.
This index uses the measure of partial correlation, which is the correla-
tion between two variables when the influence of the other variables is
which each original variable loads to varying degrees. The meaning of
the dimensions can then be considered.
If the dimensions were predicted in advance of the analysis the
meaning of the dimensions would exist prior to the analysis. Such a
process is possible and is called Factor Analysis.

Principal components and factor analysis for cross-cultural analysis
205
eliminated. The index is calculated by dividing out the simple correlation
coefficient squared between all variable pairs, by the sum of the squared
partial correlation coefficients between all variable pairs. If the partial
correlation effect is small relative to the total correlation the KMO mea-
sure will be close to one, and this is the better outcome because this
means correlations between pairs of variables are explained by other
variables, that is, meaningful factors (components) are likely. The level
of KMO required is somewhat subjective but logically should exceed 0.5
because a point beyond a 50 per cent index would normally be accepted
as more likely than not to derive useful factors (components). Hair
et al. (1995) suggests 0.7 as the bottom level of acceptability, 0.7 to be
middling, above 0.8 to be meritorious, and above 0.9 marvellous.
Yet another indicator is to examine the partial correlation coefficients.
The SPSS program produces the negative image of the partial correla-
tions in an ‘anti-image correlation’ matrix. The proportion of large coef-
ficients should be small. The diagonals of the matrix are the equivalent of
the KMO for each individual variable (as opposed to all variable pairs)
and SPSS terms these diagonals the measures of sampling adequacy
(MSA). Large MSA values are expected for the development of useful
factors (components). When it is necessary to reduce the number of
variables those variables with a small MSA are the first to consider
removing. However, the theory for the inclusion of particular variables
must be considered as equally important.
Because SPSS now outputs the above statistics, they are commonly
used. However, factor analytic techniques are mathematical and not sta-
tistical, so that they do not depend upon such tests for their use. It is also
necessary to remember that the tests above depend upon large samples,
subjectively above 100 or more directly defined as the number of cases
(N) minus the number of variables (X) being greater than 30.
Segmental correlation
The basis of both Principal Components and Factor Analysis is that each
variable can be divided into several independent parts in terms of its
association with other variables and, therefore, that each correlation
coefficient can be segmented similarly into independent parts.
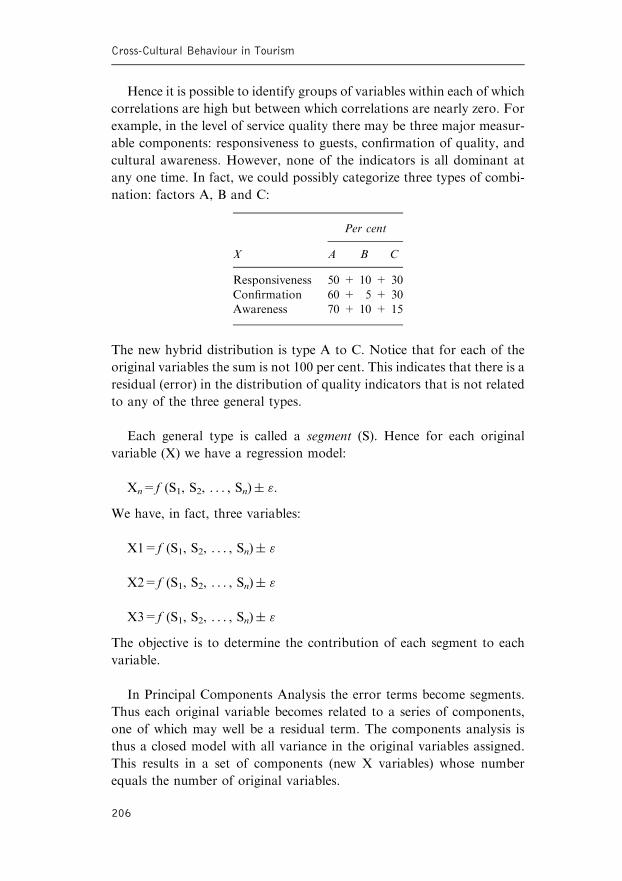
Cross-Cultural Behaviour in Tourism
206
Hence it is possible to identify groups of variables within each of which
correlations are high but between which correlations are nearly zero. For
example, in the level of service quality there may be three major measur-
able components: responsiveness to guests, confirmation of quality, and
cultural awareness. However, none of the indicators is all dominant at
any one time. In fact, we could possibly categorize three types of combi-
nation: factors A, B and C:
Per cent
X A B C
Responsiveness 50 + 10 + 30
Confirmation 60 + 5 + 30
Awareness 70 + 10 + 15
The new hybrid distribution is type A to C. Notice that for each of the
original variables the sum is not 100 per cent. This indicates that there is a
residual (error) in the distribution of quality indicators that is not related
to any of the three general types.
Each general type is called a segment (S). Hence for each original
variable (X) we have a regression model:
Xn=f (S1, S2, . . . , Sn)� ".
We have, in fact, three variables:
X1=f (S1, S2, . . . , Sn)� "
X2=f (S1, S2, . . . , Sn)� "
X3=f (S1, S2, . . . , Sn)� "
The objective is to determine the contribution of each segment to each
variable.
In Principal Components Analysis the error terms become segments.
Thus each original variable becomes related to a series of components,
one of which may well be a residual term. The components analysis is
thus a closed model with all variance in the original variables assigned.
This results in a set of components (new X variables) whose number
equals the number of original variables.

Principal components and factor analysis for cross-cultural analysis
207
In Factor Analysis the residual forms unique variance, which is not
accounted for. The remaining common variance is divided into a set of
factors (which are similar to components). The total variance in Factor
Analysis is standardized to 1.0, so that unless the residuals sum to zero
(highly unlikely) the sum of the variances of each variable must be less
than 1.0. Therefore, the number of factors must be less than the number
of variables.
Simple representation of correlation and component
extraction
The most readily understood method of representing correlations
between dimensions of data in multi-dimensional space is geometrical.
In addition, the most readily understood method for extracting compon-
ents (or factors) is the centroid method, which is not used today with the
development of computers, and has been replaced by matrix algebra.
Consequently, in representing the correlations geometrically and using
the centroid method, the objective is to provide a relatively easy under-
standing of the processes involved.
Correlations
The product-moment correlation (r) is the square root of the proportion
of the variance in X1 related to the variance in X2, and vice versa.
Looking at just two variables (X1 and X2), the perpendicular from the
three quarters point (correlation of 0.75) on X1 must meet the end of the
line representing X2, and a perpendicular from the three-quarters point
on X2 must meet the end of the line representing X1. Thus, each variable
casts a shadow on the other, and the length of the shadow represents the
correlation between them (Figure 7.1).
Basic trigonometry is used to find the angle between the two variables.
The cosine of the angle between the lines representing two variables
equals the correlation between those two variables. Cosines vary between
�1 and +1 like correlation coefficients. A cosine of zero is equal to 908and r of zero. So lines at right angles represent uncorrelated variables and
this is termed an orthogonal relationship. Therefore, it follows that a
cosine of 1808 is equal to a correlation of �1.0, so that negative correla-

Cross-Cultural Behaviour in Tourism
208
tions are shown by obtuse angles and a �1.0 correlation by a straight line
passing through the origin.
Looking now at a two-dimensional scatter diagram (refer to Figure 7.2)
the form of a set of normally distributed values varies according to the
correlation between X1 and X2. In Figure 7.2A the two variables X1 and
X2 are completely uncorrelated and the bivariate distribution is circular.
In Figure 7.2B the variables are correlated positively (positively because of
the elongation on the positive axes) and the scatter of values is elliptical
rather than circular. The axes of the ellipse are separated by the angle (�),
which has a cosine of 0.58 (hence r12=0.58) and the shape of the ellipse is
defined by the correlation between the two variables. In Figure 7.2C the
correlation is greater and the ellipse much more elongated.
Correlation matrix
It is impossible to display correlation matrices in two-dimensional space.
For example:
Correlations Angles
X1 X2 X3 X1 X2 X3
X1 1.00 0.64 0.83 X1 0 50 34
X2 0.64 1.00 0.21 X2 50 0 78
X3 0.83 0.21 1.00 X3 34 78 0
Having drawn the correlation r12=0.64 as 50 it would then be impossible
to locate a vector for X3 which is both 788 from X2 and 348 from X1. A
0.75
0.75
A
O B
C
D
X1
X2
Figure 7.1 Geometric correlation between two variables X1 and X2

Principal components and factor analysis for cross-cultural analysis
209
three-dimensional diagram would be required. The number of dimen-
sions required is equal to the number of variables. Thus, four variables
at right angles to each other (uncorrelated) would be all orthogonal
forming a four-dimensional space.
Figure 7.2 Two-dimensional presentation of correlation

Cross-Cultural Behaviour in Tourism
210
In order to continue presenting a geometric representation it is neces-
sary to use abstractions from multi-dimensional space and simple data.
Extracting principal components
In the reduction of the total set of variables down to a new set of uncor-
related structural dimensions it is necessary to extract each new variable
in turn. The first new variable is a vector that is as close as possible to the
vectors already existing. Angular closeness is measured from 08 to 1808where 1808 is the maximum correlation of �1.0. So the aim in locating
the first new variable is to get as close to either 08 or 1808 as possible withall the original vectors.
The best location will be the mean location, so that the new vector will
be as close as possible to all the original vectors at the same time.
Beginning with a correlation matrix:
X1 X2 X3
X1 1.00 0.64 0.83
X2 0.64 1.00 0.21
X3 0.83 0.21 1.00
SUM 2.47 1.85 2.04 6.36 = Total Sum
and summing the correlations for each variable to see how well correlated
with all the others it is. Next, the sum is calculated as a ratio of the square
root of the total correlations:
X1 X2 X3
Sum/ffiffiffiffiffiffiffiffiffiffiffiffiffiffiffiffiffiffiffiffiffiffiTotal Sum
p¼ 0.98 0.73 0.81
From this analysis it is clear that X1 has the highest total intercorrelation
with all of the other variables including itself.
If every correlation were 1.00 the maximum value of the total sum (TS)
of the correlations would be n2 or in our example TS=9 (32). The square
root of this value (ffiffiffiffiffiffiTS
p¼ 3) is the maximum correlation sum possible for
one variable. HenceffiffiffiffiffiffiTS
pis the maximum sum possible for any one
variable and as such is the new variable or principal component. The
ratio of the sum of the correlations for each variable toffiffiffiffiffiffiTS
pis thus the
correlation of each variable with the principal component. Thus,
(rounded):

Principal components and factor analysis for cross-cultural analysis
211
X1 X2 X3 TS
Sum of Correlations 2.47 1.85 2.04 6.36
Sum/ffiffiffiffiffiffiTS
p0.98 0.73 0.81
Angles 118 438 368
For each component three separate indices can be calculated concerning
the relationship of the component to each of the original variables:
1. the correlation (cosine of the angle);
2. the angle between the component and each original variable;
3. the correlation squared (coefficient of determination) or the propor-
tion of the variance associated with the component.
For example, given Figure 7.3:
representing six original variables and the first principal component; the
following indices could be derived for Figure 7.3 (refer to Table 7.1):
X6
X5
X4X3
CI
X1
X2
Figure 7.3 Geometric relationship between six variables and one principal component
Table 7.1 Correlations, correlations squared
and angles for the component in Figure 7.3
Variable Correlation(r)I Angle r2
X1 0.4732 140 0.2239
X1 0.3722 85 0.1385
X3 0.9615 5 0.9245
X4 0.9051 47 0.8192
X5 �0.2043 107 0.0417
X6 �0.5000 111 0.2500
P= 2.3978

Cross-Cultural Behaviour in Tourism
212
The correlations are known as component loadings and are inter-
preted in the same way as Pearson product-moment correlation coeffi-
cients. Hence the r2 values are coefficients of determination, which
indicate the proportion of the variance in the original variable, which
can be associated with the component: for X3, 92.45 per cent of its
variance is associated with the variance of CI. Consequently, the sum
of the squared loadings indicates the total variance accounted for by
the component. This sum value is known as the eigenvalue (l).Therefore:
�i ¼Xn
j¼1
L2ij ð1Þ
where: Lij is the loading for variable j on component i.
In the example above, lambda = 2.3978.
The eigenvalue alone says little; however when it is related to the total
variance in the correlation matrix it becomes a measure of relative
importance for each principal component. The total variance in the
matrix is n � 1.02=n, given n variables each with a standardized variance
of 1.0 (that is the case if the component accounted for the total variance
of each variable, and consequently each correlation �1.0). In order to
compare each eigenvalue it is merely calculated as a percentage of n. For
the data in Table 7.1:
100ð�1=nÞ ¼ 100ð2:3978=6Þ ¼ 39:96:
The example data suggests that the first component accounts for 40 per
cent of the total variance, which is related to variables X3 and X4 to a
considerable degree. This is confirmed by looking back to the angles
(Figure 7.3) presented earlier. This analysis leaves
some 60 per cent of the variance in the data unac-
counted for and raises the question of whether there
is some general pattern to the residuals, in those por-
tions of the variables not related to the mean pattern.
To answer this question the second component is
extracted.
Thus for our example of six variables discussed
previously, if we have an assumed correlation of
This process requires:
all the proportions of
the inter-correlations,which are a function of
the correlations of the
individual variableswith the component,
are subtracted from
the original
correlations.

Principal components and factor analysis for cross-cultural analysis
213
r12=0.6381 and take LI1=0.4732 (the first loading X1 for the first com-
ponent) and LI2=0.3722; with LI21=0.2239 as part of the correlation r11associated with the component, LI22 as part of r22 associated with the
component, and (LI1)(LI2) as part of r12 associated with the component,
then:
r12 ¼ 0:6381
and:
ðLI1ÞðLI2Þ ¼ ð0:4732Þð0:3722Þ ¼ 0:1761
so that: r12� (LI1)(LI2) =0.6381� 0.1761=0.4620.
Therefore, the correlation between X1 and X2, once the influence of
the first component has been removed is 0.4620, and is the partial corre-
lation, (r12.I.).
The first component is extracted in the above manner to produce a
new correlation matrix made up of partial correlations (rij �(LIi)(LIj),
where i and j are variables). A second principal component can now be
extracted as an average vector from this partial correlation matrix in the
same manner as the first component was extracted from the original
correlation matrix.
In this process variables that have loaded highly on a previous com-
ponent will have little remaining variance to be loaded highly on sub-
sequent components, while variables that have not loaded highly and
have remaining variance are candidates for loading highly on subse-
quent components.
Furthermore, the second and subsequent components will be ortho-
gonal to the first or previous components because the residuals from the
previous component are uncorrelated with the first component (other-
wise they would not be residual; they would have loaded onto the
previous component and increased the correlation). Since zero correla-
tion is shown by orthogonal vectors in our diagrams the second com-
ponent when added into Figure 7.3 becomes right-angular with the first
component (see Figure 7.4). The indices shown in Table 7.2 could be
derived for Figure 7.4.

Cross-Cultural Behaviour in Tourism
214
As a proportion of total variance: (2.1721/6)100=36.2020 or 36 per
cent. This value is below the 40 per cent accounted for by LI, which is
always the case as the second mean vector component is extracted from
the residual variance, which is less important than the original variance.
Hence successive eigenvalues become smaller and the amount of total
variance they explain is less.
Adding the two eigenvalues: 2.3978 + 2.1721=4.5699 we have a large
proportion of the total variance (n=6) accounted for. However, at least
a third component would need to be extracted from the remaining
variance to complete the analysis.
Table 7.2 Correlations, correlations squared and angles for the second
component in Figure 7.4
Variable Correlation(r)II Angle r2
X1 0.9658 45 0.9328
X2 0.9830 3 0.9663
X3 �0.3416 107 0.1167
X4 �0.1210 132 0.0146
X5 �0.2132 170 0.0455
X6 �0.3101 161 0.0962
P= 2.1721 = II (eigenvalue)
X6
X5
X4X3
CI
X1
CII
X2
Figure 7.4 Geometric relationship of Figure 7.3 with a second principal component

Principal components and factor analysis for cross-cultural analysis
215
Communality
A set of loadings is derived once all the principal components have been
extracted:
Loadings
Variable CI II III IV V VI h2
X1 0.4732 0.9658 – – – – –
X2 0.3722 0.9830 – – – – –
X3 0.9615 �0.3416 – – – – –
X4 0.9051 �0.1210 – – – – –
X5 �0.2043 �0.2132 – – – – –
X6 �0.5000 �0.3101 – – – – –
Eigenvalue=P
The communality (h2) is the sum of the squared loading for each variable:
h2j ¼Xk
i¼1
L2ij ð2Þ
where: Lij is the loading for variable j on component i
k is the number of components.
Therefore, it is the proportion of the variance for each variable
accounted for by all the components. The communality must equal 1.0
when the number of components used in its calculation equals the num-
ber of variables.
Scores
In Principal Components Analysis it is desirable to have a measure of the
relationship of each original data case to each of the linear principal
components. These measures are called the component scores and are
calculated by:
Scik ¼Xn
j¼1
DijLjk
where: Scik = the component score of observation (case); on component
k, summed over all n original variables.

Cross-Cultural Behaviour in Tourism
216
Dij = the standardized value for observation i on variable j.
Ljk = the loading of variable j on component k.
Hence, the components are determined on the basis of the original
variable loading with the component. So, if a case has a high value for
the variable with a large component loading then it has a high value on
the component.
Each original measure for each original variable is standardized to
become a Z score (refer to Hypothesis Testing in the Web support
material), and these measures are represented as Dij. So, if the original
data that generated our previous example in Figure 7.4 and Tables 7.1
and 7.2, for the first case were as Z scores:
X1 X2 X3 X4 X5 X6
Case One (Dij) �1.32 +0.08 �2.31 +1.52 �0.80 +0.93
and given the component loadings previously listed for CI:
Component One (Ljk) 0.4732 0.3722 0.9615 0.9051 �0.2043 �0.5000
then:
SciI ¼ ð�1:32Þð0:4732Þ þ ð0:08Þð0:3722Þ þ ð�2:31Þð0:9615Þ
þ ð1:52Þð0:9051Þ þ ð�0:80Þ � ð0:2043Þ þ ð0:93Þ � ð0:5000Þ ¼ 1:7417
which is the first component score of the first case value for the first
component.
There will be as many scores as original case values (N) times compo-
nents K, or N � K component scores, represented in a matrix. Each
matrix of component scores is usually termed a raw component score
matrix. This is because the standard deviations of the scores for each
component vary, although the mean does not, being equal to zero. The
variation in the raw scores, like the variation of residuals around a line of
best fit, will reflect how closely the component (line of best fit) accounts
for the scatter of cases. Since this measure of explained variance in
Principal Components Analysis is given as the eigenvalue for each com-
ponent, it is not surprising that the standard deviation of the raw scores
for each component is the same as the eigenvalue for each component.
Since the objective of producing a components scores matrix is to
examine how the individual data cases are related to each of the compo-

Principal components and factor analysis for cross-cultural analysis
217
nents, the differing standard deviations interfere with interpretation. The
scale of each component’s scores varies. Consequently, it is considered
desirable to rescale all the raw scores to have not only a mean of zero but
the same standard deviation of one (the mean has remained zero because
the raw data used for each component score calculation was standardized
as a Z value (Dij). Z scores have a mean of zero and standard deviation of
one. However, the standard deviations vary because of the multiplication
of Dij by component loadings of different sizes (Ljk). The rescaling can be
achieved by converting the raw scores to Z values. However, it is more
common to divide each raw score by the eigenvalue for the respective
component on which it is listed, having the effect of expressing each raw
score as a proportion of the total variance explained and reducing the
scores to a common base.
The result of the standardizing procedure is to produce a new matrix
of standardized component scores to replace the matrix of raw compon-
ent scores.
Factor Analysis
Factor Analysis is a term that stands for several different types of analysis
including Principal Axes Factor Analysis, Alpha Factor Analysis, Image
Factor Analysis, and Direct Factor Analysis, each of which may be
rotated in an orthogonal or oblique manner. In addition the target of
rotation may be either ‘simple structure’ or defined in advance of the
analysis. These latter subjects will be discussed in more detail below,
suffice it to point out that there are several possible analytic processes
covered under the general title Factor Analysis and each has a particular
advantage in particular problem situations.
The most commonly used Factor Analysis is the Principal Axes
method, which is identical to Principal Components Analysis except for
the use of communality estimates in the diagonal of the correlation
matrix and the rotation normally applied in the analysis. Because of
the similarities in name and calculation between Principal Components
Analysis and Principal Axes Factor Analysis the two have often been
confused. Additionally, the current literature discussing the methods in
text form rarely manages to give any adequate distinction between the
two methods. Moreover, some books list Principal Components Analysis
as a subsection of Factor Analysis to make the confusion complete.

Cross-Cultural Behaviour in Tourism
218
The difference between Principal Components Analysis and
Factor Analysis
The major difference between the two methods is the diagonal in the
correlation matrix. In Principal Components Analysis the diagonals of
the matrix are one:
X1 X2 X3
X1 1.00 0.50 0.60
X2 0.50 1.00 0.70
X3 0.60 0.70 1.00
In this model the components derived account for all the variance in each
variable, including that ‘shared’ with other variables. Hence the total
variance=1.0 is accounted for. Since, at least theoretically, each variable
will have some variance unique to itself, apart from any shared variance,
in order to account for all the variance, there must be as many compon-
ents as variables. Given the stepwise calculation of components whereby
the first component accounts for the most variance and subsequent com-
ponents for the most remaining variance, the last components are likely
to have only one variable loaded significantly on them, representing the
unique variance for that variable.
The terms used to divide the variance are unique variance, which is
composed of individual variation of a given variable including sampling
error, and common variance, which refers to the shared variance between
variables (see Figure 7.5).
Common variance
X1 X2 X3
Unique variance
Figure 7.5 The relationship between unique and common variance

Principal components and factor analysis for cross-cultural analysis
219
Factor Analysis accounts for the common variance as opposed to
Principal Components Analysis, which accounts for total variance.
Hence the diagonal of the correlation matrix must become some measure
of the common variance between each set of variables and not one. Since
the factors derived from Factor Analysis account for only part of the total
variance there is no theoretical expectation that the number of factors will
equal the number of variables. In fact, the number of factors may well be
fewer than the number of variables, which is a most desirable trait of
Factor Analysis, aiding in the reduction of the number of variables.
Unfortunately, Factor Analysis has got a problem in the measurement
of common variance for the diagonals of the correlation matrix. It is
the solution of this problem, determining the common variance, which
is the major reason for the different types of Factor Analysis techniques.
The most common method (Principal Axes Factor Analysis) employs the
squared multiple correlation coefficient of each variable against all
the other variables in the analysis. The diagonal calculated in this way
is a good guess of the communality. The sum of these principal diagonal
(‘trace’) values is the total common variance to be analysed.
This procedure weights the importance of each variable in the Factor
Analysis by the strength of its correlation with all the other variables. As
a result of this weighting of each variable the factors are pulled closer to
the variables with the larger communalities. For example, given:
where there are two variables X1 and X2, and X2 is longer than X1
because of the weighting process, the factor will not lie at equal distances
between the two variables but will be pulled toward the more heavily
weighted variable, X2. Principal Components Analysis treats all variables
equally (they all have the same length); the diagonal trace is equal to 1.0
in all cases, whereas Factor Analysis does not. Hence Principal
Components Analysis would extract the line ‘equal’ whereas a Factor
Analysis would extract the line ‘weighted’.
X1
Equal
Weighted
X2

Cross-Cultural Behaviour in Tourism
220
The main question that arises from the difference between Principal
Components Analysis and Factor Analysis is how important the difference
is. In short, the importance of the difference is all encompassing, so much
so, that Principal Components Analysis should not be considered simply
one of several Factor Analysis models, but a separate technique. The
components derived from Principal Components Analysis identify inter-
relationships among groups of variables and unique variance, so that some
components consist of both unique and common variance; while others
consist only of unique variance. The mixture of variance remains largely
indecipherable, although the component loadings hint at the relationship.
Some components have several variables loaded thereon (often variables
showing some inter-correlation in the correlation matrix), while some
components have only one variable loading highly on them.
Factor Analysis removes the confusion by accounting only for com-
mon variance by the weighting of variables according to their inter-
relationships in the correlation trace.
Therefore, the choice of method depends upon the problem to be
solved. If the researcher wants to classify all the variation in the data
set – for example, to draw dimensions of movement in a matrix of the
travel of people from a set of source origins to all destinations in the set –
then Principal Components Analysis is the appropriate method. The
fundamental total dimensions of travel (such as dimension one movement
to sunny, seaside leisure resorts) will be drawn out, as will movement that
is unique to one place and less easily explained. On the other hand, if the
researcher is attempting to understand only the inter-relationships
between variables – for example how socio-economic status can be
defined from several variables, where it is the inter-relationship (common
variance) that defines the nebulous concept of socio-economic status
and not just unique variance associated with one variable – then
Factor Analysis would be more appropriate.
As a result of the above it could be argued that Factor Analysis is the
best method for determining whether groups of variables exist. If groups
do exist they will have shared common variance. These groups can be
induced from an experimental analysis – although it is not necessary in
using Factor Analysis to have hypothesized the groups’ existence as is
often stated in literature. However, if an inductive process is used the
interpretation of the resulting dimensions may be difficult. This is equally
true for Principal Components Analysis except that the wider range of

Principal components and factor analysis for cross-cultural analysis
221
variance (resulting in diversity of component loadings) may allow for
easier classification in some situations.
Factor rotation
There are several methods for rotating the factors around the origin so as
to increase the ‘fit’ of the factors to groups of variables. This rotation is
necessary because the first factor located (using the Principal Axes
method) is a mean location between variables, and in many cases this
may not distinguish groupings to the best extent. For example, see Figure
7.6a.
given the four variables X1 to X4, in the above relationship, there appear
to be two groups: (X1 and X2) and (X3 and X4); however, Factor One
divides the two groups in order to achieve a mean location. Ideally, the
rotation of the factors around the origin would move the factors into a
position that would locate them as close as possible to each group but as
far away from each other as possible (see Figure 7.6b).
Figure 7.6a Factors for rotation among four variables. Note: The variables are given as equal
lengths to maintain a simple explanation. In fact, with a Factor Analysis method each variablewould be weighted by the communality and the lines would be different lengths to represent the
weighting process
Figure 7.6b Factors for rotation among four variables

Cross-Cultural Behaviour in Tourism
222
Before a method was derived to achieve this result, analysts pro-
duced graphical representations of the factors and visually selected the
best possible rotations. The problem was, of course, that no two
analysts would select exactly the same rotation. The problem was
solved by Thurstone in 1947 when he developed the concept of a
simple structure which is a normative (ideal) model toward which
the rotation can aim, although it would never be achieved because
of the unreal normative definition. The concept of simple structure
gave Factor Analysis a mathematical rigidity so that two people con-
ducting the same analysis on the same data would now come to the
same result.
Simple structure is defined by a factor loadings matrix where every
variable has a loading of either +1.0 or �1.0 on one factor, and 0.0 on all
others. The actual factor, which has the loading of �1.0, is not specified.
For example, see Table 7.3.
The factors are rotated around the origin to get as close as possible to
this ideal norm. In order for the ideal to be attained, the variables would
have to be perfectly correlated or uncorrelated in a given pattern and the
trace estimates would all have to be 1.0.
Of the several rotation methods that have been developed, two general
types have stood the test of time: orthogonal and oblique rotation.
Table 7.3 Example loadings matrix
for simple structure in Factor Analysis
Factor loadings
Variable I II III
X1 +1.0 0.0 0.0
X2 �1.0 0.0 0.0
X3 0.0 0.0 +1.0
X4 0.0 +1.0 0.0
X5 0.0 0.0 �1.0
X6 0.0 �1.0 0.0

Principal components and factor analysis for cross-cultural analysis
223
Orthogonal rotation
Orthogonal rotation is way and above the most commonly used method.
It retains the notion of right-angles between factors, that is, the factors
are always kept at the maximum degree (908) for an uncorrelated state.
As said earlier, when factors are separated by a right-angle they are
uncorrelated and said to be orthogonal to each other.
Using our previous example in Figures 7.6a and b, an orthogonal
rotation is shown where the dotted factor lines rotate clockwise from
their position in Figure 7.6a to their location in Figure 7.6b. Such an
orthogonal rotation maintains the right-angle and improves the delinea-
tion of the two groups.
The most commonly used method of orthogonal rotation is Kaiser’s
varimax rotation, which maximizes the variance in the cosines.
The number of factors extracted is vital to a rotation, since this
determines the number of groups of variables defined. Every rotation
is unique to each number of factors rotated. If only three factors from
a possible total of 10 are rotated, the opportunity to closely define
these groups is more enhanced than if say six factors are rotated. As
each additional factor is added into the rotation, more groups must be
distinguished, and the difference between the groups becomes more
blurred. If only one factor is rotated, the object of the analysis is
lost (to distinguish groups), and there is no need to rotate. In fact
rotation may reduce the loadings for the first factor in favour of
other factors.
Once the factors have been rotated, the sum of the squared loadings on
any factor is no longer termed the eigenvalue. The term eigenvalue refers
to that specific mean vector in the correlation matrix determined prior to
rotation.
The question within Factor Analysis becomes: how many factors
should be rotated? Kaiser suggested that the number of factors should
be equal to the number having eigenvalues greater than one. The idea is
sensible since the sum of all n roots (eigenvalues) is equal to n, so that a
value of one is par, and surely if another factor is to be added, it would be
preferable to have it account for more than an average contribution.
From the experience of many analyses, and quite apart from any math-

Cross-Cultural Behaviour in Tourism
224
ematical justification in theory, factors retained that exceed an eigenvalue
of one are known to be more readily interpretable than factors with less
than or equal to an eigenvalue of one.
Other proposals have been made for selecting the number of factors,
for example, Cattell (1966) suggested a graphical method called the scree
test, which is based on plotting the sizes of the eigenvalues and taking
only those factors whose eigenvalues fall above the evening out point
(scree slope) in the decreasing eigenvalue plot. These alternative propo-
sals offer no more or less than Kaiser’s test of an eigenvalue greater than
one. The interpretation of the resulting factors is discussed in the example
later in ‘Cultural analysis using Principal Components Analysis’. There
are other methods of orthogonal rotation (see Mulaik, 1972) including
transvarimax methods (equamax and ratiomax) described in Saunders
(1962), parsimax (Crawford, 1967), and simultaneous orthogonal vari-
max and parsimax (Horst, 1965).
Oblique rotation
Oblique rotation is used only when orthogonal rotations are not suited to
identifying group structure. An assumption has to be made that the
factors that result are independent (orthogonal), which may well not be
the case in any given analysis. In the case of oblique rotation the angle
between the factors can be other than 908 (see Figure 7.7).
The simple structure now changes and it is hypothesized that every
variable has one loading of +1.0 or �1.0, but the other loading no longer
needs to be 0.0. Of course, an orthogonal result could theoretically be
reached if the groups are in fact unrelated.
A similar problem to orthogonal rotation occurs in defining an appro-
priate number of factors to rotate. Kaiser’s test of an eigenvalue greater
than one is normally used.
An additional problem occurs with the degree of obliqueness that can
be allowed. Each additional factor added could divide already existing
groups, especially for the last factors rotated. The more factors that were
incorporated the closer the solution to one variable per factor would be
the ultimate result, if all factors were rotated.

Principal components and factor analysis for cross-cultural analysis
225
Unlike orthogonal rotation, two factor loadings are obtained from an
oblique rotation, the structure loading and the pattern loading. The
following diagram shows the difference between the two loadings.
Only one variable X1 is shown for simplicity. The structure loading
is obtained in the same way as orthogonal rotation; the X1 line casts a
shadow reflecting its correlation onto the factor giving the line O, S.
The pattern loading line is drawn parallel to other factors, in this case,
FI, bisecting the FII line at P. The distance OP is called the pattern
loading, for X1 on Factor II. The pattern loading shows the correlation
between the variable and the factor, independent of the effects of the
X3
FI
X4
FII
X2B. X1
X3
X1
X4
FII
X2
FI
A.
Figure 7.7 Oblique factor rotation

Cross-Cultural Behaviour in Tourism
226
other factors. The pattern loading is therefore a partial correlation
between X1 and FII when the effect of FI is held constant. The
angle a is equivalent to the inter-correlation between the factors, and
the line X1 � P is the only one to join X1 to factor FII, which would
produce this angle. The distance PS thus represents that portion of the
structure loading, OS, which results from the joint influence of factors
I and II on X1.
The structure loading is interpreted in the same way as orthogonal
loadings. Hence the factors and structure loadings are really the main
focus of interpretation. The pattern matrix gives all the partial correla-
tions between variables and factors when the influence of the other
factors is held constant.
No communalities, eigenvalues or sums of squared loadings are output
from an oblique rotation because they cannot be interpreted. Joint
variance can be double counted or omitted in these measures.
The Oblimin method is probably the most commonly used method of
oblique rotation because it is available in SPSS, Carroll (1960). Other
methods include Kaiser’s (1970) second generation Little Jiffy, the
Oblimax method (Saunders, 1961), promax (Hendrikson and White,
1964) and Maxplane (Cattell and Muerle, 1960). Use of the Oblimin
direct method (Jennrich and Sampson, 1966) requires a setting of the
degree of obliqueness through a specific parameter named delta. For
delta equal to zero the factors are highly correlated and they become
less correlated as delta becomes negative. For most problems delta should
be set between zero and �5 (where the factors become less oblique).
Rotation to alternative ‘simple structure’
If the Factor Analysis is to be used to test a hypothesis, that hypothesis
concerning group structure could be stated in the form of an alternative
‘simple’ structure, to which the Factor Analysis could rotate.
The hypothesis to be tested must state the expected distribution of
common variance between factors for a set of variables, so that each
variable is hypothesized to associate with a particular factor.

Principal components and factor analysis for cross-cultural analysis
227
Rotation and Principal Components Analysis
Principal components with eigenvalues greater than one (using Kaiser’s
test) are commonly rotated using an orthogonal rotation, such as vari-
max. However, unlike Factor Analysis there is no relevant ‘simple struc-
ture’ to which such a rotation can aim, or a norm against which rotated
loadings can be compared. Simple structure as a hypothesis refers to
common variance only and does not allow for the unique variance dis-
tributed among principal components.
Consequently, the rotation of a Principal Components Analysis can-
not result in a Factor Analysis, although, as it so happens, the difference
between the two methods is often not great. Rotated components with
eigenvalues greater than one are usually better group identifiers than
unrotated components. However, rotated components cannot be used
to test for a hypothesis of structure the way rotated factors can.
Rotation of components is not in itself a hypothesis testing procedure,
but merely an attempt to more clearly identify components.
Factor scores
Factor scores are the equivalent of principal component scores, discussed
earlier, for Factor Analysis. Unlike component scores that are directly
calculable, factor scores can only be estimated. This is because Factor
Analysis concerns only common variance, and each observed value has a
combination of common and unique variance in unknown proportions.
The estimation process involves regressing the data matrix onto the
loadings matrix, and thus assuming that the average proportions of com-
mon and unique variance in the loadings are the same for each observa-
tion. Such an assumption is quite a major draw-back to Factor Analysis.
Moreover, the further away from simple structure any loadings matrix is,
the more difficult it is to interpret such estimated scores.
This problem of estimating useful factor scores has not been over-
come, and until it is, the factor score estimates if used, could be highly
misleading.

Cross-Cultural Behaviour in Tourism
228
However, the obvious solution to the problem of mixed variance in
the basic data values is to begin the analysis knowing the proportion
of unique and common variance for the observations. A multiple
regression can provide this information, where the residual measures
unique variance and the predicted value common variance. Hence
Image Factor Analysis has developed as an alternative Factor
Analysis method based upon the correlations among the common
variance elements only, after the unique variance elements (measured
by the residuals from multiple regression) have been removed. In this
way the factor scores can be computed directly and do not have to be
estimated.
The problem faced by a user of Image Factor Analysis, who has
chosen this method to obtain useable factor scores, is that the original
data has been transformed prior to the Factor Analysis (by removal of
unique variance) and the loadings which result, and even the factors
generated, are different from what would have been obtained using a
conventional Factor Analysis. Image Factor Analysis is best used only
when it is essential to use Factor Analysis to test the hypothesis of simple
structure, and it is also essential to derive useful and accurate factor
scores for the purpose of the study in hand.
Controlling the input matrix in both Principal Components
and Factor Analysis
Most modern analysis procedures allow the analyst to vary the nature
of the input matrix into both Principal Components and Factor
Analysis. That is, the input matrix does not have to be in the two
forms already discussed: a correlation matrix for Principal
Components with diagonals of 1.0, and a correlation matrix with com-
munalities as the trace for Factor Analysis. The eigenvalues and eigen-
vectors of factor analytic methods can be extracted from any square
symmetric matrix.
Two common alternative matrices can be used, and possibly some
other forms. The most common alternative input matrix is a covariance
matrix, and the second alternative is a binary matrix.

Principal components and factor analysis for cross-cultural analysis
229
Covariance matrix input
In cases where the observations have magnitude, which is essential to the
derivation of meaningful factors or components, a covariance matrix of
cross-products can be used. Because cross-products do not, like the cor-
relations, vary between �1.0, the loadings emphasize the absolute size of
the original values.
For example, where the data for the analysis is the movement of
tourists between regions, the volume of flow is essential to the observa-
tion of components or factors of grouped tourist movement. Such an
analysis would draw out groups of regions that are linked by their in
(or out) flow of tourists by volume flow.
The data used in such an analysis must be measured on a uniform scale
to be meaningful. If, for example, the volume of tourism were measured
in various ways (for example by residence versus nationality) for each
region, the results could not be interpreted.
The choice between using a Principal Components Analysis or a
Factor Analysis with a covariance matrix input would seem to be unim-
portant and if the factor method is the Principal Axes method there
should be no difference in results.
Binary matrix input
In a binary matrix a value of one indicates a direct connection between two
variables and a value of zero no direct connection. The components or fac-
tors that result group the variables on the basis of their interconnections.
For example, a network (of roads, airways, wires, etc.) is made up of
nodes and lines linking the nodes. The nodes are the variables of the
analysis. In the situation where two nodes are connected, the input matrix
shows a one and for a disconnection a zero. Hence, given the network
below:
A B
D EC

Cross-Cultural Behaviour in Tourism
230
the matrix becomes:
Nodes
A B C D E
A 0 0 1 1 1
B 0 0 1 0 1
C 1 0 0 0 0
D 1 0 0 0 0
E 1 1 0 0 0
Factor and Principal Components Analysis of such a matrix will identify
the major linkage patterns. In a truly complex network, where such
linkages are not obvious, such an analysis may be used to either describe
the system, or to test a hypothesis about the nature of the linkages. In
the particular case of a binary matrix, the difference between using a
Factor Analysis and Principal Components Analysis merely lies in the
nature of the eigenvectors of the loading matrix; they are standardized in
Principal Components Analysis, and unstandardized in Factor Analysis.
Alternative input matrix modes for both Principal
Components and Factor Analysis
Apart from the inputting of different correlation matrices there is another
question concerning the choice of data matrix structure. In fact, there are
six modes (Table 7.4) or six different ways, in which a data matrix can be
extracted from a body of data (refer to Figure 7.8).
The original data body is normally represented in the fashion dis-
played in Figure 7.8. The data body has n variables for N observations
over t time periods.
Figure 7.8 Data body for the description of the six matrix modes for data input into Principal
Components and Factor Analysis
Nodes

Principal components and factor analysis for cross-cultural analysis
231
Care must be taken in using the various modes. All can be used for
descriptive purposes; however, for inferential purposes the number of
rows should exceed the number of columns. Preferably the rows should
equal 20 � P (where P is the number of columns) if a hypothesis is to be
tested.
Example Cultural analysis using PrincipalComponents Analysis
The following example analysis is part of a paper titled ‘Importance and
expectations of destination attributes for Japanese tourists to Hawaii and
the Gold Coast compared’ by L. Turner and Y. Reisinger reprinted from
the Asia Pacific Journal of Tourism Research, Vol. 4, No. 2, 1999, pp. 1–18
with permission from the publisher. This study provides a good example
of the use of Principal Components Analysis in a tourism-based cross-
cultural setting.
Table 7.4 Six modes of data matrix for input into Principal
Components or Factor Analysis
1. R-Mode Most common form and the one used for discussion
throughout Chapter 8.
The n variables form columns.
The N observations form rows.
Time held constant.
2 Q-Mode The N observations form columns.
The n variables form rows.
Time held constant.
3. O-Mode The t time periods form columns.
The n variables form rows.
Observations held constant.
4. P-Mode The n variables form columns.
The t time periods form rows.
Observations held constant.
5. S-Mode The N observations form columns.
The t time periods form rows.
Only one variable studied.
6. T-Mode The t time periods form columns.
The N observations form rows.
Only one variable studied.

Cross-Cultural Behaviour in Tourism
232
Japan is a good example of a market supplying growth for numerous
world destinations including Hawaii in the US and the Gold Coast in
Australia. Both of these destinations are potential competitors for
Japanese tourists for several reasons: (1) they are about equal travel
time away from Japan; (2) they are both tropical resort destinations
offering ‘sun, sand and relaxation’; (3) they are both western, English
speaking destinations; (4) they are both modern destinations having
similar history and culture, and offering modern environments that are
not steeped in cultural heritage; (5) the cultural heritage in both destina-
tions dates back to endogenous native populations; (6) they both offer a
marketing profile, which includes wild environments and scenic land-
scapes; and (7) the population of both destinations can reasonably be
expected to offer similar levels of service quality.
An interesting question that arises is how do Japanese tourists view
these two potentially competing destinations? What differences can be
found in the levels of expectations, and ultimate satisfaction with the
destination attributes? These questions are answered using, in part,
Principal Components Analysis.
The specific destination attributes selected for this study were adopted
from previous destination attractiveness and image studies (Echtner and
Ritchie, 1991; Gearing et al., 1974; Ritchie and Zins, 1978; Sirakaya et
al., 1996). Twenty-seven ideographic questions were asked in the general
form: ‘How satisfied are you with’. A seven-point scale ranged between
‘extremely satisfied’ (1) through ‘satisfied’ (4) to ‘extremely dissatisfied’
(7). It was considered that a seven-point scale would allow for a wide
range of answers to enhance the statistical variability of responses. A
sample of 607 Japanese tourists visiting Hawaii and 663 visiting the
Gold Coast has been collected, giving a total sample of 1270 tourists.
In Hawaii 300 arriving tourists, and separately on the Gold Coast, 307
arriving tourists were sampled. On departure from Hawaii 300 tourists
and 363 from the Gold Coast were sampled.
The samples were collected over the period August 1998 to March
1999. Two separate survey instruments were devised, one for arriving
tourists and one for departing tourists. Only departing tourists were
asked the satisfaction questions, and only arriving tourists were asked
the expectation questions. The sample of arriving and departing tourists
in each of the two locations were the same individuals.

Principal components and factor analysis for cross-cultural analysis
233
The instruments were translated into the Japanese language via a
process of original and back translation. The surveys were distributed
and collected using Japanese speaking interviewers. Pilot testing of thirty-
four Japanese tourists was conducted on the instrument to ensure all
questions could be understood and did not contain ambiguous questions
or interpretive problems.
There is a potentially significant difficulty in asking the Japanese to
directly indicate levels of satisfaction, as it is often the case in eastern
cultures and the Japanese culture in particular, to keep criticism private
in order to avoid conflict or loss of face. This was not considered a major
concern in this survey because the respondents marked their own survey
instruments on a seven-point scale. They were not required to verbalize
their comments or express their feelings with the interviewer.
A simple individual attribute analysis is insufficient to make conclu-
sions about the relative merits of the two destinations. The question is how
do these attributes combine to create an image of expectation and satis-
faction? More importantly, how do these images compare? The literature
on tourism decision-making clearly indicates that travellers do not simply
compare individual attributes in making their destination choices, but
rather react to the overall image of destinations. Tables 7.5 to 7.12 provide
Table 7.5 Total variance explained and significance tests. Expectations on
arrival on the Gold Coast
Component Extracted
communality
Initial
eigenvalue
Percentage of
explained
variance
Rotated
eigenvalue
Percentage of
explained
variance
1 0.564 8.912 33.008 4.326 16.022
2 0.666 3.192 11.821 3.337 28.383
3 0.656 1.862 6.896 3.029 39.602
4 0.639 1.507 5.583 2.850 50.158
5 0.661 1.285 4.759 2.659 60.006
6 0.667 1.235 4.575 1.791 66.641
Kaiser-Meyer-Olkin Measure of Sampling Adequacy 0.874
Bartlett’s test of Sphericity: Approx Chi-Square 4665.775
d.f. 351
Significance 0.000

Cross-C
ultu
ral
Beh
aviou
rin
Tou
rism
234
Table 7.6 Principal Components Analysis of expectations on arrival for the Gold Coast
Dimension 1 2 3 4 5 6
Characteristic Exotic place Transport Cleanliness Cost Social Assistance
Popular image of the destination 0.605Safety of the destination 0.655Ease of getting there 0.774Ease of local transportation 0.706Architecture/buildings 0.694Quality of accommodationUnpolluted environment 0.821Clean facilities 0.696Rest and relaxationExotic environment 0.729Opportunity for adventure 0.825Availability of tourist information 0.615Assistance with foreign language 0.656Nightlife and entertainment 0.674Sport activities 0.715To visit national parksTo visit historic sites/museums 0.609To see the wildlife 0.675Shopping opportunitiesTo experience a different culture and customsTo experience different food and drink 0.715Opportunity to socialize with locals 0.689Friendliness of the local people 0.732To improve your social standing in Japan 0.630The cost of airfare 0.757Local prices 0.858The exchange rate 0.853Percentage variance explained – Total [66.64] 33.01 11.82 6.90 5.58 4.76 4.58

Principal components and factor analysis for cross-cultural analysis
235
the results from four Principal Components Analyses of expectation
and satisfaction for the Gold Coast and Hawaii. For the purpose of
this study a Principal Components Analysis was run using SPSS 10.1
for each of the characteristic matrices for the Gold Coast and Hawaii.
The objective of the analysis is exploratory, to see whether there are
different dimensions of expectation and satisfaction in each location,
and also to see whether any like dimensions are in a similar or dis-
similar order of significance. It may be that combinations of character-
istics as opposed to individual measures are more informative about
differences between the two destinations.
An eigenvalue of one is used as the cut-off value to determine the
number of components to be rotated. In this case the scree test would
be less useful as it is more difficult to determine the cut-off point of the
scree slope because the eigenvalues tend to scale down evenly (refer to
Table 7.5). The KMO is very high at 0.87 and the sphericity test is
rejected well beyond 95 per cent statistical significance indicating high
sample adequacy in Table 7.5. The KMO is particularly high at 0.92, 0.94
and 0.90 and the sphericity test hypothesis is also rejected indicating
sample adequacy in Tables 7.7, 7.9 and 7.11, respectively. In each of
the four analyses the anti-image matrix is not given because of size.
However, the diagonals all show high negative partial correlations.
Only dimensions that load two or more variables (at 0.6 or higher) are
accepted for interpretation because fewer than two variables do not allow
for an adequate description of the dimension (refer to Tables 7.6, 7.10
and 7.12).
Table 7.7 Total variance explained and significance tests. Expectations on
arrival at Hawaii
Component Extracted
communality
Initial
eigenvalue
Percentage
of explained
variance
Rotated
eigenvalue
Percentage
of explained
variance
1 0.621 10.742 39.786 4.241 15.706
2 0.647 2.263 8.382 3.842 14.228
3 0.720 1.687 6.248 3.192 11.823
4 0.736 1.275 4.721 2.823 10.454
5 0.634 1.079 3.996 2.151 7.968
6 0.682 1.020 3.779 1.818 6.732

236
Table 7.8 Principal Components Analysis of expectations on arrival for Hawaii
Dimension 1 2 3 4
Characteristic Socials Safety Cleanliness Cost
Popular image of the destination 0.681
Safety of the destination 0.710
Ease of getting there 0.775
Architecture/buildings 0.742
Quality of accommodation 0.672
Unpolluted environment
Clean facilities 0.729
Rest and relaxation 0.722
Exotic environment
Opportunity for adventure
Availability of tourist information
Assistance with foreign language
Nightlife and entertainment
Sport activities
To visit national parks 0.723
To visit historic sites/museums 0.809
To see the wildlife 0.722
Shopping opportunities
To experience a different culture and customs 0.608
To experience different food and drink
Opportunity to socialize with locals 0.656
Friendliness of the local people
To improve your social standing in Japan
The cost of airfare 0.823
Local prices 0.879
The exchange rate 0.860
Ease of local transportation
Percentage variance explained –
Total [59.14] 39.79 8.38 6.25 4.72
Table 7.9 Total variance explained and significance tests. Satisfaction on
departure from the Gold Coast
Component Extracted
communality
Initial
eigenvalue
Percentage
of explained
variance
Rotated
eigenvalue
Pecentage
of explained
variance
1 0.680 12.405 45.945 5.057 18.729
2 0.681 2.244 8.313 4.363 16.158
3 0.708 1.259 4.663 4.259 15.776
4 0.595 1.239 4.587 3.468 12.846

237
Table 7.10 Principal Components Analysis of satisfaction on departure for the
Gold Coast
Dimension 1 2 3 4
Characteristic Safe Social Cost Adventure
Popular image of the destination 0.735Safety of the destination 0.745Ease of getting there 0.770Ease of local transportation 0.620Architecture/buildings 0.691Quality of accommodation 0.661Unpolluted environmentClean facilitiesRest and relaxationExotic environmentOpportunity for adventure 0.610Availability of tourist informationAssistance with foreign languageNightlife and entertainmentSport activitiesTo visit national parks 0.684To visit historic sites/museums 0.623To see the wildlifeShopping opportunitiesTo experience a different culture and customs 0.689To experience different food and drink 0.695Opportunity to socialize with locals 0.698Friendliness of the local people 0.714To improve your social standing in Japan 0.657The cost of airfare 0.683Local prices 0.734The exchange rate 0.770
Percentage variance explained – Total [66.9] 45.95 8.31 4.66 4.59
Table 7.11 Total variance explained and significance tests. Satisfaction on
departure from Hawaii
Component Extracted
communality
Initial
eigenvalue
Percentage
of explained
variance
Rotated
eigenvalue
Pecentage
of explained
variance
1 0.582 9.874 36.572 3.306 12.243
2 0.621 2.428 8.993 3.243 12.012
3 0.741 1.728 6.401 3.070 11.371
4 0.642 1.326 4.910 2.760 10.224
5 0.681 1.222 4.526 2.379 8.810
6 0.615 1.115 4.131 2.060 7.631
7 0.670 1.004 3.718 1.879 6.960

Cross-Cultural Behaviour in Tourism
238
Table 7.12 Principal Components Analysis of satisfaction on departure for Hawaii
Dimension 1 2 3 4 5 6
Characteristic Exotic Social Sites Safe Cost Adventure
Popular image of the destination
Safety of the destination 0.638
Ease of getting there 0.810
Ease of local transportation 0.745
Architecture/buildings
Quality of accommodation 0.603
Unpolluted environment 0.749
Clean facilities 0.789
Rest and relaxation 0.630
Exotic environment 0.620
Opportunity for adventure 0.696
Availability of tourist information
Assistance with foreign language
Nightlife and entertainment
Sport activities
To visit national parks 0.837
To visit historic sites/museums 0.836
To see the wildlife 0.805
Shopping opportunities 0.631
To experience a different culture and
customs 0.631
To experience different food and
drink 0.665
Opportunity to socialize with locals 0.755
Friendliness of the local people 0.766
To improve your social standing
in Japan
The cost of airfare 0.683
Local prices 0.850
The exchange rate 0.842
Percentage variance explained –
Total [65.53] 36.57 8.99 6.40 4.91 4.53 4.13

Principal components and factor analysis for cross-cultural analysis
239
Example Component interpretation
The interpretation of the components can be described as logically sub-
jective, and is based upon the nature of the variables loading on each
component.
There are four dimensions of expectations for Hawaii and six for
the Gold Coast (refer to Tables 7.6 and 7.8). The interpretation is as
follows:
1. The first dimension of expectation for Hawaii is based upon attrac-
tions and wildlife, culture, and socializing. For the Gold Coast the
main expectations are exotic, adventurous, sporting, and nightlife/
entertainment attributes.
2. The second dimension for Hawaii is ease of transport, architecture,
safety, and popular image that is the same for the Gold Coast.
3. The third dimension for Hawaii is quality of accommodation, clean-
liness and rest, whereas for the Gold Coast it is a clean, unpolluted
wildlife environment.
4. The fourth dimension for Hawaii is low cost, which is the same for
the Gold Coast.
5. There is a fifth dimension for the Gold Coast of food and socializing.
6. There is also a sixth dimension for the Gold Coast of information
and language assistance.
There are six dimensions of satisfaction for Hawaii and four for the
Gold Coast (refer to Tables 7.10 and 7.12). The interpretation is as
follows.
1. Dimension one for Hawaii is quality accommodation, in a restful,
exotic, clean, and unpolluted environment. For the Gold Coast the
first dimension is ease of transport in a safe destination with a pop-
ular image.
2. The second dimension for Hawaii is culture, food and socializing,
and it is the same for the Gold Coast.
3. The third dimension for Hawaii is visiting natural and historical sites
and wildlife, whereas for the Gold Coast it is low cost and improving
social standing.
4. The fourth dimension for Hawaii is safety and ease of transport, and
for the Gold Coast, it is adventure and visiting national parks.
5. The fifth dimension for Hawaii is cost.
6. The sixth dimension for Hawaii is adventure and shopping.

Cross-Cultural Behaviour in Tourism
240
Discussion of the dimensional differences
The issue of interest in comparing the dimensions is how much the
dimensions of expectation are met by final satisfaction. In this regard
Hawaii performs very well. The first and most important dimension of
expectation for Hawaii is the natural environment, wildlife, and social-
izing, which come out in the first three dimensions of satisfaction for
Hawaii along with culture, food and an exotic, clean and unpolluted
environment. Hawaii does not do quite so well for the expectation of
safety and ease of transport, which are a second dimension of expecta-
tion and a fourth dimension of satisfaction. Hawaii also does less well
on cost, which is the fourth dimension of expectation, and a lowly fifth
dimension of satisfaction.
For the Gold Coast there are significant problems. The first dimension
of expectation (exotic, adventurous, sporting, nightlife) is not met by
satisfaction. The most important expectations are simply not met on
the Gold Coast, and an unexpected result for the Gold Coast is ease of
transport, safety, socializing, and low cost. The surprise areas of satisfac-
tion may be considered good in themselves, but they are also boring and
at the whim of financial change (exchange rates) compared with exotic
and adventurous expectations.
In conclusion, it would seem thatHawaii outperforms theGoldCoast in
terms of satisfaction for the tourist, based on the analysis from this study.
Summary
Factor Analysis can be used to study cultural differences. There are
major differences between Factor Analysis and Principal Components
Analysis. The primary aims include removing collinearity between
variables, reducing the number of variables, and identifying groups
of variables. Tests of significance can be performed. The process of
calculation can be explained graphically. There are different ways to
extract relevant components. Two main forms of rotation are ortho-
gonal and oblique rotation. There are several ways to enter data into a
factor analytic analysis. The example with an application to tourism
cultural analysis using Principle Components Analysis was presented.

Principal components and factor analysis for cross-cultural analysis
241
Discussion points and questions
1. Explain the difference between the objectives of Factor Analysis and
Principal Components Analysis.
2. State three aims of Principal Component Analysis.
3. Create an example problem that could be analysed by Principal
Components Analysis.
4. Describe the difference between oblique and orthogonal rotation.
5. Define the following terms: factor loadings, communality, eigenvalue
and factor score.
6. How do you determine how many factors should be rotated?
7. How do you use the rotated loadings matrix to describe the nature of
the components?
8. Why is a good KMO closer to one?
Further reading
Ap, J. and Crompton, J. (1998) Developing and testing a tourism impact
scale. Journal of Travel Research 37(2): 120–130.
Cai, L. and Combrink, T. (2000) Japanese female travellers – a unique
outbound market. The Asia Pacific Journal of Tourism Research 5(1):
16–24.
Cooley, W. and Lohres, P. (1971) Multivariate Data Analysis. New York:
Wiley.
Harman, H. (1976) Modern Factor Analysis, 3rd edition, Chicago:
University of Chicago Press.
Johnston-Walker, R. (1999) The accommodation motivations and
accommodation usage patterns of international independent pleasure
travellers. Pacific Tourism Review 3(2): 143–150.
Keng, K. and Cheng, L. (1999) Determining tourist role typologies: an
exploratory study of Singapore vacations. Journal of Travel Research
37(4): 382–390.
Lindeman, R., Merenda, P. and Gold, R. (1980) Introduction to Bivariate
and Multivariate Analysis. London: Scott, Foresman and Co.
Morrison, D. (1976) Multivariate Statistical Methods, 2nd edition, New
York: McGraw-Hill.
Rummel, R. (1967) Understanding factor analysis. Conflict Resolution 11:
444–480.

Cross-Cultural Behaviour in Tourism
242
Turner, L. and Reisinger, Y. (1999) Importance and expectations of
destination attributes for Japanese tourists to Hawaii and the Gold
Coast compared. Asia Pacific Journal of Tourism Research 4(2): 1–18.

8Structural equation
modelling for cross-
cultural analysis
Objectives
After completing this chapter the reader should
be able to:
& understand the concept of structural equation
modelling (SEM)
& identify research problems that can be solved
using SEM
& understand the application of SEM in
tourism.

Cross-Cultural Behaviour in Tourism
244
Introduction
During the last decade structural equation modelling (SEM) has increas-
ingly been applied in the marketing discipline, particularly in the US. In
the tourism discipline this technique has not been applied widely. The
concept of SEM is difficult to understand due to its statistical complexity
and non-user-friendly computer manuals.
This chapter introduces the basic concepts associated with SEM using
LISREL in a comprehensive and non-technical manner. It is based upon
the article ‘Structural equation modelling with LISREL: application in
tourism’ by Y. Reisinger and L. Turner published in Tourism
Management, Vol. 20, No 1, 1999, pp. 71–88, reprinted with permission
from Elsevier Science. The purpose of this chapter is to: (1) explain the
concept of SEM modelling, its major objectives and advantages; (2) show
how useful structural models are in solving research problems within the
tourism discipline; (3) present the major steps involved in the formulation
and testing of a LISREL model through an application of LISREL
modelling to test an hypothesis about the relationship between the tourist
perceptions of a beach resort and their satisfaction with the resort; and
(4) draw attention to potential limitations associated with the LISREL
approach.
What is structural equation modelling?
Structural equation modelling is a multivariate technique that combines
(confirmatory) factor analysis modelling from psychometric theory and
structural equations modelling associated with econometrics. The term
‘structural’ assumes that the parameters reveal a causal relation.
However, the technique does not ‘discover’ causal relations. ‘At best, it
shows whether the causal assumptions embedded in a model match a
sample of data’ (Bollen, 1989, p. 4).
Objectives of structural equation modelling
The primary aim of SEM is to explain the pattern of a series of inter-
related dependence relationships simultaneously between a set of latent

Structural equation modelling for cross-cultural analysis
245
(unobserved) constructs, each measured by one or more manifest
(observed) variables.
The measured (observed) variables in SEM have a finite number of
values. Examples of measured variables are distance, cost, size, weight or
height. The measured (manifest) variables are gathered from respondents
through data collection methods, or collected as secondary data from a
published source. They are represented by the numeric responses to a
rating scale item on a questionnaire. Measured variables in SEM are
usually continuous.
On the other hand, latent (unobserved) variables are not directly
observed, have an infinite number of values, and are usually continuous.
Examples of latent constructs are attitudes, customer satisfaction, and
perception of value or quality. Latent variables are theoretical constructs
that can be determined to exist only as a combination of other measur-
able variables. As such they are similar to principal components and are
sometimes theoretically justified from a previous factor analysis.
In this primary form of analysis SEM is similar to combining multiple
regression and factor analysis. As such, the SEM expresses the linear
relationship between two separate sets of latent constructs (which may
have been derived by two separate factor analyses). When using SEM
these latent constructs are termed exogenous (independent) constructs
and endogenous (dependent) constructs. Figure 8.6 shows that endogen-
ous latent constructs such as repeat visitation and satisfaction depend on
independent exogenous latent constructs such as culture and perception.
The SEMs include one or more linear regression equations that
describe how the endogenous constructs depend upon the exogenous
constructs. Their coefficients are called path coefficients, or sometimes
regression weights.
However, there is an important difference between factor analysis
modelling and SEM modelling. In factor analysis the observed variables
can load on any and all factors (constructs). The number of factors is
constrained. When using SEM, confirmatory factor analysis is used and
the observed variables are loaded onto particular constructs. The load-
ings are free or fixed at particular values, and the independence or co-
variance of variables is specified.

Cross-Cultural Behaviour in Tourism
246
Although the primary purpose of SEM is the analysis of latent
constructs and in particular the analysis of links between latent constructs,
SEM is also capable of other forms of analysis. SEM can be used to esti-
mate variance and covariance, test hypotheses, conventional linear regres-
sion and factor analysis. In complex analysis frameworks SEM may be
preferable to conventional statistical methods, for example, where it is
required to test whether factor analysis on data from several populations
yields the same factor model simultaneously. Another example is where a
multiple regression is required to test for several dependent variables from
the same set of independent variables simultaneously, particularly if it is
possible for one dependent variable to simultaneously determine another.
The SEM is a powerful method for effectively dealing with multicollinear-
ity (when two or more variables are highly correlated), which is one of the
benefits of SEM over multiple regression and factor analysis.
All aspects of SEM modelling must be directed by theory, which is
critical for model development and modification. A clear misuse of SEM
can occur when data is simply fitted to a suitable SEM and theory is then
expanded from the analytic result.
There are three components in general structural equation models:
1) Path analysis; 2) the conceptual synthesis of latent variable and meas-
urement models; and 3) general estimation procedures (Bollen, 1989).
Application of structural equation modelling
SEM modelling has been widely used in a number of disciplines, includ-
ing psychology (Agho et al., 1992; Shen et al., 1995), sociology (Kenny,
1996), economics (Huang, 1991), criminology (Junger, 1992), cross-
national (Mullen, 1995; Singh, 1995), cross-cultural research (Riordan
and Vandenberg, 1994), healthcare (Babakus and Mangold, 1992;
Taylor, 1994a; Taylor and Cronin, 1994), gerontology (Russell, 1990),
human resources management (Medsker et al., 1994), environmental
studies (Nevitte and Kanji, 1995), family studies (Fu and Heaton,
1995), religious studies (Legge, 1995), migration studies (Sandu and
DeJong, 1995), marketing, and many others. In the marketing discipline,
LISREL has been used in a variety of applications, including consumer
behaviour (Oliver and Swan, 1989; Singh, 1990; Fornell, 1992; Heide and
Miner, 1992; Lichtenstein et al., 1993; McCarty and Shrum, 1993; Taylor

Structural equation modelling for cross-cultural analysis
247
and Baker, 1994; Spreng et al., 1996), organizational buying behaviour
(Michaels et al., 1987), channel management (Schul and Babakus, 1988),
product policy (DeBrentani and Droge, 1988), pricing strategy (Walters
and MacKenzie, 1988), advertising (MacKenzie and Lutz, 1989), sales-
force management (Dubinsky et al., 1986), retailing (Good et al., 1988),
international marketing (Han, 1988), services marketing (Arora and
Cavusgil, 1985; Crosby et al., 1990; Hui and Bateson, 1991; Francese,
1991; Cronin and Taylor, 1992; Brown et al., 1993; Price et al., 1995;
Taylor, 1994b), service quality in retail stores (Dabholkar et al., 1996),
and service satisfaction (Jayanti and Jackson, 1991). There are many
other examples.
Reasons for popularityThe reason why SEM modelling has been applied in so many disciplines
is its ability to solve research problems related to relationships between
latent constructs, which are measured by observed variables. For exam-
ple, such relationships can be found in educational research where the
determinants of educational achievements and failure are analysed, or
in consumer behavioural research where the reasons for purchasing
various products and services are analysed. Many important marketing,
psychological or cultural concepts are latent constructs, with unknown
reliability, measured by multiple observed variables. The lower the mea-
surement reliability the more difficult it is to observe relationships
between the latent constructs and other variables. By using SEMs one
can model important latent constructs while taking into account the
unreliability of the indicators. Also, many latent constructs such as
perceptions, evaluation, satisfaction, or behaviour measures have low
reliability. By using regression one may get coefficients with unexpected
signs: the predictors one would expect to be positively related to the
dependent variable end up with negative coefficients, or vice versa.
Regression analysis as opposed to SEM analysis does not eliminate
the difficulties caused by unreliable measures. The SEMs consider
unknown reliability of the measures and rank the measures in terms
of their importance (Bacon et al., 1998).
Application in tourism
SEM modelling has not been widely used in the tourism discipline, out-
side the US. However, the application of SEM in tourism is important as

Cross-Cultural Behaviour in Tourism
248
a tool for promoting better quality research. Tourism researchers are
often faced with a set of interrelated questions. What variables determine
tourist arrivals to a particular destination? How does demand as a latent
variable combine with supply variables to affect tourist arrivals? How do
demand and supply variables simultaneously affect tourist purchasing
decisions and holiday satisfaction? How does tourist holiday satisfaction
result in repeat visitation and loyalty to a destination? Many of the same
independent variables affect different dependent variables with different
effects. Other multivariate techniques do not address these questions
within a single comprehensive method.
In the tourism discipline structural modelling has recently been used
to assess traveller types (Nickerson and Ellis, 1991), hotel guest satisfac-
tion (Gundersen et al., 1996), service quality and satisfaction in the
hotel/motel industry (Getty and Thompson, 1994; Thomson and
Getty, 1994), tourists’ and retailers’ perceptions of service levels in a
tourism destination (Vogt and Fesenmaier, 1995), factors that influence
guest accommodation choice intentions (Richard and Sundaram, 1993),
relationship between travel motivation and information sources in the
senior travel market (Kim et al., 1996), antecedents of customer expec-
tations of restaurants (Clow et al., 1996), resident attitudes toward
tourism (Lindberg and Johnson, 1997), impact of tourism advertising
on tourist spending (Butterfield et al., 1998), response to wilderness
recreation fees (Williams et al., 1999), influence of tourists’ experiences
on holiday satisfaction and on the change of attitudes (Jacinto et al.,
1999), cultural differences between Asian tourists and Australian hosts
(Reisinger and Turner, 1998a,b; 1999a,b; 2002b), importance and expec-
tations of destination attributes (Turner and Reisinger, 1999), tourism
flows from the UK to seven major destinations (Turner et al., 1998),
shopping satisfaction (Reisinger and Turner, 2002c; Turner and
Reisinger, 2001), golf travellers’ satisfaction (Petrick and Backman,
2002), and many others.
Gundersen et al. (1996) identified important factors for hotel guest
satisfaction among business travellers. The analysis covered three depart-
ments of hotel operations (receptions, food and beverage, and house-
keeping) and two dimensions of satisfaction (tangible and intangible).
The structural model showed the relationships among the three depart-
ments and overall satisfaction with the hotel. The highest loadings were
noted on the service aspects of all departments. The major explanatory
variables for overall hotel guest satisfaction were tangible aspects of

Structural equation modelling for cross-cultural analysis
249
housekeeping and intangible aspects of reception service, suggesting that
by focusing on these factors, high levels of satisfaction among business
travellers can be achieved.
Getty and Thompson (1994) tested customers’ perceptions of the lodg-
ing sector performance on multiple dimensions and the perceived level of
overall quality possessed by the lodging property, satisfaction with the
lodging experience, and customers’ willingness to recommend the prop-
erty. The customers’ intentions to recommend the property were deter-
mined by their perceptions of the overall quality of the property, rather
than their satisfaction with the stay. The specific quality and satisfaction
dimensions, most responsible for willingness to recommend the property,
included: the general appearance of the property, perceived value asso-
ciated with the stay, willingness of employees to listen, and the degree to
which the property provided a safe environment. Thompson and Getty
(1994) suggested that customers’ intentions to provide positive word of
mouth are a function of their perceptions of the overall quality of the
lodging property, rather than their expressed level of satisfaction with stay.
Vogt and Fesenmaier (1995) used four service quality dimensions
(reliability, responsiveness, assurance, accessibility), measured by thirteen
items, to evaluate service experiences as perceived by tourists and retailers.
The results showed that tourists evaluated services differently to retailers.
Kim et al. (1996) tested a causal relationship between tourism motiva-
tion and information sources. They found that the more active travellers
in the senior market were more likely to consult information sources
before travel. Those who travelled to get rest and relaxation were less
likely to search for travel information. Those who travelled to visit
friends and families were not interested in searching for travel informa-
tion.
Lindberg and Johnson (1997) tested two models to assess how the
values people hold influence their attitudes toward tourism and what
types of outcomes most affect attitudes. The value-attitude model showed
that resident values regarding economic gains were better determinants of
attitudes than values regarding disruption within the community. The
expectancy-value model indicated that perceived economic and conges-
tion impacts had greater influence on attitudes than perceived crime and
aesthetic impacts.

Cross-Cultural Behaviour in Tourism
250
Reisinger and Turner (1998a) determined which cultural differences
between Asian tourists and Australian hosts are predictors of tourist
satisfaction. The results indicated that differences in cultural values and
rules of social behaviour between Asian tourists and Australian hosts
directly influence tourist satisfaction, and differences in perceptions of
service directly influence tourist social interaction. Perceptions of service
providers only indirectly determine satisfaction through the mediating
effect of interaction.
Turner and Reisinger (1999) determined the relationships between
destination attributes importance and Japanese tourist expectations of
those attributes on arrival, and confirmed that a study of satisfaction
of destination attributes should be based upon a comparison of expecta-
tions on arrival against satisfaction on departure.
Reisinger and Turner (2002c) tested the theory that shopping satisfac-
tion results from the importance of product attributes, which in turn,
depend on the types of products purchased. They showed that the prod-
ucts considered important by Japanese tourists visiting Hawaii determine
the importance of attributes, and the importance of attributes determine
tourist satisfaction.
Petrick and Backman (2002) found that golf travellers’ overall satis-
faction was determined by information satisfaction and attribute satisfac-
tion. Attributes related to the resort experience had more influence on
overall satisfaction than attributes related to information provided and
gold experiences.
Types of LISREL modelling
LISREL stands for LInear Structural RELationships and is a computer
program for covariance structure analysis. It was originally introduced
by Joreskog and Van Thillo in 1972.
The general LISREL model has many submodels as special cases. The
mathematical notations are presented on the following page, followed by
a presentation of the different submodels.

Structural equation modelling for cross-cultural analysis
251
Abbreviations:
x – measured independent variable
y – measured dependent variable
� = latent exogenous construct explained by x-variables
� = latent endogenous construct explained by y-variables
� – error for x-variable
" – error for y-variable
� – correlation between measured variables and all latent constructs
� – correlation between latent constructs � (exogenous) and � (endo-
genous)
� – correlation between exogenous latent constructs �
� – correlations between endogenous latent constructs �.
Submodel 1 is the LISREL model, which is designed to measure
observed variables. The model has only x, �, and �-error variables.
There are no y- and �-variables (see abbreviations). The data used mea-
sures only the correlation between the constructs (see Figure 8.1).
Submodel 2 is the LISREL model, which is designed to estimate rela-
tionships among directly measured independent variables and the depen-
dent variable(s). The model has no latent variables but there are two
kinds of directly measured variables: x, y, and �-error variables. There
are four types of LISREL Submodel 2: a single regression model, bivari-
ate model, recursive model, and non-recursive model. The examples of
these models are graphically presented in Figures 8.2–8.5.
Figure 8.1 Hypothetical model: submodel 1

Cross-Cultural Behaviour in Tourism
252
Figure 8.2 A single regression model
Figure 8.3 Bivariate model
Figure 8.4 Recursive model

Structural equation modelling for cross-cultural analysis
253
Full LISREL combines features of Submodel 1 and Submodel 2. It
involves x, y, �, �, and ", �, �-variables (see Figure 8.6).
Submodel 3 is the LISREL model with no x-variables.
Submodel 3A involves only y, �, �, and ", �-error variables.
Submodel 3B involves only y and �-variables with no �-variables.
The models 3A and 3B are not presented visually as they are parts of the
full LISREL model. Since the full LISREL model has a large number of
parameters, the advantage of using Submodel 3, rather than the full
LISREL is that it has fewer parameter matrices, although each one is
large, and it can handle models in which a � correlates with an ".
Figure 8.5 Non-recursive model
Figure 8.6 Full LISREL model

Cross-Cultural Behaviour in Tourism
The stages involved in structural equation modelling
There are eight stages involved in the process of structural equation
modelling and testing. These are presented in Figure 8.7.
Development of a theoretical model(model conceptualization)
Assessment of the adequacy and impact of the sample sizeselection of the method of model estimation
Stage 1
Construction of a path diagram(of relationships)
Stage 2
Conversion of path diagram into a set of structural andmeasurement equations (model specification)
Choosing the input matrix type
Correlations Covariances
Stage 3
Stage 4
Parameter estimation
Assessment of identification of the model(model identification)
Stage 5
Evaluation of the resultsfor goodness-of-fit (assessment of model)
Stage 6
Interpretation of the model
Modification of the model if theoretically justified(model modification)
Stage 7
Final model
Model cross-validationStage 8
Figure 8.7 Stages involved in the application of structural equation modelling

Structural equation modelling for cross-cultural analysis
255
Stage 1
The first part of stage 1 focuses on the development of a theoretical
model with the linkages (defined relationships) between latent constructs
and their measurable variables, reflecting proposed hypotheses. This part
represents the development of a structural model.
For example: the hypothesized model consists of two dimensions
(latent constructs): tourist perceptions of a beach resort and tourist satis-
faction with the resort. The perception of a beach resort is measured by
perceptions of: (1) a hotel, (2) service providers, (3) leisure activities, and
(4) accessibility to the resort. The satisfaction with the resort is measured
by satisfaction with (1) a tangible product, (2) an intangible product
(service), and (3) degree of relaxation. It is hypothesized that there is a
strong relationship (correlation) between the perception of a beach resort
and tourist satisfaction with the resort (Submodel 1) (see Figure 8.1). It
can also be hypothesized that tourist satisfaction is determined by tourist
perceptions of this resort (full LISREL) (see Figure 8.6).
The second part of stage 1 involves the operationalization of the latent
constructs via the measured variables and describing the way in which
they are represented by empirical indicators (manifest variables). This
part represents the development of a measurement model. The hypothet-
ical measurement model is represented simply by a two-construct model
(perception and satisfaction) as shown in Table 8.1.
The first part of stage 1 also provides information about the validities
and reliabilities of the variables. The analysis is predominantly confirm-
Table 8.1 Two-construct measurement model
Variables/indicators Indicators Loadings on constructs
Perception Satisfaction
Hotel (x1) L1
Service providers (x2) L2
Leisure activities (x3) L3
Accessibility (x4) L4
Tangible product (x5) L5
Intangible product (x6) L6
Relaxation (x7) L7

Cross-Cultural Behaviour in Tourism
256
atory because it determines the extent to which the proposed model is
consistent with the empirical data.
Critical pointsThe most critical point at this stage is to include all key predictive vari-
ables (multiple indicators of the latent variables) to avoid a specification
error. The justification for inclusion of the specific latent constructs and
their indicators in a model can be provided by factor analysis. However,
this inclusion together must be theoretically sound and be weighted
against the limitations of SEM and computer programs. A model should
contain at most twenty variables (five to six constructs each measured by
three to four indicators) (Bentler and Chou, 1987). The interpretation of
the results and their statistical significance becomes difficult as the num-
ber of concepts becomes large (exceeding twenty).
Stage 2
Stage 2 involves the construction of a path diagram. In order to under-
stand the geometric symbols represented in models and correctly draw a
path diagram, LISREL requires familiarity with the Greek letters describ-
ing LISREL matrices. The Greek letters were presented previously.
In a path diagram all relationships between constructs and their indica-
tors are graphically presentedwith arrows. They form a visual presentation
of the hypotheses and the measurement scheme. A curved line indicates a
correlation/covariance between constructs, e.g., between perceptions and
satisfaction (Submodel 1) (see Figure 8.1). A straight arrow indicates a
direct relationship from a construct to its indicators and direct effect rela-
tionship between constructs. The direct arrow from perceptions to satisfac-
tion changes the Submodel 1 into a full LISREL analysis (with y-variables)
by stating that perception determines satisfaction (see Figure 8.6).
All constructs fall into two categories: exogenous and endogenous.
Exogenous constructs are independent variables and are not determined
by any other variable in a model (there are no straight arrows pointing to
these constructs, e.g., perception in full LISREL). Endogenous constructs
are determined by other constructs and relationships contained in the
model (there are arrows pointing to these constructs, e.g., satisfaction
in full LISREL). They can also determine other endogenous constructs.

Structural equation modelling for cross-cultural analysis
257
In order to avoid specification error, attention has to be paid not to omit
any exogenous or endogenous constructs.
A path diagram should show all relationships. The number of paths
should be theoretically justified. All relationships are to be linear.
Stage 3
Stage 3 involves the formal mathematical specification of the model by
describing the nature and number of parameters to be estimated (which
variables measure which constructs), translating the path diagram into a
series of linear equations that link constructs, and translating the speci-
fied model into LISREL language in the form of matrices, indicating
hypothesized correlations among constructs or variables. The coefficient
matrices represent the paths in a model.
Because both constructs in the hypothetical path diagram are exogen-
ous (Submodel 1), the measurement model and associated correlation
matrices for exogenous constructs and indicators are needed. The appro-
priate LISREL notation is shown in Table 8.2.
At this stage a distinction must be made between fixed, constrained,
and free parameters. Fixed parameters specify values a priori and they
are not estimated as part of the model. An example of a fixed parameter
would be to assign l11=1.00 so that l21, l31, and l41 would be compared
Table 8.2 LISREL notation for the measurement model
Exogenous indicator Exogenous construct Error
x1 = �x11�1 + �1x2 = �x21�1 + �2x3 = �x31�1 + �3x4 = �x41�1 + �4x5 = �x52�2 + �5x6 = �x62�2 + �6x7 = �x72�2 + �7Correlation among exogenous constructs (�)
�1 �2�1 –
�2 �21 –
� – correlation between manifest variables and latent constructs �

Cross-Cultural Behaviour in Tourism
258
against correlations when all parameters are free. Restricted (con-
strained) parameters are unknown and are estimated by the model.
Example: when two independent variables (�1 and �2) have the same
impact on a dependent variable (�1) one can specify that �11=�12(�=correlation between latent constructs). In this case it is only neces-
sary to estimate one parameter to determine the value of the other para-
meter. Free parameters have unknown values, are not constrained to be
equal to any other parameter, and need to be estimated by the program.
The LISREL analysis run is based on control commands, which con-
sist of several lines. The LISREL control lines and the input are explained
in the LISREL SPSS manuals. Since there are five LISREL submodels
different input files need to be requested for each model. The control
commands for each submodel should be developed according to the
instructions given in the LISREL manual. Also, the correct specification
of each line depends on the research phenomena under study. Once the
LISREL program is run it reproduces all command files. The matrix and
the parameter specifications should be immediately inspected to make
sure that no errors have been made.
Stage 4
Stage 4 considers whether the variance/covariance or correlation matrix is
to be used as the input data, and this involves an assessment of the sample
size. The covariance matrix is used when the objective is to test a theory,
provide comparisons between different populations or samples, or to
explain the total variance of constructs needed to test the theory.
However, because the diagonal of the matrix is not one, interpretation
of the results is more difficult because the coefficients must be interpreted
in terms of the units of measure for the constructs. The correlation matrix
allows for direct comparisons of the coefficients within amodel. Therefore,
it is more widely used. The correlationmatrix is also used to understand the
patterns of relationships between the constructs. It is not used to explain
the total variance of a construct as needed in theory testing. Thus, inter-
pretation of the results and their generalizability to different situations
should be made with caution when the correlation matrix is used. The
correlation matrix for the hypothesized model is presented in Table 8.3.
The most widely used method for computing the correlations or
covariances between manifest variables is Pearson product-moment

Structural equation modelling for cross-cultural analysis
259
correlation and the correlation matrix is computed using Prelis (Joreskog
and Sorbom, 1988).
Sample sizeSample size plays an important role in estimating and interpreting SEM
results as well as estimating sampling errors. Although there is no correct
rule for estimating sample size for SEM, recommendations are for a size
ranging between 100 to 200 (Hair et al., 1995). A sample of 200 is called a
‘critical sample size’. The sample size should also be large enough when
compared with the number of estimated parameters (as a rule of thumb at
least five times the number of parameters), but with an absolute mini-
mum of fifty respondents. The sample size depends on methods of model
estimation, which are discussed later.
After the structural and measurement models are specified and the
input data type is selected, the computer program for model estimation
should be chosen. There are many various programs available on the
market. Although some offer different advantages, the LISREL comput-
ing program has been the most widely used program.
Stage 5
Stage 5 addresses the issue of model identification, that is, the extent to
which the information provided by the data is sufficient to enable para-
meter estimation. If a model is not identified, then it is not possible to
determine the model parameters. A necessary condition for the identifi-
Table 8.3 Correlation matrix for the hypothesized model
Variables Hotel
(x1)
Service
providers
(x2)
Leisure
activities
(x3)
Access
(x4)
Tangible
product
(x5)
Intangible
product
(x6)
Relaxation
(x7)
x1 Hotel 1.000
x2 Providers �0.349 1.000
x3 Leisure 0.562 0.786 1.000
x4 Access 0.612 0.677 0.432 1.000
x5 Tangible 0.899 0.231 0.521 0.421 1.000
x6 Intangible 0.123 0.899 0.789 0.513 0.222 1.000
x7 Relaxation 0.433 0.335 0.788 0.188 0.111 0.654 1.000

Cross-Cultural Behaviour in Tourism
260
cation is that the number of independent parameters is less than or equal
to the number of elements of the sample matrix of covariances among the
observed variables.
For example: if t parameters are to be estimated, the minimum con-
dition for identification is:
t � s
where s=1/2(p+q)(p+q+1)
p=number of y-variables
q=number of x-variables
& If t=s the set of parameters is just identified (there is only one and only
one estimate for each parameter).& If t<s, the model is overidentified (it is possible to obtain several
estimates of the same parameter).& If t>s, the model is unidentified (an infinite number of values of the
parameters could be obtained).
In a just-identified model, all the information available is used to estimate
parameters and there is no information left to test the model (df=0). In
an overidentified model there are positive degrees of freedom (equal to
s � t), thus, one set of estimates can be used to test the model. In the
unidentified model, one must either: (1) add more manifest variables; (2)
set certain parameters to zero; or (3) set parameters equal to each other
(Aaker and Bagozzi, 1979) to make all the parameters identified.
However, all three steps can be applied if they are justified by theory.
The condition t � s is necessary, but not sufficient, for the identifica-
tion of a LISREL model. In fact, there are no sufficient conditions for the
full structure model. The LISREL program provides warnings about
identification problems.
Identification problemsThe symptoms of potential identification problems are:
(a) very large standard errors for coefficients
(b) the inability of the program to invert the information matrix
(c) impossible estimates (e.g., negative and non-significant error var-
iances for any construct)
(d) high correlations (�0.80 or above) among observed variables.
These symptoms must be searched out and eliminated.

Structural equation modelling for cross-cultural analysis
261
Sources of identification problemsThere are several sources of identification problems:
1. A large number of coefficients relative to the number of correlations
or covariances, indicated by a small number of degrees of freedom –
similar to the problems of overfitting, that is, insufficient sample size
2. The use of reciprocal effects (two-way arrows between the con-
structs)
3. Failure to fix the scale of a construct, that is, incorrect assignment of
parameters as fixed or free
4. Skewness
5. Nonlinearity
6. Heteroscedasticity
7. Multicollinearity
8. Singularity
9. Autocorrelation.
It should be noted that heteroscedasticity, caused either by non-normality
of the variables or the lack of a direct relationship between variables, is
not fatal to an analysis. The linear relationship between variables is
captured by the analysis but there is even more predictability if the
heteroscedasticity is accounted for as well. If it is not, the analysis is
weakened, but not invalidated.
Multicollinearity and singularity are problems with a correlation
matrix that occur when variables are too highly correlated. For multi-
collinearity, the variables are very highly correlated (0.8 and above); and
for singularity, the variables are perfectly correlated and one of the vari-
ables is a combination of one or more of the other variables. When
variables are multicollinear or singular, they contain redundant informa-
tion and they are not all needed in the analysis.
Solutions to identification problemsThe potential solutions for identification problems are to:
1. Eliminate some of the estimated coefficients (deleting paths from the
path diagram)
2. Fix the measurement error variances of constructs if possible; if
negative change to 0.005
3. Fix any structural coefficients that were reliably known, that is, elim-
inate correlations over one because of multi-collinearity of variables

Cross-Cultural Behaviour in Tourism
262
4. Remove multicollinearity by using data reduction methods like
Principal Components Analysis
5. Eliminate troublesome variables, e.g., highly correlated variables,
redundant variables
6. Check univariate descriptive statistics for accuracy (e.g., out-of-
range values, plausible standard deviations, coefficients of variation)
7. Check for missing values
8. Identify non-normal variables, e.g., check for skewness and kurtosis
9. Check for outliers
10. Check for non-linearity and heteroscedasticity
11. Reformulate the theoretical model to provide more constructs rela-
tive to the number of relationships examined.
Estimation methodsThe LISREL program offers different kinds of parameter estimation
methods:
& Instrumental Variables (IV)& Two-stage Least Squares (TSLS)& Unweighted Least Squares (ULS)& Generalized Least Squares (GLS)& Maximum Likelihood (ML)& Generally Weighted Least Squares (WLS)& Diagonally Weighted Least Squares (DWLS).
The most widely used are the Two-stage Least Square (TSLS) and
Maximum Likelihood Estimation (MLE) methods. The TSLS method
computes the initial estimates, and the MLE method computes the final
solution. The TSLS method (as well as the IV method) of model estima-
tion is non-iterative and fast. The MLE method (as well as ULS, GLS,
WLS, and DWLS methods) is an iterative procedure and it successively
improves initial parameter estimates. The MLE method may be used to
estimate parameters under the assumption of multivariate normality and
is robust against departures from normality. When using the MLE
method the standard errors (SE) and Chi-square goodness-of-fit mea-
sures may be used if interpreted with caution. The MLE method is also
more precise in large samples. The minimum sample size to ensure appro-
priate use of MLE is 100. As the sample increases the sensitivity of the
method to detect differences among the data also increases. However, as
the sample exceeds 400–500 the method becomes ‘too sensitive’ and
almost any difference is detected, making all fit measures poor (Hair et

Structural equation modelling for cross-cultural analysis
263
al., 1995). The initial and final estimates computed by TSLS and MLE
methods for the hypothetical model are presented in Tables 8.4 and 8.5.
A comparison of the TSLS with those of the final ML estimates reveals
that they are very accurate. No difference is larger than 0.02.
Types of solutionThe LISREL program also offers three types of solution:
1. Non-standardized
2. Standardized
3. Completely standardized.
Table 8.5 LISREL estimates (Maximum Likelihood)
Variables Perception Satisfaction
Hotel 0.863 0.000
Service providers 0.849 0.000
Leisure activities 0.805 0.000
Accessibility 0.695 0.000
Tangible product 0.000 0.775
Intangible product (service) 0.000 0.929
Relaxation 0.000 0.931
Perception Satisfaction
Perception 1.000
Satisfaction 0.666 1.000
Table 8.4 Initial estimates (TSLS)
Variables Perception Satisfaction
Hotel 0.866 0.000
Service providers 0.847 0.000
Leisure activities 0.801 0.000
Accessibility 0.702 0.000
Tangible product 0.000 0.780
Intangible product (service) 0.000 0.923
Relaxation 0.000 0.930
Perception Satisfaction
Perception 1.000
Satisfaction 0.664 1.000

Cross-Cultural Behaviour in Tourism
264
Non-standardized solutionIn the non-standardized solution all latent and manifest variables are
non-standardized. The non-standardized parameter estimates show the
resulting change in a dependent variable from a unit change in an inde-
pendent variable, all other variables being held constant. Non-standard-
ized coefficients are computed with all variables in their original metric
form and describe the effect that variables have in an absolute sense.
Thus, they can be used to compare similar models in other populations.
However, they are tied to the measurement units of the variables they
represent. Any change in the measurement unit for an independent or
dependent variable changes the value and comparability of parameters
across populations (Bagozzi, 1977).
Standardized solutionIn the standardized solution only latent variables (constructs) are stand-
ardized and the manifest variables (x and y) are left in their original
metric.
Completely standardized solutionIn the completely standardized solution both the latent and the manifest
variables are standardized. The standardized parameters reflect the
resulting change in a dependent variable from a standard deviation
change in an independent variable. The standardized parameters are
appropriate to compare the relative contributions of a number of inde-
pendent variables on the same dependent variable and for the same
sample of observations. They are not appropriate to compare across
populations or samples (Bagozzi, 1980).
Stage 6
Stage 6 involves the assessment of the model fit using a variety of fit
measures for the measurement and structural model (and supporting/
rejecting the proposed hypotheses). However, before evaluating the
goodness-of-fit between the data and model several assumptions of
SEM must be met.
SEM assumptionsAssumptions of SEM are:
1. Independence of variables
2. Random sampling of respondents

Structural equation modelling for cross-cultural analysis
265
3. Linearity of all relationships between variables, latent and observed
4. Multivariate normality of distribution (important in the use of
LISREL)
5. No kurtosis and no skewness
6. Appropriate data measured on interval or ratio scale
7. Sample size 100–400
8. Exploratory purpose of the study.
The above assumptions can be tested through program PRELIS. The
Generalized Least Squares (GLS), which is an alternative estimation
method, can adjust for the violations of these assumptions. However,
as the models become large and complex, the use of this method becomes
more limited.
Additionally, if the use of SEM is associated with time-series data,
considerable care is required to test for autocorrelation and stationarity,
and where required the data transformed into a non-stationary series.
Offending estimatesOnce the assumptions are met, the results must first be examined for
offending estimates, which are coefficients that exceed acceptable limits.
The common examples are:
& negative error variances or nonsignificant error variances for any con-
struct& standardized coefficients exceeding or very close to 1.0& very large standard errors associated with any estimated coefficient.
These offending estimates must be resolved before evaluating the model
results. In the case of negative error variances (Heywood case) the offend-
ing error variances can be changed to a very small positive value (0.005).
If correlations in the standardized solution exceed 1.0, or two estimates
are highly correlated, one of the constructs should be removed. Tables 8.6
and 8.7 present the Heywood case.
Tables 8.6 and 8.7 show that a loading for tangible product is greater
than 1.0 (known as a Heywood case). A corresponding negative error
measurement value for the same variable is derived (�0.325). Such
estimates are inappropriate and must be corrected before the model
can be interpreted and the goodness-of-fit assessed. In this case, the
variable will be retained and the corresponding negative error variance
will be set to a small value of 0.005 to ensure that the loading will be

Cross-Cultural Behaviour in Tourism
266
less than 1.0. The model is then re-estimated. Since in examining the
new results, no offending estimates are found (a new loading on a
tangible product is 0.996 and error variance is 0.005), the model can
be assessed for its goodness-of-fit.
When assessing model fit, attention must be paid both to the measure-
ment and the structural models. Fornell (1987) suggested simultaneous
evaluation of both models. However, Anderson and Gerbing (1982)
reported that proper evaluation of the measurement model (latent vari-
ables) is a pre-requisite of the evaluation of the structural model (the
analysis of the relations among the latent variables). The LISREL
program runs the assessment of both models simultaneously.
Types of fit measurementThere are three types of fit measurement:
& absolute fit measures (assess the overall model fit, both structural and
measurement together, with no adjustment for overfitting).
Table 8.6 Initial results of the measurement model
Variables Perception Satisfaction
Hotel 0.644 0.000
Service providers 0.743 0.000
Leisure activities 0.564 0.000
Accessibility 0.432 0.000
Tangible product 0.000 1.234
Intangible product (service) 0.000 0.685
Relaxation 0.000 0.879
Table 8.7 Measurement error for indicators
Variables Hotel Service
providers
Leisure
activities
Accessi-
bility
Tangible
product
Intangible
product
Relaxation
Hotel 0.585
Service providers 0.000 0.572
Leisure activities 0.000 0.000 0.453
Accessibility 0.000 0.000 0.000 0.321
Tangible product 0.000 0.000 0.000 0.000 �0.325
Intangible product 0.000 0.000 0.000 0.000 0.000 0.422
Relaxation 0.000 0.000 0.000 0.000 0.000 0.000 0.000

Structural equation modelling for cross-cultural analysis
267
& incremental fit measures (compare the proposed model to a compar-
ison model).& parsimonious fit measures (adjust the measures of fit to compare mod-
els with different numbers of coefficients and determine the fit achieved
by each coefficient). In order to achieve a better understanding of the
acceptability of the proposed model multiple measures should be
applied.
Absolute fit measuresThe absolute fit measures provide information on the extent to which
the model as a whole provides an acceptable fit to the data. They are
evaluated by:
& Likelihood ratio of Chi-square to the degrees of freedom (the accep-
table range is between 0.05 and 0.10-0.20). A large value of Chi-square
indicates a poor fit of the model to the data; a small value of Chi-
square indicates a good fit. The degrees of freedom judge whether the
Chi-square is large or small. The number of degrees of freedom is
calculated as:
df ¼ 1=2½ðpþ qÞðpþ qþ 1Þ� � t
where p=the number of endogenous indicators
q=the number of exogenous indicators
p+q=number of manifest variables
t=the number of independent parameters to be estimated.
& Goodness-of-fit index (GFI), which is an indicator of the relative
amount of variances and covariances jointly accounted for by the
model, shows how closely the proposed model comes to a perfect
one (takes values between 0 and 1 and the closer to unity, the better
the model fit). A marginal acceptance level is 0.90.& Root mean square residuals (RMSR) reflect the average amount of
variances and covariances not accounted for by the model. The closer
to zero, the better the fit. A marginal acceptance level is 0.08. RMSR
must be interpreted in relation to the sizes of the observed variances
and covariances.& Root mean square error of approximation (RMSEA).& Noncentrality parameter (NCP).& Scaled noncentrality parameter (SNCP).& Expected cross-validation index (ECVI).

Cross-Cultural Behaviour in Tourism
268
The NCP, SNCP and ECVI are used in comparison among alternative
models.
Results in the hypothetical model:
Revised model
Chi-square 15.87
Degrees of freedom 10
Significance level 0.08
Goodness-of-fit index (GFI) 0.949
Adjusted Goodness-of-fit index (AGFI) 0.889
Root mean square residual (RMSR) 0.056
The Chi-square value (15.87 with 10 df) has a statistical significance
level of 0.08, above the minimum level of 0.05, but not above the more
conservative levels of 0.10 or 0.20. This statistic shows some support
for a notion that the differences between the predicted and actual
matrices are non-significant and it indicates an acceptable model fit.
The GFI of 0.949 is quite high, but not when adjusted for model
parsimony (different number of coefficients). The RMSF indicates
that the average residual correlation is 0.056, acceptable given strong
correlations in the original correlation matrix.
Problems with Chi-square statisticsSince these statistics provide overall measures of fit they do not express
the quality of the model. It has been argued that the Chi-square
measure-of-fit should not be regarded as the best indicator of the
model fit, particularly when there is data departure from normality.
Lack of normality can inflate the Chi-square statistics and create
upward bias for determining significance of the coefficients. Also, the
use of Chi-square is not valid in most applications (Joreskog and
Sorbom, 1989a). Although the Chi-square measure may be treated as
a test of the hypothesis, the statistical problem is not one of testing a
hypothesis (which a priori might be considered false), but one of fitting
the model to the data, and deciding whether the fit is adequate or not.
Joreskog and Sorbom (1989b) explain that in most empirical work,
models are only experimental and regarded as only an approximation
to reality, and for this reason the Chi-square should not be used. Other
reasons for not using a Chi-square as criteria for judging the adequacy
of the model include sample size and problems related to the power of

Structural equation modelling for cross-cultural analysis
269
the test. Large samples tend to increase the Chi-square due to specifica-
tion error in the model. Thus, Chi-square statistics should be inter-
preted with caution.
GFI, AGFI and RMSR measuresMeasures such as GFI, AGFI and RMSR also do not express perfectly
the quality of the models. According to Joreskog and Sorbom (1989b),
quality should be judged by other internal and external criteria such as
theoretical grounding. For instance, these measures can show poor fit
because of one relationship only being poorly determined. Thus a fit of
0.5–0.6 does not precisely state whether the model is or is not supported
by the data. In practice, it can suggest that some of the poorly described
relationship paths should be eliminated from the model to make it more
sound, and the model should be run again to see if an improved fit could
be obtained. These measures also do not indicate what is wrong with the
model (Joreskog and Sorbom, 1989b). As to the RMSR, they work best if
all observed variables are standardized.
The incremental fit measuresWhile all the absolute measures might fall within acceptable levels, the
incremental fit and parsimonious fit indices are needed to ensure accept-
ability of the model from other perspectives. The incremental fit meas-
ures assess the incremental fit of the model compared to a null model
(the most simple model that can be theoretically justified, e.g., a single
construct model related to all indicators with no measurement error).
These are:
1. Tucker-Lewis measure (TL);
2. Normed fit index (NFI).
These incremental fit measures should exceed the recommended level of
minimum 0.90 to support acceptance of the proposed model.
Results in the hypothetical model:
Null Model
Chi-square 210.876
Degrees of freedom 15
Significance level 0.000
Tucker Lewis (TL) 0.9414

Cross-Cultural Behaviour in Tourism
270
Both incremental fit measures exceed the recommended level of 0.90 and
support acceptance of the proposed model.
Parsimonious fit measuresParsimonious fit measures determine the model fit in comparison to
models of differing complexity. The fit is compared versus the number
of estimated coefficients (or degrees of freedom) needed to achieve the
level of fit (fit per coefficient). The two most appropriate parsimonious fit
measures are:
& Normed Chi-square (Chi-square/df) (the level recommended by
Carmines and McIver (1981) is between 1.0 and 3.0)& Adjusted for the degrees of freedom goodness-of-fit index (AGFI)
(takes values between 0 and 1; and the closer to unity, the better the
model fit). If there is a drop in AGFI as compared to GFI, the overall
fit of the model can be questioned.
Results in the hypothetical model show that the normed Chi-square (Chi-
square divided by degrees of freedom) is 1.587 (15.87/10). This falls
within the recommended levels of 1.0 to 3.0. The AGFI value of 0.889
is close to the recommended level of 0.90. These results show support for
model parsimony.
In summary, the various measures of overall model goodness-of-fit
gave support to the results of an acceptable representation of the
hypothesized constructs.
The other parsimonious fit measures are:
& Parsimony normed fit index (PNFI)& Parsimonious goodness-of-fit index (PGFI)& Comparative fit index (CFI)& Incremental fit index (IFI)& Relative fit index (RFI)& Critical N (CN).
Squared multiple correlation coefficientsThe fit of the measurement model is assessed by examining squared multi-
ple correlation coefficients (SMC) for the y- and x-variables, which indi-
cate how well the y- and x-variables measure the latent construct, the
largest amount of variance accounted for by the constructs, and the
extent to which the individual variables are free from measurement

Structural equation modelling for cross-cultural analysis
271
error. They also represent the reliabilities (convergent validities) of these
measures. These coefficients lie between 0 and 1 (the closer to 1, the better
the variable acts as an indicator of the latent construct).
Results in the hypothetical model:
Squared multiple correlations for x-variables
Hotel Providers Leisure Access Tangible Intangible Relaxation
0.745 0.720 0.648 0.483 0.600 0.863 0.867
The results show that all x-variables are good measurements of both
constructs.
The total coefficients of determination (TCD) (R2) for all y- and x-
variables provide measures of how well the y- and x-variables as a group
measure the latent constructs. The closer to 1, the better. Results in the
hypothetical model show that total coefficient of determination for x-
variables is 0.981. All x-variables as a group measure the latent constructs
very well.
The fit of the structural model is assessed by the squared multiple
correlations (SMC) for structural equations, which indicates the amount
of variance in each endogenous latent variable accounted for by the
independent variables in the relevant structural equation, and the total
coefficient of determination (TCD) (R2) for structural equations, which
shows the strength of the relationships for all structural relationships
together. Results in the hypothetical model show that the R2 for the
total structural equations is 0.788.
Multi-collinearityThe results of structural equation modelling can be affected by multi-
collinearity as in regression. If large values of correlation for the observed
variables appear the deletion of one variable, or reformulation of the
relationships should be considered. Although there is no limit on what
defines high correlation, values exceeding 0.90 and even 0.80 can indicate
problems, values below 0.8 can be compensated for by declaring covar-
iance paths between independent variables. That is, it is possible to model
multicollinearity within the SEM analysis.

Cross-Cultural Behaviour in Tourism
272
Each of the constructs can also be evaluated separately by examining:
& T-values& Correlations between the latent constructs& Standard errors (SE)& Fitted residuals (FR).
T-valuesThe examination of the t-values is associated with examining the indica-
tors’ loadings (t-values for the paths) for statistical significance. If the t-
values associated with each of the loadings for the path coefficients are
larger than 2, the parameters are significant and variables are significantly
related to their specified constructs, thus verifying the relationships
among indicators and constructs.
The examination of the t-values associated with each of the load-
ings in the hypothetical model indicates that for each variable they
exceed the critical values for the 0.05 significance level (critical value
¼ 1.96) and the 0.01 significance level as well (critical value ¼ 2.576).
Thus all variables are significantly related to their specified constructs,
verifying posited relationships among indicators and constructs (see
Table 8.8).
Table 8.8 Construct loadings (t-values in parentheses)
Variables Perception Satisfaction
Hotel 0.644 0.000
(6.543)
Service providers 0.788 0.000
(7.899)
Leisure activities 0.655 0.000
(8.999)
Accessibility 0.566 0.000
(6.888)
Tangible product 0.000 0.877
(12.435)
Intangible product (service) 0.000 0.899
(11.456)
Relaxation 0.000 0.901
(12.345)

Structural equation modelling for cross-cultural analysis
273
Correlation between the latent constructsThe examination of the correlation between the latent constructs is asso-
ciated with examining the � values and t-values.
Example: correlation among latent constructs (t-value in parentheses)
Perception Satisfaction
Perception 1.000
Satisfaction 0.899 1.000
(14.567)
The examination of the correlation between the latent constructs and the
t-value show that the correlation is very high and the t-value exceeds the
critical value of 1.96, indicating that the latent constructs are significantly
correlated with each other.
Standard errorsThe examination of standard errors is associated with assessing the
standard errors (SE) for each coefficient and construct. Standard errors
show how accurately the values of the parameters are estimated. The
smaller the standard errors, the better the estimation. However, what is
small or large depends on the units of measurement in latent constructs
and the magnitude of the parameter estimate itself. The standard errors
are correct under assumptions of multivariate normality. They should
be interpreted with caution if the condition of normality does not hold.
Therefore, t-values are better to be used as independent units of
measurement.
Fitted residualsThe model fit can also be examined by assessing the fitted residuals
(FR), which represent the differences between the observed and the
fitted correlations calculated from the model. They should be relatively
small to the size of the elements of the correlation matrices to indicate
that the fit of the models is acceptable. However, since the fitted resi-
duals depend on the metric of the observed variables (the unit of meas-
urement), they can vary from variable to variable, and are difficult to
use in the assessment of fit. The problem is avoided by evaluating the

Cross-Cultural Behaviour in Tourism
274
standardized residuals (SR) (fitted residuals divided by their standard
errors), which are independent of the metric of the observed variables
and can be interpreted as standard normal deviations. An SR that
exceeds the value of 2.58 in absolute terms indicates substantial speci-
fication and prediction error for a pair of indicators.
Q-plotThe best picture of fit is obtained by looking at the Q-plot, which plots
the standardized residuals (horizontal axis) against the quartiles of the
normal distribution (vertical axis). The best possible fit is obtained when
all residuals lie in a straight vertical line; the worst is when the residuals
lie in a horizontal straight line. An acceptable fit is indicated when the
residuals lie approximately along the diagonal, with steeper plots (greater
than 458) representing better fits (see Figure 8.8). If the pattern of
residuals is non-linear this indicates departure from normality, linearity
and/or specification errors in the model.
Stage 7
Stage 7 considers whether modifications to the model have to be made in
the light of the results obtained at the previous stage. At this stage the
analysis becomes exploratory in nature and results from previous analysis
are used to develop a better fitting model. The aim is to identify specifica-
tion errors and produce a new model that fits the data better. This new
model has to be verified on a second independent sample.
Figure 8.8 The Q-plot for the hypothetical model. A model fit is acceptable as the residuals liealong the diagonal

Structural equation modelling for cross-cultural analysis
275
Examination of the standardized residualsThe first modification to the model may be done through examination of
the standardized residuals and the modification indices. The standardized
residuals (normalized) are provided by the program and represent the
differences between the observed correlation/covariance and the estim-
ated correlation/covariance matrix. Residuals values greater than �2.58
are considered statistically significant at 0.05 level. Significant residuals
indicate substantial error for a pair of indicators. The acceptable range is
one in twenty residuals exceeding 2.58 by chance. In the hypothetical
model only one value exceeded 2.58. Thus, only one correlation from
the original input matrix has a statistically significant residual. This
falls within the acceptable range.
Deleting or adding parametersThe other two ways in which modification to a model can be made is by
deleting or adding parameters. In both cases, deleting or adding para-
meters should be guided by theory. Non-significant t-values can give
insight as to which parameters should be eliminated. However, if a theory
suggests that particular parameters should be included in the model, even
non-significant parameters should be retained because the sample size
may be too small to detect their real significance (Joreskog and
Sorbom, 1989b).
The effect of the deletion on the model fit can be assessed by compar-
ing the Chi-square values of the two models, particularly the differences
in Chi-squares.
When to use modification indicesThe modification indices (MI) can be used to decide which parameters
should be added to the model. The MI are measures of the predicted
decrease in the Chi-square that results if a single parameter (fixed or
constrained) is freed (relaxed) and the model reestimated, with all other
parameters maintaining their present values. The improvement in fit from
relaxing the parameters is acceptable under the condition that only one
parameter is relaxed at a time. The model modification should never be
based solely on the MI. Modification of the models must be theoretically
justified. Consideration should be given to whether some of the para-
meters are not necessary to measure the latent constructs. According to
Darden (1983), achieving a good fit at all costs is not always recom-

Cross-Cultural Behaviour in Tourism
276
mended because a good fit for a model may theoretically be inappropri-
ate. There are many models that could fit the data better. In fact, a poor
fit tells more, that is, the degree to which the model is not supported by
the data.
Comparison of nested modelsIf the best fitting model cannot be found using the confirmatory strategy
(where the researcher specifies a single model and SEM to assess its
significance), then the best fitting model can also be determined by com-
parison of competing or nested models. Firstly, a number of alternative
models are compared to find a model which comes closest to a theory.
Differences between models are indicated by the differences in the Chi-
square values for the different models. These differences can be tested for
statistical significance with the appropriate degrees of freedom. The
objective is to find the best fit from among the set of models. Secondly,
an initial model goes through a series of model respecifications in order to
improve the model fit.
Stage 8
Stage 8 involves the cross-validation of the model with a new data set.
This is done by dividing the sample into two parts to conduct a validation
test. The LISREL multisample analysis can be used for this purpose. The
cross-validation test is performed when modification indices are used and
the model did not provide an acceptable fit. This test should also be
performed when the model shows an acceptable fit in the first analysis.
In addition, cross-validation can be used to compare competing models
in terms of predictive validity and facilitate the selection of a model;
to compare the difference between samples belonging to different
populations and assess the impact of moderating variables (Sharma et
al., 1981).
However, cross-validation has its limitations: (1) it requires access to
the raw data and a new data set; (2) the sample must be large enough to
divide it into sub-samples and generate reliable estimates (minimum
sample size should be between 300–500 observations); and (3) bias may
occur if sample splitting is done randomly.

Structural equation modelling for cross-cultural analysis
277
Discussion points and questions
1. What are the objectives of structural equation modelling?
2. How can structural equation models be used to solve problems
within the tourism discipline? Give examples.
3. What steps are involved in formulation and testing of models?
4. What is the difference between a structural and measurement
model?
5. What does the model identification mean?
6. What are the sources of identification problems and how can they be
avoided?
7. Explain the differences between various kinds of parameter estima-
tion.
8. What is the difference between a standardized and non-standardized
solution?
Further reading
Bagozzi, R. (1980) Causal Models in Marketing. New York: Wiley.
Bollen, K. A. (1989) Structural Equations with Latent Variables. New
York: Wiley.
Summary
SEM modelling is a powerful tool enabling researchers to go beyond
factor analysis into the arena of determining whether one set of unob-
served constructs (dimensions) can determine (be seen to be likely to
determine) another set of dimensions. In tourism studies, it is often the
case that the variables under study cannot be directly observed or mea-
sured (for example, motivation, satisfaction, importance, perception)
yet these unobserved variables might be hypothesized to determine one
another. SEM analysis is a methodology capable of handling this type
of analysis, along with more conventional regression models, and simul-
taneous regression models, while accounting for multicollinearity and,
with appropriate care, other assumptions of regression modelling.

Cross-Cultural Behaviour in Tourism
278
Carmines, E. G. and McIver, J. P. (1981) Analyzing models with un-
observed variables: Analysis of covariance structures. In Bohrnstedt
G. W. and Borgatta, E. F., (eds). Social Measurement: Current Issues,
Beverly Hills, CA: Sage Publications, pp. 65–115.
Hox, J. (1995) AMOS, EQS, and LISREL for Windows: a comparative
review. Structural Equation Modeling 2(1): 79–91.
Joreskog, K. and Sorbom (1989a) LISREL 7: User’s Reference Guide.
Mooresville. Scientific Software Inc.
Joreskog, K. and Sorbom (1989b) LISREL 7: A Guide to the Program
and Applications. Chicago, IL: SPSS Inc.
For more detailed information readers should refer to specialized litera-
ture such as the journal Structural Equation Modeling.

Part 3
Applications of CulturalAnalysis in Tourism
Part 3 provides an example of the application of quantitative methodology
to cross-cultural analysis utilizing factor analysis and structural equation
modelling to identify the differences between the Asian and Australian
cultures. Five Asian cultural groups (Indonesia, Japan, Korea, Mandarin
speaking and Thai) of tourists are analysed and the implications for market-
ing and management of their cultural differences are outlined.
The focus of the analysis is to determine the main relationships between
cultural differences and Asian tourist satisfaction. From these relationships
the analysis develops cultural models providing insight into the factors
influencing Asian tourist and western host interaction.
A major finding from the analysis is that marketers cannot rely just on
perceptions of service to generate satisfaction by visiting Asian tourists.
Satisfaction can also be influenced by cultural values, rules of social beha-
viour and social interaction.


9Cultural analysis:
marketing and
management implications
Objectives
After completing this chapter the reader should
be able to
& learn about the application of Principal
Components Analysis to the cultural analysis
of tourism
& learn about the application of structural
equation modelling to the cultural analysis of
tourism
& identify cultural differences between Asian
and western populations
& identify cultural differences between Asian
tourist markets
& understand the relationships between cultural
factors and their impact on tourist holiday
satisfaction
& identify the key cultural differences that
influence Asian tourist satisfaction with
international hosts.

Cross-Cultural Behaviour in Tourism
282
Introduction
This chapter begins with a very brief summary of the literature review
presented in previous chapters, followed by the presentation of a tourist
satisfaction model and its variables. This model is used in the subsequent
example of cross-cultural analysis applied to tourism. The factor analysis
and structural equation modelling are used for the purpose of this analysis
to identify cultural differences betweenAsian tourists andAustralian hosts.
Five Asian cultural groups of tourists are analysed, and the implications
for marketing and management of their cultural differences are outlined.
Brief conceptual summary
The previous chapters reviewed existing literature on the cultural differ-
ences that influence the social interaction between international tourists
and their hosts. It was suggested that in the cross-cultural context the
cultural background of tourists and hosts, specifically the cultural simi-
larities and differences in their background, mostly determine this inter-
action. The cultural values, the most important variables in differing
cultures, determine the similarities and differences in cultural back-
grounds (Hall, 1976, 1977; Hofstede, 1980; Kluckhohn and Strodtbeck,
1961; Rokeach, 1973). Cultural values determine rules of social beha-
viour, which vary across cultures and generate interaction difficulties.
Rules of social interaction influence the development of social percep-
tions, which also differ across cultures. The cultural similarities in percep-
tions develop positive perceptions and encourage social interaction.
Cultural dissimilarities create misperceptions and discourage interaction.
Further, tourist and host social interaction can be explained within the
context of the service encounter (Riley, 1995). The cultural differences
between tourists and service providers may affect their social experiences.
The quality of services offered to tourists by service providers decide
about tourist satisfaction with hosts. The positive perceptions of service
providers create positive perceptions of service quality and result in satis-
faction with service, and vice versa.
Cultural model of conceptual relationships
The findings of the literature review show that it is possible to draw a
diagram that represents and clarifies the relationships among the theoret-

Cultural analysis: marketing and management implications
283
ical concepts that have been described in the previous chapters. Figure
9.1 shows the relationships among these concepts.
The major dependent variables (criteria) in the model are tourist-host
social interaction (SI) and satisfaction with tourist-host interaction
(SAT). The independent variables are cultural values (CV), rules of
social interaction (RSI), and perceptions (PER). The rules of social
interaction and perceptions may also be treated as dependent variables
since they depend on cultural values. Also, perceptions may depend on
rules of interaction. Figure 9.1 shows that cultural values determine
rules of social behaviour and influence people’s perceptions of each
other, which, in turn, determine their social interaction and satisfaction
or dissatisfaction with this interaction. The control variables such as
demographic and socio-economic characteristics of the subjects, or
length of stay, type of travel arrangements, and others are held constant
in order to neutralize their effect.
It is hypothesized that the cultural differences in values, rules of social
behaviour, and perceptions between international tourists and local hosts
determine tourist-host interaction and satisfaction with this interaction.
The attributes of the model
The model shows that social interaction and satisfaction with this inter-
action is a cultural phenomenon, because it is influenced by cultural
factors such as cultural values, rules of social relations, and perceptions.
The variables of the model represent multidimensional and multifaceted
Cultural values (CV)Rules of social
interaction (RSI)Perceptions (PER)
Social interaction (SI) Satisfaction (SAT)
Figure 9.1 Cultural model of conceptual relationships

Cross-Cultural Behaviour in Tourism
284
concepts and should be analysed as part of a system rather than separ-
ately because of their mutual influence on each other and the nature of
the specific relationships between them.
The study not only found significant differences in all measurement
groups but also supported the existence of the relationships between cul-
tural values, rules of social interaction, perceptions, social interaction, and
satisfaction. The results of the study have been published in two consecu-
tive articles titled ‘Cultural Differences between Asian tourist markets and
Australian hosts: Part 1 and Part 2’ by Y. Reisinger and L. Turner and
reprinted from the Journal of Travel Research, Vol. 40, No. 3, 2002, pp.
295–315, and Vol. 40, No. 4, 2002, pp. 374–384 with permission from Sage
Publications. The study and its results are briefly presented below.
Importance of the Asian tourist market
Currently, the international tourism industry is faced with an increasing
number of inbound travellers from Asia. The Asian tourist market stands
to become the largest source of international tourists. The Japanese mar-
ket is the largest single source but this will be challenged by China in the
future. The Asian market has also shown the strongest annual growth in
tourist arrivals to Australia. According to predictions, the Asian market
will be the largest source of international tourists to Australia beyond the
year 2000. Australia is the second most popular non-Asian destination
after the United States of America for the Korean market (Prideaux,
1998). It is predicted that during the next five years China may become
one of the prime sources of Asian outbound tourism due to its booming
economy, emergence of an upper middle-upper class, and liberalization
of border controls and currency regulations. The Singapore market will
also grow and will provide a high number of repeat visitors. Australia’s
other Southeast Asian markets of Indonesia, Thailand and Malaysia will
also continue to provide a steady source of tourists beyond the year 2000.
Consequently, tourist destinations will face the challenge of learning
about the Asian tourist market and developing responsive and culture
oriented marketing programs. Success in retaining and even increasing
Asian market share in Australia will depend upon responding quickly to
the needs of the distinct Asian markets. The Asian market niche with the
greatest potential is the middle class from China, Malaysia, South Korea
and Thailand (Crotts and Ryan, 1997), not the wealthy elite from Japan,

Cultural analysis: marketing and management implications
285
Hong Kong, Singapore, and Taiwan on which the tourism industry has
traditionally concentrated. Thus, it will be important to understand the
cultural orientation of these newly emerging markets for the purpose of
marketing and the design of advertising campaigns (Mok and
Armstrong, 1995). The ability to respond to each market’s peculiarities
and to adopt not just global marketing programs but regional programs
will provide a challenge (McAllan, 1997).
In the research study, culture refers to a stable and dominant cultural
character of a society shared by most of its individuals. Culture does not
refer to the subcultures of many ethnic groups living in a society. The
authors understand that individual Asian markets are heterogeneous
with respect to socio-cultural characteristics. The authors also believe
that any cultural grouping is heterogeneous at a particular scale, and
that there are regional as well as individual differences in any culture,
including Japan (Iverson, 1997). In this study all Asian samples except
the Japanese one (100 per cent of Japanese tourists are from Japan) are
represented by more than a single country. For instance, the Mandarin-
speaking market is represented by tourists from Mainland China,
Singapore, Taiwan, Hong Kong, and a very small percentage of tourists
from Malaysia and Vietnam. The South Korean market is represented by
99.4 per cent of tourists from South Korea and 0.6 per cent from Japan.
Similarly, the Thai market is represented by 98 per cent of tourists from
Research objectives
The main research objectives of the study were:
1. To identify the key cultural differences between the Asian tourist
markets and the Australian host population, as a representative of
western culture
2. To determine the key dimensions of these differences, and their
indicators
3. To find the main relationships between cultural differences and
Asian tourist satisfaction
4. To develop cultural models that can provide insight into the fac-
tors influencing Asian tourist-Australian host interaction, and
satisfaction with this interaction and
5. To identify major cultural themes that should be included in every
promotional strategy aiming at the Asian tourist market.

Cross-Cultural Behaviour in Tourism
286
Thailand and 2 per cent from Japan and China. The Indonesian market is
represented by 93.4 per cent of tourists from Indonesia and 6.6 per cent
from Hong Kong and India. However, the issue of the regional differ-
ences is not analysed here. The aim of the study is to analyse various
Asian cultures from a broad national perspective, as opposed to a region-
al or individual perspective, and to recognize a national dominant cul-
tural character of the major Asian markets that distinguishes them from
the Australian population. Similarly, the Australian sample is composed
of hosts of different origins such as Britain and New Zealand, with 96 per
cent of the Australian sample born in Australia, and 4 per cent born in
the United Kingdom and New Zealand.
The two distinct groups, tourists and hosts, are chosen for the study
because these groups are the major tourism players. Hosts in this study
are nationals of the visited country who provide services to tourists (e.g.,
front office employees, bus drivers, shop assistants, waitresses, custom
officials). They are employed in places most frequented by tourists, such
as accommodation, restaurants, tourist attractions, etc. These places offer
maximum opportunities for direct tourist-host contact. As a result, hosts
represent the first contact points with tourists. Consequently, cross-cul-
tural differences in the interpersonal interaction in the tourism context
are most likely to be apparent in these two groups: tourists and hosts.
One may, of course, argue that the interaction between local providers
and international tourists is itself impacted upon by business practices and
tourism transactions that shape the nature of the tourist-host contact, thus
the variations in this contactmay not be necessarily attributed to the nature
of cultural differences.However, the provider’s business practices as well as
the tourist’s perceptions of these practices are by themselves culturally
determined. Thus, the variations in their interpersonal interaction are at-
tributed to the cultural differences in their perceptions of what constitutes
socially and culturally appropriate service behaviour. This is supported by
the literature review findings, which show that the cultural differences in
interaction patterns between guests and service providers lead to different
perceptions of the guests’ treatment (Sheldon and Fox, 1988).
The research study hypothesizes that there are significant differences in
Asian and Australian populations in the tourism context and that these
differences can be grouped into dimensions of cultural differences
between Asian tourists and Australian hosts.

Cultural analysis: marketing and management implications
287
Study methodology
The detailed study methodology used in the study is presented in the
publisher’s website at www.bh.com/companions/0750656689. A brief
summary is presented below.
SampleA sample of 618 Asian tourists (Indonesian, Japanese, South Korean,
Mandarin and Thai) visiting the Gold Coast region, Australia’s major
tourist destination, were personally interviewed in their own language,
alongside 250 Australian service providers who were randomly selected
from a variety of sectors of the tourism and hospitality industry.
InstrumentFive measurement groups of cultural values, rules of social behaviour,
perceptions of service, forms of interaction, and satisfaction with inter-
action were measured by a structured questionnaire. The responses were
measured on a 6-point scale from least important (least satisfied) to most
important (most satisfied). A section on personal characteristics included
information on the sociodemographic profiles of respondents.
ProcedureThe instrument originally translated into Asian languages and back
translated to the English language, was pre-tested twice in two pilot
studies. Professional native Asian-language-speaking interviewers col-
lected data from 870 respondents: 250 Australian hosts and 618 Asian
tourists from five language groups (106 Indonesian, 108 Japanese, 172
South Korean, 130 Mandarin-speaking, and 102 Thai).
Data analysisBecause of the smaller individual sample sizes there was a need to reduce
the number of variables originally analysed. Thus, the analysis focused
only on the variables that statistically differed between the Asian and
Australian populations. The Mann-Whitney U-Test identified these dif-
ferences. The basic dimensions of the cultural differences (the gap scores)
were determined by Principal Components Analysis. Only the raw scores
for those variables that differed were factor analysed, as from a market-
ing perspective the interest lay in what cultural aspects were different
rather than similar. Although an analysis of the entire set of variables
would be interesting, the required number of variables to case size would
have been too large. R-type factor analysis was used (instead of Q-type)

Cross-Cultural Behaviour in Tourism
288
to analyse relationships among the variables (instead of cases) and to
identify groups of variables forming latent dimensions (factors).
Principal Components Analysis was chosen (instead of Common
Factor Analysis) in order to minimize the number of factors needed to
account for the maximum portion of the variance represented in the
original set of variables, and to reduce the specific and error variance
as a proportion of the total variance. Oblique rotation was chosen to
obtain several theoretically meaningful interrelated factors, as opposed to
orthogonal rotation, which reduces the number of variables to a smaller
set of independent factors regardless of how meaningful the resulting
factors are. Only the factors having latent roots (eigenvalues) greater
than 1 and factor loadings greater than 0.6 were considered significant.
Comrey in Hair et al. (1995) suggests that loadings in excess of 0.63 (40
per cent of overlapping variance) are very good and above 0.7 (50 per
cent of overlapping variance) are excellent.1
Results of the Mann-Whitney U-test
The results of theMann-WhitneyU-test identified seventy-three out of 117
(62.4 per cent) significant differences betweenAsian tourists andAustralian
providers in all five measurement groups: cultural values, rules of beha-
viour, perceptions of service, forms of interaction, and satisfaction with
interaction that may be obtained from the publisher’s website.2
The Mann-Whitney U-test also identified significant differences in all
measurement groups between the individual Asian language groups and
the Australian sample. In terms of the individual language groups, the
Japanese were the most distinct from the Australian hosts, followed by
the South Korean, Indonesian, Thai, and Mandarin-speaking tourists.
Out of 117 areas of measurement, eighty-three significant differences were
found between Australian hosts and Japanese tourists, seventy-four
between the South Korean sample, sixty-four between the Indonesian
and Thai samples and fifty-three between the Mandarin sample (refer
to the publisher’s website).3
Results of the Principal Components Analysis
The identified differences were grouped in several cultural dimensions
determined by Principal Components Analysis, separately in the total
Asian sample and each Asian language group.

Cultural analysis: marketing and management implications
289
Total AsiaIn the total Asian sample, five dimensions were identified: perceptions of
communication, values of family/competence, interaction, rules of feeling
display, and satisfaction. The dimension of communication reflects the
tourists’ need for adequate communication with hosts, the hosts’ ability
to be informative, give adequate explanations, listen to tourists, and
anticipate and understand tourists’ needs. The dimension of family/com-
petence reflects the importance of family and cues that describe the per-
son’s capabilities to succeed such as being intellectual, independent, self-
controlled, and polite. The dimension of interaction describes the prefer-
ences for forms of social interaction such as being invited home, or playing
sport together. The dimension of feeling display indicates disclosing per-
sonal feelings in public such as criticizing in public, or showing respect.
The dimension of satisfaction shows the components of satisfaction with
social interaction between tourists and hosts (see Table 9.1).
IndonesiaIn the Indonesian sample, four dimensions were identified: perceptions of
responsiveness, perceptions of attention, interaction, and satisfaction.
The dimension of responsiveness consists of variables that describe the
hosts’ capacity to respond to tourists’ needs and provide required service,
the cues associated with timing of service provision, physical appearance
of service providers, and the hosts’ ability to solve problems. The dimen-
sion of attention consists of variables that describe the hosts’ ability to
pay attention to tourists, anticipate and understand their needs, be con-
cerned about tourists, and listen to them. The dimension of interaction
describes the preferences for forms of social interaction. The dimension
of satisfaction relates to satisfaction with the hosts’ knowledge of
Indonesian culture and language.
JapanIn the Japanese sample, five dimensions were identified: perceptions of
helpfulness, values of competence, interaction, rules of greetings and
satisfaction. The dimension of helpfulness consists of variables that
describe the providers’ ability to help tourists and respond to their
needs including being punctual, accurate, able to solve problems, trust-
worthy, respectful, hospitable, polite, confident, communicative, infor-
mative, and professional. The dimension of competence consists of
variables that describe the cues associated with accomplishment such as
being intellectual, logical, obedient, self-respectful, wise, and indepen-
dent. The dimension of interaction describes the preferences for social

Cross-Cultural Behaviour in Tourism
290
interaction. The dimension of greetings is related to the way in which
people greet each other such as addressing by first name, or shaking
hands. The dimension of satisfaction relates to the satisfaction with
friendship and time spent together.
South KoreaIn the Korean sample, five dimensions were identified: perceptions of
communication, rules of feeling display, perceptions of performance,
interaction, and satisfaction. The dimension of communication reflects
the tourists’ needs for adequate information and explanations, to listen
to them, hosts’ ability to speak the Korean language, and have some
Table 9.1 Results of the Principal Components Analysis in the total
Asian sample for the variables that differed between Australian hosts and
all Asian tourists (significant factor loadings only)
Factor Loading Variables included in the factor
Communication 0.75601 Give adequate explanations
0.75519 Anticipate tourists’ needs
0.74292 Understand tourists’ needs
0.73079 Listen to tourists
0.72124 Offer individualized attention
0.67482 Keep tourists informed
Family/Competence 0.76365 Family security
0.74741 Being intellectual
0.70615 Being independent
0.65336 Being self-controlled
0.61418 Being polite
Interaction 0.85795 Have close relationship
0.82800 Invite home
0.82584 Take part in parties
0.82131 Play sport together
0.81233 Share a meal
0.77885 Exchange gifts
Feeling display 0.76020 Criticize in public
0.74455 Show respect
0.72936 Ask personal questions
0.72554 Conform to social status
0.71870 Respect others’ privacy
0.71268 Address by first name
0.66947 Show emotions
Satisfaction 0.75012 With time spent together
0.65842 With each other
0.63060 With knowledge of Asian language

Cultural analysis: marketing and management implications
291
knowledge of the Korean culture. The dimension of feeling display is
related to rules of social behaviour and concerns disclosing personal
feelings in public. The dimension of performance consists of variables
that describe the cues associated with providing high quality service as
perceived by the Korean tourists, that is, being responsive, respectful,
punctual, and neatly dressed. The dimension of interaction describes
the preferences for social interaction. The dimension of satisfaction
relates to satisfaction with providers and friendship.
Mandarin-speakingIn the Mandarin sample, five dimensions were identified: perceptions of
punctuality, interaction, perceptions of understanding, rules of feeling
display, and satisfaction. The dimension of punctuality focuses on the
timing and responsiveness of service. The dimension of interaction
describes the preference for forms of social interaction. The dimension
of understanding is related to the hosts’ ability to anticipate and under-
stand individual tourists’ needs, pay attention to tourists, and ability to
speak the Asian language. The dimension of feeling display concerns
disclosing personal feelings in public. The dimension of satisfaction
relates to satisfaction with providers and time spent together.
ThailandIn the Thai sample, five dimensions were identified: perceptions of com-
munication courtesy, perceptions of understanding, rules of feeling dis-
play, satisfaction and interaction. The dimension of communication
courtesy consists of variables that describe the hosts’ ability to treat
tourists as guests and behave towards tourists in a respectful and polite
manner. It entails the need to be trustworthy, considerate, and friendly.
The dimension of understanding consists of variables that describe the
hosts’ ability to understand and anticipate tourists’ needs, pay attention
to tourists, listen to them, and keep them informed. The dimension of
feeling display reflects cues associated with disclosure of personal feelings
in public. The dimension of satisfaction relates to satisfaction with con-
versation, providers, and friendship. The dimension of interaction
describes the preferred forms of social interaction.4
Interpretation of the cultural dimensions
The interpretation of the identified dimensions in the total Asian sample
is presented below.

Cross-Cultural Behaviour in Tourism
292
Total AsiaCommunication. As high uncertainty avoidance cultures, no Asian mar-
kets tolerate ambiguity and taking risk. They are concerned about com-
munication difficulties in Australia. Asian languages such as Japanese,
Korean, or Mandarin have several different levels used by various social
classes and genders. For example, DeMente (1991b) reported that there
are different levels of the Korean language used by various social classes
in a Korean hierarchical society: (1) extremely polite form used when ad-
dressing superiors, (2) an intimate form for addressing close friends or
equals, and (3) a rough form used when speaking to people on a lower
social level. Also, all Asian markets use indirect smoothing strategies to
manage conflicts (Kim and Gudykunst, 1988). This is in contrast to
Australians, who tolerate ambiguity and risk and do not avoid conflicts.
As members of high context cultures, Asian people communicate in an
indirect, implicit way by using numerous non-verbal cues such as body
language, facial expressions or eye gaze. Australians, who belong to a low
uncertainty and low context culture, have only one language used by all
social classes and genders. They communicate in a more direct, explicit
way by emphasizing words and verbal expressions.
Family/competence. Asians are very much family oriented. Family
needs and security are the concern of all its members. The relationships
between the family members are of a dependence nature. Each member
of the family depends on the other for security and protection. In Aus-
tralia, this type of dependency does not occur. Family ties are looser;
people are taught to be self-reliant and independent. Also, in Asian
high power distance cultures, societies have well-developed social hier-
archy. Proper education and intellectual achievements are important in
order to get a good job and belong to the ‘right social class’. For ex-
ample, in the masculine Japanese culture emphasis is placed on profes-
sional competence, intellectual achievements, and wisdom (Zimmerman,
1985). In Australian low power distance culture, education and intellec-
tual achievements are not of such importance. Australian society re-
gards education as a right instead of privilege, and often disregards
social position. Society places more value on sport heroes and finan-
cially wealthy people than intellectualists. On the other hand, Thai
people do not commit themselves seriously to hard work or education,
which are essential for success (Komin, 1990). Australians have more
sense of achievement and internal motivation to work hard, self-
actualization and self-reliance.

Cultural analysis: marketing and management implications
293
Interaction. As members of collectivistic cultures, Asian people are or-
iented towards group interests and needs (Hsu, 1953). Social relations
are perceived in terms of social usefulness (Hsu, 1971a) and are charac-
terized by group activities, keeping up with ‘in groups’, sharing and
doing things together, dependence on each other, group loyalty and
consensus, inclusiveness, and collaterality. For example, Ahmed and
Krohn (1992) identified characteristic elements in Japanese behaviour,
including travelling in groups and taking group photos. Similarly,
the Korean culture emphasizes group travel (Kim and Prideaux, 1996;
Prideaux, 1998). Also, in Asian cultures an individualistic behaviour is
regarded as an expense to others (Hsu, 1971b). In contrast, Australians,
who belong to a more individualistic culture are concerned about the
individual’s needs and well-being. They place greater emphasis on egali-
tarian, exclusive relationships, and ‘doing one’s own things’. The con-
cept of privacy is strong and relationships within groups looser.
Solitude is perceived positively and other people’s privacy is respected.
Consequently, Australian society is seen as a selfish social phenomenon
in which an individual person’s gain is a loss for the whole group.
In addition, as members of high power distance cultures, Asian people
are obedient and submissive to a group leader, authority, and elders.
Superior-subordinate hierarchical relationships dictate respect to higher
ranking authorities reflected in the forms of being loyal to them, obeying
them, fulfilling their instructions, showing total respect, and gratitude.
Since Australians belong to a low power distance culture the concepts of
group loyalty and obedience to authority and seniority are extremely
weak.
All Asian societies are also supposed to hold together and function
harmoniously. For example, Komin (1990) noted that in Thailand, polite,
cool and superficial relationships are preferred with strangers because they
guarantee a harmonious society. All social relationships in Asian societies
conform to formal rules of appropriate behaviour (Hsu, 1972) that cover
every aspect of conduct, including eating, drinking, seating, entertaining,
greeting, and apologizing. As a result of very strict forms of social beha-
viour, Mandarin speaking societies use a third party in personal dealings
(DeMente, 1991c). This custom is not known in Australian society where
the focus is on quick and direct face-to-face dealings.
Further, all Asian societies are very much family dependent and give
precedence in all things to the family, for them being invited to a home is

Cross-Cultural Behaviour in Tourism
294
a honourable event. For example, Japanese appreciate being invited to
restaurants and nightclubs (DeMente, 1991a). Since cuisine is regarded as
an important element of the Korean holiday experience (Prideaux, 1998)
Koreans also appreciate being invited to restaurants for a meal.
Moreover, an important aspect of social relations in the Japanese,
Korean and Mandarin speaking societies is the tradition of gift giving
and reciprocating. This tradition creates and nurtures relationships with
people. Gifts are always tailored to hierarchical position, age and gender
of the receiver and donor, and are given as expressions of apology,
appreciation, gratitude, or remembrance. In Japan, gifts are purchased
for those who stayed at home (Morsbach, 1977). Gifts are the tangible
ways of saying ‘thank you’ (DeMente, 1991c). Brand names are import-
ant. There are various types of gifts. Small thank-you gifts for hospitality
and gifts for honoured guests are common in Japan (DeMente, 1991a;
Zimmerman, 1985). However, in Australia gift giving often seems to be
inappropriate and the donor can be suspected of a bribe. Also, the
Australian style of expressing gratitude verbally with a simple ‘thank
you’, whether casual or emotional, is treated in Mandarin-speaking socie-
ties as insincere (DeMente, 1991c).
Feeling display. As members of high uncertainty avoidance and for-
mal cultures, Asians do not display their feelings in public in order not
to cause disagreement and conflict. They do not swear and do not ask
personal questions. Komin (1990) noted that the Thai are reluctant to
ask personal questions, if these could in any way imply a criticism and
make others uncomfortable. However, questions regarding age and
earnings, which are impolite to ask in Australia, are regarded as polite
in Thailand because they offer a quick way of establishing a person’s
status (Komin, 1990). By complying with formal rules of social beha-
viour, keeping emotions under control, and being self-restrained and
reserved they save own and other’s face and maintain social harmony.
The concept of ‘saving face’ prescribes using respectful language, being
extremely polite, avoiding criticism and excessive complimenting, and
not damaging one’s own or others’ reputation (DeMente, 1991b). Fail-
ure to keep emotions under control may mean loosing face, respect,
status, and causing humiliation on both sides. Wei et al. (1989) noted
that the Chinese are expected to possess dignity, reserve, patience, and
sensitivity to customs. In order to behave properly in the Mandarin-
speaking societies, the most common way is ‘to do nothing’ and ‘say
nothing’ (DeMente, 1991c). Such practice is totally irrational and un-

Cultural analysis: marketing and management implications
295
acceptable from an Australian viewpoint. Australians, who belong to a
low uncertainty and informal culture, are unrestrained in their beha-
viour and have less control over their verbal and non-verbal expres-
sions. They openly disagree, criticize each other and swear in public.
Rules of social behaviour play a minor role in their lives. They are not
concerned about destroying someone else’s reputation and saving one’s
own and other’s face. The focus is on solving problems and conflicts
rather than avoiding them. Australian people are also encouraged to
ask questions and employ critical thinking to challenge and disagree.
Further, in Asian cultures people use smaller interpersonal distance
than in Australia. Sitting and standing occurs in very close proximity.
However, physical contact such as holding hands, leaning on shoulders,
touching knees, or feet and linking arms are usually avoided in public. In
contrast, Australians use larger interpersonal distance, touch less, and
prefer to sit side-by-side less.
Satisfaction. Satisfaction with interpersonal relations in collectivistic
Asian cultures depends on the development of an atmosphere of close-
ness and co-operation. Friendship for Asian people implies obligations.
For example, Wei et al. (1989) reported that for Chinese friendship im-
plies mutual obligations and reciprocation. In Thailand, the determina-
tion of friendship depends on who one is, whom one knows and one’s
wealth (Komin, 1990). Also, Asian people tend to ‘fit’ people they meet
into a social hierarchy. In more individualistic Australia, the satisfying
social relationships are exclusive and based on mutual interests and ac-
tivities rather than social hierarchy. Australians tend to find out what a
person is like. Social relationships do not imply any obligations on the
parties involved. Australians regard friendship as being relatively super-
ficial. Also, the development of satisfying social relationships in Asia
takes a longer time than in Australia. For example, the Japanese re-
quire a long time to get to know people well, to develop an atmosphere
of trust (‘shinyo’) (Ziff-Levine, 1990), comfort (‘amae’) (Nakane, 1973),
and complete acceptance. In contrast, it is easier to develop relation-
ships with Australians and get along well with them in a relatively
short period of time.
In terms of satisfaction with service, service in Asia is of a higher
standard, personalized, and more customer oriented. Although in
Australia the service quality is high there is still much scope for improve-
ment in order to match the Asian standard. For example, Koreans see the

Cross-Cultural Behaviour in Tourism
296
Australian service providers as being too slow (Prideaux, 1998) and the
local cuisine also has a poor image (Kim, 1997). Koreans do not regard
Australians as friendly and welcoming (Kim, 1997). In fact, they have an
image of Australia as a racist country (Prideaux, 1998).
Further, as members of high uncertainty avoidance cultures, Asian
people are worried about the exposure to language difficulties when trav-
elling overseas. Although their English language skills are improving they
are unhappy about Australians’ inability to communicate with Asian
tourists. According to Indonesians and Koreans, the Australian hosts’
knowledge of the guests’ culture and language is imperative to be able to
respond to the guests’ standards of behaviour and needs. One of the
major problems for Koreans visiting Australia is language difficulties
and lack of appreciation of distinctive Korean culture (Prideaux, 1998).
Thus, ‘Koreans are dependent on tour guides to navigate them through a
country which has no public signage in Korean and few tourism workers
who speak the language’ (Prideaux, 1998, p. 98). As a result, Australia
has failed to provide a product that lives up to the promotional images of
the country (Prideaux, 1998).
Although Thai people have a great sense of humour, they do not
appreciate sarcasm, which is accepted in Australia. They also don’t pay
much attention to time constraints. In Thailand conversations between
people are relaxed. However, they require conformity to rules of social
conduct (Komin, 1990).
The analysis of the cultural dimensions identified in each Asian lan-
guage group points to several characteristic dimensions in each group.
These dimensions are briefly presented below.
IndonesiaIn the Indonesian sample, two characteristic dimensions were identified:
perceptions of service responsiveness and perceptions of attention. In
terms of responsiveness, Indonesians believe that service may occur
over an extended time period. Being in a hurry is an indication of impa-
tience (Geertz, 1967). In contrast, in Australia, time commitments are
more important and must be kept. There is more focus on punctuality
and efficiency of service provision. Also, in Indonesia physical appear-
ance and appropriate dress should reflect social position and age. This is
in contrast to Australian culture, in which clothing style is more casual.
With regard to attentiveness, Indonesians believe that people must pay

Cultural analysis: marketing and management implications
297
attention to correct behaviour and the nature and forms of obligations,
which are specified by a system of social hierarchy. In contrast,
Australian society is more egalitarian and people’s behaviour depends
less on social position and age.
JapanIn the Japanese sample, three characteristic dimensions were identified:
perceptions of service helpfulness, values of competence, and rules of
greetings. In Japan, helpfulness is seen in terms of being punctual,
informative, trustworthy, respectful, and polite. Punctuality is regarded
as a measure of professionalism and competence. Australian society
regards punctuality as relative to the importance of the occasion.
Also, the Japanese require precision and accuracy of information
(Turcq and Usunier, 1985). In contrast, Australians are not concerned
with detail to such a degree and are not worried if the problems aren’t
solved immediately. Further, in Japan, the concept of trustworthy ser-
vice is relative and depends upon the social situations and time. The
sincere and trustworthy person strives for harmony with surroundings
and a group through self-restraint (‘enryo’) (Dace, 1995). Australians,
in contrast, are more direct and open. They tend to ‘lay all cards on the
table’. In Japan, respect for others and one’s self is shown through
fulfilling work obligations and complying with the rules of social eti-
quette (Ahmed and Krohn, 1992). In Australia, where people value
equality, respect is gained through individual achievements.
Japanese politeness is an expression of social etiquette rather than a
feeling of kindness, or regard. It requires no damage to one’s own and
others’ reputation, avoidance of conflict, and controlling of emotions
(Lebra, 1976). For Australians, manners are less comprehensive. An
essential element of the Japanese polite character is an apologetic and
humble attitude, and consideration to the effects of one’s own behaviour
on others (Ziff-Levine, 1990). However, the Japanese apologize not only
when they want to admit guilt, but to avoid friction and offence, and
demonstrate humility and regret (DeMente, 1991a), which may often
seem to be illogical to Australians. Also, in a Japanese culture confidence
and loud behaviour are regarded with suspicion and as rude (Condon,
1978). In contrast, Australians regard confidence as a sign of strength.
Moreover, the Japanese tend to listen to and obey orders without ques-
tioning them. This is again in contrast to Australians who are unfamiliar
with the concepts of obedience and listening to superiors.

Cross-Cultural Behaviour in Tourism
298
In Japan, competence is seen to be dependent on personal qualities
such as being self-controlled, logical, obedient, and self-respectful. Self-
controlled means being disciplined, emotionally restrained, and able to
comply with rules of formal behaviour. In Australian culture no corre-
sponding aspects of life seem to be related. Australians are not concerned
about controlling their own behaviour and complying with rules of
socially accepted behaviour. The Japanese way of logical thinking is
intuitive and flexible. In contrast, the Australian way of thinking is objec-
tive and absolute. The Japanese way of being obedient is shown by will-
ingness to comply with the social order and respect for others, and it does
not have an equivalent in Australia either. Further, respecting oneself in
the Japanese context requires saving one’s own and others’ face. In
Australia, self-respect is gained by collecting financial wealth and stand-
ing against authority.
In Japan, individuals are addressed by second names, titles, or func-
tions. The Japanese use first names only with family members and child-
hood friends and feel embarrassed when called by their first names
(DeMente, 1991a). Australian informality of calling people by their
first names is regarded as rude. In Japan, meishi cards (name-cards) are
exchanged at the beginning of conversation to indicate the titles, posi-
tions, and ranks of the owners. The exchange of name-cards is followed
by a bow. There are different kinds and grades of Japanese bows, depend-
ing on age, rank, and social position (DeMente, 1991a; Zimmerman,
1985). The Japanese do not practise shaking hands as favoured by
many Australians. However, since the Japanese have recently become
used to dealing with western businessmen they politely accept handshak-
ing (DeMente, 1991a).
South KoreaIn the South Korean sample, only one characteristic dimension was iden-
tified: perceptions of service performance. In a relatively feminine culture
such as South Korea, society is committed to personal relations (Kim, Q.,
1988), quality of life, and social harmony. However, South Koreans also
believe in masculine values such as inequality among people (Kim, Q.,
1988), performance, and intellectual achievements. Respect is gained
through intellectual achievements and hard work. Punctuality is a mea-
sure of professionalism. South Koreans do not appreciate the waste of
time that occurs if meal service is slow (Prideaux, 1998). In Australia,
people are more money- and possession-oriented; more emphasis is on
performance, growth, and assertiveness. However, Australians also

Cultural analysis: marketing and management implications
299
support feminine values such as equality and welfare of others. Further,
in South Korea, there are specific customs concerning appropriate dress
and physical appearance, which are prescribed by law for different social
classes. This is again in contrast to Australian culture, in which clothing
style is more casual and depends less on social position or age.
Mandarin-speakingIn the Mandarin-speaking sample two characteristic dimensions were
identified: perceptions of punctuality and perceptions of understanding.
Mandarin-speaking societies expect people to adhere to a full, heavy
schedule, and be on time, or early for meetings and appointments
(DeMente, 1991c). Being late is regarded as lacking sincerity, concern
for the other, and professionalism. This is in contrast to the Australian
style of work, which is more relaxed, and in which delays can be justified.
Also, the Chinese are socially and psychologically dependent on others
(Hsu, 1953). The inherent need to care about foreign visitors in the
Mandarin cultures results in a national responsibility for giving constant
attention to and helping foreigners to cope with the different customs to a
degree that may become annoying for western visitors (Wei et al., 1989).
Chinese escort their guests constantly in order to not only ensure that
visitors do not have contact with Chinese, who may offer a different view
of their political reality, but to fulfil all needs of the visitors (Wei et al.,
1989). In Australia, people know best what their needs are and how these
needs can be satisfied.
ThailandIn the Thai sample two characteristic dimensions were identified: percep-
tions of communication courtesy and perceptions of understanding. The
Thai people are very attentive and try to please everyone. The Thai say
whatever is required in order to conform to norms of respect and polite-
ness, and avoid unpleasantness and conflict. For Australians, truth is
absolute and does not depend on a situation. The Thai people rarely
say ‘please’ or ‘thank you’ as the Thai words of politeness carry the
‘please’ element. As a result, in English the Thai may appear to be
demanding something, whereas in Thai they make a polite request
(Komin, 1990). Also, the Thai use the smile instead of polite words
(Komin, 1990). In Australia, words such as ‘please’ and ‘thank you’
are used commonly. Further, in Thailand, respect is shown to all of
higher status and age, and also to objects of everyday life such as
books, hats, umbrellas, elephants, and rice, which are associated with
knowledge, the head, royalty, religion, and life (Komin, 1990). In con-

Cross-Cultural Behaviour in Tourism
300
trast, Australians are less respectful and they do not have as many sacred
symbols.
Marketing and management implications of the PrincipalComponents Analysis results
The cultural differences between Asian and Australian populations pre-
sented in the study point to the development of specific marketing strat-
egies aimed at the Asian tourist market. Promotional advertising aiming
at all Asian tourists should focus on the opportunity to develop close
human relations between tourists and Australian people. Travel itiner-
aries should be developed and structured around socializing with
Australian people and other travellers. As a base for the development
of social relations attention should be paid to: (a) the dependent nature of
Asian social relations; (b) the hierarchical structure of Asian societies and
the ability of the hosts to comply with authority and seniority; and (c)
social etiquette which demands the providers treat Asian tourists accord-
ing to their age, social positions, and ranking. For example, special care,
respect, and courtesy should be shown to elders, and obedience to any
higher-ranking superiors. Appropriate seating arrangements in buses and
restaurants, and hotel room allocation should be made according to age
and social ranking. Australian providers should identify their profes-
sional status by wearing formal work uniforms and badges with names
and positions displayed. Preferably an older person should represent
management, as this person would be seen as being of high social status
and professional experience. Similarly, an older person is a better tour
guide choice being seen as knowledgeable and experienced. The hotel
management should welcome and bid farewell Asian tourists at the air-
port or hotel, creating an atmosphere of social order and indicating that
the management has a sense of responsibility and respect.
The hierarchy and seniority system and the compliance with basic
rules of social etiquette should be emphasized in advertising. All Asian
tourists should be addressed by their titles and last names, except Thai
tourists who should be called by their titles and first names. Tourists
should wear badges with their names and titles. Although the Japanese
and Korean tourists do not expect foreigners to know exactly how to
bow, Australian providers should show some inclination to conform to
their custom of bowing, instead of handshaking, to show their politeness
and respect of tourists. In addition, exchanging business cards with

Cultural analysis: marketing and management implications
301
English text on one of the sides, indicating the social status of the person
introduced, followed by a bow would fulfil the Japanese custom of intro-
duction. The Thai tourists should be greeted with a smile instead of
‘hello’ and a handshake. Advertising to Japanese and Korean tourists
should incorporate pictures of bowing. Advertising to Thai people should
show people with a smile on their faces.
Marketers should emphasize the time spent in Australia as a means of
developing social relations with Australians, and consider that the aver-
age Asian tourist values the importance of time spent on socializing and
devoting personal time to other people. Conversations should comply
with the rules of formal etiquette. Providers should not feel offended
when asked about their age or salary earnings. In fact, they should ask
tourists these questions to establish their social status. Ironic and sarcas-
tic comments or jokes, common in Australia, should be avoided. The
Australian relaxed, casual and slow pace lifestyle, which offers much
time for socializing should be promoted, in particular to Indonesian
and Thai tourists. The aspect of ‘having a good time, fun and pleasure’
should be the focus of promotional messages aiming at the Thai market.
Given the sensitivity and importance of face saving to all Asian
tourists, caution has to be exercised in personal dealings with Asian
tourists involving openly displaying feelings and expressing opinions,
in order to prevent conflict and disagreement in interpersonal relations
between providers and tourists. Special care should be taken not to
insult and damage the reputation of the tourist, even if criticism is
constructive and negative feelings justified. It is important not to offend
any tourist and not to swear in front of them, not to criticize, or talk
about sensitive issues. However, personal questions related to tourist
social statuses are permitted. The providers should strive to be consid-
erate and take into account the effects of one’s own behaviour on the
tourists’ feelings. If there are any differences in opinions providers
should find a suitable way of expressing their own views that does
not offend and harm a tourist. Failure to do so will result in conflict
and may cause humiliation, loss of dignity and social status on both
sides. Consequently, providers should practise self-control, coolness of
manners, non-assertiveness, and humility.
The promotional strategies aiming at the Japanese and South Korean
markets should emphasize the educational and intellectual aspects of
travel to Australia in order to enhance the tourists’ intellectual and cul-

Cross-Cultural Behaviour in Tourism
302
tural experiences. The value of knowledge and wisdom should be used as
criteria for the enhancement of the Japanese and South Korean tourist’s
social status and their recognition among fellow nationals.
Commercial advertising should be directed towards Asian families so
as to appeal to all its members rather than the individual tourist. Special
offers for extended families should be proposed and large family tours
organized. The advertising messages should promise the fulfilment of
family needs including security. The safety of airlines, the high quality
of Australian infrastructure and recreation facilities, low crime rate, clean
and unpolluted environment can be highlighted in promotional bro-
chures. The competence and professionalism of Australian service pro-
viders need to be stressed specifically to the Japanese market. Focus
should be on the ability of the providers to fulfil professional obligations,
being respectful, and obedient. By doing this the cultural predisposition
of Asian tourists to avoid risk can be overcome, without loosing interest
in travelling to Australia.
Marketing strategies aiming at Asian tourists should also focus on a
team spirit and promote group activities such as group travelling, sight-
seeing, picnics, barbecues, or recreational activities. Individual activities
may not be popular among Asian tourists who prefer to feel ‘in-group’.
Tours guides, front office, airline staff, and restaurateurs should never
leave the Asian tourists on their own, as they demand constant attention.
In particular, the Mandarin-speaking tourist groups should not be sep-
arated even for a short period of time because of the inherent need for
support and dependence.
All Asian tourists would be particularly pleased when Australian hosts
follow their custom of gift-giving. Small welcome and farewell gifts
should be given to tourists on their arrival and departure as a means of
showing an appreciation for coming to Australia. An appropriate gift
should be given, such as a box of golf balls, and in Australia, a boom-
erang or koala toys. Every gift should be artistically wrapped as the
Japanese and Koreans, in particular, value external presentation. Gifts
should be given in order of seniority. In addition, a small gift in the form
of Australian fruit or a bottle of wine should be available in each hotel
room. A lot of discretionary time for purchasing gifts for each family
member should be included in the travel itineraries for Asian tourists.
Australian tour operators should organize special shopping tours.

Cultural analysis: marketing and management implications
303
Advertising aimed at all Asian tourists should focus on hosts perform-
ing acts of kindness that bind tourists and make them feel obliged (Lebra,
1976) such as gift-giving, experiencing a sporting game, sharing an inter-
est in Asian art, food, or other elements of culture. The Asians appreciate
being invited to a nightclub or out for dinner. Being invited home is
regarded as an honourable and rare event, and it can shorten significantly
the time necessary for the development of relations. This later aspect may
be important for hosts dealing with visiting Asian tour operators.
Australian providers should be anxious to provide the best service they
can, particularly to the Japanese. Those who provide services to the
Japanese, South Korean and Mandarin-speaking tourists should be
punctual. Of importance is the effective dissemination of information
to passengers and corrective action during service break down (Laws,
1990). When the service cannot be delivered to tourists on time, providers
should provide an explanation for the service delay, apologize politely
and compensate for lack of promptness and efficiency, even if it is not
their fault. Compensation in the form of a personal written apology or a
small gift would be appropriate and eliminate the potential for offence
and frictions in human interactions with Asian tourists. Any waiting time
should be entertaining to give tourists a feeling of getting the most of
every moment of their holiday. For example, the Japanese tourists, who
value education and intellectual achievements, could be shown educa-
tional books or videotapes of Australia while waiting at the airport, or
in the hotel lobby. Also, serving Japanese or Chinese tea before the meal
would show the tourists that the order is being fulfilled and would give
them a feeling of smooth service delivery. However, Australian providers
should be less concerned about being punctual and delivering service on
time to Indonesian and Thai tourists. Indonesian and Thai tourists
should not be hurried. They require relaxed and flexible service.
Every promotional campaign aiming at the Asian tourist market
should emphasize Australian genuine hospitality, concern for tourists,
and the ability to anticipate and understand their needs. Promoting
Australian hosts’ commitment to personalized service would enhance
the Asian tourist’s interest in travelling to Australia.
Australian providers should learn some basic phrases and principles of
the Asian languages to be used in different social situations with people of
different social standing in order to be perceived as communicative and
informative. Just a small ability in speaking Asian languages would help

Cross-Cultural Behaviour in Tourism
304
to greet and farewell tourists, enquire politely about their trip or health,
make polite casual comments, and be able to respond to their queries.
Australian providers should not expect all Asian tourists to speak the
English language. The Japanese, South Korean and Mandarin-speaking
tourists would be particularly grateful to hosts for having a degree of
competence in their mother tongues, which would also enhance tourist
satisfaction with Australian providers. Since the Japanese rely more on
print media (Mihalik et al., 1995), visitor guides, brochures, and maga-
zines translated into Japanese should be made available to all Japanese
and Australian travel agents, foreign and domestic libraries, public and
private, and all other points of tourist information. The provision of
multilingual signs and services would also assist all Asian tourists.
Learning the non-verbal aspects of communication including body
language, gestures, or eye gazing should complement learning Asian lan-
guages. It would be advisable to understand the customs of Asian greet-
ing, entertaining, gift-giving, and even eating and drinking habits. The
different principles of truth and sincerity also need to be understood.
Australian providers need to be alert for signals that reveal the true
meanings of the Asian words and expressions. They should learn how
to recognize what is unsaid, intentions behind the Asian words, and say
only what has to be said to conform to rules of politeness, respect, and
avoidance of conflict. Straightforwardness should be avoided as it might
be regarded by Asian tourists as rude and wouldn’t be reciprocated.
Australian providers must be careful in interpretation of subjective
assessment provided by Japanese tourists in the host country (Iverson,
1997) and not be complacent.
Special efforts need to be made to learn about the Asian guests’ coun-
try of origin, its history, traditions, music, food, and everyday life. This is
particularly important to Korean and Indonesian tourists. This would
not only be an indication of the hosts’ willingness to please Asian tour-
ists, but also show an interest and appreciation of their culture and
enhance the tourists’ self-ego and pride.
Structural equation modelling analysis
The series of interdependent, multiple relationships between the identified
dimensions and their key indicators were assessed by structural equation

Cultural analysis: marketing and management implications
305
modelling (SEM) analysis using LISREL VII.2 (Joreskog and Sorbom,
1989a,b). The SEM is confirmatory factor analysis and aims to determine
a relationship between the latent variables, that is, whether cultural dif-
ferences between Asian tourists and their Australian hosts determine
tourist interaction and satisfaction.
Theoretical models with defined relationships between latent constructs
and their indicators were developed. Every model has several latent con-
structs, each measured by a set of manifest (observable/measurement)
variables. The variables measuring each latent construct are presented
in path diagrams with arrows. A straight arrow indicates a direct relation-
ship from a construct to its indicators. A curved line connecting two
constructs indicates just a correlation between the constructs. The vari-
ables involved in a diagram are: measurable x-variables x1. . .xn, latent
exogenous variables �1. . .�n measured by x-variables, and measurement
errors �1. . .�n in the indicators for exogenous x-variables. Since the study’s
aim is to measure the relationships between the latent constructs and their
indicators the diagrams also involve y-variables y1. . .yn, latent endogenous
variables �1. . .�n measured by y-variables, measurement errors "1. . ."n in
the indicators for endogenous y-variables, and measurement errors in
equations �1. . .�n that indicate that the endogenous variables were not
perfectly explained by the independent variables.
The correlation matrix was the preferred input data type because it
allowed: (a) to explore the pattern and the strength of interrelationships
between latent constructs and their indicators; (b) a comparison across
different variables, and their correlations with the dimensions; (c) more
conservative estimates of the significance of the coefficients than the co-
variance matrix (Hair et al., 1995); (d) easy interpretation of the results;
and (e) possible direct comparisons of the coefficients within a model. The
Pearson product-moment correlation was used to compute the correla-
tions. The correlation matrix was computed using PRELIS (Joreskog and
Sorbom, 1988).
The initial estimates were computed by the Two-Stage Least-Squares
(TSLS) method and the final solution by the Maximum Likelihood
Estimation (MLE) method. The MLE method was more suitable as it
is an iterative procedure and minimizes a fit function by successively
improving the parameter estimates. The MLE method is also robust
against departures from normality and can be used in large samples
(the largest sample was 618). The sample size required to ensure appro-

Cross-Cultural Behaviour in Tourism
306
priate use of MLE is 100 to 200 (Hair et al., 1995). This requirement was
met by all the Asian samples ranging from 102 to 173 respondents.
The assessment of the models’ fit was done on the basis of: (a) the
ratios of Chi-square to the degrees of freedom; (b) sample sizes; (c)
goodness-of-fit (GFI) values; (d) adjusted for the degrees of freedom
goodness-of-fit measures (AGFI); and (e) root mean square residuals
(RMSR) (average residuals correlation). Each of the indicators and
constructs were also evaluated separately by examining: (1) squared
multiple correlation coefficients (SMC) for both x- and y-variables;
(2) the total coefficient of determination (TCD) (R2) for all x- and y-
variables jointly; (3) t-values for the paths; (4) correlations between the
latent constructs (�-values and t-values); (5) standard errors (SE) for
each coefficient and construct; (6) fitted residuals (FR); and (7) stan-
dardized residuals (SR). In some instances modification to models was
made by deleting or adding parameters, if it was theoretically justified.
The modification indices (MI) were used to decide which parameters
should be added or deleted, to reduce Chi-square and improve the fit of
the models. For each dependent latent construct one path emanating
from it was fixed to 1 (the only option available in LISREL 7) in order
to set the measurement scale for this construct, that is, to make the
latent metric identical to the metric inherent in the observed variable
receiving the fixed path, and to achieve model identification. None of
the paths emanating from independent latent constructs was fixed, as
the purpose was to test the influence of all independent observed vari-
ables on the dependent variables.
Results of structural equation modellingThe results of the LISREL and all measures-of-fit suggested that the
developed models for the total Asian market and each individual Asian
market fitted the data well. The fit estimates for all models are shown in
Table 9.2. The solution is standardized.
The Chi-square indices are small in relation to the degrees of freedom.
Goodness-of-fit (GFI) values range between 0.92–0.96 and indicate
acceptable fits. Adjusted for the degrees of freedom goodness-of-fit mea-
sures (AGFI) range between 0.86–0.93 and also indicate acceptable fits.
Root mean square residuals (RMSR – average residuals correlation) have
values below a marginal acceptance level of 0.08 and indicate strong
correlations in the original correlation matrix.

Cultu
ral
analysis:
mark
eting
and
managem
ent
implica
tions
307
Table 9.2 LISREL fit estimates for all groups
Measures of fit
All Asian Indonesian Japanese South Korean Mandarin Thai
Chi-square 101.79 23.40 45.82 38.14 34.63 58.83
Degrees of freedom 79 19 43 34 25 44
Probability 0.043 0.220 0.356 0.287 0.095 0.067
Goodness of Fit Index (GFI) 0.923 0.955 0.936 0.962 0.937 0.922
Adjusted Goodness of Fit Index (AGFI) 0.882 0.892 0.885 0.927 0.861 0.862
Root Mean Square Residuals (RMSR) 0.059 0.038 0.049 0.034 0.055 0.040
Total Coefficient of Determination (TCDx) 0.98 0.979 0.955 0.990 0.999 0.997
Total Coefficient of Determination (TCDy) 0.97 0.994 0.992 0.996 0.869 0.994

Cross-Cultural Behaviour in Tourism
308
However, it is important to note that these statistics provide overall
measures of fit of the models to the data (GFI, AGFI and RMSR) and do
not express the quality of the models. It has been argued that the Chi-
square should not be used as a valid assessment index (Joreskog and
Sorbom, 1989b), particularly when there is data departure from multi-
variate normality. Joreskog and Sorbom (1989b) suggested the use of
other measures of fit assessment such as:
1. the squared multiple correlation coefficients (SMC) for the x- and y-
variables, which represent reliabilities of the x- and y-variables (these
are above 0.9 and indicate that the independent and dependent vari-
ables explain a very high amount of variance in their latent dimen-
sions, and thus measure these dimensions very well);
2. the total coefficient of determination (TCD) (R2) for all x- and y-
variables (these are remarkably high, range between 0.95–0.99 and
they indicate that all x- and y-variables as a group measure the latent
constructs very well);
3. t-values for the paths (these were very large – larger than 2 – and
pointed to the indicators’ power to reliably predict their latent con-
structs, thus verifying the relationships among indicators and con-
structs);
4. the correlation coefficients between the latent constructs, according
to the MLE method, are high and indicate that the latent constructs
are significantly correlated with each other;
5. the standard errors for coefficients and constructs are small and
indicate that the values of the parameters are estimated accurately.
The standard errors of correlation between the latent constructs are
also small. However, what is small or large depends on the units of
measurement in latent constructs and the magnitude of the para-
meter estimate itself. Standard errors are robust against moderate
departures from normality; thus, they should be interpreted with
caution if the condition of normality does not hold. Therefore, t-
values are used as independent units of measurement;
6. the fitted residuals which represent the differences between the
observed and the fitted correlations; these are small relative to
the size of the elements of the correlation matrices and indicate
that the fit of the models is acceptable; and
7. the standardized residuals (SR), which are fitted residuals divided by
their standard errors and are interpreted as standard normal devia-
tions. There are numerous SR values exceeding the value of 2.58 in
absolute terms and indicate specification and prediction error, for a

Cultural analysis: marketing and management implications
309
pair of indicators. However, their number is within the acceptable
range, that is, one in twenty residuals exceeding 2.58 by chance.
These fit measures suggest that there are well-defined relationship paths
in the models. They do not precisely indicate whether the models are or
are not supported by the data, and what is wrong with the model
(Joreskog and Sorbom, 1989b). Consequently, these measures could
show even better fit, and be sounder if some paths were eliminated
from the models, and the models run again. However, this was not
done. According to Joreskog and Sorbom (1989b), the quality of the
models should also be judged by external criteria such as theoretical
grounding. In this regard, the choice of path structure and content has
strong theoretical justification based upon an extensive literature review.
Analysis of the models
Total AsiaAn assessment of the results suggest that differences in rules of behaviour
(feeling display), followed by the differences in cultural values (family/
competence) have an effect on satisfaction and that these two dimensions
together determine Asian tourist satisfaction. The direct paths from cul-
tural values and rules of behaviour to satisfaction are significant and
indicate that differences in values and rules contribute directly and sig-
nificantly to satisfaction. The three major differences in values that
directly and significantly determine satisfaction, are differences in attach-
ing importance to self-control, family security, and intellectualism. The
three key differences in rules that directly and significantly determine
satisfaction, are differences in addressing people, showing respect, and
criticizing in public. On the other hand, the direct paths from values and
rules to interaction are insignificant and indicate that differences in values
and rules did not have a direct and significant effect on interaction.
Secondly, differences in perceptions (communication) do not have a
direct effect on Asian tourist satisfaction. On the other hand, differences
in perceptions have a direct effect on interaction. Although there is a
correlation between the dimensions of values, rules and perceptions,
the influence of differences in perceptions on satisfaction is indirect
only and mediated through interaction. The three key differences in per-
ceptions that have direct and significant influence on interaction and
indirect influence on satisfaction are the differences in understanding
and anticipating tourists’ needs, and paying attention to the tourist.

Cross-Cultural Behaviour in Tourism
310
Thirdly, interaction has a weak but significant effect on satisfaction.
The key differences in interaction that have a direct effect on satisfaction
are the differences in developing and maintaining close personal relation-
ships, attitudes to being invited home, sharing a meal, and playing sport.
An improvement in the model fit was achieved by using modification
indices and allowing ‘playing sport’ to measure satisfaction. This rela-
tionship appears to be reasonable. Personal interviews with the tourists
revealed the importance of playing golf for Asian tourist satisfaction.
Finally, the two key indicators of satisfaction affected by the differences
in interaction are differences in satisfaction with time spent together and
satisfaction with knowledge of an Asian language.
Further, although differences in cultural values have a significant effect
on satisfaction this effect is weak, while the path between cultural values
and interaction is insignificant. This suggests that differences in cultural
values do not determine preferences for social interaction and may have a
significant effect on satisfaction. Overall, the greatest direct and signific-
ant effects on Asian tourist satisfaction are differences in rules of beha-
viour (feeling display) (see Figure 9.2).
Figure 9.2 Model for total Asia (significant paths only)

Cultural analysis: marketing and management implications
311
JapanDifferences in rules of social behaviour (greetings) have a significant
positive but very weak influence on social interaction with the
Japanese tourist. The two major differences in rules, which directly and
significantly determine interaction with the Japanese tourist, are the dif-
ferences in addressing and greeting people. Differences in perceptions of
service (helpfulness) have a significant positive influence on Japanese
tourist satisfaction. The two major differences in perceptions of helpful-
ness, which have a significant effect on tourist satisfaction, are differences
in perceptions of the service providers being helpful and punctual.
Neither differences in perceptions of helpfulness of service nor differences
in cultural values of competence are significant determinants of inter-
action. Neither differences in cultural values of competence nor the
differences in rules of greetings are significant determinants of satisfac-
tion. However, it must be noted that the dimension of service perceptions
(helpfulness) is significantly and positively correlated with the dimension
of cultural values (competence) and the dimension of rules of behaviour
(greetings). Also, social interaction only slightly, but significantly, influ-
ences satisfaction through the mediating effect of rules of behaviour. The
three key differences in interaction, which affect satisfaction through the
rules of behaviour, are differences in sharing recreation facilities, playing
sport, and participating in a party. The two major indicators of satisfac-
tion that are affected by the differences in interaction are differences in
satisfaction with friendship and time spent together. An improvement in
the model fit was achieved by using modification indices and allowing
‘being obedient’ to measure rules of social behaviour. This relationship
appears to be reasonable (see Figure 9.3).
South KoreaDifferences in rules of social behaviour (feeling display) and differences in
perceptions of service (performance) exert a significant and positive influ-
ence on tourist satisfaction and these two dimensions determine Korean
tourist satisfaction. The three major differences in rules of feeling display
that significantly affect satisfaction are differences in displaying emotions,
criticizing and swearing. The two major differences in perceptions of ser-
vice providers’ performance that significantly affect satisfaction are differ-
ences in perceptions of providers being punctual and respectful. The two
major indicators of satisfaction influenced by the differences in rules of
feeling display and differences in perceptions of the providers’ performance
are satisfaction with friendship and time spent together. The differences in
rules of behaviour (feeling display) also have a significant but weaker

Cross-Cultural Behaviour in Tourism
312
indirect influence on satisfaction via interaction. Neither differences in
perceptions of the providers’ performance nor differences in perceptions
of communication style are significant determinants of social interaction.
Also, communication is not a significant determinant of satisfaction.
However, it must be noted that all three dimensions of rules of behaviour,
perceptions of communication and perceptions of service performance are
significantly and positively correlated with each other. Although the direct
influence of the differences in communication on interaction and satisfac-
tion is positive, it failed to reach a statistically significant level. The inter-
action dimension only slightly, but significantly, influences satisfaction.
The twomajor differences in interaction that exert influence on satisfaction
are differences in playing sport and sharing a meal (see Figure 9.4).
Mandarin-speakingOnly the dimension of perceptions of understanding the tourist exerts a
significant and positive, but weak, influence on social interaction and
indirect influence on Mandarin tourist satisfaction via interaction. The
two major differences in the perceptions of understanding that influence
interaction and, indirectly, satisfaction are differences in understanding
TFRSNA
THANDS
0.972 (7.038)0.152
0.639 (5.356)
0.096
TINTEL
0.742 (7.713)
0.093
TLOGIC
TOBEDI
0.917 (9.572)0.096
0.244 (2.860)SE = 0.085
0.124 (1.282)SE = 0.097
THLPF
0.112TPUNCT
0.847 (7.536)0.112
0.844 (7.516)
0.272 (2.547)SE = 0.107
RulesGreetings
ValuesCompetence
PerceptionsHelpfulness
0.164 (1.657)SE = 0.099
0.301 (2.488)SE = 0.104
0.194 (1.970)SE = 0.070
0.709 (3.873)
0.092
TSATFR
TSATTI
0.000
TRECFA0.146
TPARTY0.000
Satisfaction
0.345 (2.701)SE = 0.134
1
0.979 (9.362)
0.888 (9.180)
1
Interaction
THLPFTPUNCTTINTELTLOGICTOBEDITFRSNATHANDS
- helpful- provide service on time- intellectual- logic- obedient- address by first name- shake hands
TPARTYTRECFATSPORTTSATFRTSATTI
- participate in a party- share recreation facilities- play sport together- satisfaction with friendship- satisfaction with time spent together
TSPORT0.135
0.119
Figure 9.3 Model for Japan (significant paths only)

Cultural analysis: marketing and management implications
313
and anticipating the Mandarin-speaking tourist needs. Neither percep-
tions of service punctuality nor rules of feeling display determine inter-
action. Also, perceptions of service punctuality, perceptions of
understanding, and rules of feeling display do not determine satisfaction.
The dimensions of perceptions of punctuality and understanding are sig-
nificantly and positively correlated with each other. Similarly, the dimen-
sions of understanding and rules of feeling display are positively and
significantly correlated with each other. The direct effect of social inter-
action on satisfaction is large and significant, indicating that interaction
is a significant determinant of satisfaction. The two major differences in
interaction that significantly influence satisfaction are differences in the
preferences for participating in a party and sharing a meal. The two
major differences in satisfaction influenced by the differences in inter-
action are differences in satisfaction with local providers and time spent
together (see Figure 9.5).
ThailandDifferences in perceptions of understanding the tourist exert a significant
positive influence on social interaction. The indirect influence of differ-
0.938 (4.900)
0.000
TSPORT
TMEAL
0.071
1
TKEPIN
TLISTE
0.938 (15.720)0.060
0.954 (16.182)
0.067
TCRITI
0.803 (12.000)
0.067
TSWEAR
TEMOTI
0.816 (12.259)0.067
0.815 (12.239)
0.652 (9.863)SE = 0.066
TPUNCT
0.080TRESPE
0.867 (10.362)0.084
0.574 (7.203)
0.366 (4.266)SE = 0.086
PerceptionsCommunication
PerceptionsPerformance
RulesFeeling display
0.619 (10.990)SE = 0.056
0.214 (1.800)SE = 0.084
0.390 (3.689)SE = 0.094
0.938 (15.657)
0.068
TSATFR
TSATTI
0.000
Satisfaction
0.151 (2.325)SE = 0.082
1
Interaction
TCRITITSWEARTEMOTITPUNCTTRESPETKEPIN
- criticize in public- swear in public- show emotions in public- provide service on time- provide service with respect- keep tourists informed
TLISTETSPORTTMEALTSATFRTSATTI
- listen to tourists- play sport together- share a meal- satisfaction with friendship- satisfaction with time spent together
0.059
0.487 (5.497)SE = 0.078
Figure 9.4 Model for South Korea (significant paths only)

Cross-Cultural Behaviour in Tourism
314
ences in perceptions of understanding on Thai tourist satisfaction via
interaction is insignificant. The two major differences in perceptions of
understanding that influence interaction are the differences in perceptions
of the providers being able to anticipate and understand Thai tourist
needs. The three major indicators of interaction influenced by the differ-
ences in understanding are being invited to a party and a home, and
sharing a meal. Differences in perceptions of communication exert a posi-
tive and significant influence on satisfaction. The two major differences in
perceptions of communication that influence satisfaction are differences in
perceptions of the providers being able to provide the Thai tourist with
accurate information and being trustworthy. The three major indicators
of satisfaction influenced by the differences in communication are satisfac-
tion with local providers, conversation, and friendship. Although, all
three dimensions of rules of social behaviour (feeling display), perceptions
of service communication and understanding are significantly and posi-
tively correlated with each other, rules of feeling display do not have any
influence on interaction and satisfaction. The direct influence of rules of
feeling display on interaction and satisfaction is positive, however, it failed
to reach a statistically significant level. Also, interaction is not a significant
determinant of satisfaction (see Figure 9. 6).
TRESNE
0.105TPUNCT
0.989 (3.179)0.111
0.446 (2.709)
0.798 (5.061)
0.103
TMEAL
TPARTY
0.0001
TCRITI
TSENIS
0.803 (3.484)0.131
0.469 (3.010)
0.336 (2.467)SE = 0.106
TANANE
0.119TUNANE
0.725 (6.507)0.111
0.913 (7.665)
0.310 (2.280)SE = 0.106
PerceptionsPunctuality
PerceptionsUnderstanding
RulesFeeling display
0.162 (1.244)SE = 0.103
0.495 (3.191)
0.126
TSATAU
TSATTI
0.000
Satisfaction
0.655 (3.864)SE = 0.105
1
Interaction
TRESNETPUNCTTANANETUNANETCRITITSENIS
- responsive to tourists' needs- provide service on time- anticipate tourists' needs- understand tourists' needs- criticize in publiic- talk about sensitive issues
TMEALTPARTYTSATAUTSATTI
- share a meal- participate in a party- satisfaction with hosts- satisfaction with time spent together
0.106
0.289 (2.060)SE = 0.109
Figure 9.5 Model for Mandarin-speaking group (significant paths only)

Cultural analysis: marketing and management implications
315
IndonesiaNeither differences in perceptions of service responsiveness nor differences
in perceptions of service attentiveness have a significant influence on inter-
action and Indonesian tourist satisfaction. However, it must be noted that
perceptions of responsiveness and attentiveness are significantly and posi-
tively correlated with each other. An improvement in the model fit was
achieved by allowing the variable ‘have close relationship’ to measure
satisfaction, and the variable ‘satisfaction with the Indonesian language’
to measure interaction. The personal interviews with tourists revealed the
importance of personal relations for Indonesian tourist satisfaction and
ability of the providers to communicate in the Indonesian language for
interaction. These relationships appear to be reasonable. The interaction
dimension does not determine satisfaction (see Figure 9. 7).
Marketing and management implications of the structuralequation modelling analysis
An important implication of the study findings is that it becomes increas-
ingly important for tourism marketers and managers to consider and use
TSATTA0.104
TSATAU0.000
1
0.821 (9.544)
0.905 (10.442)
TSATFR0.103TUNANE
0.082TANANE
0.913 (10.964)0.083
0.950 (11.620)
TACINF
0.094TTRSTW
0.864 (9.157)0.094
0.863 (9.149)
0.556 (6.830)SE = 0.081
TSWEAR
0.103TPRSQU
0.520 (3.588)0.145
0.872 (4.301)
0.278 (2.246)SE = 0.124
PerceptionsUnderstanding
RulesFeeling display
0.292 (2.449)SE = 0.119
0.223 (1.727)SE = 0.108
TPARTY0.090
TINVIT0.000
Satisfaction
0.121 (1.139)SE = 0.100
1
0.687 (8.183)
0.958 (12.055)
0.243 (1.869)SE = 0.109
Interaction
TSWEARTPRSQUTACINFTTRSTWTUNANETANANE
- swear in public- ask personal questions- provide accurate information- trustworthy- understand tourists' needs- anticipate tourists' needs
TINVITTPARTYTMEALTSATAUTSATTATSATFR
- invite home- participate in a party- share a meal- satisfaction with hosts- satisfaction with conversation- satisfaction with friendship
PerceptionsCommunication
0.288 (2.193)SE = 0.117 TMEAL
0.095
Figure 9.6 Model for Thailand (significant paths only)

Cross-Cultural Behaviour in Tourism
316
knowledge of cultural differences and their influences on social interac-
tion with international tourists. It is clear that tourism marketers cannot
directly rely on perceptions of service to generate Asian tourist satisfac-
tion, as tourist satisfaction can also be influenced by cultural values, rules
of social behaviour, and social interaction. Tourism marketers can best
directly influence Asian tourist satisfaction by emphasizing, in their pro-
motional campaigns, the importance of values such as self-control, family
security and intellectualism, and the rules of social behaviour such as
proper address, respect, and avoidance of criticism. Perceptions of service
and, in particular, perceptions of understanding, anticipative and atten-
tive service are important indirect determinants of Asian tourist satisfac-
tion, hence they indirectly influence tourist willingness to interact with
Australian providers and, in turn, affect Asian tourist satisfaction.
For the Japanese tourist market, developing tourist perceptions of
helpful and punctual service should directly influence Japanese tourist
satisfaction. Rules of proper greeting such as the proper addressing of
people should be used to directly influence the Japanese willingness to
interact socially and to then indirectly generate satisfaction.
South Korean tourist satisfaction should be directly influenced by
learning the appropriate cultural rules of displaying feelings and, in par-
ticular, not criticizing, swearing and showing emotions in public, and
developing perceptions of punctual and respectful service. Further,
understanding the appropriate rules of feelings displayed can directly
0.083
TPERSE
0.793 (9.514)
0.075
TPRSER
TRESNE
0.825 (10.050)0.082
0.964 (12.791)
TINATT TSATCU
0.123 0.091TWELFA TSATLA
0.554 (5.057) 10.110 0.000
0.832 (6.766) 0.983 (5.098)
0.620 (6.472)SE = 0.096
PerceptionsAttention
TPERSETPRSERTRESNETINATTTWELFA
- perform service required- provide prompt service- responsive to tourists' needs- offer individualized attention- concerned about tourists' welfare
TINVITTPERELTSATCUTSATLA
- invite home- have close relationship- satisfaction with hosts' knowledge of Asian culture- satisfaction with language spoken
n.s
PerceptionsResponsiveness
TINVIT
0.072TPEREL
1 0.000
0.840 (3.820)
0.105 (0.716)SE = 0.167
n.s
n.s
n.s
0.210 (2.573)SE = 0.089
0.475 (3.182)SE = 0.085
Satisfaction
Interaction
Figure 9.7 Model for Indonesia

Cultural analysis: marketing and management implications
317
influence the South Korean tourists’ willingness to interact socially and
then indirectly generate satisfaction.
Mandarin-speaking tourist satisfaction is indirectly influenced by the
mediating effect of a proper understanding by the hosts of being able to
understand and anticipate the Mandarin tourist needs, as these percep-
tions directly determine social interaction with the Mandarin speaking
tourist, and indirectly influence their satisfaction.
Thai tourist satisfaction is directly influenced by perceptions of a
proper communication style, that is, providing the tourist with accurate
and trustworthy information, and developing tourist perceptions of hosts
as being able to understand and anticipate the Thai tourists’ needs.
Further, an understanding of the Thai tourist needs directly influences
the willingness of Thai tourists to interact socially, and indirectly influ-
ences their satisfaction.
Indonesian tourists’ satisfaction and interaction are not influenced by
either the providers’ responsiveness (perform responsive, required and
punctual service) or attentiveness (offer individualized attention, being
concerned about tourists’ welfare). This indicates that there are possibly
other more clearly distinguishing variables this study failed to identify for
the Indonesian sample.
Summary
Principal Components Analysis was used to identify the dimensions of
cultural differences between Asian and Australian populations in tour-
ism. The results of a structural equation modelling analysis deter-
mined which cultural differences between Asian tourists and
Australian providers determined their social interaction and satisfac-
tion. Five cultural models for Indonesian-, Japanese-, South Korean-,
Mandarin- and Thai-speaking groups were developed. The findings
show that marketers cannot directly rely on perceptions of service
to generate Asian tourist satisfaction but must also consider cultural
values and rules of social behaviour. The implications of the results for
tourism industry managers and marketers are presented.

Discussion points and questions
1. Explain the advantages of using a Principal Components Analysis in
tourism research.
2. Identify the research issues that might be analysed using the PCA.
3. Explain the purpose of applying a structural equation modelling in
tourism.
Endnotes1 Two statistical packages were used for data input, namely the SPSS
for Windows Release 6.0 (Norusis, 1993) and the GB-STAT for
Windows Version 5.0 (Friedman, 1994).2 Eighteen out of thirty-six areas of measurement showed significant
differences in cultural values, twenty-two out of thirty-four in rules of
social interaction, twenty-three out of twenty-nine in perceptions of
service, seven out of eleven in forms of interaction, and three out of
seven in satisfaction with interaction.3 The tables with the significant differences between the individual
Asian language groups and the Australian sample are available
from the researchers.4 The results of the Principal Components Analysis for each Asian
language group are available from the researchers.
Further reading
Boshoff, C. and Mels, G. (1995) A causal model to evaluate the relation-
ships among supervision, role stress, organizational commitment and
internal service quality. European Journal of Marketing 29(2): 23–42.
Getty, J. and Thompson, K. (1994) The relationship between quality,
satisfaction, and recommending behavior in lodging decisions.
Journal of Hospitality and Leisure Marketing 2(3): 3–22.
Gundersen, M., Heide, M. and Olsson, U. (1996) Hotel guest satisfaction
among business travelers: What are the important factors? Cornell
Hotel and Restaurant Administration Quarterly 37(2): 72–84.
Cross-Cultural Behaviour in Tourism
318

Cultural analysis: marketing and management implications
319
Homer, P. and Kahle, L. (1988) A structural equation test of the value-
attitude-behavior hierarchy. Journal of Personality and Social
Psychology 54: 638–646.
Reisinger, Y. and Turner, L. (1999) A cultural analysis of Japanese tour-
ists: challenges for tourism marketers. European Journal of Marketing
33(11/12): 1203–1227.


Part 4
Conclusion
The significance of this book lies in suggesting a solution to the problem
facing the international tourism industry of maintaining growth in
inbound tourism. The book suggests that in order to respond better to
the international tourist markets and avoid problems of negative percep-
tions and dissatisfaction with hosts, tourism industry officials should
reassess their marketing practices and focus more on the cultural differ-
ences between tourists and hosts and the impact of these differences on
the tourist cultural needs and experiences.
The book offers an explanation of the cultural influences on the inter-
personal relations between culturally different tourists and hosts. It pro-
vides suggestions for improving marketing strategies that attempt to
capture the culturally different tourist. By considering cultural differences
international tourism industry operators could use a combination of cul-
tural themes to capture the attention of the specific tourist markets. This
book also offers research opportunities, which might be useful to other
researchers working in related areas. More work is also required to verify
the results demonstrated in this book.
Several important conclusions can be drawn from the previous chap-
ters. The research presented in this book shows that cultural differences
do exist between various populations in the tourism industry. Cultural
differences between international tourists and the host community repre-
sent a very important assessment index of social interaction between
tourists and hosts, and satisfaction with this interaction, in a cross-cul-
tural tourism context. Cultural differences in values, rules of social inter-
action, and perceptions of service are very useful tourism constructs for
explaining tourist-host social interaction and determining tourist satisfac-

tion with this interaction. Cultural differences should form a foundation
for the development of new hypotheses and theories about tourist holiday
behaviour. Tourism marketers and managers should be concerned about
the influence of cultural differences on tourist behaviour and work
together to minimize their negative effects.
The conceptual model of the influence of cultural differences on tour-
ist-host interaction and satisfaction with this interaction can be used in
future tourist satisfaction research. This model is useful and effective
because it is based on the findings of an extensive literature review.
The model was tested using multivariate statistical techniques that are
highly appropriate for investigating a complex concept such as culture
and has proved to be very helpful in identifying cultural differences.
Knowledge of cultural differences should be used in identifying cultur-
ally different tourist markets and cultural differences should be used as
very useful constructs for international tourist market segmentation, tar-
geting, and positioning. The cultural backgrounds of international tour-
ists help to identify cultural profiles of the market segment and determine
promotional strategies that directly target a specific cultural market seg-
ment. Moreover, cultural differences should be used more often as seg-
mentation criteria to complement the traditional segmentation criteria
(geographic, socio-demographic, psychographic and behaviouristic)
that seem to be insufficient for segmenting culturally different inter-
national tourist markets.
Among the cultural criteria, cultural values, rules of behaviour, per-
ceptions, social interaction, and satisfaction appear to be very important.
These variables are useful in identifying specific profiles of the Asian
tourist market and for developing culture oriented marketing strategies.
The key cultural themes that are of great importance to Asian tourists
focus on developing close human relations with Asian tourists, proper
communication that complies with Asian rules of social etiquette, face
saving, avoiding direct and open expression of emotions and opinions,
socializing and developing an atmosphere of closeness and respect related
to a hierarchical social structure. In addition, of importance to Asian
tourists are a team spirit and group activities, courtesy and responsive-
ness, competence, support for family, and proper greetings.
The book also identifies the need for multicultural education and
training. Teaching cultural awareness is a professional obligation in the
Cross-Cultural Behaviour in Tourism
322

Conclusion
323
light of an internationalization of the tourism and hospitality industry
and increased interaction of people from diverse cultures. As the tourism
industry becomes more culturally diverse, future tourism and hospitality
managers should understand their customers from different cultural
backgrounds. All international holiday destinations catering for travel-
lers from culturally different countries must recognize the need for multi-
cultural awareness and skills training. Cross-cultural education is the
only way to get ahead in the world today and should start at school
and university institutions. Cross-cultural studies should be incorporated
in academic curricula. Cultural awareness, communication, and interper-
sonal skills are necessary, not only to develop ability and knowledge for
the provision of appropriate and culturally sensitive services to interna-
tional tourists, but also to avoid and/or reduce tensions and build mutual
understanding among international tourists and hosts with different cul-
tural values. Cross-cultural studies are essential to prepare students to
work in a multicultural environment. The tourism and hospitality indus-
try is an international service industry that relies on the provision of
services to culturally different customers. Although the number of ter-
tiary students studying foreign languages and cultures is constantly
increasing, there is a need for more subjects tailored to international
tourism industry needs, including foreign cultures such as Asian,
European or American cultures, cultural behaviours and expectations
in host cultures, cross- and intercultural interactions and communication,
and cultural confrontation. A variety of methods is available to teach
cross-cultural skills such as culture assimilation programs, simulation
games, subculture themes, critical incident methods, or case studies.
All tourism and hospitality industry employees should participate in
compulsory cross-cultural training. Several training programs are avail-
able that teach appropriate interpersonal skills and cultural awareness
skills. Jafari and Way (1994) suggested multicultural training that begins
with language and cross-cultural communication training. They sug-
gested a language training program that also includes culture, symbols,
and understanding cultural expectations of foreign guests. Earley (1987)
suggested intercultural communication training that develops the indivi-
dual’s self-awareness and the ability to recognize cultural differences in
personal values and behaviour. Certo (1976) recommended the cross-
cultural orientation programs that teach effective ways of interacting
and avoiding interpersonal misunderstanding. Harris and Moran (1983)
recommended action learning that teaches cross-cultural effectiveness in a
host country and utilizes local trainers. Cross-cultural training programs

help to understand one’s own culture, the culture of the tourist, appreci-
ate the differences between cultures and, as a result, accept culturally
different tourist markets. Generally speaking, such training teaches the
provider to respect and communicate with culturally different tourists. As
such, the international tourist would develop a feeling of the hosts’
understanding of the tourists’ cultural aspects and the willingness of
hosts to cater for the tourist in a professional manner. Such training
would help to guarantee every destination’s success in the international
tourist marketplace.
However, many training methods developed in the west might not be
appropriate for other cultural groups. For example, role-playing, which is
perceived as a highly effective method in developing interpersonal skills in
the west, might not be effective in high risk avoidance cultures where
members have difficulty agreeing to take up the roles assigned, and
actively participate (Howe et al., 1990). Therefore, cultural training
should also be targeted at the cultural audience in a manner sensitive
to particular cultural attitudes.
Additional web-based support material and references
The extensive referencing in this book has meant that the huge list of
references needed for the reference list cannot be published with this
book. Consequently, only a shortened list of major references is pub-
lished and the remaining references are located on the publisher’s website.
Other support material contained on the website includes:
& a detailed chapter on hypothesis testing including recommended
methods& a detailed set of tables for the Mann-Whitney U-test analysis used in
Chapter 9& a glossary of terms relevant to the book.
Cross-Cultural Behaviour in Tourism
324

References
(The list given below is for the major references cited within the book. A
more comprehensive list of references can be found on our website:
www.bh.com/companion/0750656689)
Adler, N. (1986) International Dimensions of Organizational Behavior.
Boston, MA: Kent Publishing Company.
Adler, P. S. (1975) The transition experience: an alternative view of cul-
ture shock. Journal of Humanistic Psychology 15(4): 13–23.
Allport, G. W. (1954/1979) The Nature of Prejudice. New York:
Doubleday Anchor; Reading, MA: Addison-Wesley Publishing.
Allport, G. W., Vernon, P. E. and Lindzey, G. (1951/1960) A Study of
Values: A Scale for Measuring the Dominant Interest in Personality.
Boston, MA: Houghton Mifflin Co.
Argyle, M. (1967/1978) The Psychology of Interpersonal Behaviour.
Harmondsworth: Penguin Books Ltd.
Argyle, M. (1972) Nonverbal communication in human social interac-
tion. In Hinde, R. (ed.) Nonverbal Communication. London: Royal
Society and Cambridge University Press.
Argyle, M. (1975) Bodily Communication. London: Methuen.
Argyle, M. (1981) Intercultural communication. In Argyle, M. (ed.)
Social Skills and Work. London: Methuen.
Argyle, M. (1982) Studies in cross-cultural interaction: intercultural com-
munication. In Bochner, S. (ed.) Cultures in Contact: Studies in Cross-
Cultural Interaction. Oxford: Pergamon Press.
Argyle, M. (1986) Rules for social relationships in four cultures.
Australian Journal of Psychology 38(3): 309–318.
Argyle, M. and Cook, M. (1976) Gaze and Mutual Gaze. Cambridge,
MA: Cambridge University Press.

Cross-Cultural Behaviour in Tourism
326
Argyle, M. and Henderson, M. (1984) The rules of friendship. Journal of
Personal and Social Relationships 1: 211–237.
Argyle, M. and Henderson, M. (1985a) The Anatomy of Relationships:
And the Rules and Skills Needed to Manage Them Successfully.
London: Heinemann.
Argyle, M. and Henderson, M. (1985b) The rules of relationships. In
Duck, S. and Perlman, D. (eds) Understanding Personal Relationships.
London and Beverly Hills, CA: Sage Publications, pp. 63–84.
Argyle, M., Furnham, A. and Graham, J. (1981) Social Situations.
Cambridge: Cambridge University Press.
Argyle, M., Graham, J. and White, P. (1979) The rules of different situa-
tion. New Zealand Psychologist 8: 13–22.
Argyle, M., Henderson, M. and Furnham, A. (1985a). In Argyle, M.
(1988) Bodily Communication. London: International Universities
Press, pp. 184.
Argyle, M., Henderson, M. and Furnham, A. (1985b) The rules of social
relationships. British Journal of Social Psychology 24: 125–139.
Argyle, M., Henderson, M., Bond, M. H., Iizuka, Y. and Contarello, A.
(1986) Cross-cultural variations in relationship rules. International
Journal of Psychology 21: 287–315.
Befu, H. (1971) Japan: An Anthropological Introduction. New York:
Harper and Row.
Benedict, R. (1946/1967) The Chrysanthemum and the Sword. Boston,
MA: Houghton Mifflin.
Benedict, R. (1974) The Chrysanthemum and the Sword: Patterns of
Japanese Culture. Vermont and Tokyo: Charles E. Tuttle Company
Inc. of Rutland.
Black, J. S. and Mendenhall, M. (1989) A practical but theory-based
framework for selecting cross-cultural training methods. Human
Resource Management 28(4): 511–539.
Bochner, S. (1982) Cultures in Contact: Studies in Cross-Cultural
Interaction. Oxford; New York: Pergamon Press.
Bond, M. and Chinese Culture Connection (1987) Chinese values and the
search for culture-free dimensions of culture. Journal of Cross-Cultural
Psychology 18(2): 143–174.
Brislin, R. W. (1981) Cross-Cultural Encounters: Face to Face Interaction.
New York: Pergamon Press.
Chinese Culture Connection (1987) Chinese values and the search for
culture-free dimensions of culture. Cross-Cultural Psychology 18(2):
143–174.

References
327
Cole, M. and Scribner, S. (1974) Culture and Thought. New York: John
Wiley and Sons.
Cook, M. (1979) Perceiving Others. London: Methuen.
Cook, S. W. (1962) The systematic analysis of socially significant events:
a strategy for social research. Journal of Social Issues 18(2): 66–84.
Cook, S. W. and Sellitz, C. (1955) Some factors which influence the
attitudinal outcomes of personal contact. International Sociological
Bulletin 7: 51–58.
Cronen, V. and Shuter, R. (1983) Forming intercultural bonds. In
Gudykunst, W. (ed.) Intercultural Communication Theory: Current
Perspectives. Beverley Hills, CA: Sage Publications.
Damen, L. (1987) Culture Learning: The Fifth Dimension in the Language
Classroom. Second Language Professional Library. Reading, MA:
Addison-Wesley Publishing.
Dann, G. (1978) Tourist satisfaction: a highly complex variable. Annals
of Tourism Research 5(4): 440–443.
Dodd, C. (1995/1998) Dynamics of Intercultural Communication. Boston,
MA: McGraw-Hill.
Feather, N. T. (1980a) Similarity of values systems within the same
nation: evidence from Australia and Papua New Guinea. Australian
Journal of Psychology 32(1): 17–30.
Feather, N. T. (1980b) Value systems and social interaction: a field study
in a newly independent nation. Journal of Applied Social Psychology 10
(1): 1–19
Feather, N. T. (1980c) The study of values. Journal of Asia-Pacific and
World Perspectives 3: 3–13.
Feather, N. T. and Peay, E. R. (1975) The structure of terminal and
instrumental values: dimensions and clusters. Australian Journal of
Psychology 27: 151–164.
Forgas, J. P. (1985) Interpersonal Behavior: The Psychology of Social
Interaction. Rusheutters Bay: Pergamon Press.
Furnham, A. and Bochner, S. (1986) Culture Shock: Psychological
Reactions to Unfamiliar Environments. New York: Methuen.
Goodenough, W. H. (1957) Cultural anthropology and linguistics. In
Keesing, R. M. (1981) Cultural Anthropology-A Contemporary
Perspective. New York: Holt, Rinehart and Winston.
Goodenough, W. H. (1961) Comment on cultural evolution. Daedalus 90:
521–528.
Goodenough, W. H. (1971) Culture, Language and Society. Anthropology
7. Reading, MA: Addison-Wesley Publishing.

Cross-Cultural Behaviour in Tourism
328
Gordon, L. V. (1960) Survey of Interpersonal Values. Chicago: Science
Research Associates.
Gronroos, C. (1982) A service quality model and its marketing implica-
tions. European Journal of Marketing 18(4): 36–44.
Gudykunst, W. B. (1988) Theories in Intercultural Communication.
Newbury Park, CA: Sage Publications.
Gudykunst, W. B. and Kim, Y. Y. (1984) Communicating with Strangers:
An Approach to Intercultural Communication. Reading, MA: Addison-
Wesley Publishing.
Gudykunst, W. B. and Kim, Y. Y. (1997) Communicating with Strangers:
An Approach to Intercultural Communication. 3rd edn. Boston, MA;
New York, NY: McGraw-Hill.
Gudykunst, W. B. and Ting-Toomey, S. (1988) Culture and Interpersonal
Communication. Newbury Park, CA: Sage Publications.
Gullahorn, J. E. and Gullahorn, J. T. (1963) An extension of the U-curve
hypothesis. Journal of Social Issues 19(3): 33–47.
Hall, E. T. (1959/1973) The Silent Language. Garden City, New York:
Doubleday and Fawcett Company, Anchor Press.
Hall, E. T. (1965)TheSilent Language.Greenwich, CT: FawcettCompany.
Hall, E. T. (1966) The Hidden Dimension. Garden City, New York:
Doubleday and Fawcett Company.
Hall, E. T. (1976/1977) Beyond Culture. New York: Doubleday, Anchor
Press.
Hall, E. T. (1983) The Dance Of Life: The Other Dimensions of Time.
New York: Doubledy.
Hall, E. T. and Hall, M. R. (1987) Hidden Differences: Doing Business
with the Japanese. Garden City, New York: Anchor Press/Doubleday.
Hampden-Turner, C. and Trompenaars, F. (1993) Seven Cultures of
Capitalism: Value Systems for Creating Wealth in the United States,
Britain, Japan, Germany, France, Sweden and the Netherlands. New
York: Doubleday.
Hargie, O. (1986) A Handbook of Communication Skills. London:
Routledge.
Harre, R. (1974) Some remarks on ‘rule’ as a scientific concept. In
Mitschel, T. (ed.) Understanding Other Persons. Oxford: Blackwell.
Harre, R. and Secord, P. (1972) The Explanation of Social Behavior.
Oxford: Basil Blackwell.
Harris, P. and Moran, R. (1979/1983/1996) Managing Cultural
Differences. Houston, Texas: Gulf Publishing Company.
Hofstede, G. (1980) Culture’s Consequences: International Differences in
Work-Related Values. Beverly Hills, CA: Sage Publications.

References
329
Hofstede, G. (1984) Culture’s Consequences: International Differences in
Work-related Values. Abridged edition, Beverly Hills CA: Sage
Publications.
Hofstede, G. (2001) Culture’s Consequences: Comparing Values,
Behaviors, Institutions, and Organizations Across Nations. 2nd ed.
Thousand Oaks: Sage Publications.
Hughes, K. (1991) Tourist satisfaction: a guided cultural tour in North
Queensland. Australian Psychologist 26(3): 166–171.
Hunt, H. K. (1991) Consumer satisfaction, dissatisfaction, and complain-
ing behavior. Journal of Social Issues 47(1): 107–117.
Joreskog, K. and Sorbom, D. (1989a) LISREL 7: User’s Reference Guide.
Scientific Software Inc., Mooresville.
Joreskog, K. G. and Sorbom, D. (1989b) LISREL 7: A Guide to the
Program and Applications. 2nd ed. Chicago Ill: SPSS Inc.
Kamal, A. A. and Maruyama, G. (1990) Cross-cultural contact and
attitudes of Qatari students in the United States. International
Journal of Intercultural Relations 14: 123–134.
Keesing, R. M. (1974) Theories of culture. Annual Review of
Anthropology 3: 73–97.
Kim, Y. Y. (1988) Communication and Cross-Cultural Adaptation: An
Integrative Theory. Intercommunication Series. Philadelphia:
Multilingual Matters Ltd.
Kim, Y. Y. and Gudykunst, W. B. (1988) Theories in Intercultural
Communication. International And Intercultural Communication
Annual 12. Newbury Park, CA: Sage Publications.
Kluckhohn, C. (1944) Mirror For Man. New York: McGraw-Hill.
Kluckhohn, C. (1951a) The study of culture. In Lerner, D. and Lasswell,
H. D. (eds) The Policy Sciences. Stanford, CA: Stanford University
Press.
Kluckhohn, C. (1951b) Values and value orientations in the theory of
action. In Parsons, T. and Shils, E. A. (eds) Toward a General Theory
of Action. Cambridge, MA: Harvard University Press, pp. 388–433.
Kluckhohn, C. and Kelly, W. H. (1945) The concept of culture. In
Linton, R. (ed.) The Science of Man in the World of Crisis. New
York: Columbia University Press, pp. 78–106.
Kluckhohn, F. R. and Strodtbeck, F. L. (1961) Variations in Value
Orientations. New York: Harper and Row.
Kroeber, A. and Kluckhohn, C. (1952) Culture: A Critical Review of
Concepts and Definition. Papers of the Peabody Museum of
American Archaeology and Ethnology, Harvard University Press
47(1): 223. New York: Random House.

Cross-Cultural Behaviour in Tourism
330
Kroeber, A. and Kluckhohn, C. (1985) Culture: A Critical Review of
Concepts and Definitions. New York: Random House.
Kroeber, A. L. and Parsons, T. (1958) The concepts of culture and of
social system. American Sociological Review 23: 582–593.
Landis, D. and Brislin, R. W. (1983) Handbook of Intercultural Training 2
and 3: Issues in Training Methodology. New York: Pergamon Press.
Lehtinen, U. and Lehtinen, J. R. (1982) Service Quality: A Study of
Quality Dimensions. Working Paper, Service Management, Institute
Helsinki, Finland.
Lovelock, C. H. (1991) Services Marketing. 2nd ed. New Jersey: Prentice
Hall.
Lustig, M. and Koester, J. (1993/1999) Intercultural Competence: Inter-
personal Communication Across Cultures. New York: Harper Collins.
Maddox, R. N. (1985) Measuring satisfaction with tourism. Journal of
Travel Research 23(3): 2–5.
Marsh, N. R. and Henshall, B. D. (1987) Planning better tourism: the
strategic importance of tourist-resident expectations and interactions.
Tourism Recreation Research 12(2): 47–54.
Maznewski, M. (1994) Synergy and Performance in Multi-cultural Teams.
PhD thesis University of Western Ontario.
Morris, C. W. (1956) Varieties of Human Value. Chicago: University of
Chicago Press.
Nakane, C. (1973) Japanese Society. New York: Penguin.
Oberg, K. (1960) Culture shock: adjustment to new cultural environ-
ments. Practical Anthropology 7: 177–182.
Olander, F. (1977) Consumer satisfaction – a sceptic’s view. In
Hunt, H. K. (ed) Conceptualization and Measurement of Consumer
Satisfaction and Dissatisfaction. Cambridge, MA: Marketing Science
Institute, pp. 409–452.
Parasuraman, A., Zeithaml, V. A. and Berry, L. L. (1985) A conceptual
model of service quality and its implications for future research.
Journal of Marketing 49: 41–50.
Parasuraman, A., Zeithaml, V. A. and Berry, L. L. (1986) SERVQUAL:
A Multiple-Scale Item for Measuring Consumer Perceptions of Service
Quality. Cambridge, MA: Marketing Institute.
Parasuraman, A., Zeithaml, V. and Berry, L. L. (1988) SERVQUAL: a
multiple-scale item for measuring consumer perceptions of service
quality. Journal of Retailing 64: 12–40.
Parasuraman, A., Zeithaml, V. and Berry, L. L. (1990) An Empirical
Examination of Relationships In an Extended Service Quality Model.
Cambridge, MA: Marketing Science Institute.

References
331
Parasuraman, A., Berry, L. L. and Zeithaml, V. (1991) Refinement and
reassessment of the SERVQUAL scale. Journal of Retailing 67(1):
39–48.
Parsons, T. (1951) The Social System. Glencoe, Ill: Free Press.
Pearce, P. L. (1980a) Favorability-satisfaction model of tourists’ evalua-
tions. Journal of Travel Research 14(1): 13–17.
Pearce, P. L. (1980b) Tourism’s human conflicts. Annals of Tourism
Research 7(1): 21–134.
Pearce, P. L. (1982b) The Social Psychology of Tourist Behaviour.
International Series in Experimental Social Psychology. Vol. 3.
Oxford; New York: Pergamon Press.
Pearce, P. L. (1982c) Tourists and their hosts: some social and psycho-
logical effects of intercultural contact. In Bochner, S. (ed.) (1982)
Cultures in Contact: Studies in Cross-Cultural Interaction. Oxford;
New York: Pergamon Press.
Pearce, P. L. (1988) The Ulysses Factor: Evaluating Visitors in Tourist
Settings. New York: Springer Verlag.
Pearce, P. and Bochner, S. (1982) Tourists and hosts: some social and
psychological effects of intercultural contact. In Bochner, S. (ed)
Cultures in Contact: Studies in Cross-Cultural Interaction.
International Series Experimental Psychology Vol. 1. Oxford:
Pergamon Press, pp. 199–221.
Pitts, R. and Woodside, A. (1986) Personal values and travel decisions.
Journal of Travel Research 25(1): 20–25.
Pizam, A. and Calantone, R. (1987) Beyond psychographics – values as
determinants of tourist behavior. International Journal of Hospitality
Management 6(3): 177–181.
Porter, R. E. and Samovar, L. A. (1988) Approaching intercultural com-
munication. In Samovar, L. A. and Porter, R. E. (eds) Intercultural
Communication: A Reader. 5th ed. Belmont, CA: Wadsworth
Publishing Company.
Reisinger, Y. (1992b) Tourist-host contact as a part of cultural tourism.
World Leisure and Recreation 36(2): 24–28.
Reisinger, Y. and Turner, L. (1999c) Structural equation modelling with
LISREL: application in tourism. Tourism Management 20(1): 71–88.
Reisinger, Y. and Turner, L. (2002a) Cultural differences between Asian
tourist markets and Australian hosts Part 1. Journal of Travel
Research 40(3): 295–315.
Reisinger, Y. and Turner, L. (2002b) Cultural differences between Asian
tourist markets and Australian hosts Part 2. Journal of Travel
Research 40(4): 374–384.

Cross-Cultural Behaviour in Tourism
332
Robinson, G. L. N. and Nemetz, L. (1988) Cross-Cultural Understanding.
UK: Prentice Hall International.
Robinson, J. and Preston, J. (1976) Equal status contact and modifica-
tion of racial prejudice: re-examination of the contact hypothesis.
Social Forces 54: 911–924.
Rokeach, M. (1968a) A theory of organization and change within value-
attitude systems. Journal of Social Issues 24: 13–33.
Rokeach, M. (1968b) Beliefs, Attitudes and Values. San Francisco:
Jossey-Bass.
Rokeach, M. (1973) The Nature of Human Values. New York: Free Press.
Rokeach, M. (1979) Understanding Human Values: Individual and
Societal. New York: Free Press.
Samovar, L. A. and Porter, R. E. (1988) Intercultural Communication: A
Reader. 5th ed. Belmont, CA: Wadsworth Publishing Company.
Samovar, L. A. and Porter, R. E. (1991) Communication Between
Cultures. Belmont, CA: Wadsworth Publishing Company.
Samovar, L. A., Porter, R. E. and Jain, N. C. (1981) Understanding
Intercultural Communication. Belmont, CA: Wadsworth Publishing
Company.
Samovar, L., Porter, R. and Stefani, L. (1998) Communication Between
Cultures. Belmont, CA: Wadsworth Publishing Company.
Schein, E. (1992) Organizational Culture and Leadership. 2nd ed. San
Francisco, CA: Jossey-Bass Publishers.
Schneider, D. (1976) Notes toward a theory of culture. In Basso, K. and
Selby, H. (eds) Meaning in Anthropology. Albuquerque, New Mexico:
University of New Mexico Press, pp. 197–220.
Schneider, S. and Barsoux, J.-L. (1997) Managing Across Cultures. New
York: Prentice Hall.
Scollon, R. and Scollon, S. (1995) Intercultural Communication: A
Discourse Approach. Cambridge, MA: Blackwell.
Shostack, G. L. (1985) Planning the service encounter. In Czepiel, J. A.
Solomon, M. R. and Surprenant, C. F. (eds) The Service Encounter.
Lexington, MA: Lexington Books, pp. 243–254.
Smith, V. L. (1978) Hosts and Guests. Oxford: Blackwell.
Smith, V. L. (1989) Hosts and Guests: The Anthropology of Tourism. 2nd
ed. Philadelphia: University of Pennsylvania Press.
Sutton, W. A. (1967) Travel and understanding: notes on the social
structure of touring. International Journal of Comparative Sociology
8(2): 218–223.

References
333
Swan, J. E. and Mercer, A. A. (1981) Consumer Satisfaction as a Function
of Equity and Disconfirmation. Unpublished Paper, University of
Alabama in Birmingham, Alabama.
Taft, R. (1977) Coping with unfamiliar cultures. In Warren, N. (ed.)
Studies in Cross-Cultural Psychology 1. London: Academic Press.
Taft, R. (1979) Effect of a planned intercultural experience on the atti-
tudes and behavior of the participants. International Journal of
Intercultural Relations 3(2): 187–197.
Tajfel, H. (1969) Social and cultural factors in perception. In Lindzey, G.
and Aronson, E. (eds) The Handbook of Social Psychology. Reading,
MA: Addison-Wesley Publishing.
Triandis, H. C. (1972) The Analysis of Subjective Culture. New York:
Wiley-Interscience.
Triandis, H. C. (1977a) Subjective culture and interpersonal relations
across cultures. In Loeb-Adler, L. (ed.) Issues in Cross-Cultural
Research. Annals of the New York Academy of Sciences 285: 418–434.
Triandis, H. C. (1977b) Interpersonal Behavior. Monterey, CA: Brooks/
Cole Publishing Company.
Triandis, H. C. (1994) Culture and Social Behavior. New York: McGraw-
Hill.
Triandis, H. C. (1995) Individualism and Collectivism: New Directions in
Social Psychology. Boulder, CO: Westview Press.
Triandis, H. C. and Triandis, L. M. (1960) Race, social class, religion,
and nationality as determinants of social distance. Journal of
Abnormal and Social Psychology 61: 110–118.
Triandis, H. C. and Vassiliou, V. A. (1967) Frequency of contact and
stereotyping. Journal of Personality and Social Psychology 7: 316–328.
Triandis, H. C., Vassiliou, V., Vassiliou, G., Tanaka, Y. and
Shanmugam, A. V. (1972b) The Analysis of Subjective Culture. New
York: John Wiley and Sons.
Trompenaars, F. (1984) The Organisation of Meaning and the Meaning of
Organisation a comparative study on the conceptions and organisational
structure in different cultures. PhD thesis, University of Pennsylvania.
Trompenaars, F. (1993/1997) Riding the Waves of Culture: Understanding
Cultural Diversity in Business. London: Brealey.
Turner, L. and Reisinger, Y. (1999) Importance and expectations
of destination attributes for Japanese tourists to Hawaii and the
Gold Coast compared. Asia Pacific Journal of Tourism Research
4(2): 1–18.

Cross-Cultural Behaviour in Tourism
334
Valle, V. A. and Wallendorf, M. (1977) Consumers’ attributions of the
causes of their product satisfaction and dissatisfaction. In Day, R. L.
(ed.) Consumer Satisfaction, Dissatisfaction and Complaining
Behaviour. Bloomington: Indiana.
Van Raaij, W. F. and Francken, D. A. (1984) Vacation decisions, activ-
ities, and satisfaction. Annals of Tourism Research 11(1): 101–112.
Vassiliou, V., Triandis, H. C., Vassiliou, G. and McGuire, H. (1972)
Interpersonal contact and stereotyping. In Triandis, H. C. and
Vassiliou, V., Vassiliou, G., Tanaka, Y. and Shanmugam, A. V.
(eds) The Analysis of Subjective Culture. New York: John Wiley and
Sons.
Wei, L., Crompton, J. L. and Reid, L. M. (1989) Cultural conflicts:
experiences of US visitors to China. Tourism Management 10(4):
322–332.
Whorf, B. L. (1956) Language, Thought, and Reality, Selected Writings.
Cambridge, MA, Cambridge Technology Press of Massachusetts
Institute of Technology.
Zavalloni, M. (1980) Values. In Triandis, H. C. and Brislin, R. W. (eds)
Handbook of Cross-Cultural Psychology: Social Psychology 5. Boston,
MA: Allyn and Bacon.

Index
Absolute fit 267–269
Acculturation 17, 60
Activity orientation 99
Affect displays 18
AGFI 269, 306–308
Apology 98
Argumentation 19
Artifactual code system 19
Attitudes 49, 79–80, 148, 166–167
Attribution 168, 178–179
Authority 104
Binary matrix 229
Bivariate model 251–252
Body language 18
Chi-square 262, 267, 270, 275, 306
Collateral relationships 96, 99
Common variance 218
Communality 215, 226
Complaints 194–195
Compliments 113
Covariance matrix 228–229, 258
Cross-cultural training 323–324
Cultural differences 16–21, 22,
29–30, 52–53, 76, 87, 104–111,
311, 321–322
rules of social relationships
141–145
travel behaviour 138–139, 316
Cultural orientations 88–97
Cultural patterns 23, 155, 295–296
Cultural problems 21
Cultural variability 105–111, 116–119,
142–143
expectation 232–240
interpretation 291–304
satisfaction 180–181, 232–240
service quality 183–184, 190
Culture
characteristics of 14
context 101–103
definition 5–11
purpose 12–13
Culture fatigue 58
Culture shock 56–63
intensity 61
language shock 58
stages 59–63
symptoms 57–58
Dermal code system 19
Dimensions 22–26, 88–92, 289–291
Dominant culture 14–16, 26
Egalitarian cultures 100
Eigenvalue 212, 214, 223–224, 226,
228
Enculturation 17
Ethnicity 15
Ethnocentrism 172
Factor analysis
definition 202, 217–219
image 228
Fitted residuals 273

Fixed parameters 257–258
Formal cultures 99
Formality 115
Free parameters 258
Friendship 104
GFI 269, 306–308
Gift giving 294, 302
Harmony 97–98, 121, 293, 297
Hierarchical cultures 100, 121, 300
Host
definition 38, 286
Japanese 122
Image 168
Incremental fit 267, 269–270
Individualism/Collectivism 106–107,
111–112, 119, 125
Individualistic relationships 96, 99,
112
Industry culture 11
Informal cultures 99
Instrumental values 80, 83
Intercultural communication 18
Intercultural interaction 26–28, 55–56
Interculturalness 52–53
Kaiser-Meyer-Olkin test 204–205
Kinesics 18
Language 102, 303
Linear relationships 96, 99
LISREL 250–266
Loadings 212, 215
Mann-Whitney U-test 288
Masculinity/Femininity, 107–108,
111, 125
Materialism 123
Measurement model 255, 270
Model identification 259–262
Modification indices 275–276
Monochronic culture 104
Morphology 18
Multi-collinearity 261, 271
National culture 11
Negative perceptions 156, 165–166
Non-verbal communication 54, 155,
304
Non-recursive model 251, 253
Norm of reciprocity 137
Norms of justice 137
Offending estimates 265–266
Orthogonal 207
Parsimonious fit 270–271
Path diagram 256–257
Pattern loading 225–226
Perceptions 50, 148, 314– 315
definition 149
distortion 156
and culture 152–154
importance 150
measurement 157–158
nationality 163–164
satisfaction 177
service 185, 189–192, 298
social interactions 113
types 151
Personal space 102–103
Phonology 18
Polychronic culture 104
Positive perceptions 164–165
Power distance 105–106, 125, 293
Pragmatics 18
Principal components
definition 202–203
extracting 210–214
matrix modes 230–231
purpose 203–204
segments 206
Q-plot 274
Race 14
Index
336

Recursive model 251–252
Relationship rules 135
Reverse shock 60–61
RMSR 269, 306–308
Rotation 221–227
oblique 224–226
orthogonal 223–224
principal components 227
varimax 223
Rules of social behaviour 46, 55–56,
136–137, 139–141
definition 133
measurement 141
types 134
Satisfaction 152, 295, 317
definition 176–180
measurement 192–196
Save face 97, 294, 301
Scores 215–216, 227–228
Scree test 224
Semantics 18
Service 20, 303
attributes 184
quality 183–187, 191
satisfaction 181–182
Simple structure 202, 222, 226
Situation rules 135
SMC 271, 306–308
Social contact
concept 35
components 36
contact hypothesis 39–43
co-presence 35
focused 35–36
in tourism 37
measurement 63–64
Specific rules 144–145
Sphericity test 204
Standard errors 273
Stereotyping 169–171
Structural equation modelling
assumptions 264–265
definition 244
objective 244–246
popularity 247
stages 254–277
Structure loading 225–226
Subculture 14–16
Syntactics 18
Terminal values 81, 83
Time 104–105, 117, 119, 296, 299
Touch 115–116
Tourism culture 10
Tourist
definition 37–38
Tourist–host contact 38–39, 42, 54
determinants 43–51
measurement 63–68
perceptions 152
studies 69–70
Transition shock 58
Truth 118
t-Values 272–273
U-curve 59–60, 63
Uncertainty avoidance 106, 125
Unique variance 218
Universal rules 143–144
Value analysis 85
Value conflict 76–77
Value orientation 77–78
Value surveys 83–84
Values 48, 50
Asian 120–122
Australian 127–129
definition 74–77
measurement 81–86, 114–115
satisfaction 192
types 80–81
US and European 123–127
W-curve 59–60, 63
Web-based support material 324
Z scores 216
Index
337