
Earth System Processes - · PDF fileEarth System Processes ... We experience weather every...
19
Earth System Processes Kevin Trenberth Volume 1, The Earth system: physical and chemical dimensions of global environmental change, pp 13–30 Edited by Dr Michael C MacCracken and Dr John S Perry in Encyclopedia of Global Environmental Change (ISBN 0-471-97796-9) Editor-in-Chief Ted Munn John Wiley & Sons, Ltd, Chichester, 2002
Transcript of Earth System Processes - · PDF fileEarth System Processes ... We experience weather every...

Earth System Processes
Kevin Trenberth
Volume 1, The Earth system: physical and chemical dimensions of global environmental change,pp 13–30
Edited by
Dr Michael C MacCracken and Dr John S Perry
in
Encyclopedia of Global Environmental Change(ISBN 0-471-97796-9)
Editor-in-Chief
Ted Munn
John Wiley & Sons, Ltd, Chichester, 2002
Earth System Processes
KEVIN TRENBERTH
National Center for Atmospheric Research/Climate Analysis Section, Boulder, CO, USA
We experience weather every day in all its incredible variety. Most of the time it is familiar, yet it never repeatsexactly. We also experience the changing seasons and associated kinds of weather. In summer, fine sunny daysmay be interrupted by outbreaks of rain and thunderstorms. Outside of the tropics as winter approaches, the daysget shorter, it gets colder and the weather typically fluctuates from warmer and fine spells to cooler and rainyor maybe snowy conditions. In the tropics, the seasonal variations are more often experienced as monsoonalfluctuations between a wet season and a somewhat longer dry season. These seasonal changes are the largestclimate changes we experience at any given location. Because they arise in a well understood way from theregular orbit of the Earth around the Sun, we expect them, and we look forward to them. We plan summervacations and winter ski trips accordingly. Farmers plan their crops and harvests around the seasonal cycle.By comparison, variations in the average weather from one year to the next are quite modest, and longer-term changes in climate occurring over decades or human lifetimes may be even smaller. Nevertheless, thesevariations can be very disruptive and costly if we do not expect them.
Climate changes, lasting decades to millennia, have occurred in the past as a result of various naturalinfluences. Interannual variations are also an important ingredient of climate and can arise through, for example,interactions between the atmosphere and the oceans, as is the case with El Nino.
This article discusses weather and climate variations in the context of the Earth system as a whole, andprovides a basis for understanding the reasons why climate may vary, and how these variations may be manifestedin terms of weather. The main focus of this article is on the atmosphere, which is the most variable componentof the Earth system; it is also where we live and it provides the air we breathe. But the atmosphere interactswith the oceans, the land surface and its vegetation, and with the other components of the climate system, sothose too are important, even from this perspective. Their role in climate is also addressed in this article.
Like the oceans, the atmosphere is a global commons (Soroos, 1997) (see Commons, Tragedy of the,Volume 5). It is globally connected and air that is over one nation can easily lie over another on the nextcontinent a day later. Recent attempts by manned balloons to circumnavigate the globe have dramatically shownhow the winds can carry a balloon half way around the world in a week or less and that air currents can oftentake the balloon in unwanted directions. So the atmosphere belongs to no one nation; rather all nations mayuse it for their own purposes (such as discharging pollution into it) and thus it is also subject to abuse and thephenomenon known as the “tragedy of the commons” (Hardin, 1968) in which the best interests of an individualor individual nation may conflict with the health of the commons itself. Human influences on climate change,often referred to as “global warming,” are therefore also discussed.
The Earth System includes many other important processes and phenomena that are covered elsewhere in thisEncyclopedia. Even in the atmosphere alone, environmental problems include ozone depletion and the “ozonehole,” acid rain, air quality and pollution, and, a few decades ago, radioactivity and atomic bomb test debris.Other problems exist in the oceans and on land, such as biodiversity, deforestation, desertification, exploitationof water resources and fisheries, and so on. Many of these environmental problems can be exacerbated by climatechange, so that it is the intersection of these problems and climate change that will make for major challengesin the years ahead.
THE EARTH AND CLIMATE SYSTEM
Our planet orbits the Sun once per year at an averagedistance of 1.50 ð 1011 m. Looking directly at the Sun,
the Earth receives an average radiation of 1368 W m�2
at this distance. This value is referred to as the totalsolar irradiance; this value used to be called the “solarconstant” even though it does vary by small amounts with

2 THE EARTH SYSTEM: PHYSICAL AND CHEMICAL DIMENSIONS OF GLOBAL ENVIRONMENTAL CHANGE
the sunspot cycle and related changes on the Sun (see SolarIrradiance and Climate, Volume 1). The Earth’s shape isclose to that of an oblate spheroid, with an average radiusof 6371 km, but it varies from 6378 km at the equator to6357 km at the poles. The Earth’s daily rotation is aboutan axis with a current tilt, relative to the ecliptic plane, of23.5°. The Earth’s annual orbit around the Sun is slightlyelliptical, presently bringing the Earth closest to the Sun onJanuary 3rd (called perihelion). The rotation gives rise tothe seasons because the Northern Hemisphere (NH) pointsmore toward the Sun in June while it is the SouthernHemisphere’s (SH) turn in late December.
The Earth also turns on its axis once per day with anangular velocity of 7.292 ð 10�5 s�1. This rotation gives usthe day–night cycle. A consequence of the Earth’s roughlyspherical shape and the rotation is that the average solarradiation received at the top of the Earth’s atmosphere is thesolar constant divided by 4, which is the ratio of the Earth’ssurface area (4pa2, where a is the mean radius) to that ofthe cross-section (pa2). On timescales of tens of thousandsof years, the Earth’s orbit slowly changes, the shape of theorbit is altered, the tilt changes, and the Earth precesses onits axis like a rotating top, all of which combine to alterthe latitudinal and seasonal distribution of solar radiationreceived by the Earth (see Orbital Variations, Volume 1).These variations have been associated with the Earth’sglacial cycling (see Milankovitch, Milutin, Volume 1).
The rotation of the Earth provides a centrifugal forceoutward, away from the axis of rotation. This force isgreatest on the equator at the Earth’s surface. Meanwhile,the equatorial bulge in the Earth’s shape, which presumablyarises from the rotation, provides a greater gravitationalattraction than at high latitudes. Thus, it is not a coincidencethat the effective net gravity at the surface, which is acombination of the actual gravitational attraction and thecentrifugal force, is almost constant and at right angles tothe surface, thereby allowing the Earth to be treated as asphere for many purposes.
The Earth System can be altered by effects or influencesfrom outside the planet, usually regarded as externallyimposed. Most important are the Sun and its output, theEarth’s rotation rate, Sun–Earth geometry and the slowlychanging orbit, the physical make up of the Earth systemsuch as the distribution of land and ocean, the geographicfeatures on the land, the ocean bottom topography andbasin configurations, and the mass and basic compositionof the atmosphere and ocean. These components determinethe mean climate, which can be affected by variationsdue to these natural causes. For example, a change in theaverage net radiation at the top of the atmosphere due toperturbations in the incident solar radiation or the emergentinfrared radiation leads to a change in heating. Changes inthe net incident radiation energy at the Earth’s surface canoccur from the changes internal to the Sun or, for example,
from changes in atmospheric composition such as may arisefrom natural events like volcanoes, which can create acloud of debris that blocks a portion of the incoming solarradiation. Other forcings that might be regarded as externalinclude those arising as a result of human activities.
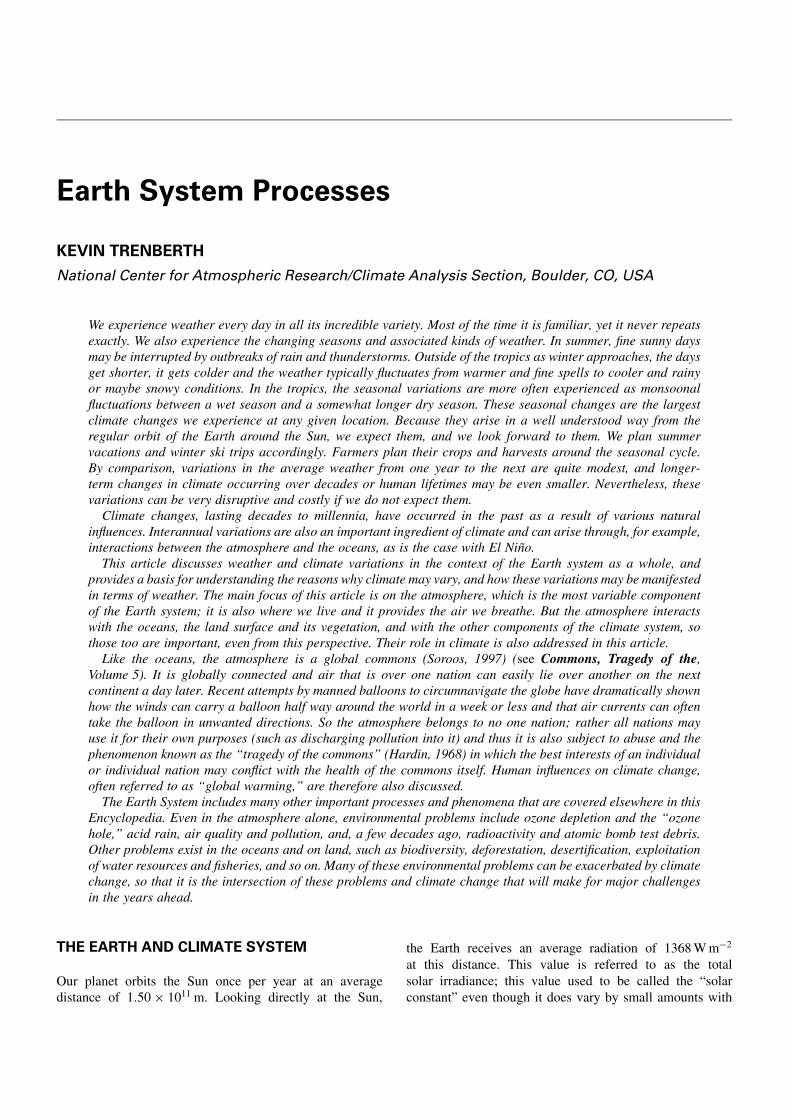
The internal interactive components in the climate sys-tem (Figure 1) include the atmosphere, the oceans, seaice, the land, snow cover, land ice, and fresh water reser-voirs. The greatest variations in the composition of theatmosphere involve water in various phases, which includewater vapor, clouds of liquid water, ice crystal clouds, andrain, snow, and hail (see Hydrologic Cycle, Volume 1).However, other constituents of the atmosphere and theoceans can also change, thereby bringing considerations ofatmospheric chemistry, marine biogeochemistry, and landsurface exchanges into climate change.
The atmosphere is the most volatile part of the climatesystem; for example, winds in jet streams at about 10 km(32800 feet) altitude often exceed 50 m s�1 (112 miles perhour) and sometimes even double these values. Changesin weather can occur in just a few hours. The atmosphereis quite a thin envelope around the planet, with 90% ofits mass of 5.1 ð 1018 kg within about 16 km (roughly10 miles) of the surface (about one four hundredth theradius of the Earth). This relative shallowness of the Earth’satmosphere often allows the atmospheric motions to be con-sidered as occurring at the Earth’s surface. For example,satellite photographs of Earth appear to show clouds hug-ging the surface.
The atmosphere is composed of several fairly distinctlayers. Immediately above the surface is the troposphere,which extends upwards to about 10 km in the extratropicsand 16 km in the tropics. About 80–90% of the atmosphereis contained in the troposphere. It is defined as the layerwhere the temperature generally decreases with altitude andis the region where most of what we call “weather” occurs.The troposphere is the region where vertical air movementsoccur and produce clouds and precipitation in rising air andclear skies in gently subsiding air.
The second layer is the stratosphere, which extends toabout 50 km in altitude. Because this is a region where tem-peratures generally increase with height, it is very stable,resists vertical motions, and is highly stratified (as the nameimplies). Many jet aircraft fly in the lower stratosphere inthe relatively non-turbulent conditions above troposphericweather systems. In this region, oxygen molecules, con-sisting of two oxygen atoms, are broken apart by intensesolar radiation in the ultraviolet and participate in a processto form ozone molecules, in which three atoms of oxygenare combined. So the main ozone layer is contained in thestratosphere (see Stratosphere, Chemistry, Volume 1). Itspresence shields the surface from harmful ultraviolet rays,making it possible for life to exist (see Ultraviolet Radia-tion, Volume 1).
EARTH SYSTEM PROCESSES 3
Changes in the atmosphere:composition, circulation
Changes in thehydrological cycle
Atmosphere
Human influences
Ocean
Sea-ice
Land
Riverslakes
Vegetation
Outgoingradiation
Changes in the ocean:circulation, biogeochemistry
Changes in/on the land surface:land use, vegetation, ecosystems
Water vaporcarbon dioxidesuspended particlesother greenhouse gases
Changes insolar
radiation
Clouds
Figure 1 Schematic view of the components of the global climate system (bold), their processes and interactions (thinarrows) and some aspects that may change (bold arrows). (Adapted from Trenberth et al., 1996)
Moving upward, the third atmospheric layer is the meso-sphere, which extends to roughly 80 km with temperaturesdecreasing with altitude. Above the mesosphere is the ther-mosphere, in which the temperature again increases withheight. The thermosphere contains only 0.01% of the atmo-sphere and it is in this region that atmospheric gases areionized by energetic and short ultraviolet solar radiation,so that it includes most of the ionosphere. The ionosphereis particularly important because it influences radiowavetransmission.
The other main fluid component of the climate system isthe oceans. The oceans contain slightly more than 97% ofthe roughly 1.3 ð 109 km3 of water on Earth. They cover70.8% of the surface, although with a much greater fractionin the SH (80.9% of the area) than the NH (60.7%), whichhas substantial implications for climate. Ocean currents canbe >1 m s�1 in strong currents like the Gulf Stream, butare more typically a few cm s�1 at the ocean’s surface.The average depth of the ocean is 3795 m. The oceans arestratified opposite to the atmosphere, with warmest watersnear the surface. The cold deep abyssal ocean turns overonly very slowly on time scales of hundreds to thousandsof years.
Other major components of the climate system includesea ice, the land and its features (including the vegeta-tion, albedo (reflective character), biomass, and ecosys-tems), snow cover, land ice (including the semi-permanentice sheets of Antarctica and Greenland and glaciers),and rivers, lakes and surface and subsurface water. Thecomponents in the climate system (Figure 1) are showntogether with the main interactions and sources of climatechange.
WEATHER AND CLIMATE
For the Earth, on an annual mean basis, the excess of incom-ing solar radiation over outgoing longwave radiation in thetropics, and the deficit at mid to high latitudes (Figure 2),sets up an equator-to-pole temperature gradient that results,with the Earth’s rotation, in a broad band of westerliesin each hemisphere in the troposphere. Embedded withinthe mid-latitude westerlies are large-scale weather systemswhich, along with the ocean, act to transport heat polewardsto achieve an overall energy balance, as described below.
In the atmosphere, phenomena and events are looselydivided into the realms of “weather” and “climate”. The

4 THE EARTH SYSTEM: PHYSICAL AND CHEMICAL DIMENSIONS OF GLOBAL ENVIRONMENTAL CHANGE
Night Day
90 °N
90 °S
60
60
Net
rad
iatio
n
Solar
Radiation
Outgoing longwave radiation
30
0
Hea
t tra
nspo
rt
30
Figure 2 The incoming solar radiation (right) illuminates only part of the Earth while the outgoing longwave radiation isdistributed more evenly. On an annual mean basis, the result is an excess of absorbed solar radiation over the outgoinglongwave radiation in the tropics, while there is a deficit at middle to high latitudes (left), so that there is a requirementfor a poleward heat transport in each hemisphere (broad arrows) by the atmosphere and the oceans. The radiationdistribution results in warm conditions in the tropics but cold at high latitudes, and the temperature contrast results in abroad band of westerlies in the extratropics of each hemisphere in which there is an embedded jet stream (shown by theribbon arrows) at about 10 km above the Earth’s surface. The flow of the jet stream over the different underlying surface(ocean, land, mountains) produces waves in the atmosphere and geographic spatial structure to climate. [The excess ofnet radiation at the equator is 68 W m�2 and the deficit peaks at �100 W m�2 at the South Pole and �125 W m�2 at theNorth Pole; from Trenberth and Solomon, 1994]. (From Trenberth et al., 1996)
large fluctuations occurring in the atmosphere from hour-to-hour and day-to-day constitute the weather. Weatheris described by such elements as temperature, air pres-sure, humidity, cloudiness, precipitation of various kindsand winds. Weather occurs as a wide variety of phenom-ena ranging from small cumulus clouds to giant thunder-storms, from clear skies to extensive cloud decks, fromgentle breezes to gales, from small wind gusts to tor-nadoes, from frost to heat waves and from snow flur-ries to torrential rain. Many such phenomena occur aspart of much larger-scale organized weather systems thatconsist, in middle latitudes, of cyclones (low pressureareas or systems) and anticyclones (high pressure systems)and their associated warm and cold fronts (see Atmo-spheric Motions, Volume 1). Tropical storms (referredto as hurricanes if exceeding certain intensity (64 knotsor 74 miles per hour) in many regions or typhoons inthe western North Pacific) are organized, large-scale sys-tems of intense low pressure that occur in low lati-tudes (see Hurricanes, Typhoons and other Tropical
Storms – Dynamics and Intensity, Volume 1). Weathersystems migrate, develop, evolve, mature, and decay overperiods of days to weeks and constitute a form of atmo-spheric turbulence. These weather systems arise mainlyfrom atmospheric instabilities driven by heating patternsfrom the Sun and their evolution is governed by non-linear “chaotic” dynamics, so that they are not predictablein an individual deterministic sense beyond about twoweeks into the future (see Chaos and Predictability, Vol-ume 1). Examples of weather systems are the cyclonesand anticyclones and associated cold and warm fronts,which arise from the equator-to-pole temperature differ-ences (Figure 2) and thus have their origin in the Sun–Earthgeometry and the distribution of solar heating. The atmo-sphere responds by continual attempts to reduce thosetemperature gradients by producing, in the NH, southerlywinds to carry warm air polewards and cold northerlywinds to reduce temperatures in lower latitudes, while inthe SH, the southerlies are cold and the northerly windsare warm. Another example is convection, which gives

EARTH SYSTEM PROCESSES 5
rise to the clouds and thunderstorms, driven by solarheating at the Earth’s surface, that produce buoyant ther-mals, which rise, expand and cool, and produce rain alongthe way.
Climate is usually defined to be average weather and thusis thought of as the prevailing weather, which includes notjust average conditions but also the range of variations. Itis often described in terms of the mean and other statisticalquantities that measure the variability. Climate extends overa period of time and possibly over a certain geographicalregion. Climate involves variations in which the atmosphereis influenced by and interacts with other parts of the climatesystem and the external forcings (Figure 1).
It is the sum of many weather phenomena that determineshow the large-scale general circulation of the atmosphereworks (i.e., the average three dimensional structure ofatmospheric motion); and it is the circulation that essentiallydetermines climate. This intimate link between weather andclimate provides a basis for understanding how weatherevents may change as the climate changes. There are manyvery different weather phenomena that can take place underan unchanging climate, so a wide range of conditions occurs
naturally. Consequently, even with a modest change inclimate, many if not most of the same weather phenomenawill still occur after the change.
This latter point can be illustrated by consideration ofthe mean and natural variability, and the effects of achange in the mean while leaving the variability unchanged.Many atmospheric variables, such as temperature, follow anormal (bell-shaped) frequency distribution quite closely.An example for temperature is shown in Figure 3 for asimple case where the bell-shaped distribution of anomaliesof temperature, defined as departures from the mean annualcycle, is shifted to correspond to a warmer climate. For anychange in mean climate, there is likely to be an amplifiedchange in extremes. If the mean temperature is 15 °C andthe standard deviation is 5 °C, 95% of the values fallwithin plus or minus two standard deviations, or between5–25 °C, on a given day. Then, if the mean temperature isincreased by 2.5 °C but with the same variability, there isonly a small change in occurrence of temperatures near themean. The biggest percentage change is for the extremes:the frequency of occurrence of temperatures above 25 °Cincreases by well over 100% while similar decreases occur
0.10
0.08
0.06
0.04
0.02
0.00
0 10 20 30
200
100
−100
−200
0
Pro
babi
lity
dens
ity fu
nctio
n
0.08
0.04
0.00
−0.04
−0.08
Diff
eren
ces
% C
hang
e
Solid: Unit areamean = 15 st dev = 5
Solid: (B − A)
Dash: Unit areamean = 17.5
st dev = 5
Dashed: % Change(B − A)
A B
(B + A)/2× 100
Temperature
Normal curve comparison
(b)
(a) 0 10 20 30
Figure 3 The two bell curves in (a) show the distribution of a climate variable (temperature in this case) before and aftera climate change. The units are given in degrees Celsius. In this example, the climate change is assumed to shift themean temperature by half a standard deviation (or 2.5 °C) but with no change in the spread of the curve (or equivalentlythe standard deviation, which is set to 5 °C). In (b), the differences in frequency of occurrence that result are shown asactual values (left axis) and as percentages (right axis)
6 THE EARTH SYSTEM: PHYSICAL AND CHEMICAL DIMENSIONS OF GLOBAL ENVIRONMENTAL CHANGE
for temperatures below 5 °C. The wide range of naturalvariability associated with day-to-day weather is the reasonthat we are unlikely to notice small climate changes exceptfor the extremes.
Changes in any of the climate system components,whether internal and thus a part of the system, or fromthe external forcings, cause the climate to vary or tochange. Thus climate can vary because of alterations inthe internal exchanges of energy or in the internal dynam-ics of the climate system. Examples are El Nino and LaNina events, which arise from natural coupled interactionsbetween the atmosphere and the ocean centered in the trop-ical Pacific. As such they are a part of the year-to-yearclimate and they lead to large and important systematicvariations in weather patterns (events such as floods anddroughts) throughout the world. Often, however, climateis taken to refer to much longer time scales – the averagestatistics over a 30-year period is a widespread and long-standing working definition. On these longer time scales,ENSO events vanish from mean statistics but becomestrongly evident in the measures of variability, such as theextremes. However, the mean climate is also influenced bythe variability. These considerations become very impor-tant in the development of models of the climate systemdesigned to serve as tools to simulate and project climatechange.
THE DRIVING FORCES OF CLIMATE
The Global Energy Balance
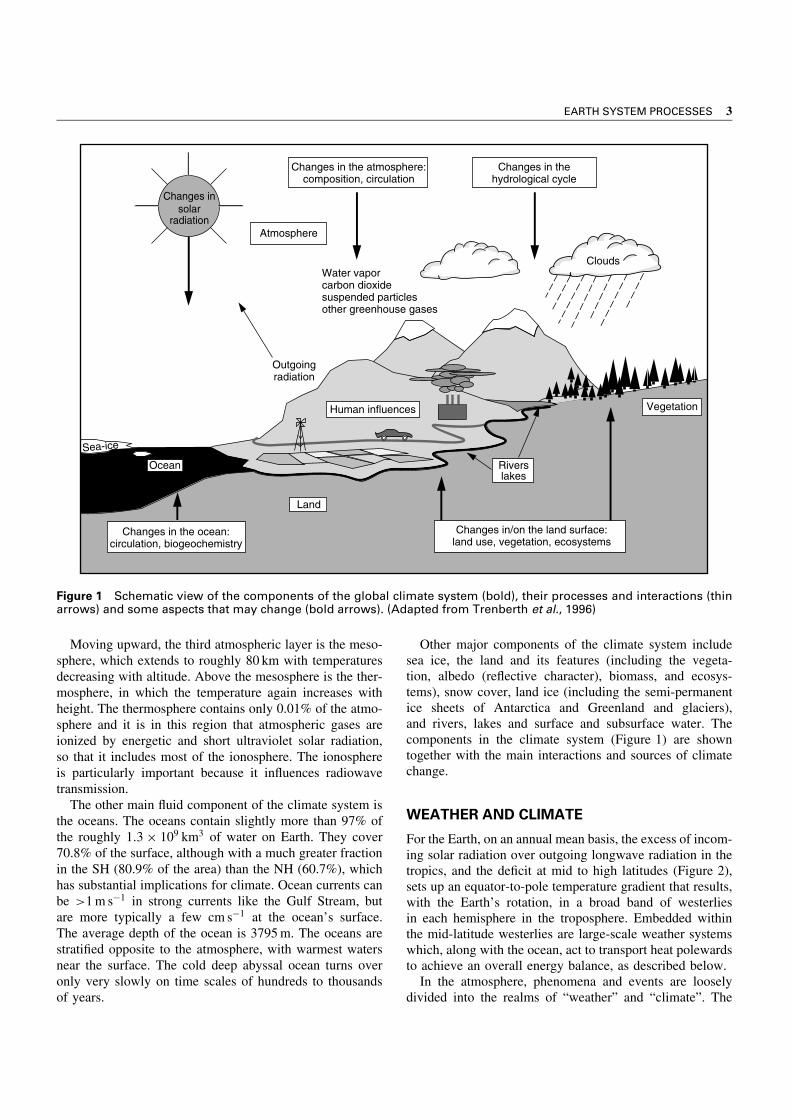
The “shortwave” radiation from the Sun provides the sourceof energy that drives the climate. Much of this energy is inthe visible part of the electromagnetic spectrum, althoughsome incoming radiation extends beyond the red part ofthe spectrum into the infrared and some extends beyondthe violet into the ultraviolet. As noted earlier, becauseof the roughly spherical shape of the Earth, at any onetime half the Earth is in night (Figure 2). Because solarradiation is coming from just one direction, the averageamount of energy incident at the top of the atmosphereis one quarter of the solar constant, or about 342 W m�2.About 31% of this energy is scattered or reflected backto space by molecules, tiny airborne particles (known asaerosols) and clouds in the atmosphere, and by the Earth’ssurface. This leaves about 235 W m�2 on average to warmthe Earth’s surface and atmosphere (Figure 4).
To balance the incoming energy, the Earth itself mustradiate, on average, the same amount of energy backto space (Figure 4). It does this by emitting thermal“longwave” radiation in the infrared part of the spectrum.The amount of thermal radiation emitted by a warm surfacedepends on its temperature and on how absorbing it is. For
235342107
77
77
67Absorbed byatmosphere
Emitted byatmosphere 165 30
40Atmospheric
window
390Surfaceradiation
350 40
78Latentheat24
168Absorbed by surface
78 Evapo-
Greenhousegases
324Absorbed by surface
30
24Thermals
Reflected solarradiation107 W m −2
Reflected by clouds,aerosol andatmosphere
Reflected bysurface
Outgoinglongwaveradiation
235 W m −2
Incomingsolar
radiation342 W m−2
324Back
radiation
Figure 4 The Earth’s radiation balance. The net incoming solar radiation of about 342 W m�2 is partially reflected byclouds and the atmosphere, or at the surface, but 49% is absorbed by the surface. Some of that heat is returned to theatmosphere as sensible heat and most as evapotranspiration that warms the atmosphere by release of latent heat duringprecipitation. The rest of the energy absorbed at the surface is radiated upward as thermal infrared radiation, most ofwhich is absorbed by the atmosphere and re-emitted both up and down, producing a greenhouse effect because theradiation lost to space comes from cloud tops and parts of the atmosphere that are much colder than the surface. (FromKiehl and Trenberth, 1997)

EARTH SYSTEM PROCESSES 7
a completely absorbing surface to emit 235 W m�2 of ther-mal radiation, it would have a temperature of about �19 °C.This is much colder than the conditions that actually existnear the Earth’s surface, where the annual average globalmean temperature is about 14 °C. However, because thetemperature in the troposphere falls off quite rapidly withheight, a temperature of �19 °C is reached typically at analtitude of about 5 km above the surface in mid-latitudes.This provides a clue about the role of the atmosphere inmaking the surface climate warmer and thereby hospitable(see Energy Balance and Climate, Volume 1).
The Greenhouse Effect
Some of the infrared radiation leaving the atmosphere orig-inates at or near the Earth’s surface and is transmittedrelatively unimpeded through the atmosphere; this is theradiation from areas where there are no clouds and whichis emitted in the part of the spectrum known as the atmo-spheric “window” (Figure 4). The bulk of the radiationemitted from the surface, however, is intercepted and re-emitted both up and down. The emissions to space occureither from the tops of clouds at different atmosphericlevels (which are almost always colder than the surface),or by gases present in the atmosphere that absorb andemit infrared radiation. Most of the atmosphere consistsof nitrogen and oxygen (composing about 99% of dry air),which are transparent to infrared radiation. It is the watervapor, which varies in amount from 0 to about 3%, car-bon dioxide and some other minor gases present in theatmosphere in much smaller quantities that absorb someof the thermal radiation leaving the surface and re-emitradiation from much higher and colder levels out to space.These radiatively active gases are known as greenhousegases because they act as a partial blanket for the thermalradiation from the surface and enable the surface to be sub-stantially warmer than it would otherwise be, analogous tothe effects of a greenhouse. (While a real greenhouse doeswork this way, the main heat retention in a greenhousecomes through protection from the wind.) This blanketingis known as the natural greenhouse effect. In the current cli-mate under clear sky conditions, water vapor is estimatedto account for about 60% of the greenhouse effect, carbondioxide 26%, ozone 8% and other gases 6% (Kiehl andTrenberth, 1997) (see Greenhouse Effect, Volume 1).
Effects of Clouds
Clouds also absorb and emit thermal radiation; as a result,they have a blanketing effect similar to that of the green-house gases. However, clouds are also bright reflectors ofsolar radiation and thus also act to cool the surface. Whileon average there is strong cancellation between the twoopposing effects of shortwave and longwave cloud heating,
the net global effect of clouds in our current climate, asdetermined by space-based measurements, is a small cool-ing of the surface. A key issue is how clouds will change asclimate changes. This issue is complicated by the fact thatclouds are also strongly influenced by particulate pollution,which tends to lead to much smaller cloud droplets, and thusmakes clouds brighter and more reflective of solar radiation.These effects may also influence the timing and amounts ofprecipitation. In addition, if cloud altitude changes, the cli-mate can be affected. If cloud tops get higher, the radiationto space from clouds is at a colder temperature and so thisreduction in the loss of the energy from the Earth producesa warming influence. However, more extensive low cloudswould be likely to produce cooling because of their highreflectivity and so their greater influence on solar radiation.
The Hydrological Cycle
The Earth contains roughly 1.3 ð 109 km3 of water. Slightlymore than 97% of the water is in the oceans and istherefore salty. The fresh water in rivers, lakes, glaciers,and underground aquifers make up roughly 36 ð 106 km3
of water. About 220 000 km3 of fresh water is in thelakes and rivers and 12 000 km3 is in the atmosphere.Of the fresh water, 28 ð 106 km3 is locked up frozenin ice sheets, ice caps and glaciers. Most of the ice iscontained in the Antarctic ice sheet which, if melted, wouldincrease sea level by about 65 m. By contrast, Greenlandcontains the equivalent of about 7 m of sea level andthe other glaciers and ice caps contain about 0.5 m (seeGlaciers, Volume 1). Most of the remaining 8 ð 106 km3
of fresh water is stored underground as ground water (seeHydrologic Cycle, Volume 1).
The hydrological cycle involves the transfer of waterfrom the oceans to the atmosphere, to the land and backto the oceans, both on top of and beneath the land sur-face. Water is evaporated from the ocean surface, and aswater vapor it is typically transported thousands of kilo-meters before it is taken up in clouds and weather systemsand is precipitated out as rain, snow, hail or some otherfrozen pellet back to the Earth’s surface. Over land, someprecipitation infiltrates or percolates into soils and someruns off into streams and rivers. Ponds and lakes or othersurface water may evaporate moisture into the atmosphere,and can also freeze so that water can become locked upfor a while. The surface water weathers rocks and erodesthe landscape, and replenishes subterranean aquifers. Overland, plants transpire moisture into the atmosphere.
A schematic view of the cycling of water through theclimate system is given in Figure 5. This figure not onlyshows the main water reservoirs and the amounts in eachin units of 103 km3, but also gives the volumetric flowsbetween ocean, land and atmosphere (based on results fromTrenberth and Guillemot, 1998). In units of 103 km3 per

8 THE EARTH SYSTEM: PHYSICAL AND CHEMICAL DIMENSIONS OF GLOBAL ENVIRONMENTAL CHANGE
Atmosphere12
Ocean to landwater vapor transport 34
Landprecipitation103
Oceanprecipitation399
Oceanevaporation 433
Surface flow
Ground water flow
Ground water8000
RiversLakes220
Land Vegetation
PercolationIce28 000
34
Evaporation, Transpiration 69
Ocean1300 000
Figure 5 The hydrological cycle, showing the reservoirs of water in square boxes and amounts in units of 103 km3. Thefigure also shows the flows of water between reservoirs (in oval boxes) in units of 103 km3 year�1
year, evaporation over the oceans (433) exceeds precipita-tion (399), leaving a net of 34 units of moisture transportedonto land as water vapor. On average, this flow must be bal-anced by a return flow over and beneath the ground throughriver and stream flows, and subsurface ground water flow.Consequently, precipitation over land exceeds evapotran-spiration by this same amount (34). Not surprisingly, per-haps, the average precipitation rate over the oceans exceedsthat over land by 72% (allowing also for the differences inareas). It has been estimated (Trenberth, 1998) that on aver-age over 80% of the moisture precipitated out comes fromlocations over 1000 km distant, highlighting the importantrole of the winds in moving moisture around.
The Role of Oceans
The oceans cover 70% of the Earth’s surface and throughtheir fluid motions, their high heat capacity, and theirecosystems play a central role in shaping the Earth’s climateand its variability. The most important characteristic of theoceans is that they are wet and, while obvious, this issometimes overlooked. Water vapor, evaporated from theocean surface, provides latent heat energy to the atmosphereduring the precipitation process. Wind blowing on the seasurface drives the large-scale ocean circulation in its upper
layers. The ocean currents carry heat and salt along withthe fresh water around the globe (see Ocean Circulation,Volume 1; Salinity Patterns in the Ocean, Volume 1).The oceans therefore store heat, absorbed at the surface,for varying durations and release it in different places,thereby ameliorating temperature changes over nearby landand contributing substantially to variability of climate onmany time scales. Additionally, the ocean thermohalinecirculation (see Thermohaline Circulation, Volume 1),which is the circulation driven by changes in sea waterdensity arising from temperature (thermal) or salt (haline)effects, allows water from the surface to be carried into thedeep ocean, where it is isolated from atmospheric influenceand hence it may sequester heat for periods of a thousandyears or more. The oceans also absorb carbon dioxide andother gases and exchange them with the atmosphere in waysthat change with ocean circulation and climate change. Inaddition, it is likely that marine biotic responses to climatechange will result in subsequent changes that may havefurther ramifications.
The Role of Land
The heat penetration into land occurs mainly through con-duction, except where water plays a role, so that heatpenetration is limited and slow. Temperature profiles taken

EARTH SYSTEM PROCESSES 9
from bore holes into land or ice caps therefore provide ablurry coarse estimate of temperatures in years long past(see Pollack et al., 1998 and Ground Temperature, Vol-ume 1). Consequently, surface air temperature changes overland occur much faster and are much larger than over theoceans for the same heating and, because we live on land,this directly affects human activities.
The land surface encompasses an enormous variety oftopographical features and soils, differing slopes (whichinfluence runoff and radiation received) and water capacity.The highly heterogeneous vegetative cover is a mixtureof natural and managed ecosystems that vary on verysmall spatial scales. Changes in soil moisture affect thedisposition of heat at the surface and whether it resultsin increases in air temperature or increased evaporationof moisture. The latter is complicated by the presence ofplants, which can act to pump moisture out of the root zoneinto the leaves, where it can be released into the atmosphereas the plant participates in photosynthesis; a process calledtranspiration. The behavior of land ecosystems can begreatly influenced by changes in atmospheric compositionand climate. The availability of surface water and the useof the Sun’s energy in photosynthesis and transpirationin plants influence the uptake of carbon dioxide from theatmosphere as plants transform the carbon and water intousable food. Changes in vegetation alter how much sunlightis reflected and how rough the surface is in creating dragon the winds, and the land surface and its ecosystems playan important role in the carbon cycle and fluxes of watervapor and other trace gases.
The Role of Ice
Major ice sheets, like those over Antarctica and Greenland,have a large heat capacity but, like land, the penetrationof heat occurs primarily through conduction so that themass experiencing temperature changes from year to yearis small. Temperature profiles can be taken directly fromboreholes into ice (see Dahl-Jensen et al., 1998 for temper-atures directly from boreholes in the Greenland ice sheet).The temperature profiles suggest that the upward heat flowfrom the underlying ground is about 51 mW m�2, whichis very small compared to the various components of theEarth’s energy balance. On century timescales, however,the ice sheet heat capacity becomes important. Unlike land,the ice can melt, which has major consequences on longertimescales through changes in sea level.
A major concern has been the possible instability ofthe West Antarctic Ice Sheet (WAIS) because it is partlygrounded below sea level. At the present rate of accumula-tion, the time needed to restore the ice is estimated as over10 000 years (Oppenheimer, 1998) so that changes are veryslow and occur on millennial time scales unless an insta-bility arises (see also Antarctica, Volume 1). If warming
alters the grounding of the ice sheet, making it float, itbecomes more vulnerable to rapid disintegration, ultimatelyleading to a rise in sea level of 4–6 m. The present assess-ment by Oppenheimer is that the risk of substantial changein WAIS contributing to major sea level rise in the 21stcentury is small, but the risk increases in future centuriesas human-induced global climate change progresses. How-ever, there is concern that, after a certain critical point isreached, such changes may be irreversible and unstoppableonce begun.
Sea ice is an active component of the climate systemand varies greatly in areal extent with the seasons, but onlyat higher latitudes (see Sea Ice, Volume 1). In the Arcticwhere sea ice is confined by the surrounding continents,mean sea ice thickness is 3–4 m thick and multi-year icecan be present. Around Antarctica the sea ice is unimpededand spreads out extensively, but as a result the meanthickness is typically 1–2 m.
The Role of Heat Storage
The different components of the climate system contributeon different timescales to climate variations and change.The atmosphere and oceans are fluid systems and can moveheat around through convection and advection (in which theheat is carried by the currents, whether small-scale short-lived eddies or large-scale atmospheric jet streams or oceancurrents). Changes in phase of water, from ice to liquidto water vapor, affect the storage of heat. However, evenignoring these complexities, many facets of the climate canbe deduced simply by considering the heat capacity of thedifferent components of the climate system. The total heatcapacity considers the mass involved as well as its capacityfor holding heat, as measured by the specific heat of eachsubstance.
The atmosphere does not have much capability to storeheat. The heat capacity of the global atmosphere corre-sponds to that of only a 3.2 m layer of the ocean. However,the depth of ocean actively involved in climate is muchgreater than that. The specific heat of dry land is roughlya factor of 4.5 less than that of sea water (for moist landthe factor is probably closer to 2). Moreover, heat penetra-tion into land is limited by the low thermal conductivityof the land surface; as a result only the top two meters orso of the land typically play an active role in heat storageand release (e.g., as the depth for most of the variationsover annual time scales). Accordingly, land plays a muchsmaller role than the ocean in the storage of heat and inproviding a memory for the climate system. Similarly, theice sheets and glaciers do not play a strong role, while seaice is important where it forms.
The seasonal variations in heating penetrate into theocean through a combination of radiation, convective over-turning (in which cooled surface waters sink while warmer
10 THE EARTH SYSTEM: PHYSICAL AND CHEMICAL DIMENSIONS OF GLOBAL ENVIRONMENTAL CHANGE
more buoyant waters below rise) and mechanical stirring bywinds. These processes mix heat through what is called themixed layer , which, on average, involves about the upper90 m of ocean. The thermal inertia of the 90 m layer can adda delay of about 6 years to the temperature response to aninstantaneous change (this time corresponds to an exponen-tial time constant in which there is a 63% response towarda new equilibrium value following an abrupt change). Asa result, actual changes in climate tend to be gradual. Withits mean depth of about 3800 m, the total ocean wouldadd a delay of 230 years to the response if rapidly mixed.However, mixing is not a rapid process for most of theocean so that in reality the response depends on the rateof ventilation of water between the well-mixed upper lay-ers of the ocean and the deeper, more isolated layers thatare separated by the thermocline (ocean layer, below themixed layer, exhibiting a strong vertical temperature gra-dient). The rate of such mixing is not well established andvaries greatly geographically. An overall estimate of thedelay in surface temperature response caused by the oceansis 10–100 years. The slowest response should be in highlatitudes where deep mixing and convection occur, and thefastest response is expected in the tropics. Consequently,the oceans are a great moderating effect on climate changes,especially changes such as those involved with the annualcycle of the seasons.
Generally, the observed variability of temperatures overland is a factor of two to six greater than that over theoceans. At high latitudes over land in winter there is oftena strong surface temperature inversion whose strength isvery sensitive to the amount of stirring in the atmosphere(Trenberth, 1993). Such wintertime inversions are signifi-cantly affected by human activities; for instance an urbanheat island effect exceeding 10 °C has been observed duringstrong surface inversion conditions in Fairbanks, Alaska.Strong surface temperature inversions over mid-latitudecontinents also occur in winter. In contrast, over the oceans,surface fluxes of heat into the atmosphere keep the airtemperature within a narrow range. Thus it is not surpris-ing that over land, month-to-month persistence in surfacetemperature anomalies is greatest near bodies of water.Consequently, it is clear that for a given heating pertur-bation, the response over land should be much greater thanover the oceans; the atmospheric winds are the reason whythe observed factor is only in the two to six range.
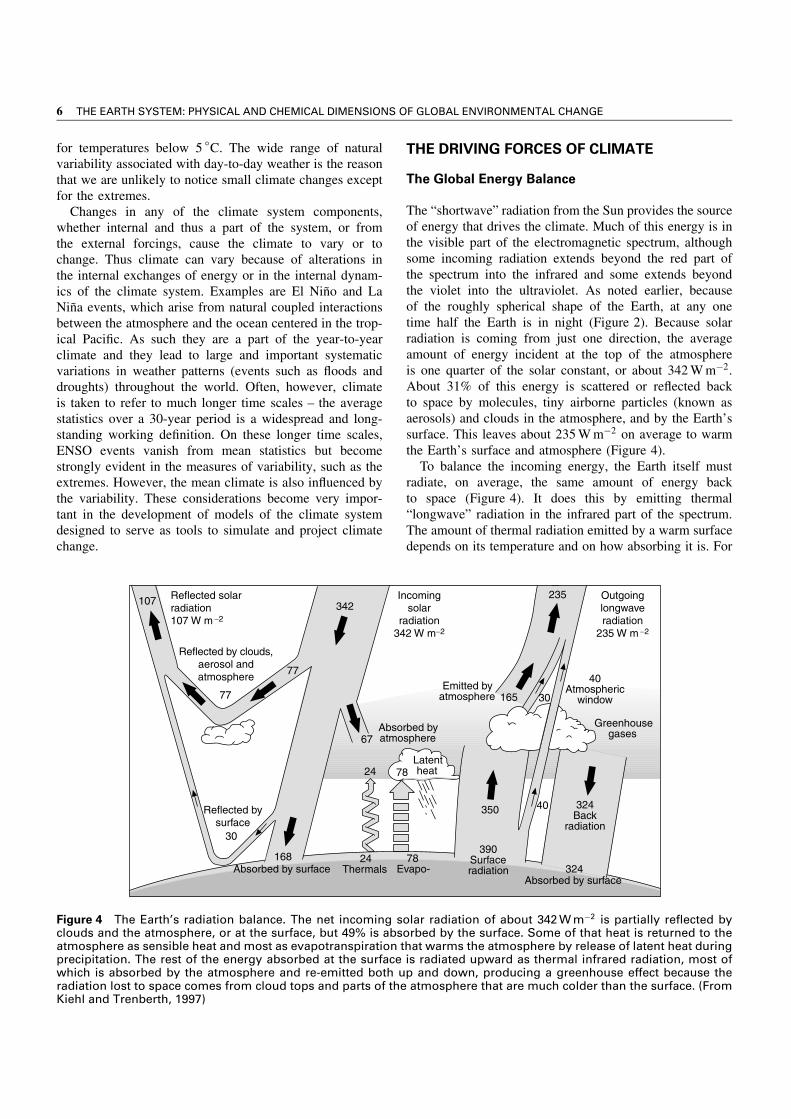
A further example of the role of the oceans in moderatingtemperature variations is the contrast in the mean annualcycle of surface temperature between the NH (60.7% water)and SH (80.9% water) (Figure 6). The amplitude of the 12-month cycle between 40 and 60 °latitude ranges from <3 °Cin the SH to ¾12 °C in the NH. Similarly, in mid-latitudesfrom 22.5–67.5 °latitude, the average lag in temperatureresponse relative to peak solar radiation is 32.9 days inthe NH versus 43.5 days in the SH (Trenberth, 1983),
10
(b)
20 30 40 50
Latitude60 70 80 90
20
15
10
5
0 10(a) 20 30 40 50 60 70 80 90
Northern Hemisphere
Southern Hemisphere
Northern Hemisphere
Annual cycle of temperature (°C)
SouthernHemisphere
Am
plitu
de (
°C)
60
50
40
30
20
10
0
Lag
(day
s)
Figure 6 Amplitude of the annual cycle in zonal meansurface temperatures in °C as a function of latitude (a),and the lag of the temperature response behind the Sunin days (b). (From Trenberth, 1983)
again reflecting the difference in thermal inertia. Even thesea surface temperatures (SSTs) in the two hemispheresundergo quite different amplitudes in the annual cycle, andaverage SSTs are higher in the NH versus the SH at eachlatitude because of the land distribution and the winds thatblow from land to ocean.
Atmosphere–Ocean Interaction: El Nino
Understanding the climate system becomes more complexas the components interact. El Nino events are a strikingexample of a phenomenon that would not occur withoutinteractions between the atmosphere and ocean. El Ninoevents involve a warming of the surface waters of thetropical Pacific Ocean (see El Nino and La Nina: Causesand Global Consequences, Volume 1). Ocean warmingtakes place from the International Dateline to the westcoast of South America and results in changes in thelocal and regional ecology. Historically, El Nino eventshave occurred about every 3–7 years and alternated withthe opposite phases of below average temperatures in thetropical Pacific, dubbed La Nina. In the atmosphere, apattern of change called the Southern Oscillation is closelylinked with these ocean changes, so that scientists referto the total phenomenon as ENSO (see El Nino/Southern

EARTH SYSTEM PROCESSES 11
Oscillation (ENSO), Volume 1). Then El Nino is the warmphase of ENSO and La Nina is the cold phase.
The strong SST gradient from the warm pool in thewestern tropical Pacific to the cold tongue in the easternequatorial Pacific is maintained by the westward-flowingtrade winds, which drive the surface ocean currents anddetermine the pattern of upwelling of cold nutrient-richwaters in the east. Because of the Earth’s rotation, easterlywinds along the equator deflect currents to the right in theNH and to the left in the SH and thus away from theequator, creating upwelling along the equator. Low sea-level pressures are set up over the warmer waters whilehigher pressures occur over the cooler regions in the tropicsand subtropics. The moisture-laden winds tend to blowtoward low pressure so that the air converges, resultingin organized patterns of heavy rainfall and a large-scaleoverturning along the equator called the Walker Circulation(see Walker Circulation, Volume 1). Because convectionand thunderstorms preferentially occur over warmer waters,the pattern of SSTs determines the distribution of rainfallin the tropics, and this in turn determines the atmosphericheating patterns through the release of latent heat. Theheating drives the large-scale monsoonal-type circulationsin the tropics, and consequently determines the winds.
If the Pacific trade winds relax, the ocean currents andupwelling change, causing temperatures to increase in theeast, which decreases the surface pressure and tempera-ture gradients along the equator, and so reduces the windsfurther. This positive feedback leads to the El Nino warm-ing persisting for a year or so, but the ocean changes alsosow the seeds of the event’s demise. The changes in theocean currents and internal waves in the ocean lead to aprogression of colder waters from the west that may ter-minate the El Nino and lead to the cold phase La Ninain the tropical Pacific. The El Nino develops as a coupledocean–atmosphere phenomenon and, because the amountof warm water in the tropics is redistributed, depleted andrestored during an ENSO cycle, a major part of the onsetand evolution of the events is determined by the historyof what has occurred one to two years previously. Thismeans that the future evolution is potentially predictablefor several seasons in advance.
The changes in atmospheric circulation are not confinedto the tropics but extend globally and influence the jetstreams and storm tracks in mid-latitudes. For El Ninoconditions, higher than normal sea level pressures overAustralia, Indonesia, Southeast Asia, and the Philippinessignal drier conditions or even droughts. Dry conditionsalso prevail for Hawaii, parts of Africa, and extend tothe northeast part of Brazil and to Colombia. Intense rainsprevail over the central and eastern Pacific, along the westcoast of South America and over parts of South Americanear Uruguay and southern parts of the United States inwinter.
OBSERVED CLIMATE CHANGE
Global aspects
We usually view the climate system from our perspec-tive as individuals on the surface of the Earth. Just a fewdecades ago, the only way a global perspective could beobtained was by collecting observations of the atmosphereand the Earth’s surface made at points over the globe andanalyzing them to form maps of various fields, such as tem-peratures. The observational coverage has increased overtime, but even today it is not truly global because of thesparse observations over the southern oceans and the polarregions. Earth observing satellites have changed this, as twopolar-orbiting sun-synchronous satellites can provide globalcoverage in about six hours, and geostationary satellitesprovide images of huge portions of the Earth almost con-tinuously (see Earth Observing Systems, Volume 1). Thesatellites have revealed the myriad cloud types and patternsof infinite variety, and glimpses of the surface underneath.Over land, changes in vegetation and snow cover with theseasons and from year to year can be seen. However, it isdifficult to see below the ocean surface and observations inthe ocean domain remain few and far between.
In the more distant past, instrumental observations arenot available at all and the nature of the weather andclimate has to be estimated from proxy indicators (seeNatural Records of Climate Change, Volume 1). Theseare organisms that are known to be sensitive to changesin temperature and precipitation, such as trees (throughthe width and composition of annual tree rings), corals(through annual layers in coral colonies), glaciers (throughannual layers of snow and ice), and deposits of smallorganisms and pollen from plants or land dust on thebottoms of lakes and in marine sediments in oceans. Suchfossil indicators can give some estimate of past climate,although the geographical coverage diminishes rapidly thefurther back in time we go because the most recent ice ageobliterates the evidence of the earlier ones.
Even for instrumental observations, the long time-seriesof high quality observations needed to discern small chan-ges are often compromised by spurious effects, and spe-cial care is required in interpretation. Most observationshave been made for other purposes, such as weather fore-casting, and therefore typically suffer from changes ininstrumentation, instrument exposure, measurement tech-niques, station location and observation times, and inthe general environment (such as the building of a cityaround the measurement location) and there have beenmajor changes in distribution and numbers of observa-tions. Adjustments must be devised to take into accountall these influences in estimating the real changes that haveoccurred.
Analysis of observations of surface temperature showthat there has been a global mean warming of about 0.7 °C

12 THE EARTH SYSTEM: PHYSICAL AND CHEMICAL DIMENSIONS OF GLOBAL ENVIRONMENTAL CHANGE
0.8
1
0
−1
0.6
0.4
0.2
−0.2
−0.4
−0.6
0.0°C °F
Base period 1961−1990
1860 1880 1900 1920 1940 1960 1980 2000
Annual global surface temperature anomalies
Figure 7 Global annual mean temperatures from 1860–1998 as departures from the 1961–1990 means. (CourtesyJim Hurrell, adapted from data provided by Hadley Centre,UKMO, and Climate Research Unit, University East Anglia)
over the past one hundred years (see The Global Temper-ature Record, Volume 1); see Figure 7 for the instrumentalrecord of global mean temperatures. The warming becamenoticeable from the 1920s to the 1940s, leveled off fromthe 1950s to the 1970s and took off again in the late 1970s.The calendar year 1998 was by far the warmest on record,exceeding the previous record held by 1997. The 1990swere the warmest decade on record. Information from pale-odata further indicates that these years are the warmestin at least the past 1000 years, which is as far back as ahemispheric estimate of temperatures can be made (Mannet al., 1999 and see Little Ice Age, Volume 1; MedievalClimatic Optimum, Volume 1). The melting of glaciersover most of the world and rising sea levels confirm thereality of the global temperature increases. The observedtrend for a larger increase in minimum than maximumtemperatures is linked to the associated increases in lowcloud amount and aerosol as well as the enhanced green-house effect (Dai et al., 1998). There is good evidence fordecadal changes in the atmospheric circulation and someevidence for ocean changes. Changes in precipitation andother components of the hydrological cycle vary consid-erably geographically. Changes in climate variability andextremes are beginning to emerge, but global patterns arenot yet apparent.
Changes in climate have occurred in the distant pastas the distribution of continents and their landscapes havechanged, as the so-called Milankovitch changes in the orbitof the Earth and the Earth’s tilt relative to the eclipticplane have varied the insolation received on Earth, andas the composition of the atmosphere has changed, allthrough natural processes (see Earth System History,Volume 1; Orbital Variations, Volume 1). Recent evidencefrom ice cores drilled through the Greenland ice sheet(e.g., Bond et al., 1997) have indicated that changes inclimate may often have been quite rapid and large, and notassociated with any known external forcings (see ClimateChange, Abrupt, Volume 1). Understanding the spatial
scales of this variability and the processes and mechanismsinvolved is very important as it seems quite possible thatstrong non-linearities may be involved that result in largechanges from relatively small perturbations by provokingpositively reinforcing feedback processes in the internalclimate system. Changes in the thermohaline circulation inthe Atlantic Ocean are one way such abrupt changes mightbe realized (see Thermohaline Circulation, Volume 1).An important question therefore is whether there might beprospects for major surprises as the climate changes.
Spatial Structure of Climate and Climate Change
Because of the land/ocean contrasts and obstacles suchas mountain ranges, the mid-latitude westerly winds andthe embedded jet stream in each hemisphere containplanetary-scale waves (Figure 2). These waves are usuallygeographically anchored but can change with time as heat-ing patterns change in the atmosphere. A consequence isthat anomalies in climate on a seasonal time scales typicallyoccur over large geographic regions with surface tempera-tures both above and below normal in different places. Thesame is true even on much longer time scales. Figure 8shows that the recent warming has been largest over mostof the northern continents, much less over the eastern half ofthe US, and with cooling over the North and South Pacificand North Atlantic (Trenberth and Hurrell, 1994; Hurrell,1996; Trenberth and Hoar, 1996, 1997). These changes areknown to be dominant in the northern winter and associatedwith changes in the atmospheric circulation and influencessuch as El Nino. On a year by year basis, extensive regionsof both above and below normal temperatures are the rule,not the exception, as should clearly be expected from thewave motions in the atmosphere.
Temperatures vary enormously on all space and timescales. At individual locations there is a large diurnalcycle, e.g., at Boulder, Colorado (at 40 °N in the centralUS) from �7 °C to C7 °C in early January and 15 °Cto 30 °C in mid-July. There is also a large annual cyclein daily-average temperature, in this case a 23 °C range.The standard deviation is a measure of the variability.A rule of thumb is that 95% of values fall within š2times the standard deviation and 68% of the values fallwithin š1 standard deviation of the mean. The standarddeviation of daily temperature anomalies at Boulder is4.5 °C while for monthly means, the value drops to 2.1 °Cas the vagaries of day to day weather are averaged out.Note that for the daily values, in this case, 71% fall withinš1 standard deviation of the mean and there are someextreme values well outside š2 standard deviations. Bothsituations arise from the annual cycle, which exhibits muchless variability in summer and much greater variabilityin winter. Spatial averages also average out the plusesand minuses, as illustrated in Figure 9, which presents the

EARTH SYSTEM PROCESSES 13
0.5
0.5
1
0.25
0.25
0
0
0.250.5
0.5
0.5
0
0
0
0
0.25
0.25
0.25−0.25
0.25
0.5
0.5
0
0° 30 °E
90 °S
60 °S
30 °S
0°
30 °N
60 °N
90 °N
60 °E 90 °E 120 °E 150 °E 150 °W 120 °W 90 °W 60 °W 30 °W 0°180°
Annual (°C)Base period 1951−1980
Figure 8 Annual mean surface temperature anomalies for the period 1981–1997 relative to a baseline set of temperaturesfor 1951–80 . (Courtesy J. Hurrell, adapted from data provided by Hadley Centre, UKMO, and CRU, University East Anglia)
monthly temperature anomalies for Boulder, Colorado, theUS, and the globe. For the US as a whole the standarddeviation is 1.2 °C and for the globe it is 0.24 °C. Only inthe latter is the global warming really apparent. It becomeseven clearer in yearly averages (Figure 7).
Figure 9 shows that small trends in global mean valuesare not readily perceived in regional or local values, simplybecause of the large natural weather-related variability; thishas implications for predictability. The latter depends onthe size of the signal from some climate forcing versus thenoise of natural variability. As indicated above, the noise(variability) is large locally but can be reduced by spatialand temporal averaging. Consequently, random weathervariations mean that local predictions for a month are lessreliably determined than averages over large areas and overlonger times.
ANTHROPOGENIC CLIMATE CHANGE
Human Influences
Climate can vary for multiple reasons and, in particular,human activities can lead to changes in several ways. Therehave been major changes in land use over the past twocenturies. Conversion of forest to cropland, in particular,has led to a higher albedo in places such as the easternand central US and changes in evapotranspiration, bothof which have probably cooled the region, in summer byperhaps 1 °C and especially in autumn by more than 2 °C,although global effects are less clear (Bonan, 1997, 1999).
In cities, the building of “concrete jungles” allows heat tobe soaked up and stored during the day and released atnight, moderating nighttime temperatures and contributingto an urban heat island. Space heating also contributes tothis effect. Urbanization changes also affect the runoff ofwater, leading to drier conditions unless compensated by thecooling influences of water usage and irrigation. However,these influences, while causing real changes in urban areas,are quite local. Widespread irrigation on farms can havemore regional effects, and so management and storage ofwater in general is important.
Combustion of fossil fuels not only generates carbondioxide and heat, but also generates particulate pollution(e.g., soot, smoke) as well as gaseous pollution that canbecome particulates (e.g., sulfur dioxide, nitrogen dioxide;which get oxidized to form tiny sulfate and nitrate parti-cles) (see Aerosols, Troposphere, Volume 1). Other gases,such as carbon monoxide, are also formed in burning and,as a result, the composition of the atmosphere is changing.Several other gases, notably methane, nitrous oxide, thechlorofluorocarbons (CFCs) and tropospheric ozone are alsoobserved to have increased from human activities (espe-cially from biomass burning, landfills, rice paddies, agri-culture, animal husbandry, fossil fuel use, leaky fuel lines,and industry), and these are all greenhouse gases. However,the observed decreases in lower stratospheric ozone sincethe 1970s (see Stratosphere, Ozone Trends, Volume 1),caused principally by human-introduced CFCs and halons,contribute to a small cooling in that region (Intergovern-mental Panel on Climate Change (IPCC), 1994).

14 THE EARTH SYSTEM: PHYSICAL AND CHEMICAL DIMENSIONS OF GLOBAL ENVIRONMENTAL CHANGE
10
5
0
−5
−10
8
4
0
−4
−8
2
1
0
−1
−2
Ano
mal
y, °
CA
nom
aly,
°C
Ano
mal
y, °
C
Boulder Sd = 2.13 °C
Contiguous United States Sd = 1.17 °C
Global Sd = 0.24 °C
1900 1910 1920 1930 1940 1950
Year1960 1970 1980 1990 2000
Monthly surface temperature anomalies, 1961−1990 base period
Figure 9 Monthly temperature anomalies for Boulder, Colorado, the US and the globe. The standard deviations (Sd) arelisted as 2.13 °C for Boulder, 1.17 °C for the US and 0.24 °C for the globe. The anomalies, defined as departures from themean annual cycle, are relative to the 1961–90 base period
The Enhanced Greenhouse Effect
The amount of carbon dioxide in the atmosphere hasincreased by more than 30% over the past two centuriessince the beginning of the Industrial Revolution, an increasethat is known to be due largely to combustion of fossil fuelsand the removal of forests (see Carbon Dioxide, RecentAtmospheric Trends, Volume 1). Most of this increasehas occurred since World War II. Because carbon diox-ide is recycled through the atmosphere many times beforeit is finally removed from the active atmosphere-ocean-vegetation resevoirs, the excess concentration has a lifetimeexceeding a hundred years. As a result, continuing emis-sions will lead to a continuing build-up in the atmosphericconcentrations. In the absence of controls, future projectionsare that the rate of increase in carbon dioxide emissions
(see Trends in Global Emissions: Carbon, Sulfur, andNitrogen, Volume 3) may accelerate and concentrationscould double their pre-industrial values within the nextsixty or so years (IPCC, 1994). Effects of implementing theKyoto Protocol of 1997 (see United Nations FrameworkConvention on Climate Change and Kyoto Protocol,Volume 4) are quite uncertain but may delay doubling ofpre-industrial values by perhaps 15 years (Wigley, 1998),and thus would buy time but would not solve the problem.
Effects of Aerosols
Human activities also affect the amount of aerosol in theatmosphere, which influences climate in other ways. Themain direct effect of aerosols is the scattering of some solarradiation back to space; which tends to cool the Earth’s

EARTH SYSTEM PROCESSES 15
surface. Aerosols can also influence the radiation budget bydirectly absorbing solar radiation leading to local heatingof the atmosphere and, to a lesser extent, by absorbing andemitting thermal radiation. A further influence of aerosolsis that many of them act as nuclei on which cloud dropletscondense. A changed concentration therefore tends to affectthe number and size of droplets in a cloud and hence altersthe reflection and the absorption of solar radiation by thecloud. Recent evidence highlights the possible importanceof this effect, although the magnitude is very uncertain(Hansen et al., 1997 and see Aerosols, Effects on theClimate, Volume 1).
Aerosols occur in the atmosphere from natural causes; forinstance, they are blown off the surface of deserts or dryregions. The eruption of Mt. Pinatubo in the Philippinesin June 1991 added considerable amounts of aerosol tothe stratosphere (see Aerosols, Stratosphere, Volume 1;Volcanic Eruption, Mt. Pinatubo, Volume 1), which forabout two years, scattered solar radiation leading to a lossof radiation at the surface and a cooling there. Humanactivities contribute to aerosol particle formation mainlythrough injection of sulfur dioxide into the atmosphere(which contributes to acid rain) particularly from powerstations and through biomass burning.
Because aerosols resulting from human activities typi-cally remain in the atmosphere for only a few days, theytend to be concentrated near their sources, such as nearand downwind of industrial regions. The cooling thereforeexhibits a very strong regional pattern, and the presence ofaerosols adds further complexity to possible climate changeas it can help mask, at least temporarily, global warm-ing arising from increased greenhouse gases. However, theaerosol effects do not cancel the global-scale effects of themuch longer-lived greenhouse gases, and significant climatechanges can still result.
CLIMATIC RESPONSE
Feedbacks
We use the global warming as a specific example of climatechange to highlight the issues of determining a climaticresponse to a particular climate forcing. Determining theclimatic response to a change in the radiative forcing iscomplicated by feedbacks. Some of these can amplify theoriginal warming (positive feedback) while others serveto reduce it (negative feedback) (see Climate Feedbacks,Volume 1).
If, for instance, the amount of carbon dioxide in theatmosphere were suddenly doubled, but with other thingsremaining the same, the outgoing long-wave radiationwould be reduced by about 4 W m�2 and this energy wouldbe trapped in the surface–atmosphere system. To restorethe radiative balance, the surface–atmosphere system must
warm up. In the absence of other changes, the warming atthe surface and throughout the troposphere would be about1.2 °C. In reality, many other factors will change, and var-ious feedbacks come into play, so that the best estimate ofthe average global warming for doubled carbon dioxide is2.5 °C (IPCC, 1990, 1995). In other words the net effect ofthe feedbacks is positive and roughly doubles the responseotherwise expected.
Increased heating therefore leads naturally to expecta-tions for increases in global mean temperatures (often mis-takenly thought of as “global warming”), but other changesin weather are also important. Increases in greenhousegases in the atmosphere produce global warming throughan increase in downwelling infrared radiation, and thus notonly increase surface temperatures but also enhance thehydrological cycle because much of the heating at the sur-face goes into additional evaporation of surface moisture.Global temperature increases signify that the water-holdingcapacity of the atmosphere increases and, together withenhanced evaporation, this means that the actual atmo-spheric moisture increases (see Water Vapor: Distributionand Trends, Volume 1), as is observed to be happeningin many places (Trenberth, 1998). It follows that naturallyoccurring droughts are likely to be exacerbated by enhanceddrying. Thus droughts, such as those set up by El Nino,are likely to start sooner, plants will wilt sooner, and thedroughts may become more extensive and last longer withglobal warming. Once the land is dry, then all the solar radi-ation goes into raising temperature, bringing on swelteringheat waves.
Further, globally there must be an increase in precipita-tion to balance the enhanced evaporation. The presence ofincreased moisture in the atmosphere implies stronger mois-ture flow converging into all precipitating weather systems,whether they are thunderstorms, or extratropical rain orsnowstorms. This leads to the expectation of enhancedrainfall or snowfall events, which is also observed to behappening (Karl and Knight, 1998; Trenberth, 1998).
The main positive feedback thus comes from water vaporas the amount of water vapor in the atmosphere increasesas the Earth warms and, because water vapor is an impor-tant greenhouse gas, it amplifies the warming. However,increases in cloud may act either to amplify the warm-ing through the greenhouse effect of clouds or reduce itby the increase in albedo; which effect dominates dependson the height and type of clouds, and varies greatly withgeographic location and time of year (see Cloud–Radia-tion Interactions, Volume 1). Ice-albedo feedback prob-ably leads to amplification of temperature changes inhigh latitudes. It arises because decreases in sea ice andsnow cover, which have high albedo, decrease the radia-tion reflected back to space and thus produces warmingthat may further decrease the sea ice and snow coverextent. However, increased open water may lead to more

16 THE EARTH SYSTEM: PHYSICAL AND CHEMICAL DIMENSIONS OF GLOBAL ENVIRONMENTAL CHANGE
evaporation and atmospheric water vapor, thereby increas-ing fog and low cloud amount, offsetting the change insurface albedo.
Other more complicated feedbacks may involve theatmosphere and ocean, e.g., cold waters off of the westerncoasts of continents (such as California or Peru) encouragedevelopment of extensive low stratocumulus cloud deckswhich block the Sun and this helps keep the ocean cold.A warming of the waters, such as during El Nino, couldeliminate the cloud deck and lead to further sea surfacewarming because of an increase in solar radiation. El Ninoitself involves strong positive and negative feedbacks thatare the essence of this natural phenomenon. Warming ofthe oceans from increased carbon dioxide may diminish theability of the oceans to continue to take up carbon dioxide,thereby enhancing the rate of change.
A number of feedbacks involve the biosphere and areespecially important when considering details of the carboncycle and the impacts of climate change. For example, inwetland soils rich in organic matter, such as peat, the pres-ence of water limits oxygen access and creates anaerobicmicrobial decay, which releases methane into the atmo-sphere. If climate change acts to dry the soils, aerobicmicrobial activity develops and produces enhanced rates ofdecay, which releases large amounts of carbon dioxide intothe atmosphere. Similarly, in areas of permafrost, naturalgas hydrates (see Methane Clathrates, Volume 1), whichare a crystalline form of water and mostly methane, canbe destabilized by permafrost melting, releasing methaneor carbon dioxide into the atmosphere, depending on thenature of the associated microbial activity that develops.Empirical evidence from ice cores reveals very strong par-allel changes in temperatures, carbon dioxide and methaneover the past 400 000 years through the major glacialsand interglacials, suggesting that atmospheric concentra-tions of these greenhouse gases somehow responded tothe climate changes underway and reinforced the changesthrough positive feedbacks. Much remains to be learnedabout these feedbacks and their possible influences onpredictions of future carbon dioxide concentrations andclimate.
Modeling of Climate
To quantify the response of the climate system to changesin forcing it is essential to account for all the complexinteractions and feedbacks among the climate system com-ponents and this is done using numerical models of theclimate system based upon well established physical prin-ciples. Global climate models include representations of allprocesses indicated in Figure 1. With comprehensive cli-mate models, experiments can be run with and withoutincreases in greenhouse gases and also other influences,such as changes in aerosols. The best models encapsu-late the current understanding of the physical processes
involved in the climate system, the interactions, and theperformance of the system as a whole. They have beenextensively tested and evaluated using observations (seeModel Simulations of Present and Historical Climates,Volume 1; Projection of Future Changes in Climate,Volume 1). While models are exceedingly useful toolsfor carrying out numerical climate experiments, they arenot perfect, and so have to be used carefully (Trenberth,1997).
Attribution of Climate Change
It is desirable to examine and evaluate the past obser-vational record by running models forced with realisticradiative forcing, although the latter is not that well known.It is in this way that models can be further tested and it maybe possible to attribute the observed changes to particularchanges in forcing, such as from volcanic or solar origins,and to achieve detection of the effects of human activitiesand specifically the effects from increases in aerosols andgreenhouse gases.
Examining observed changes and comparing with the sig-nature provide by models may enable attribution of thechanges to the changes in atmospheric composition, andin 1995 the Intergovernmental Panel on Climate Change(IPCC) assessment concluded that “the balance of evi-dence suggests that there is a discernible human influenceon global climate”. Since then the evidence has becomestronger (see Climate Change, Detection and Attribution,Volume 1).
For the observational temperature record (Figure 7), thebest evidence compiled to date suggests that solar vari-ability has played a small role but has contributed tosome of the warming of the twentieth century – perhaps0.2 °C – up to about 1950 (Cubasch et al., 1997). Changesin aerosols in the atmosphere, both from volcanic erup-tions, from increased visible pollutants and their effectson clouds have also contributed to reduced warming, per-haps by a couple of tenths of a degree C (Hansen et al.,1993). Some year-to-year fluctuations may have arisenfrom volcanic debris, such as the temporary cooling in1991 and 1992 following the eruption of Mount Pinatuboin June 1991 (Hansen et al., 1997). Heavy industrializa-tion following World War II may have contributed tothe plateau in global temperatures from 1950–1970 orso. Natural fluctuations arising from interactions betweenthe atmosphere and the oceans have probably also con-tributed to decadal fluctuations of perhaps as much as0.1 °C in global mean temperatures, and El Ninos con-tribute to the interannual variations, typically of one ortwo tenths degree C warming. It is only after the late1970s that global warming from increases in greenhousegases has probably emerged as a clear signal in globaltemperatures.

EARTH SYSTEM PROCESSES 17
Projection of Climate Change
When a model is employed for projecting changes in cli-mate it is first run for many simulated decades withoutany changes in external forcing in the system. The qual-ity of the simulation can then be assessed by comparingthe mean, the annual cycle and the variability statisticson different time scales with observations of the climate.In this way the model is evaluated (see Model Simula-tions of Present and Historical Climates, Volume 1). Themodel is then run with changes in external forcing, suchas with a possible future profile of greenhouse gas con-centrations. The differences between the climate statisticsin the two simulations provide an estimate of the accom-panying climate change. However, definitive projections ofpossible local climate changes, which are most needed forassessing impacts, are the most challenging to do with anycertainty.
Projections have been made of future global warmingeffects based upon model results to the year 2100 (seeProjection of Future Changes in Climate, Volume 1).Because the actions of humans are not predictable in anydeterministic sense, future projections necessarily containa “what if” emissions scenario. In addition, for a givenscenario, the rate of temperature increase depends on themodel and features such as how clouds are depicted, so thata range of possible outcomes exists. The IPCC projections(IPCC, 1996) for a mid-range emissions scenario in whichcarbon dioxide concentrations approximately double 1990values by the year 2100 produces global mean temperatureincreases ranging from 1.3 to 2.9 °C above 1990 valueswith a best estimate of about 2 °C. However, somewhatlarger temperature increases have been projected in theIPCC’s Third Assessment Report (IPCC, 2001) as a resultof projections that sulfur dioxide emissions are likely to becontrolled. Note that while these projections include crudeestimates of the effects of sulfate aerosol they deliberatelyomit other possible human influences such as changes inland use. A major concern is that the projected rates ofclimate change will exceed anything seen in nature in thepast 10 000 years.
REFERENCES
Bonan, G B (1997) Effects of Land Use on the Climate of theUnited States, Clim. Change, 37, 449–486.
Bonan, G B (1999) Frost Followed the Plow: Impacts of Defor-estation on the Climate of the United States, Ecol. Appl., 9(4),1305–1315.
Bond, G, Showers, W, Cheseby, M, Lotti, R, Almasi, P, deMeno-cal, P, Priore, P, Cullen, H, Hajdas, I, and Bonani, G (1997) APervasive Millennial-scale Cycle in North Atlantic Holoceneand Glacial Climates, Science, 278, 1257–1266.
Cubasch, U, Voss, R, Hegerl, G C, Waszkewitz, J, and Crow-ley, T J (1997) Simulation of the Influence of Solar Radiation
Variations on the Global Climate with an Ocean-atmosphereGeneral Circulation Model, Climate Dyn., 13, 757–767.
Dahl-Jensen, D, Mosegaard, K, Gundestrup, N, Clow, G D, John-sen, S J, Hansen, A W, and Balling, N (1998) Past Tempera-tures Directly from the Greenland Ice Sheet, Science, 282,268–271.
Hansen, J, Sato, M, Lacis, A, and Ruedy, R (1997) The MissingClimate Forcing, Philos. Trans. R. Soc. London, 352, 231–240.
Hansen, J, Sato, M, Ruedy, R, Lacis, A, Asamoah, K, Boren-stein, S, Brown, E, Cairns, B, Caliri, G, Campbell, M, Cur-ran, B, de Castro, S, Druyan, L, Fox, M, Johnson, C, Lerner, J,McCormick, M P, Miller, R, Minnis, P, Morrison, A, Pan-dolfo, L, Ramberran, I, Zaucker, F, Robinson, M, Russell, P,Shah, K, Stone, P, Tegen, I, Thomason, L, Wilder, J, and Wil-son, H (1996) A Pinatubo Climate Modeling Investigation, inThe Mount Pinatubo Eruption: Effects on the Atmosphere andClimate, eds G Fiocco, D Fua, and G Visconti, NATO ASISeries, Springer-Verlag. Heidelberg, Vol. I, 42, 233–272.
Hansen, J, Lacis, A, Ruedy, R, Sato, M, and Wilson, H (1993)How Sensitive is the World’s Climate? Natl. Geogr. Res.Exploration, 9(2) 142–158.
Hardin, G (1968) The Tragedy of the Commons, Science, 162,1243–1248.
IPCC (1990) Climate Change: the IPCC Scientific Assessment,eds J T Houghton, G J Jenkins, and J J Ephraums, CambridgeUniversity Press, Cambridge, 1–365.
IPCC (1994) Climate Change 1994. Radiative Forcing of ClimateChange and an Evaluation of the IPCC IS92 Emission Sce-narios, eds J T Houghton, L G Meira Filho, J Bruce, H Lee,B A Callander, E Haites, N Harris, and K Maskell, CambridgeUniversity Press, Cambridge, 1–339.
IPCC (1996) Climate Change (1995): The Science of ClimateChange, eds J T Houghton, F G Meira Filho, B A Callander,N Harris, A Kattenberg, and K Maskell, Cambridge UniversityPress, Cambridge, UK, 1–572.
IPCC (2001) Climate Change (2001): The Scientific Basis, edsJ T Houghton, Y Ding, D J Griggs, M Noguer, P J van derLinden, X Dai, K Maskell, and C A Johnson, Cambridge Uni-versity Press, Cambridge, 1–881.
Karl, T R and Knight, R W (1998) Secular Trends of Precipita-tion Amount, Frequency and Intensity in the USA, Bull. Am.Meteorol. Soc., 79, 231–242.
Mann, M E, Bradley, R S, and Hughes, M K (1999) NorthernHemisphere Temperatures During the Past Millennium: Infer-ences, Uncertainties, and Limitations, Geophys. Res. Lett., 26,759–762.
Kiehl, J T and Trenberth, K E (1997) Earth’s Annual GlobalMean Energy Budget, Bull. Am. Meteorol. Soc., 78, 197–208.
Oppenheimer, M (1998) Global Warming and the Stability of theWest Antarctic Ice Sheet, Nature, 393, 325–332.
Pollack, H N, Huang, S, and Shen, P Y (1998) Climate ChangeRecord in Subsurface Temperatures: a Global Perspective,Science, 282, 279–281.
Soroos, M S (1997) The Endangered Atmosphere, University ofSouth Carolina Press, Columbia, SC, 1–339.
Trenberth, K E (1983) What are the Seasons? Bull. Am. Meteorol.Soc., 64, 1276–1282.
Trenberth, K E (1993) Northern Hemisphere Climate Change:Physical Processes and Observed Changes, in Earth System

18 THE EARTH SYSTEM: PHYSICAL AND CHEMICAL DIMENSIONS OF GLOBAL ENVIRONMENTAL CHANGE
Responses to Global Change: Contrasts between North andSouth America, eds H A Mooney, E R Fuentes, and B I Kro-nberg, Academic Press, New York, 35–59.
Trenberth, K E (1998) Atmospheric Moisture Residence Timesand Cycling: Implications for Rainfall Rates With ClimateChange, Clim. Change, 39, 667–694.
Trenberth, K E and Hoar, T J (1996) The 1990–1995 El Nino-Southern Oscillation Event: Longest on Record, Geophys. Res.Lett., 23, 57–60.
Trenberth, K E and Hoar, T J (1997) El Nino and ClimateChange, Geophys. Res. Lett., 24, 3057–3060.
Trenberth, K E and Hurrell, J W (1994) Decadal Atmosphere–ocean Variations in the Pacific, Climate Dyn., 9, 303–319.
Trenberth, K E and Solomon, A (1994) The Global Heat Balance:
Heat Transports in the Atmosphere and Ocean, Climate Dyn.,10, 107–134.
Trenberth, K E and Guillemot, C J (1998) Evaluation of theAtmospheric Moisture and Hydrogical Cycle in the NCEP/NCAR Reanalyzes, Climate Dyn., 14, 213–231.
Trenberth, K E, Houghton, J T, and Meira Filho, L G (1996) TheClimate System: an Overview, Chapter 1 of Climate Change1995. The science of Climate Change. Contribution of WG 1to the Second Assessment Report of the IntergovernmentalPanel on Climate Change, eds J T Houghton, L G Meira Filho,B Callander, N Harris, A Kattenberg, and K Maskell, Cam-bridge University Press, Cambridge, 51–64.
Wigley, T M (1998) The Kyoto Protocol: CO2, CH4 and ClimateImplications, Geophys. Res. Lett., 25, 2285–2288.


