Earnings Report for the 3rd quarter ended September 30, 2021
31
Renesas’ Consolidated Financial Results for the Third Quarter Ended September 30, 2021 Media Contacts Investor Contacts Kyoko Okamoto Shigeo Muto Renesas Electronics Corporation Renesas Electronics Corporation +81 3-6773-3001 +81 3-6773-3002 [email protected] [email protected] Renesas Reports Financial Results for the Third Quarter Ended September 30, 2021 TOKYO, Japan, October 28, 2021 — Renesas Electronics Corporation (TSE:6723) today announced consolidated financial results in accordance with IFRS for the nine months ended September 30, 2021. Summary of Consolidated Financial Results (Note 1) Three months ended September 30, 2021 Nine months ended September 30, 2021 Billion Yen % of Revenue Billion Yen % of Revenue Revenue 258.4 100.0 680.0 100.0 Operating profit 53.8 20.8 119.5 17.6 Profit attributable to owners of parent 37.8 14.6 75.5 11.1 Capital expenditures (Note 2) 21.2 71.8 Depreciation and others 34.4 100.1 R&D expenses (Note 3) 39.9 107.1 Yen Yen Exchange rate (USD) 110 108 Exchange rate (EUR) 131 129 As of September 30, 2021 Billion Yen Total assets 2,328.0 Total equity 1,047.1 Equity attributable to owners of parent 1,043.8 Equity ratio attributable to owners of parent (%) 44.8 Interest-bearing liabilities 897.6 Note 1: All figures are rounded to the nearest 100 million yen. Note 2: Capital expenditures refer to the amount of capital for property, plant and equipment (manufacturing equipment) and intangible assets based on the amount of investment decisions made during the three months and nine months ended September 30, 2021. However, the investments from the former Integrated Device Technology, Inc. and Dialog Semiconductors Plc (hereinafter Dialog) are listed as an input basis. Note 3: R&D expenses includes capitalized R&D expenses recorded as intangible assets.
Transcript of Earnings Report for the 3rd quarter ended September 30, 2021

Renesas’ Consolidated Financial Results for the Third Quarter Ended September 30, 2021
Media Contacts Investor Contacts Kyoko Okamoto Shigeo Muto Renesas Electronics Corporation Renesas Electronics Corporation +81 3-6773-3001 +81 3-6773-3002 [email protected] [email protected]
Renesas Reports Financial Results for the Third Quarter Ended September 30, 2021
TOKYO, Japan, October 28, 2021 — Renesas Electronics Corporation (TSE:6723) today announced consolidated financial results in accordance with IFRS for the nine months ended September 30, 2021.
Summary of Consolidated Financial Results (Note 1)
Three months ended September 30, 2021
Nine months ended September 30, 2021
Billion Yen % of Revenue Billion Yen % of Revenue Revenue 258.4 100.0 680.0 100.0 Operating profit 53.8 20.8 119.5 17.6 Profit attributable to owners of parent
37.8 14.6 75.5 11.1
Capital expenditures (Note 2) 21.2 71.8 Depreciation and others 34.4 100.1 R&D expenses (Note 3) 39.9 107.1 Yen Yen Exchange rate (USD) 110 108 Exchange rate (EUR) 131 129
As of September 30, 2021
Billion Yen Total assets 2,328.0 Total equity 1,047.1 Equity attributable to owners of parent
1,043.8
Equity ratio attributable to owners of parent (%)
44.8
Interest-bearing liabilities 897.6 Note 1: All figures are rounded to the nearest 100 million yen. Note 2: Capital expenditures refer to the amount of capital for property, plant and equipment (manufacturing equipment) and intangible assets based on the
amount of investment decisions made during the three months and nine months ended September 30, 2021. However, the investments from the former Integrated Device Technology, Inc. and Dialog Semiconductors Plc (hereinafter Dialog) are listed as an input basis.
Note 3: R&D expenses includes capitalized R&D expenses recorded as intangible assets.
Renesas’ Consolidated Financial Results for the Third Quarter Ended September 30, 2021
RENESAS ELECTRONICS CORPORATION Consolidated Financial Results for the Third Quarter Ended September 30, 2021
English translation from the original Japanese-language document
October 28, 2021
Company name : Renesas Electronics Corporation Stock exchanges on which the shares are listed : Tokyo Stock Exchange, First Section Code number : 6723 URL : https://www.renesas.com Representative : Hidetoshi Shibata, President and CEO Contact person : Fujiko Yamaguchi, Vice President, CEO Office
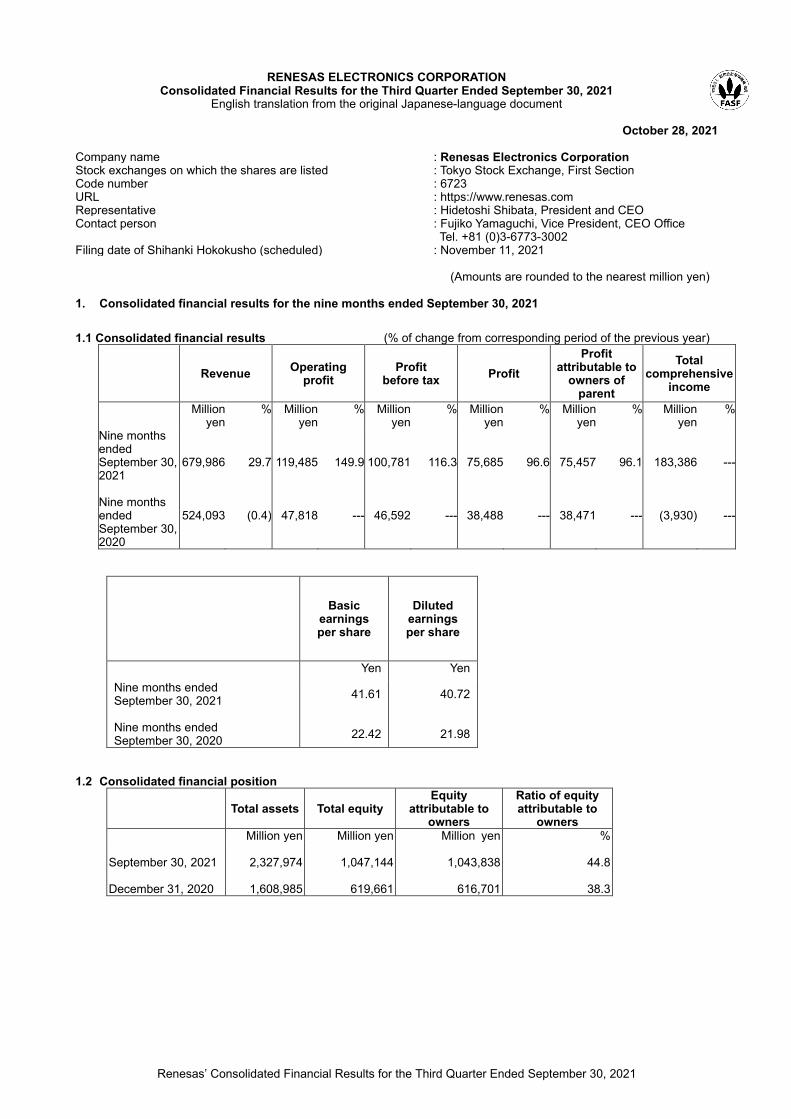
Tel. +81 (0)3-6773-3002 Filing date of Shihanki Hokokusho (scheduled) : November 11, 2021 (Amounts are rounded to the nearest million yen) 1. Consolidated financial results for the nine months ended September 30, 2021 1.1 Consolidated financial results (% of change from corresponding period of the previous year)
Revenue Operating profit
Profit before tax Profit
Profit attributable to
owners of parent
Total comprehensive
income
Million yen
% Million yen
%
Million yen
%
Million yen
%
Million yen
%
Million yen
%
Nine months ended September 30, 2021 Nine months ended September 30, 2020
679,986
524,093
29.7
(0.4)
119,485
47,818
149.9
---
100,781
46,592
116.3
---
75,685
38,488
96.6
---
75,457
38,471
96.1
---
183,386
(3,930)
---
---
Basic earnings per share
Diluted earnings per share
Yen Yen Nine months ended September 30, 2021 Nine months ended September 30, 2020
41.61
22.42
40.72
21.98
1.2 Consolidated financial position
Total assets Total equity Equity
attributable to owners
Ratio of equity attributable to
owners Million yen Million yen Million yen % September 30, 2021 December 31, 2020
2,327,974
1,608,985
1,047,144
619,661
1,043,838
616,701
44.8
38.3

Renesas’ Consolidated Financial Results for the Third Quarter Ended September 30, 2021
2. Cash dividends
Cash dividends per share At the end
of first quarter
At the end of second
quarter
At the end of third quarter
At the end of year Total
Yen Yen Yen Yen Yen Year ended December 31, 2020
--- 0.00 --- 0.00 0.00
Year ending December 31, 2021
--- 0.00 ---
Year ending December 31, 2021 (forecast)
0.00 0.00
Note: Change in forecast of cash dividends since the most recently announced forecast: Yes 3. Forecast of consolidated results for the full year ending December 31, 2021
Revenue Non-GAAP
Gross Margin Non-GAAP
Operating Margin
Full year ending December 31 2021
Million yen
977,986 (±4,000)
%
36.7 (±0.6)
%
52.8
%pts
5.4
%
28.8
%pts
9.5
Note 1: The Group reports its consolidated forecast for the full year as a range. The revenue forecast is provided assuming the midpoint and the range of the forecast are listed in brackets. The gross margin and the operating margin forecasts are
provided assuming the midpoint in the revenue forecast. For details, please refer to Appendix 1.3. “Consolidated Forecasts” on page 6.
Note 2: Non-GAAP figures are calculated by removing or adjusting non-recurring items and other adjustments from GAAP figures following a certain set of rules. The Group believes non-GAAP measures provide useful information in understanding and evaluating the Group’s constant business results, and therefore forecasts are provided on a non-GAAP basis. However, the
figure provided as revenue is based on IFRS and does not include non-GAAP adjustments.
4. Others 4.1 Changes in significant subsidiaries for the nine months ended September 30, 2021: No (Changes in specified subsidiaries resulting in changes in scope of consolidation) 4.2 Changes in Accounting Policies, Changes in Accounting Estimates and Corrections of Prior Period Errors
1. Changes in accounting policies with revision of accounting standard: No 2. Changes in accounting policies except for 4.2.1: No 3. Changes in accounting estimates: No
4.3 Number of shares issued and outstanding (common stock) 1. Number of shares issued and outstanding (including treasury stock)
As of September 30, 2021: 1,937,295,290 shares As of December 31, 2020: 1,731,898,990 shares
2. Number of treasury stock
As of September 30, 2021: 2,581 shares As of December 31, 2020: 2,581 shares
3. Average number of shares issued and outstanding
Nine months ended September 30, 2021: 1,813,309,523 shares Nine months ended September 30, 2020: 1,716,107,309 shares
(Note) Information regarding the implementation of audit procedures: These financial results are not subject to quarterly review procedures by the independent auditor.
Cautionary Statement The Group will hold an earnings conference for institutional investors and analysts on October 28, 2021. The Group plans to post the materials which are provided at the meeting, on the Group’s website on that day. The statements with respect to the financial outlook of Renesas Electronics Corporation (hereinafter “the Company”) and its consolidated subsidiaries (hereinafter “the Group”) are forward-looking statements involving risks and uncertainties. We caution you in advance that actual results may differ materially from such forward-looking statements due to changes in several important factors.
1 Renesas’ Consolidated Financial Results for the Third Quarter Ended September 30, 2021
[APPENDIX]
1. Business Results 2 1.1 Analysis of Business Results 2
1.2 Consolidated Financial Condition 5
1.3 Consolidated Forecasts 6
1.4 Forecasts of Cash Dividends 6
2. Condensed Consolidated Financial Statements 7
2.1 Condensed Consolidated Statement of Financial Position 7
2.2 Condensed Consolidated Statement of Profit or Loss and
Consolidated Statement of Comprehensive Income 9
2.3 Condensed Consolidated Statement of Changes in Equity 13
2.4 Condensed Consolidated Statement of Cash Flows 15
2.5 Notes to Condensed Consolidated Financial Statements 16
(Notes about Going Concern Assumption) 16
(Basis for Preparation) 16
(Basis of Condensed Consolidated Financial Statements) 16
(Significant Accounting Policies) 16
(Significant Accounting Estimates and Judgments) 16
(Business Segments) 17
(Business Combinations) 20
(Trade and Other Receivables) 22
(Assets held for sale and liabilities directly related to assets held for sale) 22
(Trade and Other Payables) 23
(Bonds and borrowings) 23
(Equity and Other Equity Items) 23
(Revenue) 23
(Selling, General and Administrative Expenses) 24 (Other Income) 25 (Other Expenses) 25
(Additional Information) 26
(Subsequent Events) 27

2 Renesas’ Consolidated Financial Results for the Third Quarter Ended September 30, 2021
1. Business Results
1.1 Analysis of Business Results The Group discloses consolidated business results in terms of both its internal measures which the management relies upon in making decisions (hereinafter the “Non-GAAP” financial measures) and those under IFRS. Non-GAAP gross profit and Non-GAAP operating profit are gross profit and operating profit under IFRS (hereinafter “IFRS gross profit” and “IFRS operating profit”) after excluding or adjusting non-recurring items and other adjustments following a certain set of rules. The Group believes providing non-GAAP forecasts will help to better understand the Group’s constant business results. Non-recurring items include depreciation of intangible assets recognized from acquisitions, other purchase price allocation (hereinafter “PPA”) adjustments and stock-based compensation as well as other non-recurring expenses and income the Group believes to be applicable.
The Group consists of “Automotive Business” and “Industrial/Infrastructure/IoT Business” and those are the Group’s reportable segments. For details, please refer to Appendix 2 “Condensed Consolidated Financial Statements, 2.5 Notes to Condensed Consolidated Financial Statements (Business Segments).”
(Note 1): For disclosure of Non-GAAP financial measures, the Group refers to the rules specified by the U.S. Securities
and Exchange Commission but does not fully comply with such rules. 1) Summary of Consolidated Financial Results for the Nine Months ended September 30, 2021 (Non-GAAP
basis)
Nine months ended September 30, 2020
(Jan 1 – Sep 30, 2020)
Nine months ended September 30, 2021
(Jan 1 – Sep 30, 2021) Increase
(Decrease)
Billion yen Billion yen Billion yen
% Change
Revenue (Note 2) 524.1 680.0 155.9 29.7%
Automotive 245.7 330.7 84.9 34.6%
Industrial/Infrastructure/IoT 270.8 336.1 65.3 24.1%
Non-GAAP Gross Profit Non-GAAP Gross Margin
248.6 47.4%
358.2 52.7%
109.6 5.2pts
44.1% ---
Automotive 92.4
37.6% 149.9
45.3% 57.5
7.7pts 62.3%
--
Industrial/Infrastructure/IoT 155.4 57.4%
206.2 61.4%
50.8 4.0pts
32.7% ---
Non-GAAP Operating Profit Non-GAAP Operating Margin
100.4 19.2%
197.9 29.1%
97.5 9.9pts
97.1% ---
Automotive 33.0
13.4% 83.3
25.2% 50.3
11.8pts 152.7%
---
Industrial/Infrastructure/IoT 68.3 25.2%
107.0 31.8%
38.6 6.6pts
56.5% ---
Note 1: For details on the above table, please refer to Appendix 2 “Condensed Consolidated Financial Statements, 2.5. Notes to Condensed Consolidated Financial Statements (Business Segments).”
Note 2: Consolidated revenue for the nine months ended September 30, 2020 and September 30, 2021 are based on IFRS and do not include non-GAAP adjustments.
The financial results for the nine months ended September 30, 2021 are as follows: <Revenue> Consolidated revenue for the nine months ended September 30, 2021 was 680.0 billion yen, a 29.7% increase year on year. This was due to an increase in revenue capturing demand expansion in the Industrial/Infrastructure/IoT Business and a sales increase effect from the consolidation of Dialog following the completion of the acquisition on August 31, 2021, in addition to an increase in revenue in the Automotive Business as a result of the recovery from the reduced vehicle production caused by the COVID-19 pandemic mostly during the first half of the fiscal year ended 2020. It should be noted that as of September 14, 2021, Dialog has changed its company name to Dialog Semiconductor Limited. <Non-GAAP Gross Profit (Margin)> Non-GAAP gross profits for the nine months ended September 30, 2021 was 358.2 billion yen, a 109.6 billion yen increase year on year. This was mainly due to increases in revenue for both Automotive and Industrial/Infrastructure/IoT Businesses as well as an increase in gross margin mainly from improvements in product mix and the factory utilization rate. As a result, non-GAAP gross margin for the nine months ended September 30, 2021 was 52.7%, an increase by 5.2 points year on year. <Non-GAAP Operating Profit (Margin)>

3 Renesas’ Consolidated Financial Results for the Third Quarter Ended September 30, 2021
Non-GAAP operating profit for the nine months ended September 30, 2021 was 197.9 billion yen, a 97.5 billion yen increase year on year. This was mainly due to an increase in gross profit as well as an effort to streamline non-GAAP adjusted selling, general and administrative expenses. As a result, non-GAAP operating margin for the nine months ended September 30, 2021 was 29.1%, an increase by 9.9 points year on year. The revenue breakdown of the business segments for the nine months ended September 30, 2021 are as follows: Automotive Business The Automotive Business includes the product categories “Automotive Control,” comprising semiconductor devices for controlling automobile engines and bodies, and “Automotive Information,” comprising of semiconductor devices used in sensing systems for detecting environments inside and outside the vehicle as well as Automotive Information devices such as IVI (in-vehicle infotainment) and instrument panels used to give various information to the driver of the vehicle. The Group mainly supplies microcontrollers (MCUs), system-on-chips (SoCs), analog semiconductor devices and power semiconductor devices in each of these categories.
Revenue of the Automotive Business for the nine months ended September 30, 2021 was 330.7 billion yen, a 34.6% increase year on year. This was mainly due to increases in sales for both the “Automotive Control” and “Automotive Information” categories following the recovery from the reduced vehicle production.
Non-GAAP gross profit of the Automotive Business for the nine months ended September 30, 2021 was 149.9 billion yen, a 57.5 billion yen increase year on year. This was due to an increase in gross margin mainly from product mix improvements in addition to an increase in revenue.
Non-GAAP operating profit of the Automotive Business for the nine months ended September 30, 2021 was 83.3 billion yen, a 50.3 billion yen increase year on year, mainly due to the sales increase effect as well as an increase in gross margin. Industrial/Infrastructure/IoT Business The Industrial/Infrastructure/IoT Business includes the categories “Industrial,” “Infrastructure” and “IoT” which support a smart society. The Group mainly supplies MCUs and system-on-chips (SoCs) in each of these categories.
Revenue of the Industrial/Infrastructure/IoT Business for the nine months ended September 30, 2021 was 336.1 billion yen, a 24.1% increase year on year. This was mainly due to an increase in revenues in the “Industrial,” “Infrastructure,” and “IoT” categories in addition to revenue increase from the consolidation of Dialog. Main contributors were devices for factory automation, data centers, mobile phone base stations, and OA devices such as PCs
Non-GAAP gross profit of the Industrial/Infrastructure/IoT Business for the nine months ended September 30, 2021 was 206.2 billion yen, a 50.8 billion yen increase year on year. This was mainly due to an increase in gross margin from product mix improvements in addition to an increase in revenue.
Non-GAAP operating profit of the Industrial/Infrastructure/IoT Business for the nine months ended September 30, 2021 was 107.0 billion yen, a 38.6 billion yen increase year on year, due to the sales increase effect as well as an increase in profits from gross margin improvements. 2) Reconciliation of Non-GAAP gross profit to IFRS gross profit and Non-GAAP operating profit to IFRS operating
profit
(Billion yen)
Nine months ended September 30, 2020
(Jan 1 – Sep 30, 2020)
Nine months ended September 30, 2021
(Jan 1 – Sep 30, 2021) Non-GAAP gross profit Non-GAAP gross margin
248.6 47.4%
358.2 52.7%
Amortization of purchased intangible assets and depreciation of property, plant and equipment (1.2) (0.6)
Market valuation of inventories --- (3.9)
Stock-based compensation (1.0) (0.9) Other reconciliation items in non-recurring expenses and adjustments (0.6) (15.0)
IFRS gross profit IFRS gross margin
245.8 46.9%
337.7 49.7%
Non-GAAP operating profit Non-GAAP operating margin
100.4 19.2%
197.9 29.1%
Amortization of purchased intangible assets and depreciation of property, plant and equipment (42.1) (41.9)
Market valuation of inventories --- (3.9)
Stock-based compensation (11.7) (10.3) Other reconciliation items in non-recurring expenses and adjustments 1.2 (22.3)
IFRS operating profit IFRS operating margin
47.8 9.1%
119.5 17.6%
Note: “Other reconciliation items in non-recurring expenses and adjustments” includes the non-recurring items related to acquisitions and other adjustments as well as non-recurring profits or losses

4 Renesas’ Consolidated Financial Results for the Third Quarter Ended September 30, 2021
3) Summary of Consolidated Financial Results for the Nine Months ended September 30, 2021 (IFRS basis)
Nine months ended September 30, 2020
(Jan 1 – Sep 30, 2020)
Nine months ended September 30, 2021
(Jan 1 – Sep 30, 2021) Increase
(Decrease)
Billion yen Billion yen Billion yen
% Change
Revenue 524.1 680.0 155.9 29.7%
Gross Profit Gross Margin
245.8 46.9%
337.7 49.7%
91.9 2.8 pts
37.4% ---
Operating Profit Operating Margin
47.8 9.1%
119.5 17.6%
71.7 8.4 pts
149.9% ---

5 Renesas’ Consolidated Financial Results for the Third Quarter Ended September 30, 2021
1.2 Consolidated Financial Condition 1.2.1 Total Assets, Liabilities and Total Equity As of
December 31, 2020 As of
September 30, 2021 Increase
(Decrease) Billion yen Billion yen Billion yen Total assets Total equity Equity attributable to owners of parent Equity ratio attributable to owners of parent (%) Interest-bearing liabilities Debt to equity ratio
1,609.0 619.7 616.7 38.3
693.7 1.12
2,328.0 1,047.1 1,043.8
44.8 897.6 0.86
719.0 427.5 427.1
6.5 203.9 (0.26)
Total assets as of the September 30, 2021 were 2,328.0 billion yen, a 719.0 billion yen increase from December 31, 2020. This was mainly due to an increase in goodwill owing to the acquisition of Dialog. Total equity was 1,047.1 billion yen, a 427.5 billion yen increase from December 31, 2020. This was mainly due to: increases in share capital and capital surplus as a result of the issuance of new shares mainly through public offering; an increase in other components of equity from an increase in exchange differences on translation of foreign operations following fluctuations in the exchange rate; and an increase in retained earnings through profit. Equity attributable to owners of parent increased by 427.1 billion yen from December 31, 2020, and Equity ratio attributable to owners of parent was 44.8%. In addition, Interest-bearing liabilities increased by 203.9 billion yen from December 31, 2020, mainly due to an increase in borrowings following the acquisition of Dialog. Consequently, Debt to equity ratio was 0.86. 1.2.2 Cash Flows Nine months ended
September 30, 2020 (Jan 1 – Sep 30, 2020)
Nine months ended September 30, 2021
(Jan 1 – Sep 30, 2021) Billion yen Billion yen Net cash provided by (used in) operating activities Net cash provided by (used in) investing activities
141.5 (30.1)
196.2 (619.5)
Free cash flows (Note) 111.5 (423.3) Net cash provided by (used in) financing activities (78.5) 414.6 Cash and cash equivalents at the beginning of period Cash and cash equivalents at the end of period
146.5 175.9
219.8 223.0
Note: As defined as a total of net cash flows provided by (used in) operating and investing activities (Net cash provided by (used in) operating activities) Net cash provided by operating activities for the nine months ended September 30, 2021 was 196.2 billion yen. This was mainly due to a recording of 100.8 billion yen in profit before tax as well as adjustments in non-cash items such as depreciation. (Net cash provided by (used in) investing activities) Net cash used in investing activities for the nine months ended September 30, 2021 was 619.5 billion yen. This was mainly due to the acquisition of shares of Dialog. The foregoing resulted in negative free cash flows of 423.3 billion yen for the nine months ended September 30, 2021. (Net cash provided by (used in) financing activities) Net cash used in financing activities for the nine months ended September 30, 2021 was 414.6 billion yen. This was mainly due to new borrowings from main financing banks in order to procure funds necessary for the acquisition of Dialog as well as income from the issuance of new shares through public offering.

6 Renesas’ Consolidated Financial Results for the Third Quarter Ended September 30, 2021
1.3 Consolidated Forecasts The Group reports its consolidated forecasts for the full year as a range because of the difficulty of forecasting results with high accuracy due to the short-term volatility of the semiconductor market. Additionally, in order to provide useful information to better understand the Group’s constant business results, figures such as gross margin and operating margin are presented in the non-GAAP format, which excludes or adjusts the non-recurring items related to acquisitions and other adjustments including non-recurring expenses or income from the figures based on GAAP (IFRS based) following a certain set of rules. However, the figure provided as revenue is based on IFRS and does not include non-GAAP adjustments. The revenue forecast is provided assuming the midpoint and the range of the forecast are listed in brackets. The gross margin and operating margin forecasts are given assuming the midpoint in the revenue forecast. (For the full year ending December 31, 2021)
Revenue Non-GAAP
Gross Margin Non-GAAP
Operating Margin
Previous forecasts --- --- ---
Forecasts as of October 28, 2021
Million yen
977,986 (±4,000)
%
52.8
%
28.8
Increase (decrease) --- --- ---
Percentage change --- --- ---
Reference: Results of the full year ended December 31, 2020
715,673 47.3 19.2
Note: Non-GAAP figures are calculated by removing or adjusting non-recurring items and other adjustments from GAAP figures following a certain set of rules. The Group believes non-GAAP measures provide useful information in understanding and evaluating the Group’s constant business results, and therefore, forecasts are provided as a non-GAAP basis. This adjustment and exclusion include depreciation of property, plant and equipment, amortization of intangible assets recognized from acquisitions, other PPA adjustments and stock-based compensation, as well as other non-recurring expenses and income the Group believes to be applicable.
The consolidated forecasts for the full year ending December 31, 2021 are calculated by combining the forecasts for the three months ending December 31, 2021, to the financial results of the nine months ended September 30, 2021. The consolidated forecasts for the full year ending December 31, 2021 are calculated at the rate of 109 yen per USD and 129 yen per Euro. The statements with respect to the financial outlook of the Group are forward-looking statements involving risks and uncertainties. The Company cautions you in advance that actual results may vary materially from such forward-looking statements due to several important factors. 1.4 Forecasts of Cash Dividends For the full year ending December 31, 2021, the Group suspends year-end dividend payment. The Group will divert its retained earnings for strategic investment opportunities that will enable the Group to respond to rapid environmental changes in order to thrive in the global marketplace, thus increasing shareholder profit by improving corporate value. Based on a long-term standpoint, the Group aims to realize stable and sustained growth in profits to allow dividends to be reinstated.
(For the full year ending December 31, 2021)
Interim Dividend Year-End Dividend Annual Dividend
0 Yen 0 Yen 0 Yen

7 Renesas’ Consolidated Financial Results for the Third Quarter Ended September 30, 2021
2. Condensed Consolidated Financial Statements 2.1 Condensed Consolidated Statement of Financial Position
(In millions of yen) As of December 31, 2020 As of September 30, 2021
Assets Current assets
Cash and cash equivalents 219,786 222,989 Trade and other receivables 82,318 132,647 Inventories 89,761 135,185 Other current financial assets 605 541 Income taxes receivable 2,190 4,996 Other current assets 8,162 13,333
Subtotal 402,822 509,691 Assets held for sale ― 2,606 Total current assets 402,822 512,297
Non-current assets
Property, plant and equipment 187,354 193,576 Goodwill 590,459 1,167,663 Intangible assets 364,764 378,988 Other non-current financial assets 18,101 26,398 Deferred tax assets 40,600 44,712 Other non-current assets 4,885 4,340 Total non-current assets 1,206,163 1,815,677 Total assets 1,608,985 2,327,974
8 Renesas’ Consolidated Financial Results for the Third Quarter Ended September 30, 2021
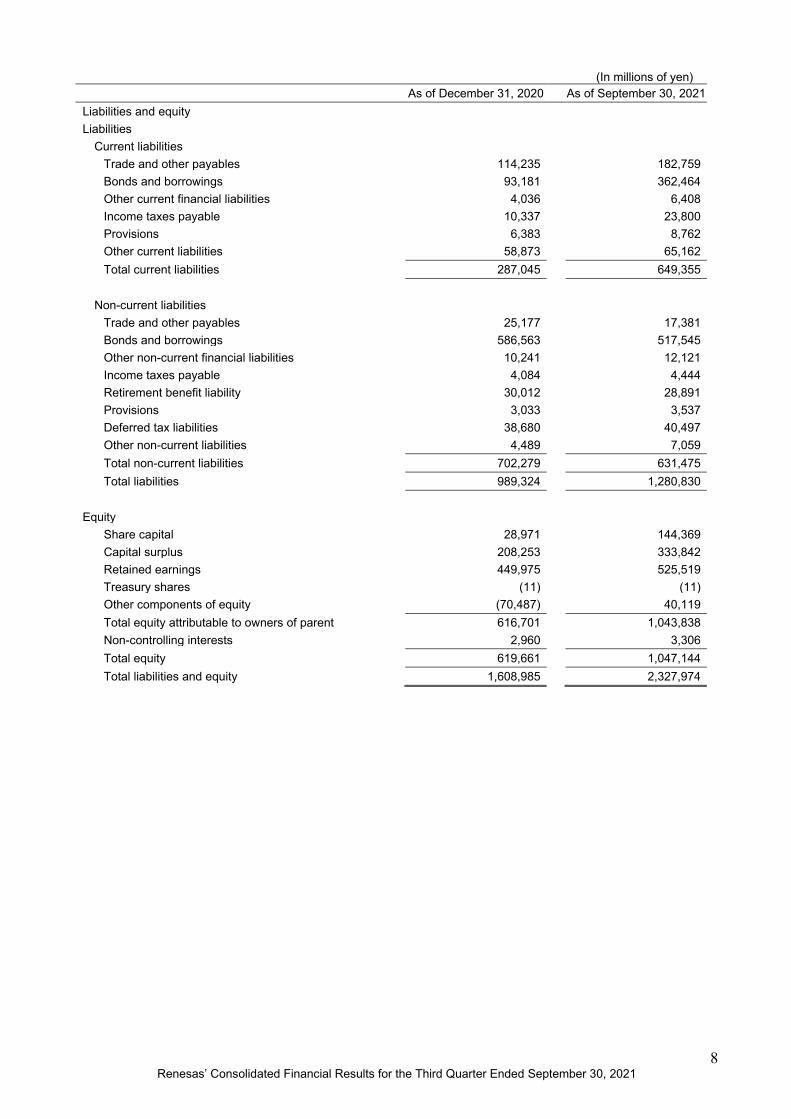
(In millions of yen) As of December 31, 2020 As of September 30, 2021
Liabilities and equity Liabilities
Current liabilities Trade and other payables 114,235 182,759 Bonds and borrowings 93,181 362,464 Other current financial liabilities 4,036 6,408 Income taxes payable 10,337 23,800 Provisions 6,383 8,762 Other current liabilities 58,873 65,162 Total current liabilities 287,045 649,355
Non-current liabilities
Trade and other payables 25,177 17,381 Bonds and borrowings 586,563 517,545 Other non-current financial liabilities 10,241 12,121 Income taxes payable 4,084 4,444 Retirement benefit liability 30,012 28,891 Provisions 3,033 3,537 Deferred tax liabilities 38,680 40,497 Other non-current liabilities 4,489 7,059 Total non-current liabilities 702,279 631,475 Total liabilities 989,324 1,280,830
Equity
Share capital 28,971 144,369 Capital surplus 208,253 333,842 Retained earnings 449,975 525,519 Treasury shares (11) (11) Other components of equity (70,487) 40,119 Total equity attributable to owners of parent 616,701 1,043,838 Non-controlling interests 2,960 3,306 Total equity 619,661 1,047,144 Total liabilities and equity 1,608,985 2,327,974

9 Renesas’ Consolidated Financial Results for the Third Quarter Ended September 30, 2021
2.2 Condensed Consolidated Statement of Profit or Loss and Consolidated Statement of Comprehensive Income Condensed Consolidated Statement of Profit or Loss (Nine months ended September 30, 2020 and September 30, 2021)
(In millions of yen) Nine months ended
September 30, 2020 Nine months ended September 30, 2021
Revenue 524,093 679,986 Cost of sales (278,317) (342,291) Gross profit 245,776 337,695 Selling, general and administrative expenses (198,269) (215,401) Other income 3,632 5,648 Other expenses (3,321) (8,457) Operating profit 47,818 119,485 Finance income 4,509 3,097 Finance costs (5,735) (21,801) Profit before tax 46,592 100,781 Income tax expense (8,104) (25,096) Profit 38,488 75,685 Profit attributable to
Owners of parent 38,471 75,457 Non-controlling interests 17 228
Profit 38,488 75,685 Earnings per share
Basic earnings per share (yen) 22.42 41.61 Diluted earnings per share (yen) 21.98 40.72

10 Renesas’ Consolidated Financial Results for the Third Quarter Ended September 30, 2021
Condensed Consolidated Statement of Comprehensive Income (Nine months ended September 30, 2020 and September 30, 2021)
(In millions of yen)
Nine months ended September 30, 2020 Nine months ended
September 30, 2021 Profit 38,488 75,685 Other comprehensive income Items that will not be reclassified to profit or loss
Remeasurements of defined benefit plans 260 (138) Equity instruments measured at fair value through other comprehensive income (432) (156)
Total of items that will not be reclassified to profit or loss (172) (294)
Items that may be reclassified subsequently to profit or loss
Exchange differences on translation of foreign operations (42,246) 111,966
Cash flow hedges ― (3,971) Total of items that may be reclassified subsequently to profit or loss (42,246) 107,995
Total other comprehensive income (42,418) 107,701 Total comprehensive income (3,930) 183,386
Comprehensive income attributable to
Owners of parent (3,841) 183,040 Non-controlling interests (89) 346 Total comprehensive income (3,930) 183,386

11 Renesas’ Consolidated Financial Results for the Third Quarter Ended September 30, 2021
Condensed Consolidated Statement of Profit or Loss (Three months ended September 30, 2020 and September 30, 2021)
(In millions of yen) Three months ended
September 30, 2020 Three months ended September 30, 2021
Revenue 178,678 258,433 Cost of sales (94,307) (123,424) Gross profit 84,371 135,009 Selling, general and administrative expenses (66,790) (79,969) Other income 486 1,037 Other expenses (818) (2,253) Operating profit 17,249 53,824 Finance income 1,213 1,667 Finance costs (1,639) (5,446) Profit before tax 16,823 50,045 Income tax expense (1,595) (12,239) Profit 15,228 37,806 Profit attributable to
Owners of parent 15,259 37,752 Non-controlling interests (31) 54
Profit 15,228 37,806 Earnings per share
Basic earnings per share (yen) 8.86 19.50 Diluted earnings per share (yen) 8.69 19.12

12 Renesas’ Consolidated Financial Results for the Third Quarter Ended September 30, 2021
Condensed Consolidated Statement of Comprehensive Income (Three months ended September 30, 2020 and September 30, 2021)
(In millions of yen)
Three months ended September 30, 2020 Three months ended
September 30, 2021 Profit 15,228 37,806 Other comprehensive income Items that will not be reclassified to profit or loss
Remeasurements of defined benefit plans (10) 2 Equity instruments measured at fair value through other comprehensive income 2 (156)
Total of items that will not be reclassified to profit or loss (8) (154)
Items that may be reclassified subsequently to profit or loss
Exchange differences on translation of foreign operations (18,430) 26,788
Cash flow hedges ― (7,388) Total of items that may be reclassified subsequently to profit or loss (18,430) 19,400
Total other comprehensive income (18,438) 19,246 Total comprehensive income (3,210) 57,052
Comprehensive income attributable to
Owners of parent (3,207) 56,987 Non-controlling interests (3) 65 Total comprehensive income (3,210) 57,052

13 Renesas’ Consolidated Financial Results for the Third Quarter Ended September 30, 2021
2.3 Condensed Consolidated Statement of Changes in Equity (Nine months ended September 30, 2020)
(In millions of yen) Equity attributable to owners of parent
Share capital Capital surplus Retained earnings Treasury shares
Other components of equity
Share acquisition rights
Remeasurements of defined benefit
plans
Equity instruments
measured at fair value through
other comprehensive
income Balance as of January 1, 2020 22,213 201,588 403,857 (11) 16,053 ― (1,131)
Profit ― ― 38,471 ― ― ― ― Other comprehensive income
― ― ― ― ― 260 (432)
Total comprehensive income ― ― 38,471 ― ― 260 (432)
Issuance of new shares 4,006 4,006 ― ― ― ― ―
Share-based payment transactions
― ― ― ― 3,685 ― ―
Transfer to retained earnings ― ― 847 ― (1,019) (260) 432
Total transactions with owners 4,006 4,006 847 ― 2,666 (260) 432
Balance as of September 30, 2020
26,219 205,594 443,175 (11) 18,719 ― (1,131)
Equity attributable to owners of parent
Non-controlling interests Total equity
Other components of equity Total equity
attributable to owners of parent
Exchange differences on translation of
foreign operations
Cash flow hedges Total
Balance as of January 1, 2020 (21,114) ― (6,192) 621,455 2,949 624,404
Profit ― ― ― 38,471 17 38,488 Other comprehensive income
(42,140) ― (42,312) (42,312) (106) (42,418)
Total comprehensive income (42,140) ― (42,312) (3,841) (89) (3,930)
Issuance of new shares ― ― ― 8,012 ― 8,012
Share-based payment transactions
― ― 3,685 3,685 ― 3,685
Transfer to retained earnings ― ― (847) ― ― ―
Total transactions with owners ― ― 2,838 11,697 ― 11,697
Balance as of September 30, 2020
(63,254) ― (45,666) 629,311 2,860 632,171

14 Renesas’ Consolidated Financial Results for the Third Quarter Ended September 30, 2021
(Nine months ended September 30, 2021)
(In millions of yen) Equity attributable to owners of parent
Share capital Capital surplus Retained earnings Treasury shares
Other components of equity
Share acquisition rights
Remeasurements of defined benefit
plans
Equity instruments
measured at fair value through
other comprehensive
income Balance as of January 1, 2021 28,971 208,253 449,975 (11) 15,959 ― (1,131)
Profit ― ― 75,457 ― ― ― ― Other comprehensive income
― ― ― ― ― (138) (156)
Total comprehensive income ― ― 75,457 ― ― (138) (156)
Issuance of new shares 115,398 114,572 ― ― ― ― ―
Share-based payment transactions
― 11,017 ― ― (494) ― ―
Transfer to retained earnings ― ― 87 ― (269) 138 44
Reclassification to non-financial assets
― ― ― ― ― ― ―
Total transactions with owners 115,398 125,589 87 ― (763) 138 44
Balance as of September 30, 2021
144,369 333,842 525,519 (11) 15,196 ― (1,243)
Equity attributable to owners of parent
Non-controlling interests Total equity
Other components of equity Total equity
attributable to owners of parent
Exchange differences on translation of
foreign operations
Cash flow hedges Total
Balance as of January 1, 2021 (85,315) ― (70,487) 616,701 2,960 619,661
Profit ― ― ― 75,457 228 75,685 Other comprehensive income
111,848 (3,971) 107,583 107,583 118 107,701
Total comprehensive income 111,848 (3,971) 107,583 183,040 346 183,386
Issuance of new shares ― ― ― 229,970 ― 229,970
Share-based payment transactions
― ― (494) 10,523 ― 10,523
Transfer to retained earnings ― ― (87) ― ― ―
Reclassification to non-financial assets
― 3,604 3,604 3,604 ― 3,604
Total transactions with owners ― 3,604 3,023 244,097 ― 244,097
Balance as of September 30, 2021
26,533 (367) 40,119 1,043,838 3,306 1,047,144
15 Renesas’ Consolidated Financial Results for the Third Quarter Ended September 30, 2021
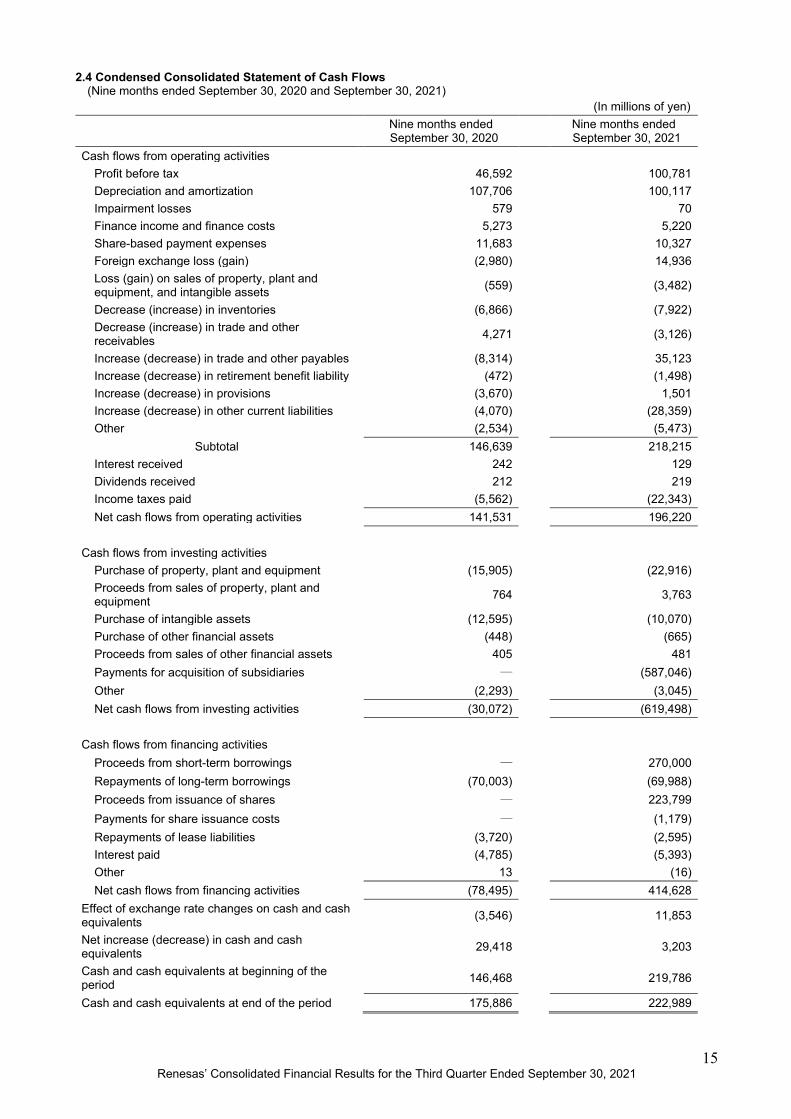
2.4 Condensed Consolidated Statement of Cash Flows (Nine months ended September 30, 2020 and September 30, 2021)
(In millions of yen)
Nine months ended September 30, 2020 Nine months ended
September 30, 2021 Cash flows from operating activities
Profit before tax 46,592 100,781 Depreciation and amortization 107,706 100,117 Impairment losses 579 70 Finance income and finance costs 5,273 5,220 Share-based payment expenses 11,683 10,327 Foreign exchange loss (gain) (2,980) 14,936 Loss (gain) on sales of property, plant and equipment, and intangible assets (559) (3,482)
Decrease (increase) in inventories (6,866) (7,922) Decrease (increase) in trade and other receivables 4,271 (3,126)
Increase (decrease) in trade and other payables (8,314) 35,123 Increase (decrease) in retirement benefit liability (472) (1,498) Increase (decrease) in provisions (3,670) 1,501 Increase (decrease) in other current liabilities (4,070) (28,359) Other (2,534) (5,473)
Subtotal 146,639 218,215 Interest received 242 129 Dividends received 212 219 Income taxes paid (5,562) (22,343) Net cash flows from operating activities 141,531 196,220
Cash flows from investing activities
Purchase of property, plant and equipment (15,905) (22,916) Proceeds from sales of property, plant and equipment 764 3,763
Purchase of intangible assets (12,595) (10,070) Purchase of other financial assets (448) (665) Proceeds from sales of other financial assets 405 481 Payments for acquisition of subsidiaries ― (587,046) Other (2,293) (3,045) Net cash flows from investing activities (30,072) (619,498)
Cash flows from financing activities
Proceeds from short-term borrowings ― 270,000 Repayments of long-term borrowings (70,003) (69,988) Proceeds from issuance of shares ― 223,799 Payments for share issuance costs ― (1,179) Repayments of lease liabilities (3,720) (2,595) Interest paid (4,785) (5,393) Other 13 (16) Net cash flows from financing activities (78,495) 414,628
Effect of exchange rate changes on cash and cash equivalents (3,546) 11,853
Net increase (decrease) in cash and cash equivalents 29,418 3,203
Cash and cash equivalents at beginning of the period 146,468 219,786
Cash and cash equivalents at end of the period 175,886 222,989

16 Renesas’ Consolidated Financial Results for the Third Quarter Ended September 30, 2021
2.5 Notes to Condensed Consolidated Financial Statements (Notes about Going Concern Assumption) Not applicable (Basis for Preparation)
(1) Compliance with IFRS Because the Group meets the requirements for “Specified Companies Complying with Designated International Accounting Standards” stated in Article 1-2 of Ordinance on Consolidated Financial Statements, the Group has adopted the provisions of Article 93 of the Ordinance. The condensed consolidated financial statements of the Group have been prepared in accordance with International Accounting Standards 34 “Interim Financial Reporting” (hereafter “IAS 34”).
The condensed consolidated financial statements do not contain all of the information that would be required on consolidated financial statements for a fiscal year. Therefore, the condensed consolidated financial statements should be used with the consolidated financial statements for the prior fiscal year.
(2) Basis of measurement
In the condensed consolidated financial statements of the Group, assets and liabilities are measured at a historical cost basis except for items such as financial instruments measured at fair value.
(3) Functional currency and presentation currency The condensed consolidated financial statements are presented in Japanese yen (rounded to the nearest million yen), which is the functional currency of the Company.
(4) Change in Presentation (Condensed Consolidated Statement of Cash Flows) “Foreign exchange loss (gain),” which was disclosed in “Other” under “Cash flows from operating activities” for the prior fiscal year, has been presented independently from the current fiscal year due to the increase in its materiality. In order to reflect this change in presentation, Condensed Consolidated Statement of Cash Flows for the prior fiscal year has been reclassified. Consequently, (5,514) million yen of “Other”, which was disclosed under “Cash flows from operating activities,” has been classified to (2,980) million yen of “Foreign exchange loss (gain)” and (2,534) million yen of “Other.”
(Basis of Condensed Consolidated Financial Statements)
Scope of consolidation Two companies have been excluded from the scope of consolidation due to liquidation for the three months ended March 31, 2021. A company has been excluded from the scope of consolidation due to the transfer of the shares for the three months ended June 30, 2021. 43 companies have been newly included in the scope of consolidation due to acquisition of share capital of Dialog Semiconductor Plc (hereinafter “Dialog”). A company has been excluded from the scope of consolidation due to liquidation for the three months ended September 30, 2021.
In addition, Dialog changed its company name to Dialog Semiconductor Limited on September 14, 2021. (Significant Accounting Policies)
The significant accounting policies for the condensed consolidated financial statements of the Group are the same with the accounting policies applied in preparing the Group's consolidated financial statements for the prior fiscal year.
In addition, income taxes for the nine months ended September 30, 2021 are calculated using the estimated annual effective tax rate.
(Significant Accounting Estimates and Judgments) In preparing the condensed consolidated financial statements, management of the Group makes judgements, accounting estimates and assumptions that could have an impact on the application of accounting policies and the reporting amounts of assets, liabilities, revenue and expenses. These estimates and assumptions are based on the best judgment of management, taking into account various factors that are deemed reasonable on the closing date in light of past experience and available information. However, figures based on these estimates and assumptions may differ from the actual results due to their nature.
Estimates and underlying assumptions are reviewed continuously. The impact of the review of these estimates is recognized in the period when the estimates are revised and future periods.
Estimates and assumptions that could have a significant impact on the figures in the condensed consolidated financial statements are the same with those stated in the Group's consolidated financial statements for the prior fiscal year.
The Group reflects the impact of the spread of COVID-19 to estimates and assumptions (such as judgment to indication of impairment of goodwill and collectability of deferred tax assets), to a reasonable extent based on available information.

17 Renesas’ Consolidated Financial Results for the Third Quarter Ended September 30, 2021
(Business Segments) (1) Overview of reportable segments
The Group’s reportable segments are components of the Group for which separate financial information is available that is evaluated regularly by the Board of Directors to determine the allocation of management resources and assess performance.
The Group mainly consists of “Automotive Business” and “Industrial/Infrastructure/IoT Business” and those are the Group’s reportable segments. The Automotive Business includes the product categories “Automotive control,” comprising semiconductor devices for controlling automobile engines and bodies, and “Automotive information,” comprising of semiconductor devices used in sensing systems for detecting environments inside and outside the vehicle as well as automotive information devices such as IVI (in-vehicle infotainment) and instrument panels used to give various information to the driver of the vehicle. The Group mainly supplies microcontrollers (MCUs), system-on-chips (SoCs), analog semiconductor devices and power semiconductor devices in each of these categories. The Industrial/Infrastructure/IoT Business includes the product categories “Industrial,” “Infrastructure” and “IoT” which support the smart society. The Group mainly supplies MCUs and SoCs in each of these categories. Additionally, commissioned development and manufacturing from the Group’s design and manufacturing subsidiaries are categorized as “Other.”
(2) Information on reportable segments
The accounting treatment for the reportable segments is same as described in “Significant Accounting Policies.” As for information on the reportable segments, the Group discloses revenue from external customers, segment gross profit, and segment operating profit (which is the segment profit). The Group added segment gross profit as a disclosure item in the business segments from the three months ended March 31, 2021. This change is reflected to the business segments for the three and nine months ended September 30, 2020.
Segment gross profit and segment operating profit are internal key performance indicators which are used by management when making decisions and are calculated by excluding the following items from IFRS gross profit and operating profit (Adjustments 2): amortization of certain tangible and intangible assets related to business combinations; certain share-based payment expenses; and other non-recurring items. Other non-recurring items include costs related to acquisitions and gains and losses the Group believes to be appropriate for deduction. However, certain other non-recurring items the Group believes to be covered by each reportable segment. are included in segment gross profit and segment operating profit of each reportable segment (Adjustments 1). The Group’s Executive Officers assess the performance after eliminating intragroup transactions, and therefore, there are no transfers between reportable segments included within the segment results.
Information on reportable segments is as follows.
Nine months ended September 30, 2020 (In millions of yen) Reportable Segments
Other Adjustments 1 Total Adjustments
2 Consolidation
basis Automotive Industrial/
Infrastructure/ IoT
Revenue from external customers 245,725 270,793 7,575 ― 524,093 ― 524,093
Segment gross profit 92,392 155,395 813 ― 248,600 (2,824) 245,776 Segment operating profit 32,960 68,328 880 (1,801) 100,367 (52,549) 47,818
Finance income 4,509 Finance costs (5,735) Profit before tax 46,592 (Other adjustments) Depreciation and amortization 35,021 30,130 236 ― 65,387 42,319 107,706
Nine months ended September 30, 2021 (In millions of yen)
Reportable Segments
Other Adjustments 1 Total Adjustments
2 Consolidation
basis Automotive Industrial/
Infrastructure/ IoT
Revenue from external customers 330,666 336,100 13,220 ― 679,986 ― 679,986
Segment gross profit 149,925 206,207 1,679 365 358,176 (20,481) 337,695 Segment operating profit 83,292 106,953 1,678 5,935 197,858 (78,373) 119,485
Finance income 3,097 Finance costs (21,801) Profit before tax 100,781 (Other adjustments) Depreciation and amortization 32,946 25,185 ― ― 58,131 41,986 100,117

18 Renesas’ Consolidated Financial Results for the Third Quarter Ended September 30, 2021
Three months ended September 30, 2020 (In millions of yen) Reportable Segments
Other Adjustments 1 Total Adjustments
2 Consolidation
basis Automotive Industrial/
Infrastructure/ IoT
Revenue from external customers 79,551 96,671 2,456 ― 178,678 ― 178,678
Segment gross profit 29,743 55,008 161 ― 84,912 (541) 84,371 Segment operating profit 10,704 25,130 138 502 36,474 (19,225) 17,249
Finance income 1,213 Finance costs (1,639) Profit before tax 16,823 (Other adjustments) Depreciation and amortization 10,877 9,930 ― ― 20,807 13,733 34,540
Three months ended September 30, 2021 (In millions of yen)
Reportable Segments
Other Adjustments 1 Total Adjustments
2 Consolidation
basis Automotive Industrial/
Infrastructure/ IoT
Revenue from external customers 121,310 132,614 4,509 ― 258,433 ― 258,433
Segment gross profit 59,637 82,398 593 76 142,704 (7,695) 135,009 Segment operating profit 35,451 47,482 592 341 83,866 (30,042) 53,824
Finance income 1,667 Finance costs (5,446) Profit before tax 50,045 (Other adjustments) Depreciation and amortization 10,858 8,909 ― ― 19,767 14,626 34,393

19 Renesas’ Consolidated Financial Results for the Third Quarter Ended September 30, 2021
(3) Information on products and services Information on products and services is the same with information on the reportable segments and therefore, omitted from this section.
(4) Information on regions and countries
The components of revenue from external customers by region and country are as follows. (Nine months ended September 30, 2020 and September 30, 2021)
(In millions of yen)
Nine months ended September 30, 2020 Nine months ended
September 30,2021
Japan 179,103 224,130
China 126,006 150,367
Asia (Excluding Japan and China) 90,616 139,915
Europe 79,687 104,147
North America 46,774 59,047
Others 1,907 2,380
Total 524,093 679,986 (Three months ended September 30, 2020 and September 30, 2021)
(In millions of yen)
Three months ended September 30, 2020 Three months ended
September 30,2021
Japan 55,545 83,444
China 44,466 61,472
Asia (Excluding Japan and China) 32,946 54,075
Europe 27,885 36,839
North America 17,217 21,636
Others 619 967
Total 178,678 258,433 (Note) Revenues are categorized into the country or region based on the location of the customers.

20 Renesas’ Consolidated Financial Results for the Third Quarter Ended September 30, 2021
(Business Combinations) (1) Business combination by acquisition
Nine months ended September 30, 2021 a. Overview of business combination The Company made an acquisition of the entire issued and to be issued share capital of Dialog on August 31, 2021. Following the completion of the acquisition, Dialog has become a wholly-owned subsidiary of the Company.
1) Name and overview of the acquiree Name of the acquiree: Dialog Semiconductor Plc Business overview: Development, manufacturing and sales of analog ICs such as mixed-signal devices.
2) Date of the acquisition August 31, 2021. (LONDON, United Kingdom: August 30, 2021)
3) Purpose of the acquisition
Dialog is an innovative provider of highly-integrated and power-efficient mixed-signal ICs for a broad array of customers within IoT, consumer electronics and high-growth segments of automotive and industrial end-markets. Centered around its low-power and mixed-signal expertise, Dialog brings a wide range of product offerings including battery and power management, power conversion, configurable mixed-signal (CMIC), LED drivers, custom mixed-signal ICs (ASICs) and automotive power management ICs (PMICs), wireless charging technology, and more. Dialog also offers broad and differentiated Bluetooth® Low Energy, WiFi and audio system-on-chips (SoCs) that deliver advanced connectivity for a wide range of applications; from smart home/building automation, wearables, to connected medical. All these systems complement and expand Renesas’ leadership portfolio in delivering comprehensive solutions to improve performance and efficiency in high-computing electronic systems. The acquisition demonstrates Renesas’ continued and unwavering commitment to further advance its solution offering. The complementary nature of the companies’ technological assets and the scale of the combined portfolios will enable Renesas to build more robust and comprehensive solutions to serve high-growth segments of the IoT and automotive markets. Renesas believes there is a compelling strategic and financial rational for the acquisition because it: (i) Scales Renesas’ IoT sector capabilities with Dialog’s low-power technologies Dialog has a differentiated portfolio of low-power mixed-signal products, decades of experience in developing custom and configurable solutions for the world’s largest customers and expertise in low-power connectivity that are highly complementary to Renesas. The acquisition of these low-power technologies enhances Renesas’ product portfolio and expands horizons in addressing high-growth markets in the IoT field. (ii) Unlocks further differentiation to Renesas system solution with connectivity Bringing together Renesas and Dialog will extend the combined the Group's reach to a broader customer base and open up additional growth potential in the key growth segments: industrial infrastructure, IoT and automotive. Dialog’s BLE, WiFi and audio SoCs are highly complementary to Renesas’ microcontroller (MCU)-based solutions. Combining Dialog’s innovative low-power Wi-Fi and Bluetooth® SoC and expertise with Renesas’ technologies will enable Renesas to further differentiate its system solution offering and extend its footprint in high-growth segments, including contactless IoT applications for smart home/building automation and healthcare. Renesas’ automotive solutions will also be enriched with connectivity for a wide range of security and safety applications.
4) Acquisition Method Renesas implemented a scheme of arrangement pursuant to UK law. The scheme of arrangement is a method of acquisition whereby with the agreement of Dialog, the acquisition can be executed by obtaining approvals from Dialog shareholders and the Court.
b. Consideration for the acquisition and its breakdown
(In millions of yen) Consideration Amount
Cash 623,892 Restricted stock units 7,183 Total A 631,075
Expenses related to the acquisition were 4,555 million yen, which were recorded in “Selling, general and administrative expenses” for the nine months ended September 30, 2021.

21 Renesas’ Consolidated Financial Results for the Third Quarter Ended September 30, 2021
c. Fair value of assets acquired, liabilities assumed and goodwill (In millions of yen)
Date of acquisition (August 31, 2021)
Current assets Cash and cash equivalents 40,450 Trade and other receivables (Note 2) 39,808 Inventories 34,748 Other 8,842
Total current assets 123,848
Non-current assets
Property, plant and equipment 10,771 Intangible assets 40,303 Other 2,376
Total non-current assets 53,450
Total assets 177,298 Current liabilities
Trade and other payables 14,825 Other 36,848
Total current liabilities 51,673 Non-current liabilities
Other non-current financial liabilities 2,881 Deferred tax liabilities 4,445 Other 3,238
Total non-current liabilities 10,564
Total liabilities 62,237 Net assets B 115,061
Basis adjustments (Note 3) C 3,604
Goodwill (Note 4) A-B+C 519,618 (Note 1) As of September 30, 2021, the acquisition was accounted for using provisional amounts determined based on
reasonable information currently available, and since the recognition and fair value measurement of the identifiable assets acquired and liabilities assumed at the acquisition date have not been finalized, the purchase price allocation is still preliminary. Currently the valuation of property, plant and equipment and additional recognition of intangible assets, among other assets and liabilities, have not been completed, except for certain inventories that valuation was able to be reflected. As a result, goodwill was provisionally recognized as the total amount of the excess of the consideration transferred over the net amount of the assets acquired and liabilities assumed. The identifiable intangible assets are tentatively recorded at the book value of Dialog.
(Note 2) The total contract amount is the same as the fair value, and there are no receivables that are expected to be unrecoverable.
(Note 3) The Company has entered into currency options and exchange contracts to hedge the foreign exchange risk against EUR-denominated acquisition consideration payments and adopted the hedge accounting. The hedging instruments are settled in cash at the fair value on the acquisition date. The basis adjustments are the amount of change in the fair value of the hedging instruments recorded in other comprehensive income on the acquisition date and were added to the amount of goodwill.
(Note 4) Goodwill reflects future excess earning power expected from synergies between the Company and Dialog. No amount of goodwill is expected to be deductible for tax purposes.
22 Renesas’ Consolidated Financial Results for the Third Quarter Ended September 30, 2021
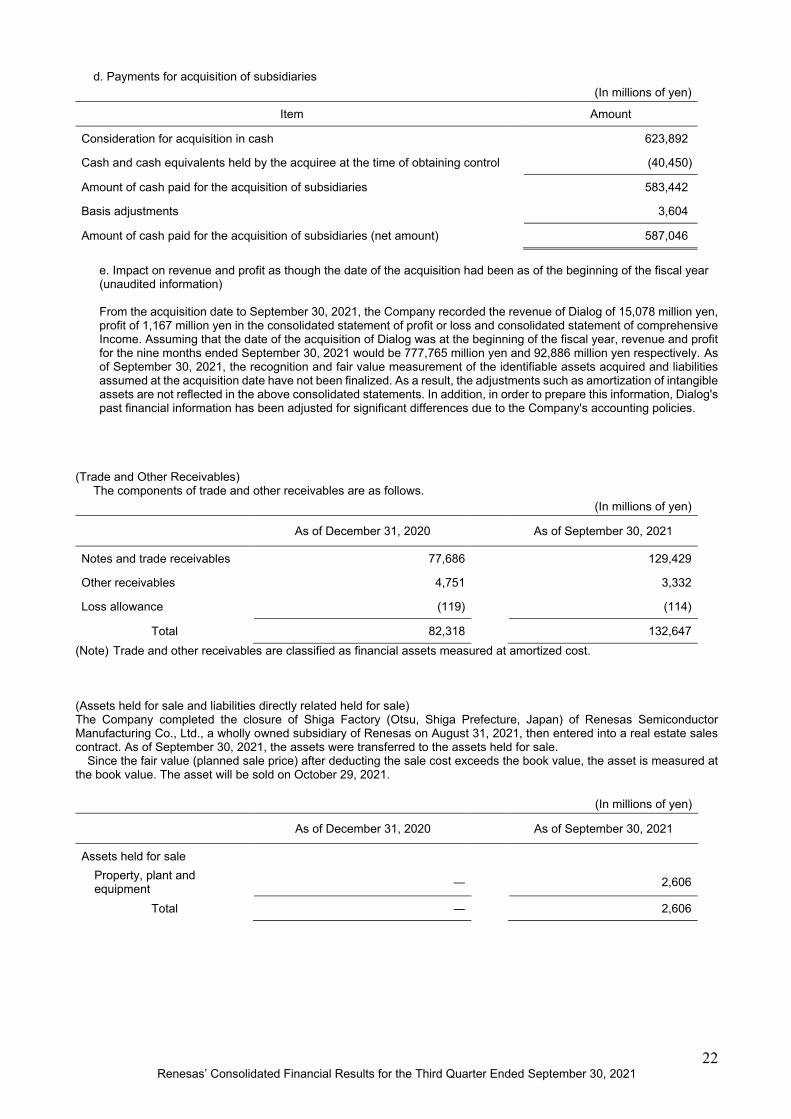
d. Payments for acquisition of subsidiaries (In millions of yen)
Item Amount
Consideration for acquisition in cash 623,892
Cash and cash equivalents held by the acquiree at the time of obtaining control (40,450)
Amount of cash paid for the acquisition of subsidiaries 583,442
Basis adjustments 3,604
Amount of cash paid for the acquisition of subsidiaries (net amount) 587,046
e. Impact on revenue and profit as though the date of the acquisition had been as of the beginning of the fiscal year (unaudited information) From the acquisition date to September 30, 2021, the Company recorded the revenue of Dialog of 15,078 million yen, profit of 1,167 million yen in the consolidated statement of profit or loss and consolidated statement of comprehensive Income. Assuming that the date of the acquisition of Dialog was at the beginning of the fiscal year, revenue and profit for the nine months ended September 30, 2021 would be 777,765 million yen and 92,886 million yen respectively. As of September 30, 2021, the recognition and fair value measurement of the identifiable assets acquired and liabilities assumed at the acquisition date have not been finalized. As a result, the adjustments such as amortization of intangible assets are not reflected in the above consolidated statements. In addition, in order to prepare this information, Dialog's past financial information has been adjusted for significant differences due to the Company's accounting policies.
(Trade and Other Receivables)
The components of trade and other receivables are as follows. (In millions of yen)
As of December 31, 2020 As of September 30, 2021
Notes and trade receivables 77,686 129,429
Other receivables 4,751 3,332
Loss allowance (119) (114)
Total 82,318 132,647 (Note) Trade and other receivables are classified as financial assets measured at amortized cost.
(Assets held for sale and liabilities directly related held for sale) The Company completed the closure of Shiga Factory (Otsu, Shiga Prefecture, Japan) of Renesas Semiconductor Manufacturing Co., Ltd., a wholly owned subsidiary of Renesas on August 31, 2021, then entered into a real estate sales contract. As of September 30, 2021, the assets were transferred to the assets held for sale.
Since the fair value (planned sale price) after deducting the sale cost exceeds the book value, the asset is measured at the book value. The asset will be sold on October 29, 2021.
(In millions of yen)
As of December 31, 2020 As of September 30, 2021
Assets held for sale Property, plant and equipment ― 2,606
Total ― 2,606

23 Renesas’ Consolidated Financial Results for the Third Quarter Ended September 30, 2021
(Trade and Other Payables) The components of trade and other payables are as follows.
(In millions of yen)
As of December 31, 2020 As of September 30, 2021
Trade payables 67,008 92,658
Other payables 47,433 66,968
Electronically recorded obligations 7,852 10,538
Refund liabilities 17,119 29,976
Total 139,412 200,140
Current liabilities 114,235 182,759
Non-current liabilities 25,177 17,381 (Note) Trade and other payables are classified as financial liabilities measured at amortized cost. (Bonds and borrowings)
To raise a portion of the funds for the acquisition, the Company entered into a loan agreement (Facilities Agreement) with MUFG Bank, Ltd. and Mizuho Bank, Ltd. with borrowing limit of 735,400 million yen on February 8, 2021.
The Company also has entered into an amendment agreement (the “Amendment Agreement”) with MUFG Bank, Ltd. and Mizuho Bank, Ltd. to partially amend the Facilities Agreement on June 30, 2021. Both net proceeds from the fundraising through the issuance of new shares and Renesas’ cash on hand are appropriated for the funds of the acquisition. Among the loan facilities, the amount has been amended in the Amendment Agreement. The borrowing limit has been reduced for part of the loan agreement as the planned currency hedge has been completed. Following the Amendment Agreement, the borrowing limit has changed from the initial amount of 735,400 million yen to 665,400 million yen.
As of August 31, 2021, the Company had borrowed 270,000 million yen from MUFG Bank, Ltd. and Mizuho Bank, Ltd. under the Amended Agreement. with the last repayment date of February 7, 2022, and interest rate of 0.835%. Furthermore, the funds to be obtained through the Loan is continuously intended to be converted to various long-term funds. (Equity and Other Equity Items)
Nine months ended September 30, 2021 Based on the resolution at the Board of Directors’ meeting held on May 28, 2021, the Company issued 192,252,800 shares through a public offering with the due date of payment on June 15, 2021 and 2,067,600 shares of common stock through a third-party allotment with the payment due date of June 28, 2021. As a consequence, share capital increased by 111,899 million yen and capital surplus increased by 111,092 million yen.
As a result, the share capital is 144,369 million yen and the capital surplus is 333,842 million yen as of September 30, 2021. (Revenue)
All revenue arises from contracts with customers. In addition, disaggregation of revenue recognized from contracts with customers are stated in “Business segments, (2) Information on reportable segments and (4) Information on regions and countries.”

24 Renesas’ Consolidated Financial Results for the Third Quarter Ended September 30, 2021
(Selling, General and Administrative Expenses) The components of selling, general and administrative expenses are as follows. (Nine months ended September 30, 2020 and September 30, 2021)
(In millions of yen)
Nine months ended September 30, 2020 Nine months ended
September 30, 2021
Research and development expenses 97,206 106,511
Depreciation and amortization 47,027 46,308
Personnel expenses 33,208 37,000
Retirement benefit expenses 1,863 2,068
Other 18,965 23,514
Total 198,269 215,401 (Three months ended September 30, 2020 and September 30, 2021)
(In millions of yen)
Three months ended September 30, 2020 Three months ended
September 30, 2021
Research and development expenses 32,868 39,697
Depreciation and amortization 15,122 16,067
Personnel expenses 12,332 12,868
Retirement benefit expenses 645 807
Other 5,823 10,530
Total 66,790 79,969

25 Renesas’ Consolidated Financial Results for the Third Quarter Ended September 30, 2021
(Other Income) The components of other income are as follows. (Nine months ended September 30, 2020 and September 30, 2021)
(In millions of yen)
Nine months ended September 30, 2020 Nine months ended
September 30, 2021
Gain on sales of property, plant and equipment 602 3,541
Insurance claim income 2,386 460
Other 644 1,647
Total 3,632 5,648
(Three months ended September 30, 2020 and September 30, 2021) (In millions of yen)
Three months ended September 30, 2020 Three months ended
September 30, 2021
Profit from contract cancellation ― 516
Reversal of provision for business restructuring ― 285
Gain on sales of property, plant and equipment 113 41
Government grant income 182 2
Other 191 193
Total 486 1,037 (Other Expenses)
The components of other expenses are as follows. (Nine months ended September 30, 2020 and September 30, 2021)
(In millions of yen)
Nine months ended September 30, 2020 Nine months ended
September 30, 2021
Provision for loss on litigation 529 4,675
Business restructuring expenses 1,253 1,795
Other 1,539 1,987
Total 3,321 8,457
(Three months ended September 30, 2020 and September 30, 2021) (In millions of yen)
Three months ended September 30, 2020 Three months ended
September 30, 2021
Business restructuring expenses 8 979
Commitment fee 88 769
Provision for loss on litigation 519 181
Other 203 324
Total 818 2,253

26 Renesas’ Consolidated Financial Results for the Third Quarter Ended September 30, 2021
(Additional Information) Fire outbreak in a wholly-owned manufacturing subsidiary
On March 19, 2021, a fire broke out at a manufacturing line in the N3 Building (300mm line) of Naka Factory (located in Hitachinaka, Ibaraki Prefecture) of Renesas Semiconductor Manufacturing Co., Ltd, a wholly-owned manufacturing subsidiary of the Company. Due to this fire, certain property, plant and equipment such as machinery and equipment and inventories such as work in progress were damaged.
Due to this fire, the Group recorded 16,036 million yen for restoration and repairment costs of property, plant and equipment, disposal costs and reinspection fees of inventories and fixed costs during the shutdown for the nine months ended September 30, 2021. These are included in cost of sales of 15,930 million yen and other expenses of 106 million yen in the condensed consolidated statement of profit or loss. The Group recorded 3,721 million yen for restoration and repairment costs of property, plant and equipment, during the shutdown for the three months ended September 30, 2021. These are included in cost of sales of 3,670 million yen and other expenses of 51 million yen in the condensed consolidated statement of profit or loss. In addition, other payables of the fire related costs are recorded in trade and other payables and other liabilities of 10,292 million yen in the condensed consolidated statement of financial position.
The amounts of loss may change depending on the situation of the repairment of property, plant and equipment and the determination of insurance claim income.

27 Renesas’ Consolidated Financial Results for the Third Quarter Ended September 30, 2021
(Subsequent Events) Acquisition of Stock of Celeno Communications Inc.
On October 28, 2021, the Company has resolved at the Meeting of Board of Directors to acquire all outstanding shares of Celeno Communications Inc. (hereafter “Celeno”), the holding company of Celeno Communications Ltd., a semiconductor company which mainly operates its business in Israel, to make Celeno a wholly-owned subsidiary of the Company (hereafter “the Celeno Acquisition”). 1) Purpose of acquisition Headquartered in Israel, Celeno offers a wide range of wireless communication solutions, including advanced Wi-Fi chipsets and software solutions, for high-performance home networks, smart buildings, enterprise and industrial markets. Its industry’s most compact chipset offerings for Wi-Fi 6 and 6E deliver exceptional Wi-Fi network performance and increased security with low latency and low power consumption. Celeno’s breakthrough Wi-Fi Doppler Imaging technology, a Wi-Fi based, high-resolution imaging technology is ideal for home elderly care and assisted living, home security, safe driving and digital and connected factories. It depicts, tracks and analyzes the motion, behavior and location of people and objects using standard Wi-Fi, eliminating the need for multiple cameras or sensors in home environments and commercial buildings. As the world’s No.1 embedded processor supplier, the Company offers a breadth of low-power MCU/MPU/SoC processors, wireless ICs, sensors and power management technologies. Celeno’s field-proven Wi-Fi and software capabilities are highly complementary to the Company. The combination creates a comprehensive, end-to-end embedded solutions for addressing the fast-growing markets for low-power connectivity in IoT, infrastructure, industrial and automotive applications.
In addition to expanding the solution offering, the Celeno Acquisition also increases the Company’s engineering and design scale with Celeno’s design center in Israel and by welcoming R&D staff based in Israel, Ukraine, India, China, Taiwan and more. This further strengthens the Company’s global engineering and software development talent base, allowing the Company to bring more seamless and expanded services to customers around the globe. 2) Acquisition Method For the purpose of the Celeno Acquisition, the Company will establish a wholly-owned subsidiary (hereafter “Acquisition Subsidiary”) in Delaware, United States that will then merge with Celeno in a reverse triangular merger. The surviving company following the merger will be Celeno. Cash will be paid to Celeno’s shareholders as consideration for the merger. The shares of the Acquisition Subsidiary owned by the Company will be converted into outstanding shares of the surviving company, making the surviving company a wholly-owned subsidiary of the Company. The Celeno Acquisition will take effect following approval by Celeno shareholders and the fulfilment of the customary closing conditions pertaining to merger agreements.
The Company will acquire Celeno in an all cash transaction valued at approximately US$315 million (approximately 35.9 billion yen). In addition to cash payments of approximately US$270 million (approximately 30.8 billion yen), this includes approximately US$45 million (approximately 5.1 billion yen) which will be paid upon the satisfaction of certain conditions as set forth in the merger agreement relating to Celeno’s future product development and mass production progress. Note: the exchange rate used is calculated based on the rate of 114 yen per US$ as of October 25, 2021.
3) Overview of Entities to be Acquired Overview of Celeno (1) Name Celeno Communications Inc. (2) Address Dover, Delaware, United States of America (3) Business description Holding company (4) Capital amount 142,207 thousand US$ (as of the end of December 2020) (5) Date of foundation March 2005
/ incorporation Overview of Celeno Communications Ltd. (1) Name Celeno Communications Ltd. (2) Address Ra'anana, Israel (3) Business description Development and sales of connectivity devices such as Wi-Fi 5, Wi-Fi 6 and IoT chipsets (4) Capital amount Less than one thousand ILS (as of the end of December 2020) (5) Date of foundation March 2005
/ incorporation 4) Schedule The Celeno Acquisition is expected to close by the end of calendar year 2021, subject to approval by Celeno shareholders and the fulfilment of the customary closing conditions pertaining to merger agreements. 5) Future Outlook As a result of the Celeno Acquisition, Celeno will become a consolidated subsidiary of the Company. It is expected that the impact on the fiscal 2021 consolidated performance of the Group is in the process of being calculated.

28 Renesas’ Consolidated Financial Results for the Third Quarter Ended September 30, 2021
Forward-Looking Statements The statements in this press release with respect to the plans, strategies and financial outlook of Renesas Electronics Corporation and its consolidated subsidiaries (collectively “we”) are forward-looking statements involving risks and uncertainties. We caution you in advance that actual results may differ materially from such forward-looking statements due to several important factors including, but not limited to, general economic conditions in our markets, which are primarily Japan, North America, Asia, and Europe; demand for, and competitive pricing pressure on, products and services in the marketplace; ability to continue to win acceptance of products and services in these highly competitive markets; and fluctuations in currency exchange rates, particularly between the yen and the U.S. dollar. Among other factors, downturn of the world economy; deteriorating financial conditions in world markets, or deterioration in domestic and overseas stock markets, may cause actual results to differ from the projected results forecast.
About Renesas Electronics Corporation
Renesas Electronics Corporation (TSE: 6723) delivers trusted embedded design innovation with complete semiconductor solutions that enable billions of connected, intelligent devices to enhance the way people work and live. A global leader in microcontrollers, analog, power, and SoC products, Renesas provides comprehensive solutions for a broad range of automotive, industrial, infrastructure, and IoT applications that help shape a limitless future. Learn more at renesas.com. Follow us on LinkedIn, Facebook, Twitter, YouTube, and Instagram.