3rd Quarter FY 2018 Earnings...
27
3rd Quarter FY 2018 Earnings Presentation February 8, 2018
Transcript of 3rd Quarter FY 2018 Earnings...

3rd Quarter FY 2018Earnings PresentationFebruary 8, 2018

February 8, 2018 23rd Quarter FY 2018 Earnings Presentation
Pro forma combined company financial information
In an effort to provide investors with additional information, we are disclosing certain unaudited pro forma combined company financial information of DXC for the three and nine months ended December 31, 2017 (“pro forma combined company” information) as supplemental information herein. The following discussion includes comparisons of our unaudited results of operations for the three and nine months of fiscal 2018 to our pro forma combined company results. The pro forma combined company results are based on the historical quarterly statements of operations of each of CSC and the Enterprise Services Business of Hewlett Packard Enterprise Company (“HPES”), giving effect to the merger as if it had been consummated on April 2, 2016.CSC reported its results based on a fiscal year convention that comprised four thirteen-week quarters, while HPES reported its results on a fiscal year basis ended October 31. As a consequence of CSC and HPES having different fiscal year-end dates, the pro forma combined company results include the historical unaudited condensed combined statements of operations of CSC for the three and nine months ended December 30, 2016 and of HPES for the three and nine months ended October 31, 2016.The historical financial information of HPES was “carved-out” from the combined statement of operations of HPE and reflects assumptions and allocations made by HPE and only includes revenue and costs directly attributable to HPES and an allocation of expenses related to certain HPE corporate functions and does not necessarily include all expenses that would have been incurred by HPES had it been a separate, stand-alone entity and therefore, does not necessarily reflect what HPES’ results of operations would have been had HPES operated as a stand-alone company during the period presented. Actual costs that may have been incurred if HPES had been a stand-alone company would depend on a number of factors, including the chosen organizational structure, functions outsourced or performed by employees and strategic decisions made in areas such as information technology and infrastructure.The pro forma combined company results have been prepared using the acquisition method of accounting with CSC considered the accounting acquirer of HPES. These pro forma combined company results include historical results, reflecting preliminary purchase accounting (“PPA”) adjustments and aligning our accounting policies for consolidated results and reportable segments. These adjustments give effect to pro forma events that were (i) directly attributable to the merger of CSC and HPES, (ii) factually supportable, and (iii) expected to have a continuing impact on the consolidated results of operations of DXC. The pro forma combined company results do not reflect the costs of integration activities or benefits that may result from realization of synergies. No assurances of the timing or the amount of cost synergies, or the costs necessary to achieve those cost synergies, can be provided.The adjustments to historical results included were based upon currently available information and assumptions that management of DXC believes to be reasonable. The pro forma combined company results are provided for illustrative and informational purposes only and are not intended to represent or be indicative of what DXC’s results of operations would have been had the merger occurred on April 2, 2016, and should not be taken as being indicative of DXC’s future consolidated financial results. The pro forma combined company results should be read in conjunction with Exhibit 99.2 of the Form 8-K/A that was filed on June 14, 2017, including the accompanying notes.

February 8, 2018 33rd Quarter FY 2018 Earnings Presentation
Non-GAAP financial measures
We present non-GAAP financial measures of performance which are derived from the unaudited condensed consolidated statements of operations and unaudited pro forma combined company statement of operations of DXC. These non-GAAP financial measures include earnings before interest and taxes (“EBIT”), adjusted EBIT, adjusted EBIT margin, non-GAAP income before income taxes, non-GAAP net income, non-GAAP EPS and adjusted free cash flow.
We present these non-GAAP financial measures to provide investors with meaningful supplemental financial information, in addition to the financial information presented on a GAAP or pro forma basis. Non-GAAP financial measures exclude certain items from GAAP results that DXC management believes are not indicative of core operating performance. DXC management believes these non-GAAP measures provide investors supplemental information about the financial performance of DXC exclusive of the impacts of corporate wide strategic decisions. DXC management believes that adjusting for these items provides investors with additional measures to evaluate the financial performance of our core business operations on a comparable basis from period to period. DXC management believes the non-GAAP measures provided are also considered important measures by financial analysts covering DXC as equity research analysts continue to publish estimates and research notes based on our non-GAAP commentary, including our guidance around non-GAAP EPS.
There are limitations to the use of the non-GAAP financial measures presented in this presentation. One of the limitations is that they do not reflect complete financial results. We compensate for this limitation by providing a reconciliation between our non-GAAP financial measures and the respective most directly comparable financial measure calculated and presented in accordance with GAAP or on a pro forma basis. Additionally, other companies, including companies in our industry, may calculate non-GAAP financial measures differently than we do, limiting the usefulness of those measures for comparative purposes between companies.
Selected references are made on a “constant currency basis” (cc) so that certain financial results can be viewed without the impact of fluctuations in foreign currency rates, thereby providing comparisons of operating performance from period to period. Financial results on a “constant currency basis” are non-GAAP measures calculated by translating current period activity into U.S. dollars using the comparable prior period’s currency conversion rates. This approach is used for all results where the functional currency is not the U.S. dollar.

February 8, 2018 43rd Quarter FY 2018 Earnings Presentation
Forward-looking statements
All statements in this presentation that do not directly and exclusively relate to historical facts constitute “forward looking statements.” These statements represent current expectations and beliefs, and no assurance can be given that the results described in such statements will be achieved.Such statements are subject to numerous assumptions, risks, uncertainties and other factors that could cause actual results to differ materially from those described in such statements, many of which are outside of our control. For a written description of these factors, see the section titled “Risk Factors” in DXC’s Quarterly Reports on Form 10-Q for the quarters ended June 30, 2017 and September 30, 2017 and any updating information in subsequent SEC filings, including DXC’s upcoming Form 10-Q for the quarter ended December 31, 2017.No assurance can be given that any goal or plan set forth in any forward-looking statement can or will be achieved, and readers are cautioned not to place undue reliance on such statements which speak only as of the date they are made. We do not undertake any obligation to update or release any revisions to any forward-looking statement or to report any events or circumstances after the date of this presentation or to reflect the occurrence of unanticipated events except as required by law.

3rd Quarter FY 2018Earnings PresentationMike LawrieChairman, President andChief Executive Officer
February 8, 2018 63rd Quarter FY 2018 Earnings Presentation
Key messages
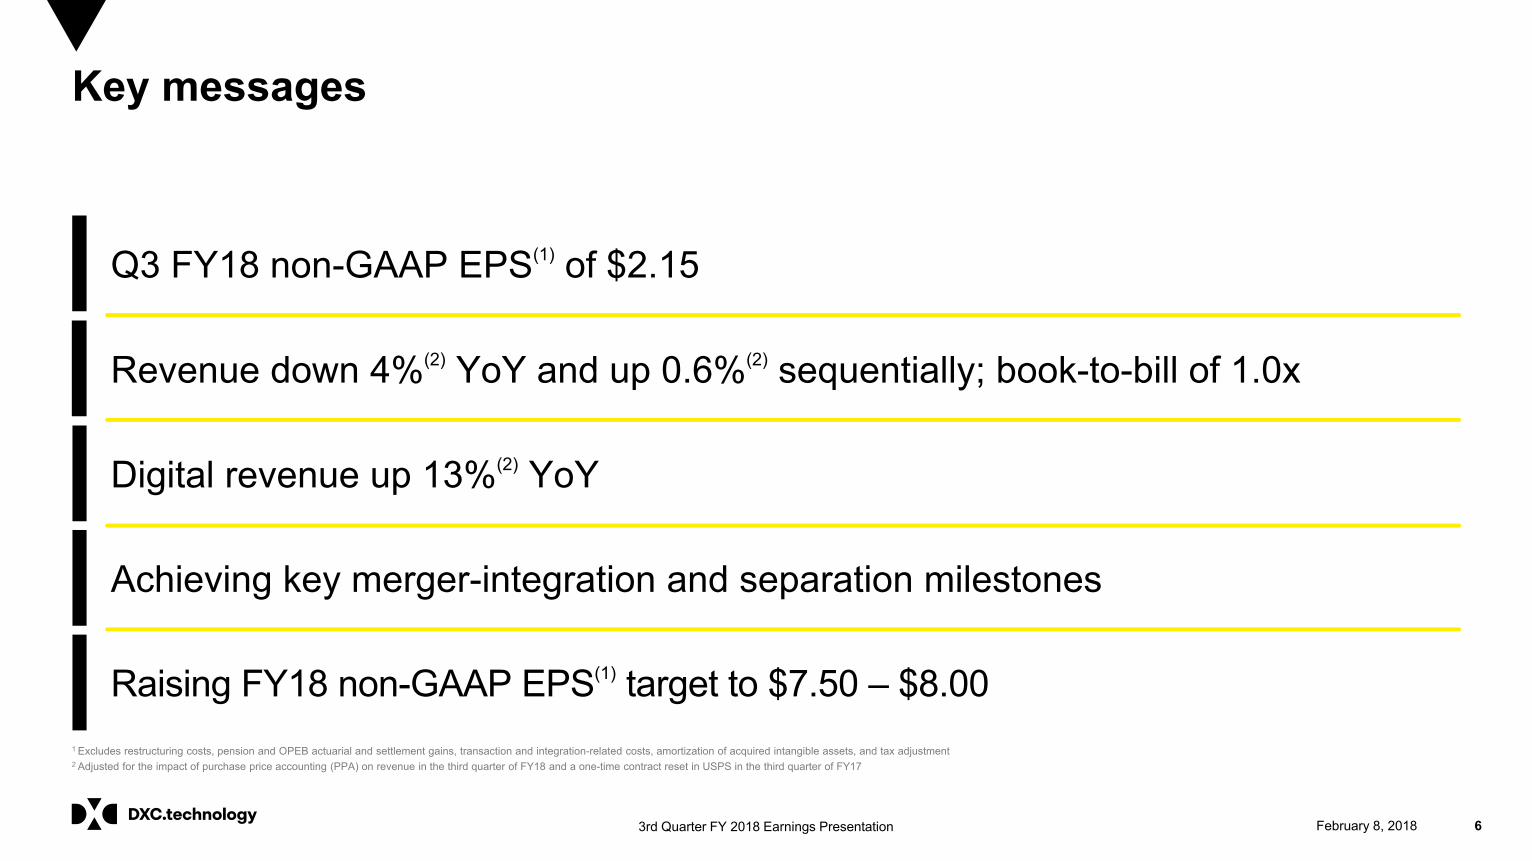
1 Excludes restructuring costs, pension and OPEB actuarial and settlement gains, transaction and integration-related costs, amortization of acquired intangible assets, and tax adjustment2 Adjusted for the impact of purchase price accounting (PPA) on revenue in the third quarter of FY18 and a one-time contract reset in USPS in the third quarter of FY17
Q3 FY18 non-GAAP EPS(1) of $2.15
Revenue down 4%(2) YoY and up 0.6%(2) sequentially; book-to-bill of 1.0x
Digital revenue up 13%(2) YoY
Achieving key merger-integration and separation milestones
Raising FY18 non-GAAP EPS(1) target to $7.50 – $8.00

3rd Quarter FY 2018Earnings PresentationPaul SalehExecutive Vice Presidentand Chief Financial Officer

February 8, 2018 83rd Quarter FY 2018 Earnings Presentation
Financial presentation
• Pro forma results conform with the methodology used in the Form S-4
• Prior year pro forma non-GAAP results assume a flat quarterly tax rate of about 27.5%
• FY18 results reflect revenue adjustments for purchase price accounting, whereas the prior year pro forma does not
• Non-GAAP results exclude restructuring costs, pension and OPEB actuarial and settlement gains, transaction and integration-related costs, amortization of acquired intangible assets, and tax adjustment
Fiscal 2017
1st Quarter 2nd Quarter 3rd Quarter 4th Quarter
CSC July 1, 2016 September 30, 2016 December 30, 2016 March 31, 2017
HPES April 30, 2016 July 31, 2016 October 31, 2016 January 31, 2017
February 8, 2018 93rd Quarter FY 2018 Earnings Presentation
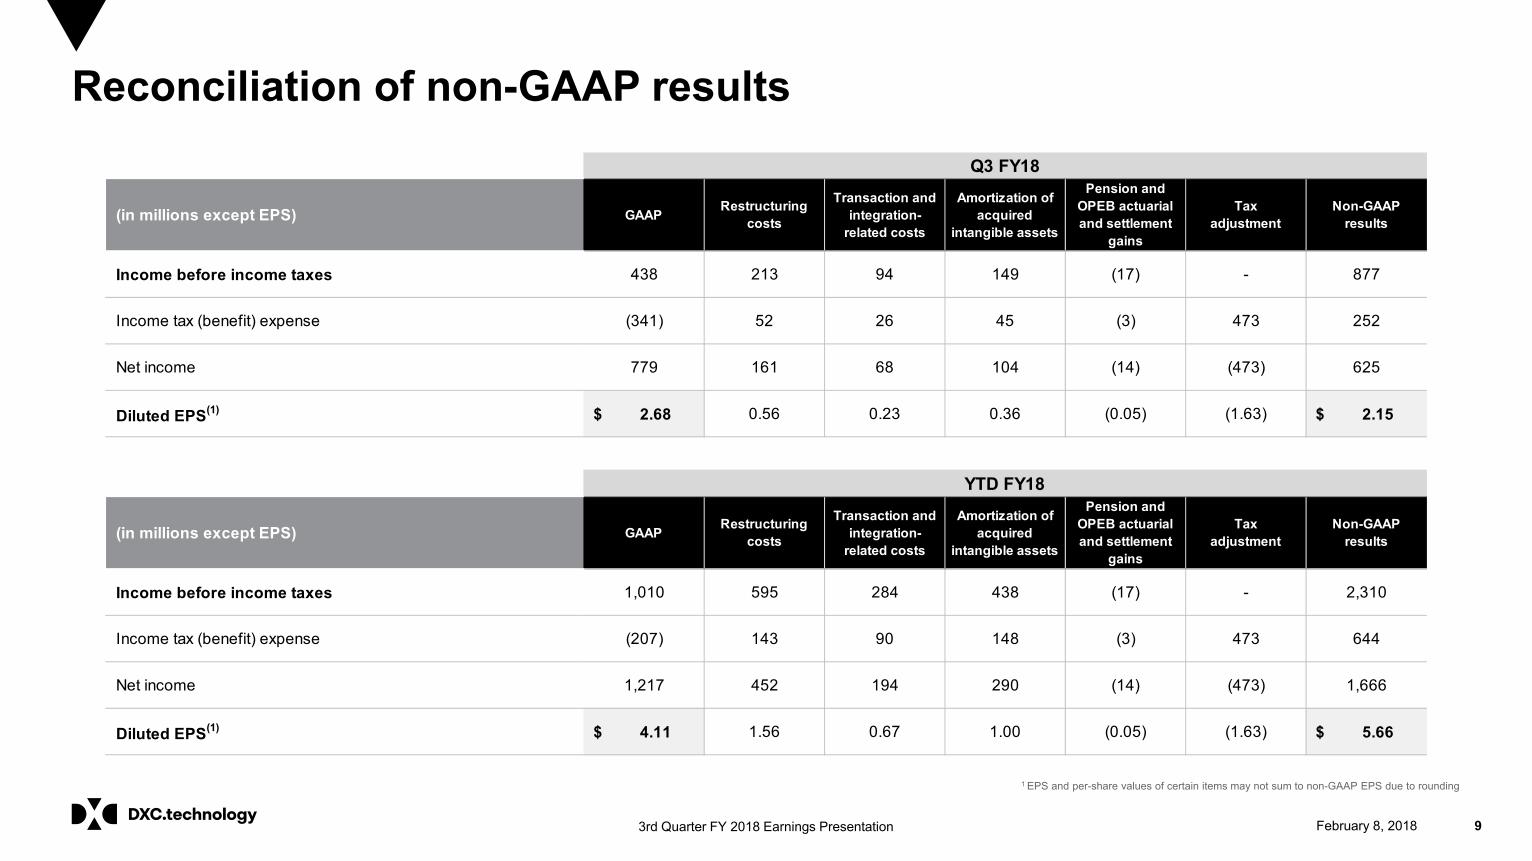
Reconciliation of non-GAAP results
1 EPS and per-share values of certain items may not sum to non-GAAP EPS due to rounding
Q3 FY18
(in millions except EPS) GAAP Restructuringcosts
Transaction and integration-
related costs
Amortization of acquired
intangible assets
Pension and OPEB actuarial and settlement
gains
Tax adjustment
Non-GAAPresults
Income before income taxes 438 213 94 149 (17) - 877
Income tax (benefit) expense (341) 52 26 45 (3) 473 252
Net income 779 161 68 104 (14) (473) 625
Diluted EPS(1) $ 2.68 0.56 0.23 0.36 (0.05) (1.63) $ 2.15
YTD FY18
(in millions except EPS) GAAP Restructuringcosts
Transaction and integration-
related costs
Amortization of acquired
intangible assets
Pension and OPEB actuarial and settlement
gains
Tax adjustment
Non-GAAPresults
Income before income taxes 1,010 595 284 438 (17) - 2,310
Income tax (benefit) expense (207) 143 90 148 (3) 473 644
Net income 1,217 452 194 290 (14) (473) 1,666
Diluted EPS(1) $ 4.11 1.56 0.67 1.00 (0.05) (1.63) $ 5.66
February 8, 2018 103rd Quarter FY 2018 Earnings Presentation
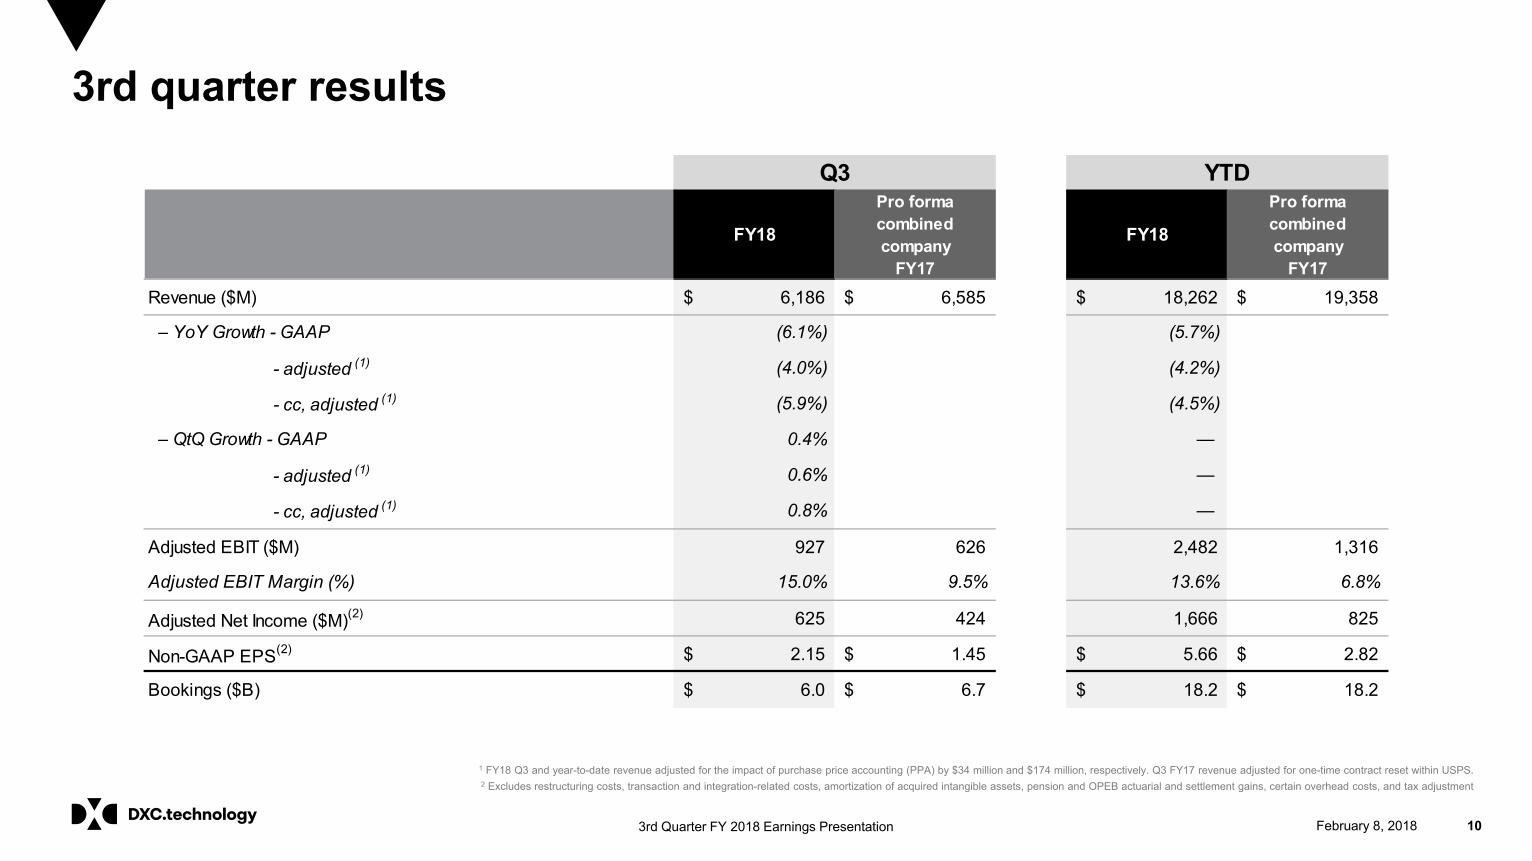
3rd quarter results
1 FY18 Q3 and year-to-date revenue adjusted for the impact of purchase price accounting (PPA) by $34 million and $174 million, respectively. Q3 FY17 revenue adjusted for one-time contract reset within USPS.2 Excludes restructuring costs, transaction and integration-related costs, amortization of acquired intangible assets, pension and OPEB actuarial and settlement gains, certain overhead costs, and tax adjustment
FY18
Pro formacombinedcompany
FY17
FY18
Pro formacombinedcompany
FY17
Revenue ($M) 6,186$ 6,585$ 18,262$ 19,358$
– YoY Growth - GAAP (6.1%) (5.7%)
– YoY Growth - adjusted (1) (4.0%) (4.2%)
– YoY Growth - cc, adjusted (1) (5.9%) (4.5%)
– QtQ Growth - GAAP 0.4% —
– YoY Growth - adjusted (1) 0.6% —
– YoY Growth - cc, adjusted (1) 0.8% —
Adjusted EBIT ($M) 927 626 2,482 1,316
Adjusted EBIT Margin (%) 15.0% 9.5% 13.6% 6.8%
Adjusted Net Income ($M)(2) 625 424 1,666 825
Non-GAAP EPS(2) 2.15$ 1.45$ 5.66$ 2.82$
Bookings ($B) 6.0$ 6.7$ 18.2$ 18.2$
Q3 YTD

February 8, 2018 113rd Quarter FY 2018 Earnings Presentation
Global Business Services (GBS)
$8.1 $7.3
YTD FY18 YTD FY17
$6,893 $7,245
YTD FY18 YTD FY17
15.9%12.3%
YTD FY18 YTD FY17
Revenue ($M) Bookings ($B)
1 Adjusted for the impact of purchase price accounting (PPA) on revenue of $6 million in the third quarter of FY18 and $32 million on a year-to-date basis
GBS Profit Margin %Year-to-Date
Q3 FY18Pro formacombinedcompanyQ3 FY17
YTD FY18Pro formacombinedcompanyYTD FY17
Revenue ($M) 2,315$ 2,432$ 6,893$ 7,245$ – YoY growth - GAAP (4.8%) (4.9%)
– YoY growth - adjusted (1) (4.6%) (4.4%)
– YoY growth - cc, adjusted (1) (6.6%) (4.9%)– QtQ growth - GAAP 0.2% —
– QtQ growth - adjusted (1) 0.2% —
– QtQ growth - cc, adjusted (1) 0.4% — GBS Profit ($M) 431 338 1,093 889 GBS Profit Margin (%) 18.6% 13.9% 15.9% 12.3%Bookings ($B) 3.3$ 2.2$ 8.1$ 7.3$

February 8, 2018 123rd Quarter FY 2018 Earnings Presentation
Revenue ($M) Bookings ($B)GIS Profit Margin %Year-to-Date
Global Infrastructure Services (GIS)
$8.8 $9.1
YTD FY18 YTD FY17
$9,256 $9,906
YTD FY18 YTD FY17
13.2%
5.5%
YTD FY18 YTD FY17
1 Adjusted for the impact of purchase price accounting (PPA) on revenue of $26 million in the third quarter of FY18 and $134 million on a year-to-date basis
Q3 FY18Pro formacombinedcompanyQ3 FY17
YTD FY18Pro formacombinedcompanyYTD FY17
Revenue ($M) 3,145$ 3,327$ 9,256$ 9,906$ – YoY growth - GAAP (5.5%) (6.6%)
– YoY growth - adjusted (1) (4.7%) (5.2%)
– YoY growth - cc, adjusted (1) (6.8%) (5.4%)– QtQ growth - GAAP 0.1% —
– QtQ growth - adjusted (1) 0.4% —
– QtQ growth - cc, adjusted (1) 0.7% — GIS Profit ($M) 463 317 1,222 540 GIS Profit Margin (%) 14.7% 9.5% 13.2% 5.5%Bookings ($B) 2.2$ 3.6$ 8.8$ 9.1$
February 8, 2018 133rd Quarter FY 2018 Earnings Presentation
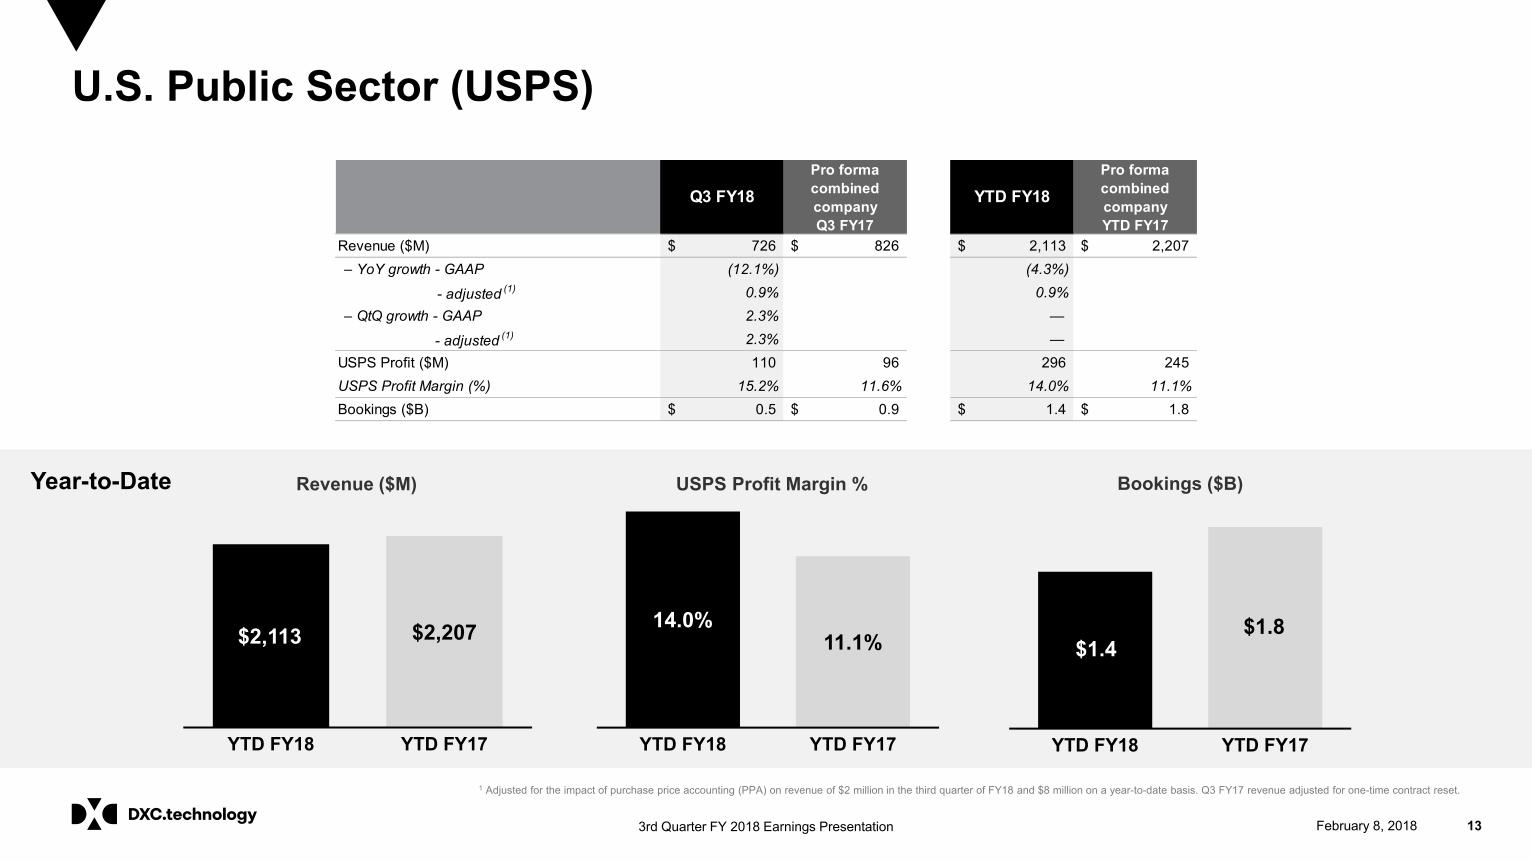
Revenue ($M) Bookings ($B)USPS Profit Margin %Year-to-Date
U.S. Public Sector (USPS)
$1.4 $1.8
YTD FY18 YTD FY17
$2,113 $2,207
YTD FY18 YTD FY17
14.0%11.1%
YTD FY18 YTD FY17
1 Adjusted for the impact of purchase price accounting (PPA) on revenue of $2 million in the third quarter of FY18 and $8 million on a year-to-date basis. Q3 FY17 revenue adjusted for one-time contract reset.
Q3 FY18Pro formacombinedcompanyQ3 FY17
YTD FY18Pro formacombinedcompanyYTD FY17
Revenue ($M) 726$ 826$ 2,113$ 2,207$ – YoY growth - GAAP (12.1%) (4.3%)
– YoY growth - adjusted (1) 0.9% 0.9%– QtQ growth - GAAP 2.3% —
– QtQ growth - adjusted (1) 2.3% —USPS Profit ($M) 110 96 296 245 USPS Profit Margin (%) 15.2% 11.6% 14.0% 11.1%Bookings ($B) 0.5$ 0.9$ 1.4$ 1.8$
February 8, 2018 143rd Quarter FY 2018 Earnings Presentation
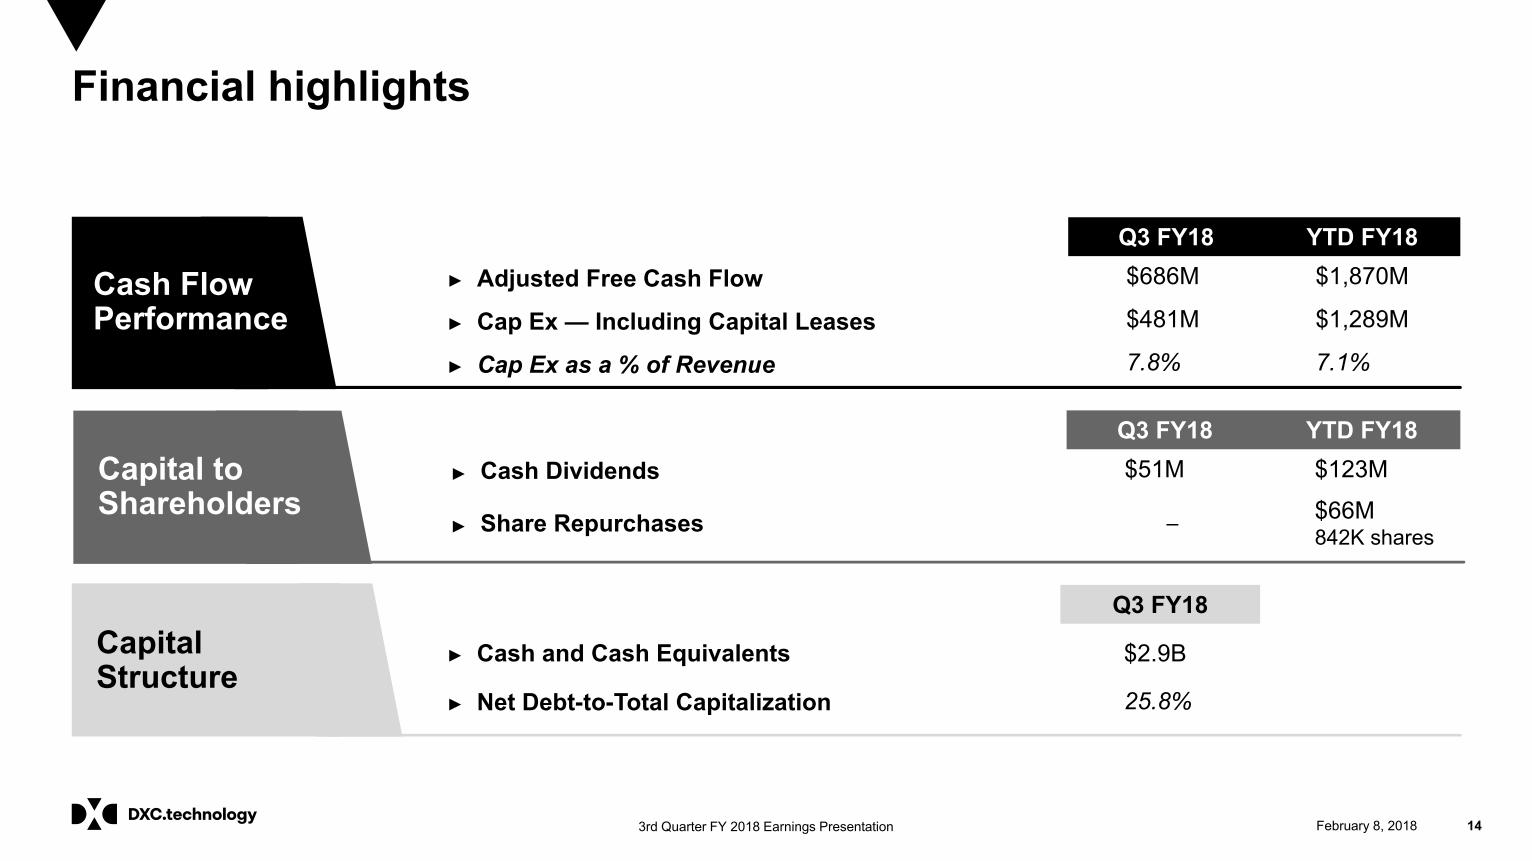
Financial highlights
Cash Flow Performance
Capital Structure
Capital to ShareholdersCapital to Shareholders
Q3 FY18 YTD FY18► Adjusted Free Cash Flow $686M $1,870M
► Cap Ex — Including Capital Leases $481M $1,289M
► Cap Ex as a % of Revenue 7.8% 7.1%
Q3 FY18 YTD FY18► Cash Dividends $51M $123M
► Share Repurchases ‒ $66M842K shares
Q3 FY18
► Cash and Cash Equivalents $2.9B
► Net Debt-to-Total Capitalization 25.8%

February 8, 2018 153rd Quarter FY 2018 Earnings Presentation
FY 2018 targets
$24.0B – $24.5BRevenue
$7.50 – $8.00Non-GAAP EPS(1)
Adjusted Free Cash Flow 90% of Adj. Net Income(1)
1 Excludes restructuring costs, pension and OPEB actuarial and settlement gains, transaction and integration-related costs, amortization of acquired intangible assets, and tax adjustment
February 8, 2018 163rd Quarter FY 2018 Earnings Presentation
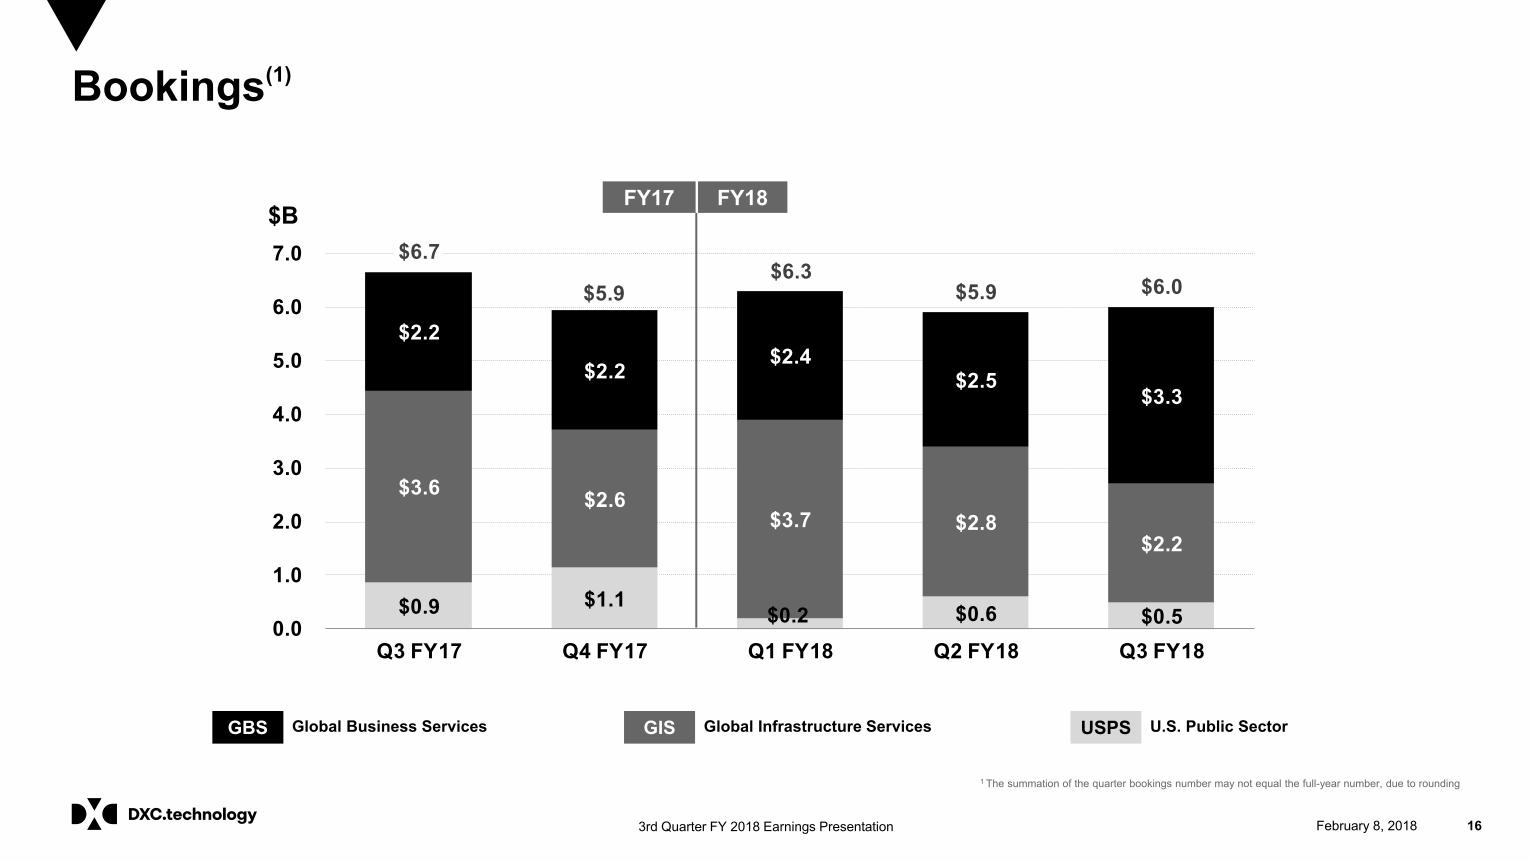
$0.9 $1.1 $0.2 $0.6 $0.5
$3.6 $2.6 $3.7 $2.8
$2.2
$2.2
$2.2 $2.4
$2.5 $3.3
$6.7
$5.9 $6.3
$5.9 $6.0
0.0
1.0
2.0
3.0
4.0
5.0
6.0
7.0
Q3 FY17 Q4 FY17 Q1 FY18 Q2 FY18 Q3 FY18
Bookings(1)
U.S. Public SectorUSPSGlobal Business ServicesGBS Global Infrastructure ServicesGIS
FY17 FY18
1 The summation of the quarter bookings number may not equal the full-year number, due to rounding
$B

3rd Quarter FY 2018Earnings PresentationSupplemental Information
February 8, 2018 183rd Quarter FY 2018 Earnings Presentation
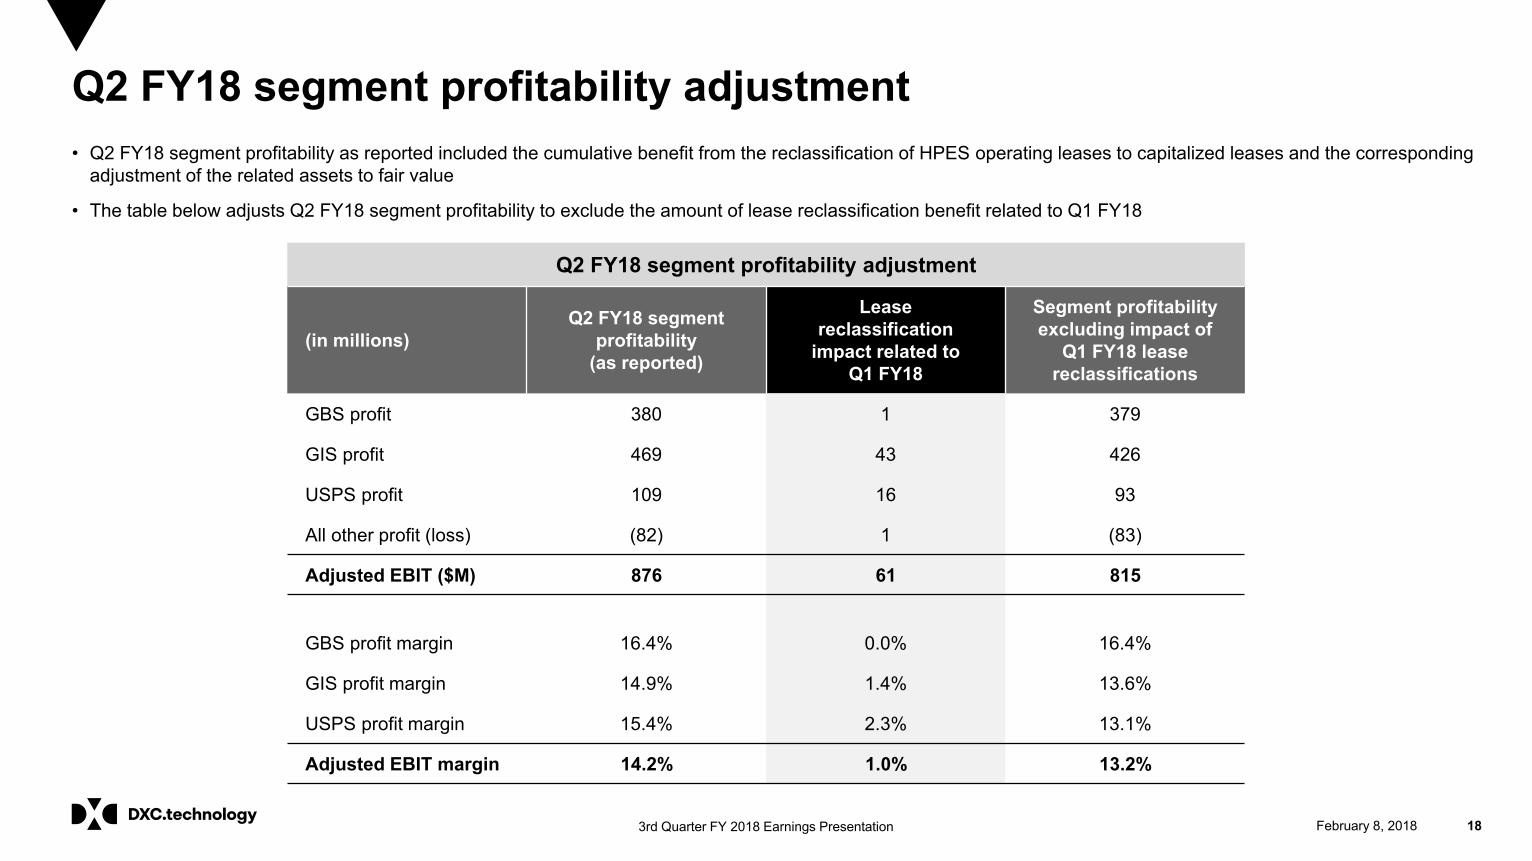
Q2 FY18 segment profitability adjustment
Q2 FY18 segment profitability adjustment
(in millions)Q2 FY18 segment
profitability (as reported)
Lease reclassification
impact related to Q1 FY18
Segment profitability excluding impact of
Q1 FY18 lease reclassifications
GBS profit 380 1 379
GIS profit 469 43 426
USPS profit 109 16 93
All other profit (loss) (82) 1 (83)
Adjusted EBIT ($M) 876 61 815
GBS profit margin 16.4% 0.0% 16.4%
GIS profit margin 14.9% 1.4% 13.6%
USPS profit margin 15.4% 2.3% 13.1%
Adjusted EBIT margin 14.2% 1.0% 13.2%
• Q2 FY18 segment profitability as reported included the cumulative benefit from the reclassification of HPES operating leases to capitalized leases and the corresponding adjustment of the related assets to fair value
• The table below adjusts Q2 FY18 segment profitability to exclude the amount of lease reclassification benefit related to Q1 FY18
February 8, 2018 193rd Quarter FY 2018 Earnings Presentation
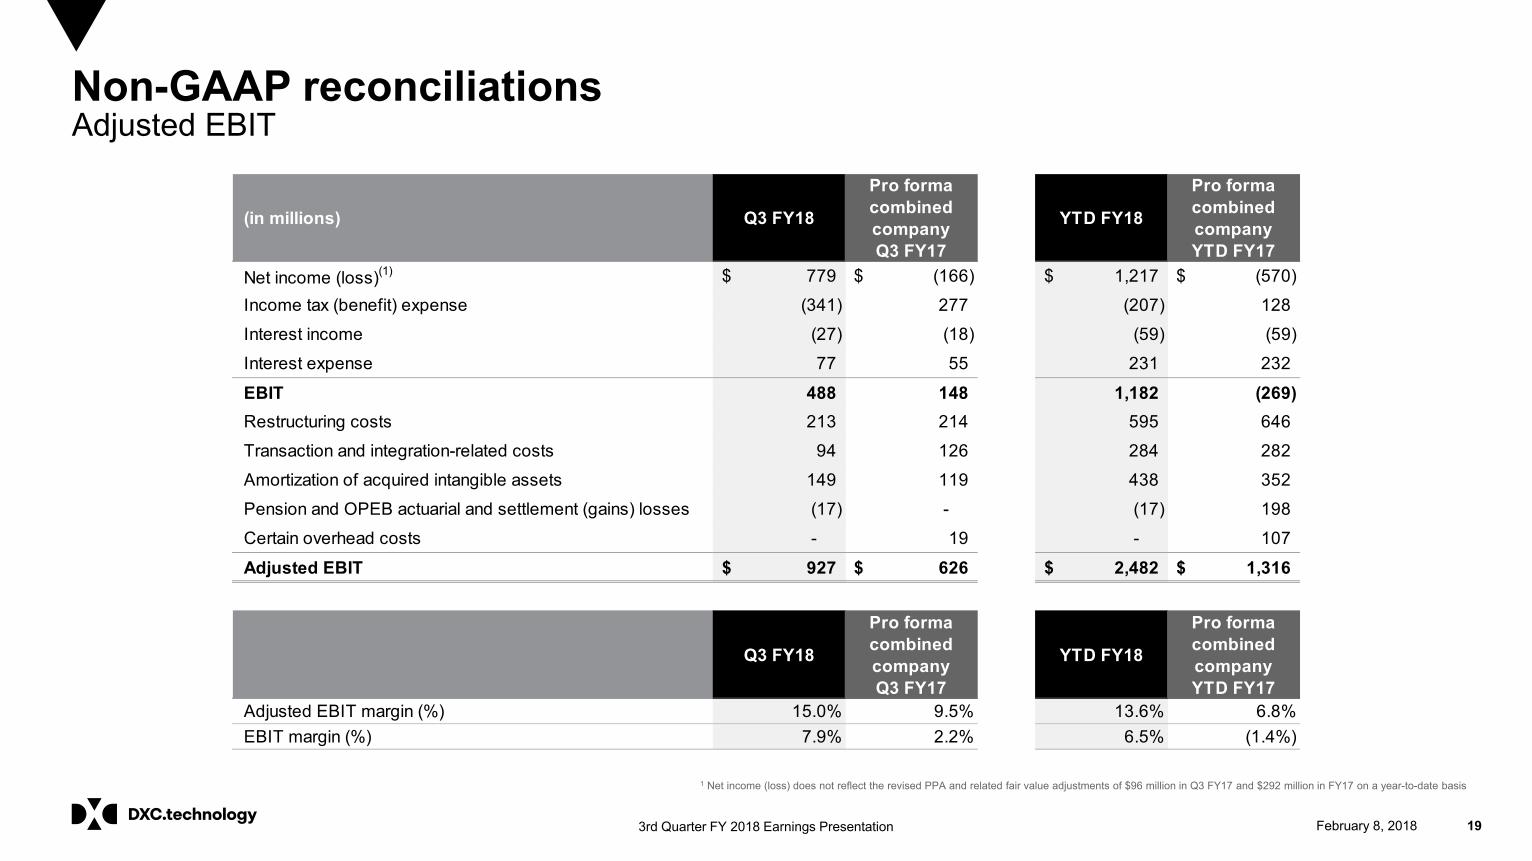
Non-GAAP reconciliationsAdjusted EBIT
(in millions) Q3 FY18
Pro formacombinedcompanyQ3 FY17
YTD FY18
Pro formacombinedcompanyYTD FY17
Net income (loss)(1) 779$ (166)$ 1,217$ (570)$
Income tax (benefit) expense (341) 277 (207) 128
Interest income (27) (18) (59) (59)
Interest expense 77 55 231 232
EBIT 488 148 1,182 (269) Restructuring costs 213 214 595 646
Transaction and integration-related costs 94 126 284 282
Amortization of acquired intangible assets 149 119 438 352
Pension and OPEB actuarial and settlement (gains) losses (17) - (17) 198
Certain overhead costs - 19 - 107
Adjusted EBIT 927$ 626$ 2,482$ 1,316$
Q3 FY18
Pro formacombinedcompanyQ3 FY17
YTD FY18
Pro formacombinedcompanyYTD FY17
Adjusted EBIT margin (%) 15.0% 9.5% 13.6% 6.8%EBIT margin (%) 7.9% 2.2% 6.5% (1.4%)
1 Net income (loss) does not reflect the revised PPA and related fair value adjustments of $96 million in Q3 FY17 and $292 million in FY17 on a year-to-date basis

February 8, 2018 203rd Quarter FY 2018 Earnings Presentation
Non-GAAP reconciliationsSegment profit
(in millions) Q3 FY18
Pro formacombinedcompanyQ3 FY17
YTD FY18
Pro formacombinedcompanyYTD FY17
GBS profit 431$ 338$ 1,093$ 889$
GIS profit 463 317 1,222 540
USPS profit 110 96 296 245
All other loss (77) (144) (129) (465)
Interest income 27 18 59 59
Interest expense (77) (55) (231) (232)
Restructuring costs (213) (214) (595) (646)
Pension and OPEB actuarial and settlement gains 17 - 17 (198)
Amortization of acquired intangible assets (149) (119) (438) (352)
Transaction and integration-related costs (94) (126) (284) (282)
Income (loss) before income taxes 438$ 111$ 1,010$ (442)$
Segment profit margins Q3 FY18
Pro formacombinedcompanyQ3 FY17
YTD FY18
Pro formacombinedcompanyYTD FY17
GBS profit margin (%) 18.6% 13.9% 15.9% 12.3%GIS profit margin (%) 14.7% 9.5% 13.2% 5.5%USPS profit margin (%) 15.2% 11.6% 14.0% 11.1%
February 8, 2018 213rd Quarter FY 2018 Earnings Presentation
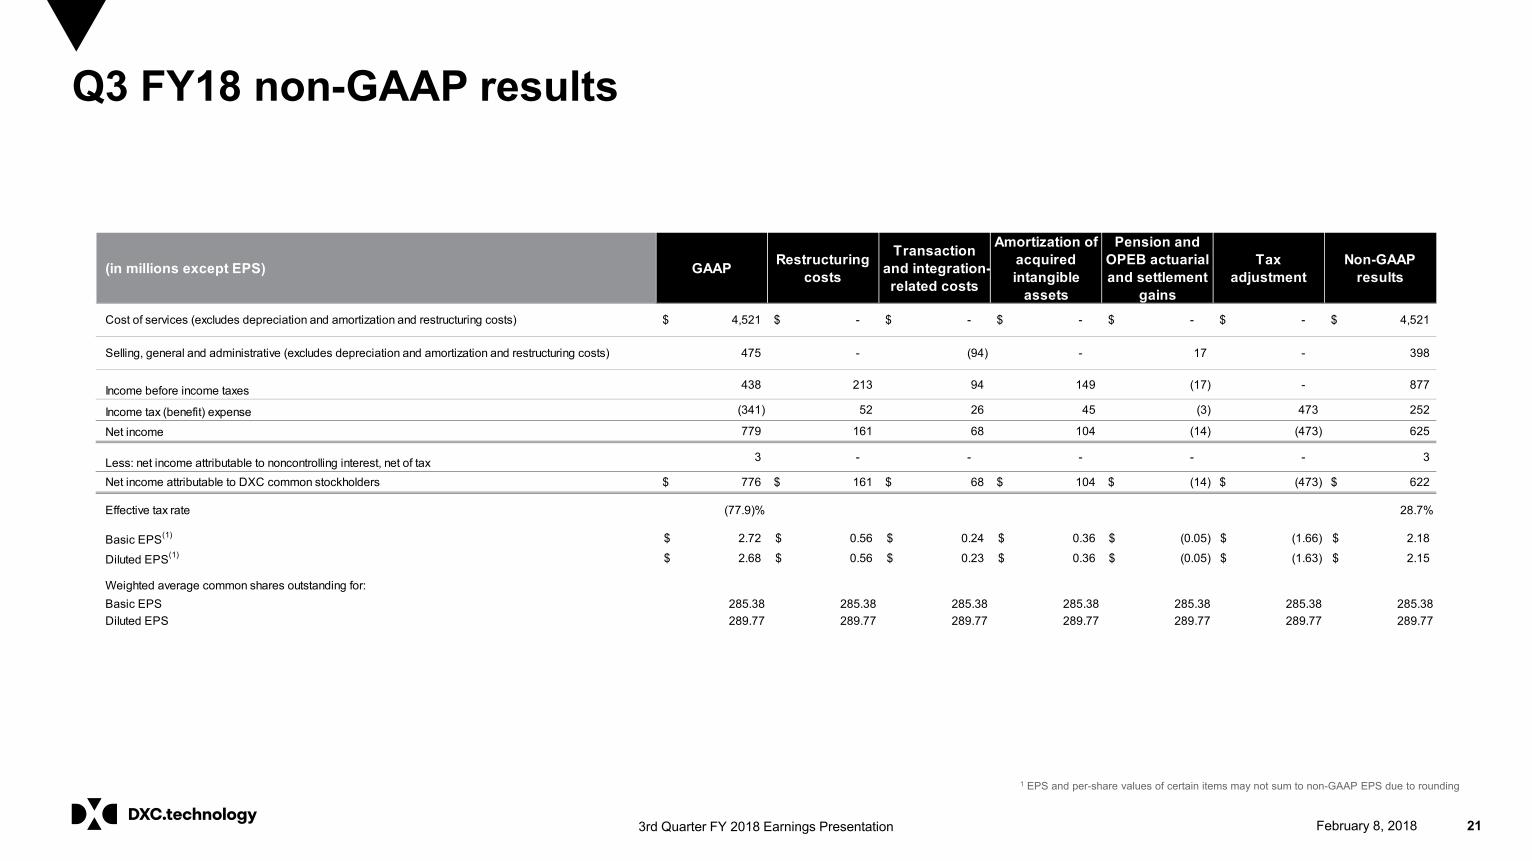
Q3 FY18 non-GAAP results
1 EPS and per-share values of certain items may not sum to non-GAAP EPS due to rounding
(in millions except EPS) GAAP Restructuring costs
Transaction and integration-related costs
Amortization of acquired intangible
assets
Pension and OPEB actuarial and settlement
gains
Tax adjustment
Non-GAAP results
Cost of services (excludes depreciation and amortization and restructuring costs) 4,521$ -$ -$ -$ -$ -$ 4,521$
Selling, general and administrative (excludes depreciation and amortization and restructuring costs) 475 - (94) - 17 - 398
Income before income taxes 438 213 94 149 (17) - 877
Income tax (benefit) expense (341) 52 26 45 (3) 473 252
Net income 779 161 68 104 (14) (473) 625
Less: net income attributable to noncontrolling interest, net of tax 3 - - - - - 3
Net income attributable to DXC common stockholders 776$ 161$ 68$ 104$ (14)$ (473)$ 622$
Effective tax rate (77.9)% 28.7%
Basic EPS(1) 2.72$ 0.56$ 0.24$ 0.36$ (0.05)$ (1.66)$ 2.18$
Diluted EPS(1) 2.68$ 0.56$ 0.23$ 0.36$ (0.05)$ (1.63)$ 2.15$
Weighted average common shares outstanding for:Basic EPS 285.38 285.38 285.38 285.38 285.38 285.38 285.38Diluted EPS 289.77 289.77 289.77 289.77 289.77 289.77 289.77
February 8, 2018 223rd Quarter FY 2018 Earnings Presentation
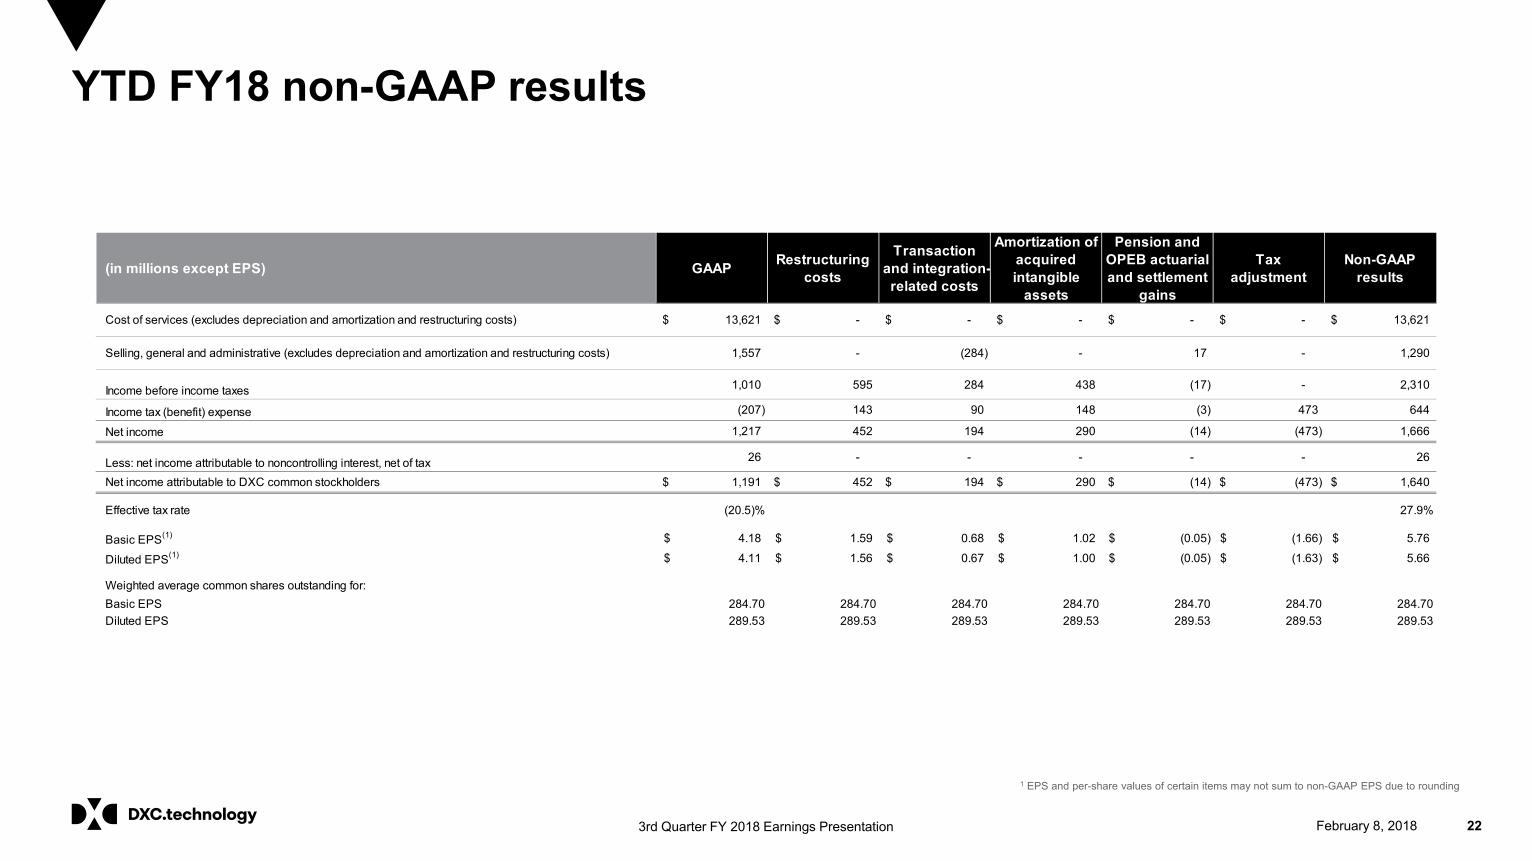
YTD FY18 non-GAAP results
1 EPS and per-share values of certain items may not sum to non-GAAP EPS due to rounding
(in millions except EPS) GAAP Restructuring costs
Transaction and integration-related costs
Amortization of acquired intangible
assets
Pension and OPEB actuarial and settlement
gains
Tax adjustment
Non-GAAP results
Cost of services (excludes depreciation and amortization and restructuring costs) 13,621$ -$ -$ -$ -$ -$ 13,621$
Selling, general and administrative (excludes depreciation and amortization and restructuring costs) 1,557 - (284) - 17 - 1,290
Income before income taxes 1,010 595 284 438 (17) - 2,310
Income tax (benefit) expense (207) 143 90 148 (3) 473 644
Net income 1,217 452 194 290 (14) (473) 1,666
Less: net income attributable to noncontrolling interest, net of tax 26 - - - - - 26
Net income attributable to DXC common stockholders 1,191$ 452$ 194$ 290$ (14)$ (473)$ 1,640$
Effective tax rate (20.5)% 27.9%
Basic EPS(1) 4.18$ 1.59$ 0.68$ 1.02$ (0.05)$ (1.66)$ 5.76$
Diluted EPS(1) 4.11$ 1.56$ 0.67$ 1.00$ (0.05)$ (1.63)$ 5.66$
Weighted average common shares outstanding for:Basic EPS 284.70 284.70 284.70 284.70 284.70 284.70 284.70Diluted EPS 289.53 289.53 289.53 289.53 289.53 289.53 289.53

February 8, 2018 233rd Quarter FY 2018 Earnings Presentation
Q3 FY17 non-GAAP results
1 Net (loss) income and EPS do not reflect the revised PPA and related fair value adjustments of $96 million and $0.34 for Q3 FY172 EPS and per-share values of certain items may not sum to non-GAAP EPS due to rounding
(in millions except EPS)Pro formacombinedcompany
Restructuring costs
Transaction and integration-related costs
Amortization of acquired intangible
assets
Pension and OPEB actuarial and settlement
losses
Certain overhead
costs
Tax adjustment
Non-GAAP results
Cost of services (excludes depreciation and amortization and restructuring costs) 5,015$ -$ -$ -$ -$ -$ -$ 5,015$
Selling, general and administrative (excludes depreciation and amortization and restructuring costs) 689 - (126) - - (19) - 544
Income before income taxes 111 214 126 119 - 19 - 589
Income tax expense 277 - - - - - (112) 165
Net (loss) income(1) (166) 214 126 119 - 19 112 424
Less: net income attributable to noncontrolling interest, net of tax 8 - - - - - - 8
Net (loss) income attributable to DXC common stockholders(1) (174)$ 214$ 126$ 119$ -$ 19$ 112$ 416$
Effective tax rate 249.5% 28.0%
Basic EPS(1)(2) (0.61)$ 0.76$ 0.44$ 0.42$ -$ 0.07$ 0.40$ 1.47$
Diluted EPS(1)(2) (0.61)$ 0.75$ 0.44$ 0.41$ -$ 0.07$ 0.39$ 1.45$
Weighted average common shares outstanding for:Basic EPS 283.16 283.16 283.16 283.16 283.16 283.16 283.16 283.16Diluted EPS 283.16 287.09 287.09 287.09 287.09 287.09 287.09 287.09
February 8, 2018 243rd Quarter FY 2018 Earnings Presentation
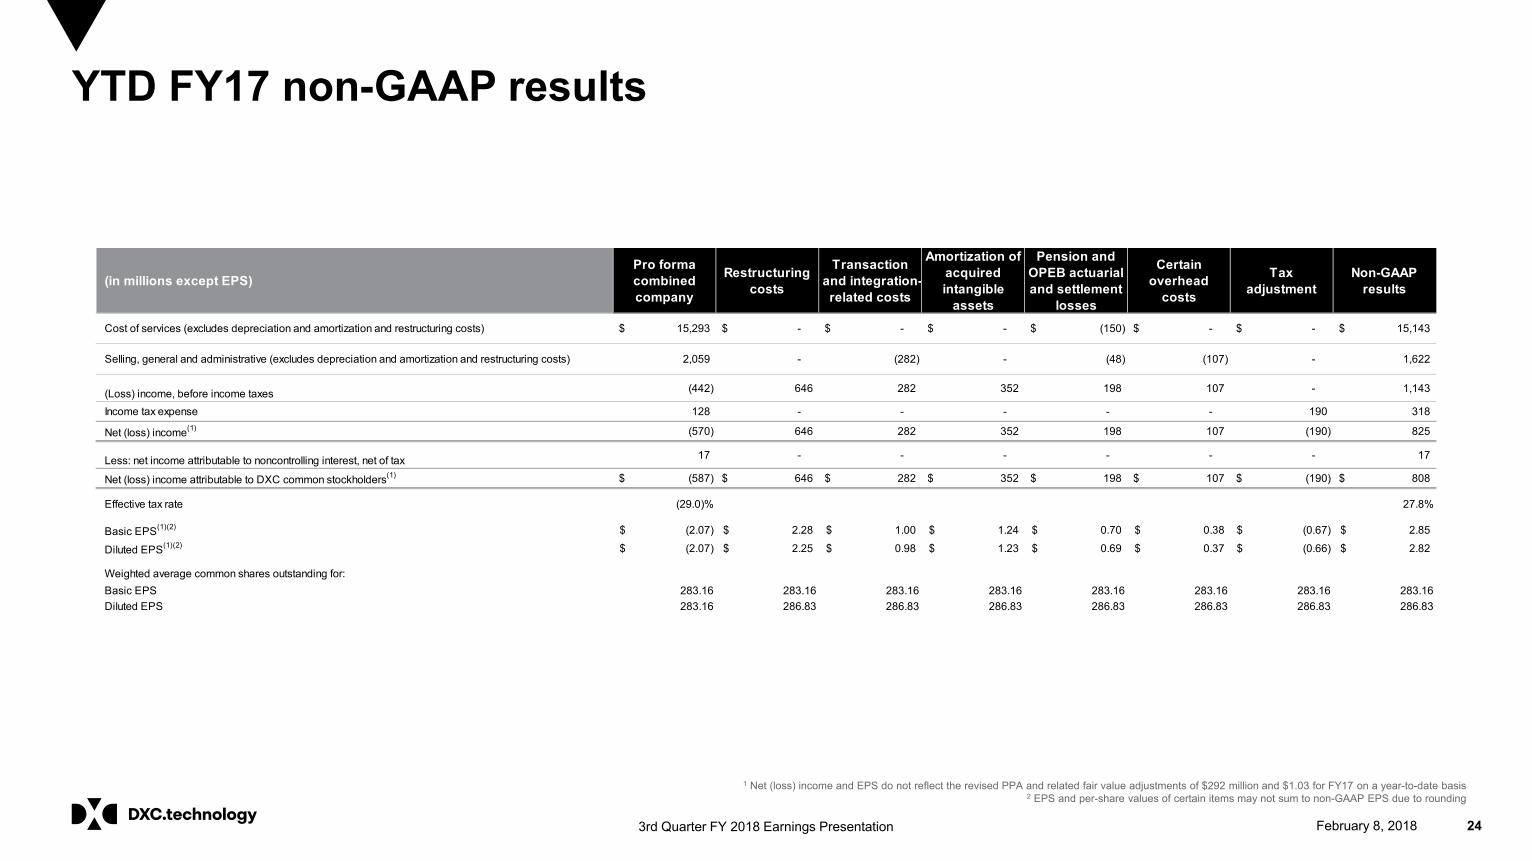
YTD FY17 non-GAAP results
1 Net (loss) income and EPS do not reflect the revised PPA and related fair value adjustments of $292 million and $1.03 for FY17 on a year-to-date basis2 EPS and per-share values of certain items may not sum to non-GAAP EPS due to rounding
(in millions except EPS)Pro formacombinedcompany
Restructuring costs
Transaction and integration-related costs
Amortization of acquired intangible
assets
Pension and OPEB actuarial and settlement
losses
Certain overhead
costs
Tax adjustment
Non-GAAP results
Cost of services (excludes depreciation and amortization and restructuring costs) 15,293$ -$ -$ -$ (150)$ -$ -$ 15,143$
Selling, general and administrative (excludes depreciation and amortization and restructuring costs) 2,059 - (282) - (48) (107) - 1,622
(Loss) income, before income taxes (442) 646 282 352 198 107 - 1,143
Income tax expense 128 - - - - - 190 318
Net (loss) income(1) (570) 646 282 352 198 107 (190) 825
Less: net income attributable to noncontrolling interest, net of tax 17 - - - - - - 17
Net (loss) income attributable to DXC common stockholders(1) (587)$ 646$ 282$ 352$ 198$ 107$ (190)$ 808$
Effective tax rate (29.0)% 27.8%
Basic EPS(1)(2) (2.07)$ 2.28$ 1.00$ 1.24$ 0.70$ 0.38$ (0.67)$ 2.85$
Diluted EPS(1)(2) (2.07)$ 2.25$ 0.98$ 1.23$ 0.69$ 0.37$ (0.66)$ 2.82$
Weighted average common shares outstanding for:Basic EPS 283.16 283.16 283.16 283.16 283.16 283.16 283.16 283.16Diluted EPS 283.16 286.83 286.83 286.83 286.83 286.83 286.83 286.83
February 8, 2018 253rd Quarter FY 2018 Earnings Presentation
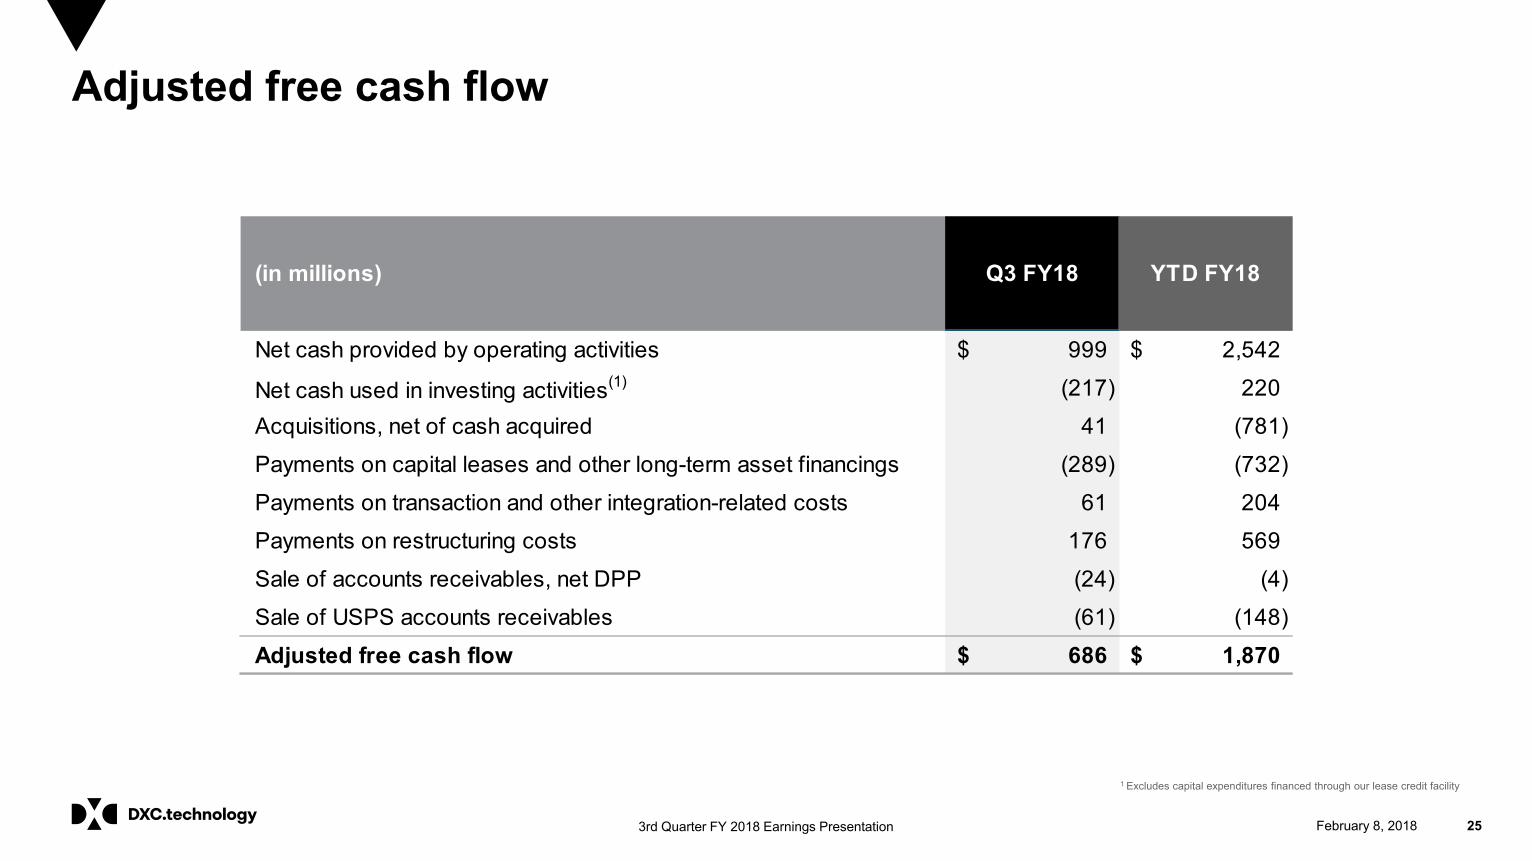
Adjusted free cash flow
(in millions) Q3 FY18 YTD FY18
Net cash provided by operating activities 999$ 2,542$
Net cash used in investing activities(1) (217) 220
Acquisitions, net of cash acquired 41 (781)
Payments on capital leases and other long-term asset financings (289) (732)
Payments on transaction and other integration-related costs 61 204
Payments on restructuring costs 176 569
Sale of accounts receivables, net DPP (24) (4)
Sale of USPS accounts receivables (61) (148)
Adjusted free cash flow 686$ 1,870$
1 Excludes capital expenditures financed through our lease credit facility

February 8, 2018 263rd Quarter FY 2018 Earnings Presentation
Non-GAAP and other definitions
Segment profit: Segment revenue less costs of services, segment selling, general and administrative, and depreciation and amortization (excluding amortization of acquired intangible assets)
Segment profit margin: Segment profit as a percentage of revenue
Earnings before interest and taxes (EBIT): Net income (loss) less income from discontinued operations, net of taxes, interest expense, interest income, and income tax expense (benefit)
EBIT margin: EBIT as a percentage of revenue
Adjusted EBIT: EBIT excluding restructuring costs, transaction and integration-related costs, amortization expense related to acquired intangible assets, pension and OPEB actuarial and settlement gains and losses, and certain overhead costs
Adjusted EBIT margin: Adjusted segment EBIT as a percentage of revenue
Adjusted free cash flow: Equal to the sum of (1) operating cash flows, (2) investing cash flows, excluding business acquisitions, dispositions and investments (including short-term investments and purchase or sale of available for sale securities), and (3) payments on capital leases and other long-term asset financings. Adjusted free cash flow is further adjusted for certain cash flow items, such as (i) payments for transaction and integration-related costs, (ii) restructuring payments, (iii) cash receipts from the sale of accounts receivables
Capital expenditure: Equal to the sum of purchases of property, equipment, and software, payments on outsourcing contracts, and principal payments on capital leases, less proceeds from sales of assets
Net debt: Total debt, less cash and cash equivalents
Net debt-to-total capitalization: Calculated as the ratio of net debt to total capitalization