Earnings Management During Antidumping Investigations In .../media/ac4bbdabce1a4d5d9c01b6dcf… ·...
51
0 Earnings Management During Antidumping Investigations In Europe: Sample-Wide And Cross- Sectional Evidence + David Godsell Michael Welker ⃰ Ning Zhang This draft: April 25, 2016 Abstract This paper examines earnings management in European Union firms that initiate an antidumping investigation. We first document economically and statistically significant income decreasing earnings management around the initiation of an antidumping investigation. We show that earnings management is more pronounced when accounting data directly affect the magnitude of the tariffs imposed in the trade investigation. We also find that earnings management decreases as the number of petitioning firms increases or as the distance between petitioning firms increases, suggesting free-rider and coordination problems. As corroborating evidence, we find that industry association involvement as a representative for petitioning firms enhances earnings management, suggesting that an industry association helps improve petitioner coordination and reduces free-rider problems. We find that earnings management is exacerbated when the petition is directed at a country that imports more goods from the petitioning firm’s home country, suggesting retaliation threats affect incentives. We document that raising equity or debt financing moderates income decreasing earnings management, consistent with the idea that sample firms trade off capital market and regulatory considerations. In contrast with some prior literature, we find that earnings management does not vary with legal enforcement, regulatory quality or measures of auditing and financial reporting oversight intensity. + Godsell is from Virginia Tech and Welker and Zhang are from Queen's University in Canada. We are grateful to Marc Busch for assistance in understanding trade regulations and data. We also acknowledge helpful comments on the manuscript from Christian Leuz (the editor), a very constructive and helpful anonymous referee, workshop participants from Virginia Polytechnic Institute and State University, the University of Waterloo, Miami University of Ohio and the University of Toronto, Giorgio Gotti, Hollis Skaife, Ole- Kristian Hope, Hans Christensen, Mark Maffett, Eddie Riedl, a reviewer for the International Accounting Section Mid-Year Meeting, and participants at the 2014 Global Issues in Accounting Conference at UNC-CH and the International Accounting Section Mid-year Meeting. We are also grateful to Bureau van Dijk for making their ORBIS database available to us to support this research. We acknowledge funding from the Social Science and Humanities Research Council of Canada (SSHRCC) and the Queen’s School of Business. Welker acknowledges financial support from the KPMG fellowship at Queen’s University. * Correspondence author: e-mail: [email protected]; telephone: (613) 533-2317.
Transcript of Earnings Management During Antidumping Investigations In .../media/ac4bbdabce1a4d5d9c01b6dcf… ·...

0
Earnings Management During Antidumping Investigations In Europe: Sample-Wide And Cross-Sectional Evidence+
David Godsell
Michael Welker⃰
Ning Zhang
This draft: April 25, 2016
Abstract
This paper examines earnings management in European Union firms that initiate an antidumping investigation. We first document economically and statistically significant income decreasing earnings management around the initiation of an antidumping investigation. We show that earnings management is more pronounced when accounting data directly affect the magnitude of the tariffs imposed in the trade investigation. We also find that earnings management decreases as the number of petitioning firms increases or as the distance between petitioning firms increases, suggesting free-rider and coordination problems. As corroborating evidence, we find that industry association involvement as a representative for petitioning firms enhances earnings management, suggesting that an industry association helps improve petitioner coordination and reduces free-rider problems. We find that earnings management is exacerbated when the petition is directed at a country that imports more goods from the petitioning firm’s home country, suggesting retaliation threats affect incentives. We document that raising equity or debt financing moderates income decreasing earnings management, consistent with the idea that sample firms trade off capital market and regulatory considerations. In contrast with some prior literature, we find that earnings management does not vary with legal enforcement, regulatory quality or measures of auditing and financial reporting oversight intensity.
+ Godsell is from Virginia Tech and Welker and Zhang are from Queen's University in Canada. We are grateful to Marc Busch for assistance in understanding trade regulations and data. We also acknowledge helpful comments on the manuscript from Christian Leuz (the editor), a very constructive and helpful anonymous referee, workshop participants from Virginia Polytechnic Institute and State University, the University of Waterloo, Miami University of Ohio and the University of Toronto, Giorgio Gotti, Hollis Skaife, Ole-Kristian Hope, Hans Christensen, Mark Maffett, Eddie Riedl, a reviewer for the International Accounting Section Mid-Year Meeting, and participants at the 2014 Global Issues in Accounting Conference at UNC-CH and the International Accounting Section Mid-year Meeting. We are also grateful to Bureau van Dijk for making their ORBIS database available to us to support this research. We acknowledge funding from the Social Science and Humanities Research Council of Canada (SSHRCC) and the Queen’s School of Business. Welker acknowledges financial support from the KPMG fellowship at Queen’s University.
* Correspondence author: e-mail: [email protected]; telephone: (613) 533-2317.
1
Earnings Management During Antidumping Investigations In Europe: Sample-Wide And Cross-Sectional Evidence
Section 1 – Introduction
Earnings management occurs when management uses the flexibility inherent in accounting standards to manage
the firm’s reported accounting earnings to influence some economic outcome to the firm’s (or management’s)
benefit (Schipper, 1989). This paper examines earnings management in European Union (EU) firms initiating
antidumping trade investigations. Antidumping investigations in the EU (and elsewhere) involve two key
determinations. First, the prices at which foreign exporters are selling goods in the EU are compared to the
goods’ normal values to determine if goods are being dumped into the EU.1 Second, the financial performance
of the allegedly affected domestic EU industry is examined to determine if the domestic industry has suffered
financial injury as a result of the dumping. When both dumping and material injury are present, duties on the
goods imported into the EU are assessed. These duties make the products of the domestic industry more
competitive and financially benefit the domestic industry. This setting provides clear incentives for the domestic
industry to engage in earnings management to enhance the likelihood of an affirmative injury decision. The
setting also allows an examination of several economic predictions about cross-sectional variation in earnings
management that are new to the literature.
In a seminal study in the accounting literature, Jones (1991) examines a small sample of companies that
requested import relief in five industries in the United States between 1980 and 1985 and finds evidence
suggesting that firms manipulate their accounting data to report diminished profitability in the year in which the
trade investigation is concluded. Jones’ (1991) work has spawned tremendous interest in earnings management,
including application and extension of her model in a variety of contexts. Debates over the existence, magnitude
and measurement of earnings management in this extensive literature continue today (e.g., Ball, 2013; Gerakos,
2012).2 Despite this voluminous follow up work, there has been almost no additional work that investigates
whether and how earnings management occurs during trade investigations in contemporary periods and in other
1 Normal value is typically the price of the product allegedly dumped when sold in the exporting country market. 2 Since the subsequent earnings management literature has not focused on trade investigations and is very extensive, we do not provide a detailed review of this literature here. This broad literature and the influence of the original Jones (1991) article on this literature are discussed in Dechow, Ge and Schrand (2010). The only studies that examine potential earnings management in trade investigations are Rayburn and Lenway (1992) who examine sixteen U.S. semiconductor manufacturers during 1985 and Magnan, Nadeau and Cormier (1999) who examine 17 Canadian firms during 1976 to 1992.

2
jurisdictions around the world. There have been a variety of studies that examine earnings management in other
regulatory settings that produce similar incentives to manage earnings to report lower profitability. Most of these
studies are conducted using data from the United States. This literature has typically examined regulated
industries or circumstances in which high profitability could prompt political scrutiny and costs (e.g., Cahan
(1992), Mensah, Considine and Oakes (1994), Key (1997), Han and Wang (1998), Monem (2003) and Johnston
and Rock (2005)).
Our research is closely related to studies that examine earnings management in jurisdictions outside the
United States. Leuz, Nanda and Wysocki (2003) document that earnings management proxies suggest less
earnings management in countries with better developed stock markets that have more dispersed ownership, and
better legal enforcement and investor protection. Gopalan and Jayaraman (2012) extend Leuz et al. (2003) and
find that insider controlled firms exhibit more earnings management in countries with weak investor protection.
Francis and Wang (2008) also find an association between earnings management and investor protection that is
concentrated in firms using Big 4 auditors. Because these international studies examine earnings management in
broad samples of public firms, the researchers generally have no prior beliefs regarding if, when or how firms in
these broad samples might face incentives to manage earnings to achieve a particular economic outcome. As a
result, it is difficult to infer whether the evidence provided in these studies is consistent with earnings
management or with variation in accruals caused by other factors.
In contrast, in the trade investigation setting, we are able to identify which firms have incentives to
manage earnings, and when and how they would manage earnings in order to increase the likelihood of receiving
trade remedies and the economic magnitude of those remedies. As we detail later, the process by which injury is
determined and the procedure for assessing duties provide clear incentives to engage in predictable earnings
management in the periods surrounding the initiation of an antidumping investigation. While our study utilizes
smaller samples than much of the past literature, we are able to make directional predictions about earnings
management during particular periods that have not been possible in most of the prior literature examining
earnings management in international settings.
We choose to examine firms initiating trade investigations in the EU for several reasons. First, there is a
single regulatory process in place that governs how all antidumping investigations are conducted in the EU. This

3
allows us to investigate a number of interesting sample partitions to see what factors are associated with cross-
sectional variation in earnings management while holding constant the regulatory setting that gives rise to the
earnings management incentives. The regulatory process governing trade investigations in the EU can determine
assessed duties based on the extent of injury (allegedly) suffered by domestic petitioners, providing enhanced
incentives for earnings management in those cases. In addition, the EU setting provides interesting variation in
the number of firms within the EU that initiate investigations, the distance between those firms and the
involvement of industry associations in the investigation and in the export intensity of the countries that are
home to petitioning firms. The EU setting allows us to investigate the effects of these setting specific incentives
on earnings management, enhancing confidence that our analysis is documenting earnings management in
response to the incentives provided in the setting. In addition, we are able to assess the effects of country level
institutions such as legal enforcement and regulatory quality while holding constant the regulatory process that
produces the incentives for earnings management in our setting.
We develop our hypotheses by analyzing the trade investigation process. The injury decision involves
systematically comparing accounting data prior to the initiation of the antidumping claim with accounting data
in the year, and in some cases, the year after or year before, the investigation is launched. Deteriorating
accounting performance around the time the claim is filed is viewed as evidence consistent with the domestic
industry being injured by the dumping of competing foreign products into the EU marketplace. This injury
determination process is dictated by WTO guidelines and would be very transparent and predictable to
petitioning firms. Hence, we posit that EU firms petitioning for trade remedies in antidumping investigations
have strong incentives to engage in income decreasing earnings management in the year of and year subsequent
to their petition for trade relief. Sample-wide we find income decreasing earnings management in the year
closest to the date the antidumping investigation is initiated and the following year, and our estimates of
earnings management suggest that on average discretionary accruals contribute to more than a one percent
decline in return on assets during these periods for sample firms. We consider that magnitude of decline to be
economically as well as statistically significant.
We also document a number of cross-sectional patterns in this earnings management activity. We
examine two types of factors that could affect the incentives for earnings management in our setting. First, we

4
examine some previously unexplored factors that could impact the costs and benefits of earnings management
that are specific to our setting. Second, we revisit some factors that the previous literature has found are
associated with earnings management to see if these factors impact earnings management in our setting. Our
first set of case specific variables includes a measure of the extent to which petitioning firms’ accounting data
directly affects the magnitude of import relief provided in successful cases, the number of firms petitioning for
import relief and the distance between them, the involvement of an industry association in the petition and the
export intensity of the country that is home to the petitioning firm(s). We find that earnings management is more
pronounced in cases in which the petitioning firms’ accounting data directly affect the magnitude of the tariffs
imposed in the trade investigation. In antidumping investigations in the EU, the European Commission
calculates two margins: a dumping margin that measures the deviation of the sales price charged for the dumped
goods in the EU from the goods’ normal value and an injury elimination margin that measures the duty that
would have to be applied to the foreign goods in order to remove the injury to the domestic industry.
Importantly, the ultimate duty applied is the lower of the dumping margin and the injury elimination margin.
This decision is made individually for each foreign exporter, or in some cases, for each foreign country where
foreign exporters are domiciled. As a result, any given antidumping case may have some defendants assigned an
injury elimination margin and some defendants assigned a dumping margin. If petitioning firms from the
domestic industry can anticipate which margins will be lower, the incentives to engage in earnings management
are stronger when injury elimination margins are used to determine the tariffs for a greater proportion of the
defendants as these margins are a direct function of the petitioning firms’ accounting data. We find that earnings
management is more pronounced when a greater proportion of the tariffs assigned in the case are based on injury
elimination margins.
In addition, we find that the income decreasing earnings management around case initiation is less
pronounced in cases involving a greater number of sample petitioning firms. Among those cases that involve
two or more sample petitioning firms, we find that earnings management is less pronounced in cases in which
there is greater distance between the petitioners and more pronounced in cases in which the petitioning firms are
represented in the investigation by an industry association. These results suggest that either free-rider problems
or coordination costs are more severe when more firms are involved or when firms are more distant, limiting the

5
earnings management undertaken by petitioning firms. The results also indicate that an industry association that
represents petitioning firms can mitigate coordination and free-rider problems. To the best of our knowledge,
this is the first evidence in the accounting literature that free-rider problems or coordination costs affect earnings
management incentives. We also find that earnings management is exacerbated when the country that is home to
the petitioning firm has a high level of exports to the country(ies) charged in the petition with dumping goods
into the EU. This result is consistent with the idea that regulators are reluctant to impose tariffs on countries with
strong capability to retaliate, and that petitioning firms manage earnings more to enhance the apparent injury
and increase their probability of success in these cases.
Our second set of cross-sectional variables includes external financing needs and country level
institutions. We identify firms that raise new debt or equity financing in the year of and/or the year after the
initiation of an antidumping investigation, and find that income decreasing earnings management in those years
is moderated for this set of firms. This result is consistent with the literature that suggests that reporting
incentives play an important role in influencing financial reporting decisions and highlights the tradeoff between
regulatory and capital market based incentives (Ball, Robin and Wu, 2003; Leuz et al., 2003). We find that
earnings management during trade investigations does not differ between countries with better legal
enforcement or regulatory quality and countries with worse legal enforcement and regulatory quality. We find
similar results when we partition our sample on measures that explicitly capture auditing and financial reporting
related enforcement. On the surface this evidence appears to contradict the past literature that better legal
enforcement or regulatory quality generally moderate earnings management. We conjecture that this difference
from the prior research findings is a result of the type of earnings management we document. Most prior studies
examine broad samples in which any earnings management occurring is likely to be income increasing,
decreasing transparency and potentially harming investors. In our setting firm stakeholders other than consumers
will benefit from import relief if the antidumping case is successful. In addition, the expected earnings
management is income decreasing. Therefore it is not clear that better regulatory and legal institutions would
constrain the type of earnings management we document if regulators are incented to be attentive to income
increasing earnings management that is detrimental to stakeholders other than management.

6
Our study makes several contributions to the accounting literature. First, our main results update and
expand the analyses reported by Jones (1991) and suggest that earnings management during import relief
investigations continues in a contemporary European Union sample. Given the importance of the Jones (1991)
paper to the accounting literature, we believe this update and extension of her analysis is important. Her original
evidence is based on a small sample (23 firms, 14 of which are petitioning firms) from a single jurisdiction
(U.S.) in the early 1980s, over 30 years ago. The only additional work examining trade investigation settings
(Rayburn and Lenway (1992) and Magnan et al. (1999)) is also based on very small and dated samples in the
U.S. and Canada, respectively. Given the importance of trade regulation to the world economy and the
systematic liberalization of international trade since the 1980s, additional evidence on the use of accounting data
in trade regulation, and the incentives trade regulations create, seems warranted. In addition, the models used to
detect earnings management have advanced considerably since Jones (1991) and our paper provides important
feedback about the ability of current research methods to detect accruals based earnings management.
One of the most compelling contributions of our paper comes from our consideration of the process
through which petitioning firms prepare petitions and through which regulators use accounting data in the trade
investigation. Our evidence that earnings management increases with the likelihood of regulators basing tariffs
on the petitioners’ accounting data, increases with the ability of the defendant country(ies) to retaliate, and
decreases as the number of petitioning firms increases or as the distance between petitioners increases and
therefore coordination costs increase provide novel and unique insights to the earnings management literature.
Our study provides the first evidence that industry associations may play a role in helping to mitigate
coordination and free-rider problems. These results are interesting from accounting and industry lobbying and
protectionism perspectives (Ludema, (2001), Reynolds (2006), Nelson (2006)). Collectively these findings
suggest that a thorough understanding of the incentives facing firms can significantly increase the power of
research designs that examine the prevalence and magnitude of earnings management in economically
motivated settings. We encourage further work in which a thorough understanding of the incentives for earnings
management is incorporated in the research design.
Our finding that firms that issue debt or equity financing around the time of the trade investigation
engage in less income decreasing earnings management suggests that these firms must trade off economic
7
benefits from trade remedies with capital market outcomes that may accompany reporting lower accounting
performance. We also contribute to, and offer a caveat to, the literature on the effect of country level institutions
on earnings management. The lack of the expected association between legal and regulatory institutions and
earnings management in this setting leads to a conjecture that this regulatory forbearance occurs in our setting
because: i) the earnings management is beneficial to stakeholders other than consumers, and/or ii) the earnings
management is income decreasing and regulators and auditors focus on income increasing earnings management
(Dechow et al., 2011). We encourage more research on the effects of regulatory institutions to further our
understanding of how these institutions influence financial reporting in a variety of settings and to help
disentangle these two potential causes for regulatory forbearance.
The remainder of the paper is organized as follows. Section 2 of the paper describes the process that is
followed in antidumping deliberations in the EU, reviews the relevant trade and accounting literature, and
develops our hypotheses. Section 3 describes the data, our sample selection procedures, and provides descriptive
statistics for our sample firms. Section 4 describes the research design employed to test the hypotheses presented
in the paper. Section 5 presents our empirical results and Section 6 offers our conclusions and suggestions for
future work.
Section 2 – Description of the setting, prior literature, and hypotheses
We focus our discussion of the antidumping investigation process on the procedures in place in the EU.
Antidumping investigations in the EU are generally initiated after receiving a complaint from producers of a
homogeneous product in the European Community (hereafter the Community) alleging that non-EU domiciled
foreign exporters are dumping a like product in the EU. Blonigen and Prusa (2003) review the antidumping
literature and report that industry specific factors such as import penetration, industry employment, capital
intensity and industry concentration and macro-economic factors such as GDP growth and currency fluctuations
are associated with firms’ decisions to initiate an investigation. The European Commission is responsible for
investigating antidumping allegations, and the process begins with a decision about whether or not the evidence
provided in the complaint warrants an investigation. This decision must be made within 45 days of receiving the
complaint. Importantly, the complaint filed by the EU producers must provide detailed information about the
alleged dumping including evidence of dumping, injury, and a causal link between the two.

8
When the European Commission decides to investigate a complaint, it publishes a notice in the EU’s
Official Journal indicating it is opening an investigation. The European Commission then sends questionnaires
to both EU producers and to the exporting firms accused of dumping to gather information that will aid in the
investigation. An investigation into an allegation that foreign companies are dumping products involves two
critical determinations. First, the European Commission must determine whether foreign goods are in fact being
sold below fair market value into their jurisdiction. This involves a comparison of the prices at which the foreign
entities are selling goods in the EU with the goods’ normal value. Typically, normal values are the prices at
which the foreign exporter sells goods in its own domestic market. In some cases, the exporter has insufficient
sales in its domestic market, the foreign entity’s domestic market is deemed to be a non-market economy, or the
prices in that market are deemed to be below unit production costs plus selling, general and administrative
expenses.3 In these cases, the determination of whether dumping is taking place is based either on the prices at
which the goods are sold in a third (or proxy) market, or based on a constructed normal value. The constructed
normal value of the good is the “cost of production in the country of origin plus a reasonable amount for selling,
general and administrative costs and for profits.”4 The accounting data of the foreign producers would be used
to determine constructed normal values. The foreign producers are given incentive to cooperate with the
investigation in the EU because the European Commission makes it clear that “the consequences of non-
cooperation normally lead to the imposition of measures which are higher than for parties which have
cooperated.”5
The second determination is whether the domestic producers of the goods have been injured by the
alleged dumping. This is the key determination that provides firms seeking trade relief with incentives to
manage their earnings to demonstrate diminished profitability and therefore injury. This determination is based
on the volume of dumped goods compared to the total domestic market, the effect of the dumped imports on
prices in that market, and the impact of the dumped imports on the domestic industry. The extent to which the
dumped imports have negatively impacted the domestic industry is based on “an evaluation of all relevant
3 The economies in transition that the EU currently considers non-market economies are the People’s Republic of China, Vietnam, Kazakhstan, Albania, Armenia, Georgia, Kyrgyzstan, Moldova and Mongolia. 4 This definition, which comes from European Council Regulation No. 1225/2009, Article 2, section 3, conforms to the definition in the World Trade Organization guidelines. The Regulation is available at http://trade.ec.europa.eu/doclib/docs/2010/april/tradoc_146035.pdf. 5 “Investigations” available at http://trade.ec.europa.eu/doclib/docs/2013/april/tradoc_151022.pdf.

9
economic factors and indices having a bearing on the state of the industry, including the fact that an industry is
still in the process of recovering from the effects of past dumping, the magnitude of the actual margin of
dumping, actual and potential decline in sales, profits, output, market share, productivity, return on investments,
utilization of capacity, factors affecting … prices; actual and potential negative effects on cash flow, inventories,
employment, wages, growth, ability to raise capital or investments. This list is not exhaustive, nor can any one
or more of these factors necessarily give decisive guidance.”6
The injury decision typically involves the assessment of changes in industry financial condition during
an investigation period. While there is some variation in exactly how this investigation period is defined, the
typical case uses an investigation period of approximately two years, and this investigation period typically ends
at some time in the year before or the year after the trade investigation is initiated. Usually deteriorating
financial performance between the two years of the investigation period and the two years prior to the
investigation period is cited as evidence of injury. It is clear that the determination of injury to domestic
producers involves the extensive use of affected domestic producers’ accounting data.
Jones (1991) provides an extensive discussion of the incentives that petitioning firms have to manage
their accounting data to provide more compelling evidence that injury exists in trade cases.7 The incentives to
report less profitable operations during an antidumping investigation may conflict with other incentives
managers may have, e.g., to report inflated profitability to appease shareholders, or due to debt covenants or
compensation agreements. However, because all parties that contract with the firm (with the exception of
consumers) stand to benefit if the firm receives a favorable ruling, these incentives to report inflated profitability
are likely to be outweighed on average by the incentives to report diminished profitability during the
investigation period.8 Regulators overseeing the antidumping investigation are unlikely to have incentives to
6 European Council Regulation No. 1225/2009, Article 3, section 5. 7 While Jones (1991) discusses antidumping investigations, her empirical analysis focuses on “general escape clause” trade investigations in the United States. These investigations did not require that dumping by foreign producers be proven. She argues that the incentives to understate accounting data to show injury are even greater in general escape clause investigations than in antidumping investigations because the extent of injury required to get trade relief is higher in general escape clause investigations. While this may be true, the incentives to understate accounting data to demonstrate injury in antidumping cases still clearly exist. We examine antidumping cases because data on these cases are available internationally. 8 Outcomes other than the imposition of antidumping duties include rejection of the application for trade remedy, an undertaking (a price agreement) established between the European Commission and the exporter, or the withdrawal of the application for trade relief by the petitioner (this may be caused for any number of reasons, e.g., lack of petition support from industry peers, inadequate evidence to support claims or the establishment of a private sector agreement satisfactory to the petitioner (see, e.g., Prusa (1992) and Staiger and Wolak (1994))).

10
“undo” any earnings management because it is unlikely that consumers will find it cost effective to organize and
lobby the regulator to do so.9 Thus, trade investigations provide powerful incentives to report poor financial
performance. To provide a more complete understanding of the trade investigation process, we present a
description of one case in detail in the appendix.
In our study, we build upon and extend Jones (1991) in several ways. We first update her analysis to
examine much more recent data. Much has changed both in the world of international trade and in accounting
since the mid-1980s, not least being the advent of the WTO and its stricter terms on antidumping methodology
(Barton, Goldstein and Josling, 2006). Therefore, it is ex ante not clear if the original Jones (1991) findings are
descriptive of current practice.
Second, the original Jones (1991) study examines only trade investigations that were initiated in the
United States. Since the United States has arguably the most stringent accounting standards and enforcement in
the world, it could be argued that Jones (1991) evidence provides a lower bound on the extent to which
accounting data are managed internationally in response to trade investigations. International investigations of
earnings management across a wide range of countries generally find that the United States has the best, or
among the best, earnings quality, with the least evidence of earnings management, in the world (Leuz et al.
(2003), Bhattacharya et al. (2003)). Our work sheds light on trade investigations in the EU to provide evidence
about whether the management of accounting data during trade investigations exists outside the United States.
Our initial baseline specification includes indicator variables for particular years relative to the date the trade
investigation is initiated. We predict that earnings are managed downward in period t and t+1 relative to the year
in which the petition is filed. We include year indicators for periods t-3 and t-2 because these periods are often
used as benchmarks in assessing the extent of the injury experienced in the petitioning firms’ industry. If
petitioning firms plan the initiation of their investigation far in advance, there would be incentives to engage in
income increasing earnings management during these baseline periods to exaggerate the injury calculation.10 We
9 Blonigen and Prusa (2003, p. 11) describe the process by which injury is determined in the U.S. as follows: “Somewhat like the definition of pornography, they apparently know injury when they see it… Trends analysis is common, but this essentially means eyeballing charts and tables and confirming profits and employment are down. If imports have also increased, the causality connection is assumed.” 10 This notion is anticipated by several authors in early work. For example, Hillman, Katz and Rosenberg (1987) develop a model in which firms hire excessively in up market conditions so they can point to the dismissal of larger numbers of workers when responding to an import shock, thereby increasing the likelihood of a positive injury determination. Leidy and Hoekman (1991) also suggest strong

11
also include an indicator variable for period t-1, though predicting what type of earnings management would be
incented in trade investigations during this period is more difficult because sometimes this period in included in
the pre-injury baseline period, and sometimes it is included in the injury investigation period. In addition, we
include terms for periods t+2 and t+3 to capture any reversal of the income decreasing earnings management
occurring in periods t and t+1 (Dechow, Hutton, Kim and Sloan, 2012). The optimal earnings management
pattern in this setting would be to inflate earnings in periods t-3 and t-2, then have this income increasing
earnings management reverse during periods t and t+1, exaggerating the perceived injury due to dumping. If this
pattern is what we observe, then there would not be reversals in periods t+2 and t+3 because the accrual reversal
would occur in periods t and t+1.
In order to limit the number of indicator variables included in our subsequent empirical testing, we also
present baseline results that collapse periods t-3, t-2 and t-1 into a new variable (Pre) capturing average earnings
management during the pre-injury baseline period, periods t and t+1 into a new variable (Current) capturing the
average earnings management during the injury investigation period, and periods t+2 and t+3 into a new
variable (Post) to capture any reversal of earnings management that occurs during the post injury determination
period.
Our first hypothesis predicts that petitioners in trade investigations engage in earnings management
around the time of the investigation. We expect to see the strongest results during the Current time period in our
tests but our specifications also test for earnings management before and after that primary test period.
H1: EU firms petitioning for trade relief engage in earnings management around the time the petition is
filed.
We next consider case-based incentives that vary across firms. The process of assigning duties in
antidumping trade investigations in the EU follows a two-step process. The Council regulation describing
protections against dumped imports in the EU notes that “the amount of the antidumping duty shall not exceed
the margin of dumping established but it should be less than the margin if such lesser duty would be adequate to
incentives for petitioning firms to “orchestrate the appearance of injury”, leading to their theory of spurious injury. These papers sit in a broader literature to which our paper relates which studies directly unproductive profit seeking or rent seeking, a general concept first outlined by Bhagwati (1982).

12
remove the injury to the Community industry”.11 In other words, two potential duties are calculated, a dumping
margin and an injury elimination margin, and the final duties assessed in the case are the lower of these two
margins. The dumping margin is defined in the EU council regulation as “the amount by which the normal value
exceeds the export price”.12 Normal values are prices paid in arms-length transactions in the exporting country,
though in some circumstances a constructed normal value or a proxy country normal value are used. The export
price is defined in the EU council regulation as “the price actually paid or payable for the product when sold for
export from the exporting country to the Community”, though again there are circumstances in which
adjustments are made in arriving at this price.13 The regulations do not provide detailed guidance indicating how
the injury elimination margin is to be calculated, but anecdotally from our review of decisions this is often
calculated as the increase in price needed to bring the industry back to the profitability levels that existed prior
to the injury investigation period.
This sample partition assumes that the firms initiating a trade investigation would have reasonable
foresight about whether injury elimination margins or dumping margins are likely to be the predominantly used
margins in their case. We believe that this assumption is reasonable because the petitioning firms have to gather
data that would allow them to estimate both the injury elimination and dumping margins in their case.
Petitioning firms are required to provide information including, for example, “…a complete description of the
allegedly dumped product, information on prices at which the product in question is sold when destined for
consumption in domestic markets…information on prices at which the product is sold…to a third country or
information on the constructed value of the product… and information on export prices”. 14 This is the
information needed to determine dumping margins. In addition, the petitioning firms must provide “information
on changes in the volume of the allegedly dumped imports, the effect of those imports on prices of the like
product on the community market, and the consequent impact of the imports on the community industry”.15 This
is the information needed to determine injury elimination margins. If petitioning firms are able to correctly
anticipate when injury elimination margins are likely to be utilized in setting final duties, the earnings
11 European Council Regulation No. 1225/2009, Article 9, section 4. 12 European Council Regulation No. 1225/2009, Article 2, section 12. 13 European Council Regulation No. 1225/2009, Article 2, section 8. 14 European Council Regulation No. 1225/2009, Article 5, section 2. 15 European Council Regulation No. 1225/2009, Article 5, section 2.

13
management incentives to exaggerate the extent of injury are particularly strong because in those cases the
managed accounting data map directly into the magnitude of the ultimate duties imposed on exporting firms and
the trade relief the petitioning firms receive.16 Our second hypothesis is:
H2: The earnings management by firms petitioning for trade relief in the EU is concentrated in firms
initiating investigations in which tariffs are more likely to be based on injury elimination margins more
so than firms initiating investigations in which tariffs are more likely to be based on dumping margins.
The European Commission, like other trade regulators, assesses injury at the industry level, not at the
level of the individual firm. As such, there are free-rider and coordination problems among firms that belong to
the allegedly affected industry in the EU. Individual firms have an incentive to be free-riders that do not manage
earnings to help bolster the case that the industry has been injured. This allows these firms to avoid the potential
costs associated with income decreasing earnings management to show injury while relying on other firms’
accounting data to present a persuasive case in favor of an affirmative injury ruling. The potential costs of
income decreasing earnings management stem from the uses of accounting data in capital markets and in
contractual settings. As the number of firms associated with the petition for import relief increases, we expect
that the incentives to be a free-rider, and the costs of coordinating earnings management activities across
petitioners to avoid free-rider problems, increase. In addition, in cases with two or more sample petitioning
firms, we expect the costs of coordinating earnings management activities and preventing free-rider problems to
increase as the distance between the petitioners increases. This would result in diminished earnings management
in those cases that have a greater number of sample firms joining together to petition for import relief and in
cases in which the petitioning firms are more distant. In addition, our setting is particularly well suited to
examining coordination and free-rider effects because in a number of our sample cases petitioning firms are
represented by an industry association. This allows us to test whether such involvement helps mitigate these
coordination and free-rider problems. We expect that such associations facilitate the coordination of earnings
management activities and/or help ensure commitment to those activities among petitioning firms. Our third
hypothesis is:
16 Interestingly, the international law firm of Holman, Fenwick, Willan, advertises a service that would assist clients in determining these two margins. As their webpage notes, “We regularly advise clients on the preparation of… antidumping questionnaire replies and perform dumping and injury margin simulations”, quoted from: http://www.hfw.com/Anti-dumping.

14
H3: The earnings management by firms petitioning for trade relief in the EU is concentrated in firms
initiating investigations with fewer petitioning firms, with geographically closer petitioning firms, or
with representation by an industry association more so than firms initiating investigations with more
petitioning firms, with geographically more distant petitioning firms, or without representation by an
industry association.
The trade literature recognizes that potential retaliation can affect how countries impose tariffs in
antidumping investigations. Blonigen and Bown (2003) find that U.S. decisions are more likely to be in favor of
trade relief when the threat of retaliation (or more directly, the capacity to retaliate) of the foreign country is
lower. Prusa and Skeath (2002) examine antidumping cases filed around the world in the 1980s and 1990s and
find that a large number of cases are filed against countries that had previously initiated antidumping cases
against the filing country. This effect was particularly pronounced for cases initiated against the jurisdictions
with long-established use of antidumping tariffs such as the EU, Australia, Canada and the United States. Nearly
90% of cases launched against those jurisdictions were initiated by countries with a retaliation motive. This
suggests that petitioning firms located in countries that have high levels of exports to the countries accused of
dumping products in their investigation will face a higher hurdle in order for their case to receive affirmative
decisions that lead to trade remedies. This is true because the EU regulator will be more hesitant to impose trade
sanctions against countries that import a significant amount of goods from the petitioning firms’ host
country(ies), and the petitioning firms’ host country(ies) is less likely to lobby the European Commission to
impose tariffs when the threat of retaliation is high.17 Therefore petitioning firms located in countries that have a
high level of exports to the countries accused of dumping goods in their petitions for trade relief may have
heightened incentives to engage in income decreasing earnings management so that their injury appears more
severe. Since there will be a bias against imposing tariffs in their investigation, a more severe level of injury will
be necessary in order for the petitioner to justify trade relief. Our fourth hypothesis is:
H4: The earnings management by firms petitioning for trade relief in the EU is concentrated in firms
initiating investigations against countries that receive high levels of imports from the petitioning firms’
17 We thank Donal Byard for bringing this possibility to our attention.

15
home countries more so than firms initiating investigations against countries that receive low levels of
imports from the petitioning firms’ home countries.
Next we discuss cross-sectional predictions arising from factors associated with earnings management
that are suggested by the prior literature. Our setting provides firms with predictable incentives to engage in
income decreasing earnings management around the trade investigation initiation. For firms with a need for
external financing, the capital market consequences of managing earnings downward could moderate the
benefits the firm receives in the form of trade remedies. Accordingly, we predict that firms that raise either debt
or equity capital during the Current time period face weaker incentives to engage in income decreasing earnings
management. There is tension around this hypothesis, however, because it is possible that external capital
providers could be aware of the incentives for earnings management in our setting and adjust financing terms
accordingly, effectively eliminating any penalties for firms engaging in earnings management and seeking
external financing.18 Our fifth hypothesis is:
H5: The earnings management by firms petitioning for trade relief in the EU is concentrated in firms that
do not raise debt or equity capital around the trade investigation more so than firms that do raise debt or
equity capital around the trade investigation.
The past literature also provides mixed results about how country level regulatory institutions such as the
rule of law, regulatory efficiency, and legal enforcement affect earnings management incentives. Leuz et al.
(2003) document that legal enforcement is associated with reduced earnings management in broad samples of
firms around the world. Burgstahler, Hail and Leuz (2006) find that better legal enforcement is associated with
reduced earnings management in both public and private firms in the EU. In contrast, Ahmed, Neel and Wang
(2013) also utilize very broad samples and find that IFRS adoption is associated with increased earnings
management in countries with stronger country level institutions. Hence, the relation between country level
institutions and earnings management incentives remains an open empirical issue based on the past literature. In
addition, we examine income decreasing earnings management that is beneficial to stakeholders other than
18 Godsell (2016) provides evidence related to this point. For a sample of U.S. firms initiating antidumping investigations, he finds that the market does adjust the valuation of managed (and therefore less persistent) earnings, but only when firms file their second or subsequent petition. The market does not adjust the valuation of earnings for first-time petitioners, which dominate our sample.

16
consumers, so it is not clear that results from the past literature will generalize to our setting. Accordingly, our
sixth hypothesis is not directional:
H6: The earnings management by firms petitioning for trade relief in the EU differs between firms
domiciled in countries with better regulatory institutions and legal enforcement and firms domiciled in
countries with worse regulatory institutions and legal enforcement.
Section 3 – Sample Selection and Descriptive Data
The European Commission is active in pursuing antidumping investigations on behalf of firms located
within the EU. We obtain data from the World Bank on 743 unique product-country investigations undertaken
in the EU between 1980 and early 2012.19 There are around 1,000 domestic EU producers that are named as the
potentially injured parties in these investigations, and the investigations examine whether dumping has been
undertaken by nearly 2,000 foreign producers who export their goods to the EU. We begin our sample
construction by matching the firms identified as petitioners in the World Bank database with the ORBIS
database by Bureau van Dijk. The online version of ORBIS provides historical data for 10 years, and Bureau
van Dijk provided us with a “snapshot” of the database as of 2002 to provide additional historical data from
1992-2002. All told, we have access to up to 21 years of historical data for public and private firms domiciled in
the EU.20 We use matching software provided by Bureau van Dijk to provide initial matches based on company
names and then manually inspect the matching candidates to ensure that we are appropriately matching
petitioning firms with ORBIS firms. We are able to identify 240 petitioning firms in the ORBIS database. Since
some petitioning firms are involved as petitioners in more than one trade investigation, these 240 firms give rise
to 285 firm-case events that are used in our subsequent empirical analysis.21
19 For the underlying data about antidumping investigations, and a description of the data, see Bown, Chad P. (2012) "Global Antidumping Database,” available at http://econ.worldbank.org/ttbd/gad/ 20 There are up to 21 years of data because the ORBIS database (both online and our “snapshot” of the database as of 2002) contains the most recent ten years of data for each firm. For example, the online version of the database we accessed contains 2003 to 2012 data for firms with 2012 data available and 2002 to 2011 data for firms that did not yet have updated 2012 data in the database. This also applies to the “snapshot” data we received as of 2002. As such, the full database spans up to 21 years from 1992-2012. We initially planned to acquire our data from Amadeus, another Bureau van Dijk database covering the EU in particular. ORBIS is a broader database with international coverage. We did not use Amadeus to acquire financial statement data for our sample firms because we discovered that Amadeus does not contain data for dead firms. Because Amadeus only contains data for surviving firms, it is subject to potential survivorship bias. 21 A few of these firm-case events that fall very early or very late in our sample period do not have data available for all the event years we examine. Nevertheless, we utilize the available data for these firm-case events. We also hoped to use the EU setting to examine the earnings management activities of private versus public firms (Ball and Shivakumar (2005) and Burgstahler et al. (2006)) and to examine the effects of IFRS adoption on the earnings management activities of public firms. Unfortunately the small number of public sample firm observations (40) precluded an examination of either of these issues.

17
Panel A of Table 1 shows the countries where we are able to identify petitioning firms. The sample
covers 17 different jurisdictions in the EU with 22% of our sample in Italy, the home to the most petitioning
firms in our sample. We find only two sample firms, or 1% of our total, in each of Lithuania, Slovenia and
Slovakia. There are 20 or more firms identified in six countries, namely Belgium, Germany, Spain, France, the
United Kingdom and Italy. Panel B of Table 1 shows the industry composition of our sample. Given that our
sample is constructed from firms seeking trade remedies, it is not surprising that our sample is concentrated in
industries that produce tradable goods. The sample is dominated by manufacturing, durable and non-durable
goods companies. Finally, Panel C shows the time periods when trade investigations are initiated by sample
firms. There is no evidence of strong clustering in time or obvious time trends in the sample observations,
though there is some indication of reduced trade investigation initiations during the post-crisis years of 2008,
2010 and 2011. The number of observations in 2011 also reflects the fact that some of the 2011 investigations
were not completed at the time of our data collection.
We supplement our sample of trade petitioning firms with a matched sample of similar firms to provide
more non-event observations to estimate model parameters. While many studies of discretionary accruals form
estimation samples based on similar industry composition, this approach is not appropriate in our setting. While
petitioning firms in the industry may have the strongest incentives to engage in earnings management because
they know the petition will be filed, it is conceivable that non-petitioning members of the industry could also be
engaging in earnings management around the initiation of the petition. This is a reasonable expectation because
the European Commission also considers industry data to assess injury, not just the data of the petitioning firms.
Indeed, in Jones (1991) investigation of earnings management during trade investigations in the United States,
she examines 23 firms, only 14 of which are named as petitioners. While she does find that earnings
management appears more pronounced in petitioning firms, there is also some evidence of earnings
management by non-petitioning firms in the affected industry. We follow the advice of Ecker, Francis, Olsson
and Schipper (2013) and create a matched sample based on firm size rather than industry.22 In addition to
matching on firm size, we also include a performance-based match in which we select firms that are close to our
22 They report that estimation samples based on similarity in size “perform at least as well as estimation samples based on industry membership in detecting discretionary accruals”, while permitting less sample attrition than industry-based matches (Ecker et al., 2013, p. 190).

18
sample firms in Return on Assets (ROA) in the event year. We further follow Gonzalez, Schmid and Yermack
(2013) and identify five matching firms for each sample firm to form our estimation sample. These matching
firms are drawn from the population of firms in the same country as the petitioning firm, and we also restrict this
matching algorithm to match only public firms to public petitioning firms and only private firms to private
petitioning firms. Specifically, we identify potential matching firms that meet the above two restrictions that
have an ROA within 0.1 of the sample firm during the event year.23 From that subset of firms, we select the five
firms that are closest to the sample firm in lagged total assets. This provides a substantial increase in the
estimation sample while imposing a restriction that should ensure that petitioning firms and matched firms are
relatively similar in size, performance, country and legal form.24
Panel A of Table 2 provides descriptive data on the sample of petitioning firms, the matched firms, and
the combined sample. Consistent with the prior literature, total accruals are on average negative with a central
tendency around -3.5 to -4.0 percent of lagged total assets. As Panel A reveals, our matching algorithm is
successful in identifying a set of matching firms very similar in total assets, cash flows and accruals to the
sample of petitioning firms. Panel B of Table 2 shows the time-series pattern of total accruals, working capital
accruals and operating cash flow around the trade investigation initiation date. The time-series of both total and
working capital accruals reveal lower total and working capital accruals in year t+1, and operating cash flows
appear lower than normal in years t-1 and t. Panel C of Table 2 shows the sample composition across the
primary sample-wide cross-sectional partitioning variables that we utilize in the study. These data indicate that
our sample partitions provide relatively independent sorts of sample firms.
Section 4 – Research Design
Accounting earnings consists of two components, actual cash flows during the period and a variety of
accounting accruals that are intended to account for events that affect economic performance in the current
period but do not result in cash flows in the current period. Examples of these accruals are treating the costs of
producing inventory as an asset until the goods are sold, even though the cash is spent when the goods are 23 Results are qualitatively similar if we match on size but do not match on ROA. 24 We perform this matching with replacement, so that one matched firm can be assigned to more than one sample firm. We do this so that when we later partition our sample each sample firm has the best set of five matching firms. In the full sample, this means that there are fewer matched firms than would be implied by taking the number of sample firms and multiplying by five. Consequently, most of our samples that are partitioned in subsequent analysis have a total number of observations that exceed the total number of observations in the full sample as the data for a single matched firm may be used in both subsamples generated by any given sample partition.

19
manufactured, and recording both receivables and payables that result from selling or purchasing goods on trade
credit. We focus on the accrual component of earnings as this component involves estimates and is therefore
subject to manipulation.25 Our setting allows for identification of the period(s) when firms have incentive to
manage their accounting earnings. We first perform a systematic review of the preliminary investigation
decision documents and find that the injury determination decision in the EU generally involves a comparison of
accounting and other data over a four year period, though in a few cases a somewhat longer or shorter total
investigation period for injury determination is employed. In the vast majority of cases, this period ends within
the two year period centered on the date the investigation is initiated. In other words, the four year injury
investigation period typically ends sometime between one year before and one year after the investigation is
initiated. Further, injury is quite consistently determined based on whether there is a decline in the petitioning
industry’s financial performance between the beginning of the four year period and the end of the four year
period. In the typical case there is an affirmative decision about injury because of a decline in financial
performance between the first two years of the injury investigation period and the final two years of the injury
investigation period. The upshot of this discussion is that the injury investigation process provides clear
incentives for firms to engage in income decreasing earnings management in the year that the trade investigation
is initiated and the following year. If the petitioning firms have sufficient foresight to know that they will launch
a trade investigation in the future, the process also provides incentives to engage in income increasing earnings
management in the two or three years preceding the launch of the investigation. Our empirical specification
allows for this possibility, though we do not predict this latter form of earnings management because it is not
clear that firms would have this much foresight about future investigation initiations.
Our model is an expanded version of the Jones (1991) model. Following McNichols (2002), we
incorporate the lead, lag and contemporaneous cash flow terms suggested by Dechow and Dichev (2002). We
also incorporate other time varying firm characteristics suggested by the past literature. Our design also captures
25 The incentives in this setting do not clearly translate into real earnings management predictions. Consider real earnings management through over or under production, for example. If petitioning firms under produce, for example, this would increase cash flows, decrease earnings, and decrease inventories. The increase in cash flows and decrease in inventory would be damaging to their injury case, while the decrease in earnings would be beneficial. Hence while we think the setting provides clear and compelling accrual management incentives, the incentives for real earnings management are less clear. Nevertheless, we conducted two additional tests to examine this possibility that we describe in footnote 27.

20
additional modifications suggested by Dechow et al. (2012) as we incorporate indicator variables for time
periods that correspond to periods that could contain both initial earnings management and the reversal of
earnings management. Our expanded modification is slightly more complex than theirs in that they incorporate
only two time periods, the period of the earnings management and the reversal period, while we include separate
yearly indicator variables for a seven year period around the investigation.26 This base model has a long history
of use to detect accrual manipulation in the accounting literature, and Dechow et al. (2012) provide extensive
evidence related to the performance of the model. Our setting provides us with reasonable priors about the
timing and direction of the earnings management, which should improve the power of our tests to detect
earnings management. To control for firm characteristics that may also affect firms’ accruals choices, we
include proxies for firm size, leverage, growth, operating volatility and net operating assets (Burgstahler et al.
2006; Barton and Simko, 2002). Finally, to further mitigate the concern that the decline in accruals simply
reflects poor performance rather than earnings management, we include the median contemporaneous stock
return for all public firms in the corresponding Fama-French 30 industry from the country that is home to the
petitioning firm. Specifically, we initially estimate the following equation:
WC_ACCi,t or TOT_ACCi,t = α0 + β0 1/TotAssetsi,t-1 + β1 PPEi,t + β2 (ΔREVi,t – ΔARi,t) + β3 CFOi,t + β4 CFOi,t-1
+ β5 CFOi,t+1 + β6 Event Year t-3i,t + β7 Event Year t-2i,t + β8 Event Year t-1i,t + β9 Event Yeari,t + β10 Event Year
t+1i,t + β11 Event Year t+2i,t + β12 Event Year t+3i,t + β13 Event Firm Indicatori + β14 Sizei,t + β15 Leveragei,t + β16
Growthi,t + β17 Std(Sales)i,t + β18 NOAi,t-1 + β19Returni,t + Country Fixed Effects + Industry Fixed Effects + Year
Fixed Effects + εi,t (1)
All continuous variables are scaled by TotAssetsi,t-1, which is lagged total assets. WC_ACC is working
capital accruals, defined as the change in current assets minus the change in current liabilities minus the change
in cash plus the change in short-term debt. TOT_ACC is total accruals, defined as WC_ACC minus depreciation.
26 Occasionally, there are two petitions involving the same firm that are close enough in time that a single fiscal year for that firm could fall somewhere in the expanded event period for more than one case. When that occurs we let the earlier event determine the event period coding for all fiscal years up to the fiscal year in which the subsequent petition is filed, at which time the event coding is determined by the subsequent event. For example, consider a firm with petitions filed in early 2005 and early 2008 with a December 31 fiscal year end. The December 31, 2004 fiscal year is coded as the event year (zero) for the 2005 case, and the 2005 and 2006 fiscal years are coded as event years + 1 and +2, respectively. The 2007 fiscal year is coded as an event year (zero) due to the subsequent case filed in 2008, and this year is not coded as an event year +3 based on the 2005 case. In this way each fiscal year is identified with only one event period indicator variable, and the coding presumes that the incentives related to the subsequent case dominate beginning with the year when that case is filed. We use an analogous procedure to code the condensed event indicators in equation (2). If we change this procedure and allow a single fiscal year to be coded as one for more than one event period indicator there is no change in our inferences.

21
Event Year is the fiscal year that ends closest to the date on which the petitioning firms file for an antidumping
investigation. ΔREV is the change in sales revenue and ΔAR is the change in accounts receivable. PPE is net
property, plant and equipment. CFO is cash flow from operations. Size is the natural logarithm of total sales
revenue. Leverage is book leverage, defined as long-term debt + current portion of long-term debt, scaled by
total assets. Growth is sales growth, defined as sales growth from t-1 to t. Std(sales) is operating volatility,
defined as the standard deviation of sales over the past three years, i.e., t, t-1, t-2. NOA is net operating assets,
calculated as the sum of shareholders equity and interest-bearing debt, minus cash assets, scaled by sales.
Return is the median contemporaneous annual excess stock return (annual raw return minus the market index
return) for all public firms that are from the same Fama-French 30 industry from the country that is home to the
petitioning firm. We extract return data from Worldscope.
As mentioned earlier, we also estimate a collapsed version of this model in which we replace the
individual year indicator variables with variables that capture average earnings management during a pre-injury
period consisting of event years t-3, t-2 and t-1 (Pre), a current injury period indicator variable measuring
average earnings management during the injury determination years t and t+1 (Current), and a post injury
determination indicator variable measuring average earnings management during periods t+2 and t+3 (Post):
WC_ACCi,t or TOT_ACCi,t = α0 + β0 1/TotAssetsi,t-1 + β1 PPEi,t + β2 (ΔREVi,t – ΔARi,t) + β3 CFOi,t + β4 CFOi,t-1
+ β5 CFOi,t+1 + β6 Prei,t + β7 Currenti,t + β8 Posti,t + β9 Event Firm Indicatori + β10 Sizei,t +
β11 Leveragei,t + β12 Growthi,t + β13 Std(Sales)i,t + β14 NOAi,t-1 + β15Returni,t + Country Fixed Effects + Industry
Fixed Effects + Year Fixed Effects + εi,t (2)
Pre, Current and Post are based on the fiscal year that ends closest to the date on which the petitioning firms
file for an antidumping investigation which is designated year t. All other variables are defined as in equation
(1).
Based on the past literature, we expect accruals to be positively related to cash sales growth, lead and
lagged cash flow, and negatively related to current period cash flows. Since fixed assets generate depreciation
charges, PPE is expected to be negatively related to TOT_ACC. We include an event firm indicator variable to
capture any systematic differences in accruals between petitioning firms and matching firms outside the event
window. We include country and industry fixed effects to capture any systematic differences in accruals across

22
EU countries or industries represented in our sample. We include year fixed effects to capture any sample-wide
shifts in accruals through the changing economic conditions that characterize our sample period. Our primary
empirical predictions are that discretionary accruals will be significantly negative during the Current time period
in the collapsed specification, or the individual year indicator variables for the years that fall in the Current
period in the expanded specification, and that these coefficients will vary across firms or over time as discussed
in our hypotheses. Specifically, our primary empirical prediction is that one or both of β9, and/or β10 in equation
(1) will be negative and that β7 will be negative in equation (2). As discussed above, it is also conceivable that
the data may reveal significantly positive abnormal accruals for the Pre and Post indicators in the collapsed
specification, or the individual year indicator variables for the years that fall in the pre or post period in the
expanded specification, consistent with either income increasing earnings management prior to the initiation of
the trade investigation to maximize the apparent injury attributed to dumping or for other reasons, or with the
reversal of the income decreasing accruals occurring after the current period.
Section 5 – Results
Section 5.1 Main Results
Table 3 provides the results of estimating equations (1) and (2) on the full sample of petitioning firms
and the matched firms as described in Section 3. We begin with a discussion of the results from the expanded
specification detailed in equation (1), which are reported in columns (1) and (2). Consistent with H1, both total
accruals and working capital accruals are significantly negative in both the event year and event year +1. The
magnitude of these discretionary accruals is also economically significant, with discretionary accruals lowering
reported return on assets more than 1% in the event year and year +1. There is also some evidence of positive
abnormal accruals in the years preceding the initiation of the investigation as event year -2 exhibits significantly
positive discretionary total accruals. The other coefficients for years -3, -2 and -1 are positive but not significant
at conventional levels. Given the pattern of discretionary accruals that we observe between event years -3 and
+1 (positive but generally insignificant in years -3, -2 and -1, and negative and significant in years 0 and +1), it
is not surprising that we do not observe discretionary accruals reversals during event years +2 and +3. The
control variables in the model have predicted signs and are largely consistent with the prior literature.
Specifically, accruals are positively related to cash sales growth, lead and lag cash flows, and negatively related

23
to current period cash flows. Property, plant and equipment gives rise to depreciation expense and is therefore
negatively related to total accruals. The event firm indicator variable is insignificant in both regressions,
indicating that our event firms’ accruals do not differ from the matched sample outside the event window.
Accruals increase with firm size and growth and decrease with leverage, operating volatility and net operating
assets. Accruals are generally unrelated to industry-wide contemporaneous returns.
Columns (3) and (4) provide the results of the collapsed specification detailed in equation (2). The
results from the collapsed specification are consistent with the results from the expanded specification. Total
accruals and working capital accruals are positive but insignificantly different from zero during the Pre period.
Both total accruals and working capital accruals are significantly negative during the Current time period, and
both types of accruals are not different from zero during the Post period. The coefficients on the other variables
in the model are predictably very similar in the expanded and collapsed specifications. Given the consistency of
the results, we report all subsequent results using the simplified collapsed specification. We have also
reproduced all of our analyses using the expanded specification and the primary inferences from the analysis are
unaffected.27
While our primary specification includes an event firm indicator variable to capture any systematic
differences in accruals between petitioning firms and control firms, this specification does not allow for firm
specific differences in accrual behavior across petitioning firms. To ensure that our results are not affected by
this restriction, columns (5) through (8) show our main results when we replace the industry and country fixed
effects and the event firm indicator variable with firm fixed effects. Columns (5) and (6) show the results of our
expanded specification and columns (7) and (8) show the results of our collapsed specification. The results from
this specification are similar to the main results reported in columns (1)-(4). Not surprisingly model R2s are
somewhat higher with firm fixed effects.28
27 The ORBIS data we use in this investigation in the EU provides too little income statement detail to estimate models of real earnings management except for the abnormal cash flow model from Roychowdhury (2006). That test shows no evidence of real earnings management. We also ran an expanded specification in which we interacted our event dummy variables (either just Current or all of Pre, Current and Post) with each of the three cash flow terms in the model. This allows for the possibility that cash flows are unusual during these periods, and that this creates an unusual relationship between cash flow and accruals during our event period. A couple of the event period indicators interacted with lagged cash flows have positive coefficients but our inferences are not affected by this expansion of the model. 28 This specification is arguably closer to the specification utilized by Jones (1991) who estimates regressions on firm by firm basis. Jones (1991) has a median of 28 (minimum of 14) years prior to her event years to estimate model parameters for each firm. We have a

24
Section 5.2 Cross-sectional tests based on setting specific economic factors
After establishing sample-wide evidence consistent with earnings management, we next examine a
number of case specific factors that we predict will create cross-sectional variation in the incentives for earnings
management in our setting. Our first sample partition is based on case-level variation in how the duties (if any)
applied in the case are determined. As we discussed earlier, a higher percentage of injury elimination margins
used in the case increases earnings management incentives because injury elimination margins are a function of
injury and are determined by petitioning firms’ accounting data. Since the assignment of injury elimination
margins versus dumping margins as the final duty amount varies by exporting firm and is not uniformly applied
at the case level, we initially partition our sample using the median percentage of exporters assessed injury
elimination margins versus dumping margins. In particular, cases in which more than 33% (the median) of the
duties assigned are based on injury elimination margins are considered high use of injury elimination margin
cases, and cases in which 33% or less of the duties are based on injury elimination margin are considered low
use of injury elimination margin cases. 29 Our prediction is that earnings management around the trade
investigation will be concentrated in the high use of injury elimination margin sample. As discussed earlier, this
test helps provide confidence that our tests are capturing earnings management in response to the incentives
present in our setting because this test directly varies the strength of those incentives.
Our results of estimating equation (2) for this partition are presented in Table 4. Columns (1) and (2)
report the results for the low use of injury elimination margin sample and columns (3) and (4) report the results
for the high use of injury elimination margin sample. The coefficients on the Current period indicator are
insignificantly different from zero in the low use of injury elimination duty sample in columns (1) and (2) but
these coefficients are negative and economically and statistically significant in the high use of injury elimination
margin sample in columns (3) and (4). Tests of differences in coefficients reveal that the coefficients on the
Current time period are significantly more negative in the sample with high use of injury elimination margins.
This is consistent with the prediction in H2 that higher use of injury elimination margins provides enhanced
maximum of 20 and an average of about 9 years of data per firm, including event periods and periods after the event year. This precludes firm level estimation for our sample. 29 Ideally, we would base this partition based on the proportion of the volume of exports into the EU that are assigned injury elimination margins, not the proportion of exporting firms. Unfortunately this information is not available to us. We explore the sensitivity of our results to this 33% threshold later.

25
incentives for earnings management. Given the cost-benefit tradeoff that would have to accompany any decision
to engage in earnings management, it appears that sample firms are rationally anticipating when the benefits of
earnings management will be greater and responding accordingly. 30
To examine the sensitivity of our choice of the median percentage of exporters assessed the injury-based
duty as the point distinguishing high and low use of injury elimination margins, we experiment with other
choices of benchmarks and report results in Table 5. Specifically, we examine two alternative definitions of high
use of injury elimination margins. First we classify as high use any investigation in which there is at least one
injury elimination margin assigned. Second, we classify as high use any investigation in which half or more of
the margins are based on injury. If our conjecture that greater use of injury elimination margins enhances the
incentives to engage in earnings management, then earnings management should increase as we move from at
least one, to the median (1/3), to 1/2 injury elimination margins. Table 5 displays the results for the high use of
injury elimination margins sample for each of the three alternative definitions. This table reveals that each of
these partitions is associated with statistically and economically significant earnings management evidenced by
the coefficients on the Current period indicator, and importantly, the evidence of earnings management
increases along with the threshold for assigning firms to the high use of injury elimination margins sample. This
is the pattern we would expect to observe if firms had accurate ex ante assessments of the ex post observed use
of injury elimination margins and the use of those margins created greater incentives for earnings management.
Next we examine the effect of the number of sample firms named in the petition for import relief on
earnings management.31 Since antidumping investigations are initiated on behalf of an entire EU industry, there
30 In the high use of injury elimination sample in which we document significant income decreasing accruals, the coefficient on the Event Firm Indicator in column (4) is significantly positive. This same result is also observed in some other partitions in which we observe large negative earnings management in our event window. The positive coefficient on the Event Firm Indicator variable is not surprising as the large negative accruals observed in the event window must be offset by positive accruals at some point during our sample period, and the Event Firm Indicator variable picks up these positive accruals if they do not occur during the Pre or Post periods. To ensure that our sample firms respond similarly to our control firms to economic shocks, we create pseudo-events based on the years with the largest positive and largest negative GDP change, or based just on the years with the largest negative GDP change to capture negative events. We repeated our tests using these pseudo-events and found that all event indicator variables were insignificant, suggesting that the accruals of our treatment firms and control firms respond similarly to economic shocks. As discussed in more detail in footnote number 24, the total observations reported across the two subsamples in Table 4 exceeds the total observations reported in the full sample in Table 3 because of how we implement the matching algorithm to produce the matched sample. 31 We base this analysis on the number of sample firms initiating the petition rather than on the number of firms named in the original petition because in some cases industry associations rather than individual firms initiate petitions. Note that this is distinct from the cases we examine later in which firms initiate the petition but are represented by a trade association. It is sometimes, but not always, possible to distinguish trade associations from firms among the entities named as petitioning parties in the petition, so it is not possible to construct an accurate list of the total number of petitioning firms for each petition. When we partition our sample based on the median number of petitioning entities (without distinguishing between trade associations and firms, and including all petitioning entities, not just

26
are free-rider and coordination problems that arise when there are multiple firms in the EU industry. In fact,
Feinberg and Hirsch (1989) find that U.S. industries with more firms are less likely to petition for import relief,
which is consistent with the idea that coordination costs and free-rider problems are more severe in industries
with more firms. When there are more sample firms named on the petition, we expect that it is more difficult to
control free-rider problems and that the costs of attempting to coordinate earnings management activities across
firms increase. As a result, firms involved in these petitions are less likely to engage in earnings management to
increase the apparent injury suffered by the EU industry because each individual firm is less sure that other
firms in the industry will do likewise. Since the median case in our sample has two sample firms named in the
petition, we partition the sample based on cases with one or two sample petitioning firms and cases with more
than two sample petitioning firms.
The results of this analysis are reported in Table 6. Columns (1) and (2) report the results for the sample
cases with more than two petitioning firms and columns (3) and (4) report the results for the sample cases with
one or two petitioning firms. The coefficients on the Current time period are negative and significant when there
are one or two petitioning firms, but are not significantly different from zero when there are more than two
petitioning firms. Tests of differences in coefficients reveal that the coefficients on the Current time period are
significantly more negative in the sample with only one or two petitioners for both total accruals and working
capital accruals. These results are generally consistent with H3.
We also conduct a test that examines geographic distance as another potential factor affecting
coordination costs and free-rider problems. We measure distance as the sum of the distances between all sample
petitioners in the case. Table 7 presents results when we partition the sample of investigations with two or more
petitioners based on the median aggregate distance between all sample petitioners (1,500 kilometers). The above
median distant sample is labeled the “Distant” sample and is reported in columns (1) and (2) of Table 7. The
below median distance sample is labeled the “Proximate” sample and is reported in columns (3) and (4) of Table
7. As the table shows, earnings management is concentrated in those cases in which the petitioners are
geographically proximate, consistent with idea that geographic distance impedes coordination. Tests of
those in our sample), we continue to find that the Current period indicator only has a significantly negative coefficient in the low number of petitioners sample. However, the p-value for the test of differences in the Current period coefficient between the low and high number of petitioners samples is between 0.10 and 0.20 in these tests.

27
differences in coefficients reveal that the coefficients on the Current time period are significantly more negative
in the proximate sample.32
The World Bank database that we use to gather data on trade investigations indicates trade association
involvement with petitions in two forms. First, as discussed in footnote 31, in some cases an industry association
is named as the party initiating the petition for an investigation. These cases do not appear in our sample as the
individual firms supporting or involved with the petition are not identified. In other cases, individual firms are
identified as the parties initiating the petition for an investigation but the database also contains textual material
indicating the involvement of an industry association with the petition. In all cases, this involvement is indicated
with text in a special column in the database that notes that the individual firms named in the petition are
“represented by [name of industry association]”.
We believe that this presents a unique opportunity to examine the influence of coordination and free-
rider problems on earnings management in our setting. The involvement of an industry association provides a
natural mechanism through which coordination of earnings management and disciplining of free-riders could
occur. To test this conjecture, we perform another partition of the cases involving two or more sample firms into
those firms represented by an industry association and those firms not represented by an industry association.
The results are presented in Table 8 and columns (1) and (2) present the results for the cases not represented by
an industry association and columns (3) and (4) present the results for the cases represented by an industry
association. The Current period coefficients are significantly negative only in the cases represented by an
industry association, and test of differences in coefficients reveal that the Current period coefficients are
significantly more negative in the sample represented by an industry association than in the sample not
represented by an industry association.
Our next sample partition examines the effect of trade retaliation on earnings management incentives in
our setting. To do this we investigate petitioner country exports to the foreign country allegedly dumping goods
into the EU. As discussed earlier, the trade literature identifies the capability to retaliate as a factor that 32 We thank an anonymous reviewer for this suggestion. We also repeated this test using the average distance between petitioners and find similar results. That specification helps to ensure that our aggregate distance measure is not just mechanically increasing in the number of petitioners and essentially replicating our earlier results based on number of petitioners. We also considered examining separately cases in which there are two or more petitioners from the same country versus those cases in which there are two or more petitioners from different countries. Unfortunately, the sample in which there are two or more petitioners from the same country was too small for analysis (fewer than 20 observations).

28
moderates regulator incentives to assign duties in antidumping investigations. Capacity to retaliate is a direct
function of the extent to which the country(ies) accused of dumping goods into the EU imports goods from the
country alleging dumping. When the country that is home to petitioning firms has a high level of exports to the
country(ies) accused of dumping goods into the EU, regulators in the country that is home to the petitioning
firms may be reluctant to lobby Brussels to award trade relief in the case. Regulator reluctance to assign duties
when the threat of retaliation is high may incent petitioning firms to engage in more earnings management. To
the extent that the petitioning firms think it is necessary to bolster their claim of injury in order to make it more
difficult for the regulator to deny relief in the case, we expect to observe more earnings management in the
sample of firms that are domiciled in countries with high levels of exports to the countries accused of dumping
in the firm’s petition. We first calculate the total exports from the country that is home to each petitioning firm
in our sample during event year 0 for that firm. We then calculate the proportion of these total exports that go to
each country named in the petition as a country allegedly dumping goods in the EU. If there is more than one
country named in the petition as a country allegedly dumping goods in the EU, we sum the proportion of exports
going to all such countries to create a measure of the cumulative retaliation capability of the defendant countries.
Finally, we partition our sample into high and low exports to defendant countries based on the median value of
this sum (which is about 1%). The low exports to defendant countries have low capacity to retaliate and the
results for this sample partition are reported in columns (1) and (2) of Table 9. The high exports to defendant
countries have high capacity to retaliate and the results for this sample partition are reported in columns (3) and
(4) of Table 9.
The Current period coefficients are negative and economically and statistically significant in the high
capacity to retaliate sample but not significantly different from zero in the low capacity to retaliate sample. Tests
of differences in coefficients reveal that the coefficients on the Current time period indicator are significantly
more negative in the sample with high capacity to retaliate for both total accruals and working capital accruals.
These results are consistent with H4 that retaliation threats affect earnings management incentives.
Section 5.3 Cross-sectional tests based on factors affecting earnings management identified in prior literature
We next estimate equation (2) when the sample is partitioned into firms that raise new financing versus
firms that do not raise new financing over the two-year period denoted by Current. We calculate the difference
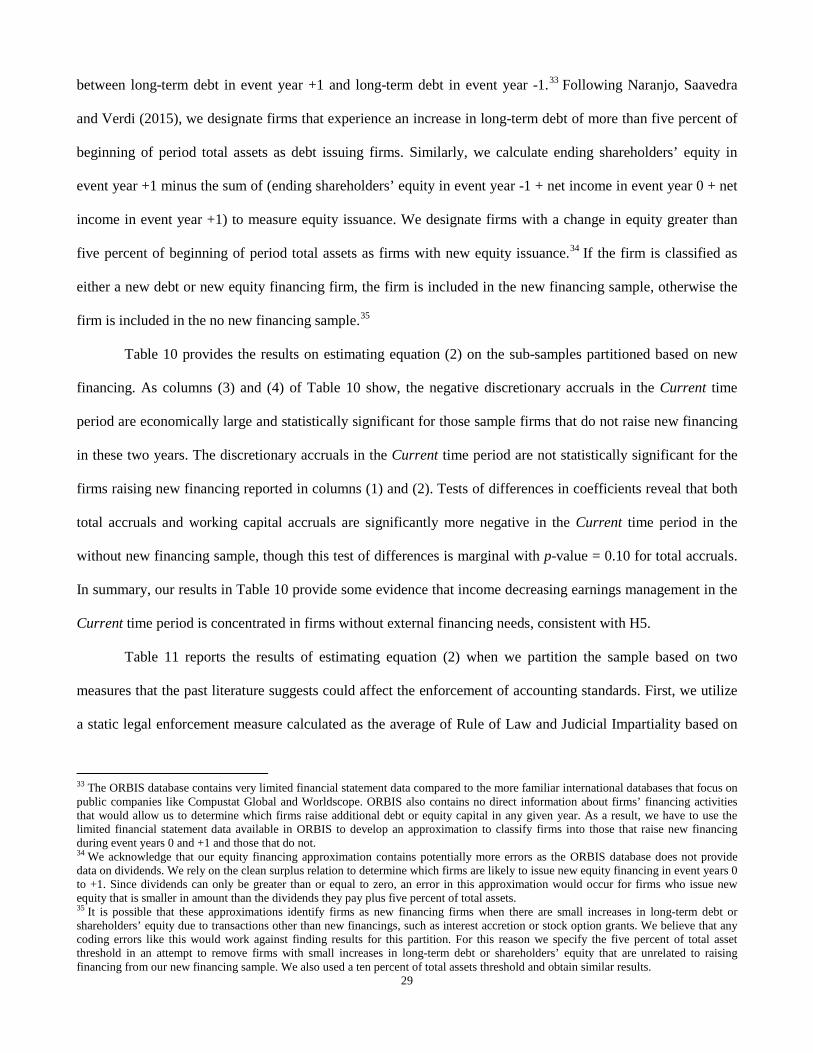
29
between long-term debt in event year +1 and long-term debt in event year -1.33 Following Naranjo, Saavedra
and Verdi (2015), we designate firms that experience an increase in long-term debt of more than five percent of
beginning of period total assets as debt issuing firms. Similarly, we calculate ending shareholders’ equity in
event year +1 minus the sum of (ending shareholders’ equity in event year -1 + net income in event year 0 + net
income in event year +1) to measure equity issuance. We designate firms with a change in equity greater than
five percent of beginning of period total assets as firms with new equity issuance.34 If the firm is classified as
either a new debt or new equity financing firm, the firm is included in the new financing sample, otherwise the
firm is included in the no new financing sample.35
Table 10 provides the results on estimating equation (2) on the sub-samples partitioned based on new
financing. As columns (3) and (4) of Table 10 show, the negative discretionary accruals in the Current time
period are economically large and statistically significant for those sample firms that do not raise new financing
in these two years. The discretionary accruals in the Current time period are not statistically significant for the
firms raising new financing reported in columns (1) and (2). Tests of differences in coefficients reveal that both
total accruals and working capital accruals are significantly more negative in the Current time period in the
without new financing sample, though this test of differences is marginal with p-value = 0.10 for total accruals.
In summary, our results in Table 10 provide some evidence that income decreasing earnings management in the
Current time period is concentrated in firms without external financing needs, consistent with H5.
Table 11 reports the results of estimating equation (2) when we partition the sample based on two
measures that the past literature suggests could affect the enforcement of accounting standards. First, we utilize
a static legal enforcement measure calculated as the average of Rule of Law and Judicial Impartiality based on
33 The ORBIS database contains very limited financial statement data compared to the more familiar international databases that focus on public companies like Compustat Global and Worldscope. ORBIS also contains no direct information about firms’ financing activities that would allow us to determine which firms raise additional debt or equity capital in any given year. As a result, we have to use the limited financial statement data available in ORBIS to develop an approximation to classify firms into those that raise new financing during event years 0 and +1 and those that do not. 34 We acknowledge that our equity financing approximation contains potentially more errors as the ORBIS database does not provide data on dividends. We rely on the clean surplus relation to determine which firms are likely to issue new equity financing in event years 0 to +1. Since dividends can only be greater than or equal to zero, an error in this approximation would occur for firms who issue new equity that is smaller in amount than the dividends they pay plus five percent of total assets. 35 It is possible that these approximations identify firms as new financing firms when there are small increases in long-term debt or shareholders’ equity due to transactions other than new financings, such as interest accretion or stock option grants. We believe that any coding errors like this would work against finding results for this partition. For this reason we specify the five percent of total asset threshold in an attempt to remove firms with small increases in long-term debt or shareholders’ equity that are unrelated to raising financing from our new financing sample. We also used a ten percent of total assets threshold and obtain similar results.

30
La Porta, Lopez-de-Silanes, Shleifer and Vishny (2002). Burgstahler et al. (2006) predict and find that similar
measures of legal enforcement are associated with earnings management in both public and private firms in the
EU, so these measures are appropriate for our sample that contains a mixture of public and private firms. We
split our sample into weak and strong legal enforcement based on the median value of this measure. These
results are reported in columns (1)-(4) of Table 11. The Current period coefficients are negative and statistically
and economically significant for firms domiciled in countries with both low and high levels of legal
enforcement. The test for equality of the Current period coefficients across these two subsamples fails to reject
the null of equality for both total accruals and working capital accruals.
Our second institutional quality measure is a time-varying measure of regulatory quality compiled and
discussed in Kaufmann, Kraay and Mastruzzi (2009) and applied in Christensen, Hail and Leuz (2013). This
measure “reflects perceptions of the ability of the government to formulate and implement sound policies and
regulations that permit and promote private sector development” (Kaufmann et al., 2009, p. 6). This variable is
measured every other year beginning in 1996 until 2002, and then is measured annually after 2002. When the
variable is measured every other year, we construct a measure for the missing years by averaging the measure in
the two years that are adjacent to the missing year. We partition the sample into a low regulatory quality
subsample and high regulatory quality subsample based on the median country-year measure of regulatory
quality. The results for this partition are reported in columns (5)–(8) of Table 11. These results are very similar
to the results based on the legal enforcement partition, and again suggest that earnings management in our
sample firms does not differ across countries with differing institutional quality.
Because this null result conflicts with some prior literature, we conducted an additional test using
another set of time-varying measures of regulation and enforcement affecting financial reporting. Specifically,
we collected the AUDIT, ENFORCE, and TOTAL scores from Brown, Preiato and Tarca (2014). These
measures are available for 2002, 2005 and 2008. We apply the 2002 data to all of our sample years before 2002
and up to and including 2002, use the 2005 score and then interpolate to fill in scores for each year between
2003 and 2007, and apply the 2008 scores to 2008 and all years after 2008. We believe these scores are a good
fit for our setting because they measure a number of features of the audit environment across countries (AUDIT)
and also focus on regulatory enforcement directly related to financial statements (ENFORCE). In addition, there

31
is at least some time series variation in these measures, and the measurement dates were chosen to capture a
period when enforcement was changing in many countries, particularly in the EU. We create sample partitions
based on the median score for AUDIT, ENFORCE, and TOTAL (which combines AUDIT and ENFORCE).
These results are presented in Table 12. As that table clearly shows, we continue to find no significant
differences between high and low score countries for any of these measures.36
On the surface, these results are inconsistent with some past literature utilizing broad samples of public
firms (e.g., Leuz et al., 2003) or samples of public and private firms in the EU (Burgstahler et al., 2006) that
suggest that better legal and regulatory institutions help curb earnings management. That inconsistency may be
related to the type of earnings management we document during trade investigations. There are at least two
possible reasons why we may be finding that regulatory institutions do not appear to affect earnings
management in our setting while the past literature finds that these institutions do matter. The past literature
generally examines broad samples of firms in which the earnings management incentives are not specified or
clear. We suspect that in these samples of firms, most earnings management activities involve income increasing
earnings management undertaken due to capital market incentives. This type of earnings management is not in
shareholders’ interests, and we suspect that this is the type of earnings management that both auditors and
regulators charged with overseeing financial reporting are most concerned about. Auditors care more about
income increasing earnings management (Elliott, Nelson and Tarpley, 2002) and are more likely to be sued
when earnings are overstated (St. Pierre and Anderson, 1984). Regulators are more likely to face unpleasant
publicity and scrutiny when earnings are overstated. Indeed, most AAER activity in the United States is focused
on income increasing earnings management that is apparently undertaken for capital market reasons (Dechow,
Ge, Larson and Sloan, 2011). Hence, we conjecture, but cannot test, that the regulatory forbearance we
document is due to one of two reasons, which cannot be disentangled in our setting but could be in future
research. One possibility is that regulators do not constrain the earnings management in our setting even though
36 Note that all three of the regulatory sample partitions are based on either the country (legal enforcement) or the country-year (regulatory quality, AUDIT, ENFORE and TOTAL) median, not the median value for sample firm-years. As a result these partitions are not balanced splits of the data as not all countries contribute equal numbers of sample firm-years. If we partition the sample based on the sample firm-year median, the partitions are more balanced and the results are similar. We also examined the sample of countries that Christensen et al. (2013) identify as countries that changed their enforcement of financial reporting around the time of IFRS adoption. We separately examine the periods before and then after these enforcement changes. Because there are only six countries and limited data for them, these tests produce insignificant earnings management in each sample, and, not surprisingly, show no differences between the pre and post enforcement change periods.

32
they detect it because it is in shareholders’ interests and hence is unlikely to result in any negative outcome for
the regulators or auditors if the earnings management is permitted. Alternatively, it could be that auditors and
regulators are focused on income increasing earnings management and simply fail to detect the income
decreasing earnings management that takes place in our setting. Future research can shed further light on this
issue by identifying settings in which there is 1) income increasing earnings management that is in capital
providers’ interests, and 2) income decreasing earnings management that is not in capital providers’ interests.
While this issue clearly deserves more study, our results suggest that concluding that better legal and regulatory
institutions help curb all types of earnings management based on the prior literature may not be appropriate.37
Section 6 – Conclusions and Suggestions for Future Research
We examine earnings management in European Union (EU) firms that initiate an antidumping trade
investigation against foreign exporters that allegedly dump goods into the EU. We first document sample-wide
income decreasing earnings management around the initiation of an antidumping investigation. We also
examine some novel and unique case based factors that could influence the costs and benefits of earnings
management in our setting. We document that earnings management is more pronounced in those cases in which
the petitioning firms’ accounting data directly affect the magnitude of the tariffs imposed in the trade
investigation. Earnings management by sample firms is more pronounced in antidumping cases with fewer
sample petitioning firms, when sample petitioning firms are more distant, and when the petitioning firms are
represented by an industry association, suggesting that free-rider and coordination issues cause firms to manage
earnings less. Finally, we document that earnings management is more pronounced when the petitioning firm is
located in a country with high levels of exports to the countries accused of dumping goods into the EU in the
petition. This result suggests that concerns over retaliation may dampen regulators’ willingness to assign tariffs,
perhaps because the home country of the petitioning firm is less supportive of the case. This may cause
petitioning firms to turn to earnings management to show greater injury to enhance their likelihood of success.
We also document that raising equity or debt financing during the antidumping investigation moderates
this income decreasing earnings management. We find that earnings management does not differ between firms
37 Of course a null result could also be attributable to low power. We do note however that our other sample partitions suggest that our tests have sufficient power to detect plausible alternative hypotheses.

33
domiciled in countries with better legal enforcement or regulatory quality and firms domiciled in countries with
worse legal enforcement and regulatory quality. This result is inconsistent with some prior research. We
speculate, but cannot test, that this may be due to the fact that we examine a setting that provides incentives for
earnings management that is beneficial to shareholders and virtually all stakeholders other than consumers,
and/or because we examine income decreasing earnings management.
The paper makes a number of contributions to the accounting literature. First, we show that the earnings
management surrounding trade investigations initially documented by Jones (1991) exists outside the United
States and in contemporary time periods. Given the importance of the Jones (1991) paper to the accounting
literature, we believe this update and extension of her analysis is important. Given the importance of trade
regulation to the world economy and the extensive development of trade regulation since the 1980s, including
the introduction of the World Trade Organization, additional evidence on the use of accounting data in trade
regulation, and the incentives this creates, is important. In addition, the models used to detect earnings
management have been modified since Jones (1991) and our tests suggest that current research methods can be
effective in detecting accrual based earnings management. Our cross-sectional tests either confirm that prior
results hold in a new sample (e.g., financing versus regulatory incentives), suggest caution in extrapolating prior
results to different settings (legal enforcement and regulatory quality), or provide new results to the literature
(our case based incentives discussed above). More generally, we believe that our paper broadens the accounting
literature significantly by looking at how accounting data are used in international settings outside of capital
markets. We highlight the importance of understanding how accounting data are used in trade investigations and
understanding how firms respond to those uses, and encourage researchers to consider how accounting data are
used in other international commercial settings beyond capital markets. While we acknowledge that there is a
significant investment required to understand these settings, we believe that the potential contributions to our
understanding of how accounting data affect commercial activity internationally justify incurring the costs to
make those investments.

34
References Ahmed, A., M. Neel and D. Wang. 2013. Does Mandatory Adoption of IFRS Improve Accounting Quality? Contemporary Accounting Research, 30: 1344-1372. Ball, R. 2013. Accounting Informs Investors and Earnings Management is Rife: Two Questionable Beliefs. Accounting Horizons, 27: 847-853 Ball, R., A. Robin and J. S. Wu. 2003. Incentives versus Standards: Properties of Accounting Income in Four East Asian Countries. Journal of Accounting and Economics 36: 235-270 Ball, R. and L. Shivakumar. 2005. Earnings Quality in UK Private Firms: Comparative Loss Recognition Timeliness. Journal of Accounting and Economics, 39: 83-128. Barton, J., J. Goldstein, T. Josling and R. Steinberg. 2006. The Evolution of the Trade Regime: Politics, Law and Economics of the GATT and the WTO. Princeton University Press. Barton, J. and P. J. Simko. 2002. The Balance Sheet as an Earnings Management Constraint. The Accounting Review, 77: 1-27.
Bhagwati, J. 1982. Directly Unproductive, Profit-Seeking (DUP) Activities. Journal of Political Economy, 90: 988-1002. Bhattacharya, U., H. Daouk and M. Welker. 2003. The World Price of Earnings Opacity. The Accounting Review, 78: 641-678. Blonigen, B. 2006. Working the system: Firm Learning and the Antidumping Process. European Journal of Political Economy, 22: 715-731. Blonigen, B. and C. Bown. 2003. Antidumping and Retaliation Threats. Journal of International Economics, 60: 249-273 Blonigen, B. and T. Prusa. 2003. Chapter 9: Antidumping in Handbook of International Trade: Volume 1, edited by Choi, E.K. and J. Harrigan. Blackwell Reference Online. Bown, Chad P. (2012) "Global Antidumping Database,” available at http://econ.worldbank.org/ttbd/gad/. Brown, P., J. Preiato and A. Tarca. 2014. Measuring Country Differences in Enforcement of Accounting Standards: An Audit and Enforcement Proxy. Journal of Business Finance & Accounting, 41: 1-52. Burgstahler, D., L. Hail and C. Leuz. 2006. The Importance of Reporting Incentives: Earnings Management in European Private and Public Firms. The Accounting Review, 81: 983-1016. Byard, D., L. Ying, and Y. Yu. 2011. The Effect of Mandatory IFRS Adoption on Financial Analysts’ Information Environment. Journal of Accounting Research, 49: 69−96. Cahan, S. 1992. The Effect of Antitrust Investigations on Discretionary Accruals: A Refined Test of the Political Cost Hypothesis. The Accounting Review, 67: 77-95. Chen, H., Q. Tang, Y. Jiang, and Z. Lin. 2010. The Role of International Financial Reporting Standards in Accounting Quality: Evidence from the European Union. Journal of International Financial Management & Accounting, 21: 220-278.

35
Christensen, H., L. Hail and C. Leuz. 2013, Mandatory IFRS Reporting and Changes in Enforcement. Journal of Accounting and Economics, 56: 147-177. Daske, H., L. Hail, C. Leuz and R. Verdi. 2008. Mandatory IFRS Reporting around the World: Early Evidence on the Economic Consequences. Journal of Accounting Research, 46: 1085-1142. Dechow, P. and I. Dichev. 2002. The Quality of Accruals and Earnings: The Role of Accrual Estimation Errors. The Accounting Review 77: 35-59 Dechow, P., W. Ge, C. Larson and R. Sloan. 2011. Predicting Material Accounting Misstatements. Contemporary Accounting Research 28 (Spring), pp. 17-82. DeChow, P., W. Ge and C. Schrand. 2010. Understanding Earnings Quality: A Review of the Proxies, Their Determinants and Their Consequences. Journal of Accounting and Economics, 50: 344-401. DeChow, P., A. Hutton, J.H. Kim and R. Sloan. 2012. Detecting Earnings Management: A New Approach. Journal of Accounting Research, 50: 275-334. Ecker, F., J. Francis, P. Olsson and K. Schipper. 2013. Estimation Sample Selection for Discretionary Accruals Models. Journal of Accounting and Economics, 56: 190-211. Elliott, J., M. Nelson and R. Tarpley. 2002. Evidence from Auditors About Managers’ and Auditors’ Earnings-Management Decisions. The Accounting Review, 77 (Supplement): 175-202. Feinberg, R. and B. Hirsch. 1989. Industry Rent Seeking and the Filing of “Unfair Trade” Complaints. International Journal of Industrial Organization, 7: 325-340. Francis, J. and D. Wang. 2008. The Joint Effect of Investor Protection and Big 4 Audits on Earnings Quality around the World. Contemporary Accounting Research, 25: 157-191. González, T., M. Schmid and D. Yermack. 2013. Smokescreen: How Managers Behave When They Have Something To Hide. NBER Working paper, No. 18886. Godsell, D. 2016. The Market Valuation of Managed Earnings in A Regulatory Setting With Learning Opportunities. Working Paper, Virginia Tech. Gopalan, R. and S. Jayaram. 2012. Private Control Benefits and Earnings Management: Evidence from Insider Controlled Firms. Journal of Accounting Research, 50: 117-157 Han, J. and S. Wang. 1998. Political Costs and Earnings Management of Oil Companies during the 1990 Persian Gulf Crisis. The Accounting Review, 73: 103-117. Hansen, W. and T. Prusa, 1997. The Economics and Politics of Trade Policy: An Empirical Analysis of ITC Decision Making. Review of International Economics, 5: 230-245. Hillman, A., E. Katz and J. Rosenberg. 1987. Workers as Insurance: Anticipated Government Assistance and Factor Demand. Oxford Economic Papers, 39: 813-820. Johnston, R. and S. Rock. 2005. Earnings Management to Minimize Superfund Clean-up and Transaction Costs. Contemporary Accounting Research, 22: 617-642. Jones, J. 1991. Earnings Management during Import Relief Investigations. Journal of Accounting Research, 29: 193-228.

36
Kaufmann, D., A. Kraay and M. Mastruzzi. 2009. Governance Matters VIII: Governance Indicators for 1996 – 2008. World Bank Policy Research, Washington, D.C. Key, K. 1997. Political Cost Incentives for Earnings Management in the Cable Televisions Industry. Journal of Accounting and Economics, 23: 309-337. La Porta, R., F. Lopez-De-Silanes, A. Shleifer and R. Vishny. 2002. Investor Protection and Corporate Valuation. Journal of Finance, 57: 1147-1170. Leidy, M., & B. Hoekman. 1991. Spurious Injury as Indirect Rent-Seeking: Free Trade under the Prospect of Protection. Economics and Politics, 3: 111-137. Leuz, C., D. Nanda and P. Wysocki. 2003. Earnings Management and Investor Protection: An International Comparison. Journal of Financial Economics, 69: 505-527. Li, S. 2010. Does Mandatory Adoption of International Financial Reporting Standards in the European Union Reduce the Cost of Equity Capital? The Accounting Review, 85: 607-636. Ludema, R. 2001. Market Collusion and the Politics of Protection. European Journal of Political Economy, 17: 817-833 Magnan, M., C. Nadeau and D. Cormier. 1999. Earnings Management during Antidumping Investigations: Analysis and Implications. Canadian Journal of Administrative Sciences, 16 (2): 149-162. McNichols, M.F. 2002. Discussion of the Quality of Accruals and Earnings: The Role of Accrual Estimation Errors. The Accounting Review, 77: 61-69. Mensah, Y., J. Considine and L. Oakes. 1994. Statutory Insolvency Regulations and Earnings Management in the Prepaid Health-Care Industry. The Accounting Review, 69: 70-95. Monem, R. 2003. Earnings Management in Response to the Introduction of the Australian Gold Tax. Contemporary Accounting Research, 20: 747-774. Naranjo, P., D Saavedra and R. Verdi. 2015. Financial Reporting Regulation and Financing Decisions. Working paper available at http://papers.ssrn.com/sol3/papers.cfm?abstract_id=2147838. Nelson, D. 2006. The Political Economy of Antidumping: a survey. European Journal of Political Economy, 22: 554-590. Prusa, T. 1992. Why are So Many Antidumping Petitions withdrawn? Journal of International Economics, 33: 1–20. Prusa, T. and S. Skeath. 2002. The Economic and Strategic Motives for Antidumping Filings, NBER Working Paper, No. 8424. Rayburn, J. and S. Lenway. 1992. An Investigation of the Behavior of Accruals in the Semiconductor Industry: 1985. Contemporary Accounting Research, 9 (2): 237-251. Reynolds, K. 2006. Subsidizing Rent-seeking: Antidumping Protection and the Byrd Amendment. Journal of International Economics, 70: 490-502

37
Roychowdhury, S. 2006. Earnings Management through Real Activities Manipulation. Journal of Accounting and Economics, 42: 335–370. St. Pierre, K., and J. A. Anderson. 1984. An Analysis of the Factors Associated with Lawsuits against Public Accountants. The Accounting Review 59: 242-263. Schipper, K. 1989. Commentary on Earnings Management. Accounting Horizons, 3: 91-102. Staiger, R. and F. Wolak. 1996. Differences in the Uses and Effects of Antidumping law across Import Sources, in: Krueger, A.O. (Ed.), The Political Economy of American Trade Policy. Chicago: University of Chicago Press.
Tan, H., S. Wang and M. Welker. 2011. Analyst Following and Forecast Accuracy After Mandated IFRS Adoptions. Journal of Accounting Research, 49: 1307-1357.

38
Appendix: An example of an antidumping case
We provide a brief snapshot of the data that are available in the World Bank database to illustrate our
empirical approach and to highlight the important features of our setting. On August 13, 2009, an investigation
was launched into the potential dumping of aluminum wheels into the EU by manufacturers in China. There
were nine domestic producers of these wheels named in the investigation, and these producers were domiciled in
Germany, the Czech Republic, Switzerland, Poland, Italy, Spain and France. Because China is considered a non-
market economy, the normal value of most of the wheels covered in the investigation was determined based on
the prices that domestic producers in Turkey sold their products for in their home market of Turkey. Based on a
comparison of these normal values with the export prices charged by the Chinese exporters, the European
Commission determined that Chinese exporters were in fact dumping aluminum wheels in the EU. The
European Commission also determined that the industry in the EU was injured by the dumping, and a variety of
aggregate industry metrics were cited as evidence of injury. Among these, declining production, capacity
utilization, market share, profitability, return on investment, and cash flows were key indicators that the
dumping was causing economic injury in the EU industry.
The investigation period covered the year from July 1, 2008 to June 30, 2009, so the focus of the injury
determination was on this time period. The EU financial condition during the investigation period was compared
to the preceding two years, 2006 and 2007, to determine if there was injury from the alleged dumping. The
overall industry profitability as a percentage of sales declined from 3.2% to negative 5.4% during the
investigation period, and the return on investment fell from 50.8% in 2006 to negative 40.8% during the
investigation period. These numbers are central to our investigation because we hypothesize that the EU
producers of aluminum wheels had strong incentives to manage their accounting data to demonstrate this
diminished financial performance during the investigation period. Because there was an affirmative
determination of both dumping and injury, antidumping duties were assessed. Importantly, the size of the duty
imposed was determined as the amount of duty necessary to allow the industry to return to its pre-dumping
profitability of 3.2% from the level of profitability observed in the investigation period, negative 5.4%. Hence,
in this particular case, the EU producers accounting data in the investigation period and the period immediately
preceding the investigation period had a direct impact on the determination of whether the industry had been
injured and a direct effect on the magnitude of the duties imposed on the Chinese exporters.

39
Table 1 – Sample Selection This table reports the selection of the trade investigation sample. Panel A lists the home country for our sample firms. Panel B lists the industry composition of our sample, and Panel C shows the distribution of case initiation dates over time.
Panel A: Country breakdown # of cases % as total cases # of firms % as total # of firms # of firm years % as total firm years
Austria 10 4% 7 3% 53 2% Belgium 22 8% 19 8% 190 9% Czech Republic 3 1% 3 1% 29 1% Germany 34 12% 25 10% 154 7% Spain 52 18% 41 17% 447 21% Finland 4 1% 4 2% 39 2% France 36 13% 32 13% 271 13% United Kingdom 26 9% 22 9% 155 7% Greece 3 1% 3 1% 43 2% Italy 62 22% 51 21% 502 24% Lithuania 2 1% 2 1% 9 0% Netherlands 8 3% 8 3% 65 3% Poland 9 3% 9 4% 62 3% Portugal 3 1% 3 1% 28 1% Sweden 7 2% 7 3% 61 3% Slovenia 2 1% 2 1% 6 0% Slovakia 2 1% 2 1% 15 1% Total 285 100% 240 100% 2,129 100%
Panel B: Industry breakdown # of cases % as total cases # of firms % as total # of firms # of firm years % as total firm years
Non-durable 35 12% 31 13% 290 14% Consumer Durable 18 6% 17 7% 160 8% Manufacturing 194 68% 158 66% 1446 68% Energy 5 2% 5 2% 44 2% High Tech 6 2% 6 3% 56 3% Telecommunication 2 1% 2 1% 6 0% Health 2 1% 2 1% 20 1% Other 23 8% 19 8% 107 5% Total 285 100% 240 100% 2,129 100%
Panel C: Year breakdown # of cases % as total cases # of firm years % as total firm years
1996 and before 28 10% 98 5% 1997 19 7% 122 6% 1998 29 10% 131 6% 1999 27 9% 135 6% 2000 15 5% 142 7% 2001 8 3% 145 7% 2002 13 5% 138 6% 2003 19 7% 126 6% 2004 18 6% 126 6% 2005 15 5% 128 6% 2006 13 5% 147 7% 2007 33 12% 148 7% 2008 11 4% 150 7% 2009 24 8% 149 7% 2010 10 4% 141 7% 2011 3 1% 103 5% Total 285 100% 2,129 100%

40
Table 2 – Descriptive Statistics
This table reports the summary statistics for the main variables used in this paper. TOT_ACC is measured as the change in current assets minus the change in current liabilities (adjusted for current liabilities used for financing) minus depreciation expense. WC_ACC is working capital accruals, measured as the change in current assets minus the change in current liabilities (adjusted for current liabilities used for financing). 1/TotAssets is the inverse of lagged total assets. CFOt-1, t, t+1 are cash flows from operations in year t-1, t and t+1 scaled by lagged total assets. PP&E is net property, plant and equipment, scaled by lagged total assets. ΔREV-ΔAR is the change in sales minus the change in accounts receivable, scaled by lagged total assets. Size is the natural logarithm of total sales revenue. Leverage is book leverage, defined as long-term debt + current portion of long-term debt, scaled by total assets. Growth is sales growth, defined as sales growth from t-1 to t. Std(sales) is operating volatility, defined as the standard deviation of sales over the past three years, i.e., t, t-1, t-2. NOA is net operating assets, calculated as the sum of shareholders equity and interest-bearing debt, minus cash assets, scaled by sales. Return is the median contemporaneous annual excess stock return (annual raw return minus the market index return) for all public firms that are from the same Fama-French 30 industry from the country that is home to the petitioning firm. We extract return data from Worldscope. Panel A provides descriptive statistics for the trade investigation sample and the matched sample. Panel B shows how the components of earnings for trade investigation behave around investigation initiation dates. Panel C shows the distribution of event firm-years across our primary sample-wide partitions to assess the independence of our sample partitions.
Panel A: Summary statistics for the baseline sample
Trade investigation sample (n=2,129) Matched sample (n=11,281) Full sample (n=13,410) Variable Mean P25 Median P75 Mean P25 Median P75 Mean P25 Median P75 TOT_ACC -0.038 -0.104 -0.042 0.024
-0.034 -0.095 -0.034 0.023
-0.035 -0.097 -0.035 0.023
WC_ACC 0.014 -0.048 0.007 0.071
0.010 -0.045 0.006 0.062
0.011 -0.046 0.006 0.064 1/TotAssets 0.058 0.002 0.011 0.043
0.055 0.002 0.011 0.042
0.055 0.002 0.011 0.042
PP&E 0.324 0.186 0.313 0.447
0.281 0.083 0.221 0.412
0.288 0.094 0.239 0.421 ΔREV-ΔAR 0.049 -0.092 0.045 0.184
0.052 -0.066 0.025 0.158
0.051 -0.069 0.028 0.163
CFOt-1 0.066 -0.004 0.065 0.139
0.064 -0.008 0.062 0.132
0.065 -0.008 0.063 0.134 CFO 0.066 -0.002 0.067 0.138
0.065 -0.005 0.064 0.134
0.065 -0.004 0.064 0.135
CFOt+1 0.063 -0.005 0.066 0.141
0.066 -0.006 0.062 0.139
0.066 -0.006 0.063 0.140 Size 4.781 3.231 4.670 6.140
4.643 3.145 4.538 6.065
4.664 3.168 4.558 6.076
Leverage 0.202 0.038 0.169 0.324
0.202 0.013 0.135 0.324
0.202 0.015 0.142 0.324 Growth 0.064 -0.096 0.050 0.199
0.062 -0.077 0.041 0.178
0.062 -0.079 0.042 0.181
Std(sales) 0.164 0.061 0.114 0.205
0.157 0.044 0.096 0.193
0.158 0.047 0.099 0.195 NOAt-1 1.075 0.286 0.477 0.702
1.460 0.185 0.397 0.751
1.399 0.201 0.412 0.735
Return -0.030 -0.184 -0.045 0.096 -0.039 -0.176 -0.052 0.073 -0.038 -0.177 -0.052 0.079
Panel B: Summary statistics for the trade investigation sample across years around the investigation period
TOT_ACC WC_ACC CFO Year Mean P25 Median P75 Mean P25 Median P75 Mean P25 Median P75 Non-event years -0.040 -0.104 -0.043 0.023
0.013 -0.051 0.006 0.074
0.073 0.002 0.072 0.149
Event year-3 -0.028 -0.099 -0.032 0.031
0.023 -0.034 0.011 0.085
0.078 -0.012 0.061 0.148 Event year-2 -0.040 -0.122 -0.040 0.019
0.011 -0.054 0.014 0.064
0.086 0.011 0.088 0.148
Event year-1 -0.016 -0.088 -0.022 0.049
0.035 -0.031 0.022 0.093
0.051 -0.029 0.053 0.121 Event year -0.031 -0.095 -0.041 0.024
0.018 -0.041 0.012 0.061
0.048 -0.011 0.047 0.118
Event year+1 -0.061 -0.104 -0.059 -0.011
-0.008 -0.058 -0.003 0.041
0.078 0.010 0.072 0.133 Event year+2 -0.032 -0.115 -0.036 0.032
0.017 -0.045 0.010 0.076
0.054 -0.005 0.065 0.138
Event year+3 -0.045 -0.118 -0.047 0.027 0.004 -0.056 0.003 0.071 0.065 -0.002 0.078 0.146 Panel C: Numbers of event firm-years across primary sample-wide partitions
No new financing
High % of injury-implied duty
# petitioners <=2
Large export to the defendant country
Strong legal enforcement
No new financing 156 79 108 79 60 High % of injury-implied duty 79 147 91 75 60 # petitioners <=2 108 91 189 69 59 Large export to the defendant country 79 75 69 136 48 Strong legal enforcement 60 60 59 48 97

41
Table 3 – Sample-Wide Regression Results
This table reports the baseline test that examines sample-wide earnings management in periods around the initiation of an antidumping trade investigation. Columns (1) and (2) present the results of estimating the expanded specification detailed in equation (1) while columns (3) and (4) show the results of estimating the collapsed specification detailed in equation (2). Columns (5)-(8) repeat the analysis reported in columns (1)-(4) including firm fixed effects. TOT_ACC is measured as the change in current assets minus the change in current liabilities (adjusted for current liabilities used for financing) minus depreciation expense. WC_ACC is working capital accruals, measured as the change in current assets minus the change in current liabilities (adjusted for current liabilities used for financing). 1/TotAssets is the inverse of lagged total assets. CFOt-1, t, t+1 are cash flows from operations in year t-1, t and t+1 scaled by lagged total assets. PP&E is net property, plant and equipment, scaled by lagged total assets. ΔREV-ΔAR is the change in sales minus the change in accounts receivable, scaled by lagged total assets. Other control variables are defined in Table 2. Standard errors are two-way clustered by both firm and year. T-statistics are presented underneath the coefficient estimates. ***, **, and * denote significance levels at 1%, 5%, and 10%, respectively.
(1) (2) (3) (4) (5) (6) (7) (8) TOT_ACC WC_ACC TOT_ACC WC_ACC TOT_ACC WC_ACC TOT_ACC WC_ACC Modified Dechow-Dichev variables
1/TotAssets 0.0271*** 0.0424***
0.0271*** 0.0424***
0.0308* 0.0432**
0.0308* 0.0432**
(3.01) (5.53)
(3.00) (5.53)
(1.68) (2.26)
(1.68) (2.26)
PP&E -0.0376*** 0.00666
-0.0376*** 0.00663
-0.0341*** 0.00307
-0.0342*** 0.00301
(-6.95) (1.31)
(-6.96) (1.31)
(-3.73) (0.35)
(-3.75) (0.34)
ΔREV-ΔAR 0.0269*** 0.0264***
0.0269*** 0.0264***
0.0255*** 0.0266***
0.0255*** 0.0265***
(5.18) (4.88)
(5.19) (4.92)
(4.24) (4.97)
(4.25) (4.98)
CFO t-1 0.0987*** 0.141***
0.0987*** 0.141***
0.0629*** 0.0761***
0.0630*** 0.0761***
(10.29) (10.28)
(10.33) (10.34)
(7.22) (8.69)
(7.20) (8.67)
CFO -0.780*** -0.718***
-0.780*** -0.718***
-0.828*** -0.799***
-0.828*** -0.799***
(-53.26) (-59.22)
(-52.93) (-58.73)
(-55.45) (-55.40)
(-55.19) (-55.11)
CFO t+1 0.102*** 0.134***
0.102*** 0.134***
0.0729*** 0.0787***
0.0729*** 0.0787***
(8.20) (13.44)
(8.23) (13.48)
(7.09) (7.84)
(7.11) (7.84)
Event year-3 0.0114 0.00791
0.0100 0.00861
(1.35) (1.11)
(1.08) (1.06)
Event year-2 0.00914* 0.00658
0.00867 0.00810
(1.91) (1.33)
(1.46) (1.46)
Event year-1 0.00212 0.000855
0.00250 0.00208
(0.33) (0.13)
(0.47) (0.38)
Event year -0.0119** -0.0124**
-0.0126** -0.0137**
(-2.18) (-2.40)
(-2.16) (-2.36)
Event year+1 -0.0152*** -0.0116*
-0.0165*** -0.0128**
(-2.81) (-1.93)
(-2.60) (-2.04)
Event year+2 -0.00290 -0.00451
-0.00236 -0.00312
(-0.32) (-0.51)
(-0.27) (-0.37)
Event year+3 -0.00812 -0.00830
-0.00898 -0.00929
(-1.36) (-1.50)
(-1.60) (-1.58)
Pre
0.00762 0.00509
0.00682 0.00599
(1.63) (1.12)
(1.33) (1.27)
Current
-0.0133*** -0.0119**
-0.0142*** -0.0131***
(-2.64) (-2.45)
(-2.65) (-2.60)
Post
-0.00563 -0.00636
-0.00513 -0.00594
(-1.06) (-1.12)
(-0.95) (-1.09)
Firm characteristics Size 0.00198*** 0.00256***
0.00197*** 0.00255***
0.00634*** 0.00919***
0.00635*** 0.00919***
(2.84) (3.98)
(2.83) (4.01)
(3.22) (4.53)
(3.22) (4.53)
Leverage -0.0431*** -0.0261***
-0.0431*** -0.0262***
-0.0532*** -0.0391***
-0.0534*** -0.0392***
(-6.98) (-3.48)
(-6.96) (-3.47)
(-6.69) (-5.22)
(-6.72) (-5.23)
Growth 0.0246*** 0.0325***
0.0246*** 0.0325***
0.0189*** 0.0246***
0.0190*** 0.0246***
(4.77) (7.33)
(4.81) (7.38)
(4.36) (5.87)
(4.39) (5.91)
Std(sales) -0.0153*** -0.00957**
-0.0153*** -0.00952**
-0.00851 -0.00948
-0.00839 -0.00937
(-3.15) (-2.05)
(-3.11) (-2.04)
(-1.21) (-1.41)
(-1.19) (-1.39)
NOAt-1 0.000245 -0.000569***
0.000246 -0.000568***
-0.0000878 -0.000443*
-0.0000853 -0.000441*
(1.09) (-3.13)
(1.03) (-3.15)
(-0.41) (-1.78)
(-0.39) (-1.77)
Return 0.00263 0.00141
0.00250 0.00134
0.00255 0.00267
0.00241 0.00258
(0.58) (0.41)
(0.56) (0.40)
(0.91) (1.11)
(0.87) (1.08)
Event Firm Indicator 0.00203 0.00528
0.00190 0.00515
(0.49) (1.23)
(0.45) (1.19)
Industry fixed effects Yes Yes
Yes Yes
No No
No No Country fixed effects Yes Yes
Yes Yes
No No
No No
Firm fixed effects No No
No No
Yes Yes
Yes Yes Year fixed effects Yes Yes
Yes Yes
Yes Yes
Yes Yes
N 13410 13410
13410 13410
13410 13410
13410 13410 adj. R-sq 0.755 0.729 0.755 0.729 0.814 0.788 0.814 0.788

42
Table 4 – Injury Elimination Margin Sample Partition
This table reports the results showing earnings management in periods around the initiation of an antidumping trade investigation when the sample is partitioned based on the percentage of exporters assessed injury elimination margins. We designate cases in which less than (more than) the median percentage (33%) of the exporters are assessed the injury elimination margins as low percentage of injury-implied duty cases, respectively. Columns (1) and (2) report the results for the low percentage of injury-implied duty cases and columns (3) and (4) report the results for the high percentage of injury-implied duty cases. TOT_ACC is measured as the change in current assets minus the change in current liabilities (adjusted for current liabilities used for financing) minus depreciation expense. WC_ACC is working capital accruals, measured as the change in current assets minus the change in current liabilities (adjusted for current liabilities used for financing). 1/TotAssets is the inverse of lagged total assets. CFOt-1, t, t+1 are cash flows from operations in year t-1, t and t+1 scaled by lagged total assets. PP&E is net property, plant and equipment, scaled by lagged total assets. ΔREV-ΔAR is the change in sales minus the change in accounts receivable, scaled by lagged total assets. Other control variables are defined in Table 2. Standard errors are two-way clustered by both firm and year. T-statistics are presented underneath the coefficient estimates. ***, **, and * denote significance levels at 1%, 5%, and 10%, respectively.
(1) (2) (3) (4)
Low % of injury-implied duty
High % of injury-implied duty
TOT_ACC WC_ACC TOT_ACC WC_ACC Modified Dechow-Dichev variables
1/TotAssets 0.00773 0.0355***
0.0479*** 0.0451***
(0.70) (3.03)
(2.67) (3.19)
PP&E -0.0404*** 0.00677
-0.0309*** 0.00812
(-6.10) (1.11)
(-3.95) (1.18)
ΔREV-ΔAR 0.0279*** 0.0302***
0.0262*** 0.0262***
(4.12) (4.01)
(4.15) (4.19)
CFO t-1 0.106*** 0.135***
0.0929*** 0.139***
(8.60) (9.52)
(7.28) (9.10)
CFO -0.785*** -0.747***
-0.783*** -0.703***
(-35.87) (-36.55)
(-40.96) (-61.52)
CFO t+1 0.104*** 0.130***
0.101*** 0.139***
(8.06) (10.60)
(7.13) (13.27)
Pre 0.0109 0.0103
0.000733 -0.00193
(1.57) (1.60)
(0.10) (-0.28)
Current -0.00695 -0.00255
-0.0200*** -0.0204***
(-1.01) (-0.38)
(-3.56) (-3.11)
Post -0.00600 -0.00490
-0.00730 -0.00675
(-1.14) (-0.92)
(-0.90) (-0.76)
Firm characteristics Size 0.000138 0.000808
0.00332*** 0.00375***
(0.15) (0.92)
(3.70) (4.56)
Leverage -0.0263*** -0.0224**
-0.0593*** -0.0350***
(-2.99) (-2.31)
(-7.30) (-4.33)
Growth 0.0254*** 0.0326***
0.0235*** 0.0286***
(4.15) (4.22)
(2.96) (4.26)
Std(sales) -0.0105 -0.00530
-0.0195*** -0.0140*
(-1.23) (-0.54)
(-2.89) (-1.88)
NOAt-1 0.0000835 -0.000127
0.000204 -0.000603*
(0.95) (-1.46)
(0.69) (-1.87)
Return 0.00505 0.00447
0.000737 -0.000666
(1.04) (1.00)
(0.19) (-0.19)
Event Firm Indicator -0.00452 -0.000321
0.0109** 0.0110**
(-0.84) (-0.06)
(2.00) (2.08)
Industry fixed effects Yes Yes
Yes Yes Country fixed effects Yes Yes
Yes Yes
Year fixed effects Yes Yes
Yes Yes p-value (βCurrent
TOT_ACC>βCurrentTOT_ACC) 0.04
p-value (βCurrentWC_ACC>βCurrent
WC_ACC) 0.01 N 6501 6501
7379 7379
adj. R-sq 0.760 0.744 0.753 0.722

43
Table 5 – Further Evidence: Injury Elimination Margins
This table reports the results showing earnings management in periods around the initiation of an antidumping trade investigation when the sample is partitioned based on the percentage of exporters assessed the injury elimination margin. We repeat the analysis in Table 7 with cases in which at least one, 33%, and then 50% of the exporters are assessed the injury elimination margin as high use of injury-implied duty cases, respectively. Columns (1) and (2) report the results for cases in which there is at least one injury elimination margin, columns (3) and (4) repeat the results that were provided in Table 7 for the sample with above median (33%) percentage of injury-implied duties for comparative purposes, and columns (5) and (6) report the results for the sample with above 50% of injury-implied duties. TOT_ACC is measured as the change in current assets minus the change in current liabilities (adjusted for current liabilities used for financing) minus depreciation expense. WC_ACC is working capital accruals, measured as the change in current assets minus the change in current liabilities (adjusted for current liabilities used for financing). 1/TotAssets is the inverse of lagged total assets. CFOt-1, t, t+1 are cash flows from operations in year t-1, t and t+1 scaled by lagged total assets. PP&E is net property, plant and equipment, scaled by lagged total assets. ΔREV-ΔAR is the change in sales minus the change in accounts receivable, scaled by lagged total assets. Other control variables are defined in Table 2. Standard errors are two-way clustered by both firm and year. T-statistics are presented underneath the coefficient estimates. ***, **, and * denote significance levels at 1%, 5%, and 10%, respectively.
(1) (2) (3) (4) (5) (6)
At least one injury-implied duty
>=33% of injury-implied duty
>=50% of injury-implied duty
TOT_ACC WC_ACC TOT_ACC WC_ACC TOT_ACC WC_ACC Modified Dechow-Dichev variables
1/TotAssets 0.0394** 0.0447***
0.0479*** 0.0451***
0.0429*** 0.0327**
(2.23) (3.13)
(2.67) (3.19)
(2.75) (2.30)
PP&E -0.0357*** 0.00674
-0.0309*** 0.00812
-0.0286*** 0.00955
(-5.13) (1.07)
(-3.95) (1.18)
(-3.66) (1.24)
ΔREV-ΔAR 0.0265*** 0.0257***
0.0262*** 0.0262***
0.0239*** 0.0218***
(4.05) (3.69)
(4.15) (4.19)
(3.07) (2.66)
CFO t-1 0.0966*** 0.145***
0.0929*** 0.139***
0.0875*** 0.145***
(7.48) (9.23)
(7.28) (9.10)
(7.02) (11.04)
CFO -0.775*** -0.697***
-0.783*** -0.703***
-0.791*** -0.695***
(-40.60) (-45.32)
(-40.96) (-61.52)
(-40.92) (-56.44)
CFO t+1 0.103*** 0.140***
0.101*** 0.139***
0.0937*** 0.139***
(7.35) (13.12)
(7.13) (13.27)
(6.29) (14.46)
Pre 0.00304 0.000571
0.000733 -0.00193
0.00205 -0.000603
(0.41) (0.09)
(0.10) (-0.28)
(0.31) (-0.10)
Current -0.0181*** -0.0174***
-0.0200*** -0.0204***
-0.0241*** -0.0229***
(-3.38) (-2.92)
(-3.56) (-3.11)
(-4.30) (-4.15)
Post -0.00511 -0.00465
-0.00730 -0.00675
-0.0155** -0.0148**
(-0.74) (-0.63)
(-0.90) (-0.76)
(-2.25) (-2.10)
Firm characteristics Size 0.00273*** 0.00328***
0.00332*** 0.00375***
0.00327*** 0.00357***
(3.29) (4.31)
(3.70) (4.56)
(3.27) (3.85)
Leverage -0.0514*** -0.0279***
-0.0593*** -0.0350***
-0.0639*** -0.0360***
(-6.36) (-3.63)
(-7.30) (-4.33)
(-7.49) (-4.31)
Growth 0.0231*** 0.0299***
0.0235*** 0.0286***
0.0280*** 0.0342***
(3.58) (4.92)
(2.96) (4.26)
(3.66) (4.39)
Std(sales) -0.0193*** -0.0141**
-0.0195*** -0.0140*
-0.0210*** -0.0158**
(-3.08) (-2.21)
(-2.89) (-1.88)
(-3.64) (-2.32)
NOAt-1 0.000158 -0.00100***
0.000204 -0.000603*
0.000363 -0.000528*
(0.55) (-2.98)
(0.69) (-1.87)
(0.96) (-1.83)
Return 0.000758 -0.00115
0.000737 -0.000666
0.000526 -0.00212
(0.22) (-0.36)
(0.19) (-0.19)
(0.13) (-0.59)
Event Firm Indicator 0.00598 0.00769*
0.0109** 0.0110**
0.0132** 0.0116**
(1.30) (1.74)
(2.00) (2.08)
(2.31) (2.01)
Industry fixed effects Yes Yes
Yes Yes
Yes Yes Country fixed effects Yes Yes
Yes Yes
Yes Yes
Year fixed effects Yes Yes
Yes Yes
Yes Yes N 8734 8734
7379 7379
5894 5894
adj. R-sq 0.750 0.720 0.753 0.722 0.763 0.723

44
Table 6 – Number Of Petitioning Firms Sample Partition
This table reports the results showing earnings management in periods around the initiation of an antidumping trade investigation when the sample is partitioned based on the number of petitioners in each case. Specifically, we designate cases in which more than two petitioners were involved into the “# petitioners>2” partition and the remaining cases into the “# petitioner <=2” partition. Columns (1) and (2) report the results for “# petitioners>2” partition and columns (3) and (4) report the results for the “# petitioners <=2” partition. TOT_ACC is measured as the change in current assets minus the change in current liabilities (adjusted for current liabilities used for financing) minus depreciation expense. WC_ACC is working capital accruals, measured as the change in current assets minus the change in current liabilities (adjusted for current liabilities used for financing). 1/TotAssets is the inverse of lagged total assets. CFOt-1, t, t+1 are cash flows from operations in year t-1, t and t+1 scaled by lagged total assets. PP&E is net property, plant and equipment, scaled by lagged total assets. ΔREV-ΔAR is the change in sales minus the change in accounts receivable, scaled by lagged total assets. Other control variables are defined in Table 2. Standard errors are two-way clustered by both firm and year. T-statistics are presented underneath the coefficient estimates. ***, **, and * denote significance levels at 1%, 5%, and 10%, respectively.
(1) (2) (3) (4)
# petitioners >2
# petitioners <=2
TOT_ACC WC_ACC TOT_ACC WC_ACC Modified Dechow-Dichev variables
1/TotAssets 0.0175 0.0271**
0.0209 0.0649***
(1.52) (2.47)
(0.99) (3.49)
PP&E -0.0227*** 0.00534
-0.0413*** 0.00579
(-2.90) (0.75)
(-6.52) (1.01)
ΔREV-ΔAR 0.0330*** 0.0275***
0.0265*** 0.0295***
(3.69) (3.18)
(4.51) (4.78)
CFO t-1 0.0848*** 0.148***
0.0964*** 0.138***
(6.44) (9.74)
(9.13) (10.23)
CFO -0.825*** -0.738***
-0.772*** -0.712***
(-42.60) (-51.07)
(-42.00) (-41.82)
CFO t+1 0.0835*** 0.136***
0.103*** 0.136***
(4.01) (14.76)
(8.43) (11.87)
Pre 0.0136* 0.0104
0.00397 0.00214
(1.68) (1.41)
(0.54) (0.34)
Current -0.00644 -0.00568
-0.0167** -0.0145**
(-0.96) (-1.00)
(-2.57) (-2.45)
Post -0.0107 -0.0122
-0.00143 -0.00176
(-1.33) (-1.31)
(-0.25) (-0.31)
Firm characteristics Size 0.000470 0.00109
0.00184** 0.00328***
(0.43) (1.16)
(1.98) (3.98)
Leverage -0.0698*** -0.0436***
-0.0367*** -0.0210***
(-10.08) (-6.06)
(-5.90) (-2.78)
Growth 0.0185** 0.0246***
0.0241*** 0.0310***
(2.27) (4.00)
(3.81) (5.16)
Std(sales) -0.0253*** -0.0228***
-0.00733 -0.00243
(-3.07) (-2.98)
(-1.41) (-0.46)
NOAt-1 0.0000399 -0.0000871
0.000284 -0.000478**
(0.53) (-0.88)
(0.90) (-2.01)
Return -0.00137 -0.00321
0.00409 0.00471
(-0.30) (-0.78)
(1.06) (1.53)
Event Firm Indicator -0.00711 0.0000485
0.00587 0.00676
(-1.25) (0.01)
(1.12) (1.37)
Industry fixed effects Yes Yes
Yes Yes Country fixed effects Yes Yes
Yes Yes
Year fixed effects Yes Yes
Yes Yes p-value (βCurrent
TOT_ACC>βCurrentTOT_ACC) 0.08
p-value (βCurrentWC_ACC>βCurrent
WC_ACC) 0.07 N 4715 4715
9094 9094
adj. R-sq 0.783 0.750 0.746 0.719
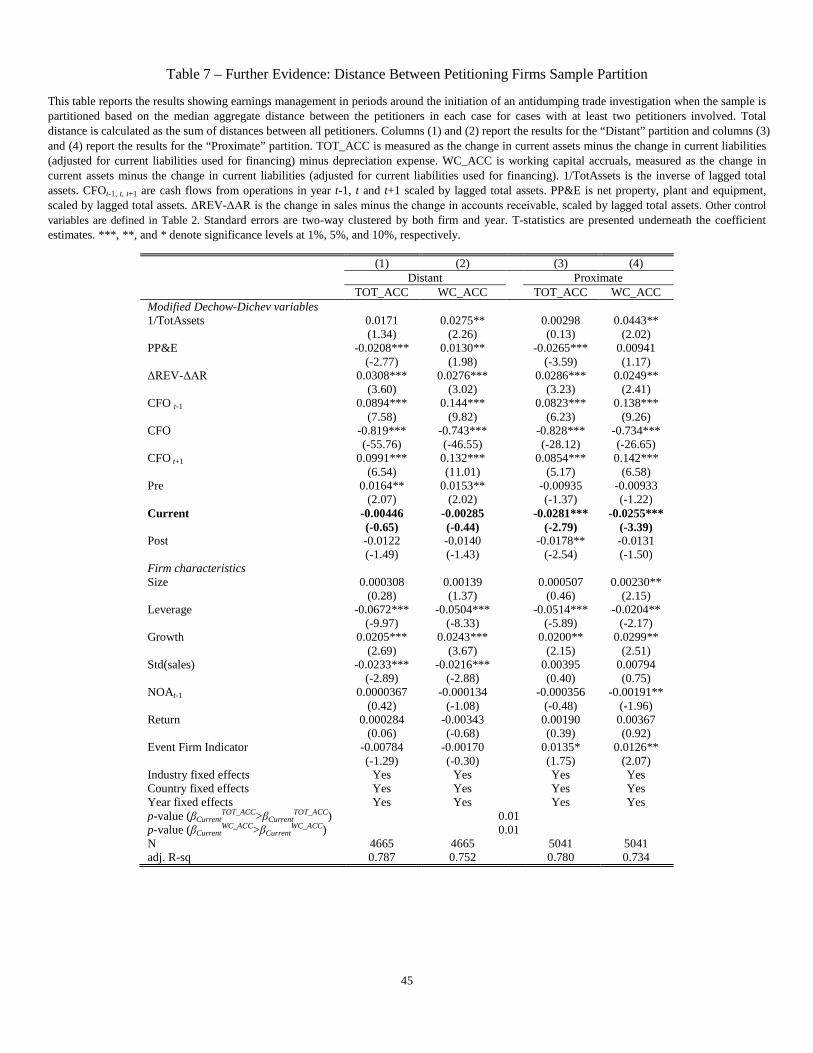
45
Table 7 – Further Evidence: Distance Between Petitioning Firms Sample Partition
This table reports the results showing earnings management in periods around the initiation of an antidumping trade investigation when the sample is partitioned based on the median aggregate distance between the petitioners in each case for cases with at least two petitioners involved. Total distance is calculated as the sum of distances between all petitioners. Columns (1) and (2) report the results for the “Distant” partition and columns (3) and (4) report the results for the “Proximate” partition. TOT_ACC is measured as the change in current assets minus the change in current liabilities (adjusted for current liabilities used for financing) minus depreciation expense. WC_ACC is working capital accruals, measured as the change in current assets minus the change in current liabilities (adjusted for current liabilities used for financing). 1/TotAssets is the inverse of lagged total assets. CFOt-1, t, t+1 are cash flows from operations in year t-1, t and t+1 scaled by lagged total assets. PP&E is net property, plant and equipment, scaled by lagged total assets. ΔREV-ΔAR is the change in sales minus the change in accounts receivable, scaled by lagged total assets. Other control variables are defined in Table 2. Standard errors are two-way clustered by both firm and year. T-statistics are presented underneath the coefficient estimates. ***, **, and * denote significance levels at 1%, 5%, and 10%, respectively.
(1) (2) (3) (4)
Distant
Proximate
TOT_ACC WC_ACC TOT_ACC WC_ACC Modified Dechow-Dichev variables
1/TotAssets 0.0171 0.0275**
0.00298 0.0443**
(1.34) (2.26)
(0.13) (2.02)
PP&E -0.0208*** 0.0130**
-0.0265*** 0.00941
(-2.77) (1.98)
(-3.59) (1.17)
ΔREV-ΔAR 0.0308*** 0.0276***
0.0286*** 0.0249**
(3.60) (3.02)
(3.23) (2.41)
CFO t-1 0.0894*** 0.144***
0.0823*** 0.138***
(7.58) (9.82)
(6.23) (9.26)
CFO -0.819*** -0.743***
-0.828*** -0.734***
(-55.76) (-46.55)
(-28.12) (-26.65)
CFO t+1 0.0991*** 0.132***
0.0854*** 0.142***
(6.54) (11.01)
(5.17) (6.58)
Pre 0.0164** 0.0153**
-0.00935 -0.00933
(2.07) (2.02)
(-1.37) (-1.22)
Current -0.00446 -0.00285
-0.0281*** -0.0255***
(-0.65) (-0.44)
(-2.79) (-3.39)
Post -0.0122 -0.0140
-0.0178** -0.0131
(-1.49) (-1.43)
(-2.54) (-1.50)
Firm characteristics Size 0.000308 0.00139
0.000507 0.00230**
(0.28) (1.37)
(0.46) (2.15)
Leverage -0.0672*** -0.0504***
-0.0514*** -0.0204**
(-9.97) (-8.33)
(-5.89) (-2.17)
Growth 0.0205*** 0.0243***
0.0200** 0.0299**
(2.69) (3.67)
(2.15) (2.51)
Std(sales) -0.0233*** -0.0216***
0.00395 0.00794
(-2.89) (-2.88)
(0.40) (0.75)
NOAt-1 0.0000367 -0.000134
-0.000356 -0.00191**
(0.42) (-1.08)
(-0.48) (-1.96)
Return 0.000284 -0.00343
0.00190 0.00367
(0.06) (-0.68)
(0.39) (0.92)
Event Firm Indicator -0.00784 -0.00170
0.0135* 0.0126**
(-1.29) (-0.30)
(1.75) (2.07)
Industry fixed effects Yes Yes
Yes Yes Country fixed effects Yes Yes
Yes Yes
Year fixed effects Yes Yes
Yes Yes p-value (βCurrent
TOT_ACC>βCurrentTOT_ACC) 0.01
p-value (βCurrentWC_ACC>βCurrent
WC_ACC) 0.01 N 4665 4665
5041 5041
adj. R-sq 0.787 0.752 0.780 0.734

46
Table 8 – Further Evidence: Firms Represented By Industry Associations
This table reports the results showing earnings management in periods around the initiation of an antidumping trade investigation when the sample is partitioned based on the presence of an industry association in each case for cases in which at least two petitioners are involved. We classify cases in which firms are not represented by an industry association in columns (1) and (2) and classify cases in which firms are represented by an industry association in columns (3) and (4). TOT_ACC is measured as the change in current assets minus the change in current liabilities (adjusted for current liabilities used for financing) minus depreciation expense. WC_ACC is working capital accruals, measured as the change in current assets minus the change in current liabilities (adjusted for current liabilities used for financing). 1/TotAssets is the inverse of lagged total assets. CFOt-1, t, t+1 are cash flows from operations in year t-1, t and t+1 scaled by lagged total assets. PP&E is net property, plant and equipment, scaled by lagged total assets. ΔREV-ΔAR is the change in sales minus the change in accounts receivable, scaled by lagged total assets. Other control variables are defined in Table 2. Standard errors are two-way clustered by both firm and year. T-statistics are presented underneath the coefficient estimates. ***, **, and * denote significance levels at 1%, 5%, and 10%, respectively.
(1) (2) (3) (4)
Cases not represented by industry associations
Cases represented by industry associations
TOT_ACC WC_ACC TOT_ACC WC_ACC Modified Dechow-Dichev variables
1/TotAssets 0.0210** 0.0304***
0.0547* 0.0805**
(1.97) (3.03)
(1.79) (2.35)
PP&E -0.0281*** 0.0108
-0.0177** 0.0138**
(-3.30) (1.55)
(-2.41) (1.99)
ΔREV-ΔAR 0.0164* 0.0102
0.0361*** 0.0329***
(1.74) (1.00)
(5.27) (4.17)
CFO t-1 0.0884*** 0.138***
0.0817*** 0.150***
(8.86) (10.36)
(5.16) (9.18)
CFO -0.807*** -0.724***
-0.834*** -0.744***
(-44.60) (-39.93)
(-40.16) (-38.90)
CFO t+1 0.0830*** 0.130***
0.0913*** 0.141***
(4.83) (9.35)
(5.38) (8.63)
Pre 0.00431 0.000995
0.00745 0.00957
(0.53) (0.14)
(0.93) (1.10)
Current -0.00877 -0.00608
-0.0223*** -0.0201**
(-1.25) (-0.85)
(-2.90) (-2.55)
Post -0.00743 -0.00549
-0.0179** -0.0135
(-1.17) (-0.79)
(-2.11) (-1.51)
Firm characteristics Size 0.00214** 0.00246***
0.00127 0.00252**
(2.30) (2.91)
(1.08) (2.33)
Leverage -0.0490*** -0.0264**
-0.0628*** -0.0444***
(-5.99) (-2.45)
(-7.87) (-7.20)
Growth 0.0375*** 0.0509***
0.00984 0.0125**
(3.73) (5.16)
(1.46) (2.14)
Std(sales) -0.00204 -0.000580
-0.0251*** -0.0203***
(-0.27) (-0.08)
(-3.13) (-2.75)
NOAt-1 0.000289 -0.00111**
0.000254 -0.000251
(0.48) (-2.09)
(1.05) (-0.99)
Return -0.00294 -0.00219
0.00280 0.00173
(-0.58) (-0.49)
(0.64) (0.34)
Event Firm Indicator 0.00248 0.00524
-0.000906 0.000858
(0.38) (0.81)
(-0.14) (0.14)
Industry fixed effects Yes Yes
Yes Yes Country fixed effects Yes Yes
Yes Yes
Year fixed effects Yes Yes
Yes Yes p-value (βCurrent
TOT_ACC>βCurrentTOT_ACC)
0.07
p-value (βCurrentWC_ACC>βCurrent
WC_ACC)
0.05 N 5906 5906
3669 3669
adj. R-sq 0.784 0.738 0.788 0.747

47
Table 9 – Retaliation Capacity Sample Partition
This table reports the results showing earnings management in periods around the initiation of an antidumping trade investigation when the sample is partitioned based on the ratio of total value of exports from the petitioning firm’s home country to the defendant countries over the total value of exports by the petitioning firm’s home country. We designate cases in which this ratio is lower than the sample median into the low export partition (i.e., low retaliation capacity partition) and cases in which the ratio is higher than the sample median into the high export partition (i.e., high retaliation capacity partition), respectively. Columns (1) and (2) report the results for the low retaliation capacity partition and columns (3) and (4) report the results for the high retaliation capacity partition. TOT_ACC is measured as the change in current assets minus the change in current liabilities (adjusted for current liabilities used for financing) minus depreciation expense. WC_ACC is working capital accruals, measured as the change in current assets minus the change in current liabilities (adjusted for current liabilities used for financing). 1/TotAssets is the inverse of lagged total assets. CFOt-1, t, t+1 are cash flows from operations in year t-1, t and t+1 scaled by lagged total assets. PP&E is net property, plant and equipment, scaled by lagged total assets. ΔREV-ΔAR is the change in sales minus the change in accounts receivable, scaled by lagged total assets. Other control variables are defined in Table 2. Standard errors are two-way clustered by both firm and year. T-statistics are presented underneath the coefficient estimates. ***, **, and * denote significance levels at 1%, 5%, and 10%, respectively.
(1) (2) (3) (4)
Low retaliation capacity
High retaliation capacity
TOT_ACC WC_ACC TOT_ACC WC_ACC Modified Dechow-Dichev variables
1/TotAssets 0.0373* 0.0542***
0.0184 0.0369***
(1.88) (3.19)
(1.57) (3.39)
PP&E -0.0361*** 0.00466
-0.0321*** 0.0138**
(-5.65) (0.71)
(-4.52) (2.26)
ΔREV-ΔAR 0.0246*** 0.0298***
0.0337*** 0.0267***
(3.72) (4.49)
(5.12) (3.57)
CFO t-1 0.0901*** 0.120***
0.101*** 0.157***
(9.68) (9.54)
(8.40) (11.24)
CFO -0.776*** -0.725***
-0.794*** -0.722***
(-39.37) (-41.57)
(-44.58) (-53.95)
CFO t+1 0.110*** 0.130***
0.0921*** 0.137***
(9.37) (11.25)
(6.18) (12.65)
Pre 0.0114 0.00601
0.00213 0.00398
(1.52) (0.79)
(0.47) (0.72)
Current -0.00674 -0.00594
-0.0217*** -0.0188***
(-0.84) (-0.88)
(-3.57) (-2.98)
Post -0.00865 -0.00943
-0.0110* -0.00775
(-1.16) (-1.32)
(-1.67) (-1.11)
Firm characteristics Size 0.00259*** 0.00353***
0.00159* 0.00242***
(2.88) (4.29)
(1.69) (2.94)
Leverage -0.0289*** -0.0204**
-0.0631*** -0.0382***
(-3.31) (-2.25)
(-7.30) (-4.44)
Growth 0.0217*** 0.0242***
0.0172* 0.0325***
(3.52) (4.05)
(1.93) (4.58)
Std(sales) -0.00888 -0.00319
-0.0195*** -0.0153**
(-1.36) (-0.50)
(-2.80) (-2.50)
NOAt-1 0.000139 -0.000228*
0.000202 -0.000389*
(0.70) (-1.75)
(0.84) (-1.73)
Return 0.00106 0.00137
0.00290 0.000564
(0.22) (0.29)
(0.60) (0.16)
Event Firm Indicator 0.00217 0.00358
0.00455 0.00660
(0.35) (0.58)
(0.92) (1.39)
Industry fixed effects Yes Yes
Yes Yes Country fixed effects Yes Yes
Yes Yes
Year fixed effects Yes Yes
Yes Yes p-value (βCurrent
TOT_ACC>βCurrentTOT_ACC) 0.03
p-value (βCurrentWC_ACC>βCurrent
WC_ACC) 0.05 N 7185 7185
6673 6673
adj. R-sq 0.748 0.726 0.767 0.742

48
Table 10 – Financing Sample Partition
This table reports the results showing earnings management in periods around the initiation of an antidumping trade investigation when the sample is partitioned based on the legal status of the firm whether or not the firm raises new financing in the year of, year before, and/or the year after the initiation. Columns (1) and (2) report the results for firms that raise cumulative new debt or equity greater than 5% of total assets and columns (3) and (4) report the results for firms that do not raise cumulative new debt or equity greater than 5% of total assets. TOT_ACC is measured as the change in current assets minus the change in current liabilities (adjusted for current liabilities used for financing) minus depreciation expense. WC_ACC is working capital accruals, measured as the change in current assets minus the change in current liabilities (adjusted for current liabilities used for financing). 1/TotAssets is the inverse of lagged total assets. CFOt-1, t, t+1 are cash flows from operations in year t-1, t and t+1 scaled by lagged total assets. PP&E is net property, plant and equipment, scaled by lagged total assets. ΔREV-ΔAR is the change in sales minus the change in accounts receivable, scaled by lagged total assets. Other control variables are defined in Table 2. Standard errors are two-way clustered by both firm and year. T-statistics are presented underneath the coefficient estimates. ***, **, and * denote significance levels at 1%, 5%, and 10%, respectively.
(1) (2) (3) (4)
With new financing
Without new financing
TOT_ACC WC_ACC TOT_ACC WC_ACC Modified Dechow-Dichev variables
1/TotAssets 0.0274** 0.0467***
0.0248 0.0404***
(2.51) (4.11)
(1.45) (3.35)
PP&E -0.0332*** 0.00937
-0.0366*** 0.00262
(-4.56) (1.41)
(-5.17) (0.39)
ΔREV-ΔAR 0.0267*** 0.0261***
0.0282*** 0.0295***
(3.86) (3.82)
(3.29) (3.11)
CFO t-1 0.0829*** 0.124***
0.105*** 0.152***
(6.78) (8.00)
(7.33) (10.13)
CFO -0.813*** -0.748***
-0.767*** -0.689***
(-50.58) (-51.95)
(-40.70) (-43.58)
CFO t+1 0.104*** 0.135***
0.0994*** 0.134***
(7.14) (10.90)
(7.52) (12.35)
Pre -0.00120 0.000859
0.0113 0.00586
(-0.14) (0.12)
(1.37) (0.68)
Current -0.0106 -0.00646
-0.0198*** -0.0183***
(-1.24) (-0.84)
(-3.10) (-2.73)
Post -0.00451 -0.00406
-0.00750 -0.00579
(-0.60) (-0.52)
(-1.49) (-1.01)
Firm characteristics Size 0.00243*** 0.00326***
0.00200* 0.00242**
(3.37) (4.63)
(1.84) (2.57)
Leverage -0.0383*** -0.0193**
-0.0451*** -0.0278***
(-5.07) (-2.31)
(-5.36) (-3.16)
Growth 0.0211*** 0.0251***
0.0221*** 0.0318***
(3.23) (5.02)
(3.62) (4.28)
Std(sales) -0.0220* -0.0147
-0.00797 -0.00482
(-1.90) (-1.30)
(-1.13) (-0.69)
NOAt-1 -0.0000483 -0.000338*
0.000399 -0.000611*
(-0.20) (-1.95)
(1.27) (-1.93)
Return 0.00527* 0.00550*
0.0000926 -0.00151
(1.78) (1.79)
(0.02) (-0.39)
Event Firm Indicator 0.000437 -0.00157
0.00516 0.00938**
(0.08) (-0.30)
(1.01) (2.00)
Industry fixed effects Yes Yes
Yes Yes Country fixed effects Yes Yes
Yes Yes
Year fixed effects Yes Yes
Yes Yes p-value (βCurrent
TOT_ACC>βCurrentTOT_ACC) 0.10
p-value (βCurrentWC_ACC>βCurrent
WC_ACC) 0.06 N 6501 6501
7391 7391
adj. R-sq 0.775 0.744 0.750 0.715
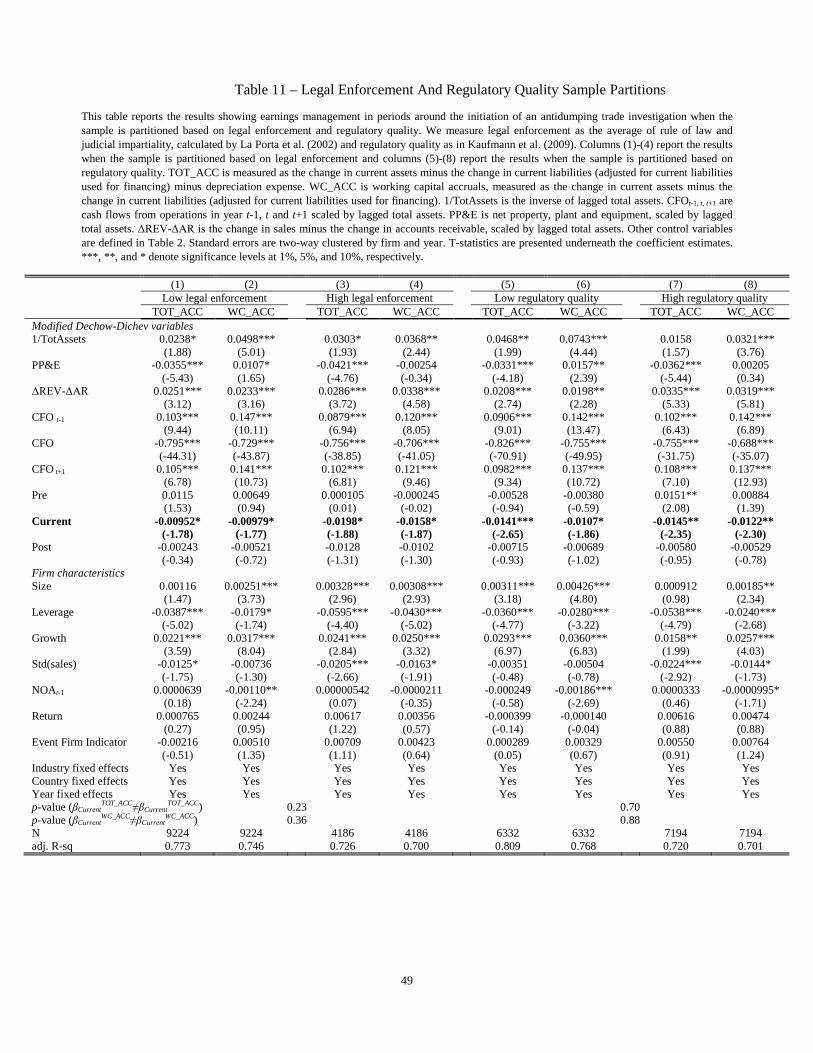
49
Table 11 – Legal Enforcement And Regulatory Quality Sample Partitions
This table reports the results showing earnings management in periods around the initiation of an antidumping trade investigation when the sample is partitioned based on legal enforcement and regulatory quality. We measure legal enforcement as the average of rule of law and judicial impartiality, calculated by La Porta et al. (2002) and regulatory quality as in Kaufmann et al. (2009). Columns (1)-(4) report the results when the sample is partitioned based on legal enforcement and columns (5)-(8) report the results when the sample is partitioned based on regulatory quality. TOT_ACC is measured as the change in current assets minus the change in current liabilities (adjusted for current liabilities used for financing) minus depreciation expense. WC_ACC is working capital accruals, measured as the change in current assets minus the change in current liabilities (adjusted for current liabilities used for financing). 1/TotAssets is the inverse of lagged total assets. CFOt-1, t, t+1 are cash flows from operations in year t-1, t and t+1 scaled by lagged total assets. PP&E is net property, plant and equipment, scaled by lagged total assets. ΔREV-ΔAR is the change in sales minus the change in accounts receivable, scaled by lagged total assets. Other control variables are defined in Table 2. Standard errors are two-way clustered by firm and year. T-statistics are presented underneath the coefficient estimates. ***, **, and * denote significance levels at 1%, 5%, and 10%, respectively.
(1) (2) (3) (4) (5) (6) (7) (8)
Low legal enforcement
High legal enforcement
Low regulatory quality
High regulatory quality
TOT_ACC WC_ACC TOT_ACC WC_ACC TOT_ACC WC_ACC TOT_ACC WC_ACC Modified Dechow-Dichev variables
1/TotAssets 0.0238* 0.0498***
0.0303* 0.0368**
0.0468** 0.0743***
0.0158 0.0321***
(1.88) (5.01)
(1.93) (2.44)
(1.99) (4.44)
(1.57) (3.76)
PP&E -0.0355*** 0.0107*
-0.0421*** -0.00254
-0.0331*** 0.0157**
-0.0362*** 0.00205
(-5.43) (1.65)
(-4.76) (-0.34)
(-4.18) (2.39)
(-5.44) (0.34)
ΔREV-ΔAR 0.0251*** 0.0233***
0.0286*** 0.0338***
0.0208*** 0.0198**
0.0335*** 0.0319***
(3.12) (3.16)
(3.72) (4.58)
(2.74) (2.28)
(5.33) (5.81)
CFO t-1 0.103*** 0.147***
0.0879*** 0.120***
0.0906*** 0.142***
0.102*** 0.142***
(9.44) (10.11)
(6.94) (8.05)
(9.01) (13.47)
(6.43) (6.89)
CFO -0.795*** -0.729***
-0.756*** -0.706***
-0.826*** -0.755***
-0.755*** -0.688***
(-44.31) (-43.87)
(-38.85) (-41.05)
(-70.91) (-49.95)
(-31.75) (-35.07)
CFO t+1 0.105*** 0.141***
0.102*** 0.121***
0.0982*** 0.137***
0.108*** 0.137***
(6.78) (10.73)
(6.81) (9.46)
(9.34) (10.72)
(7.10) (12.93)
Pre 0.0115 0.00649
0.000105 -0.000245
-0.00528 -0.00380
0.0151** 0.00884
(1.53) (0.94)
(0.01) (-0.02)
(-0.94) (-0.59)
(2.08) (1.39)
Current -0.00952* -0.00979*
-0.0198* -0.0158*
-0.0141*** -0.0107*
-0.0145** -0.0122**
(-1.78) (-1.77)
(-1.88) (-1.87)
(-2.65) (-1.86)
(-2.35) (-2.30)
Post -0.00243 -0.00521
-0.0128 -0.0102
-0.00715 -0.00689
-0.00580 -0.00529
(-0.34) (-0.72)
(-1.31) (-1.30)
(-0.93) (-1.02)
(-0.95) (-0.78)
Firm characteristics Size 0.00116 0.00251***
0.00328*** 0.00308***
0.00311*** 0.00426***
0.000912 0.00185**
(1.47) (3.73)
(2.96) (2.93)
(3.18) (4.80)
(0.98) (2.34)
Leverage -0.0387*** -0.0179*
-0.0595*** -0.0430***
-0.0360*** -0.0280***
-0.0538*** -0.0240***
(-5.02) (-1.74)
(-4.40) (-5.02)
(-4.77) (-3.22)
(-4.79) (-2.68)
Growth 0.0221*** 0.0317***
0.0241*** 0.0250***
0.0293*** 0.0360***
0.0158** 0.0257***
(3.59) (8.04)
(2.84) (3.32)
(6.97) (6.83)
(1.99) (4.03)
Std(sales) -0.0125* -0.00736
-0.0205*** -0.0163*
-0.00351 -0.00504
-0.0224*** -0.0144*
(-1.75) (-1.30)
(-2.66) (-1.91)
(-0.48) (-0.78)
(-2.92) (-1.73)
NOAt-1 0.0000639 -0.00110**
0.00000542 -0.0000211
-0.000249 -0.00186***
0.0000333 -0.0000995*
(0.18) (-2.24)
(0.07) (-0.35)
(-0.58) (-2.69)
(0.46) (-1.71)
Return 0.000765 0.00244
0.00617 0.00356
-0.000399 -0.000140
0.00616 0.00474
(0.27) (0.95)
(1.22) (0.57)
(-0.14) (-0.04)
(0.88) (0.88)
Event Firm Indicator -0.00216 0.00510
0.00709 0.00423
0.000289 0.00329
0.00550 0.00764
(-0.51) (1.35)
(1.11) (0.64)
(0.05) (0.67)
(0.91) (1.24)
Industry fixed effects Yes Yes
Yes Yes
Yes Yes
Yes Yes Country fixed effects Yes Yes
Yes Yes
Yes Yes
Yes Yes
Year fixed effects Yes Yes
Yes Yes
Yes Yes
Yes Yes p-value (βCurrent
TOT_ACC≠βCurrentTOT_ACC) 0.23
0.70
p-value (βCurrentWC_ACC≠βCurrent
WC_ACC) 0.36
0.88 N 9224 9224
4186 4186
6332 6332
7194 7194
adj. R-sq 0.773 0.746 0.726 0.700 0.809 0.768 0.720 0.701

50
Table 12 – Audit And Financial Reporting Enforcement Intensity Sample Partitions This table reports the results showing earnings management in periods around the initiation of an antidumping trade investigation when the sample is partitioned based on AUDIT, ENFORCE and TOTAL scores from Brown, Preiato and Tarca (2014). Columns (1)-(4) report the results when the sample is partitioned based on AUDIT, columns (5)-(8) report the results when the sample is partitioned based on ENFORCE and columns (9)-(12) report the results when the sample is partitioned on TOTAL. TOT_ACC is measured as the change in current assets minus the change in current liabilities (adjusted for current liabilities used for financing) minus depreciation expense. WC_ACC is working capital accruals, measured as the change in current assets minus the change in current liabilities (adjusted for current liabilities used for financing). 1/TotAssets is the inverse of lagged total assets. CFOt-1, t, t+1 are cash flows from operations in year t-1, t and t+1 scaled by lagged total assets. PP&E is net property, plant and equipment, scaled by lagged total assets. ΔREV-ΔAR is the change in sales minus the change in accounts receivable, scaled by lagged total assets. Other control variables are defined in Table 2. Standard errors are two-way clustered by both firm and year. T-statistics are presented underneath the coefficient estimates. ***, **, and * denote significance levels at 1%, 5%, and 10%, respectively. (1) (2) (3) (4) (4) (6) (7) (8) (9) (10) (11) (12)
Low audit score
High audit score
Low enforcement score
High enforcement score
Low total score
High total score
TOT_ACC WC_ACC TOT_ACC WC_ACC TOT_ACC WC_ACC TOT_ACC WC_ACC TOT_ACC WC_ACC TOT_ACC WC_ACC Modified Dechow-Dichev variables
1/TotAssets 0.0319*** 0.0441***
0.0280 0.0651***
0.000949 0.0195**
0.0420** 0.0601***
0.0198* 0.0389***
0.0372 0.0598***
(3.34) (5.02)
(1.18) (2.83)
(0.09) (2.06)
(2.24) (4.44)
(1.95) (4.36)
(1.61) (3.06)
PP&E -0.0341*** 0.0112
-0.0386*** 0.00101
-0.0342*** -0.00400
-0.0342*** 0.0148**
-0.0358*** 0.00288
-0.0369*** 0.00940
(-4.11) (1.47)
(-5.74) (0.17)
(-3.90) (-0.51)
(-4.90) (2.45)
(-3.99) (0.35)
(-5.81) (1.50)
ΔREV-ΔAR 0.0261*** 0.0223**
0.0309*** 0.0328***
0.0310*** 0.0290***
0.0266*** 0.0272***
0.0305*** 0.0307***
0.0285*** 0.0293***
(3.28) (2.57)
(4.98) (5.61)
(3.54) (3.51)
(4.18) (4.43)
(3.10) (3.38)
(5.34) (5.65)
CFO t-1 0.0901*** 0.144***
0.108*** 0.144***
0.116*** 0.151***
0.0876*** 0.133***
0.102*** 0.145***
0.0983*** 0.138***
(6.38) (8.57)
(9.27) (10.99)
(5.23) (6.48)
(10.29) (12.85)
(4.74) (6.62)
(10.99) (12.63)
CFO -0.779*** -0.697***
-0.786*** -0.733***
-0.737*** -0.692***
-0.810*** -0.734***
-0.728*** -0.671***
-0.802*** -0.737***
(-34.52) (-31.09)
(-45.20) (-61.69)
(-25.20) (-24.06)
(-56.26) (-82.69)
(-20.48) (-21.10)
(-58.70) (-85.04)
CFO t+1 0.0945*** 0.138***
0.102*** 0.131***
0.125*** 0.146***
0.0921*** 0.128***
0.117*** 0.150***
0.0973*** 0.129***
(6.79) (9.96)
(6.98) (12.46)
(9.65) (11.67)
(5.91) (10.59)
(7.49) (10.21)
(7.22) (12.65)
Pre 0.0107 0.00387
0.00724* 0.00578
0.00584 0.00363
0.00485 0.00421
0.00755 0.00271
0.00519 0.00352
(0.94) (0.42)
(1.69) (1.12)
(0.49) (0.34)
(1.00) (0.83)
(0.64) (0.25)
(1.16) (0.75)
Current -0.00983 -0.0100
-0.0144** -0.0115**
-0.00641 -0.00876
-0.0176*** -0.0130**
-0.0122** -0.0109*
-0.0150** -0.0118**
(-1.26) (-1.37)
(-2.52) (-2.11)
(-0.95) (-1.31)
(-3.28) (-2.21)
(-2.12) (-1.86)
(-2.57) (-2.04)
Post -0.00730 -0.00822
-0.00193 -0.00305
0.00139 -0.000420
-0.00966 -0.00919
-0.0101 -0.0094
-0.00651 -0.00619
(-0.96) (-1.15)
(-0.23) (-0.35)
(0.13) (-0.04)
(-1.14) (-1.13)
(-1.03) (-1.03)
(-0.83) (-0.89)
Firm characteristics Size 0.00305*** 0.00328***
0.00129 0.00279***
-0.00109 -0.000397
0.00357*** 0.00413***
0.00103 0.00271**
0.00239*** 0.00339***
(3.44) (4.26)
(1.33) (3.19)
(-0.77) (-0.33)
(3.83) (4.95)
(0.83) (2.52)
(2.60) (4.03)
Leverage -0.0251*** -0.00546
-0.0551*** -0.0383***
-0.0227* -0.00845
-0.0563*** -0.0347***
-0.0203 -0.00244
-0.0523*** -0.0336***
(-2.70) (-0.48)
(-7.67) (-5.91)
(-1.92) (-0.64)
(-8.03) (-4.87)
(-1.62) (-0.18)
(-8.34) (-5.64)
Growth 0.0239*** 0.0390***
0.0175*** 0.0203***
0.0257** 0.0399***
0.0185*** 0.0240***
0.0265** 0.0384***
0.0191*** 0.0233***
(3.45) (5.06)
(3.15) (4.00)
(2.04) (4.90)
(3.70) (5.91)
(2.39) (4.20)
(5.15) (5.89)
Std(sales) -0.00854 -0.00786
-0.0206** -0.00950
-0.0146* -0.0138
-0.0128** -0.00650
-0.0176** -0.0166**
-0.0141* -0.00695
(-1.16) (-1.19)
(-2.36) (-1.14)
(-1.77) (-1.51)
(-2.01) (-1.10)
(-2.17) (-1.96)
(-1.86) (-0.98)
NOAt-1 0.000312 -0.000451
0.000106 -0.000333
-0.000113 -0.00109*
0.000316 -0.000283
0.0000301 -0.0000283
0.000188 -0.000409**
(1.28) (-1.56)
(0.46) (-1.38)
(-0.26) (-1.90)
(1.50) (-1.49)
(0.53) (-0.45)
(0.81) (-2.20)
Return -0.00249 -0.00232
0.00624* 0.00493
-0.000514 -0.000282
0.00471 0.00320
-0.001000 0.000122
0.00558 0.00337
(-0.53) (-0.51)
(1.68) (1.43)
(-0.16) (-0.10)
(0.92) (0.72)
(-0.20) (0.03)
(1.53) (1.05)
Event Firm Indicator -0.000758 0.00259
0.00274 0.00419
0.0101 0.0126**
-0.000613 0.00157
0.0138** 0.0101*
-0.00155 0.00364
(-0.11) (0.49)
(0.58) (0.81)
(1.51) (2.08)
(-0.14) (0.37)
(2.12) (1.73)
(-0.37) (0.87)
Industry fixed effects Yes Yes
Yes Yes
Yes Yes
Yes Yes
Yes Yes
Yes Yes Country fixed effects Yes Yes
Yes Yes
Yes Yes
Yes Yes
Yes Yes
Yes Yes
Year fixed effects Yes Yes
Yes Yes
Yes Yes
Yes Yes
Yes Yes
Yes Yes p-value (βCurrent
TOT_ACC≠βCurrentTOT_ACC) 0.54
0.17
0.69
p-value (βCurrentWC_ACC≠βCurrent
WC_ACC) 0.82
0.58
0.88 N 6316 6316
7457 7457
4525 4525
9028 9028
4255 4255
9361 9361
adj. R-sq 0.768 0.730 0.745 0.727 0.722 0.709 0.773 0.741 0.719 0.699 0.770 0.742