Earnings Call Presentation - BorgWarner
27
© BorgWarner Inc. 1 May 5, 2021 Earnings Call Presentation Q1 2021 1
Transcript of Earnings Call Presentation - BorgWarner

© BorgWarner Inc. 1
May 5, 2021
Earnings Call PresentationQ1 2021
1
© BorgWarner Inc. 2
Forward-Looking StatementsStatements in this presentation may constitute forward-looking statements as contemplated by the 1995 Private Securities Litigation Reform Act (the “Act”) that are based on management's current outlook, expectations, estimates and projections. Words such as “anticipates,” “believes,” “continues,” “could,” “designed,” “effect,” “estimates,” “evaluates,” “expects,” “forecasts,” “goal,” “initiative,” “intends,” “may,” “outlook,” “plans,” “potential,” “predicts,” “project,” “pursue,” “seek,” “should,” “target,” “when,” “will,” “would,” and variations of such words and similar expressions are intended to identify such forward-looking statements. Further, all statements, other than statements of historical fact contained or incorporated by reference in this presentation, that we expect or anticipate will or may occur in the future regarding our financial position, business strategy and measures to implement that strategy, including changes to operations, competitive strengths, goals, expansion and growth of our business and operations, plans, references to future success and other such matters, are forward-looking statements. Accounting estimates, such as those described under the heading “Critical Accounting Policies and Estimates” in Item 7 of our Annual Report on Form 10-K for the year ended December 31, 2020 (“Form 10-K”), are inherently forward-looking. All forward-looking statements are based on assumptions and analyses made by us in light of our experience and our perception of historical trends, current conditions and expected future developments, as well as other factors we believe are appropriate under the circumstances. Forward-looking statements are not guarantees of performance and the Company’s actual results may differ materially from those expressed, projected, or implied in or by the forward-looking statements.
You should not place undue reliance on these forward-looking statements, which speak only as of the date of this presentation. Forward-looking statements are subject to risks and uncertainties, many of which are difficult to predict and generally beyond our control, that could cause actual results to differ materially from those expressed, projected or implied in or by the forward-looking statements. These risks and uncertainties, among others, include: uncertainties regarding the extent and duration of impacts of matters associated with the COVID-19/coronavirus pandemic (“COVID-19”), including additional production disruptions; the failure to realize the expected benefits of the acquisition of Delphi Technologies PLC that the Company completed on October 1, 2020; the failure to promptly and effectively integrate acquired businesses; the potential for unknown or inestimable liabilities relating to the acquired businesses; the possibility that the proposed transaction between the Company and AKASOL AG (“Proposed Transaction”) will not be consummated; failure to satisfy any of the conditions to the proposed transaction; failure to realize the expected benefits of the Proposed Transaction; our dependence on automotive and truck production, both of which are highly cyclical and subject to disruptions; our reliance on major original equipment manufacturers (“OEM”) customers; commodities availability and pricing; supply disruptions; fluctuations in interest rates and foreign currency exchange rates; availability of credit; our dependence on key management; our dependence on information systems; the uncertainty of the global economic environment; the outcome of existing or any future legal proceedings, including litigation with respect to various claims; future changes in laws and regulations, including, by way of example, tariffs, in the countries in which we operate; and the other risks, including, by way of example, pandemics and quarantines, noted in reports that we file with the Securities and Exchange Commission, including Item 1A, “Risk Factors” in our most recently-filed Form 10-K as updated by Item 1A of this report. We do not undertake any obligation to update or announce publicly any updates to or revisions to any of the forward-looking statements in this presentation to reflect any change in our expectations or any change in events, conditions, circumstances, or assumptions underlying the statements.
© BorgWarner Inc. 3
Non-GAAP Financial Measures
This presentation contains information about BorgWarner’s financial results that is not presented in accordance with accounting principles generally accepted in the United
States (“GAAP”). Such non-GAAP financial measures are reconciled to their closest GAAP financial measures in the Appendix. The provision of these comparable GAAP
financial measures for 2021 is not intended to indicate that BorgWarner is explicitly or implicitly providing projections on those GAAP financial measures, and actual results for
such measures are likely to vary from those presented. The reconciliations include all information reasonably available to the company at the date of this presentation and the
adjustments that management can reasonably predict.
Management believes that these non-GAAP financial measures are useful to management, investors, and banking institutions in their analysis of the Company's business and
operating performance. Management also uses this information for operational planning and decision-making purposes.
Non-GAAP financial measures are not and should not be considered a substitute for any GAAP measure. Additionally, because not all companies use identical calculations,
the non-GAAP financial measures as presented by BorgWarner may not be comparable to similarly titled measures reported by other companies.

© BorgWarner Inc. 4
▪ Fred Lissalde Chief Executive Officer
▪ Kevin Nowlan Chief Financial Officer
▪ Q&A
Agenda
© BorgWarner Inc. 5
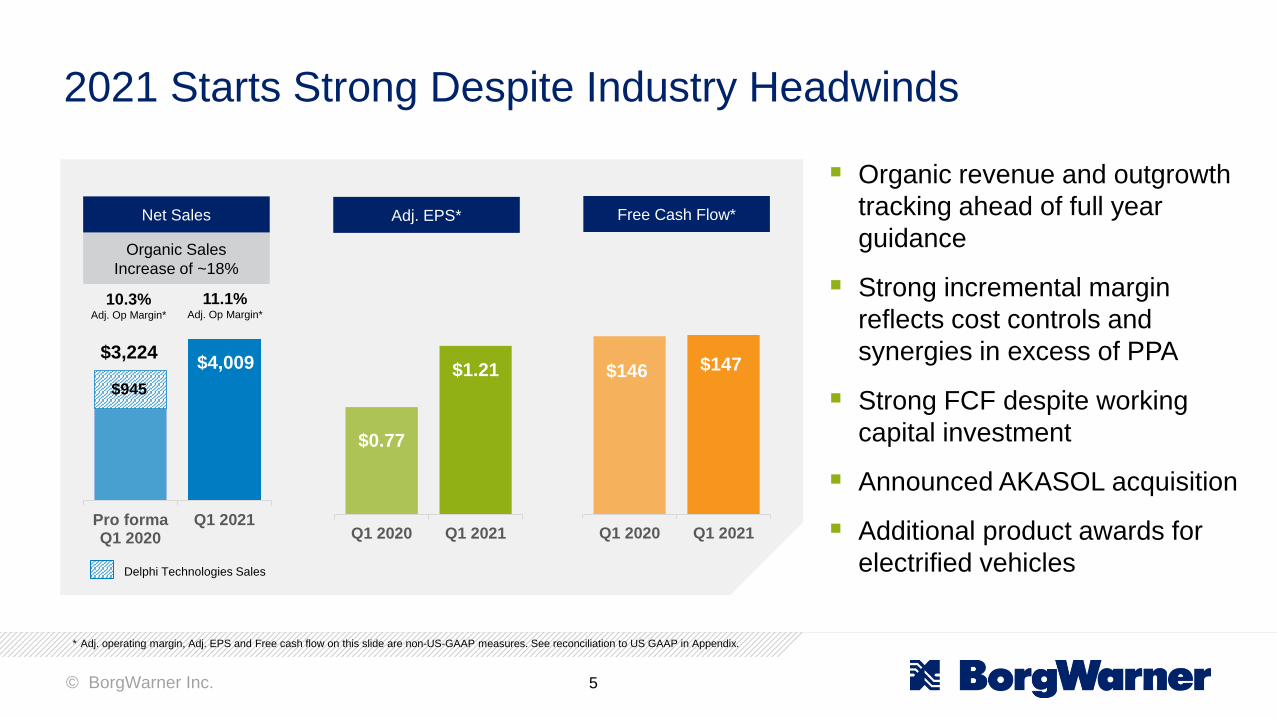
$3,224$4,009
$945
Pro formaQ1 2020
Q1 2021
Net Sales Adj. EPS*
$0.77
$1.21
Q1 2020 Q1 2021
▪ Organic revenue and outgrowth
tracking ahead of full year
guidance
▪ Strong incremental margin
reflects cost controls and
synergies in excess of PPA
▪ Strong FCF despite working
capital investment
▪ Announced AKASOL acquisition
▪ Additional product awards for
electrified vehicles
Organic Sales
Increase of ~18%
2021 Starts Strong Despite Industry Headwinds
Free Cash Flow*
$146 $147
Q1 2020 Q1 2021
10.3%Adj. Op Margin*
11.1% Adj. Op Margin*
** Adj. operating margin, Adj. EPS and Free cash flow on this slide are non-US-GAAP measures. See reconciliation to US GAAP in Appendix.
Delphi Technologies Sales
© BorgWarner Inc. 6
Acquisition of Leading Battery Systems Provider
▪ Battery Systems is a key element of BorgWarner’s e-growth strategy
▪ AKASOL is a leader in high-performance battery system solutions for electric vehicles
▪ AKASOL has highly flexible battery technology across multiple cell architectures
▪ AKASOL has proven technologies and products with established manufacturing facilities already in
serial production today
▪ AKASOL has a strong order backlog of approximately $2.4B1 primarily from leading OEMs
▪ AKASOL products serve CV and Off-highway applications, which aligns with BorgWarner’s goal to
increase its electrification portfolio across both LV and CV markets
Strengthens BorgWarner’s electric propulsion systems leadership
1 Backlog based on latest AKASOL public disclosure of €2.0B as of Q2 2020 using $1.20 USD to Euro exchange rate.
© BorgWarner Inc. 7
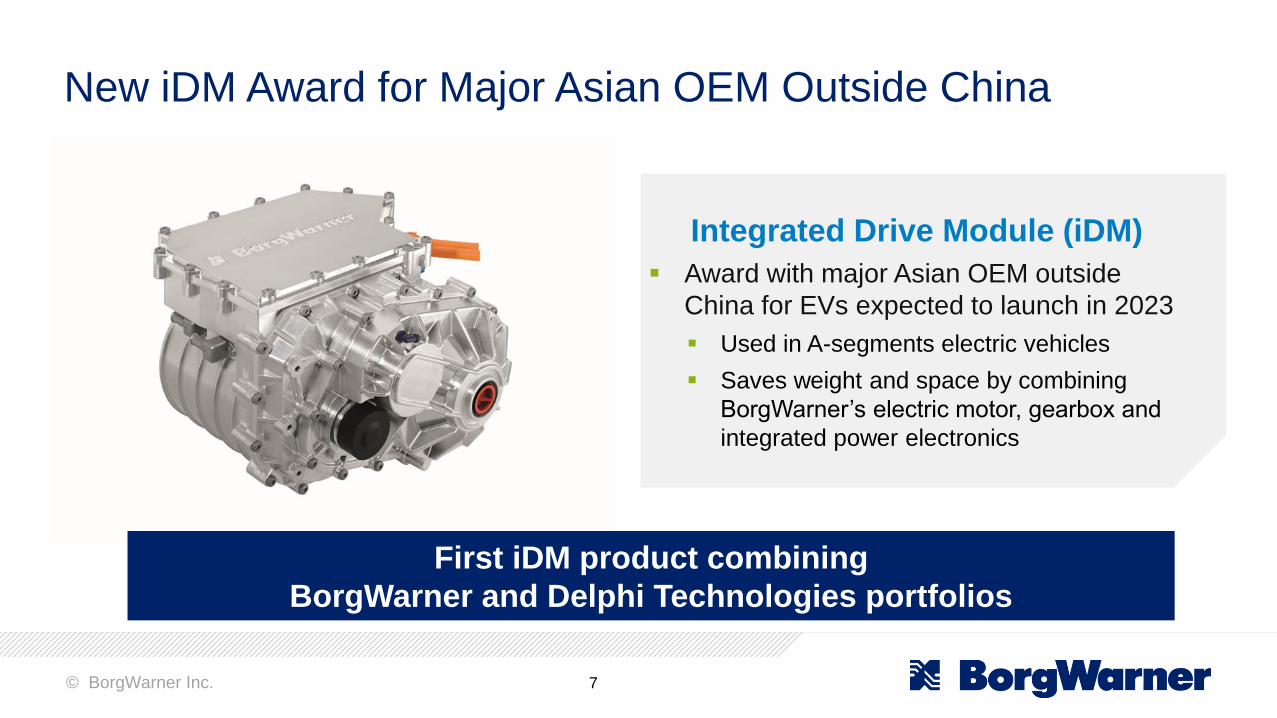
New iDM Award for Major Asian OEM Outside China
Integrated Drive Module (iDM)
▪ Award with major Asian OEM outside
China for EVs expected to launch in 2023
▪ Used in A-segments electric vehicles
▪ Saves weight and space by combining
BorgWarner’s electric motor, gearbox and
integrated power electronics
First iDM product combining
BorgWarner and Delphi Technologies portfolios
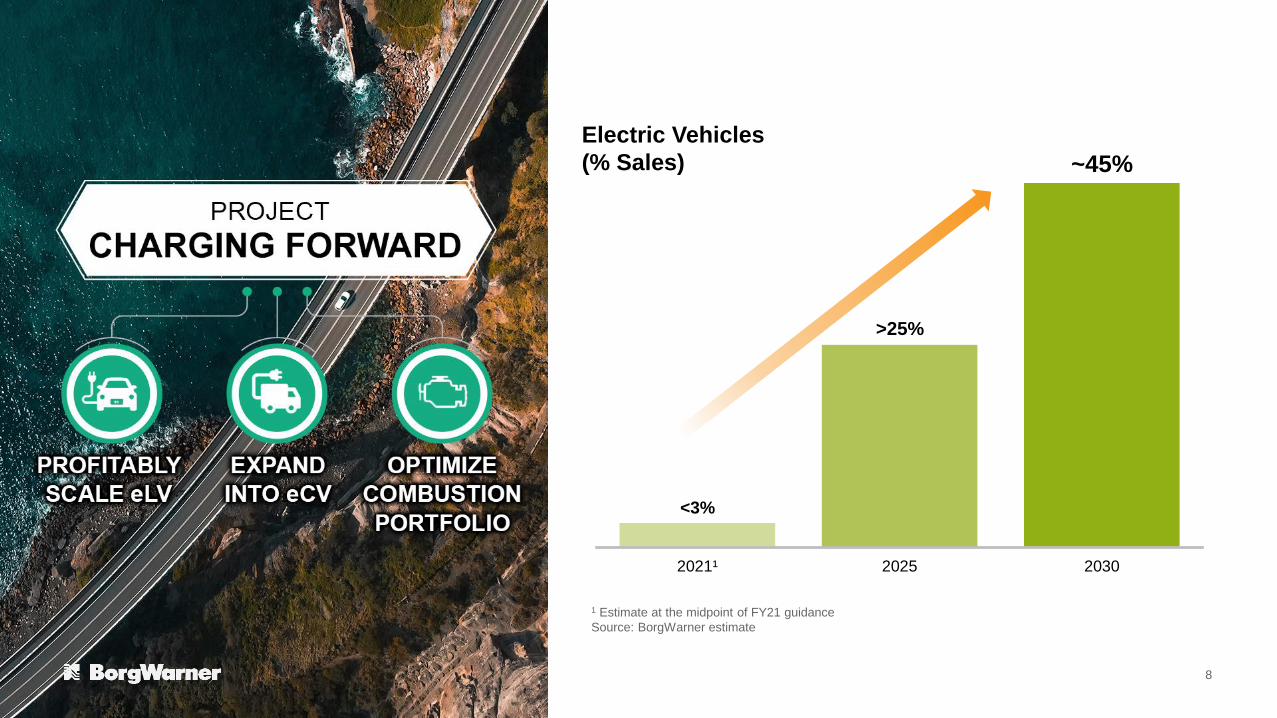
Electric Vehicles
(% Sales)
<3%
>25%
~45%
2021¹ 2025 2030
1 Estimate at the midpoint of FY21 guidance
Source: BorgWarner estimate
8
© BorgWarner Inc. 9
Achieved Great Place to Work-Certified™ Company Status
▪ Achieved status for 2nd consecutive year
▪ Great Place to Work is the global authority
on workplace culture
▪ Affirms leadership behaviors proven to
deliver market leading revenue and
increased innovation
▪ Certification validates positive work
environment
We continue to strive to be an employer of choice
© BorgWarner Inc. 10
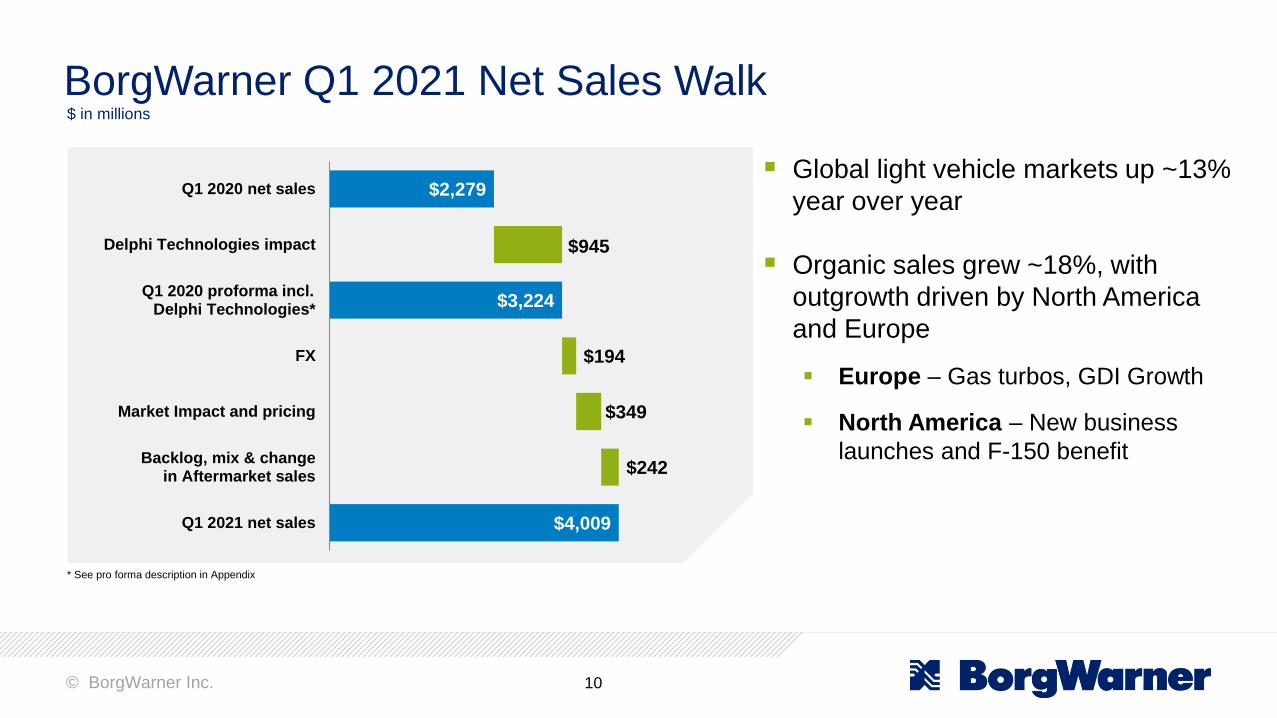
BorgWarner Q1 2021 Net Sales Walk
▪ Global light vehicle markets up ~13%
year over year
▪ Organic sales grew ~18%, with
outgrowth driven by North America
and Europe
▪ Europe – Gas turbos, GDI Growth
▪ North America – New business
launches and F-150 benefit
$2,279
$3,224
$4,009
$945
$194
$349
$242
Q1 2020 net sales
Delphi Technologies impact
Q1 2020 proforma incl. Delphi Technologies*
FX
Market Impact and pricing
Backlog, mix & change in Aftermarket sales
Q1 2021 net sales
$ in millions
* See pro forma description in Appendix
© BorgWarner Inc. 11
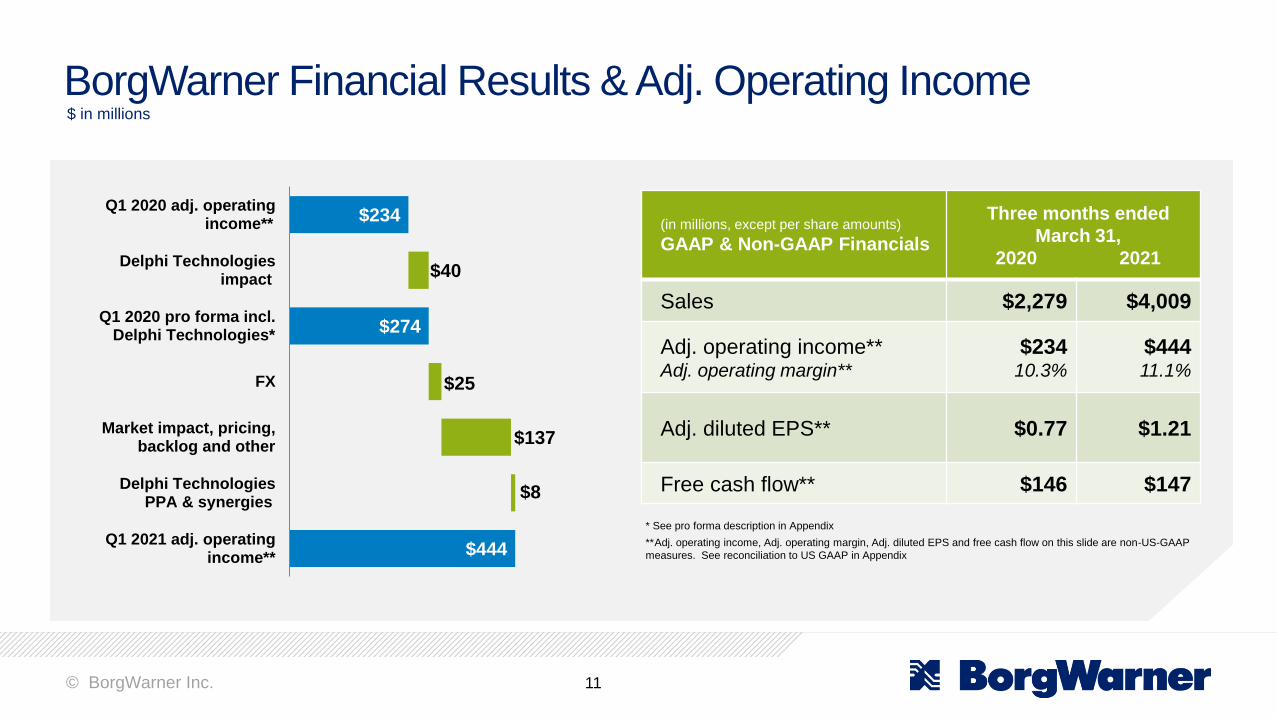
BorgWarner Financial Results & Adj. Operating Income
(in millions, except per share amounts)
GAAP & Non-GAAP Financials
Three months ended
March 31,
2020 2021
Sales $2,279 $4,009
Adj. operating income**Adj. operating margin**
$23410.3%
$44411.1%
Adj. diluted EPS** $0.77 $1.21
Free cash flow** $146 $147
$234
$274
$444
$40
$25
$137
$8
Q1 2020 adj. operating income**
Delphi Technologies impact
Q1 2020 pro forma incl. Delphi Technologies*
FX
Market impact, pricing, backlog and other
Delphi Technologies PPA & synergies
Q1 2021 adj. operating income**
$ in millions
* See pro forma description in Appendix
**Adj. operating income, Adj. operating margin, Adj. diluted EPS and free cash flow on this slide are non-US-GAAP
measures. See reconciliation to US GAAP in Appendix
© BorgWarner Inc. 12
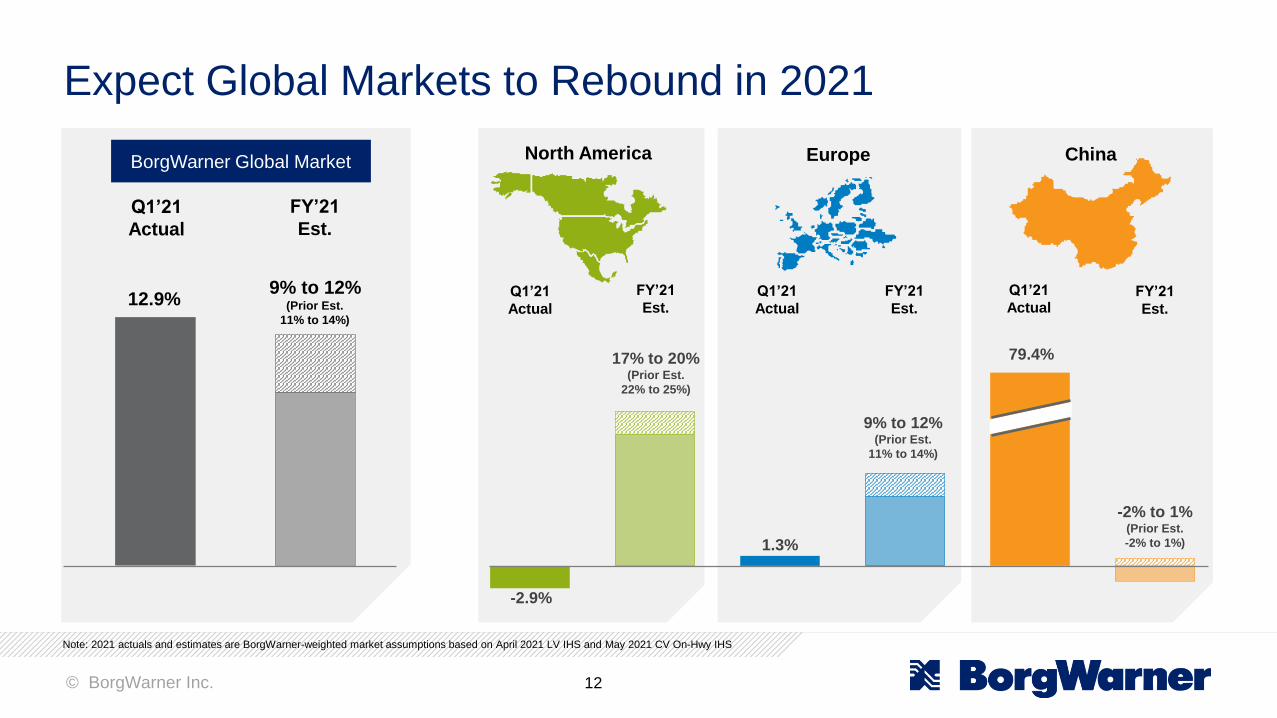
-2.9%
1.3%
79.4%
12.9%
BorgWarner Global Market
Q1’21
Actual
FY’21
Est.
Q1’21
Actual
FY’21
Est.
Q1’21
ActualFY’21
Est.
Q1’21
Actual
FY’21
Est.
North America ChinaEurope
Expect Global Markets to Rebound in 2021
9% to 12%(Prior Est.
11% to 14%)
17% to 20%(Prior Est.
22% to 25%)
-2% to 1%(Prior Est.
-2% to 1%)
9% to 12%(Prior Est.
11% to 14%)
Note: 2021 actuals and estimates are BorgWarner-weighted market assumptions based on April 2021 LV IHS and May 2021 CV On-Hwy IHS
© BorgWarner Inc. 13
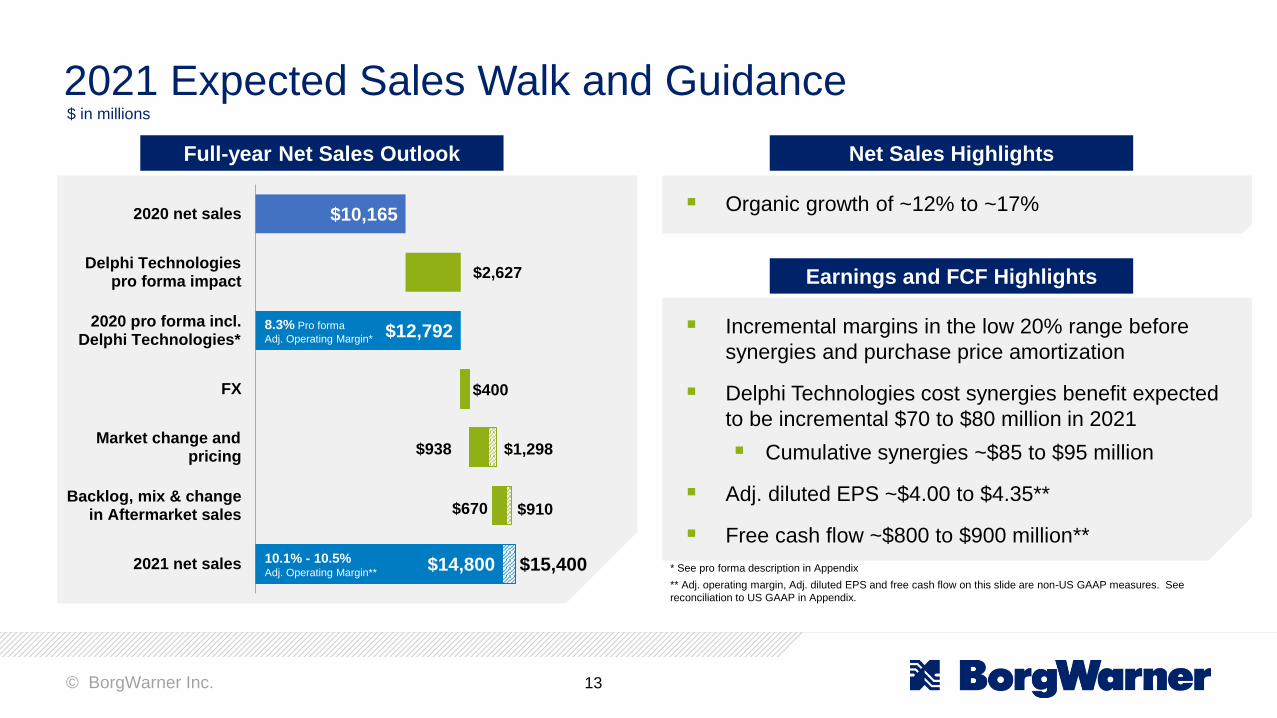
2021 Expected Sales Walk and Guidance$ in millions
Full-year Net Sales Outlook
$10,165
$12,792
$14,800
$2,627
$400
$938
$670
$15,400
$1,298
$910
2020 net sales
Delphi Technologies pro forma impact
2020 pro forma incl. Delphi Technologies*
FX
Market change and pricing
Backlog, mix & change in Aftermarket sales
2021 net sales
▪ Organic growth of ~12% to ~17%
Net Sales Highlights
▪ Incremental margins in the low 20% range before
synergies and purchase price amortization
▪ Delphi Technologies cost synergies benefit expected
to be incremental $70 to $80 million in 2021
▪ Cumulative synergies ~$85 to $95 million
▪ Adj. diluted EPS ~$4.00 to $4.35**
▪ Free cash flow ~$800 to $900 million**
Earnings and FCF Highlights
* See pro forma description in Appendix
** Adj. operating margin, Adj. diluted EPS and free cash flow on this slide are non-US GAAP measures. See
reconciliation to US GAAP in Appendix.
10.1% - 10.5%Adj. Operating Margin**
8.3% Pro forma
Adj. Operating Margin*
© BorgWarner Inc. 14
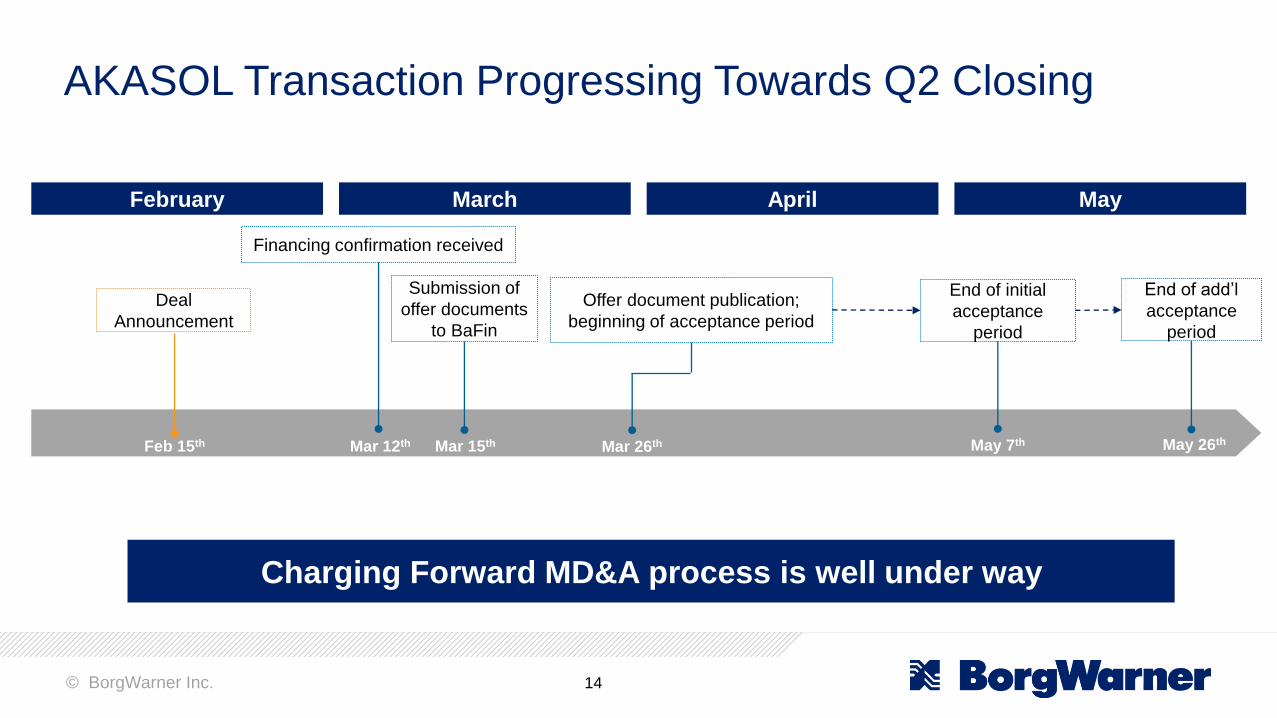
Submission of
offer documents
to BaFin
Deal
Announcement
Financing confirmation received
February March April May
Offer document publication;
beginning of acceptance period
End of initial
acceptance
period
End of add’l
acceptance
period
Feb 15th Mar 12th Mar 15th Mar 26th May 7th May 26th
Charging Forward MD&A process is well under way
AKASOL Transaction Progressing Towards Q2 Closing

© BorgWarner Inc. 15
May 5, 2021
Thank you!
15
© BorgWarner Inc. 16
Appendix
© BorgWarner Inc. 17
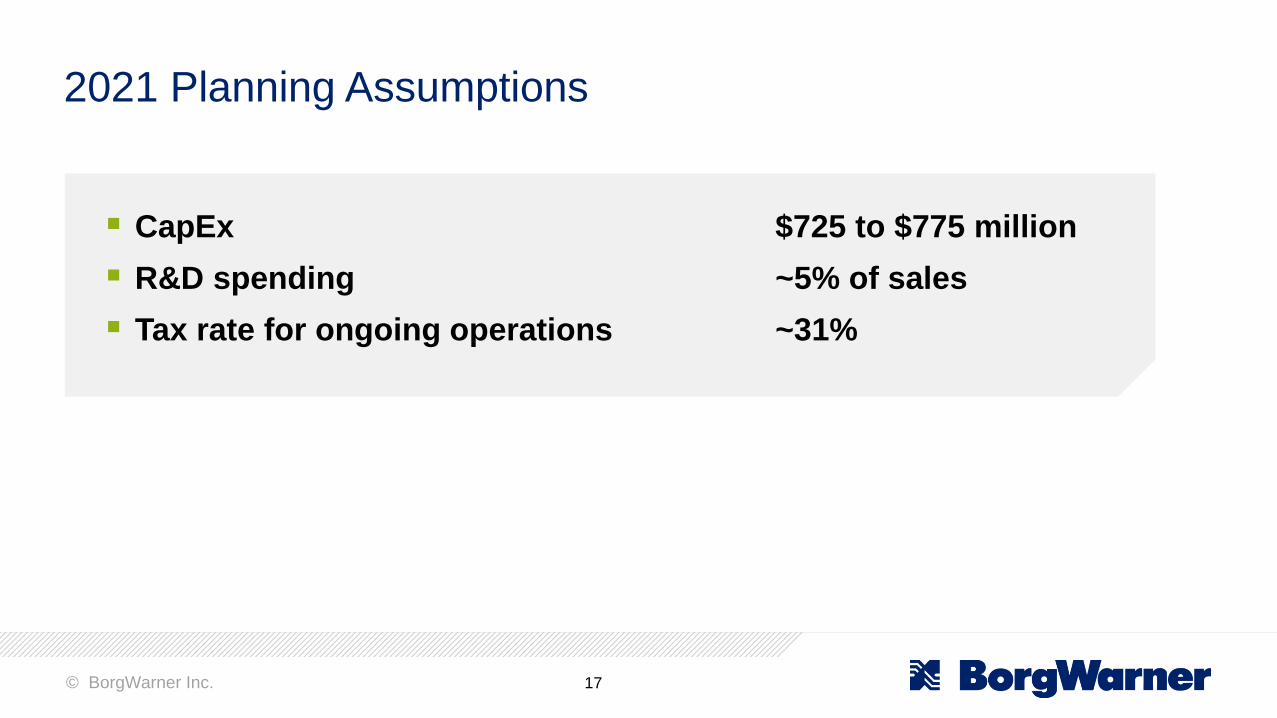
▪ CapEx $725 to $775 million
▪ R&D spending ~5% of sales
▪ Tax rate for ongoing operations ~31%
2021 Planning Assumptions
© BorgWarner Inc. 18
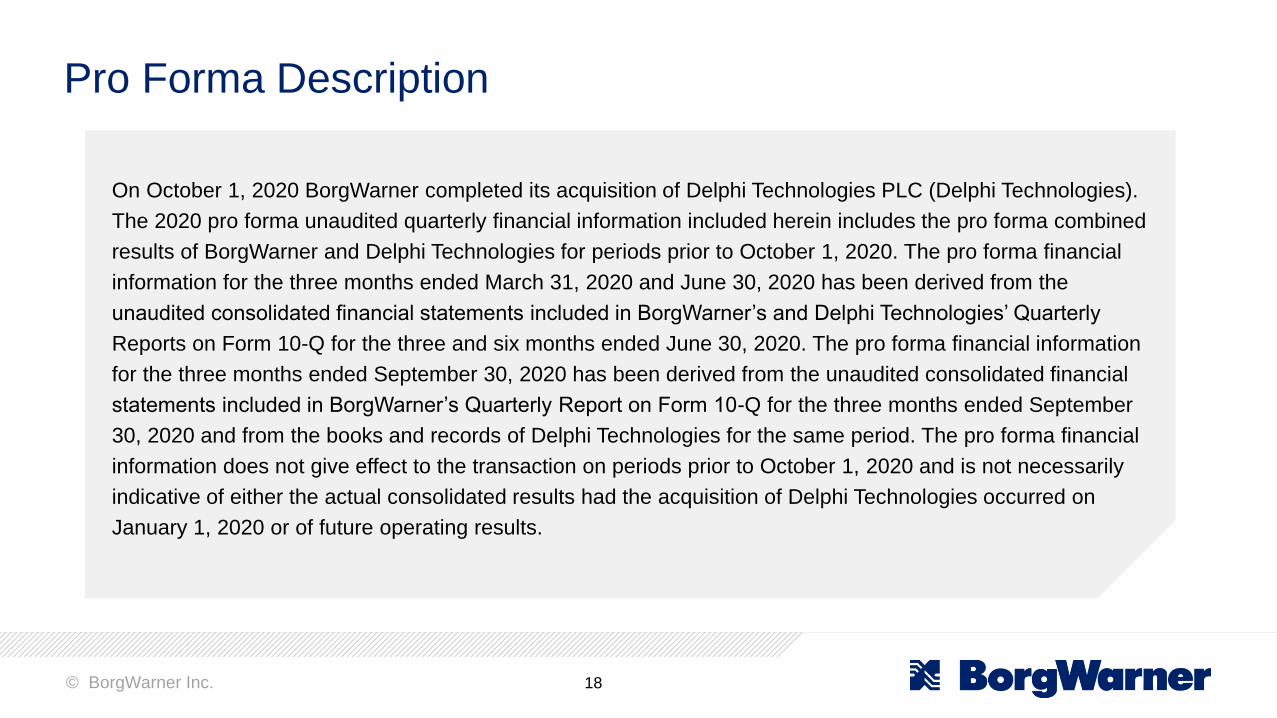
On October 1, 2020 BorgWarner completed its acquisition of Delphi Technologies PLC (Delphi Technologies).
The 2020 pro forma unaudited quarterly financial information included herein includes the pro forma combined
results of BorgWarner and Delphi Technologies for periods prior to October 1, 2020. The pro forma financial
information for the three months ended March 31, 2020 and June 30, 2020 has been derived from the
unaudited consolidated financial statements included in BorgWarner’s and Delphi Technologies’ Quarterly
Reports on Form 10-Q for the three and six months ended June 30, 2020. The pro forma financial information
for the three months ended September 30, 2020 has been derived from the unaudited consolidated financial
statements included in BorgWarner’s Quarterly Report on Form 10-Q for the three months ended September
30, 2020 and from the books and records of Delphi Technologies for the same period. The pro forma financial
information does not give effect to the transaction on periods prior to October 1, 2020 and is not necessarily
indicative of either the actual consolidated results had the acquisition of Delphi Technologies occurred on
January 1, 2020 or of future operating results.
Pro Forma Description
© BorgWarner Inc. 19
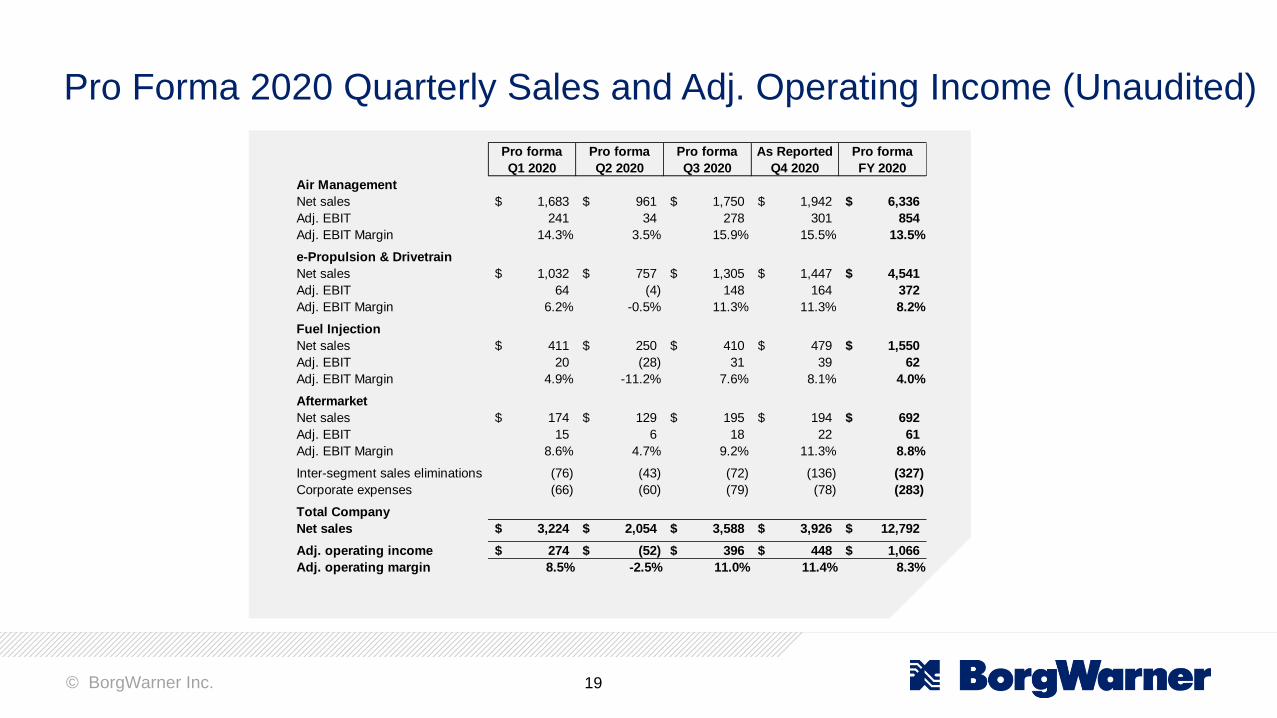
Pro Forma 2020 Quarterly Sales and Adj. Operating Income (Unaudited)
Pro forma
Q1 2020
Pro forma
Q2 2020
Pro forma
Q3 2020
As Reported
Q4 2020
Pro forma
FY 2020
Air Management
Net sales 1,683$ 961$ 1,750$ 1,942$ 6,336$
Adj. EBIT 241 34 278 301 854
Adj. EBIT Margin 14.3% 3.5% 15.9% 15.5% 13.5%
e-Propulsion & Drivetrain
Net sales 1,032$ 757$ 1,305$ 1,447$ 4,541$
Adj. EBIT 64 (4) 148 164 372
Adj. EBIT Margin 6.2% -0.5% 11.3% 11.3% 8.2%
Fuel Injection
Net sales 411$ 250$ 410$ 479$ 1,550$
Adj. EBIT 20 (28) 31 39 62
Adj. EBIT Margin 4.9% -11.2% 7.6% 8.1% 4.0%
Aftermarket
Net sales 174$ 129$ 195$ 194$ 692$
Adj. EBIT 15 6 18 22 61
Adj. EBIT Margin 8.6% 4.7% 9.2% 11.3% 8.8%
Inter-segment sales eliminations (76) (43) (72) (136) (327)
Corporate expenses (66) (60) (79) (78) (283)
Total Company
Net sales 3,224$ 2,054$ 3,588$ 3,926$ 12,792$
Adj. operating income 274$ (52)$ 396$ 448$ 1,066$
Adj. operating margin 8.5% -2.5% 11.0% 11.4% 8.3%
© BorgWarner Inc. 20
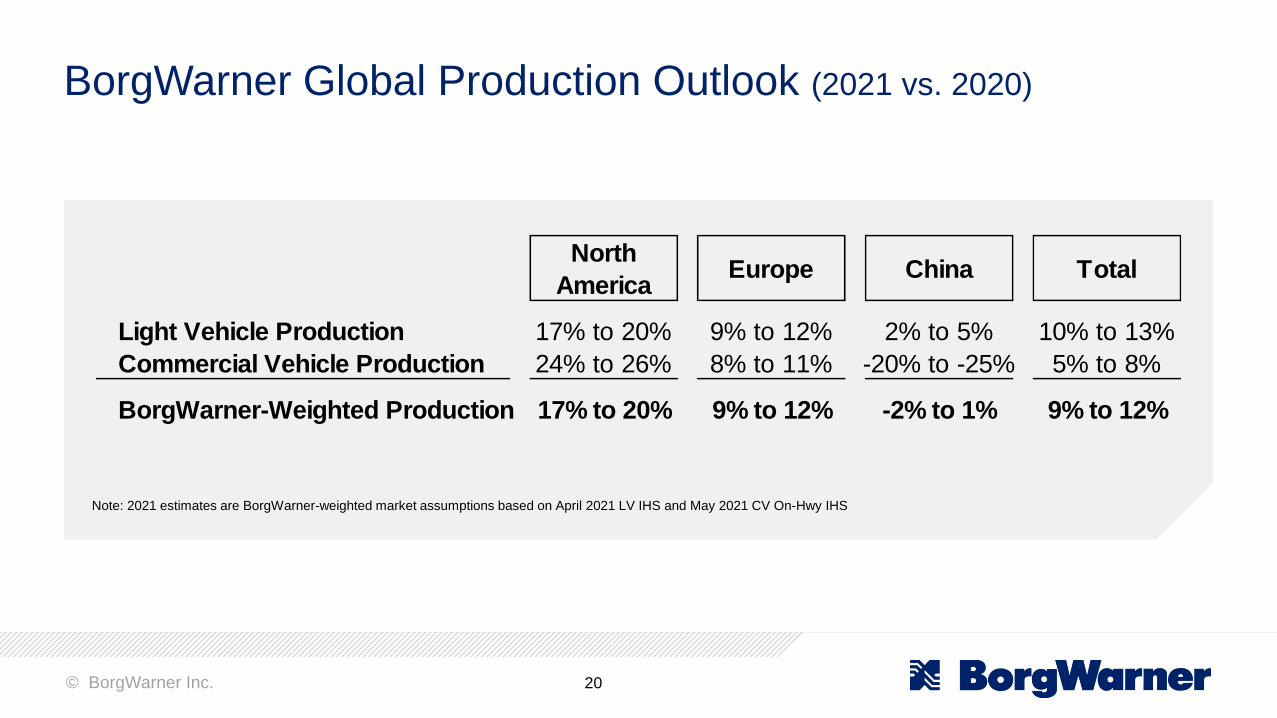
BorgWarner Global Production Outlook (2021 vs. 2020)
Note: 2021 estimates are BorgWarner-weighted market assumptions based on April 2021 LV IHS and May 2021 CV On-Hwy IHS
North
AmericaEurope China Total
Light Vehicle Production 17% to 20% 9% to 12% 2% to 5% 10% to 13%
Commercial Vehicle Production 24% to 26% 8% to 11% -20% to -25% 5% to 8%
BorgWarner-Weighted Production 17% to 20% 9% to 12% -2% to 1% 9% to 12%
© BorgWarner Inc. 21
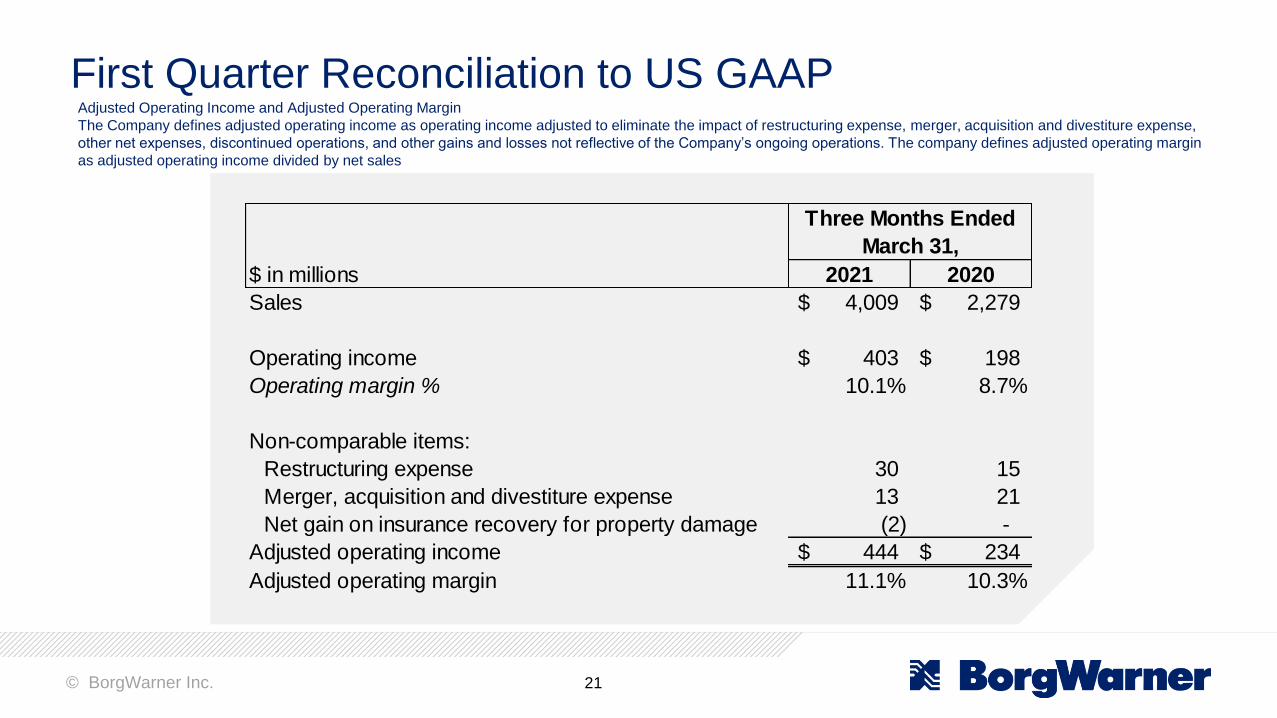
First Quarter Reconciliation to US GAAPAdjusted Operating Income and Adjusted Operating Margin
The Company defines adjusted operating income as operating income adjusted to eliminate the impact of restructuring expense, merger, acquisition and divestiture expense,
other net expenses, discontinued operations, and other gains and losses not reflective of the Company’s ongoing operations. The company defines adjusted operating margin
as adjusted operating income divided by net sales
$ in millions 2021 2020
Sales $ 4,009 $ 2,279
Operating income $ 403 $ 198
Operating margin % 10.1% 8.7%
Non-comparable items:
Restructuring expense 30 15
Merger, acquisition and divestiture expense 13 21
Net gain on insurance recovery for property damage (2) -
Adjusted operating income $ 444 $ 234
Adjusted operating margin 11.1% 10.3%
Three Months Ended
March 31,
© BorgWarner Inc. 22
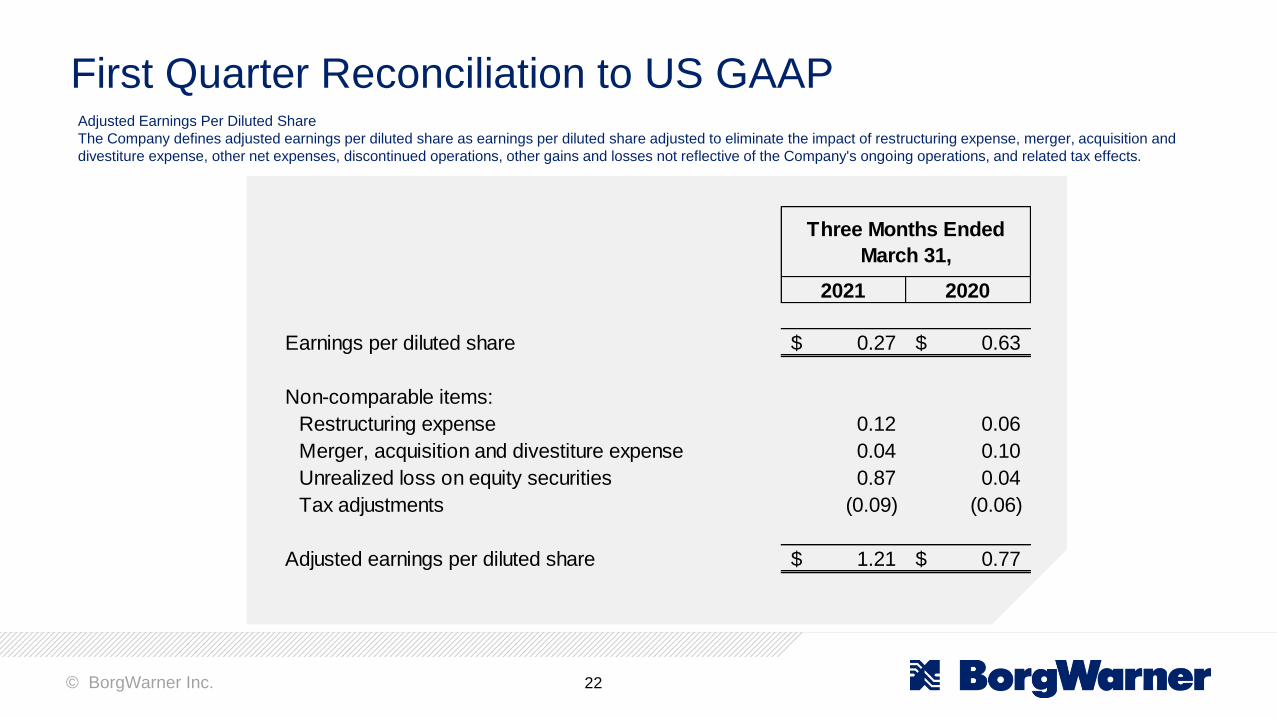
First Quarter Reconciliation to US GAAPAdjusted Earnings Per Diluted Share
The Company defines adjusted earnings per diluted share as earnings per diluted share adjusted to eliminate the impact of restructuring expense, merger, acquisition and
divestiture expense, other net expenses, discontinued operations, other gains and losses not reflective of the Company's ongoing operations, and related tax effects.
2021 2020
Earnings per diluted share 0.27$ 0.63$
Non-comparable items:
Restructuring expense 0.12 0.06
Merger, acquisition and divestiture expense 0.04 0.10
Unrealized loss on equity securities 0.87 0.04
Tax adjustments (0.09) (0.06)
Adjusted earnings per diluted share 1.21$ 0.77$
Three Months Ended
March 31,
© BorgWarner Inc. 23
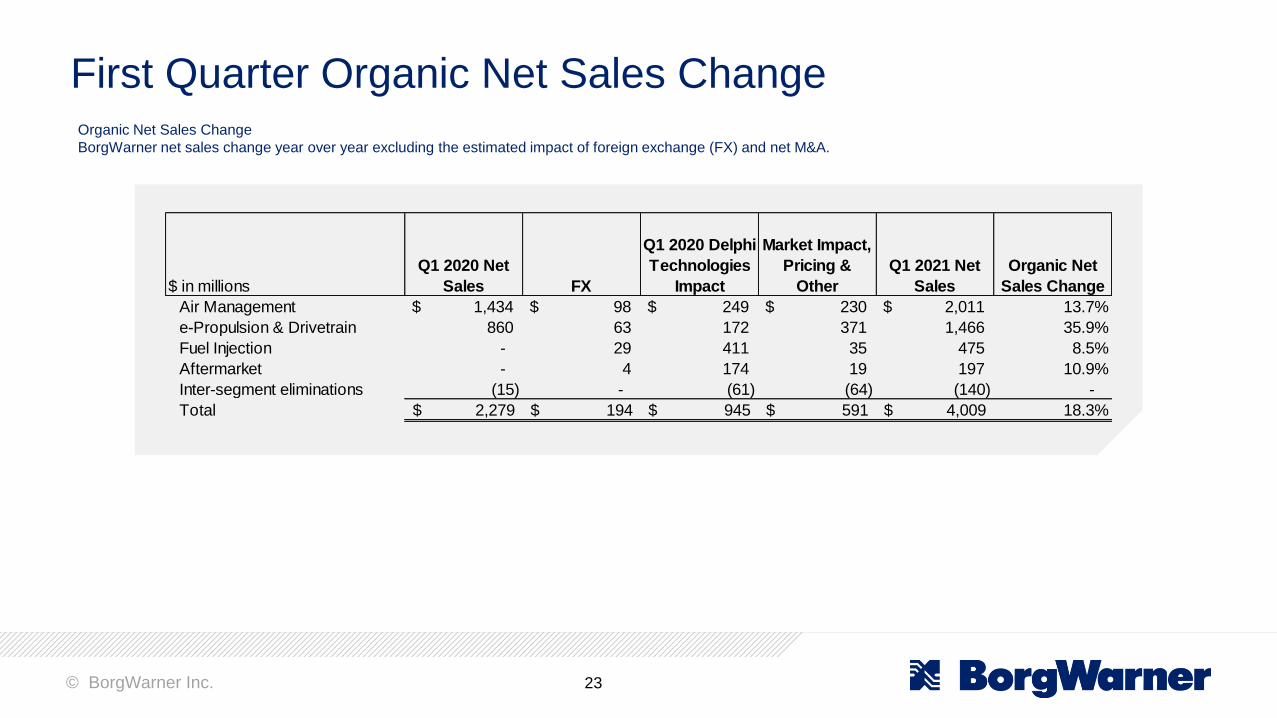
First Quarter Organic Net Sales ChangeOrganic Net Sales Change
BorgWarner net sales change year over year excluding the estimated impact of foreign exchange (FX) and net M&A.
$ in millions
Q1 2020 Net
Sales FX
Q1 2020 Delphi
Technologies
Impact
Market Impact,
Pricing &
Other
Q1 2021 Net
Sales
Organic Net
Sales Change
Air Management $ 1,434 $ 98 $ 249 $ 230 $ 2,011 13.7%
e-Propulsion & Drivetrain 860 63 172 371 1,466 35.9%
Fuel Injection - 29 411 35 475 8.5%
Aftermarket - 4 174 19 197 10.9%
Inter-segment eliminations (15) - (61) (64) (140) -
Total 2,279$ 194$ 945$ 591$ 4,009$ 18.3%
© BorgWarner Inc. 24
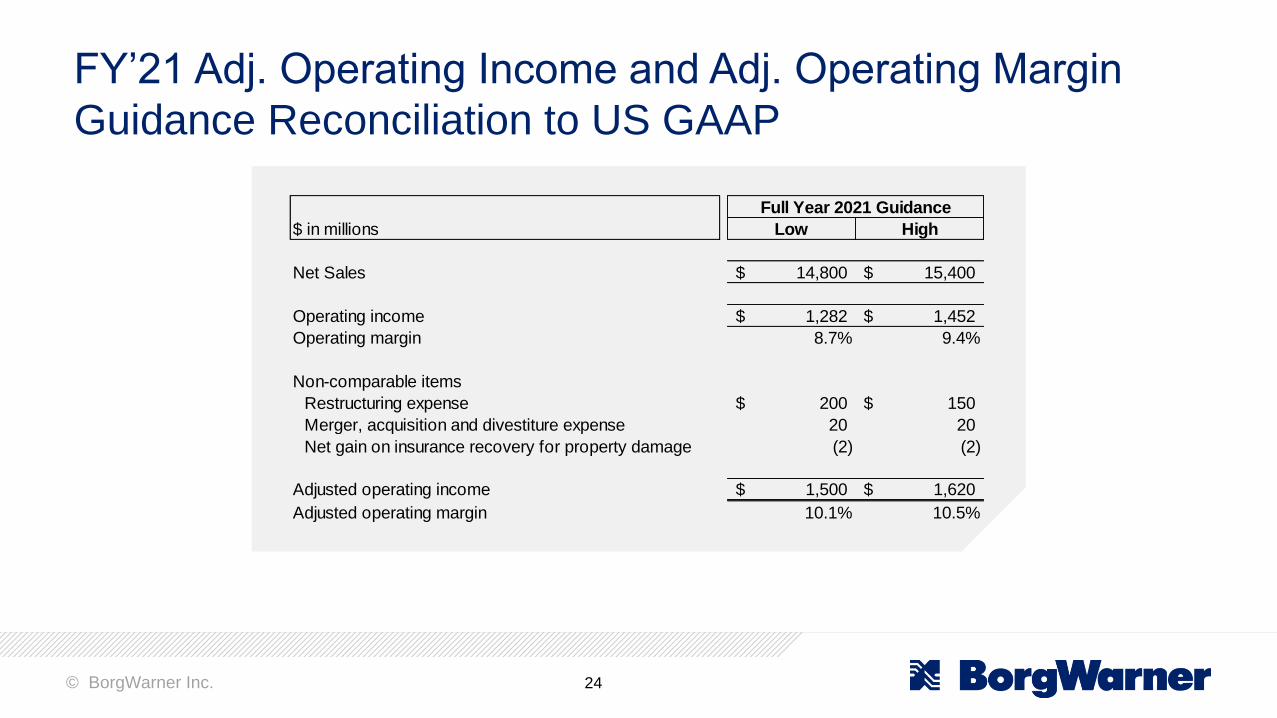
FY’21 Adj. Operating Income and Adj. Operating Margin
Guidance Reconciliation to US GAAP
Low High
Net Sales 14,800$ 15,400$
Operating income 1,282$ 1,452$
Operating margin 8.7% 9.4%
Non-comparable items
Restructuring expense 200$ 150$
Merger, acquisition and divestiture expense 20 20
Net gain on insurance recovery for property damage (2) (2)
Adjusted operating income 1,500$ 1,620$
Adjusted operating margin 10.1% 10.5%
$ in millions
Full Year 2021 Guidance
© BorgWarner Inc. 25
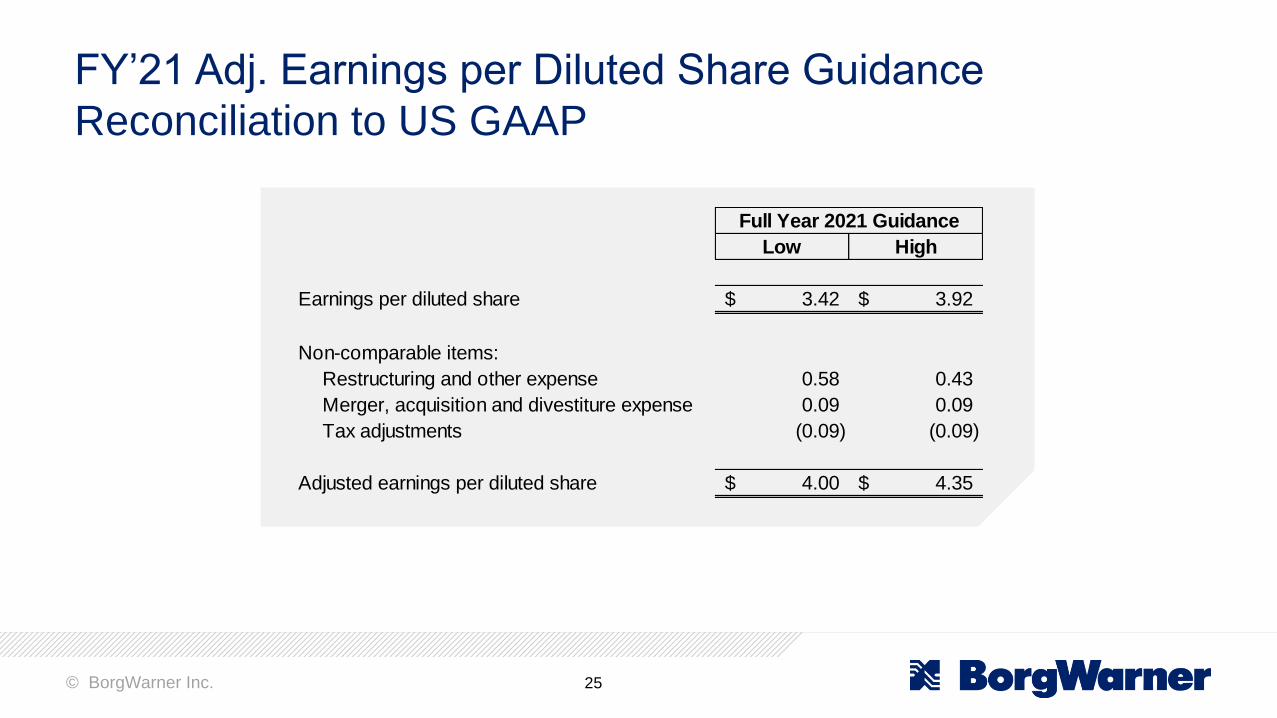
FY’21 Adj. Earnings per Diluted Share Guidance
Reconciliation to US GAAP
Low High
Earnings per diluted share 3.42$ 3.92$
Non-comparable items:
Restructuring and other expense 0.58 0.43
Merger, acquisition and divestiture expense 0.09 0.09
Tax adjustments (0.09) (0.09)
Adjusted earnings per diluted share 4.00$ 4.35$
Full Year 2021 Guidance
© BorgWarner Inc. 26
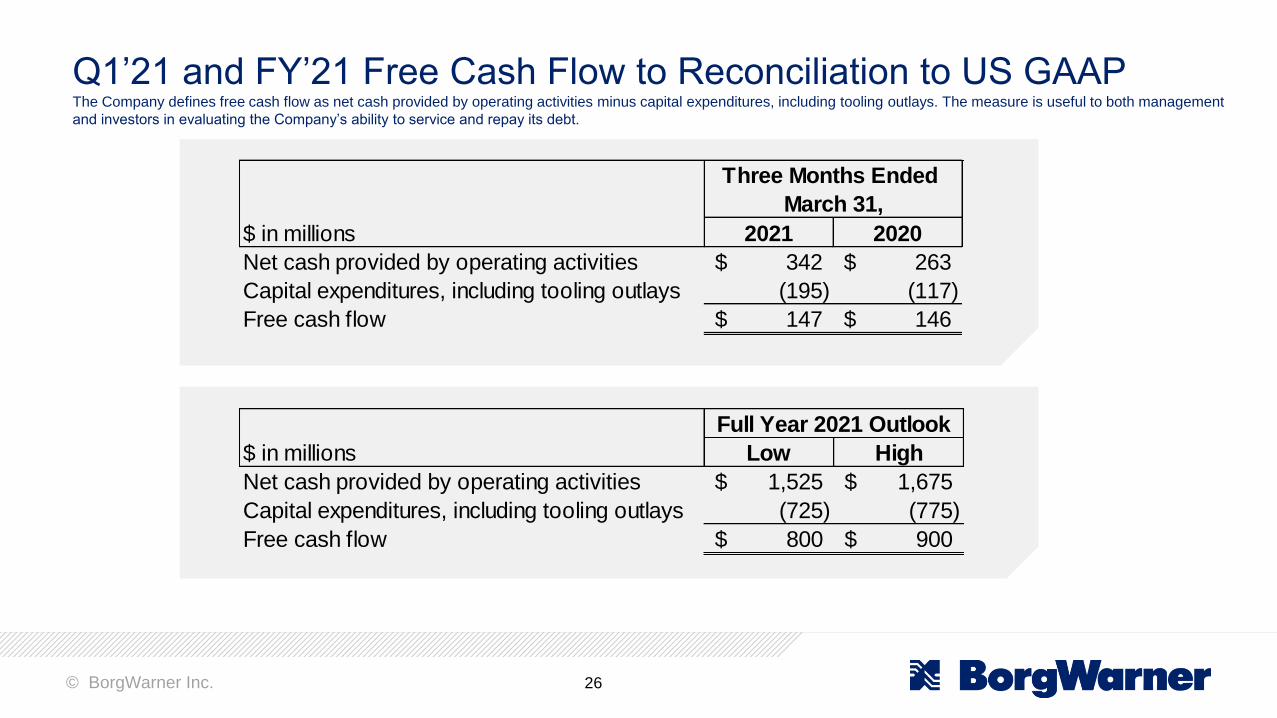
Q1’21 and FY’21 Free Cash Flow to Reconciliation to US GAAPThe Company defines free cash flow as net cash provided by operating activities minus capital expenditures, including tooling outlays. The measure is useful to both management
and investors in evaluating the Company’s ability to service and repay its debt.
Low High
Net cash provided by operating activities 1,525$ 1,675$
Capital expenditures, including tooling outlays (725) (775)
Free cash flow 800$ 900$
$ in millions
Full Year 2021 Outlook
2021 2020
Net cash provided by operating activities 342$ 263$
Capital expenditures, including tooling outlays (195) (117)
Free cash flow 147$ 146$
$ in millions
Three Months Ended
March 31,
© BorgWarner Inc. 27
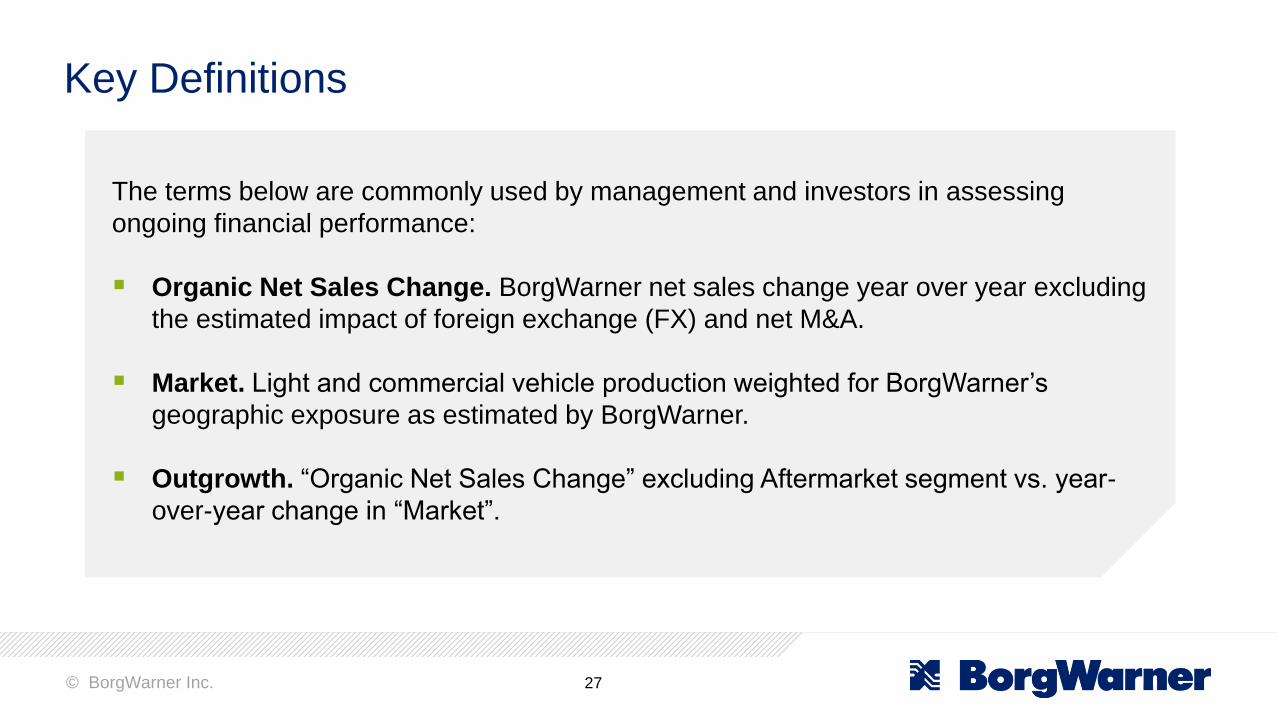
The terms below are commonly used by management and investors in assessing
ongoing financial performance:
▪ Organic Net Sales Change. BorgWarner net sales change year over year excluding
the estimated impact of foreign exchange (FX) and net M&A.
▪ Market. Light and commercial vehicle production weighted for BorgWarner’s
geographic exposure as estimated by BorgWarner.
▪ Outgrowth. “Organic Net Sales Change” excluding Aftermarket segment vs. year-
over-year change in “Market”.
Key Definitions