EARNINGS ANNOUNCEMENT - Emitentes
14
EARNINGS ANNOUNCEMENT 30 JUNE 2018
Transcript of EARNINGS ANNOUNCEMENT - Emitentes

EARNINGS ANNOUNCEMENT 30 JUNE 2018
EARNINGS ANNOUNCEMENT 30 JUNE 2018
Pag. 2
1. CEO’S MESSAGE AND MAIN HIGHLIGHTS
“Sonae Capital presented a positive operating performance in the first half of 2018.
We remained focused in the strengthening of our Business Units, both in terms of growth and value creation, closing the semester with an EBITDA margin of 8.7%, approximately 70 basis points above the same period of 2017.
In the real estate business, we fulfilled very significant objectives, especially with the closing of the promissory purchase and sale agreement of UNOP 3, in Tróia, in the amount of 20M€. Also in Tróia, but in the residential touristic units’ area, as well as in the remaining assets’ area, both the amount of sales deeds signed and the promissory purchase and sale agreements in place continued to evolve in line with expectations.
As a result, on a consolidated basis, turnover kept the positive trend of the previous quarters and reached 92.6M€, 27.8% above the same period of 2017 while, at the same time, the operating profitability grew to 6.7M€, an increase of 21.7% strongly backed by a 40.6% growth in the profitability of the Business Units. In the meantime, we continued investing in our businesses and Capex reached 19.7M€ in the first half of 2018. The operating cash-flow generated, coupled with the level of investment and the dividends distributed in the amount of 15M€, kept debt at a controlled level, and an adequate capital structure when considering the Group’s portfolio of businesses and real estate assets held: in which Net Debt to EBITDA stood at 2.8x and Loan-to-Value reached 21.7%.
This semester I end my collaboration with Sonae Capital in the quality of CEO. I truly believe that the path drawn so far, which is anchored in the values that have been part of this Group’s DNA for many decades, allowed the creation of a company with a renewed portfolio, a stronger company, always based on the premise that one can not grow and create shareholder value without, at the same time, create economic and social value.”
Cláudia Azevedo
“I am very proud to continue to collaborate with Sonae Capital, now as CEO. We believe in the strategy that has been implemented and we will strive to deserve the confidence of our stakeholders, knowing in advance that we count with the adequate resources to face the challenges ahead.”
Miguel Gil Mata
1H18 MAIN HIGHLIGHTS
Maintenance of the positive trend in Business Units turnover (+29.4%) and improvement of the
operating profitability (+40.6%), with the positive contribution of almost all the segments, namely:
o Fitness segment, showing a strong turnover and EBITDA performance (growth of 54.5%
and 94.6%, respectively), backed by organic and non-organic growth;
o Energy segment, increasing turnover and operating profitability, benefiting with the
operations acquired in 2017;
o Hospitality segment, posting a RevPAR increase of 12.6% in 1H18, and an EBITDA of 0.5M€
in 2Q18, 73.1% above 2Q17. EBITDA of Porto Palácio Hotel positive in 1H18;
In the Real Estate Business:
o Troia Resort: (i) PPSA of UNOP 3 in the amount of 20M€ (not yet reflected in 1H18 results);
and, (ii) 19 deeds of residential touristic units in Tróia, in the amount of 7.1M€, plus 11
contracts in Reserve / PPSA, for a total amount of 5.2M€, at the date of this report;
o Other Real Estate Assets: PPSAs of 4.4M€ in addition to sale and purchase deeds signed
in the amount of 1.2M€, at the date of this report.
Operational improvement recorded in the majority of businesses not yet seen in Net results, due
to non-recurrent costs in 1H18, including the estimate of the closing of RACE Brazil, and due to
higher Amortizations, consequence of the new operations in the portfolio;
Net Debt of 144.4M€, driven by: (i) dividends paid in May 2018 (totalling 15M€); (ii) the payment
of a deferred component in the amount of 9M€, related to the acquisitions completed in 2Q17 in
the Energy segment; and, (iii) the investments made (amounting to 19.7M€), in which the
acquisition of Pump Fitness chain and the beginning of a biomass-fuelled cogeneration project
development are included;
Capital structure under control and adequate when considering the Group’s portfolio of
businesses and real estate assets held: Net Debt to EBITDA of 2.8x and LTV of 21.7%.

EARNINGS ANNOUNCEMENT 30 JUNE 2018
Pag. 3
2. OVERALL PERFORMANCE
2.1. PROFIT AND LOSS STATEMENT
Business Units’ turnover stood at 84.8M€ in 1H18, showing an increase of 29.4% y.o.y.. In the
same period, consolidated turnover reached 92.6M€, which represents an increase of 27.8%
compared to 1H17, a positive evolution driven by the performance of the Business Units and the
Real Estate business.
In 1H18, Business Units’ EBITDA grew to 7.3M€, 40.6% above 1H17, equivalent to an EBITDA margin of 8.7%, 0.7pp above the 1H17. The consolidated EBITDA increased 21.7%, to 6.7M€,
generating an EBITDA margin of 7.2%, 0.4pp below 1H17, driven mostly by the Real Estate
business.
Net results (continued businesses) stood at negative 8.0M€, which represents a decrease of
4.7M€ when compared to the same period of 2017. Notwithstanding the EBITDA increase
(+1.2M€), Net Results were primarily impacted by: (i) an increase in Amortization & Depreciation
line (+3.2M€), driven by the acquisitions made in Energy and Fitness segments; (ii) non-
recurrent costs in the amount of 0.7M€, impacted mostly by staff restructuring costs and an
impairment related to a business carried out by RACE Brazil, as reported in 1Q18; and, (iii) the
recognition, in 1H17, of Badwill in the amount of 1.8M€, consequence of the operations acquired
in the Energy segment.
Consolidated Profit and Loss Account
Million euro 2Q 2018 2Q 2017 D 18/17 1H 2018 1H 2017 D 18/17
Turnover
Business Units 45.69 35.71 +27.9% 84.76 65.52 +29.4%
Energy 13.64 11.58 +17.8% 25.55 21.37 +19.5%
Industrial Engineering 3.03 - - 6.36 - -
Fitness 8.80 5.60 +57.1% 17.74 11.48 +54.5%
Hospitality 6.39 5.92 +7.9% 9.25 8.68 +6.5%
Refrigeration & HVAC 11.27 9.91 +13.8% 22.06 20.13 +9.6%
Troia Resort - Operations 2.55 2.70 -5.4% 3.81 3.86 -1.4%
Real Estate Assets 6.14 6.46 -5.1% 10.68 9.91 +7.8%
Troia Resort 3.72 4.42 -15.9% 6.59 5.74 +14.8%
Other Real Estate Assets 2.42 2.04 +18.5% 4.09 4.17 -1.8%
Eliminations & Adjustments -1.60 -1.73 +7.9% -2.89 -3.03 +4.7%
Consolidated Turnover 50.23 40.44 +24.2% 92.55 72.40 +27.8%
Other Operational Income 1.18 1.24 -4.2% 1.81 1.90 -4.9%
Total Operational Income 51.42 41.68 +23.4% 94.36 74.30 +27.0%
EBITDA
Business Units 5.35 4.34 +23.3% 7.34 5.22 +40.6%
Energy 3.89 3.58 +8.8% 7.08 5.68 +24.6%
Industrial Engineering -0.26 - - -0.47 - -
Fitness 1.37 0.41 >100% 2.54 1.30 +94.6%
Hospitality 0.48 0.28 +73.1% -0.97 -1.22 +21.1%
Refrigeration & HVAC 0.16 -0.28 - 0.09 -0.01 -
Troia Resort - Operations -0.30 0.35 - -0.92 -0.53 -73.0%
Real Estate Assets -0.02 1.51 - 0.53 2.02 -73.9%
Troia Resort -0.91 -0.38 <-100% -0.99 -0.49 <-100%
Other Real Estate Assets 0.89 1.89 -52.9% 1.51 2.51 -39.8%
Eliminations & Adjustments -0.69 -0.72 +3.2% -1.16 -1.73 +33.1%
Consolidated EBITDA 4.63 5.13 -9.7% 6.71 5.51 +21.7%
Amortization & Depreciation 5.65 4.16 +35.8% 11.47 8.23 +39.3%
Provisions & Impairment Losses -0.05 0.03 - 0.08 -0.26 -
Non-recurrent costs/income (1) 0.04 -0.16 - 0.72 0.08 >100%
EBIT
Business Units 1.51 2.33 -35.1% -1.02 0.95 -
Real Estate Assets -0.87 0.60 - -2.02 -0.66 <-100%
Eliminations & Adjustments -1.65 -1.82 +9.6% -2.53 -2.83 +10.5%
Consolidated EBIT -1.01 1.10 - -5.57 -2.54 <-100%
Net Financial Expenses -0.89 -1.06 +15.9% -2.00 -2.05 +2.6%
Investment Income and Results from Assoc. Undertakings 0.02 1.93 -98.9% 0.22 2.00 -89.0%
EBT -1.88 1.96 - -7.35 -2.59 <-100%
Taxes -0.29 -0.47 +38.4% -0.66 -0.75 +11.8%
Net Profit - Continued Businesses -2.17 1.50 - -8.00 -3.33 <-100%
Net Profit - Discontinued Businesses -0.02 -0.58 +95.7% -2.05 -0.60 <-100%
Net Profit - Total -2.19 0.92 - -10.06 -3.93 <-100%
Attributable to Equity Holders of Sonae Capital -2.46 0.57 - -9.93 -4.48 <-100%
Attributable to Non-Controlling Interests 0.27 0.34 -21.0% -0.13 0.55 -
(1) Non-recurrent items mainly related to restructuring costs and one-off income

EARNINGS ANNOUNCEMENT 30 JUNE 2018
Pag. 4
Net results (discontinued businesses) show, as already reported, the recognition of costs related
to the discontinuation of RACE’s Brazilian operation, in the amount of 2.0M€
Therefore, consolidated net results stood at negative 10.1M€.
2.2. CAPITAL STRUCTURE
Capex stood at 19.7M€ in 1H18, mostly
a consequence of the
investments made in
Fitness segment
(acquisition of Pump Fitness chain in the
amount of 8.4M€) and
in the Energy
segment (beginning
of the biomass-fuelled
cogeneration project
development in the
amount of 6.4M€).
Levered Free Cash Flow reached negative 20.3M€ at the end of June 2018 (before the payment of dividends), an output of the above-mentioned investments, coupled with the payment of a
deferred component of 9M€, related to the acquisitions made in the Energy segment in 2Q17.
Consequence of the Capex registered (19.7M€), the dividends paid, in the amount of 15M€, on May
2018, and the payment of a 9M€ tranche, as previously explained, Net Debt has shown an increase
versus the end of 2017, reaching 144.4M€. We continue to maintain an adequate capital structure
when considering the Group’s portfolio of businesses and real estate assets held: Net Debt to
EBITDA of 2.8% and LTV of 21.7%.
Net capital employed increased by 1.4% when compared to the end of 2017, to 406.5M€, motivated by an increase in fixed assets and working capital.
Following the Net Debt and Total Equity evolution, Debt to Equity reached 55.1%, +17.6pp when compared to 2017 year-end.
Million euro Jun 2018 Dec 2017 D 18/17
Net Capital Employed 406.5 400.7 +1.4%
Fixed Assets 328.8 322.6 +1.9%
Non-Current Investments (net) 6.1 8.6 -29.3%
Working Capital 75.1 71.8 +4.5%
Capex (end of period) 19.7 61.6 -68.1%
% Fixed Assets 6.0% 19.1% -13.1pp
Net Debt 144.4 109.4 +32.0%
% Net Capital Employed 35.5% 27.3% +8.2pp
Debt to Equity 55.1% 37.5% +17.6pp
Capital Structure Ratios
Loan to Value (Real Estate) 21.7% 15.9% +5.8pp
Net Debt/EBITDA (recurrent) 2.84x 2.57x +10.5%
Capital Structure/Capex/Ratios

EARNINGS ANNOUNCEMENT 30 JUNE 2018
Pag. 5
3. BUSINESS UNITS
3.1. ENERGY
In 1H18, Energy turnover reached 25.6M€, 19.5% above the same period of 2017, much because of
the contribution of the operations acquired in 2017, which had a turnover of 5.4M€ in 1H18 (+4.3M€
vs. 1H17).
EBITDA stood at 7.1M€, performing a growth of 24.6% y.o.y. and generating an EBITDA margin of
27.7%, +1.1pp above 1H17. It should be highlighted that operating profitability kept the positive
trend of the previous quarters, notwithstanding the impact of CO2 prices and the reduced solar
resource during the period. The EBITDA contribution of the operations acquired was paramount
for the performance of the semester, reaching 3.0M€ in 1H18 (+2.0M€ vs 1H17).
EBIT registered a decrease of 25.4% due to higher Amortization & Depreciation, fully driven by
the operations acquired in 2017.
Capex stood at 7.2M€, greatly because of the beginning of the development of a new biomass-
fuelled cogeneration power plant, announced in 4Q17, which is expected to start operating in
2H19.
Currently, all the projects of the segment operate in regulated market. The first project to be
carried over the free market corresponds to 10MW (solar energy), which will take place in 2H21.
Million euro 2Q 2018 2Q 2017 D 18/17 1H 2018 1H 2017 D 18/17
Total Operational Income 14.06 11.66 +20.6% 26.17 21.59 +21.2%
Turnover 13.64 11.58 +17.8% 25.55 21.37 +19.5%
Other Operational Income 0.41 0.08 >100% 0.62 0.22 >100%
Total Operational Costs -10.16 -8.08 -25.8% -19.09 -15.91 -20.0%
Cost of Goods Sold -7.12 -6.09 -17.0% -13.35 -11.81 -13.0%
External Supplies and Services -1.58 -1.11 -42.4% -3.09 -2.43 -27.4%
Staff Costs -0.75 -0.58 -29.1% -1.51 -1.17 -29.8%
Other Operational Expenses -0.72 -0.31 <-100% -1.14 -0.51 <-100%
EBITDA 3.89 3.58 +8.8% 7.08 5.68 +24.6%
EBITDA Margin (% Turnover) 28.5% 30.9% -2.4pp 27.7% 26.6% +1.1pp
EBIT 1.70 2.40 -29.4% 2.58 3.46 -25.4%
EBIT Margin (% Turnover) 12.4% 20.8% -8.3pp 10.1% 16.2% -6.1pp
Capex 1.57 34.88 -95.5% 7.15 38.41 -81.4%
EBITDA-Capex 2.32 -31.30 - -0.08 -32.73 +99.8%
Total Capacity (MW) 65.5 72.5 -9.7% 65.5 72.5 -9.7%
Owned & Operated 62.3 62.3 -0.1% 62.3 62.3 -0.1%
Operated (not consolidated) 3.2 10.2 -68.6% 3.2 10.2 -68.6%
Profit and Loss Account - Energy

EARNINGS ANNOUNCEMENT 30 JUNE 2018
Pag. 6
3.2. INDUSTRIAL ENGINEERING
The Industrial Engineering segment includes Adira, a company acquired in July 2017; throughout
1H18, we kept focused in the investment on a structure of adequate and sufficient resources for
the implementation with success of the growth strategy set. We would like to stress the recent
achievements in the operational areas.
Therefore, 1H18 results are still impacted by the ongoing restructuring process, namely in the suitability to the processes of the Group.
Although not visible in terms of results, the number of machines continued to evolve positively, totalling 88 in 1H18 (42 machines in 1Q18 and 46 machines in 2Q18, respectively). In addition, it
should be noted the positive evolution in orders backlog.
This segment’s contribution to the consolidated results reached 6.4M€ and negative 0.5M€ at turnover and EBITDA, respectively.
3.3. FITNESS
The Fitness segment was able to reinforce, once again, its competitive position, and continued to
show positive operating and financial results. At the end of 1H18, the consolidation of Solinca and
Pump operations led the average number of active members to 84,722, more than 70% above the
same period of 2017. At the same time, turnover in the period grew by 54.5% (which include a
growth of 1% on average membership fees on a like-for-like basis).
Million euro 2Q 2018 2Q 2017 D 18/17 1H 2018 1H 2017 D 18/17
Total Operational Income 3.17 - - 6.62 - -
Turnover 3.03 - - 6.36 - -
Other Operational Income 0.14 - - 0.27 - -
Total Operational Costs -3.43 - - -7.10 - -
Cost of Goods Sold -1.82 - - -4.01 - -
External Supplies and Services -0.56 - - -0.93 - -
Staff Costs -0.94 - - -1.90 - -
Other Operational Expenses -0.11 - - -0.26 - -
EBITDA -0.26 - - -0.47 - -
EBITDA Margin (% Turnover) -8.4% - - -7.5% - -
EBIT -0.49 - - -0.94 - -
EBIT Margin (% Turnover) -16.1% - - -14.7% - -
Capex 0.19 - - 0.44 - -
EBITDA-Capex -0.45 - - -0.91 - -
Profit and Loss Account - Industrial Engineering
Million euro 2Q 2018 2Q 2017 D 18/17 1H 2018 1H 2017 D 18/17
Total Operational Income 9.15 5.65 +62.0% 18.15 11.60 +56.5%
Turnover 8.80 5.60 +57.1% 17.74 11.48 +54.5%
Other Operational Income 0.36 0.05 >100% 0.41 0.12 >100%
Total Operational Costs -7.78 -5.24 -48.5% -15.61 -10.29 -51.7%
Cost of Goods Sold -0.03 -0.04 +27.1% -0.09 -0.09 -5.3%
External Supplies and Services -4.63 -3.30 -40.4% -9.24 -6.27 -47.3%
Staff Costs -2.80 -1.71 -63.4% -5.52 -3.44 -60.5%
Other Operational Expenses -0.33 -0.19 -70.7% -0.76 -0.50 -52.9%
EBITDA 1.37 0.41 >100% 2.54 1.30 +94.6%
EBITDA Margin (% Turnover) 15.5% 7.3% +8.3pp 14.3% 11.4% +2.9pp
EBIT 0.62 0.13 >100% 0.71 0.57 +25.1%
EBIT Margin (% Turnover) 7.1% 2.2% +4.9pp 4.0% 4.9% -0.9pp
Capex 1.25 0.45 >100% 10.83 0.98 >100%
EBITDA-Capex 0.12 -0.04 - -8.29 0.33 -
# Health Clubs in Operation 29 17 +12 29 17 +12
Profit and Loss Account - Fitness
EARNINGS ANNOUNCEMENT 30 JUNE 2018
Pag. 7
We ended the 1H18 with 29 clubs in operation: 20 Solinca clubs and 9 Pump clubs. Throughout
the coming quarters, we will continue working in order to expand our position in the Fitness
market, in both segments.
Fitness EBITDA reached 2.5M€ in 1H18, 94.6% above 1H17, generating an EBITDA margin of 14.3%,
2.9pp above 1H17.
EBIT stood at 0.7M€, a value that compares with 0.6M€ in 1H17. As previously reported, EBIT in
1H18 was negatively impacted by the registration of an impairment of approximately 0.3M€, driven
by the discontinuation of the Crossfit operation in “Cascais”, whose profitability was not in line
with expectations.
3.4. HOSPITALITY
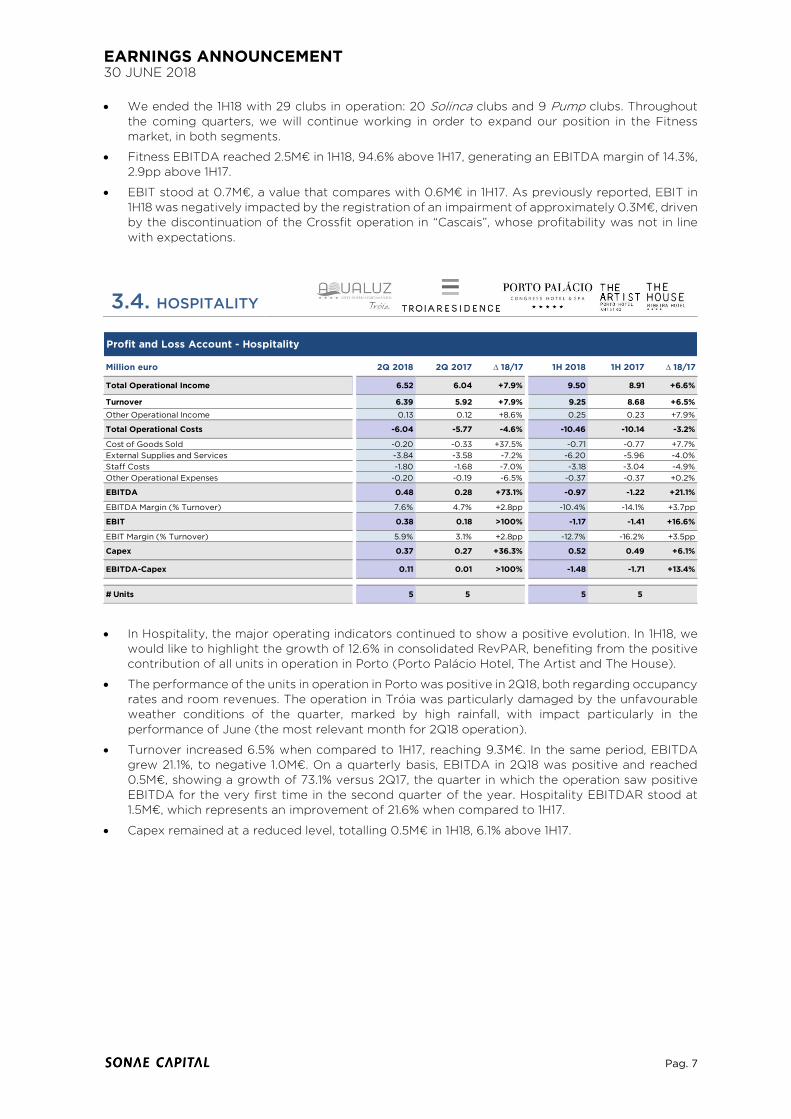
In Hospitality, the major operating indicators continued to show a positive evolution. In 1H18, we
would like to highlight the growth of 12.6% in consolidated RevPAR, benefiting from the positive
contribution of all units in operation in Porto (Porto Palácio Hotel, The Artist and The House).
The performance of the units in operation in Porto was positive in 2Q18, both regarding occupancy
rates and room revenues. The operation in Tróia was particularly damaged by the unfavourable
weather conditions of the quarter, marked by high rainfall, with impact particularly in the
performance of June (the most relevant month for 2Q18 operation).
Turnover increased 6.5% when compared to 1H17, reaching 9.3M€. In the same period, EBITDA
grew 21.1%, to negative 1.0M€. On a quarterly basis, EBITDA in 2Q18 was positive and reached
0.5M€, showing a growth of 73.1% versus 2Q17, the quarter in which the operation saw positive
EBITDA for the very first time in the second quarter of the year. Hospitality EBITDAR stood at
1.5M€, which represents an improvement of 21.6% when compared to 1H17.
Capex remained at a reduced level, totalling 0.5M€ in 1H18, 6.1% above 1H17.
Million euro 2Q 2018 2Q 2017 D 18/17 1H 2018 1H 2017 D 18/17
Total Operational Income 6.52 6.04 +7.9% 9.50 8.91 +6.6%
Turnover 6.39 5.92 +7.9% 9.25 8.68 +6.5%
Other Operational Income 0.13 0.12 +8.6% 0.25 0.23 +7.9%
Total Operational Costs -6.04 -5.77 -4.6% -10.46 -10.14 -3.2%
Cost of Goods Sold -0.20 -0.33 +37.5% -0.71 -0.77 +7.7%
External Supplies and Services -3.84 -3.58 -7.2% -6.20 -5.96 -4.0%
Staff Costs -1.80 -1.68 -7.0% -3.18 -3.04 -4.9%
Other Operational Expenses -0.20 -0.19 -6.5% -0.37 -0.37 +0.2%
EBITDA 0.48 0.28 +73.1% -0.97 -1.22 +21.1%
EBITDA Margin (% Turnover) 7.6% 4.7% +2.8pp -10.4% -14.1% +3.7pp
EBIT 0.38 0.18 >100% -1.17 -1.41 +16.6%
EBIT Margin (% Turnover) 5.9% 3.1% +2.8pp -12.7% -16.2% +3.5pp
Capex 0.37 0.27 +36.3% 0.52 0.49 +6.1%
EBITDA-Capex 0.11 0.01 >100% -1.48 -1.71 +13.4%
# Units 5 5 5 5
Profit and Loss Account - Hospitality

EARNINGS ANNOUNCEMENT 30 JUNE 2018
Pag. 8
3.5. REFRIGERATION & HVAC
Turnover in 1H18 increased 9.6%, to 22.1M€. Importantly, the volume of contracts in pipeline
reached 21.1M€ at the end of the semester, equivalent to approximately 5 months of activity.
EBITDA grew to 0.1M€ in 1H18, which represents a relevant increase when compared to the same
period of 2017, driven mostly by a greater focus on Refrigeration, despite the negative effect of
the operating margin deterioration in some specific HVAC projects, which were not carried out
as planned. It should be noted that the positive performance of the segment in 1H18 was totally
driven by the performance in 2Q18.
EBIT reached negative 0.3M€, 13.2% below 1H17, driven by the recognition of non-recurrent costs
in the amount of 0.4M€, consequence of an impairment related with a business made through
RACE Brazil, as disclosed in 1Q18.
3.6. TROIA RESORT - OPERATIONS
This segment includes Atlantic Ferries river transportation and operations such Tróia Marina and
Tróia Market.
Turnover generated by Troia Resort operations reached 3.8M€ in 1H18, 1.4% below 1H17. This was
caused by a slightly smaller reduction of the activity in the Resort, mostly driven by the
unfavourable weather conditions.
Capex remained at controlled levels and was mainly due to investments in the renovation and
improvement of Tróia Marina and Atlantic Ferries river transportation.
Million euro 2Q 2018 2Q 2017 D 18/17 1H 2018 1H 2017 D 18/17
Total Operational Income 11.32 9.61 +17.8% 22.13 20.06 +10.3%
Turnover 11.27 9.91 +13.8% 22.06 20.13 +9.6%
Other Operational Income 0.05 -0.30 - 0.07 -0.07 -
Total Operational Costs -11.16 -9.89 -12.8% -22.04 -20.07 -9.8%
Cost of Goods Sold -6.29 -4.51 -39.5% -11.46 -9.04 -26.8%
External Supplies and Services -2.61 -3.01 +13.5% -6.08 -6.27 +3.1%
Staff Costs -2.24 -2.04 -9.9% -4.34 -4.24 -2.3%
Other Operational Expenses -0.02 -0.33 +92.8% -0.16 -0.51 +68.8%
EBITDA 0.16 -0.28 - 0.09 -0.01 -
EBITDA Margin (% Turnover) 1.4% -2.8% +4.2pp 0.4% -0.1% +0.4pp
EBIT 0.10 -0.30 - -0.33 -0.29 -13.2%
EBIT Margin (% Turnover) 0.9% -3.1% +3.9pp -1.5% -1.4% -0.0pp
Capex -0.01 0.03 - 0.09 0.09 +4.5%
EBITDA-Capex 0.17 -0.32 - -0.01 -0.10 +92.3%
Profit and Loss Account - Refrigeration & HVAC
Million euro 2Q 2018 2Q 2017 D 18/17 1H 2018 1H 2017 D 18/17
Total Operational Income 2.65 2.99 -11.4% 4.01 4.29 -6.6%
Turnover 2.55 2.70 -5.4% 3.81 3.86 -1.4%
Other Operational Income 0.09 0.29 -67.2% 0.20 0.43 -53.4%
Total Operational Costs -2.95 -2.64 -11.8% -4.93 -4.83 -2.2%
Cost of Goods Sold -0.25 -0.28 +10.3% -0.33 -0.36 +10.0%
External Supplies and Services -1.61 -1.28 -25.7% -2.60 -2.40 -8.3%
Staff Costs -0.85 -0.97 +12.3% -1.60 -1.77 +9.5%
Other Operational Expenses -0.23 -0.10 <-100% -0.40 -0.29 -37.6%
EBITDA -0.30 0.35 - -0.92 -0.53 -73.0%
EBITDA Margin (% Turnover) -11.7% 13.0% -24.7pp -24.3% -13.8% -10.4pp
EBIT -0.80 -0.08 <-100% -1.87 -1.38 -35.8%
EBIT Margin (% Turnover) -31.2% -3.0% -28.3pp -49.2% -35.7% -13.5pp
Capex 0.21 0.12 +78.9% 0.25 0.15 +65.2%
EBITDA-Capex -0.51 0.24 - -1.17 -0.68 -71.3%
Profit and Loss Account - Troia Resort: Operations
EARNINGS ANNOUNCEMENT 30 JUNE 2018
Pag. 9
4. REAL ESTATE ASSETS
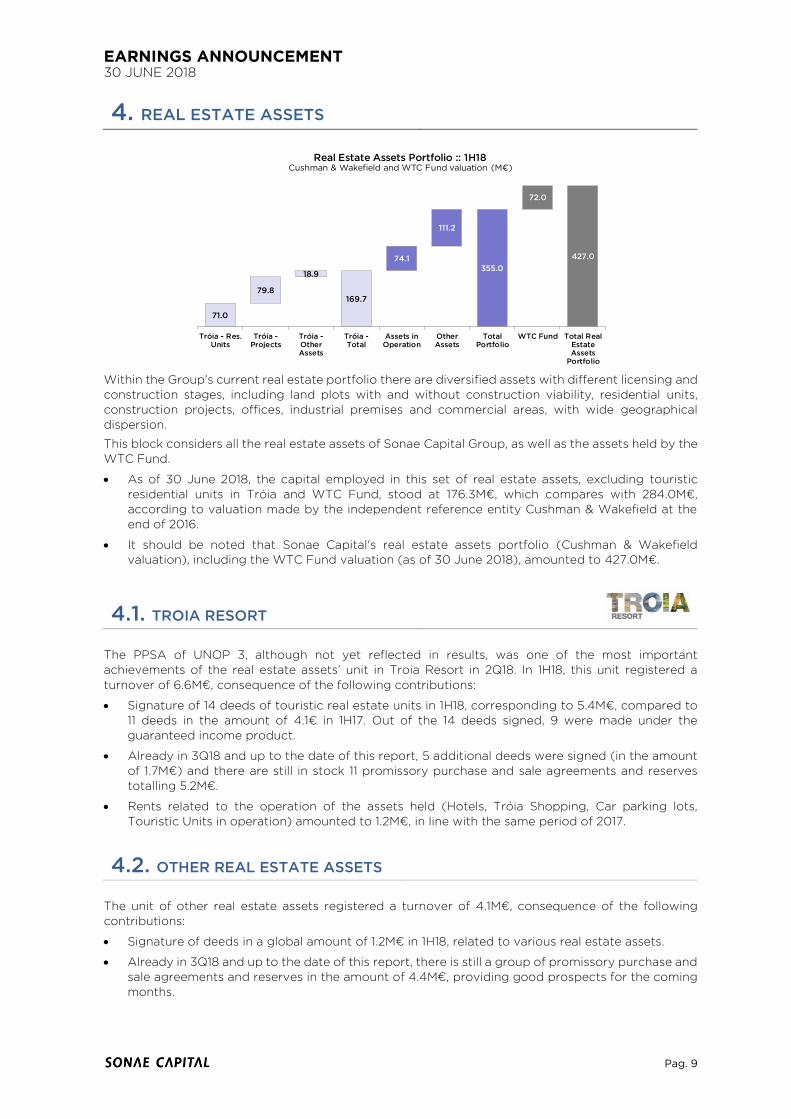
Within the Group's current real estate portfolio there are diversified assets with different licensing and
construction stages, including land plots with and without construction viability, residential units,
construction projects, offices, industrial premises and commercial areas, with wide geographical
dispersion.
This block considers all the real estate assets of Sonae Capital Group, as well as the assets held by the
WTC Fund.
As of 30 June 2018, the capital employed in this set of real estate assets, excluding touristic
residential units in Tróia and WTC Fund, stood at 176.3M€, which compares with 284.0M€,
according to valuation made by the independent reference entity Cushman & Wakefield at the
end of 2016.
It should be noted that Sonae Capital's real estate assets portfolio (Cushman & Wakefield valuation), including the WTC Fund valuation (as of 30 June 2018), amounted to 427.0M€.
4.1. TROIA RESORT
The PPSA of UNOP 3, although not yet reflected in results, was one of the most important
achievements of the real estate assets’ unit in Troia Resort in 2Q18. In 1H18, this unit registered a
turnover of 6.6M€, consequence of the following contributions:
Signature of 14 deeds of touristic real estate units in 1H18, corresponding to 5.4M€, compared to
11 deeds in the amount of 4.1€ in 1H17. Out of the 14 deeds signed, 9 were made under the
guaranteed income product.
Already in 3Q18 and up to the date of this report, 5 additional deeds were signed (in the amount
of 1.7M€) and there are still in stock 11 promissory purchase and sale agreements and reserves
totalling 5.2M€.
Rents related to the operation of the assets held (Hotels, Tróia Shopping, Car parking lots,
Touristic Units in operation) amounted to 1.2M€, in line with the same period of 2017.
4.2. OTHER REAL ESTATE ASSETS
The unit of other real estate assets registered a turnover of 4.1M€, consequence of the following
contributions:
Signature of deeds in a global amount of 1.2M€ in 1H18, related to various real estate assets.
Already in 3Q18 and up to the date of this report, there is still a group of promissory purchase and
sale agreements and reserves in the amount of 4.4M€, providing good prospects for the coming
months.
71.0
79.8
18.9
169.7
74.1
111.2
355.0
72.0
427.0
Tróia - Res.Units
Tróia -Projects
Tróia -OtherAssets
Tróia -Total
Assets inOperation
OtherAssets
TotalPortfolio
WTC Fund Total RealEstateAssets
Portfolio
Real Estate Assets Portfolio :: 1H18Cushman & Wakefield and WTC Fund valuation (M€)

EARNINGS ANNOUNCEMENT 30 JUNE 2018
Pag. 10
5. BACKUP – CONSOLIDATED BALANCE SHEET
Million euro Jun 2018 Dec 2017 D 18/17
Total Assets 522.3 516.1 +1.2%
Tangible and Intangible Assets 276.1 275.3 +0.3%
Goodwill 52.7 47.4 +11.3%
Non-Current Investments 2.2 2.0 +8.9%
Other Non-Current Assets 29.9 34.4 -12.9%
Stocks 91.4 94.4 -3.1%
Trade Debtors and Other Current Assets 58.6 53.0 +10.6%
Cash and Cash Equivalents 9.1 7.3 +24.7%
Assets held for sale 2.1 2.4 -12.7%
Total Equity 262.1 291.4 -10.0%
Total Equity - Equity Holders of Sonae Capital 252.6 280.5 -9.9%
Total Equity - Non-Controlling Interests 9.5 10.9 -12.9%
Total Liabilities 260.2 224.8 +15.7%
Non-Current Liabilities 96.6 116.2 -16.9%
Non-Current Borrowings 70.6 88.5 -20.2%
Deferred Tax Liabilities 21.7 21.6 +0.1%
Other Non-Current Liabilities 4.3 6.1 -28.9%
Current Liabilities 163.5 108.6 +50.7%
Current Borrowings 82.9 28.2 >100%
Trade Creditors and Other Current Liabilities 75.0 75.5 -0.7%
Liabilities associated to assets held for sale 5.6 4.8 +16.8%
Total Equity and Liabilities 522.3 516.1 +1.2%
Consolidated Balance Sheet

EARNINGS ANNOUNCEMENT 30 JUNE 2018
Pag. 11
6. CORPORATE INFORMATION
6.1. CORPORATE INFORMATION 2Q18 On 3 May 2018, the Shareholders' General Meeting of Sonae Capital was held at the company's
headquarters. Amongst the proposals presented, it was approved a dividend payment to the
shareholders in the amount of 0.06€ per share.
On 15 May 2018, Sonae Capital informed about the date of dividends payment, 30 May 2018. Dividends’
global amount is 15M€.
On 28 June 2018, Sonae Capital informed about the execution, through its subsidiary S.I.I. SOBERANA
– INVESTIMENTOS IMOBILIÁRIOS, S.A., of a PPSA regarding the real estate asset in Tróia designated
in Tróia Detailed Plan as UNOP 3, for the global amount of 20M€ with LAGUNE TROIA, S.A.. The
execution of the sale and and purchase deed and the establishment of its respective terms is
contingent upon a set of condition precedent that have not yet taken place.
6.2. SUBSEQUENT EVENTS On 17 July 2018, Efanor Investimentos informed about the intention to appoint Cláudia Azevedo as
the next CEO of Sonae, after the end of the present mandate. Subsequently, Cláudia Azevedo asked
Sonae Capital Board of Directors to be released from her role as CEO. The Board accepted and has
expressed its gratitude for the valuable contribution of Cláudia Azevedo as CEO. Additionally, Sonae
Capital Board of Directors agreed to elect Miguel Gil Mata as CEO for the remaining of the current
mandate. Cláudia Azevedo will remain as Board member of Sonae Capital, but as a Non-Executive
Director.

EARNINGS ANNOUNCEMENT 30 JUNE 2018
Pag. 12
7. METHODOLOGICAL NOTES
The quarterly consolidated financial information presented in this report is non-audited and has been
prepared in accordance with the International Financial Reporting Standards ("IAS / IFRS"), issued by
the International Accounting Standards Board ("IASB"), as adopted by the European Union.
With the aim of continuing to provide the best financial information not only at the Consolidated level,
but also, at each Business Unit level and aligning with the best market practices, the international
operations (Mozambique and Brazil) of the Refrigeration & HVAC segment are considered as assets
held for sale and therefore their contribution to the consolidated results is recognized as discontinued
operations.
GLOSSARY
Capex = Investment in Tangible and Intangible Assets.
EBITDA = Operational Profit (EBIT) + Amortization and Depreciation + Provisions and
Impairment Losses + Impairment Losses of Real Estate Assets in Stocks (included in Costs of
Goods Sold) – Reversal of Impairment Losses and Provisions (including in Other Operation
Income).
EBITDA, excluding Guaranteed Income Provisions = EBITDA + Provisions related to the
estimated present value of potential costs for the full period of the Guaranteed Income from
real estate sales at Troia Resort.
EBITDAR = EBITDA + Building Rents.
Gearing: Debt to Equity = Net Debt / Equity.
HVAC = Heating, Ventilation and Air Conditioning.
Loan to Value = Net Debt of real estate assets / Real estate assets Valuation.
Net Debt = Non-Current Loans + Current Loans – Cash and Cash Equivalents – Current
Investments.
Operational Cash Flow = EBITDA - Capex.
PPSA = Promissory Purchase and Sale Agreement.
RevPAR = Revenue Per Available Room.

EARNINGS ANNOUNCEMENT 30 JUNE 2018
Pag. 13
Page intentionally left in blank.

EARNINGS ANNOUNCEMENT 30 JUNE 2018
Pag. 14
CONTACTS
Anabela Nogueira de Matos
Representative for Capital Market Relations
E-mail: [email protected]
Tel.: +351 22 012 9528
Fax: +351 22 010 7900
Nuno Parreiro
Investor Relations Officer
E-mail: [email protected]
Tel.: +351 22 010 7903
Fax: +351 22 010 7935
Sonae Capital, SGPS, SA
Lugar do Espido, Via Norte
Apartado 3053
4471 – 907 Maia
Portugal
www.sonaecapital.pt