Q3FY17/18 Earnings Announcement - Lenovo · Q3FY17/18 Earnings Announcement . 2 ... statements are...
25
2018 Lenovo Internal. All rights reserved. Jan 31, 2018 – Silicon Valley Feb 1, 2018 – Hong Kong Q3FY17/18 Earnings Announcement
Transcript of Q3FY17/18 Earnings Announcement - Lenovo · Q3FY17/18 Earnings Announcement . 2 ... statements are...

2018 Lenovo Internal. All rights reserved.
Jan 31, 2018 – Silicon Valley Feb 1, 2018 – Hong Kong
Q3FY17/18 Earnings Announcement

2
Forward Looking Statement
This presentation contains “forward-looking statements” which are statements that refer to expectations and plans for
the future and include, without limitation, statements regarding Lenovo’s future results of operations, financial condition
or business prospects as well as other statements based on projections, estimates and assumptions. In some cases,
these statements can be identified by terms such as "expect," "intend," "plan," "believe," "estimate," "may," "will,"
"should" and comparable words (including the negative of such words). These forward-looking statements, reflect the
current expectations and plans of the directors and management of Lenovo, which may not materialize or may change.
Many risks, uncertainties and other factors, some of which are unpredictable and beyond Lenovo’s control, could affect
the matters discussed in these forward-looking statements. These factors include, without limitation, economic and
business conditions globally and in the countries where we operate, Lenovo’s ability to predict and respond quickly to
market developments, consumer demand, pricing trends and competition; changes in applicable laws and regulations
(including applicable tax and tariff rates). Any variance from the expectations or plans on which these forward-looking
statements are based could cause Lenovo’s actual results or actions to differ materially from those expressed or
implied in these statements. These forward-looking statements are not guarantees of future performance and you are
cautioned not to place undue reliance on these statements. Lenovo undertakes no obligation to update any forward-
looking statements in this presentation, whether as a result of new information or any subsequent change, development
or event. All forward-looking statements in this presentation are qualified by reference to this paragraph.

2018 Lenovo Internal. All rights reserved.
Yuanqing Yang Chairman & CEO
4
Maintain PC Profitability Build MBG & DCG
into New Growth Engines
Invest in “Device + Cloud”
and “Infrastructure +
Cloud” Powered by A.I.

5
101
150
0
20
40
60
80
100
120
140
160
Q3 16/17 Q3 17/18
2018 Lenovo. All rights reserved.
Stronger Performance Guided by 3-Wave Strategy
Source: Internal Data
• Revenue $12.9 billion, highest in 3 years
• Pre Tax Income $150 million, up 48% year-on-year, first year-on-year growth in 5
quarters
Revenue ($B)
+$49M
PTI ($M)
11.3 10.7
12.1
12.91
9.1
10.1
11.2
12.2
9.6 10
11.8
12.94
0
2
4
6
8
10
12
14
Q414/15
Q115/16
Q215/16
Q315/16
Q415/16
Q116/17
Q216/17
Q316/17
Q416/17
Q117/18
Q217/18
Q317/18
6
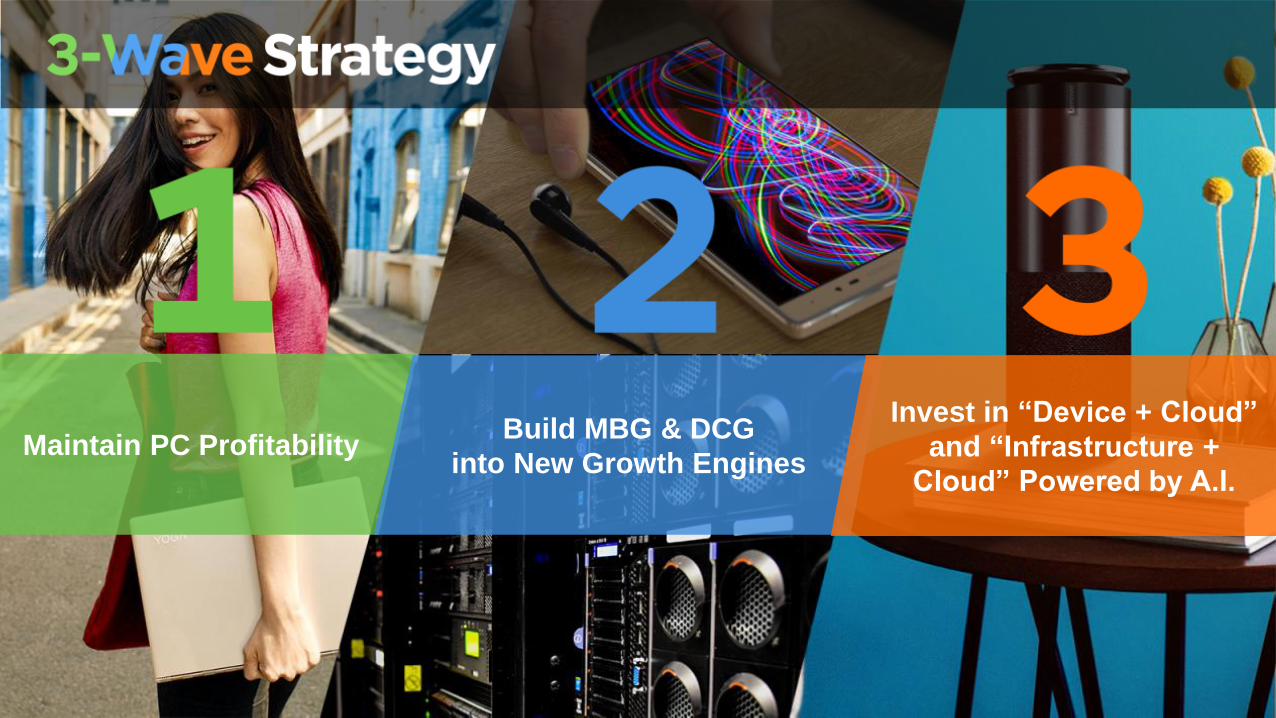
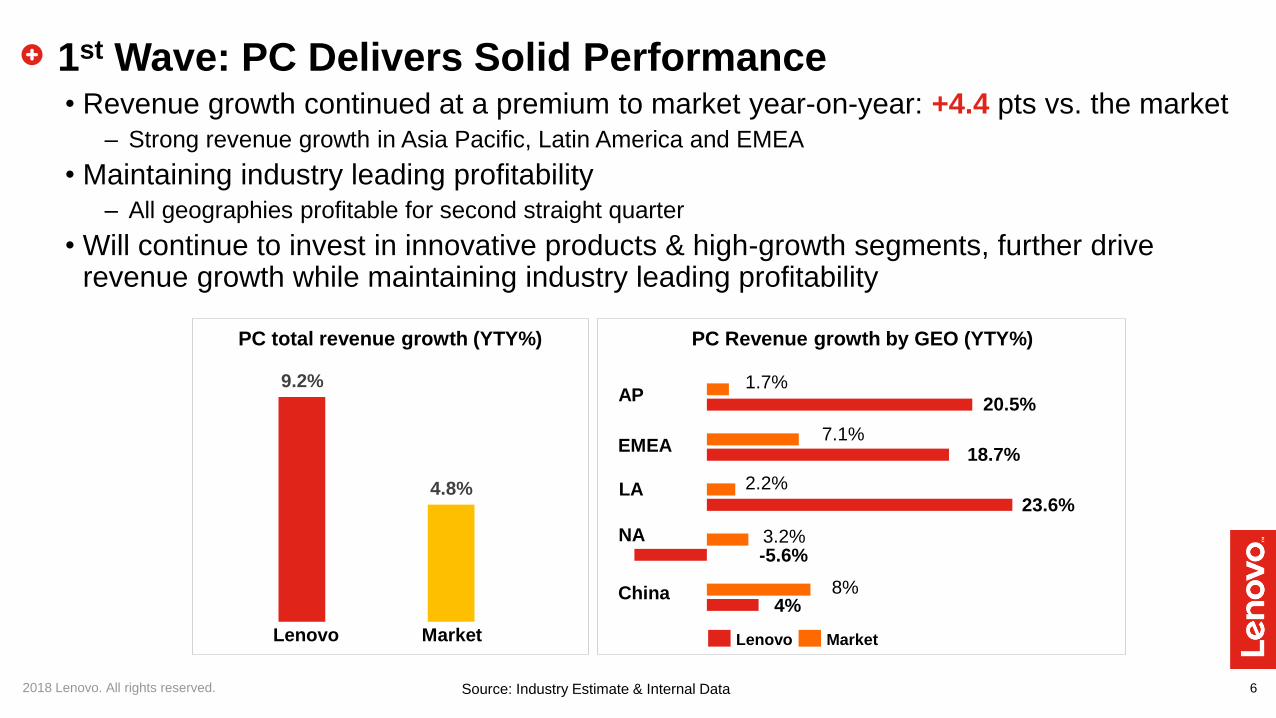
• Revenue growth continued at a premium to market year-on-year: +4.4 pts vs. the market – Strong revenue growth in Asia Pacific, Latin America and EMEA
• Maintaining industry leading profitability – All geographies profitable for second straight quarter
• Will continue to invest in innovative products & high-growth segments, further drive revenue growth while maintaining industry leading profitability
1st Wave: PC Delivers Solid Performance
2018 Lenovo. All rights reserved.
PC Revenue growth by GEO (YTY%) PC total revenue growth (YTY%)
Market Lenovo
1.7%
20.5%
China 8% 4%
NA 3.2% -5.6%
AP
2.2%
18.7%
LA
7.1%
23.6%
EMEA
Market Lenovo
Source: Industry Estimate & Internal Data
9.2%
4.8%

7
• Revenue highest in 2 years while further improving profitability – Strong growth year-on-year for 3rd consecutive quarter in North America, Europe
– Double-digit growth year-on-year in China, Asia Pacific
– Triple-digit growth year-on-year in Software Defined Infrastructure and Hyperscale segments
• Foundation building taking effect – Hyperscale: Improved in-house design, in-house manufacturing, provided customized solutions, and we won 6
of top 10 hyperscale customers in the world
• Will continue to invest in focused areas, remain confident in returning to profitable growth
2nd Wave: Data Center Progress Better Than Expected
2018 Lenovo. All rights reserved.
985
1087 1082 1050
850 971 976
1225
Q4 15/16 Q1 16/17 Q2 16/17 Q3 16/17 Q4 16/17 Q1 17/18 Q2 17/18 Q3 17/18
DCG Revenue ($M)
8 2018 Lenovo. All rights reserved.
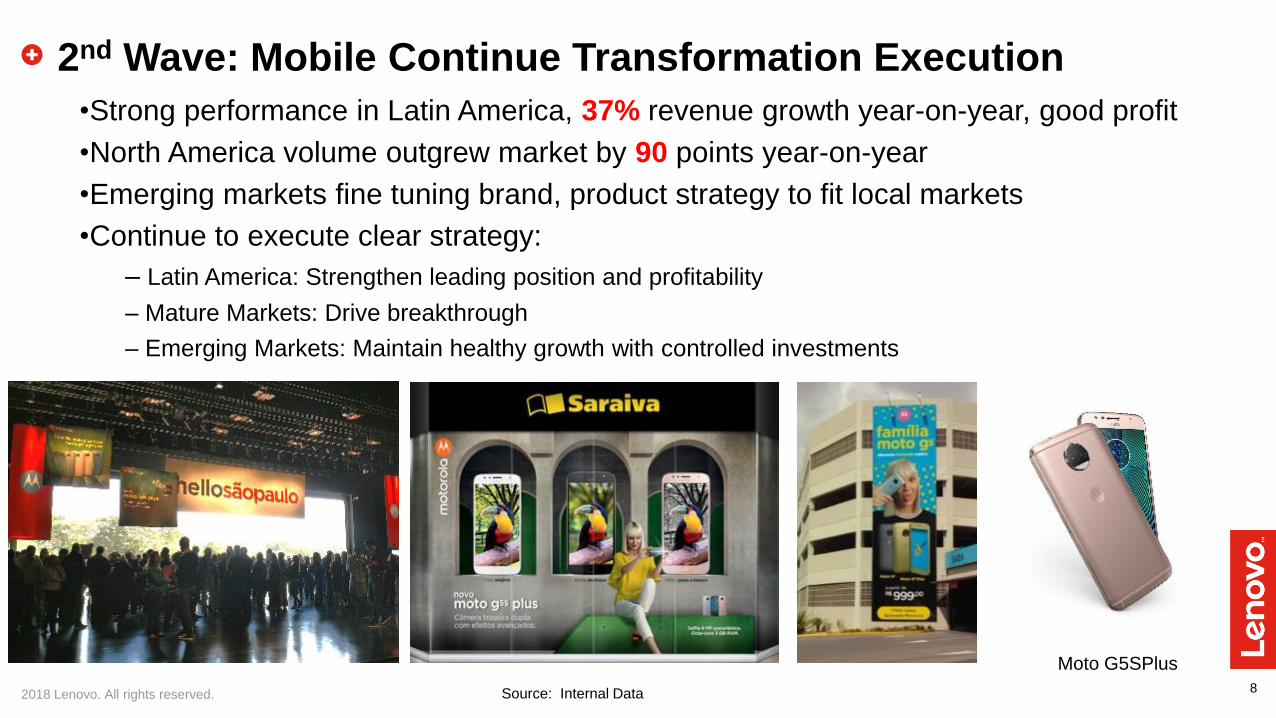
•Strong performance in Latin America, 37% revenue growth year-on-year, good profit
•North America volume outgrew market by 90 points year-on-year
•Emerging markets fine tuning brand, product strategy to fit local markets
•Continue to execute clear strategy:
– Latin America: Strengthen leading position and profitability
– Mature Markets: Drive breakthrough
– Emerging Markets: Maintain healthy growth with controlled investments
Source: Internal Data
2nd Wave: Mobile Continue Transformation Execution
Moto G5SPlus

9
3rd Wave: Solid Execution on “Device + Cloud” Delivers Progress
2018 Lenovo. All rights reserved.
•Non-device revenue continued year-on-year growth
•Consumer Electronics Show: Won record 80 awards, 2/3 for smart devices.
•Will launch the award winning star products soon
•Star Wars Jedi Challenge AR headset, clear #1 AR consumer device of holiday season
Lenovo Smart Display Lenovo Mirage Solo & Mirage Camera 80 Award at CES
10
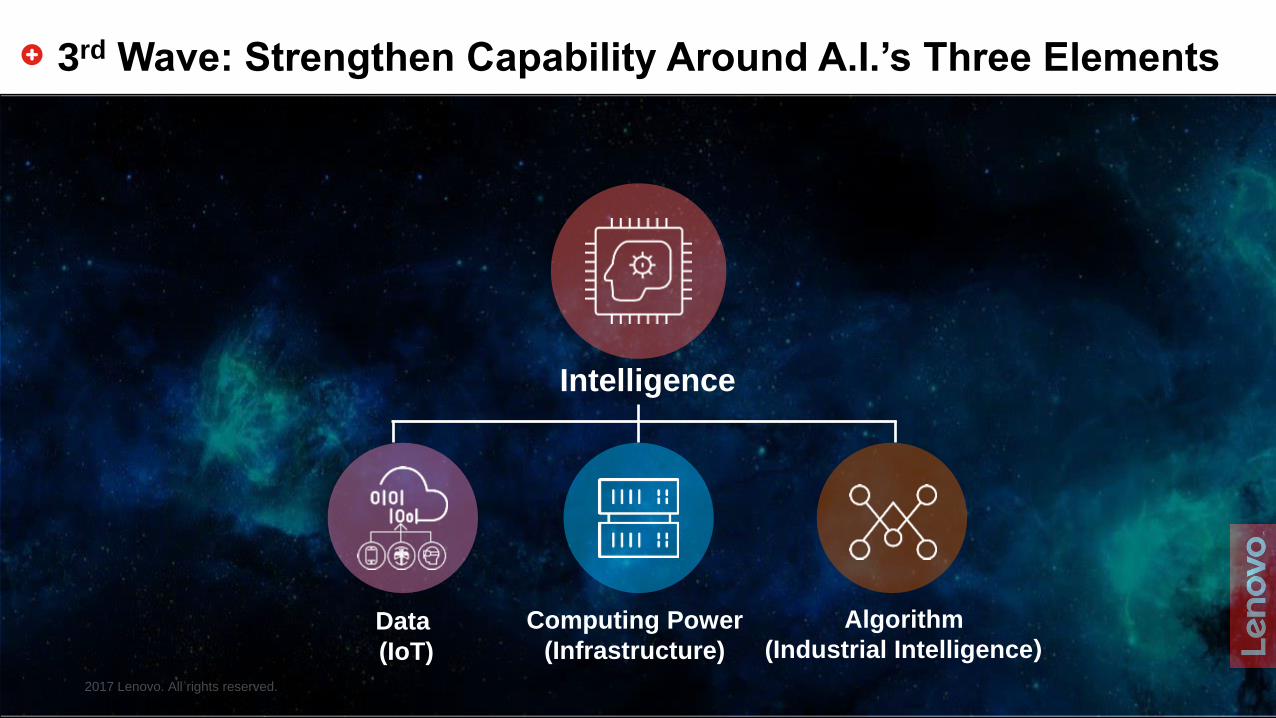
3rd Wave: Strengthen Capability Around A.I.’s Three Elements
2017 Lenovo. All rights reserved.
Intelligence
Data
(IoT)
Computing Power
(Infrastructure)
Algorithm
(Industrial Intelligence)

11
Looking Forward
2017 Lenovo. All rights reserved.
•Further drive progress in transforming the company
•Confident in reaching a new stage of strong, sustainable growth

2018 Lenovo Internal. All rights reserved.
Wong Wai Ming Chief Financial Officer

13
Q3 FY2017/18 Highlights Financial Highlights: • Transformation is on track • Highest group revenue in 3 years • Group PTI at $150m, up 48% YTY • PCSD: strong revenue growth of 8% YTY with improved PTI margin QTQ • DCG: highest revenue in 2 years with profitability improvement • MBG: loss narrowed & core geo in Latin America remained strong
Financial Snap Shot
US$ Million Q3 FY2017/18 Q3 FY2016/17 Q2 FY2017/18
Revenue 12,939 12,169 11,761
Gross Profit 1,751 1,595 1,613
Operating Expenses (1,547) (1,457) (1,525)
Operating Profit 204 138 88
Pre-tax Income 150 101 35
Less: One-time Property Disposal Gain (61) - -
Add: One-time Severance Charge 61 - -
Add: Non-cash M&A Related Accounting Charges 62 73 63
Operational PTI 212 174 98
Q3 FY2017/18 Q3 FY2016/17 Q2 FY2017/18
Gross margin 13.5% 13.1% 13.7%
Operating margin 1.6% 1.1% 0.7%
PTI margin 1.2% 0.8% 0.3%
Operational PTI margin 1.6% 1.4% 0.8%

14
2018 Lenovo Internal. All rights reserved.
Cash and Working Capital
-40-20
02040
6080
100
2Q16/17
3Q16/17
4Q16/17
1Q17/18
2Q17/18
3Q17/18
Days receivable 36 36 40 37 35 36
Days inventory 27 26 32 32 32 31
Days payable 68 75 94 84 81 83
Cash conversion cycle -5 -13 -22 -15 -14 -16
Days
US$ Million Q3 FY2017/18 Q3 FY2016/17 Q2 FY2017/18
Bank deposits and cash 1,747 2,685 1,262
Total Borrowings 2,674 2,530 2,661
Net (Debt)/Cash Reserves (927) 155 (1,399)
Net cash generated from operating
activities 211 345 364
15 2018 Lenovo Internal. All rights reserved.
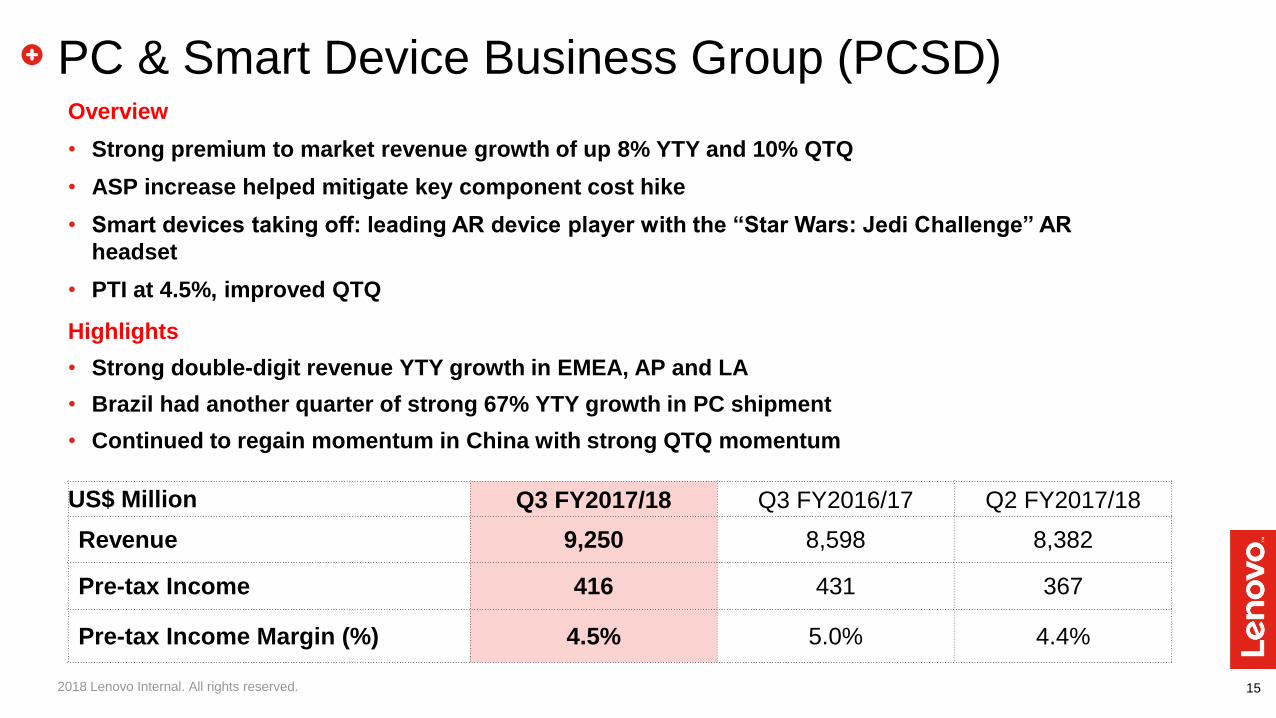
PC & Smart Device Business Group (PCSD)
Overview
• Strong premium to market revenue growth of up 8% YTY and 10% QTQ
• ASP increase helped mitigate key component cost hike
• Smart devices taking off: leading AR device player with the “Star Wars: Jedi Challenge” AR
headset
• PTI at 4.5%, improved QTQ
Highlights
• Strong double-digit revenue YTY growth in EMEA, AP and LA
• Brazil had another quarter of strong 67% YTY growth in PC shipment
• Continued to regain momentum in China with strong QTQ momentum
US$ Million Q3 FY2017/18 Q3 FY2016/17 Q2 FY2017/18
Revenue 9,250 8,598 8,382
Pre-tax Income 416 431 367
Pre-tax Income Margin (%) 4.5% 5.0% 4.4%

16 2018 Lenovo Internal. All rights reserved.
Data Center Business Group (DCG) Overview
• Transformation on track: highest revenue in 2 years with profitability improvement
• All geographies saw double-digit revenue YTY growth
• 3rd consecutive quarter of revenue YTY growth in NA & EMEA since System X acquisition
• China returned to YTY revenue growth with margin improvement
• Strong growth across all segments, particularly in Hyperscale and Software Defined Infrastructure (SDI) segments
Highlights
• High Performance Computing: closing the gap with #1 position on WW Top 500 HPC vendor list
• Hyperscale: strong revenue growth and margin improvement, now won 6 of the top 10 global hyperscalers
• SDI: strong revenue growth driven by growth across all partners, i.e. Nutanix, Microsoft Azure, VMWare
* Included non-cash M&A-related accounting charges, such as intangible asset amortization, imputed interest expense of promissory notes and others
US$ Million Q3 FY2017/18 Q3 FY2016/17 Q2 FY2017/18
Revenue 1,225 1,050 976
Pre-tax Loss Operational (56) (94) (100)
Reported* (86) (124) (131)
Pre-tax Income Margin (%) Operational (4.6%) (8.9%) (10.3%)
Reported* (7.0%) (11.8%) (13.4%)

17 2018 Lenovo Internal. All rights reserved.
Mobile Business Group (MBG) Overview
• Core geo Latin America remained strong: revenue grew double-digit YTY and maintained strong profitability
• Continued to strengthen presence with mainstream models and carrier expansion in North America and Western Europe
• Faced challenges in AP emerging markets on intense competition; brand transition in Eastern Europe was slower than expected
• ASP improved QTQ and YTY driven by better product mix
• Component cost hike remained a challenge; repositioning product strategy to fit local market
Highlights
• North America shipment grew around 80% YTY as Moto gain presence in the carriers
• Continued strength of Moto brand in Western Europe growing double-digit YTY in shipment
* Included non-cash M&A-related accounting charges, such as intangible asset amortization, imputed interest expense of promissory notes and others
US$ Million Q3 FY2017/18 Q3 FY2016/17 Q2 FY2017/18
Revenue 2,076 2,185 2,076
Pre-tax Loss Operational (92) (112) (132)
Reported* (124) (155) (164)
Pre-tax Income Margin (%) Operational (4.4%) (5.1%) (6.4%)
Reported* (6.0%) (7.1%) (7.9%)
Appendix - Financial Summary
- Condensed Consolidated Income Statement
- Condensed Consolidated Balance Sheet
- Condensed Consolidated Cash Flow Statement
- Q3FY18 Performance by Geography
- Summary : “PTI (As Reported) ” vs “PTI Before Non-Cash M&A
Related Accounting Charges and One-time Gain/Charge”

19
Financial Summary US$ Million Q3 FY2017/18 Q3 FY2016/17 Y/Y% Q/Q% YTD FY2017/18
Revenue 12,939 12,169 6% 10% 34,712
Gross Profit 1,751 1,595 9.76% 9% 4,728
Operating Expenses (1,547) (1,457) 6% 1% (4,442)
Operating Profit 204 138 48% 133% 286
Other Non-Operating Expenses (54) (37) 48% 2% (170)
Pre-tax Income 150 101 48% 325% 116
Taxation (425) 6 N.A. N.A. (292)
(Loss)/Profit for the period (275) 107 N.A. N.A. (175)
Non-controlling interests (14) (9) 65% - (47)
(Loss)/Profit attributable to Equity Holders (289) 98 N.A. N.A. (222)
EPS (US cents)
- Basic (2.53) 0.90 N.A. N.A. (1.99)
- Diluted (2.53) 0.90 N.A. N.A. (1.99)
Dividend per share (HK cents)
Q3 FY2017/18 Q3 FY2016/17 Q2 FY2017/18 YTD FY2017/18
Gross margin 13.5% 13.1% 13.7% 13.6%
E/R ratio 12.0% 12.0% 13.0% 12.8%
Operating margin 1.6% 1.1% 0.7% 0.8%
PTI margin 1.2% 0.8% 0.3% 0.3%
Net margin attributable to Equity Holders -2.2% 0.8% 1.2% -0.6%
2018 Lenovo Internal. All rights reserved.
20
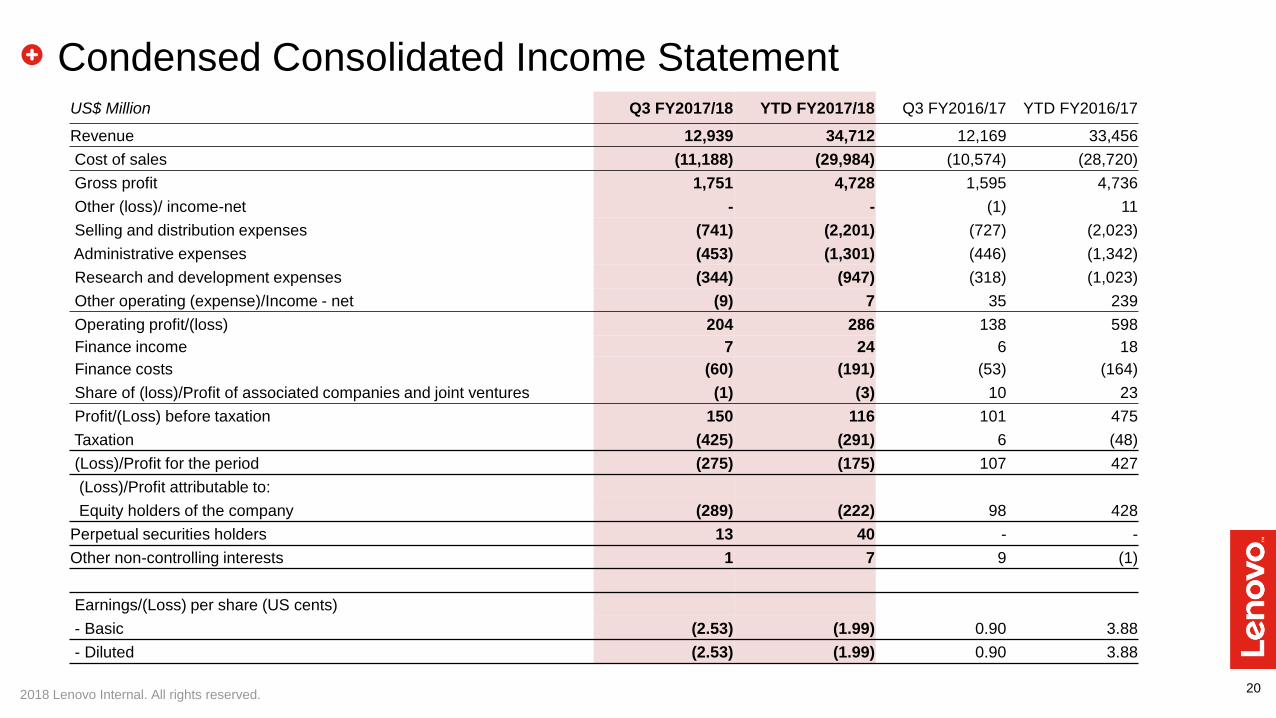
Condensed Consolidated Income Statement US$ Million Q3 FY2017/18 YTD FY2017/18 Q3 FY2016/17 YTD FY2016/17
Revenue 12,939 34,712 12,169 33,456
Cost of sales (11,188) (29,984) (10,574) (28,720)
Gross profit 1,751 4,728 1,595 4,736
Other (loss)/ income-net - - (1) 11
Selling and distribution expenses (741) (2,201) (727) (2,023)
Administrative expenses (453) (1,301) (446) (1,342)
Research and development expenses (344) (947) (318) (1,023)
Other operating (expense)/Income - net (9) 7 35 239
Operating profit/(loss) 204 286 138 598
Finance income 7 24 6 18
Finance costs (60) (191) (53) (164)
Share of (loss)/Profit of associated companies and joint ventures (1) (3) 10 23
Profit/(Loss) before taxation 150 116 101 475
Taxation (425) (291) 6 (48)
(Loss)/Profit for the period (275) (175) 107 427
(Loss)/Profit attributable to:
Equity holders of the company (289) (222) 98 428
Perpetual securities holders 13 40 - -
Other non-controlling interests 1 7 9 (1)
Earnings/(Loss) per share (US cents)
- Basic (2.53) (1.99) 0.90 3.88
- Diluted (2.53) (1.99) 0.90 3.88
2018 Lenovo Internal. All rights reserved.

21
Condensed Consolidated Balance Sheet US$ Million As at As at
Dec 31, 2017 Sep 30, 2017
Non-current assets 12,554 12,891
Property, plant and equipment 1,279 1,284
Intangible assets 8,416 8,448
Others 2,859 3,159
Current assets 16,945 16,033
Bank deposits and cash 1,747 1,262
Trade, notes and other receivables 10,992 10,920
Inventories 3,983 3,600
Others 223 251
Current liabilities 20,589 20,295
Borrowings 57 70
Trade, notes, other payables, accruals and provisions 18,724 18,443
Others 1,808 1,782
Net current asset/(liabilities) (3,644) (4,262)
Non-current liabilities 4,534 4,440
Total equity 4,376 4,189
2018 Lenovo Internal. All rights reserved.

22
Condensed Consolidated Cash Flow Statement
US$ Million Q3 FY2017/18 Q3 FY2016/17 Q2 FY2017/18
Net cash generated from operating activities 211 345 364
Net cash (used in)/generated from investing activities (103) 93 (93)
Net cash generated from/(used in) financing activities 395 (118) (526)
Increase/(Decrease) in cash and cash equivalents 503 321 (255)
Effect of foreign exchange rate changes 13 (51) 12
Cash and cash equivalents at the beginning of the period 1,144 2,253 1,387
Cash and cash equivalents at the end of the period 1,660 2,523 1,144
2018 Lenovo Internal. All rights reserved.
23
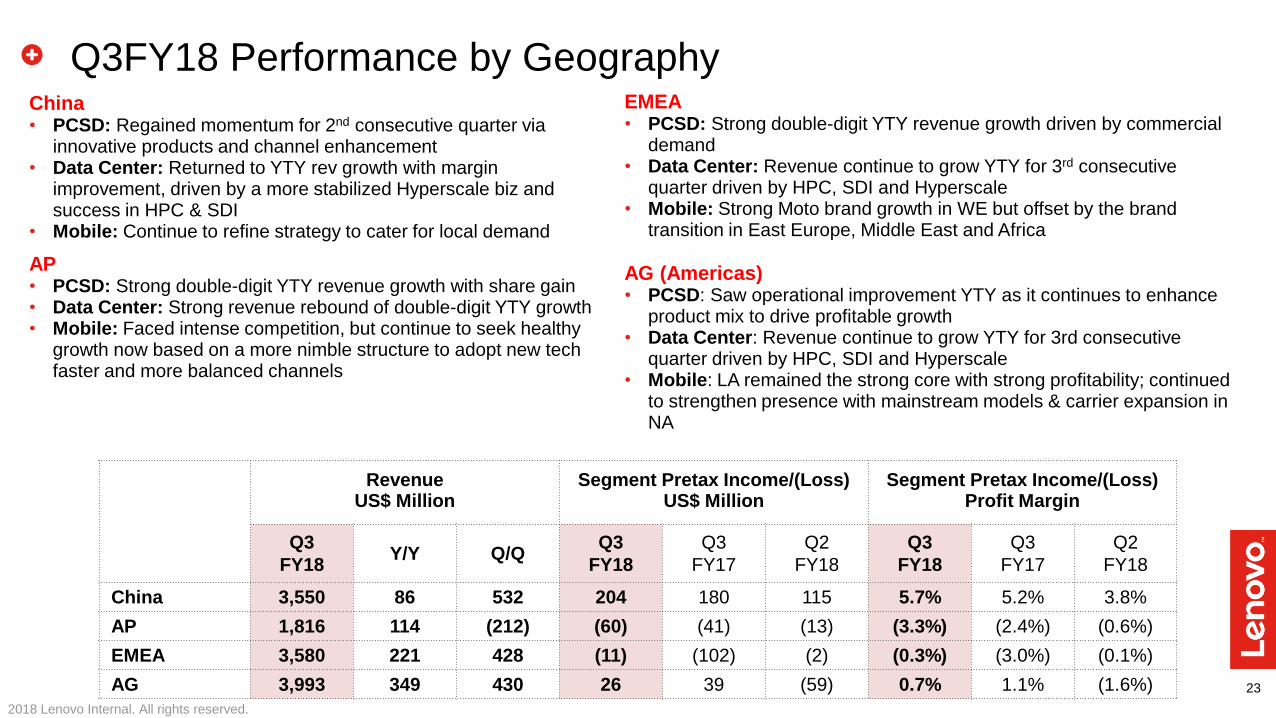
China • PCSD: Regained momentum for 2nd consecutive quarter via
innovative products and channel enhancement • Data Center: Returned to YTY rev growth with margin
improvement, driven by a more stabilized Hyperscale biz and success in HPC & SDI
• Mobile: Continue to refine strategy to cater for local demand
AP • PCSD: Strong double-digit YTY revenue growth with share gain • Data Center: Strong revenue rebound of double-digit YTY growth • Mobile: Faced intense competition, but continue to seek healthy
growth now based on a more nimble structure to adopt new tech faster and more balanced channels
EMEA • PCSD: Strong double-digit YTY revenue growth driven by commercial
demand • Data Center: Revenue continue to grow YTY for 3rd consecutive
quarter driven by HPC, SDI and Hyperscale • Mobile: Strong Moto brand growth in WE but offset by the brand
transition in East Europe, Middle East and Africa
AG (Americas) • PCSD: Saw operational improvement YTY as it continues to enhance
product mix to drive profitable growth • Data Center: Revenue continue to grow YTY for 3rd consecutive
quarter driven by HPC, SDI and Hyperscale • Mobile: LA remained the strong core with strong profitability; continued
to strengthen presence with mainstream models & carrier expansion in NA
Q3FY18 Performance by Geography
Revenue Segment Pretax Income/(Loss) Segment Pretax Income/(Loss) US$ Million US$ Million Profit Margin
Q3
FY18 Y/Y Q/Q
Q3
FY18
Q3
FY17
Q2
FY18
Q3
FY18
Q3
FY17
Q2
FY18
China 3,550 86 532 204 180 115 5.7% 5.2% 3.8%
AP 1,816 114 (212) (60) (41) (13) (3.3%) (2.4%) (0.6%)
EMEA 3,580 221 428 (11) (102) (2) (0.3%) (3.0%) (0.1%)
AG 3,993 349 430 26 39 (59) 0.7% 1.1% (1.6%)
2018 Lenovo Internal. All rights reserved.

24
Summary : “PTI (As Reported) ” vs “PTI Before Non-Cash M&A Related Accounting Charges
and One-time Gain/Charge”
Q3 FY17/18 Q3 FY16/17 Q2 FY17/18
Pre-tax Income (As-Reported) 150 101 35
• Non-Cash M&A Related Accounting Charges 62 73 63
PTI Before Non-Cash M&A Related Accounting Charges 212 174 98
• One-time Gain Including Property Disposal Gain (61) - -
• One-time Restructuring Charge 61 - -
PTI Before Non-Cash M&A Related Accounting Charges
and One-time Gain/Charge 212 174 98
2018 Lenovo Internal. All rights reserved.