Earnings Among Nine Ethnic Minorities and the Han Majority ...ftp.iza.org/dp10230.pdf · Han...
35
Forschungsinstitut zur Zukunft der Arbeit Institute for the Study of Labor DISCUSSION PAPER SERIES Earnings Among Nine Ethnic Minorities and the Han Majority in China‘s Cities IZA DP No. 10230 September 2016 Björn Gustafsson Xiuna Yang
Transcript of Earnings Among Nine Ethnic Minorities and the Han Majority ...ftp.iza.org/dp10230.pdf · Han...
Forschungsinstitut zur Zukunft der ArbeitInstitute for the Study of Labor
DI
SC
US
SI
ON
P
AP
ER
S
ER
IE
S
Earnings Among Nine Ethnic Minorities andthe Han Majority in China‘s Cities
IZA DP No. 10230
September 2016
Björn GustafssonXiuna Yang
Earnings among Nine Ethnic Minorities and the Han Majority in China’s Cities
Björn Gustafsson University of Gothenburg
and IZA
Xiuna Yang
China Development Research Foundation
Discussion Paper No. 10230 September 2016
IZA
P.O. Box 7240 53072 Bonn
Germany
Phone: +49-228-3894-0 Fax: +49-228-3894-180
E-mail: [email protected]
Any opinions expressed here are those of the author(s) and not those of IZA. Research published in this series may include views on policy, but the institute itself takes no institutional policy positions. The IZA research network is committed to the IZA Guiding Principles of Research Integrity. The Institute for the Study of Labor (IZA) in Bonn is a local and virtual international research center and a place of communication between science, politics and business. IZA is an independent nonprofit organization supported by Deutsche Post Foundation. The center is associated with the University of Bonn and offers a stimulating research environment through its international network, workshops and conferences, data service, project support, research visits and doctoral program. IZA engages in (i) original and internationally competitive research in all fields of labor economics, (ii) development of policy concepts, and (iii) dissemination of research results and concepts to the interested public. IZA Discussion Papers often represent preliminary work and are circulated to encourage discussion. Citation of such a paper should account for its provisional character. A revised version may be available directly from the author.
IZA Discussion Paper No. 10230 September 2016
ABSTRACT
Earnings among Nine Ethnic Minorities and the Han Majority in China’s Cities*
This paper asks if economic growth and steps towards a market economy have affected earnings gaps between the Han and nine large urban ethnic minorities: Zhuang, Hui, Manchurian, Tujia, Uighur, Miao, Tibetan, Mongol and Korean. It also asks how earnings premiums and earnings penalties have changed for the nine ethnic minorities. For the analysis we use a subsample of the 2005 China’s Inter-Census Survey. We find examples of three different changes over time in earnings premiums and earnings penalties: One ethnic minority for whom the development has been more favourable than for the Han majority; a second category in which development has been similar; and a third category for which development has been unfavourable. We conclude from the analysis that it can be misleading to infer the experience of one ethnic minority from that of another. JEL Classification: J15, J31, J71, P23 Keywords: earnings, ethnic minorities, Uighur, Tibetan, Korean Corresponding author: Björn Gustafsson Department of Social Work University of Gothenburg P.O. Box 720 SE 405 30 Göteborg Sweden E-mail: [email protected]
* Much of Xiuna Yang’s work was carried out when she was a visiting PhD student at the University of Gothenburg funded by a grant from the China State Scholarship Council (CSC). An earlier version of the paper was presented at the 6th IZA/CIER Annual Workshop on Research in Labor Economics, IZA, Bonn, Germany, July 18–19 2014 and the 6th International Symposium on Human Capital and Labor Market, October 30-31 2014, Central University of Finance and Economics, Beijing, P. R. China.

3
Earnings among nine ethnic minorities and the Han majority in China’s cities
1. Introduction
This paper asks if and how economic growth and steps towards a market economy in China have affected earnings gaps between the ethnic majority and nine large ethnic minorities: Zhuang, Hui, Manchurian, Tujia, Uighur, Miao, Tibetan, Mongol and Korean. Our confirmed hypothesis is that it is possible to find examples of three different outcomes: an ethnic minority for whom earnings development has been more favourable than for the Han majority; a second category in which development has been similar; and a third category in which development has been unfavourable.
Why is it interesting to study how earnings of China’s urban minorities relate to earnings of the majority? One reason is the large number of urban minority workers in China: six million in 2005 according to the data used for this paper. This equates to the number of workers in medium-sized EU countries, such as Belgium, Czech Republic and Sweden.
Another reason for interest in our research questions is that during the planning period China adopted a number of policies to promote equality between the Han majority and minorities in different parts of the state sector. This leads to a hypothesis that ethnic minority workers are more likely to be employed in public services than Han workers with the same characteristics (education, age, etc.). However, as the labour market has evolved and a number of private employers have emerged one would expect that China’s transformation has given room for unfavourable treatment of ethnic minorities. At the same time, the policy of opening up may have increased the skills possessed by some ethnic minority workers, and may therefore have been more favourable for them.
Surprisingly little is known about earnings among China’s substantial urban ethnic minorities and how they relate to earnings of the ethnic majority. We are aware of one study (Ding et al., 2013) that analysed the ethnic earnings gap in 1995, 2002 and 2007 using CHIP data. This study found that the earnings gap between ethnic minorities, as a single category, and the majority was relatively small, a picture similar to that reported by Zang and Li (2001) using data collected in 1998 in Beijing. However, these studies do not distinguish between different categories of ethnic minorities1. Several papers by Xiaowei Zang focus on differences in earnings among Uighur and Han workers in Urumchi, the capital of Xinjiang, in 2005 but do not cover other ethnic minorities or locations (Zang, 2008, 2010, 2011, 2012a and 2012b). Wu and Song (2014) used the same data for 2005 as we used in this paper, but concentrated on Uighur and Han workers in Xinjiang. Similarly concentrating on one minority, Hasmath (2008) studied Manchurian and Han workers in Beijing, Chang and Sun Lei (2008), Li and
1 Zhang (2004) analyzed data collected from a region with a high concentration of ethnic minorities in Gansu, and studied why the rural workers’ had earnings grown rather slow in that region. However, this paper does not distinguish between workers of different ethnicities.
4
Ding (2013) as well as Xie Wenxin (2012) studied Hui and Han workers in Ningxia or rural workers in Ningxia. Papers have been published, relating to our topic, by Maurer-Fazio and co-authors on the labour supply among China’s ethnic minorities and the majority. For example, Maurer-Fazio et al. (2010) show that several categories of female minorities had lower labour force participation rates than Han women in 2000.
We use a subsample of the 2005 China’s Inter-Census Survey for the analysis. Unlike many studies of earnings in urban China, not only do we investigate people with urban hukou, but also include those with rural hukou (rural to urban migrants). We document the raw earnings gap and analyse whether it has increased across the birth cohort of workers born between 1972 and 1989 and those born between 1944 and 1971. We interpret the cross-cohort differences as resulting from economic growth and reform. A characteristic of the Chinese labour market is that it is segmented along different dimensions such as ownership sector (private, State Owned Enterprises (SOEs), public service sector) in which a worker is employed, as well as earnings determination within each of these sectors.
This paper is organised into seven sections. Section 2 gives an outline of ethnicity in China’s urban labour market. Section 3 gives a brief introduction to data sources and portrays the nine largest ethnic minorities. In Section 4, we present some preliminary descriptive results regarding earnings and the earnings gap between ethnic minorities and the majority (Han). Sections 5 and section 6 present our estimation results regarding earnings and the earnings gap between ethnic minorities and the majority. Section 7 presents our conclusion.
2. Ethnicity in China’s urban labour market
In order to promote inter-ethnic peace, maintain political stability and preserve territorial integrity, the Chinese government has taken some measures to enhance the wellbeing of ethnic minorities. For example, regions with a high or relatively high concentration of ethnic minority inhabitants have been given autonomy. The People’s Republic of China defines autonomous regions at three levels: 1) Province: Inner Mongolia, Xinjiang, Guangxi, Ningxia and Tibet; 2) Prefecture; 3) County. Such an administrative structure makes it possible for the central and provincial level government to, for example, subsidise public expenditure and thereby promote human capital formation among ethnic minorities.
In addition, governmental organisations and State Owned Enterprises SOEs were during the planning époque instructed to preferentially hire ethnic minority workers if they hold similar or slightly lower qualifications than Han workers. Such a policy was easier to implement when workers were assigned to firms and other work units than later when a labour market emerged with more room for ethnic preferences to affect hiring decisions in SOEs. Furthermore, a private sector in which hiring and wage-setting decisions are largely unaffected by public policy has emerged and grown. From this one can hypothesise that ethnic minority workers are more likely than Han workers with the same characteristics to be

5
employed in public service organisations, but also that such differences have diminished over time.
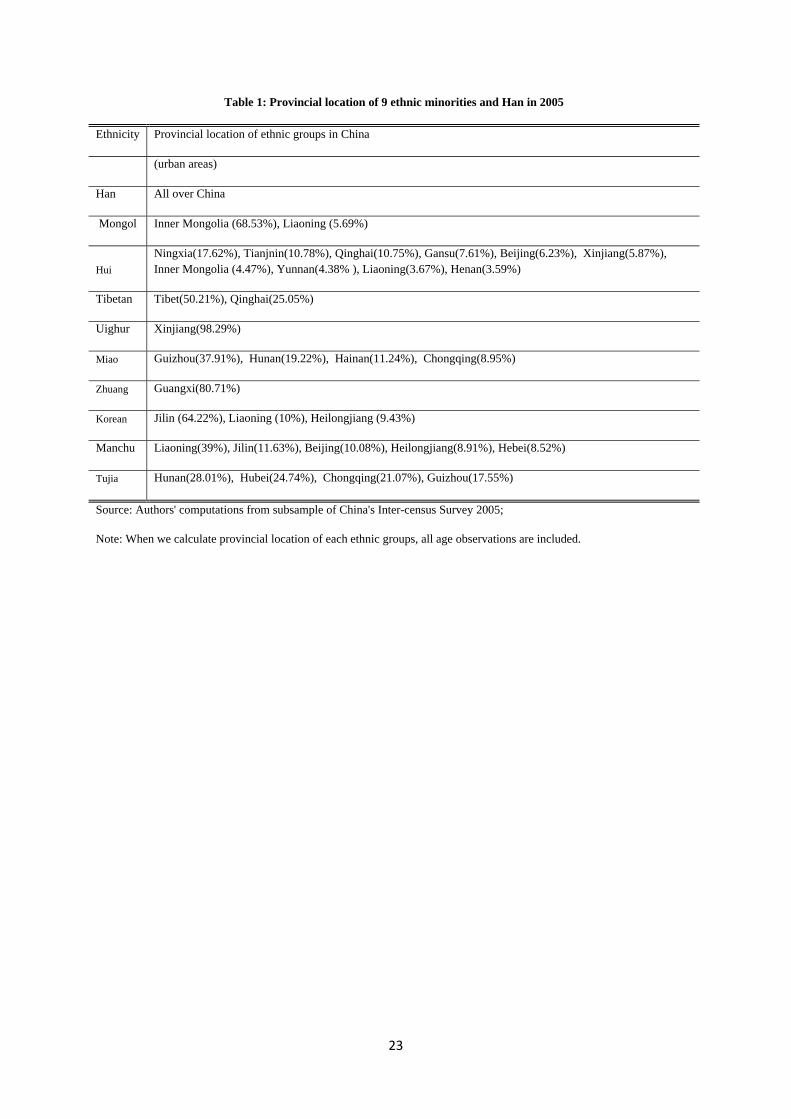
Our data makes it possible to study separately each of the nine largest ethnic minorities living in urban China.2 They are listed by name in Table 1, which also shows their concentration by province of domicile. Three of the ethnic minorities studied are concentrated in the southwest of China: Zhuang, Tujia and Miao. Tibetans are concentrated in the west. Uighurs are strongly concentrated in the northwest of China, with as many as 98 per cent living in Xinjiang autonomous region and Mongols in Inner Mongolia autonomous region. The northeast of China (Jilin, Liaoning, Heilongjiang) is the home of most people belonging to the Manchu and Korean ethnic minorities. The Hui ethnic group is dispersed over large parts of China with some concentration in Ningxia autonomous region.
<Insert Table 1 here>
There are plenty of reasons to anticipate an earnings gap between ethnic minorities and the Han majority. First, most of the minority workers reside in provinces with a lower level of industrialisation, although the opposite is the case among, for example, the Manchu and Korean groups who are concentrated in the northeast of China. Second, there are differences in human capital. For example, some minority workers have a poor command of Mandarin. They also tend to have shorter schooling and belong to different, and perhaps less useful, social networks to the majority ethnic group. All of these factors can make it difficult for some ethnic minorities to earn as much as Han.
Third, the productivity of minority workers can vary compared to Han workers with the same length of schooling. This could possibly be expected as a side effect of policies promoting higher education among ethnic minorities. Students belonging to some minority groups can be admitted into universities even though they achieve lower scores than Han students. If hiring decisions and earnings are determined not only by education level but also by ability (for example measured by an IQ test), one could claim that some ethnic minority workers are less productive than majority workers and therefore can be expected to achieve lower earnings. However, another process, which results in the opposite consequences on wage differentials between ethnic minority workers and majority workers with the same education, may exist. Minority students have, on average, more economic and social disadvantages to overcome than majority students. This could possibly mean that they need to show higher levels of ability than those from the Han. The issue of how earnings are related to ethnicity among persons with the same level of schooling is further complicated because minority students often study at different universities and colleges from Han students. As a result, earnings differ between graduates from different higher institutions of learning because of perceived or real differences in quality of education or the networks open to graduates of particular universities.
2 The People’s Republic of China recognises 55 ethnic minorities and the Han majority. Ethnicity status is stated on each person’s identity card (Shen Fen Zheng), on which one ethnicity is shown.
6
Fourthly, ethnic differences in employment and wages can also originate from the demand side. Employers and potential employers may, for various reasons, prefer workers of a particular ethnicity, reject workers solely on the basis of ethnicity, or assume that ethnicity is related to productivity levels. For example Maurer-Fazio (2012) reports results from a large-scale field experiment investigating how Chinese firms respond to Internet job board applications from ethnic minorities and Han applicants. Names were used to signal ethnicity. The results indicate that workers from the ethnic minorities studied (Tibetan, Mongolian and Uighur) are less likely to be invited to an interview than Han applicants. Of course, there could be many other reasons for ethnic differences in employment and earnings levels that we have not mentioned here.
3. Data and portraying the largest ethnic minorities
For this study, we use a subsample of the 2005 China’s Inter-Census Survey. This survey took place in November 2005. It is a 1 per cent sample of the current population derived by a three-stage cluster sampling method as further described by Weimin (no year). We have access to 20 per cent of the observations of this survey data, based on which it is possible to study each of the nine largest ethnic minorities and the majority (Han) living in urban China with some precision. In addition, it is possible to define a residual category consisting of workers of other minorities. We study male and female workers who have urban hukou as well as workers with rural hukou who have lived in a city for at least six months at the time of the survey. We restrict the population under study to those aged between 16 and 60 years and exclude students and agricultural sector workers according to the Inter-Census Survey.
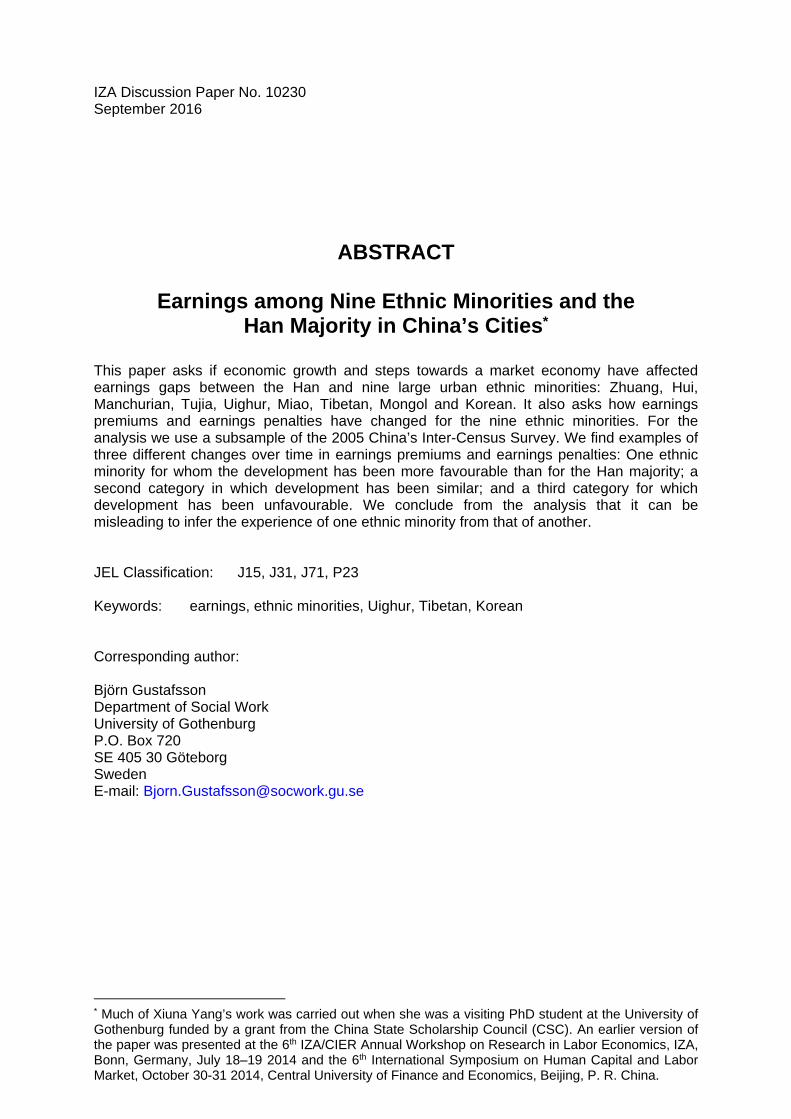
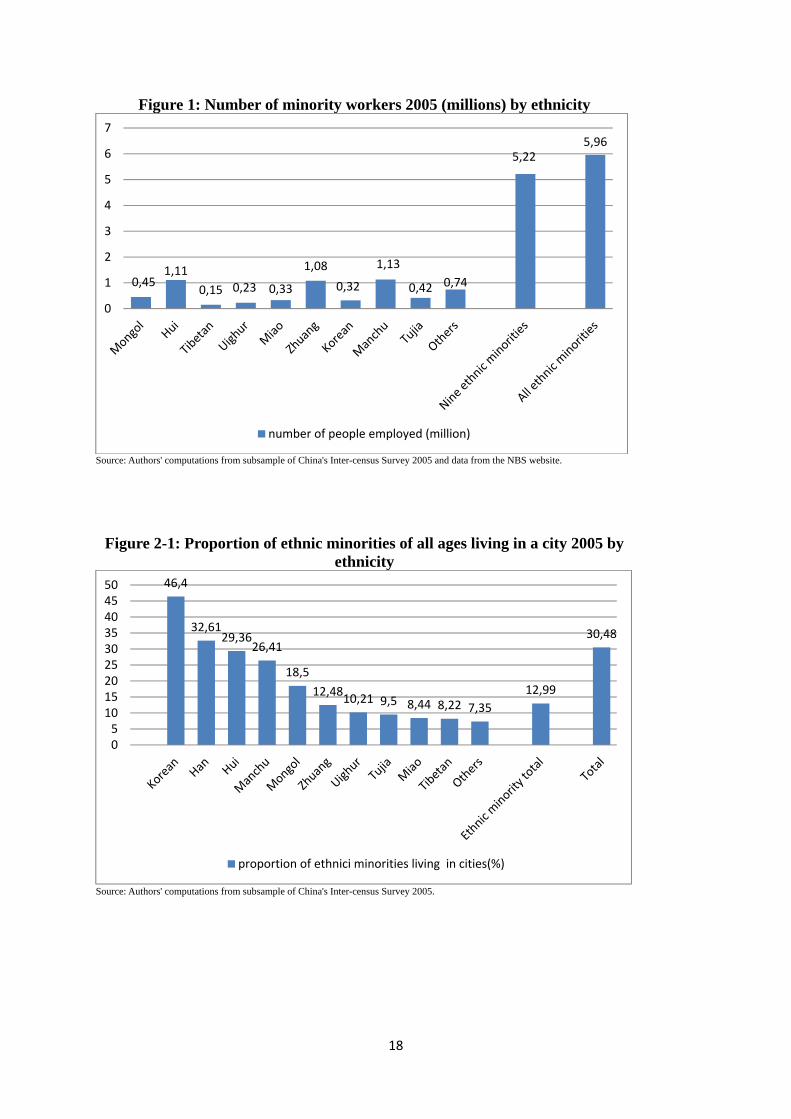
<Insert Figure 1 here>
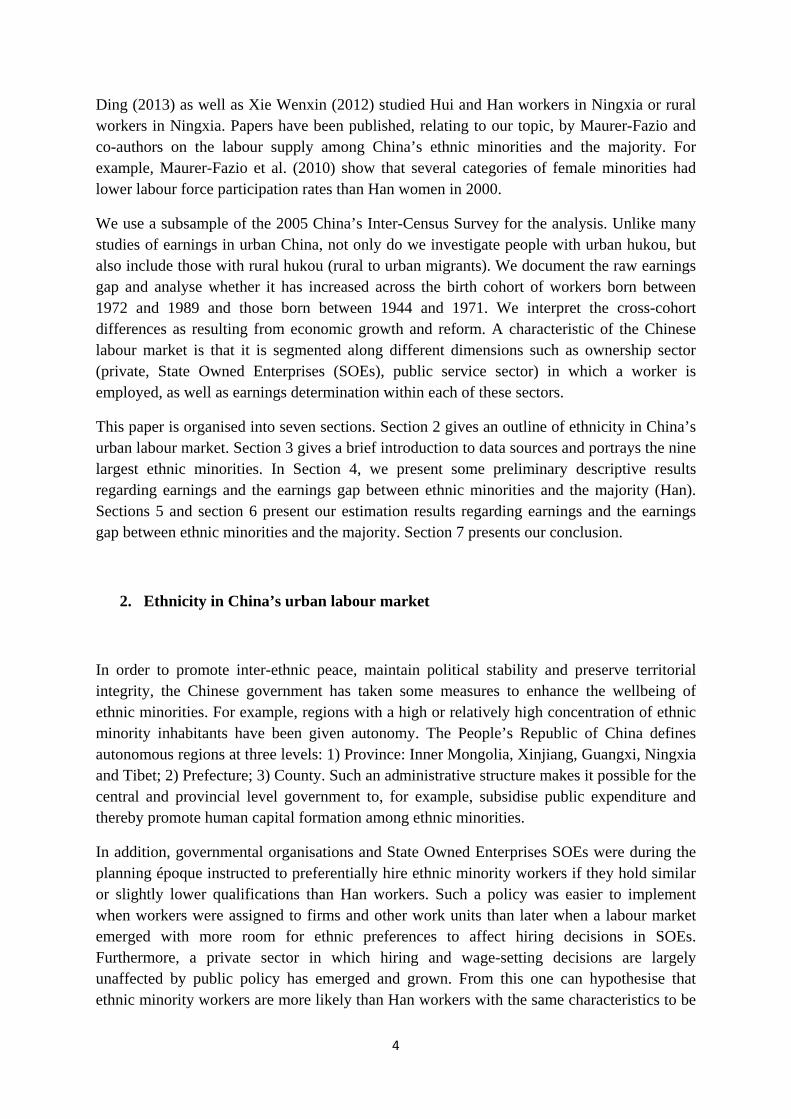
Figure 1 indicates that there are not less than six million people who belong to one of the nine ethnic minorities or the residual category, are of active employment age and have a job. Different ethnic groups have different proportions of people living in cities. This is illustrated in Figure 2-1 which shows that the highest concentration in urban areas is among the Korean minority (46 per cent), which is a higher percentage than the Han majority (33 per cent). The lowest proportion urbanised is reported for the Tibetan minority (only 8 per cent).
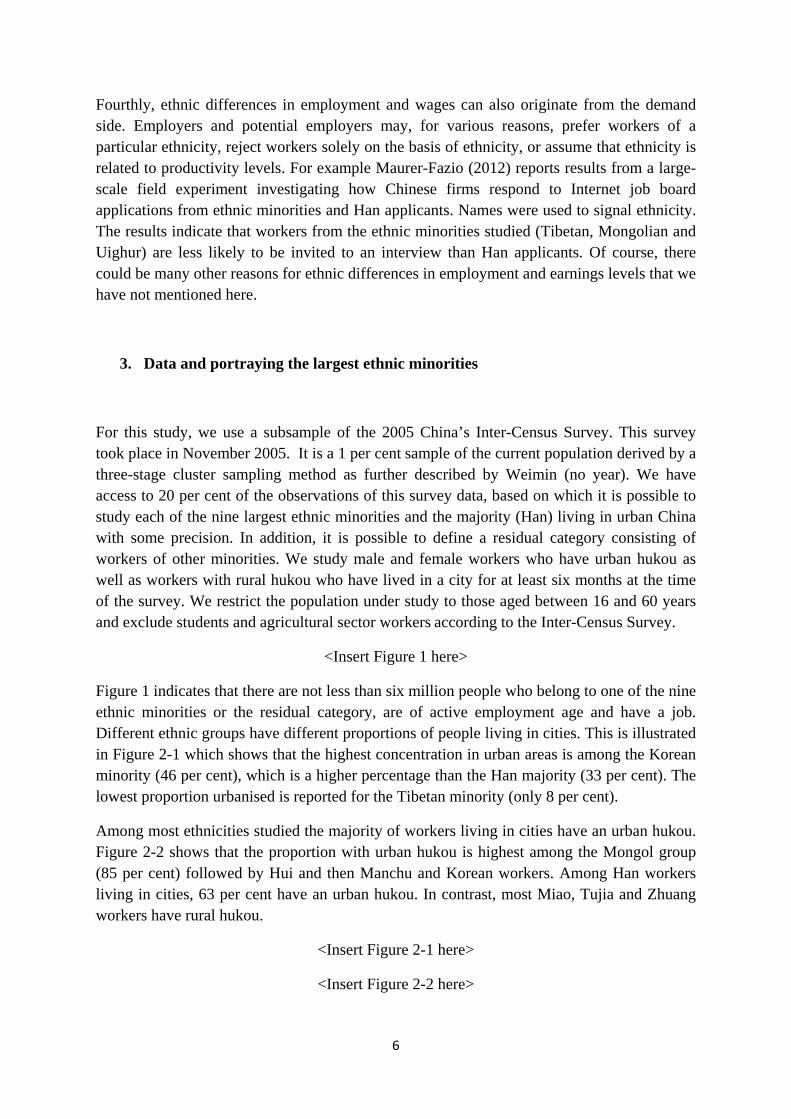
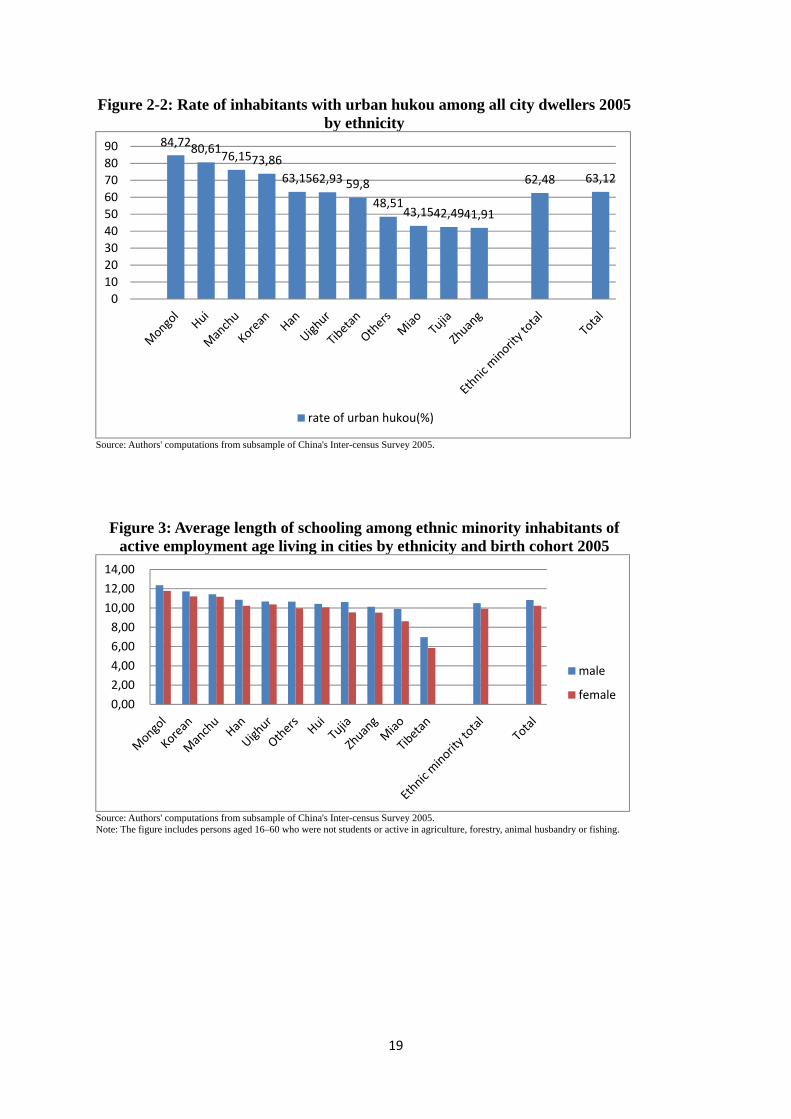
Among most ethnicities studied the majority of workers living in cities have an urban hukou. Figure 2-2 shows that the proportion with urban hukou is highest among the Mongol group (85 per cent) followed by Hui and then Manchu and Korean workers. Among Han workers living in cities, 63 per cent have an urban hukou. In contrast, most Miao, Tujia and Zhuang workers have rural hukou.
<Insert Figure 2-1 here>
<Insert Figure 2-2 here>
7
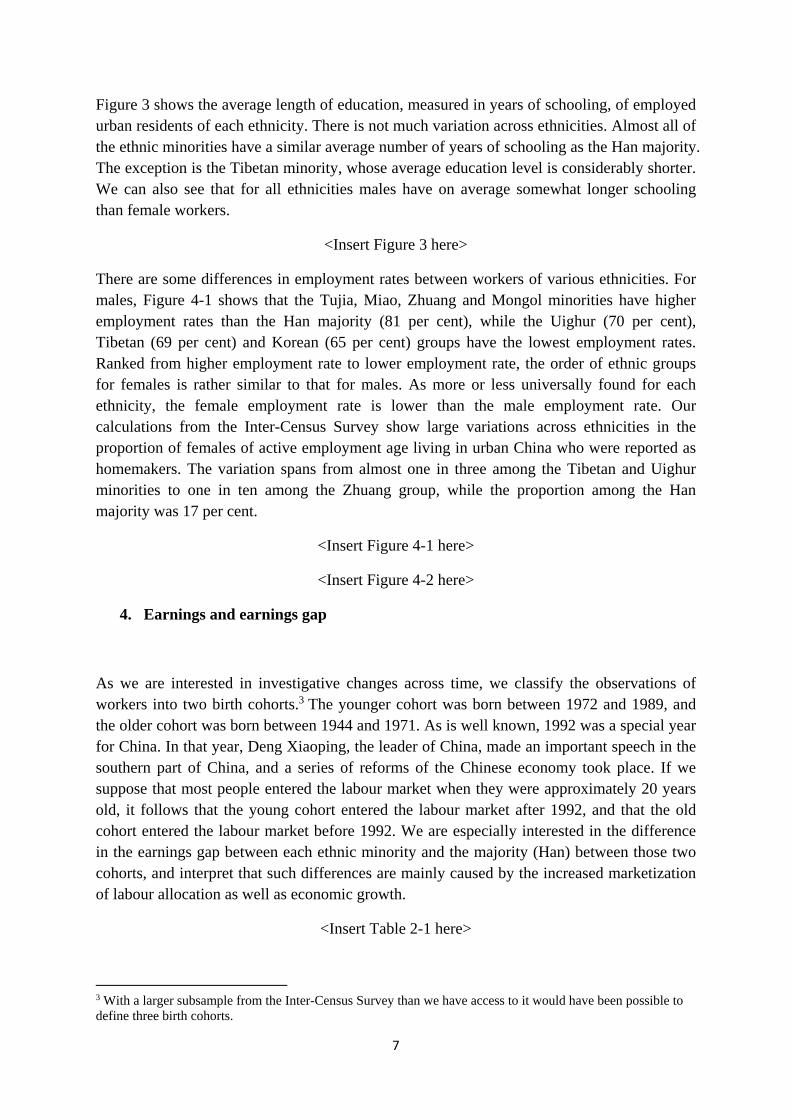
Figure 3 shows the average length of education, measured in years of schooling, of employed urban residents of each ethnicity. There is not much variation across ethnicities. Almost all of the ethnic minorities have a similar average number of years of schooling as the Han majority. The exception is the Tibetan minority, whose average education level is considerably shorter. We can also see that for all ethnicities males have on average somewhat longer schooling than female workers.
<Insert Figure 3 here>
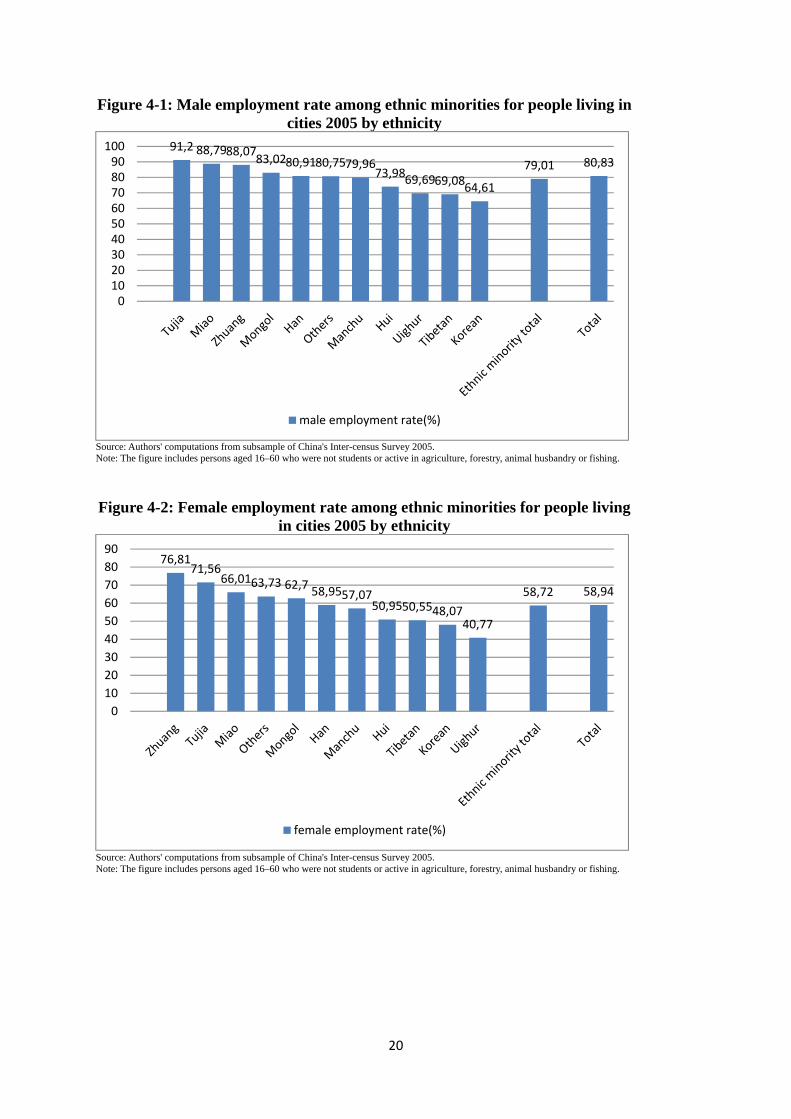
There are some differences in employment rates between workers of various ethnicities. For males, Figure 4-1 shows that the Tujia, Miao, Zhuang and Mongol minorities have higher employment rates than the Han majority (81 per cent), while the Uighur (70 per cent), Tibetan (69 per cent) and Korean (65 per cent) groups have the lowest employment rates. Ranked from higher employment rate to lower employment rate, the order of ethnic groups for females is rather similar to that for males. As more or less universally found for each ethnicity, the female employment rate is lower than the male employment rate. Our calculations from the Inter-Census Survey show large variations across ethnicities in the proportion of females of active employment age living in urban China who were reported as homemakers. The variation spans from almost one in three among the Tibetan and Uighur minorities to one in ten among the Zhuang group, while the proportion among the Han majority was 17 per cent.
<Insert Figure 4-1 here>
<Insert Figure 4-2 here>
4. Earnings and earnings gap
As we are interested in investigative changes across time, we classify the observations of workers into two birth cohorts.3 The younger cohort was born between 1972 and 1989, and the older cohort was born between 1944 and 1971. As is well known, 1992 was a special year for China. In that year, Deng Xiaoping, the leader of China, made an important speech in the southern part of China, and a series of reforms of the Chinese economy took place. If we suppose that most people entered the labour market when they were approximately 20 years old, it follows that the young cohort entered the labour market after 1992, and that the old cohort entered the labour market before 1992. We are especially interested in the difference in the earnings gap between each ethnic minority and the majority (Han) between those two cohorts, and interpret that such differences are mainly caused by the increased marketization of labour allocation as well as economic growth.
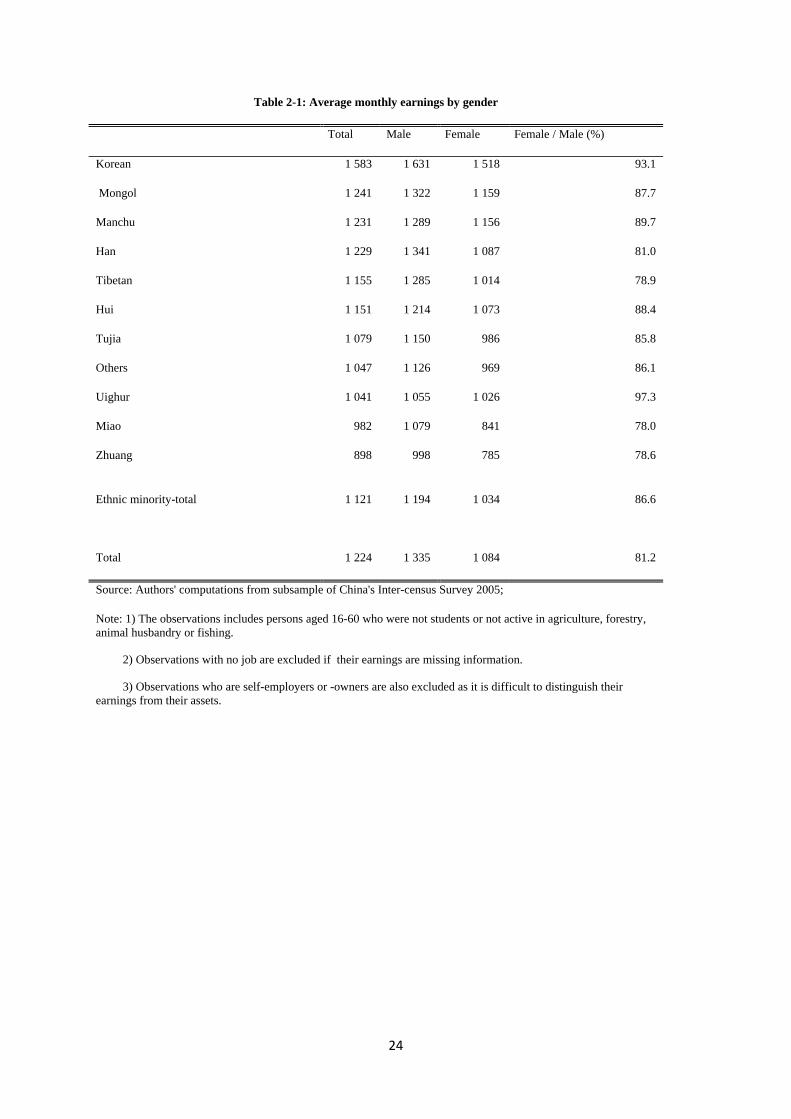
<Insert Table 2-1 here>
3 With a larger subsample from the Inter-Census Survey than we have access to it would have been possible to define three birth cohorts.

8
First, we display some descriptive results showing the average earnings and earnings gap by gender for each ethnic minority studied. We report in the second column of Table 2-1 (for the two birth cohorts combined) that the average monthly earning of the Korean minority is the highest among all ethnicities including the Han. Male Korean workers earned on average 22 per cent more than male Han workers, while female Korean workers earned as much as 40 per cent more than female Han workers (see Table 2-2). The estimates of the average earnings among Mongol and Manchu workers are close to the estimate for Han workers, and this applies to both genders. For six of the ethnic minority groups and the residual group average earnings are lower than among the Han majority. The largest negative earnings gap with the Han majority is observed for the Zhuang minority: 26 per cent among male workers and 28 per cent among female workers; and for the Miao group, 20 per cent for male workers and 23 per cent for female workers. For all ethnicities, female earnings are lower than male earnings, unsurprisingly. The gender earnings gap is small among the Uighur (3 per cent) and Korean (7 per cent) minorities, and is around 20 per cent among several groups: Miao, Zhuang, Tibetan and Han.
Table 2.2 also reports the Gini Coefficient of earnings, defined and measured in the next section for each ethnic minority. Earnings among Tibetan and Korean workers are rather unequally distributed with Gini Coefficients above 0.4. Uighur and Miao workers have the lowest Gini Coefficient, just under 0.3, and the Gini coefficient for the ethnic majority is 0.36.
<Insert Table 2-2 here>
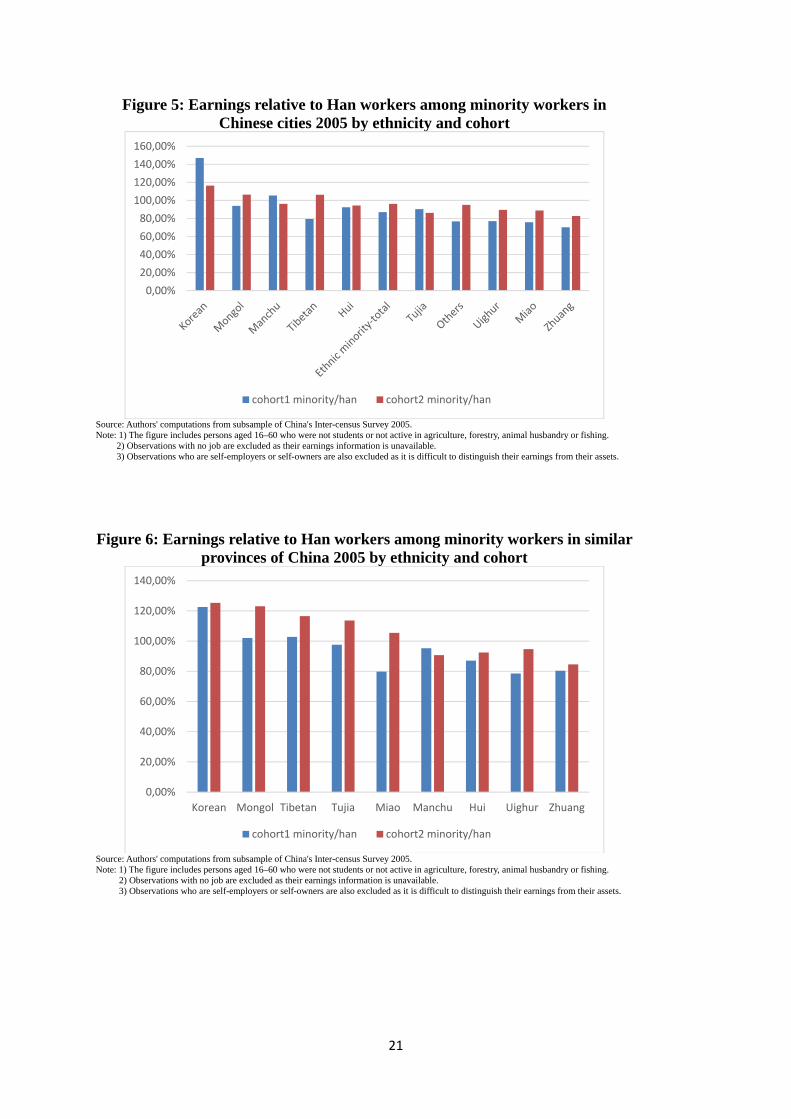
<Insert Figure 5 here>
The remainder of this section uses the available data to describe how average earnings differ by the defined birth cohorts. All bars in Figure 5 represent the percentage of each ethnic minority’s earnings in proportion to earnings of the Han majority in the same cohort. Here we have combined males and females, as figures for males and females are rather similar. The blue bar represents the young cohort and the red bar represents the old cohort. This graph shows that, compared with the Han majority, earnings of the Korean minority are clearly and increasingly higher. There are few differences across cohorts for Manchu, Hui and Tujia workers. Among the other ethnic minorities, the income gap compared to the Han majority has increased across cohorts.
<Insert Figure 6 here>
Figure 5 is based on an analysis of observations from across China. As spatial distribution across Chinese provinces differs among ethnic minorities compared to that of the Han majority, we compare the earnings between each ethnic minority and Han workers living in
9
the corresponding province (as shown in Table 1). 4 Figure 6 shows the results. The impression from this figure is similar to that gained from Figure 5 as far as levels of minority earnings relative to majority earnings are concerned. This exercise demonstrates that the spatial distribution of minority ethnicities is not the single most important reason for ethnic earnings gaps in urban China. Deeper analysis is therefore required, and the next section analyses the importance of individual characteristics.
5. A personal characteristics analysis of earnings determination
In order to gain a better understanding of whether ethnicity is related to earnings after controlling for individual factors, such as gender, age, education, hukou, location and so on, we specified and estimated a Heckman sample-selection model for males and females respectively.5
The earnings function is as follows:
iii uxy
The dependent variable iy is the logarithm of monthly earnings and ix represents a set of
independent variables. It is only possible in reality to observe the earnings of those who are employed. This might not have been a large problem if we had studied earnings in urban China during the planning epoch, when the labour force participation rate was very high. However, since the end of the 1990s, when workers, particularly females, left the workforce and unemployment surfaced, this has no longer been the case (see, for example, Gustafsson and Ding, 2013). If we use the OLS method to estimate the model and merely run a regression on the observations on the full sample, those observations with missing values of
iy will not be included in the analysis. Due to the possibility of yielding biased and
inconsistent estimates, we do not use the OLS regression estimated on a subset of individuals in this study; we prefer the Heckman method. The earnings function and selection function are as follows:
iii uxy
)0( vzIs ii
It is possible to observe earnings when a person participates in the labour market. A binomial probit or logit model that predicts the person’s probability of participating in the labour
market can be used. In this circumstance, is is set to zero or one based on the factors
4 This is done as follows, taking the Uighur group as an example: As the Uighur minority is concentrated in Xinjiang, we compare the earnings of Uighur observations in Xinjiang and the earnings of Han observations in Xinjiang. Similarly, as the Korean minority is concentrated in Jilin, Liaoning and Heilongjiang, we compare the earnings of Korean observations in the three provinces and the earnings of Han observations in the three provinces. 5 The 2005 China’s Inter-Census Survey does not include questions on language proficiency.
10
underlying the decision. We assume that the independent variables in X satisfy the zero-conditional-mean assumption E [XU] =0. The I ( ) function equals 1 if its argument is true,
and is zero otherwise. We observe iy if is = 1. The error term V in the selection equation is
assumed to have a zero-conditional mean: E [ZV] =0. We assume that V follows a standard normal distribution. A full maximum-likelihood procedure to jointly estimate and is
used.6
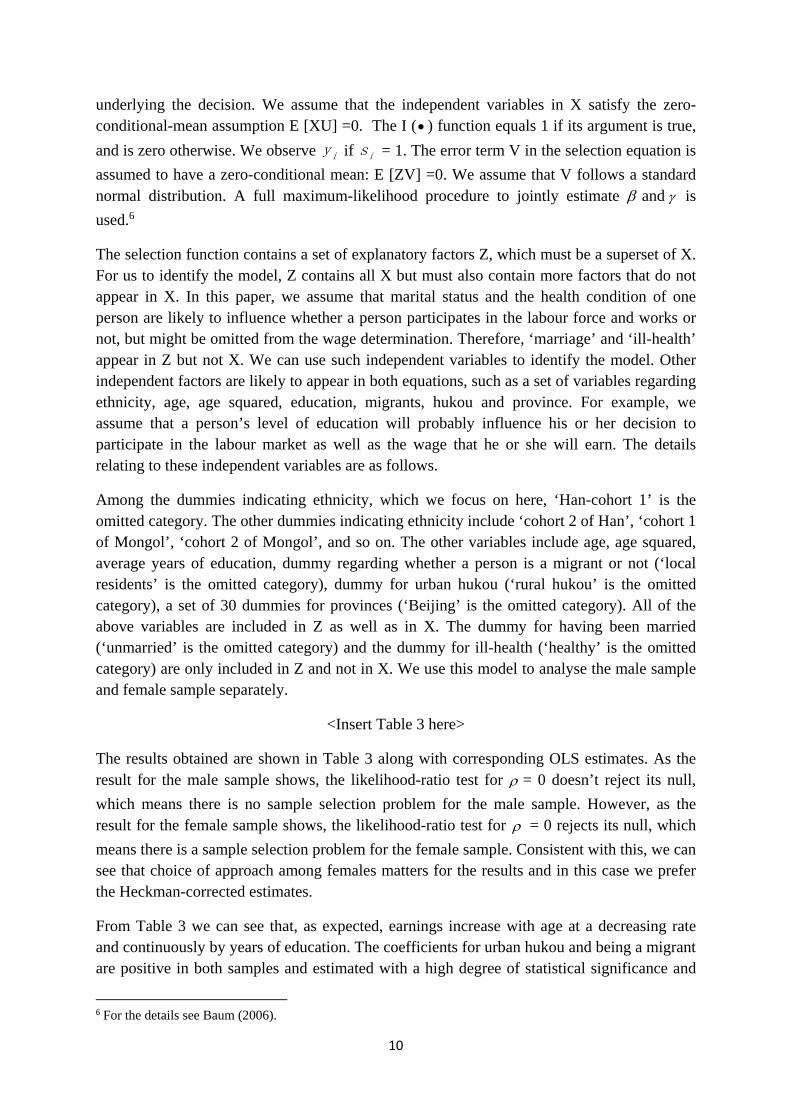
The selection function contains a set of explanatory factors Z, which must be a superset of X. For us to identify the model, Z contains all X but must also contain more factors that do not appear in X. In this paper, we assume that marital status and the health condition of one person are likely to influence whether a person participates in the labour force and works or not, but might be omitted from the wage determination. Therefore, ‘marriage’ and ‘ill-health’ appear in Z but not X. We can use such independent variables to identify the model. Other independent factors are likely to appear in both equations, such as a set of variables regarding ethnicity, age, age squared, education, migrants, hukou and province. For example, we assume that a person’s level of education will probably influence his or her decision to participate in the labour market as well as the wage that he or she will earn. The details relating to these independent variables are as follows.
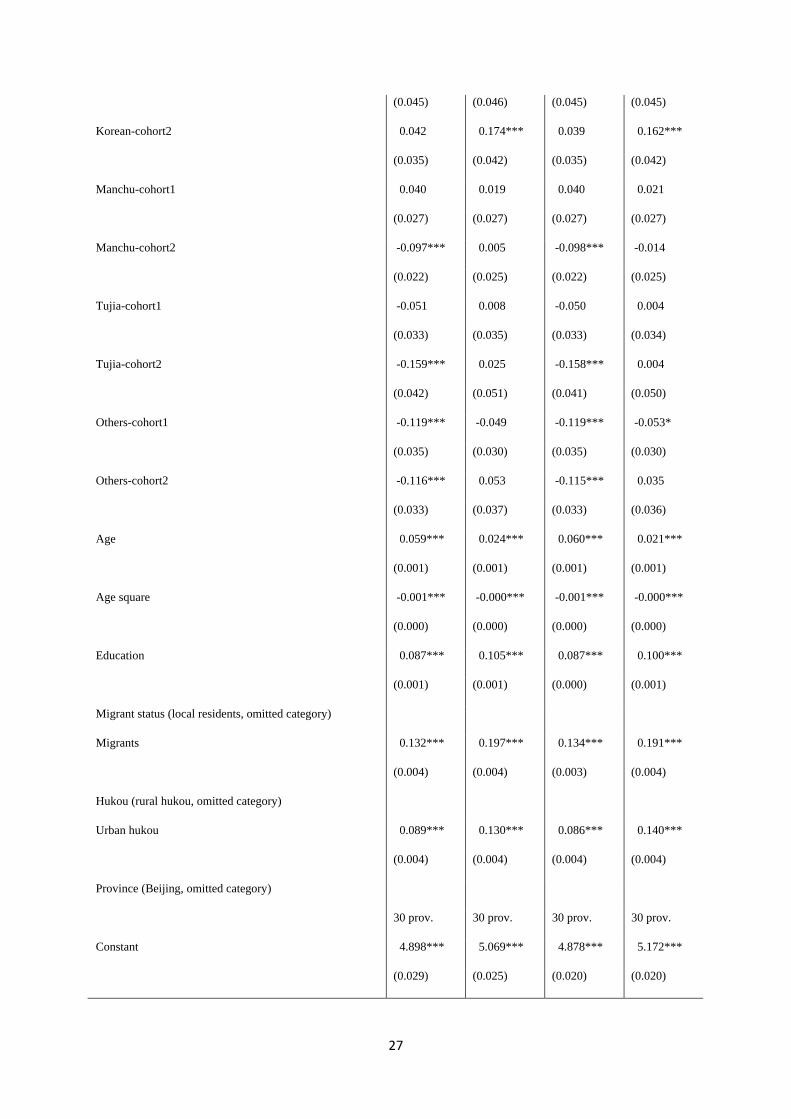
Among the dummies indicating ethnicity, which we focus on here, ‘Han-cohort 1’ is the omitted category. The other dummies indicating ethnicity include ‘cohort 2 of Han’, ‘cohort 1 of Mongol’, ‘cohort 2 of Mongol’, and so on. The other variables include age, age squared, average years of education, dummy regarding whether a person is a migrant or not (‘local residents’ is the omitted category), dummy for urban hukou (‘rural hukou’ is the omitted category), a set of 30 dummies for provinces (‘Beijing’ is the omitted category). All of the above variables are included in Z as well as in X. The dummy for having been married (‘unmarried’ is the omitted category) and the dummy for ill-health (‘healthy’ is the omitted category) are only included in Z and not in X. We use this model to analyse the male sample and female sample separately.
<Insert Table 3 here>
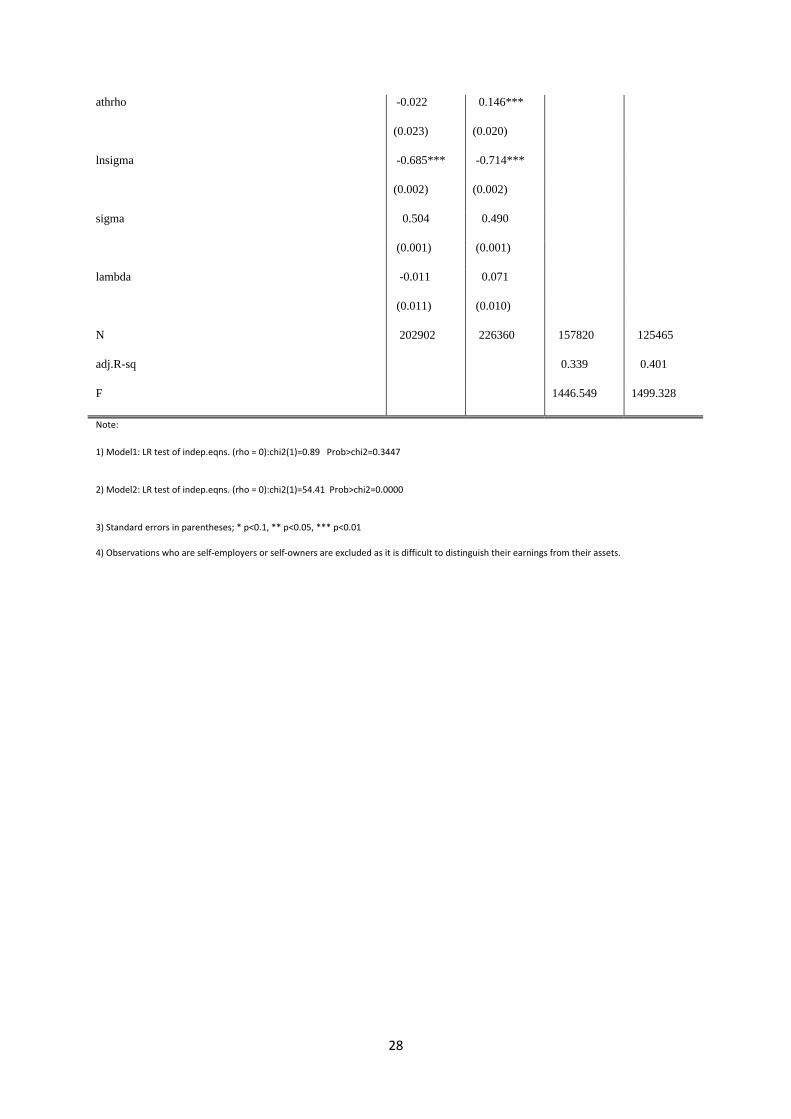
The results obtained are shown in Table 3 along with corresponding OLS estimates. As the result for the male sample shows, the likelihood-ratio test for = 0 doesn’t reject its null,
which means there is no sample selection problem for the male sample. However, as the result for the female sample shows, the likelihood-ratio test for = 0 rejects its null, which
means there is a sample selection problem for the female sample. Consistent with this, we can see that choice of approach among females matters for the results and in this case we prefer the Heckman-corrected estimates.
From Table 3 we can see that, as expected, earnings increase with age at a decreasing rate and continuously by years of education. The coefficients for urban hukou and being a migrant are positive in both samples and estimated with a high degree of statistical significance and
6 For the details see Baum (2006).

11
are somewhat higher for females. The coefficients of the set of 30 dummies for provinces are omitted in Table 3 for reasons of brevity.
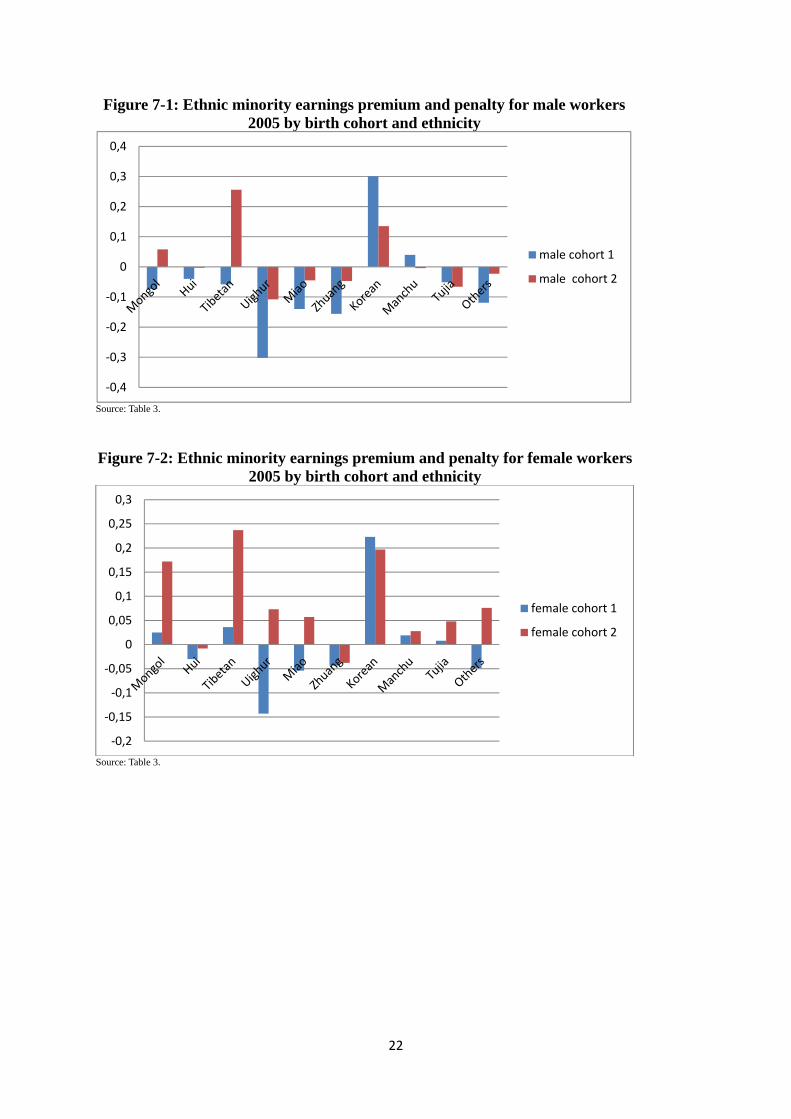
<Insert Figure 7-1 here>
<Insert Figure 7-2 here>
Turning to the main interest of the study, let us examine the results regarding ethnicity for the two cohorts. They are also visualised in Figure 7-1 and Figure 7-2, both based on the Heckman-corrected results reported in Table 3. In each figure the blue bar represents the difference between the coefficient of an ethnic minority’s young cohort (cohort 1) and the corresponding coefficient for the Han majority. Similarly, the red bar represents the difference between the coefficient of each ethnic minority’s old cohort (cohort 2) and the coefficient of the Han majority’s old cohort (cohort 2). From Figure 7-1, for males we can see that only Korean’s and to a smaller extend Manchu’s blue bar is higher than the corresponding red bar. In most other cases the blue bars are lower than the corresponding red bar. From Figure 7-2, for females we can again see that only Korean’s blue bar is higher than the corresponding red bar, although the difference is small. Particularly large cross-cohort differences are reported for Tibetan and Uighur males, followed by Mongol females.
6. A sector analysis of earnings determination
In this section the complexities that workers are employed in different types of sectors and that ethnicity can play a role in which sector they are employed, and that this could have changed over time, are introduced into the study. The possibility for ethnicity to play different roles for earnings determination in the various sectors, and that this can have changed over time is also introduced.
We disaggregate the labour market into three sectors: public service sectors, SOEs (or state firms) and private enterprises. Here ‘public service sectors’ include government offices, party agencies (Dang Zheng Ji Guan), schools, universities, hospitals, research institutes, social welfare agencies and so on (Shi Ye Dan Wei). There are some differences between SOEs and public service sectors when it comes to hiring and remuneration. Since 1978, state firms have been oriented towards market competition, whereas government agencies and public organisations are not under market pressure to the same extent in their role, which concerns redistribution, providing social goods and promoting justice. Jobs in public service sectors and SOEs are often called ‘good jobs’, as they are associated with security, relatively high wages, access to subsidized health care and pensions, and so on. The private sector is made up of small as well as large firms and employed 56 per cent of the old cohort and 74 per cent of the young cohort according to our data .
In the analysis, we pay close attention to two issues: 1) How does ethnic minority status relate to employment probability in each of the three sectors and how has this changed across the two cohorts for each ethnic minority studied compared with the Han majority? 2) How have earnings determinations in each of the three sectors changed across the two cohorts for
12
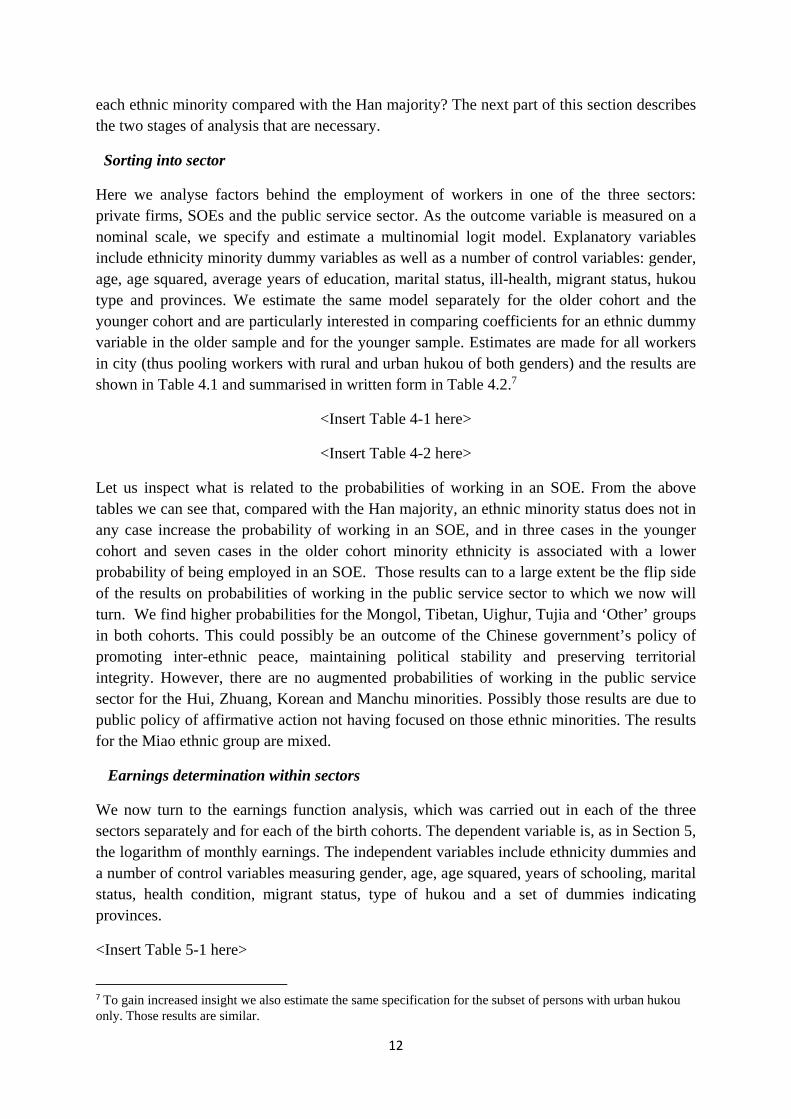
each ethnic minority compared with the Han majority? The next part of this section describes the two stages of analysis that are necessary.
Sorting into sector
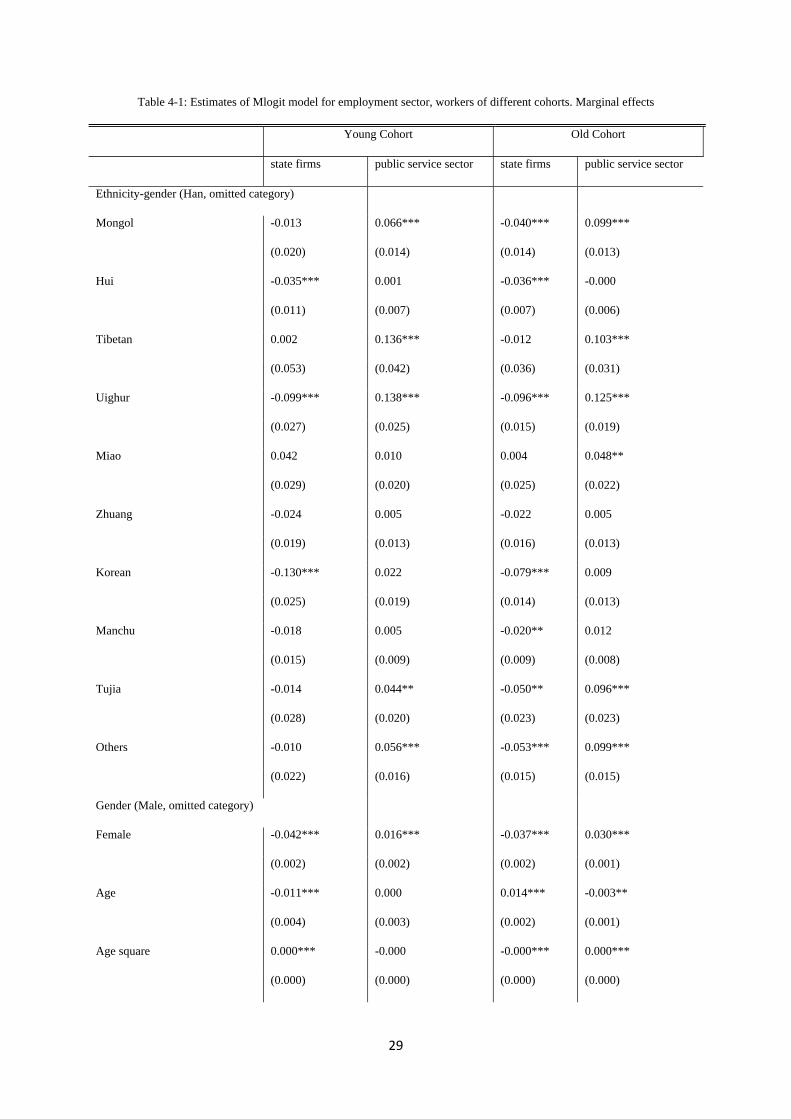
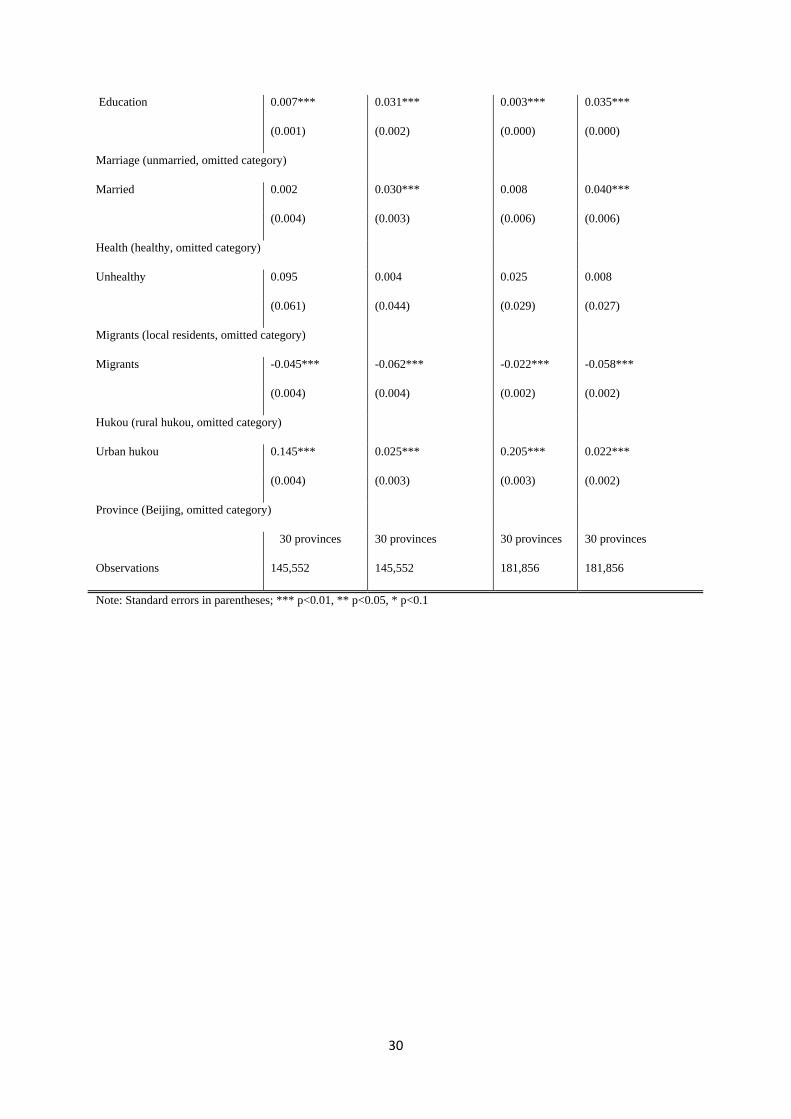
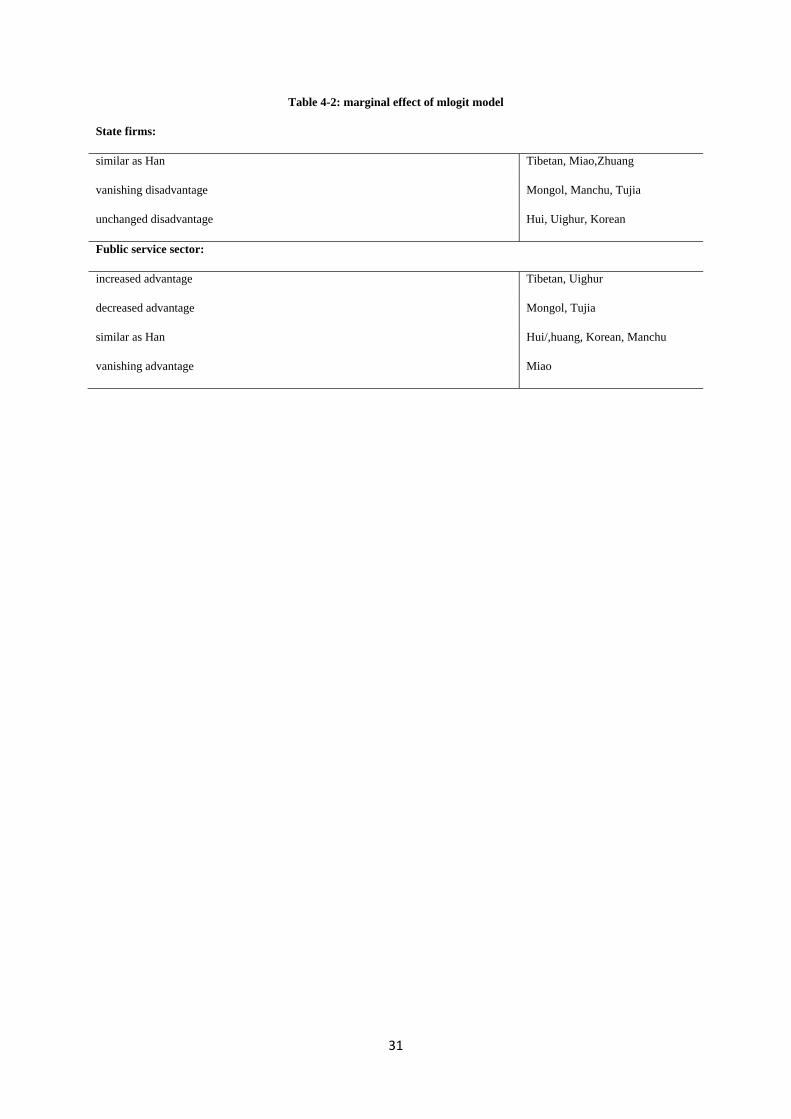
Here we analyse factors behind the employment of workers in one of the three sectors: private firms, SOEs and the public service sector. As the outcome variable is measured on a nominal scale, we specify and estimate a multinomial logit model. Explanatory variables include ethnicity minority dummy variables as well as a number of control variables: gender, age, age squared, average years of education, marital status, ill-health, migrant status, hukou type and provinces. We estimate the same model separately for the older cohort and the younger cohort and are particularly interested in comparing coefficients for an ethnic dummy variable in the older sample and for the younger sample. Estimates are made for all workers in city (thus pooling workers with rural and urban hukou of both genders) and the results are shown in Table 4.1 and summarised in written form in Table 4.2.7
<Insert Table 4-1 here>
<Insert Table 4-2 here>
Let us inspect what is related to the probabilities of working in an SOE. From the above tables we can see that, compared with the Han majority, an ethnic minority status does not in any case increase the probability of working in an SOE, and in three cases in the younger cohort and seven cases in the older cohort minority ethnicity is associated with a lower probability of being employed in an SOE. Those results can to a large extent be the flip side of the results on probabilities of working in the public service sector to which we now will turn. We find higher probabilities for the Mongol, Tibetan, Uighur, Tujia and ‘Other’ groups in both cohorts. This could possibly be an outcome of the Chinese government’s policy of promoting inter-ethnic peace, maintaining political stability and preserving territorial integrity. However, there are no augmented probabilities of working in the public service sector for the Hui, Zhuang, Korean and Manchu minorities. Possibly those results are due to public policy of affirmative action not having focused on those ethnic minorities. The results for the Miao ethnic group are mixed.
Earnings determination within sectors
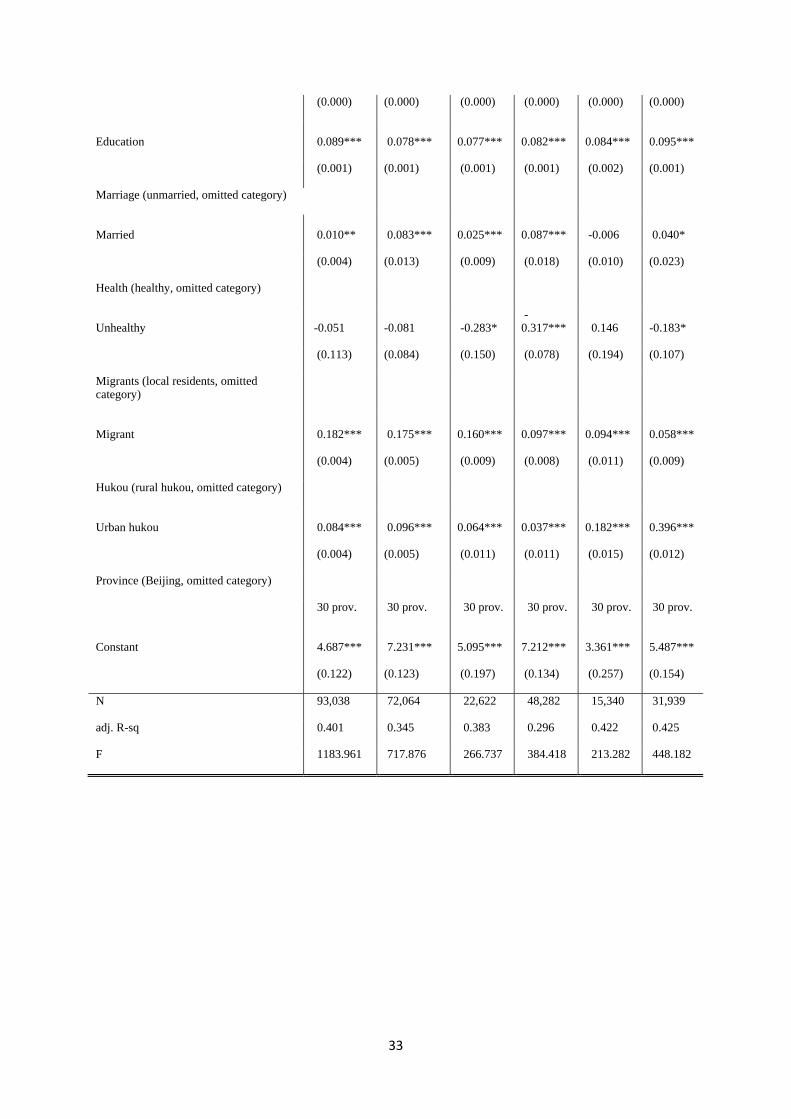
We now turn to the earnings function analysis, which was carried out in each of the three sectors separately and for each of the birth cohorts. The dependent variable is, as in Section 5, the logarithm of monthly earnings. The independent variables include ethnicity dummies and a number of control variables measuring gender, age, age squared, years of schooling, marital status, health condition, migrant status, type of hukou and a set of dummies indicating provinces.
<Insert Table 5-1 here>
7 To gain increased insight we also estimate the same specification for the subset of persons with urban hukou only. Those results are similar.
13
<Insert Table 5-2 here>
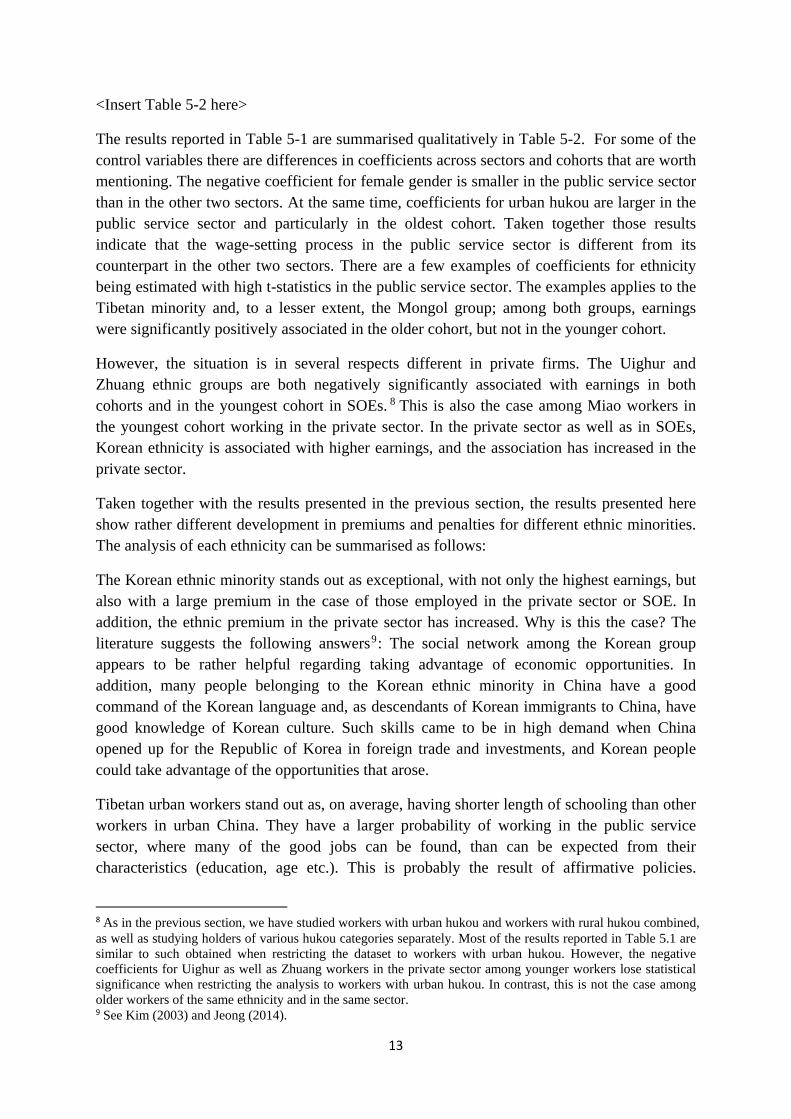
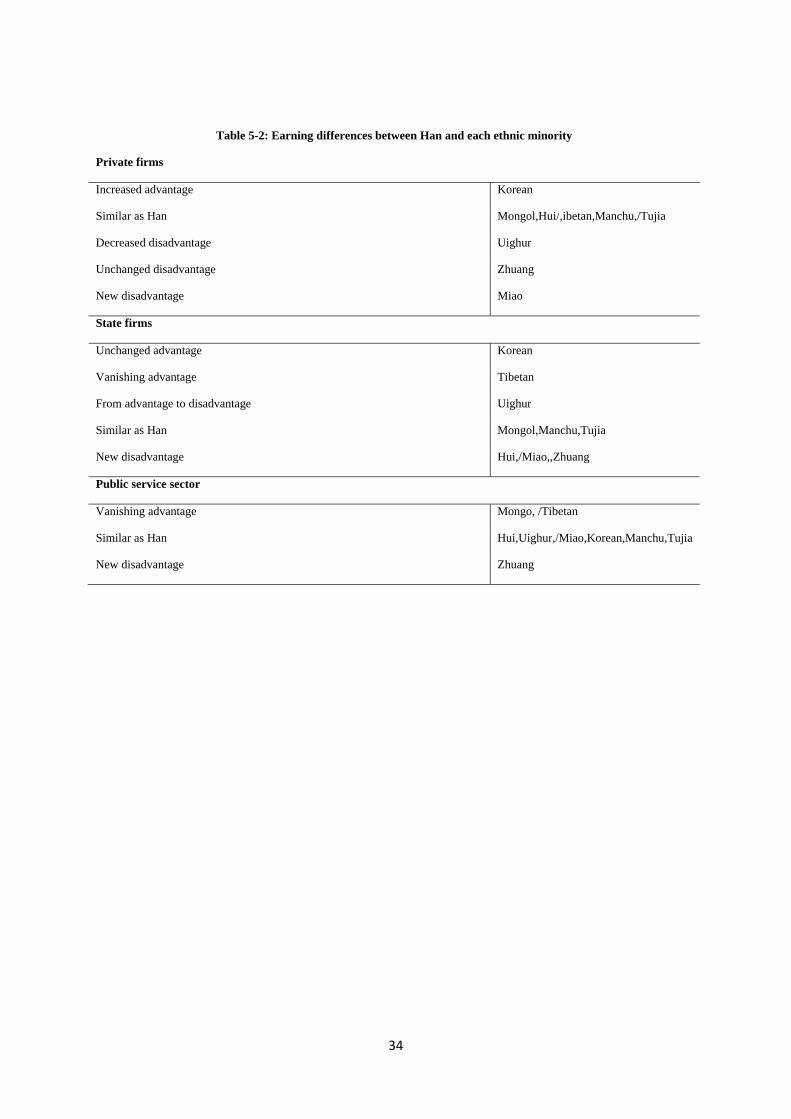
The results reported in Table 5-1 are summarised qualitatively in Table 5-2. For some of the control variables there are differences in coefficients across sectors and cohorts that are worth mentioning. The negative coefficient for female gender is smaller in the public service sector than in the other two sectors. At the same time, coefficients for urban hukou are larger in the public service sector and particularly in the oldest cohort. Taken together those results indicate that the wage-setting process in the public service sector is different from its counterpart in the other two sectors. There are a few examples of coefficients for ethnicity being estimated with high t-statistics in the public service sector. The examples applies to the Tibetan minority and, to a lesser extent, the Mongol group; among both groups, earnings were significantly positively associated in the older cohort, but not in the younger cohort.
However, the situation is in several respects different in private firms. The Uighur and Zhuang ethnic groups are both negatively significantly associated with earnings in both cohorts and in the youngest cohort in SOEs. 8 This is also the case among Miao workers in the youngest cohort working in the private sector. In the private sector as well as in SOEs, Korean ethnicity is associated with higher earnings, and the association has increased in the private sector.
Taken together with the results presented in the previous section, the results presented here show rather different development in premiums and penalties for different ethnic minorities. The analysis of each ethnicity can be summarised as follows:
The Korean ethnic minority stands out as exceptional, with not only the highest earnings, but also with a large premium in the case of those employed in the private sector or SOE. In addition, the ethnic premium in the private sector has increased. Why is this the case? The literature suggests the following answers9: The social network among the Korean group appears to be rather helpful regarding taking advantage of economic opportunities. In addition, many people belonging to the Korean ethnic minority in China have a good command of the Korean language and, as descendants of Korean immigrants to China, have good knowledge of Korean culture. Such skills came to be in high demand when China opened up for the Republic of Korea in foreign trade and investments, and Korean people could take advantage of the opportunities that arose.
Tibetan urban workers stand out as, on average, having shorter length of schooling than other workers in urban China. They have a larger probability of working in the public service sector, where many of the good jobs can be found, than can be expected from their characteristics (education, age etc.). This is probably the result of affirmative policies.
8 As in the previous section, we have studied workers with urban hukou and workers with rural hukou combined, as well as studying holders of various hukou categories separately. Most of the results reported in Table 5.1 are similar to such obtained when restricting the dataset to workers with urban hukou. However, the negative coefficients for Uighur as well as Zhuang workers in the private sector among younger workers lose statistical significance when restricting the analysis to workers with urban hukou. In contrast, this is not the case among older workers of the same ethnicity and in the same sector. 9 See Kim (2003) and Jeong (2014).

14
However, while the older cohort enjoyed an earnings premium when employed in the public service sector, this has disappeared in the younger cohort.10
Uighur workers, Miao workers and Zhuang workers are all relatively similar to Han workers when it comes to length of schooling. Uighur workers of both cohorts and Miao workers of the older cohort have a larger probability of working in the public service sector than can be expected from their characteristics. This is probably the outcome of affirmative policies, which, according to the findings discussed above, also seems to have benefited Tibetan workers. However, similar results are not obtained for Zhuang workers. In contrast, there are several examples of Uighur, Zhuang and Miao workers facing an earnings penalty compared to Han workers with the same characteristics employed in the same sector.
As has been shown for several other ethnic minorities, Tujia and Mongol workers are more likely than Han workers with the same characteristics to be employed in the public service sector. However, unlike Uighur, Miao and Zhuang workers, there are little signs of an earnings penalty for such workers. Finally, there is limited evidence that Hui and Manchu ethnicities enjoy an advantage or suffer a penalty when sorting workers into sectors, and there is no evidence of an ethnic penalty or bonus among those working in a particular sector.
7. Conclusion
This paper uses a subsample of the 2005 China’s Inter-Census Survey to investigate if and how economic growth and steps toward a market economy in China have affected the earnings gaps between the majority (Han) and the nine largest ethnic minorities: Zhuang, Hui, Manchu, Tujia, Uighur, Miao, Tibetan, Mongol and Korean.
It was found that, on average, male urban ethnic minority workers earned 11 per cent less than Han workers in 2005, while for female workers the gap was not more than 5 per cent. However, those numbers hide variations within the ethnic minority population. For example, male and female Korean minority workers were found to earn 29 per cent more than Han workers. On the other hand, for several other ethnic minorities there is a substantial earnings gap compared to the ethnic majority. The largest raw ethnic earnings gap is that for the Zhuang minority (27 per cent) and for the Miao minority (20 per cent). For other ethnic minorities (Mongol and Manchu), their average earnings were found to be rather similar to the earnings of the Han majority.
Although China’s ethnic minorities are differently spatially distributed from the majority and earnings differ by province, geography was ruled out as a major reason for cross-ethnicity differences in earnings. In order to gain a better understanding of whether and how ethnicity is related to earnings, we controlled for individual characteristics, such as gender, age,
10 This is a background for the finding reported in the preceding section that the earnings premium for Tibetan workers has more or less disappeared across cohorts.
15
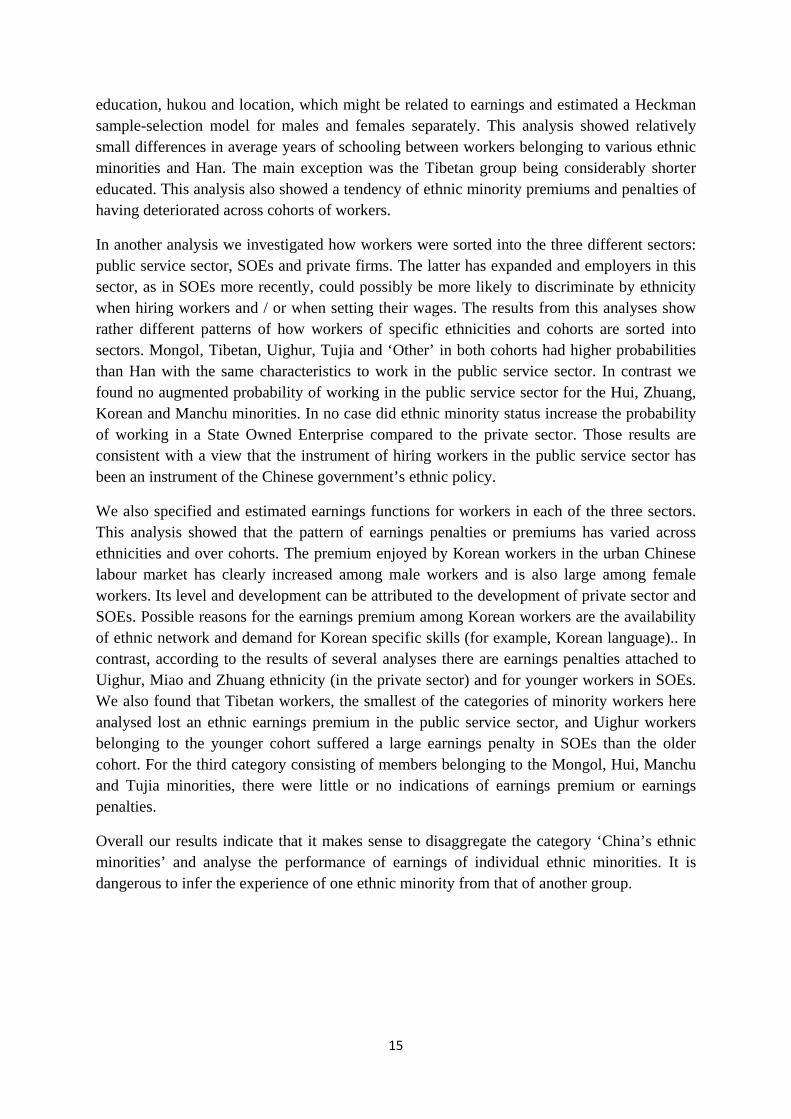
education, hukou and location, which might be related to earnings and estimated a Heckman sample-selection model for males and females separately. This analysis showed relatively small differences in average years of schooling between workers belonging to various ethnic minorities and Han. The main exception was the Tibetan group being considerably shorter educated. This analysis also showed a tendency of ethnic minority premiums and penalties of having deteriorated across cohorts of workers.
In another analysis we investigated how workers were sorted into the three different sectors: public service sector, SOEs and private firms. The latter has expanded and employers in this sector, as in SOEs more recently, could possibly be more likely to discriminate by ethnicity when hiring workers and / or when setting their wages. The results from this analyses show rather different patterns of how workers of specific ethnicities and cohorts are sorted into sectors. Mongol, Tibetan, Uighur, Tujia and ‘Other’ in both cohorts had higher probabilities than Han with the same characteristics to work in the public service sector. In contrast we found no augmented probability of working in the public service sector for the Hui, Zhuang, Korean and Manchu minorities. In no case did ethnic minority status increase the probability of working in a State Owned Enterprise compared to the private sector. Those results are consistent with a view that the instrument of hiring workers in the public service sector has been an instrument of the Chinese government’s ethnic policy.
We also specified and estimated earnings functions for workers in each of the three sectors. This analysis showed that the pattern of earnings penalties or premiums has varied across ethnicities and over cohorts. The premium enjoyed by Korean workers in the urban Chinese labour market has clearly increased among male workers and is also large among female workers. Its level and development can be attributed to the development of private sector and SOEs. Possible reasons for the earnings premium among Korean workers are the availability of ethnic network and demand for Korean specific skills (for example, Korean language).. In contrast, according to the results of several analyses there are earnings penalties attached to Uighur, Miao and Zhuang ethnicity (in the private sector) and for younger workers in SOEs. We also found that Tibetan workers, the smallest of the categories of minority workers here analysed lost an ethnic earnings premium in the public service sector, and Uighur workers belonging to the younger cohort suffered a large earnings penalty in SOEs than the older cohort. For the third category consisting of members belonging to the Mongol, Hui, Manchu and Tujia minorities, there were little or no indications of earnings premium or earnings penalties.
Overall our results indicate that it makes sense to disaggregate the category ‘China’s ethnic minorities’ and analyse the performance of earnings of individual ethnic minorities. It is dangerous to infer the experience of one ethnic minority from that of another group.
16
References
Baum, Christopher (2006), An Introduction to Modern Econometrics Using Stata, College Station: Stata press.
Chang Jinxiong and Sun Lei (2008), ‘The wage differences between Han rural migrants and Hui rural migrants, one case study about Guyuan city in Ningxia province’, Management World, 3. (in Chinese).
Ding Sai, Li Shi and Samuel L. Myers, Jr. (2013), ‘Inter-temporal Changes in Ethnic Urban Earnings Disparities in China’, Chapter 14 of Rising Inequality in China: Challenge to a Harmonious Society, Cambridge: Cambridge University Press.
Gustafsson, Bjorn and Ding Sai (2013) ‘Unemployment and the Rising Number of Nonworkers in Urban China: Causes and Consequences’ in Li Shi, Sato, Hiroshi and Sicular, Terry (Eds), Rising Inequality in China. Challenges to a Harmonious Society, Cambridge: Cambridge University Press.
Hasmath, Reza. (2008) ‘The Big Payoff? Educational and Occupational Attainments of Ethnic Minorities in Beijing’, European Journal of Development Research, 20, 104–116.
Jeong, Jong-Ho. (2014) ‘Transplanting Wenzhou Model and Transnational Ethnic Economy: experiences of Zhejiangcun's Wenzhou migrants and Wangjing's Chaoxianzu (ethnic Korean Chinese) migrants in Beijing’, Journal of Contemporary China, 23, 86, 330–350.
Kim, Harris. (2003) ‘Ethnic Enclave Economy in Urban China: the Korean Immigrants in Yanbian’, Ethnic and Racial Studies, 26, 5, 802–828.
Li Shi and Ding Sai (2013) ‘An empirical analysis of income inequality between a minority and the majority in urban China: The case of Ningxia Hui autonomous Region’, The Review of Black Political Economy, 40, 341–355.
Maurer-Fazio, Margaret, Hughes, James, W. and Zhang, Dandan (2010) ‘A Comparison and Decompositon of Reform-era Labor Force Participation Rates of China’s Ethnic Minorities and Han Majority’, International Journal of Manpower, 31, 138–162.
Maurer-Fazio, Margaret (2012) ‘Ethnic Discrimination in China’s Internet Job Board Labor Market’, IZA Journal of Migration, 1, 1–12.
Weimin, Zhang (no year) ‘China’s Inter-census Survey in 2005’, available at: www.ancsdaap.org/cencon2005/Papers/China/China.Zhang.Weimin.etal.pdf (Downloaded February 19, 2014).

17
Wu, Xiaogang and Song, Xi (2014) ‘Ethnic Stratification amid China’s Economic Transition: Evidence from the Xinjiang Uyghur Autonomous Region’, Social Science Research, 44, 158–172.
Xie Wenxin (2012), ‘The Earning of the people living in the area where ethnic minorities are concentrated: the earning comparison between Hui and Han living in Ningxia province’, Journal of Hui Muslim Minority Studies, 4. (in Chinese).
Zang, Xiaowei (2008) ‘Market Reforms and Han-Muslim Variation in Employment in the Chinese State Sector in a Chinese City’, World Development, 36, 2341–2352.
Zang, Xiaowei (2010) ‘Affirmative Action, Economic Reforms, and Han-Uygur Variation in Job Attainment in the State Sector in Urumqi’, China Quarterly, 202, 344–361.
Zang, Xiaowei (2011) ‘Uyghur-Han earnings differentials in Urumchi’, The China Journal, 65, pp. 141–155.
Zang, Xiaowei (2012a) ‘Gender roles and ethnic income inequality in Urumchi’, Ethnic and Racial Studies, 35, 238–258.
Zang, Xiaowei (2012b) ‘Age and the Cost of Being Uyghur in Urumqi’, China Quarterly,
210, 419–434.
Zang, Xiaowei and Li, Lulu (2001) ‘Ethnicity and Earnings Determination in Urban China’, New Zealand Journal of Asian Studies, 3, 1, 34–48.
Zhang Jiliang (2004) ‘Why the Earnings of the Rural Person Living in the Area Where the Ethnic Minorities are Concentrated to Grow Slowly in Gansu Province’, Social Sciences Review, 2 (in Chinese).
18
Figure 1: Number of minority workers 2005 (millions) by ethnicity
Source: Authors' computations from subsample of China's Inter-census Survey 2005 and data from the NBS website.
Figure 2-1: Proportion of ethnic minorities of all ages living in a city 2005 by ethnicity
Source: Authors' computations from subsample of China's Inter-census Survey 2005.
0,451,11
0,15 0,23 0,33
1,08
0,32
1,13
0,42 0,74
5,225,96
0
1
2
3
4
5
6
7
number of people employed (million)
46,4
32,6129,36
26,41
18,5
12,4810,21 9,5 8,44 8,22 7,35
12,99
30,48
05
101520253035404550
proportion of ethnici minorities living in cities(%)
19
Figure 2-2: Rate of inhabitants with urban hukou among all city dwellers 2005 by ethnicity
Source: Authors' computations from subsample of China's Inter-census Survey 2005.
Figure 3: Average length of schooling among ethnic minority inhabitants of active employment age living in cities by ethnicity and birth cohort 2005
Source: Authors' computations from subsample of China's Inter-census Survey 2005. Note: The figure includes persons aged 16–60 who were not students or active in agriculture, forestry, animal husbandry or fishing.
84,7280,6176,1573,86
63,1562,93 59,8
48,5143,1542,4941,91
62,48 63,12
0
10
20
30
40
50
60
70
80
90
rate of urban hukou(%)
0,00
2,00
4,00
6,00
8,00
10,00
12,00
14,00
male
female
20
Figure 4-1: Male employment rate among ethnic minorities for people living in cities 2005 by ethnicity
Source: Authors' computations from subsample of China's Inter-census Survey 2005. Note: The figure includes persons aged 16–60 who were not students or active in agriculture, forestry, animal husbandry or fishing.
Figure 4-2: Female employment rate among ethnic minorities for people living in cities 2005 by ethnicity
Source: Authors' computations from subsample of China's Inter-census Survey 2005. Note: The figure includes persons aged 16–60 who were not students or active in agriculture, forestry, animal husbandry or fishing.
91,2 88,7988,0783,0280,9180,7579,96
73,9869,6969,0864,61
79,01 80,83
0102030405060708090
100
male employment rate(%)
76,8171,56
66,0163,73 62,758,9557,07
50,9550,5548,0740,77
58,72 58,94
0
10
20
30
40
50
60
70
80
90
female employment rate(%)
21
Figure 5: Earnings relative to Han workers among minority workers in Chinese cities 2005 by ethnicity and cohort
Source: Authors' computations from subsample of China's Inter-census Survey 2005. Note: 1) The figure includes persons aged 16–60 who were not students or not active in agriculture, forestry, animal husbandry or fishing. 2) Observations with no job are excluded as their earnings information is unavailable. 3) Observations who are self-employers or self-owners are also excluded as it is difficult to distinguish their earnings from their assets.
Figure 6: Earnings relative to Han workers among minority workers in similar provinces of China 2005 by ethnicity and cohort
Source: Authors' computations from subsample of China's Inter-census Survey 2005. Note: 1) The figure includes persons aged 16–60 who were not students or not active in agriculture, forestry, animal husbandry or fishing. 2) Observations with no job are excluded as their earnings information is unavailable. 3) Observations who are self-employers or self-owners are also excluded as it is difficult to distinguish their earnings from their assets.
0,00%
20,00%
40,00%
60,00%
80,00%
100,00%
120,00%
140,00%
160,00%
cohort1 minority/han cohort2 minority/han
0,00%
20,00%
40,00%
60,00%
80,00%
100,00%
120,00%
140,00%
Korean Mongol Tibetan Tujia Miao Manchu Hui Uighur Zhuang
cohort1 minority/han cohort2 minority/han
22
Figure 7-1: Ethnic minority earnings premium and penalty for male workers 2005 by birth cohort and ethnicity
Source: Table 3.
Figure 7-2: Ethnic minority earnings premium and penalty for female workers 2005 by birth cohort and ethnicity
Source: Table 3.
‐0,4
‐0,3
‐0,2
‐0,1
0
0,1
0,2
0,3
0,4
male cohort 1
male cohort 2
‐0,2
‐0,15
‐0,1
‐0,05
0
0,05
0,1
0,15
0,2
0,25
0,3
female cohort 1
female cohort 2
23
Table 1: Provincial location of 9 ethnic minorities and Han in 2005
Ethnicity Provincial location of ethnic groups in China
(urban areas)
Han All over China
Mongol Inner Mongolia (68.53%), Liaoning (5.69%)
Hui
Ningxia(17.62%), Tianjnin(10.78%), Qinghai(10.75%), Gansu(7.61%), Beijing(6.23%), Xinjiang(5.87%), Inner Mongolia (4.47%), Yunnan(4.38% ), Liaoning(3.67%), Henan(3.59%)
Tibetan Tibet(50.21%), Qinghai(25.05%)
Uighur Xinjiang(98.29%)
Miao Guizhou(37.91%), Hunan(19.22%), Hainan(11.24%), Chongqing(8.95%)
Zhuang Guangxi(80.71%)
Korean Jilin (64.22%), Liaoning (10%), Heilongjiang (9.43%)
Manchu Liaoning(39%), Jilin(11.63%), Beijing(10.08%), Heilongjiang(8.91%), Hebei(8.52%)
Tujia Hunan(28.01%), Hubei(24.74%), Chongqing(21.07%), Guizhou(17.55%)
Source: Authors' computations from subsample of China's Inter-census Survey 2005;
Note: When we calculate provincial location of each ethnic groups, all age observations are included.
24
Table 2-1: Average monthly earnings by gender
Total Male Female Female / Male (%)
Korean 1 583 1 631 1 518 93.1
Mongol 1 241 1 322 1 159 87.7
Manchu 1 231 1 289 1 156 89.7
Han 1 229 1 341 1 087 81.0
Tibetan 1 155 1 285 1 014 78.9
Hui 1 151 1 214 1 073 88.4
Tujia 1 079 1 150 986 85.8
Others 1 047 1 126 969 86.1
Uighur 1 041 1 055 1 026 97.3
Miao 982 1 079 841 78.0
Zhuang 898 998 785 78.6
Ethnic minority-total 1 121 1 194 1 034 86.6
Total 1 224 1 335 1 084 81.2
Source: Authors' computations from subsample of China's Inter-census Survey 2005;
Note: 1) The observations includes persons aged 16-60 who were not students or not active in agriculture, forestry, animal husbandry or fishing.
2) Observations with no job are excluded if their earnings are missing information.
3) Observations who are self-employers or -owners are also excluded as it is difficult to distinguish their earnings from their assets.

25
Table 2-2: Monthly income comparison between ethnic minority and Han by gender and Gini coefficient for each ethnicity
Minority-male / Han-male
Minority-female / Han-female
Minority-total / Han-total
Gini coefficient (earnings)
(%) (%) (%)
Han /// /// /// 0.361
Korean 121.6 139.7 128.8 0.408
Mongol 98.6 106.7 101.0 0.317
Manchu 96.1 106.4 100.2 0.370
Tibetan 95.8 93.3 94.0 0.419
Hui 90.5 98.7 93.7 0.379
others 83.9 89.2 85.2 0.333
Tujia 85.7 90.8 87.8 0.304
Uighur 78.7 94.4 84.7 0.294
Miao 80.4 77.4 79.9 0.299
Zhuang 74.4 72.2 73.1 0.312
Ethnic minority-total 89.0 95.1 91.2 0.359
Source: Authors' computations from subsample of China's Inter-census Survey 2005.
Note: 1) The observations includes persons aged 16-60 who were not students or not active in agriculture, forestry, ,animal husbandry or fishing.
2) Observations with no job are excluded as their earnings are missing information.
3) Observations who are self-employers or self-owners are also excluded as it is difficult to distinguish their earnings from their assets.

26
Table 3: Earning function for male and female workers 2005
Heckman OLS
male Female male female
Ethnicity-gender (Han-cohort1, omitted category)
Han-cohort2 -0.093*** -0.023*** -0.093*** -0.039***
(0.005) (0.006) (0.005) (0.005)
Mongol-cohort1 -0.074** 0.025 -0.075** 0.021
(0.037) (0.033) (0.037) (0.033)
Mongol-cohort2 -0.035 0.149*** -0.035 0.128***
(0.031) (0.033) (0.031) (0.033)
Hui-cohort1 -0.040* -0.030 -0.040* -0.026
(0.021) (0.021) (0.021) (0.021)
Hui-cohort2 -0.096*** -0.031 -0.097*** -0.043**
(0.018) (0.020) (0.018) (0.020)
Tibetan-cohort1 -0.058 0.036 -0.058 0.046
(0.057) (0.060) (0.057) (0.060)
Tibetan-cohort2 0.163*** 0.214*** 0.163*** 0.197***
(0.053) (0.058) (0.053) (0.058)
Uighur-cohort1 -0.302*** -0.143*** -0.305*** -0.118**
(0.055) (0.048) (0.055) (0.048)
Uighur-cohort2 -0.201*** 0.050 -0.202*** 0.045
(0.043) (0.047) (0.043) (0.047)
Miao-cohort1 -0.140*** -0.054 -0.139*** -0.058
(0.035) (0.039) (0.034) (0.039)
Miao-cohort2 -0.138*** 0.034 -0.137*** 0.009
(0.044) (0.054) (0.044) (0.054)
Zhuang-cohort1 -0.156*** -0.044** -0.155*** -0.055**
(0.022) (0.022) (0.022) (0.022)
Zhuang-cohort2 -0.140*** -0.061* -0.139*** -0.089**
(0.032) (0.037) (0.032) (0.036)
Korean-cohort1 0.301*** 0.223*** 0.269*** 0.233***
27
(0.045) (0.046) (0.045) (0.045)
Korean-cohort2 0.042 0.174*** 0.039 0.162***
(0.035) (0.042) (0.035) (0.042)
Manchu-cohort1 0.040 0.019 0.040 0.021
(0.027) (0.027) (0.027) (0.027)
Manchu-cohort2 -0.097*** 0.005 -0.098*** -0.014
(0.022) (0.025) (0.022) (0.025)
Tujia-cohort1 -0.051 0.008 -0.050 0.004
(0.033) (0.035) (0.033) (0.034)
Tujia-cohort2 -0.159*** 0.025 -0.158*** 0.004
(0.042) (0.051) (0.041) (0.050)
Others-cohort1 -0.119*** -0.049 -0.119*** -0.053*
(0.035) (0.030) (0.035) (0.030)
Others-cohort2 -0.116*** 0.053 -0.115*** 0.035
(0.033) (0.037) (0.033) (0.036)
Age 0.059*** 0.024*** 0.060*** 0.021***
(0.001) (0.001) (0.001) (0.001)
Age square -0.001*** -0.000*** -0.001*** -0.000***
(0.000) (0.000) (0.000) (0.000)
Education 0.087*** 0.105*** 0.087*** 0.100***
(0.001) (0.001) (0.000) (0.001)
Migrant status (local residents, omitted category)
Migrants 0.132*** 0.197*** 0.134*** 0.191***
(0.004) (0.004) (0.003) (0.004)
Hukou (rural hukou, omitted category)
Urban hukou 0.089*** 0.130*** 0.086*** 0.140***
(0.004) (0.004) (0.004) (0.004)
Province (Beijing, omitted category)
30 prov. 30 prov. 30 prov. 30 prov.
Constant 4.898*** 5.069*** 4.878*** 5.172***
(0.029) (0.025) (0.020) (0.020)
28
athrho -0.022 0.146***
(0.023) (0.020)
lnsigma -0.685*** -0.714***
(0.002) (0.002)
sigma 0.504 0.490
(0.001) (0.001)
lambda -0.011 0.071
(0.011) (0.010)
N 202902 226360 157820 125465
adj.R-sq 0.339 0.401
F 1446.549 1499.328
Note:
1) Model1: LR test of indep.eqns. (rho = 0):chi2(1)=0.89 Prob>chi2=0.3447
2) Model2: LR test of indep.eqns. (rho = 0):chi2(1)=54.41 Prob>chi2=0.0000
3) Standard errors in parentheses; * p<0.1, ** p<0.05, *** p<0.01
4) Observations who are self‐employers or self‐owners are excluded as it is difficult to distinguish their earnings from their assets.
29
Table 4-1: Estimates of Mlogit model for employment sector, workers of different cohorts. Marginal effects
Young Cohort Old Cohort
state firms public service sector state firms public service sector
Ethnicity-gender (Han, omitted category)
Mongol -0.013 0.066*** -0.040*** 0.099***
(0.020) (0.014) (0.014) (0.013)
Hui -0.035*** 0.001 -0.036*** -0.000
(0.011) (0.007) (0.007) (0.006)
Tibetan 0.002 0.136*** -0.012 0.103***
(0.053) (0.042) (0.036) (0.031)
Uighur -0.099*** 0.138*** -0.096*** 0.125***
(0.027) (0.025) (0.015) (0.019)
Miao 0.042 0.010 0.004 0.048**
(0.029) (0.020) (0.025) (0.022)
Zhuang -0.024 0.005 -0.022 0.005
(0.019) (0.013) (0.016) (0.013)
Korean -0.130*** 0.022 -0.079*** 0.009
(0.025) (0.019) (0.014) (0.013)
Manchu -0.018 0.005 -0.020** 0.012
(0.015) (0.009) (0.009) (0.008)
Tujia -0.014 0.044** -0.050** 0.096***
(0.028) (0.020) (0.023) (0.023)
Others -0.010 0.056*** -0.053*** 0.099***
(0.022) (0.016) (0.015) (0.015)
Gender (Male, omitted category)
Female -0.042*** 0.016*** -0.037*** 0.030***
(0.002) (0.002) (0.002) (0.001)
Age -0.011*** 0.000 0.014*** -0.003**
(0.004) (0.003) (0.002) (0.001)
Age square 0.000*** -0.000 -0.000*** 0.000***
(0.000) (0.000) (0.000) (0.000)
30
Education 0.007*** 0.031*** 0.003*** 0.035***
(0.001) (0.002) (0.000) (0.000)
Marriage (unmarried, omitted category)
Married 0.002 0.030*** 0.008 0.040***
(0.004) (0.003) (0.006) (0.006)
Health (healthy, omitted category)
Unhealthy 0.095 0.004 0.025 0.008
(0.061) (0.044) (0.029) (0.027)
Migrants (local residents, omitted category)
Migrants -0.045*** -0.062*** -0.022*** -0.058***
(0.004) (0.004) (0.002) (0.002)
Hukou (rural hukou, omitted category)
Urban hukou 0.145*** 0.025*** 0.205*** 0.022***
(0.004) (0.003) (0.003) (0.002)
Province (Beijing, omitted category)
30 provinces 30 provinces 30 provinces 30 provinces
Observations 145,552 145,552 181,856 181,856
Note: Standard errors in parentheses; *** p<0.01, ** p<0.05, * p<0.1
31
Table 4-2: marginal effect of mlogit model
State firms:
similar as Han Tibetan, Miao,Zhuang
vanishing disadvantage Mongol, Manchu, Tujia
unchanged disadvantage Hui, Uighur, Korean
Fublic service sector:
increased advantage Tibetan, Uighur
decreased advantage Mongol, Tujia
similar as Han Hui/,huang, Korean, Manchu
vanishing advantage Miao

32
Table 5-1: Earnings function for sectors and cohorts
private firms
private firms
state firms
state firms
public service sector
public service sector
Cohort 1 Cohort 2 Cohort 1 Cohort 2 Cohort 1 Cohort 2
Ethnicity-gender (Han, omitted category)
Mongol -0.039 0.007 0.082 0.009 -0.017 0.072**
(0.034) (0.051) (0.051) (0.046) (0.039) (0.029)
Hui 0.019 -0.011 -0.051* -0.001 0.022 -0.009
(0.018) (0.023) (0.029) (0.022) (0.034) (0.023)
Tibetan -0.029 -0.006 -0.041 0.188* 0.045 0.139**
(0.063) (0.080) (0.137) (0.111) (0.083) (0.063)
Uighur -0.150*** -0.233*** -
0.338*** 0.128* -0.049 -0.020
(0.057) (0.069) (0.092) (0.071) (0.052) (0.040)
Miao -0.114*** -0.021 -0.123* -0.049 0.015 -0.075
(0.027) (0.051) (0.072) (0.071) (0.083) (0.060)
Zhuang -0.091*** -0.092*** -
0.144*** -0.025 -0.164*** -0.064
(0.016) (0.035) (0.056) (0.054) (0.060) (0.049)
Korean 0.318*** 0.241*** 0.220**
0.219*** -0.026 0.013
(0.035) (0.042) (0.103) (0.060) (0.071) (0.044)
Manchu 0.033 0.007 0.022 0.010 0.052 -0.015
(0.024) (0.028) (0.039) (0.028) (0.040) (0.028)
Tujia -0.018 -0.052 -0.104 0.035 -0.038 -0.039
(0.025) (0.047) (0.076) (0.086) (0.068) (0.052)
Others -0.077*** -0.025 -0.056 -0.025 0.013 0.004
(0.026) (0.045) (0.059) (0.055) (0.049) (0.033)
Gender (Male, omitted category)
Female -0.169*** -0.325*** -
0.160*** -
0.164*** -0.082***
-0.093***
(0.003) (0.004) (0.006) (0.005) (0.007) (0.005)
Age 0.083*** -0.044***
0.084*** -
0.035*** 0.150*** -0.002
(0.004) (0.004) (0.010) (0.005) (0.013) (0.005)
Age square -0.001*** 0.000*** -
0.001***
0.000*** -0.002*** 0.000**
33
(0.000) (0.000) (0.000) (0.000) (0.000) (0.000)
Education 0.089*** 0.078***
0.077***
0.082*** 0.084***
0.095***
(0.001) (0.001) (0.001) (0.001) (0.002) (0.001)
Marriage (unmarried, omitted category)
Married 0.010** 0.083***
0.025***
0.087*** -0.006 0.040*
(0.004) (0.013) (0.009) (0.018) (0.010) (0.023)
Health (healthy, omitted category)
Unhealthy -0.051 -0.081 -0.283* -
0.317*** 0.146 -0.183*
(0.113) (0.084) (0.150) (0.078) (0.194) (0.107)
Migrants (local residents, omitted category)
Migrant 0.182*** 0.175***
0.160***
0.097*** 0.094***
0.058***
(0.004) (0.005) (0.009) (0.008) (0.011) (0.009)
Hukou (rural hukou, omitted category)
Urban hukou 0.084*** 0.096***
0.064***
0.037*** 0.182***
0.396***
(0.004) (0.005) (0.011) (0.011) (0.015) (0.012)
Province (Beijing, omitted category)
30 prov. 30 prov. 30 prov. 30 prov. 30 prov. 30 prov.
Constant 4.687*** 7.231***
5.095***
7.212*** 3.361***
5.487***
(0.122) (0.123) (0.197) (0.134) (0.257) (0.154)
N 93,038 72,064 22,622 48,282 15,340 31,939
adj. R-sq 0.401 0.345 0.383 0.296 0.422 0.425
F 1183.961 717.876 266.737 384.418 213.282 448.182
34
Table 5-2: Earning differences between Han and each ethnic minority
Private firms
Increased advantage Korean
Similar as Han Mongol,Hui/,ibetan,Manchu,/Tujia
Decreased disadvantage Uighur
Unchanged disadvantage Zhuang
New disadvantage Miao
State firms
Unchanged advantage Korean
Vanishing advantage Tibetan
From advantage to disadvantage Uighur
Similar as Han Mongol,Manchu,Tujia
New disadvantage Hui,/Miao,,Zhuang
Public service sector
Vanishing advantage Mongo, /Tibetan
Similar as Han Hui,Uighur,/Miao,Korean,Manchu,Tujia
New disadvantage Zhuang