Early Life Exposure to Above Average Rainfall and Adult ... · 4 For instance, in Jakarta, the...
49
#2018/05 Mochamad Pasha, Marc Rockmore, and Chih Ming Tan Early Life Exposure to Above Average Rainfall and Adult Mental Health
-
Upload
duongthuan -
Category
Documents
-
view
214 -
download
0
Transcript of Early Life Exposure to Above Average Rainfall and Adult ... · 4 For instance, in Jakarta, the...

#2018/05
Mochamad Pasha, Marc Rockmore, and Chih Ming Tan
Early Life Exposure to Above Average Rainfall and Adult Mental Health

EDITOR-IN-CHIEF
Martin Karlsson, Essen
MANAGING EDITOR
Katharina Blankart, Essen
EDITORIAL BOARD
Boris Augurzky, Essen Jeanette Brosig-Koch, Essen Stefan Felder, Basel Annika Herr, Düsseldorf Nadja Kairies-Schwarz, Essen Hendrik Schmitz, Paderborn Harald Tauchmann, Erlangen-Nürnberg Jürgen Wasem, Essen
CINCH SERIES
CINCH – Health Economics Research Center Weststadttürme, Berliner Platz 6-8 45127 Essen www.cinch.uni-due.de [email protected] Phone +49 (0) 201 183 - 3679 Fax +49 (0) 201 183 - 3716 All rights reserved. Essen, Germany, 2014 ISSN 2199-8744 (online) The working papers published in the Series constitute work in progress circulated to stimulate discussion and critical comments. Views expressed represent exclusively the authors’ own opinions and do not necessarily reflect those of the editors.

#2018/05
Mochamad Pasha, Marc Rockmore, and Chih Ming Tan
Early Life Exposure to Above Average Rainfall and Adult Mental Health


Mochamad Pasha*, Marc Rockmore†, and Chih Ming
Tan‡
Early Life Exposure to Above Average Rainfall and Adult Mental Health§
Abstract
We study the effect of early life exposure to above average levels of rainfall on adult
mental health. While we find no effect from pre-natal exposure, post-natal positive rainfall
shocks decrease average Center for Epidemiological Studies Depression (CESD) mental
health scores by 15 percent and increase the likelihood of depression by 5 percent, a more
than 20 percent increase relative to the mean. These effects are limited to females. We
rule out prenatal stress and income shocks as pathways and find evidence suggestive of
increased exposure to disease.
Keywords: Fetal origins, early life shocks, rainfall, mental health, climate change,
Indonesia
JEL Classification Codes: I15; O12
* Consultant, World Bank, Indonesia. Corresponding Author: [email protected] † Department of Economics, Clark University, 950 Main Street, Worcester, MA 01610 ‡ Department of Economics, University of North Dakota, 293 Centennial Drive Stop 8369, Grand Forks, ND 58202 § Tan thanks the Greg and Cindy Page Faculty Distribution Fund for financial support.

2
1. Introduction
Early life exposure to weather shocks is linked to a variety of diminished later-life human
capital outcomes.1 Most recently, it has been linked to lower adult mental health (Adhvaryu
et al. 2017b; Dinkelman 2017; Liu et al. 2017; Maclean et al 2016). While rarely studied
in (development) economics, the effects of mental health disorders are both large in
magnitude and relatively common in developing countries despite being rarely diagnosed
or treated (Collins et al. 2011; Demyttenaere et al., 2004). In the context which we study
(Indonesia), these account for roughly 10 percent of the disease burden and more than 20
percent of our sample is symptomatic of depression (WHO 2011).2
We contribute to this emerging literature by examining the effects of above-average levels
of rainfall (i.e. a positive (magnitude) ‘shock’3). This contrasts with a larger literature (both
in economics and elsewhere) on early life exposure to heat. Although temperatures show
considerable variation in certain regions, such as Africa (Adhvaryu et al. 2017b), this is not
true in much of South and South-East Asia.4 Rather, the climate variability with rainfall
due to phenomena as the El Niño-Southern Oscillation and monsoon rains. For instance,
1 The early literature on natural shocks focused on height before expanding to a variety of other outcomes in
recent years including cognitive development (Shah and Steinberg, 2017; Leight et al. 2015), personality
traits (Krutikova and Lilleor, 2015) and pro-social behavior (Ben Yishay, 2013). Rainfall variation can also
have important effects in developed country settings (Deschenes 2014; Deschenes and Greenstone 2011; and
Deschenes et al 2009). 2 Between 2012 and 2030, this burden is expected to lower Indonesia’s aggregate output by US$ 0.98 trillion
hence presenting a significant headwind to overall growth and, potentially, to efforts to reduce poverty
(Bloom et al. 2015). 3 Throughout the pape, we refer to above-average rainfall as a positive shock. The ‘positive’ refers to it being
an above-average level of rainfall and differentiates it from ‘negative’ shocks where there is less than average
levels of rainfall. Although the shock is positive in magnitude, it is necessarily ‘positive’ for the household. 4 For instance, in Jakarta, the capital of Indonesia, the monthly average air temperature between 1865 and
1995 was essentially bounded between 26 and 29 degrees centigrade (Harger 1995).

3
25 percent of our sample experiences a rainfall 0.7 standard deviations or higher than the
moving 10-year community average.5
We are not the first to study the effects of rainfall although we are only aware of three other
such studies. Maclean et al. (2016) include droughts and floods in their aggregate measure
of exposure to natural disasters and find that early-life exposure to their aggregate measure
results in worse adult mental health outcomes. Dinkelman (2017) focuses on negative
weather shocks, specifically droughts, and finds that prenatal exposure and, depending on
the specification, exposure during the first year of life leads to higher adult rates of mental
health disorder and disabilities. Liu et al. (2017) study typhoons (severe wind events
associated with significant increases in precipitation) in Taiwan and find a significant
increase in mental illness among women.
By combining a national survey and a historical station-level panel of daily rainfall and
temperature data, we create individual-specific measures of exposure to rainfall shocks
during different early life growth periods: pre-natal, from ages 0 to 1 year, and from 1 to 2
years. We identify the effects of rainfall variation based on the within period variation
across communities within the same district. Our measure of mental health employs the
Center for Epidemiological Studies Depression (CESD) scale, a widely used diagnostic
instrument for depression symptoms. We employ both the log of the raw CESD scores as
well as the indicator for symptomatic depression using typical cutoff values employed by
psychologists.
5 Aldrian et al. (2003) further discusses rainfall variation within and across years in Indonesia.
4
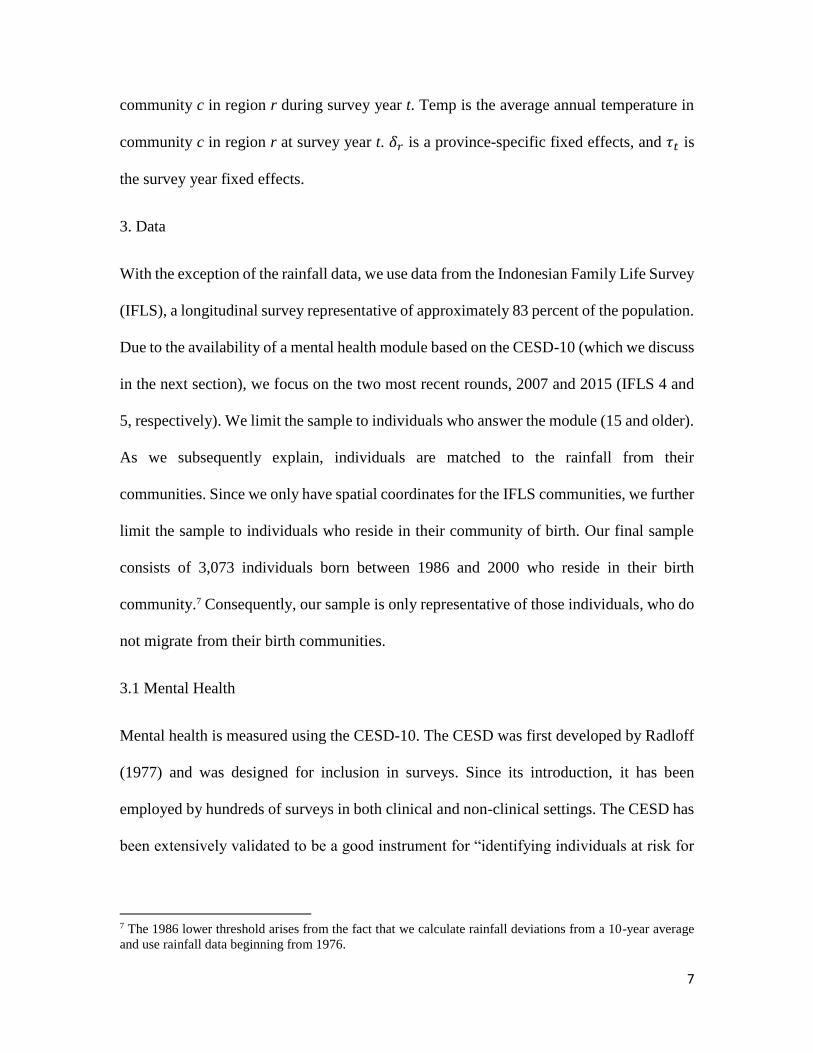
We find a clear and consistent negative relationship between post-natal positive rainfall
exposure and our measures of mental health. In our benchmark specification, exposure to
postnatal rainfall shocks increases average mental health scores by 15 percent (higher
scores reflect a deterioration in outcomes) and increase the likelihood of depression by 5
percent, a more than 20 percent increase relative to the mean. These effects are robust to
alternate specifications and measures of rainfall. Interestingly (and similar to Liu et al.
2017), these effects are limited to women.
We next examine particular pathways suggested by the literature on weather, climate
change, and mental health (Berry et al. 2010) in conjunction with the broader literatures
on early life shocks. While we are able to rule out pre-natal stress and income shocks from
exposure to rainfall shocks as explanations for the increased depression observed, we do
find suggestive evidence that changes in the disease environment may be a mechanism by
which exposure to rainfall shocks affect mental health.
The analysis points to important effects of early exposure to above-average levels of
rainfall. If this relationship persists, it is particularly worrisome as climate change is
expected to increase both the variability of weather and the frequency of ‘extreme’ events
(Dell et al. 2014; Deschenes 2014).6 For instance, in Indonesia, while annual precipitation
levels have slightly decreased in recent years, climate models suggest that climate change
will increase precipitation in the coming decades (Case et al. 2007). These analyses point
6 A more developed literature focuses on heat. Although temperatures show considerable variation in certain
regions, such as Africa (Adhvaryu et al. 2017b), this is not universally true, particularly in South and South-
East Asia. For instance, in Jakarta, the capital of Indonesia, the monthly average air temperature between
1865 and 1995 was essentially bounded between 26 and 29 degrees centigrade (Harger 1995). In contrast,
there is considerable variation in rainfall levels in Indonesia within and across years (Aldrian et al. 2003)
Consequently, we choose to focus on rainfall.

5
to heterogeneity in the local effects from climate change, but the changes are likely to be
substantial; for instance, parts of Sumatra are expected to experience between 10-30
percent more precipitation by 2080.
The remainder of the paper is organized as follows: sections 2 and 3 describe the
methodology and data, respectively. Section 4 presents the main results and examines their
robustness before investigating specific pathways. Finally, section 5 concludes.
2. Specification
To estimate the long-run effects of pre-natal and early-life exposure of rainfall shocks on
adult mental health, we follow Adhvaryu et al. (2017b) and estimate the following
benchmark regression specification:
𝑀𝑒𝑛𝑡𝑎𝑙 𝐻𝑒𝑎𝑙𝑡ℎ𝑖𝑐𝑗𝑑𝑡 = 𝛼 + 𝛽𝑅𝑎𝑖𝑛𝑓𝑎𝑙𝑙𝑖ℎ𝑐𝑔 + 𝑋𝑖𝑐𝑔𝑡′ 𝜃 + 𝛾𝑗𝑑 + 𝜌𝑐 + 𝜏𝑡 + 휀 (1)
Where Mental Healthicjdt is a measure of the mental health of person i born in community
c in district d during survey year t in birth year j. Following the literature on early-life
shocks and its emphasis on the first 1,000 days of life as the “sensitive/critical period” for
their effects (Barker 1995; Hoddinott 2010; Victora et al 2008), we use separate measures
of exposure, Rainfall, for three growth periods, g; specifically, pre-natal, and between ages
0 and 1 year, and 1 and 2 years, respectively. While we initially only examine the effects
of shocks before the age of 2, we subsequently allow for the possibility of a later life effect
and expand the measures of yearly exposure to age 7. 𝛽 is our coefficient of interest and
represents the treatment effect of early life rainfall exposure on adult mental health.

6
𝑋𝑖𝑐𝑔𝑡′ is a vector of controls for survey year t including the age of the respondent and of
his/her mother, an indicator for a female head of household, highest education of the
respondent’s parents, household size, and the total number of health facilities in the
community. To account for the potential effects of temperature, the vector also contains a
measure of the average temperature during each growth period. 𝛾𝑗𝑑 is a vector of district-
birth year fixed effects and therefore controls for any unobserved determinants of mental
health which affect all individuals in a birth cohort within a given district. Consequently,
we are identifying the effects of rainfall variation based solely on the within period
variation across communities within the same district.
𝜌𝑐 is a vector of fixed effects for the birth (and current) community of the respondent and
therefore account for unobserved community characteristics which might affect mental
health. Lastly, 𝜏𝑡 is a vector of fixed effects for the year of survey and controls for any
unobserved factors which affect Indonesia at the time of the survey, t. Following the
recommendations of Dell et al. (2014), we use robust standard errors clustered by sub-
district and birth year.
After establishing the effect of rainfall shocks, we next examine potential pathways. As we
subsequently discuss, much of this analysis relies on variations of equation (1). One
exception, however, is our discussion of disease epidemics which estimates the following
equation:
𝐷𝑖𝑠𝑒𝑎𝑠𝑒𝑂𝑢𝑡𝑏𝑟𝑒𝑎𝑘𝑐𝑟𝑡 = 𝛼 + 𝛽𝑅𝑎𝑖𝑛𝑓𝑎𝑙𝑙𝑐𝑟𝑡 + 𝜃𝑇𝑒𝑚𝑝𝑐𝑟𝑡 + 𝛿𝑟 + 𝜏𝑡 + 휀 (2)
where DiseaseOutbreak is a binary indicator for a particular disease outbreak in
community c in region r at survey year t. Rainfall is an indicator for rainfall shock in
7
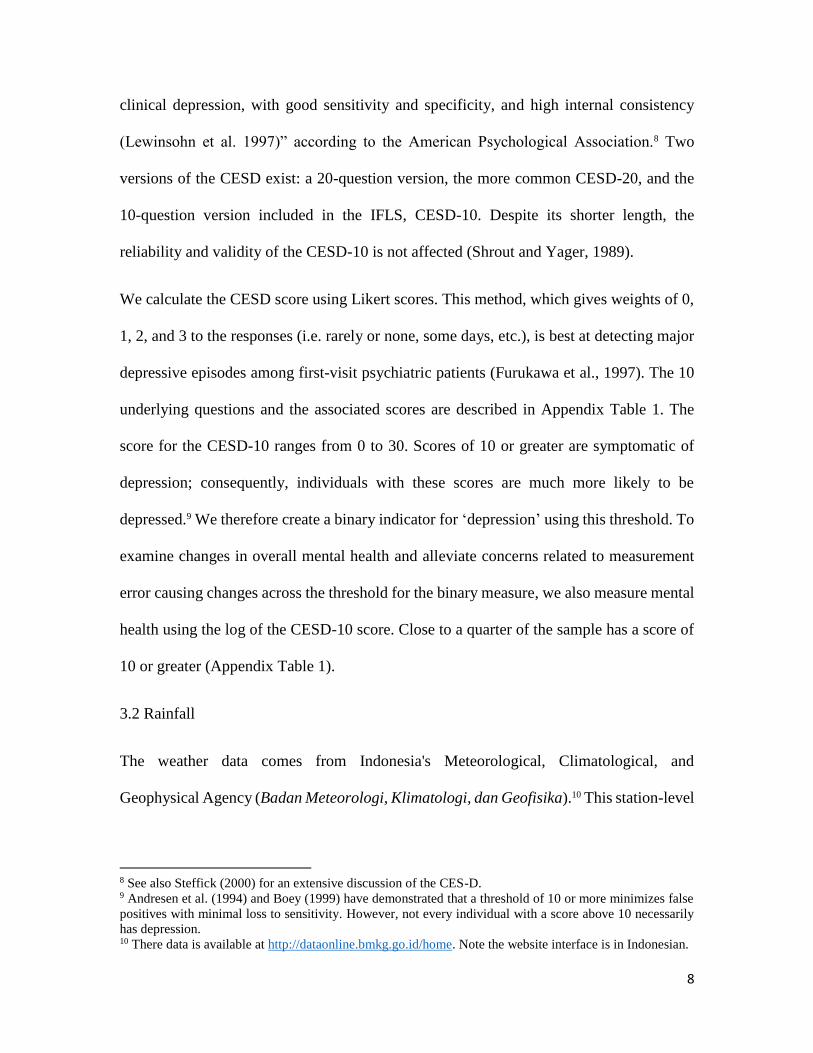
community c in region r during survey year t. Temp is the average annual temperature in
community c in region r at survey year t. 𝛿𝑟 is a province-specific fixed effects, and 𝜏𝑡 is
the survey year fixed effects.
3. Data
With the exception of the rainfall data, we use data from the Indonesian Family Life Survey
(IFLS), a longitudinal survey representative of approximately 83 percent of the population.
Due to the availability of a mental health module based on the CESD-10 (which we discuss
in the next section), we focus on the two most recent rounds, 2007 and 2015 (IFLS 4 and
5, respectively). We limit the sample to individuals who answer the module (15 and older).
As we subsequently explain, individuals are matched to the rainfall from their
communities. Since we only have spatial coordinates for the IFLS communities, we further
limit the sample to individuals who reside in their community of birth. Our final sample
consists of 3,073 individuals born between 1986 and 2000 who reside in their birth
community.7 Consequently, our sample is only representative of those individuals, who do
not migrate from their birth communities.
3.1 Mental Health
Mental health is measured using the CESD-10. The CESD was first developed by Radloff
(1977) and was designed for inclusion in surveys. Since its introduction, it has been
employed by hundreds of surveys in both clinical and non-clinical settings. The CESD has
been extensively validated to be a good instrument for “identifying individuals at risk for
7 The 1986 lower threshold arises from the fact that we calculate rainfall deviations from a 10-year average
and use rainfall data beginning from 1976.
8
clinical depression, with good sensitivity and specificity, and high internal consistency
(Lewinsohn et al. 1997)” according to the American Psychological Association.8 Two
versions of the CESD exist: a 20-question version, the more common CESD-20, and the
10-question version included in the IFLS, CESD-10. Despite its shorter length, the
reliability and validity of the CESD-10 is not affected (Shrout and Yager, 1989).
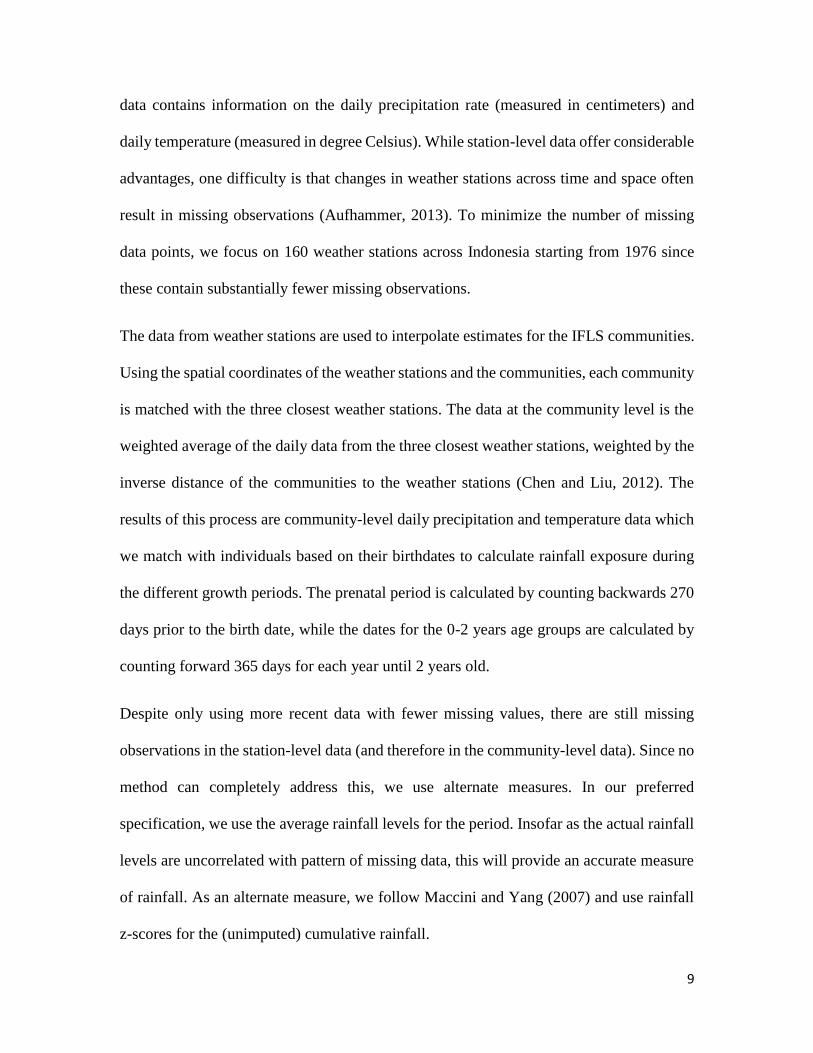
We calculate the CESD score using Likert scores. This method, which gives weights of 0,
1, 2, and 3 to the responses (i.e. rarely or none, some days, etc.), is best at detecting major
depressive episodes among first-visit psychiatric patients (Furukawa et al., 1997). The 10
underlying questions and the associated scores are described in Appendix Table 1. The
score for the CESD-10 ranges from 0 to 30. Scores of 10 or greater are symptomatic of
depression; consequently, individuals with these scores are much more likely to be
depressed.9 We therefore create a binary indicator for ‘depression’ using this threshold. To
examine changes in overall mental health and alleviate concerns related to measurement
error causing changes across the threshold for the binary measure, we also measure mental
health using the log of the CESD-10 score. Close to a quarter of the sample has a score of
10 or greater (Appendix Table 1).
3.2 Rainfall
The weather data comes from Indonesia's Meteorological, Climatological, and
Geophysical Agency (Badan Meteorologi, Klimatologi, dan Geofisika).10 This station-level
8 See also Steffick (2000) for an extensive discussion of the CES-D. 9 Andresen et al. (1994) and Boey (1999) have demonstrated that a threshold of 10 or more minimizes false
positives with minimal loss to sensitivity. However, not every individual with a score above 10 necessarily
has depression. 10 There data is available at http://dataonline.bmkg.go.id/home. Note the website interface is in Indonesian.
9
data contains information on the daily precipitation rate (measured in centimeters) and
daily temperature (measured in degree Celsius). While station-level data offer considerable
advantages, one difficulty is that changes in weather stations across time and space often
result in missing observations (Aufhammer, 2013). To minimize the number of missing
data points, we focus on 160 weather stations across Indonesia starting from 1976 since
these contain substantially fewer missing observations.
The data from weather stations are used to interpolate estimates for the IFLS communities.
Using the spatial coordinates of the weather stations and the communities, each community
is matched with the three closest weather stations. The data at the community level is the
weighted average of the daily data from the three closest weather stations, weighted by the
inverse distance of the communities to the weather stations (Chen and Liu, 2012). The
results of this process are community-level daily precipitation and temperature data which
we match with individuals based on their birthdates to calculate rainfall exposure during
the different growth periods. The prenatal period is calculated by counting backwards 270
days prior to the birth date, while the dates for the 0-2 years age groups are calculated by
counting forward 365 days for each year until 2 years old.
Despite only using more recent data with fewer missing values, there are still missing
observations in the station-level data (and therefore in the community-level data). Since no
method can completely address this, we use alternate measures. In our preferred
specification, we use the average rainfall levels for the period. Insofar as the actual rainfall
levels are uncorrelated with pattern of missing data, this will provide an accurate measure
of rainfall. As an alternate measure, we follow Maccini and Yang (2007) and use rainfall
z-scores for the (unimputed) cumulative rainfall.
10
These rainfall measures are then used to construct the standardized rainfall z-scores, which
measures the standard deviations from a community-level 10 year-moving average from
the date of birth of the specific individual. While the community-fixed effects account for
long-run community averages, local patterns may change for a variety of reasons including
climate change. Consequently, the z-scores account for any trends over time. Following
the climate literature, we define a rainfall shocks as a z-score greater than 0.7 during a
growth period (Aguilar Esteva 2012; Andalon et al. 2016).
As an additional robustness check, we adapt the instrumented variable approach employed
in Maccini and Yang (2007). We use rainfall shocks constructed from rainfall data from
the second, and third closest stations to instrument the rainfall shock from the first closest
weather station, with the restriction that these weather stations were operational before
2000. Contrary to the previous two approaches, where rainfall shocks for each growth
period are defined as when the rainfall z-score is greater than 0.7 standard deviations from
the 10-year locality mean, in the IV approach, we follow Maccini and Yang (2007) in using
log deviations from the 10-year locality mean as the measure for the rainfall shocks.
3.3 Other Covariates
In addition to the fixed effects, the estimation specifications include measures for the
average temperature during each growth period, the age of the respondent and his/her
mother, an indicator for a female head of household, highest education of the respondent’s

11
parents11, household size, and total health facilities in the communities. With the exception
of the temperature data, these are all drawn from the IFLS.
Table 1 presents summary statistics for the variables used in this paper. There is
considerable variation in our measures of mental health. The sample average for CESD
scores is a little over 5 (log 1.54), considerably below the threshold of 10 for depression.
At the same time, however, close to a quarter of the sample (23.2 percent) have CESD
scores above the threshold. Within localities, there is also substantial fluctuation in rainfall
with roughly one quarter of the sample exposed to at least one rainfall shock (z-score>0.7)
during the first 1,000 days of life. Since the percent of the population exposed to shocks
during the different growth periods is in-between 21 and 22 percent, this implies that a
fraction of the population was exposed to multiple rainfall shocks during their first 1,000
days of life.
4. Results
4.1 Main Results
We begin by examining the link between rainfall and mental health. In Table 2, columns
(1) and (3), we estimate the effects of rainfall deviations (from the local moving 10-year
average) on the log CESD and depression indicator, respectively. For both measures, the
estimated coefficients are insignificant. We therefore refine the analysis by focusing on
shocks (z-score >0.7) and by allowing the effects to differ for positive and negative shocks.
This allows rainfall shocks, such as floods and droughts, to have different effects on
11 Due to the high number of missing observations for the education of parents, a category for missing
observations is created.

12
outcomes, such as agricultural production and, ultimately, on income. Similarly, disease
burdens, such as malaria, may be affected non-linearly by positive/negative rainfall shocks.
The estimated coefficients are reported in columns (2) and (4). The negative rainfall shocks
are never significant which contrasts with Dinkelman (2017), who finds an effect of
droughts on the incidence of adult mental disabilities. This likely reflects difference in the
context. In South Africa, below average rainfall can lead to droughts which are particularly
destructive and harmful. In contrast, Indonesia is always ‘wet’; below average rainfall does
not constitute a drought. Consequently, it is unsurprising that low rainfall is not necessarily
destructive.
The results for positive (i.e. above average rainfall events) shocks are consistent with the
study by Liu et al. (2017) on the effects of typhoons (which also engender a positive rainfall
shock). For average mental health, only the estimated coefficient for a positive shock
during age 1 is significant and implies a 15 percent increase in CESD scores. Similarly,
only the coefficient for above average exposure at age 2 is significant for depression. The
magnitude, however, is relatively large and implies a 5.5 percent increased likelihood of
being depressed, an increase of 23% relative to the sample average.
Since the negative rainfall shocks are statistically insignificant, the remainder of the
analysis focuses on positive rainfall shocks. Although the literature on early life shocks
focuses on the first 1,000 days after birth, this literature typically does not examine mental
health. Consequently, it is not clear that the effects of early life exposure to weather
variation are similarly limited to the first 1,000 days. We therefore examine this in Table
3. Columns (1) and (3) re-estimate equation (1) using only positive shocks up to age 2. The

13
results are broadly similar to Table 2 although the effects of rainfall shocks on average
mental health extend to age 2. Columns (2) and (4) extend the growth period until age 7
and includes exposure to (positive) rainfall shocks in each year. The results are largely
unchanged as none of the newly added estimated coefficients are significant while the
significance and magnitude of the estimated coefficient in columns (1) and (3) remain
largely unaffected. This suggests that the effects are limited to this early life period.
4.2 Robustness
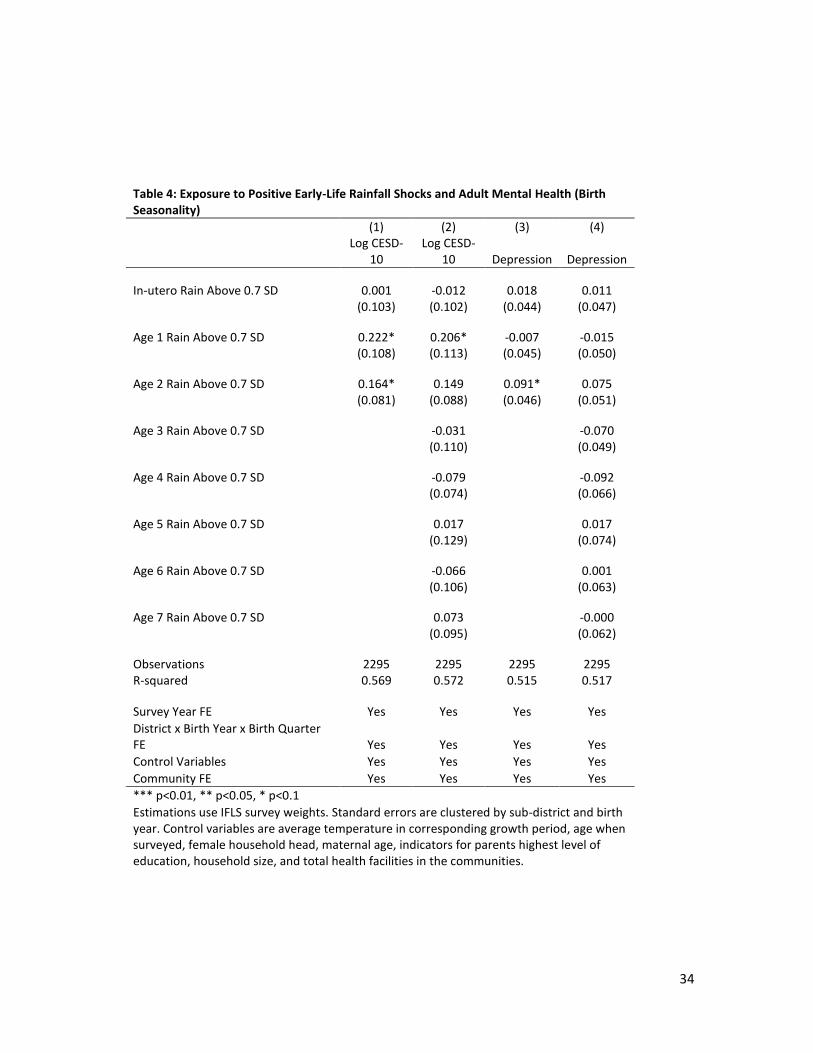
We next examine the robustness of these results. We begin by investigating the effects of
seasonality. In particular, as with much of the literature, equation (1) identifies the effects
of weather (i.e. rainfall) based on the monthly variation in exposure for children born in
the same year in the same geographic area (i.e. district). Other factors, however, are also
correlated with seasonality. For instance, seasonality may affect household livelihoods and
therefore the ability of parents to be with children, or exposure to sunlight, etc.
Consequently, one important concern is whether omitted variables which are correlated
with seasonality are potentially underlying our effects. We address this in Table 4 by
replacing the district-year fixed effects with a district-birth year-birth quarter fixed effect.
As a result, we are identifying based on variation in rainfall exposure of children born in
the same quarter in the same year and district. Columns (1) and (3) replicate our estimates
from Table 3 for shocks before age 2, while columns (2) and (4) replace the district-year
fixed effects with a district-birthyear-birthquarter fixed effect. While the statistical
significance decreases somewhat, the same pattern broadly emerges. The magnitude of the
effects, however, are noticeably larger. Consequently, our results are not driven by
14
seasonality and may perhaps somewhat underestimate the total effects of early-life
exposure to rainfall variation.
In our earlier estimations, z-scores were calculated based on the average rainfall in a
community during a growth period. We replace these measures of shocks with an alternate
measure of shocks based on z-scores for the cumulative rainfall during the growth periods.
These use the same 0.7 standard deviation threshold as in earlier exercises. The results are
presented in Table 5. Columns (1) and (3) replicate our benchmark results (reported in
Table 3, columns (1) and (3)). The new estimates are presented in columns (2) and (4). As
can be seen, the results are qualitatively and quantitatively similar.
Finally, we adapt the instrument variable approach employed in Maccini and Yang (2007).
Rainfall shocks from the second and third closest weather stations are good instruments for
rainfall shocks in the closest weather station (Appendix: Table 11: Panels A to G).
However, the null hypothesis of the Durbin-Wu-Hausman test of exogeneity cannot be
rejected in any first stage. Consequently, instrumental variables estimators are inefficient
while the least squares estimates remain consistent and are therefore preferred.
4.3 Heterogeneity
We next examine heterogeneity along two dimensions: geographic and gender. While
(positive) rainfall shocks, such as flooding, may affect urban areas, their effects may be
stronger in rural areas for two reasons. First, rural households are relatively more
vulnerable to weather fluctuations since they frequently depend on rain-fed agriculture with

15
minimal irrigation.12 Second, poverty was primarily concentrated in rural areas during this
period and poorer households are more affected by fluctuations in income (caused by the
weather). We modify equation (1) to include interaction terms between the rainfall shocks
in each growth period and a rural indicator. The results are presented in Table 6. The effects
of rainfall shocks on average mental health are present in both urban and rural areas. In
urban areas, only the estimated coefficient for shocks at age 1 are significant. In rural area,
both of the post-birth estimated coefficients are significant. In the specifications with
depression, the estimate coefficient for rainfall shocks at age 2 are significant at the 10
percent levels. Taken together, the results suggest that may rural areas drive the main
results.
We next examine whether rainfall shocks affect boys and girls differently. Not only does
the broader literature on early life shocks frequently find differences based on gender, but
Liu et al. (2017) find that the effect of typhoons on depression are limited to women. We
modify equation (1) to include a binary variable for gender as well as interaction terms
between the rainfall shocks in each growth period and a rural indicator. The estimated
effects are presented in Table 7 and show that the main effects are completely driven by
the effects on women; none of the estimated coefficients for men are significant. The
estimated magnitudes are large: 12 to 28 percent higher average mental health scores and
a 12 percent increased likelihood of being depressed, an increase of 50 percent relative to
the sample mean. The estimated effect of early life shocks on the women’s likelihood of
being depressed matches Liu et al. (2017).
12 There is limited data for the percent of agricultural land in Indonesia that is irrigated. The World
Development Indicators suggests that it varies between 11 and 16 percent.

16
Unfortunately, the data do not allow us to understand the exact reasons for this. We are,
however, able to rule out one channel discussed in the literature: the culling of weaker
fetuses during pregnancy. For instance, Liu et al. (2017) note that their strong findings for
women are consistent with weaker male fetuses being less likely to survive leading to
stronger surviving males (Bozzoli et al. 2009; Liu et al. 2015; Bhalotra et al. 2010). Since
there are no effects on exposure to prenatal shocks, this is unlikely to be the channel.
Based on the broader literature, one possible explanation is that girls are more vulnerable
to shocks during these age groups. Another possibility is that the effects of these shocks
lead to within household re-allocations of time and/or resources that disproportionately
disadvantage girls. For instance, mothers may have to work outside of the house and spend
less time with children (Miller and Urdinola. 2010) The size of the effects and unclear
explanation makes this an important avenue for future research.
4.4 Potential Pathways
Having established a clear, causal relationship between early life exposure to rainfall
shocks and adult mental health, we next examine the pathways suggested by the literature
on weather, climate change and mental health (Berry et al. 2010) and the broader literatures
on early life shocks. As we discuss below, we are able to rule out pre-natal stress and
income shocks while we find evidence suggestive of the disease environment.
4.4.1 Pre-Natal Stress
As summarized in Adhvaryu et al. (2017b), pre-natal stress may affect prenatal growth and
is linked with mental disorders and depression (Brown et al., 2000; O’Connor et al., 2005;
St Clair et al., 2005; Watson et al., 1999). In addition to the direct effects on growth
17
(Hansen 2009), there may be indirect effects via elevated activity in the mother’s
neuroendocrine system (the ‘neurodevelopment hypothesis’; see, Bennet and Gunn 2006;
Phillips 2007). With respect to weather, this background literature focuses primarily on
temperature (as opposed to rainfall) (Hansen 2009). Within economics, Adhvaryu et al.
(2017b) find consistent effects for temperature and Dinkelman (2017) and Liu et al. (2017)
for rainfall (droughts and typhoons, respectively).
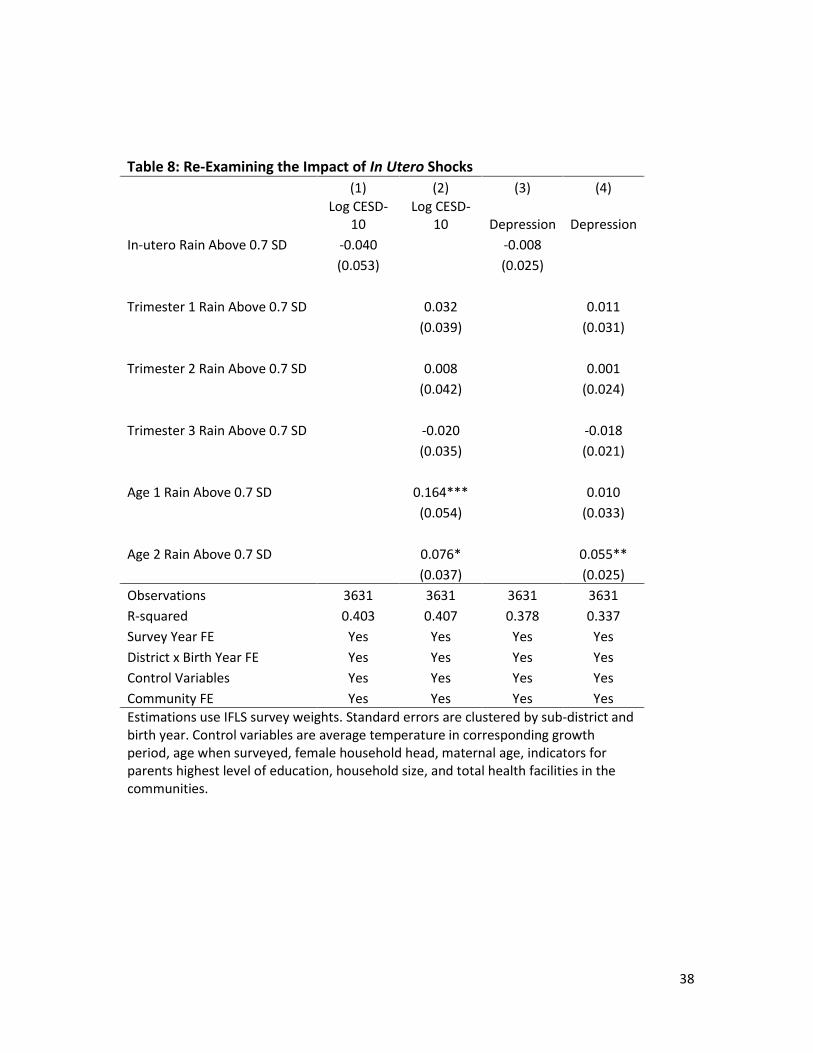
While we do not find any evidence for this in our main specification (Table 3: columns 1
and 3), we now examine alternate specifications to understand the role of prenatal shocks
in our context. We first alter the specification to more closely match Adhvaryu et al.
(2017b) who only control for prenatal shocks. However, the estimated coefficients remain
insignificant (Table 8: columns 1 and 3). Another possibility is that only some of the
trimesters matter but are insignificant when aggregated together. We therefore re-estimate
our main estimation after disaggregating prenatal shocks by semester. The estimated
coefficients for the trimesters are individually and jointly insignificant (Table 8: columns
2 and 4). Consequently, we are able to rule out pre-natal stress (and any other explanation
which relies on prenatal shocks) as a possible underlying mechanism (at least in the context
of Indonesia).
4.4.2 Income
We next examine the effect of income shocks, a highly studied shock in the broader
literature. Baird et al. (2013) find that positive income shocks for families improve the
mental health of adolescent girls. Adhvaryu et al. (2017a) extend this to the long-run effect
on adult mental health by examining exogenous price variation in cocoa, the main cash
18
crop in Ghana. The exact channels are unclear but may include nutrition or other food
deprivation (Brown et al 2000; Neugubauer et al 1999; Pol et al. 2000; Susser and St Clair
2003)
Unfortunately, we do not have information on the income or wealth levels of households
at the time of birth for our sample. Similarly, we cannot identify which households were
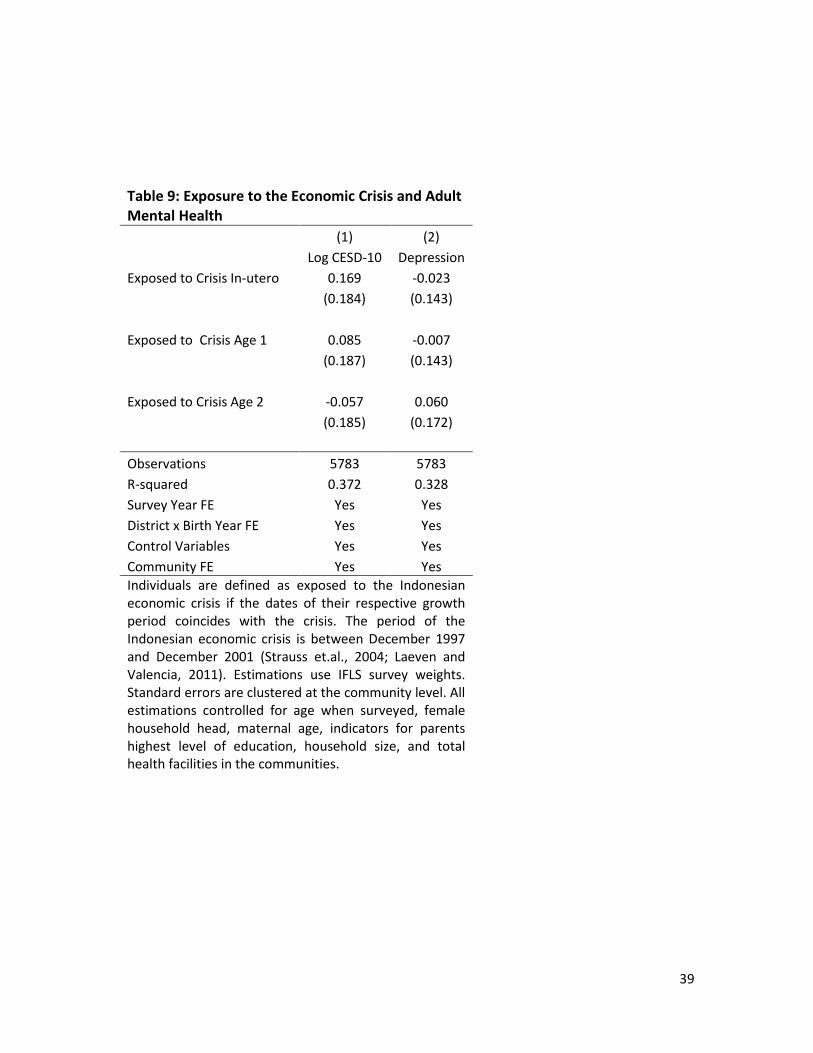
involved in cash crops. Consequently, we rely on a different income shock: the 1997 Asian
Financial Crisis. The crisis was the worst economic shock in recent Indonesian history and
had a devastating effect. Thomas and Frankenberg (2007) estimate that average per capita
expenditure dropped by 25 percent between 1997 and 1998. At the same time, inflation in
1998 reached 80 percent. It took roughly until 2001 for the country to recover.
We replace the rainfall shock variables with variables for exposure to the Asian Financial
Crisis during the different growth periods. The estimation results are presented in Table 9.
None of the estimated coefficients are significant although many have the expected sign.
If the primary pathway from rainfall shocks to adult mental health were through its effect
on income, the largest economic event in recent years would presumably have a similar
effect. However, this is not the case.
4.4.3 Disease
The disease environment has been linked to mental health through a variety of channels.
For instance, pre-natal exposure through mothers to influenza has been linked to
schizophrenia (Brown et al. 2004; Mednick et al 1988; Shi et al 2003). A recent review of
major infectious diseases links them to neurocognitive and mental health outcomes
(Chandy et al. 2015).

19
We focus here on two major diseases in Indonesia for which we have data: malaria and
dengue. Cerebral malaria is associated with increased risk of subsequent mental health
disorder in children (John et al. 2015). Among adults, malaria has been associated with
concurrent mental disorders (Weiss 1985). More broadly, in utero and post-natal exposure
to malaria are linked with lower adult education, income and poverty outcomes, which
could be associated with adult mental health (Barreca 2010; Cutler et al 2010). Similarly,
dengue has been associated with anxiety and depression, and mania in adults (Hashmi et
al 2012; Jhanjee et al 2011; Lam 1996)
Unfortunately, the IFLS does not contain information on personal disease histories.
Consequently, we examine how rainfall influences the disease environment using the
PODES (Potensi Desa) data which contain information on disease outbreaks for all
communities in Indonesia. We use data from the 2000, 2003, 2006, 2008, and 2011 survey
rounds and merge the two data sets together to create a yearly-community level measure
of disease outbreak for dengue fever and malaria. We estimate equation 2 in Table 10 and
find that positive rainfall shocks increase the prevalence of both dengue and malaria, two
diseases linked to depression (Barreca 2010; John et al. 2015; Weiss 1985).13 This is
consistent with the WHO 2003 report on climate change and human health, where extreme
weather events precipitate the transmission of tropical diseases such as malaria and dengue
fever, especially in regions with high El Nino South Oscillation (ENSO) signal
(McMichael, 2003). In the case of Indonesia, past ENSO events have been correlated with
13 In results which we available upon request, we show that it is not linked with diarrhea, upper respiratory
infection and measles epidemic outbreaks.

20
dengue epidemics (Gagnon et al, 2001). These results are consistent with disease outbreaks
being a factor that can lead to decreased adult mental health.
5. Conclusion
This study examines the impact of early life exposure to positive rainfall shocks on adult
mental health. We find a causal and robust effect: post-natal exposure leads to important
decreases in average mental health and large increases in the rate of depression. Since
positive rainfall shocks are relatively common in Indonesia (25% of the sample experience
a shock in the first 1,000 days post birth) and in the broader South East Asian region, this
suggests a potentially large and understudied burden in the region arising from climate.
Moreover, these effects are likely to be exacerbated by climate change in the coming years.
While we are able to rule out prenatal and income shocks as pathways, important questions
remain. With the data available to us, we were able to find support for the hypothesis that
the mechanism that mediates early exposure to rainfall shocks on adult mental health may
be through the influence of rainfall on disease prevalence. However, one important facet
of our analyses is to confirm the findings of Liu et al (2016) that these effects are present
only in women. It is, however, unclear why this is the case. While the explanation may be
biological, it may also reflect endogenous responses by households which can be addressed
through policy.
Likewise, our results are consistent with changes in the duration of breastfeeding (which
has been linked to improved mental health outcomes in children (Oddy et al. 2010)). The
median duration of exclusive breastfeeding in Indonesia is 0.7 months although some form
of breastfeeding often continues into the second year of life (Statistics Indonesia et al.,

21
2013). Our effects are limited to the first two years of life with the largest effects in the
first year. It is possible that large weather shocks may affect the ability of women to nurse
(e.g. stress, nutritional changes, time allocation) or that this is impacted by the prevalence
of diseases.
However, detailed data on breastfeeding is not available in the IFLS and so we were not
able to investigate this potential channel. If confirmed, this would also open another policy
avenue to address the changes in mental health brought about by early exposure to positive
rainfall shocks. Finally, insofar as these effects are caused by the spread of diseases, our
findings emphasize the importance of investments in basic public health and sanitation in
developing countries.

22
References
Adhvaryu, A., Fenske, J., Kala, N., Nyshadham, A., et al. (2016a). Fetal origins of mental
health: Evidence from Africa.
Adhvaryu, A., Fenske, J., and Nyshadham, A. (2016b). Early life circumstance and adult
mental health.
Aguilar Esteva, A. (2012). Essays in Development and Labor Economics. Doctoral
Dissertation, Harvard University.
Aldrian, E. and Dwi Susanto, R. (2003). Identification of Three Dominant Rainfall
Regions within Indonesia and Their Relationship to Sea Surface Temperature.
International Journal of Climatology, 23(12):1435–1452.
Andalón, M., Azevedo, J. P., Rodríguez-Castelán, C., Sanfelice, V., and Valderrama-
González, D. (2016). Weather Shocks and Health at Birth in Colombia. World
Development, 82:69–82.
Andresen, E. M., Malmgren, J. A., Carter, W. B., and Patrick, D. L. (1994). Screening for
Depression in Well Older Adults: Evaluation of. Prev Med, 10:77–84.
Auffhammer, M., Hsiang, S. M., Schlenker, W., and Sobel, A. (2013). Using weather
Data and Climate Model Output in Economic Analyses of Climate Change. Review of
Environmental Economics and Policy, page ret016.
Baird, Sarah & De Hoop, Jacobus & Ozler, Berk. 2011. Income Shocks and Adolescent
Mental Health. Journal of Human Resources. 48. 10.1353/jhr.2013.0014.

23
Barreca, Alan I. 2010. The long-term economic impact of in utero and postnatal exposure
to malaria. Journal of Human Resources, 45(4): 865–892.
Barker, D. J. (1995). Fetal Origins of Coronary Heart Disease. BMJ: British Medical
Journal, 311(6998):171.
BenYishay, A. (2013). Childhood Shocks and Trust in Adulthood: Impacts of Early-life
Rainfall in Sub-Saharan Africa. Technical Report, Working Paper, Department of
Economics, University of New South Wales.
Berry, HL, Bowen K, and Kjellstrom T. 2010 Climate Change and Mental Health: A
Causal Pathways Framework International Journal of Public Health 55(2): 123-32.
Bloom, D. E.; Chen, S.; McGovern, M.; Prettner, K.; Candeias, V.; Bernaert, A.; Cristin,
S. (2015) Economics of Non-Communicable Diseases in Indonesia. In: World
Economic Forum. 2015.
Boey, K. W. (1999). Cross-Validation of a Short Form of the CES-D in Chinese Elderly.
International journal of geriatric psychiatry, 14(8):608–617.
Brown, A. S., van Os, J., Driessens, C., Hoek, H. W., & Susser, E. S. (2000). Further
evidence of relation between prenatal famine and major affective disorder. American
Journal of Psychiatry, 157(2), 190-195.
Cameron, A. C., Gelbach, J. B., and Miller, D. L. (2008). Bootstrap-Based Improvements
for Inference with Clustered Errors. The Review of Economics and Statistics,
90(3):414–427.
24
Cameron, A. C. and Miller, D. L. (2015). A Practitioner’s Guide to Cluster-Robust
Inference. Journal of Human Resources, 50(2):317–372.
Case, M., Ardiansyah, F., and Spector, E. (2007). Climate Change in Indonesia:
Implications for Humans and Nature. World Wildlife Federation
Chen, F.-W. and Liu, C.-W. (2012). Estimation of the Spatial Rainfall Distribution using
Inverse Distance Weighting (IDW) in the Middle of Taiwan. Paddy and Water
Environment, 10(3):209– 222.
Correia, S. (2016). Linear Models with High-Dimensional Fixed Effects: An Efficient
and Feasible Estimator. Working Paper.
Cunha, F. and Heckman, J. J. (2008). Formulating, Identifying and Estimating the
Technology of Cognitive and Noncognitive Skill Formation. The Journal of Human
Resources, 43(4):738–782.
Currie, J. (2009). Healthy, Wealthy, and Wise: Is There a Causal Relationship between
Child Health and Human Capital Development? Journal of Economic Literature,
47(1):87–122.
Collins, Pamela Y., Vikram Patel, Sarah S. Joestl, Dana March, Thomas R. Insel, and
Abdallah S. Daar. 2011. “Grand Challenges In Global Mental Health.” Nature,
475(7354): 27–30
Dell, Melissa, Benjamin F. Jones, and Benjamin A. Olken. 2014. “What Do We Learn
from the Weather? The New Climate-Economy Literature.” Journal of Economic
Literature, 52(3): 740-798.

25
Demyttenaere, K, et al. 2004. “Prevalence, Severity, And Unmet Need For Treatment Of
Mental Disorders In The World Health Organization World Mental Health Surveys.”
Journal of the American Medical Association, 291(21): 2581–2590.
Deschenes, Olivier. 2014. “Temperature, Human Health, and Adaptation: A Review of
the Empirical Literature.” Energy Economics, 46: 606-619.
Deschênes, O. and Greenstone, M. (2011). Climate Change, Mortality, and Adaptation:
Evidence from Annual Fluctuations in Weather in the US. American Economic
Journal: Applied Economics, 3(4):152–185.
Deschênes, O., Greenstone, M., and Guryan, J. (2009). Climate Change and Birth
Weight. The American Economic Review, 99(2):211–217.
Dinkelman, Taryn 2017. Long Run Health Repercussions of Drought Shocks: Evidence
from South African Homelands The Economic Journal 127(604): 1906-1939.
Furukawa, T., Anraku, K., Hiroe, T., Takahashi, K., Kitamura, T., Hirai, T., Takahashi,
K., and Iida, M. (1997). Screening for Depression Among First-Visit Psychiatric
Patients: Comparison of Different Scoring Methods for the Center for Epidemiologic
Studies Depression Scale using Receiver Operating Characteristic Analyses.
Psychiatry and Clinical Neurosciences, 51(2):71–78.
Gagnon, A. S., Bush, A. B., and Smoyer-Tomic, K. E. (2001). Dengue Epidemics and the
El Niño Southern Oscillation. Climate Research, 19(1):35–43.
Gluckman, P. and Hanson, M. (2006). Mismatch: Why Our World No Longer Fits Our
Bodies. Oxford University Press.

26
Gluckman, P. D. and Hanson, M. A. (2005). The Fetal Matrix: Evolution, Development
and Disease. Cambridge University Press.
Hashmi, A. M., Butt, Z., Idrees, Z., Niazi, M., Yousaf, Z., Haider, S. F., & Bhatti, M. R.
(2012). Anxiety and depression symptoms in patients with dengue fever and their
correlation with symptom severity. The International Journal of Psychiatry in
Medicine, 44(3), 199-210.
Hoddinott, J. (2010). Nutrition and Conditional Cash Transfer Program. In Adato, M. and
Hoddinott, J., editors, Conditional Cash Transfers in Latin America. International
Food Policy Research Institute.
Jhanjee, A., Bhatia, M. S., & Srivastava, S. (2011). Mania in dengue fever. Industrial
psychiatry journal, 20(1), 56.
John, C. C., Carabin, H., Montano, S. M., Bangirana, P., Zunt, J. R., and Peterson, P. K.
(2015). Global Research Priorities for Infections that Affect the Nervous System.
Nature, 527(7578):S178–S186.
Kishore, K., Subbiah, A., Sribimawati, T., Diharto, I. S., Alimoeso, S., Rogers, P., and
Setiana, A. (2000). Indonesia Country Study. Asian Disaster Preparedness Center.
Krutikova, S. and Lilleør, H. (2015). Fetal Origins of Personality: Effects of Early Life
Circumstances on Adult Personality Traits. Technical report.
Leight, J., Glewwe, P., & Park, P. (2015). The Impact of Early Childhood Rainfall
Shocks on the Evolution of Cognitive and Non-Cognitive Skills. Manuscript.

27
Liu, Elain M., Liu, Jin-Tan, and Tsen, Tsu-Yin Hazel. Fetal Origins of Mental Health:
Evidence from Natural Disasters in Taiwan. Manuscript.
Maccini, S. and Yang, D. (2009). Under the Weather: Health, Schooling, and Economic
Consequences of Early-Life Rainfall. American Economic Review, 99(3):1006–26.
Maclean, Johanna Catherine, Popovici, Iona, and French, Michael T. 2016. Are Natural
Disasters in Early Childhood Associated with Mental Health and Substance Use
Disorder as an Adult? Social Science & Medicine 151: 78-91.
Manton, M., Della-Marta, P., Haylock, M., Hennessy, K., Nicholls, N., Chambers, L.,
Collins, D., Daw, G., Finet, A., Gunawan, D., et al. (2001). Trends in Extreme Daily
Rainfall and Temperature in Southeast Asia and the South Pacific: 1961–1998.
International Journal of Climatology, 21(3):269–284.
McMichael, A. J. (2003). Climate Change and Human Health: Risks and Responses.
World Health Organization.
Mednick, S. A., Machon, R. A., Huttunen, M. O., & Bonett, D. (1988). Adult
schizophrenia following prenatal exposure to an influenza epidemic. Archives of
general psychiatry, 45(2), 189-192.
Miller, G., and Urdinola, B.P. (2010) Cyclicality, Mortality, and the Value of Time: The
Case of Coffee Price Fluctuations and Child Survival in Colombia. Journal of
Political Economy, 118(1): 113-155.

28
Naylor, R. L., Battisti, D. S., Vimont, D. J., Falcon, W. P., and Burke, M. B. (2007).
Assessing Risks of Climate Variability and Climate Change for Indonesian Rice
Agriculture. Proceedings of the National Academy of Sciences, 104(19):7752–7757.
Neugebauer, R., Hoek, H. W., & Susser, E. (1999). Prenatal exposure to wartime famine
and development of antisocial personality disorder in early adulthood. Jama, 282(5),
455-462.
Oddy, W. H., Kendall, G. E., Li, J., Jacoby, P., Robinson, M., De Klerk, N. H., ... &
Stanley, F. J. (2010). The long-term effects of breastfeeding on child and adolescent
mental health: a pregnancy cohort study followed for 14 years. The Journal of
pediatrics, 156(4), 568-574.
Radloff, L. S. (1977). The CES-D Scale: A Self-Report Depression Scale for Research in
the General Population. Applied psychological measurement, 1(3):385–401.
Shah, M., & Steinberg, M.S.. (2017) Drought of Opportunities: Contemporaneous and
Long-Term Impacts of Rainfall Shocks on Human Capital. Journal of Political
Economy, 125(2): 527-561.
Shi, L., Fatemi, S. H., Sidwell, R. W., & Patterson, P. H. (2003). Maternal influenza
infection causes marked behavioral and pharmacological changes in the
offspring. Journal of Neuroscience, 23(1), 297-302.
Shrout, P. E. and Yager, T. J. (1989). Reliability and Validity of Screening Scales: Effect
of Reducing Scale Length. Journal of clinical epidemiology, 42(1):69–78.

29
Statistics Indonesia (Badan Pusat Statistik—BPS), National Population and Family
Planning Board (BKKBN), and Kementerian Kesehatan (Kemenkes—MOH), and
ICF International. 2013. Indonesia Demographic and Health Survey 2012. Jakarta,
Indonesia: BPS, BKKBN, Kemenkes, and ICF International.
Susser, E., & Clair, D. S. (2013). Prenatal famine and adult mental illness: interpreting
concordant and discordant results from the Dutch and Chinese Famines. Social
science & medicine, 97, 325-330.
Trewin, B., Baddour, O., and Kontongomde, H. (2007). The Role of Climatological
Normals in a Changing Climate. World Meteorological Organization.
Thisyakorn, U., Thisyakorn, C., Limpitikul, W., & Nisalak, A. (1999). Dengue infection
with central nervous system manifestations. The Southeast Asian journal of tropical
medicine and public health, 30(3), 504-506.
Victora, C. G., Adair, L., Fall, C., Hallal, P. C., Martorell, R., Richter, L., Sachdev, H. S.,
Maternal, Group, C. U. S., et al. (2008). Maternal and Child Undernutrition:
Consequences for Adult Health and Human Capital. The Lancet, 371(9609):340–
357.
Weiss, M. G. (1985). The Interrelationship of Tropical Disease and Mental Disorder:
Conceptual Framework and Literature Review (Part I—Malaria). Culture, Medicine
and Psychiatry, 9(2):121–200.
World Health Organization (2011). Mental Health Atlas 2011 – Indonesia, WHO.

30
World Meteorological Organization. (1989). Calculation of Monthly and Annual 30-year
Standard Normals.
World Meteorological Organization. (2011). Guide to Climatological Practices. WMO,
Geneva, Switzerland, 3rd edition.

31
Table 1: Summary Statistics
Variable Mean Std. Dev. Variable Percent
Log CESD-10 Score 1.74 0.75 Depression 23.16
Average Mean Temperature in Trimester 1 25.74 1.36 In Utero Rain Above 0.7 SD 21.61
Average Mean Temperature in Trimester 2 25.73 1.35 Trimester 1 Rain Above 0.7 SD 22.63
Average Mean Temperature in Trimester 3 25.72 1.38 Trimester 2 Rain Above 0.7 SD 22.06
Average Mean Temperature In Utero 25.73 1.30 Trimester Rain Above 0.7 SD 22.20
Average Mean Temperature Age 1 25.73 1.31 Age 1 Rain Above 0.7 SD 21.22
Average Mean Temperature Age 2 25.77 1.32 Age 2 Rain Above 0.7 SD 21.98
Averege Mean Temperature First 1,000 Days 25.74 1.28 First 1,000 Days Rain Above 0.7 SD 25.56
Age 18.90 3.38 Female Household Head 16.27
Maternal Age 26.76 6.42 Maternal Education Level:
Total Health Facilities in the Community 8.14 6.43 Missing 7.21
No Schooling 10.18
Elementary School 50.61
Junior High School 14.70
High School 13.30
College and Above 4.01
Paternal Education Level:
Missing 26.82
No Schooling 4.15
Elementary School 38.25
Junior High School 11.00
High School 13.95
College and Above 5.83
Observations 5,090

32
Table 2: Exposure to Early-Life Rainfall Shocks and Adult Mental Health
(1) (2) (3) (4)
Log CESD-10 Log CESD-10 Depression Depression
Rainfall Deviation In-utero -0.199 -0.002
(0.124) (0.070)
Rainfall Deviation Age 1 0.137 -0.005
(0.194) (0.170)
Rainfall Deviation Age 2 0.147 0.095
(0.153) (0.125)
In-utero Rain Below 0.7 SD 0.008 0.001
(0.047) (0.028)
Age 1 Rain Below 0.7 SD -0.039 -0.005
(0.040) (0.032)
Age 2 Rain Below 0.7 SD -0.023 0.011
(0.040) (0.017)
In-utero Rain Above 0.7 SD -0.019 -0.003
(0.060) (0.035)
Age 1 Rain Above 0.7 SD 0.153*** 0.020
(0.046) (0.031)
Age 2 Rain Above 0.7 SD 0.063 0.055*
(0.036) (0.029)
Observations 3631 3631 3631 3631
R-squared 0.441 0.442 0.377 0.378
Survey Year FE Yes Yes Yes Yes
District x Birth Year FE Yes Yes Yes Yes
Control Variables Yes Yes Yes Yes
Community FE Yes Yes Yes Yes Estimations use IFLS survey weights. Standard errors are clustered by sub-district and birth year. Control variables are average temperature in corresponding growth period, age when surveyed, female household head, maternal age, indicators for parents highest level of education, household size, and total health facilities in the communities.

33
Table 3: Exposure to Positive Early-Life Rainfall Shocks and Adult Mental Health
(1) (2) (3) (4)
Log CESD-
10 Log CESD-
10 Depression Depression
In-utero Rain Above 0.7 SD -0.026 -0.011 -0.003 0.007
(0.054) (0.054) (0.033) (0.033)
Age 1 Rain Above 0.7 SD 0.156*** 0.148*** 0.022 0.016
(0.044) (0.046) (0.030) (0.030)
Age 2 Rain Above 0.7 SD 0.059* 0.061* 0.053* 0.051*
(0.029) (0.034) (0.026) (0.028)
Age 3 Rain Above 0.7 SD -0.025 -0.025
(0.051) (0.025)
Age 4 Rain Above 0.7 SD -0.036 -0.039
(0.046) (0.037)
Age 5 Rain Above 0.7 SD -0.001 -0.007
(0.064) (0.038)
Age 6 Rain Above 0.7 SD -0.007 0.011
(0.042) (0.028)
Age 7 Rain Above 0.7 SD 0.003 0.011
(0.059) (0.030)
Observations 3631 3631 3631 3631
R-squared 0.442 0.442 0.378 0.380
Survey Year FE Yes Yes Yes Yes
District x Birth Year FE Yes Yes Yes Yes
Control Variables Yes Yes Yes Yes
Community FE Yes Yes Yes Yes Estimations use IFLS survey weights. Standard errors are clustered by sub-district and birth year. Control variables are average temperature in corresponding growth period, age when surveyed, female household head, maternal age, indicators for parents highest level of education, household size, and total health facilities in the communities.
34
Table 4: Exposure to Positive Early-Life Rainfall Shocks and Adult Mental Health (Birth Seasonality)
(1) (2) (3) (4)
Log CESD-
10 Log CESD-
10 Depression Depression
In-utero Rain Above 0.7 SD 0.001 -0.012 0.018 0.011
(0.103) (0.102) (0.044) (0.047)
Age 1 Rain Above 0.7 SD 0.222* 0.206* -0.007 -0.015
(0.108) (0.113) (0.045) (0.050)
Age 2 Rain Above 0.7 SD 0.164* 0.149 0.091* 0.075
(0.081) (0.088) (0.046) (0.051)
Age 3 Rain Above 0.7 SD -0.031 -0.070
(0.110) (0.049)
Age 4 Rain Above 0.7 SD -0.079 -0.092
(0.074) (0.066)
Age 5 Rain Above 0.7 SD 0.017 0.017
(0.129) (0.074)
Age 6 Rain Above 0.7 SD -0.066 0.001
(0.106) (0.063)
Age 7 Rain Above 0.7 SD 0.073 -0.000
(0.095) (0.062)
Observations 2295 2295 2295 2295 R-squared 0.569 0.572 0.515 0.517
Survey Year FE Yes Yes Yes Yes
District x Birth Year x Birth Quarter FE Yes Yes Yes Yes
Control Variables Yes Yes Yes Yes
Community FE Yes Yes Yes Yes
*** p<0.01, ** p<0.05, * p<0.1
Estimations use IFLS survey weights. Standard errors are clustered by sub-district and birth year. Control variables are average temperature in corresponding growth period, age when surveyed, female household head, maternal age, indicators for parents highest level of education, household size, and total health facilities in the communities.

35
Table 5: Robustness to Alternative Rainfall Measures
(1) (2) (3) (4)
Log CESD-10 Log CESD-10 Depression Depression
In-utero Rain Above 0.7 SD -0.026 -0.028 -0.003 0.003
(0.054) (0.050) (0.033) (0.034)
Age 1 Rain Above 0.7 SD 0.156*** 0.140*** 0.022 0.019
(0.044) (0.039) (0.030) (0.028)
Age 2 Rain Above 0.7 SD 0.059* 0.067** 0.053* 0.061**
(0.029) (0.028) (0.026) (0.024)
Rainfall Average Cumulative Average Cumulative
Observations 3631 3642 3631 3642
R-squared 0.442 0.441 0.378 0.376
Survey Year FE Yes Yes Yes Yes
District x Birth Year FE Yes Yes Yes Yes
Control Variables Yes Yes Yes Yes
Community FE Yes Yes Yes Yes
Estimations use IFLS survey weights. Standard errors are clustered by sub-district and birth year. Control
variables are average temperature in corresponding growth period, age when surveyed, female
household head, maternal age, indicators for parents highest level of education, household size, and
total health facilities in the communities.

36
Table 6: Effects of Rainfall on Adult Mental Health, Rural vs Urban
(1) (4)
Log CESD-
10 Depression
Effect of In-utero Shock in Urban Communities 0.060 0.028
(0.088) (0.046)
Effect of Age 1 Shock in Urban Communities 0.133* 0.046
(0.075) (0.053)
Effect of Age 2 Shock in Urban Communities -0.002 0.044
(0.055) (0.038)
Effect of In Utero Shock in Rural Communities -0.068 -0.018
(0.063) (0.037)
Effect of Age 1 Shock in Rural Communities 0.165** 0.010
(0.069) (0.032)
Effect of Age 2 Shock in Rural Communities 0.097** 0.059*
(0.039) (0.034)
Observations 3631 3631
R-squared 0.443 0.378
Survey Year FE Yes Yes
District x Birth Year FE Yes Yes
Control Variables Yes Yes
Community FE Yes Yes
Estimations use IFLS survey weights. Standard errors are clustered by sub-district and birth year. Control variables are average temperature in corresponding growth period, age when surveyed, female household head, maternal age, indicators for parents highest level of education, household size, and total health facilities in the communities.

37
Table 7: Effects of Rainfall on Adult Mental Health, Male vs Female
(1) (4)
Log CESD-10 Depression
Effect of In Utero Shock for Men -0.031 -0.002
(0.056) (0.038)
Effect of Age 1 Shock for Men 0.096 0.028
(0.060) (0.037)
Effect of Age 2 Shock for Men 0.035 0.020
(0.021) (0.028)
Effect of In Utero Shock for Women 0.027 0.019
(0.084) (0.042)
Effect of Age 1 Shock for Women 0.276*** 0.039
(0.052) (0.036)
Effect of Age 2 Shock for Women 0.118* 0.118**
(0.063) (0.043)
Observations 3631 3631
R-squared 0.445 0.380
Survey Year FE Yes Yes
District x Birth Year FE Yes Yes
Control Variables Yes Yes
Community FE Yes Yes
Estimations use IFLS survey weights. Standard errors are clustered by sub-district and birth year. Control variables are gender, average temperature in corresponding growth period, age when surveyed, female household head, maternal age, indicators for parents highest level of education, household size, and total health facilities in the communities.
38
Table 8: Re-Examining the Impact of In Utero Shocks
(1) (2) (3) (4)
Log CESD-
10 Log CESD-
10 Depression Depression
In-utero Rain Above 0.7 SD -0.040 -0.008
(0.053) (0.025)
Trimester 1 Rain Above 0.7 SD 0.032 0.011
(0.039) (0.031)
Trimester 2 Rain Above 0.7 SD 0.008 0.001
(0.042) (0.024)
Trimester 3 Rain Above 0.7 SD -0.020 -0.018
(0.035) (0.021)
Age 1 Rain Above 0.7 SD 0.164*** 0.010
(0.054) (0.033)
Age 2 Rain Above 0.7 SD 0.076* 0.055**
(0.037) (0.025)
Observations 3631 3631 3631 3631
R-squared 0.403 0.407 0.378 0.337
Survey Year FE Yes Yes Yes Yes
District x Birth Year FE Yes Yes Yes Yes
Control Variables Yes Yes Yes Yes
Community FE Yes Yes Yes Yes
Estimations use IFLS survey weights. Standard errors are clustered by sub-district and birth year. Control variables are average temperature in corresponding growth period, age when surveyed, female household head, maternal age, indicators for parents highest level of education, household size, and total health facilities in the communities.
39
Table 9: Exposure to the Economic Crisis and Adult Mental Health
(1) (2)
Log CESD-10 Depression
Exposed to Crisis In-utero 0.169 -0.023
(0.184) (0.143)
Exposed to Crisis Age 1 0.085 -0.007
(0.187) (0.143)
Exposed to Crisis Age 2 -0.057 0.060
(0.185) (0.172)
Observations 5783 5783
R-squared 0.372 0.328
Survey Year FE Yes Yes
District x Birth Year FE Yes Yes
Control Variables Yes Yes
Community FE Yes Yes
Individuals are defined as exposed to the Indonesian economic crisis if the dates of their respective growth period coincides with the crisis. The period of the Indonesian economic crisis is between December 1997 and December 2001 (Strauss et.al., 2004; Laeven and Valencia, 2011). Estimations use IFLS survey weights. Standard errors are clustered at the community level. All estimations controlled for age when surveyed, female household head, maternal age, indicators for parents highest level of education, household size, and total health facilities in the communities.

40
Table 10: Rainfall Shocks and Community Epidemics
(1) (2)
Dengue Fever
Epidemic
Malaria
Epidemic
Yearly Rain Above 0.7 SD 0.062* 0.031*
(0.033) (0.017)
Observations 1446 1446
R-squared 0.031 0.063
Province Fixed Effect Yes Yes
Year Fixed Effect Yes Yes
Robust standard errors are clustered at the subdistrict level. Estimation is at
the IFLS community level. Estimation data are based on matches between
IFLS communities with PODES. Disease epidemic data are from PODES 2000,
PODES 2003, PODES 2006, PODES 2008, and PODES 2011. Estimations
control for average temperature in the given year.
CINCH working paper series
1 Halla, Martin and Martina Zweimüller. Parental Responses to Early Human Capital Shocks: Evidence from the Chernobyl Accident. CINCH 2014.
2 Aparicio, Ainhoa and Libertad González. Newborn Health and the Business Cycle: Is it Good to be born in Bad Times? CINCH 2014.
3 Robinson, Joshua J. Sound Body, Sound Mind?: Asymmetric and Symmetric Fetal Growth Restriction and Human Capital Development. CINCH 2014.
4 Bhalotra, Sonia, Martin Karlsson and Therese Nilsson. Life Expectancy and Mother-Baby Interventions: Evidence from A Historical Trial. CINCH 2014.
5 Goebel, Jan, Christian Krekel, Tim Tiefenbach and Nicolas R. Ziebarth. Natural Disaster, Environmental Concerns, Well-Being and Policy Action: The Case of Fukushima. CINCH 2014.
6 Avdic, Daniel, A matter of life and death? Hospital Distance and Quality of Care: Evidence from Emergency Hospital Closures and Myocardial Infarctions. CINCH 2015.
7 Costa-Font, Joan, Martin Karlsson and Henning Øien. Informal Care and the Great Recession. CINCH 2015.
8 Titus J. Galama and Hans van Kippersluis. A Theory of Education and Health. CINCH 2015.
9 Dahmann, Sarah. How Does Education Improve Cognitive Skills?: Instructional Time versus Timing of Instruction. CINCH 2015.
10 Dahmann, Sarah and Silke Anger. The Impact of Education on Personality: Evidence from a German High School Reform. CINCH 2015.
11 Carbone, Jared C. and Snorre Kverndokk. Individual Investments in Education and Health. CINCH 2015.
12 Zilic, Ivan. Effect of forced displacement on health. CINCH 2015.
13 De la Mata, Dolores and Carlos Felipe Gaviria. Losing Health
Insurance When Young: Impacts on Usage of Medical Services and Health. CINCH 2015.
14 Tequame, Miron and Nyasha Tirivayi. Higher education and fertility: Evidence from a natural experiment in Ethiopia. CINCH 2015.
15 Aoki, Yu and Lualhati Santiago. Fertility, Health and Education of UK Immigrants: The Role of English Language Skills. CINCH 2015.
16 Rawlings, Samantha B., Parental education and child health: Evidence from an education reform in China. CINCH 2015.
17 Kamhöfer, Daniel A., Hendrik Schmitz and Matthias Westphal. Heterogeneity in Marginal Non-monetary Returns to Higher Education. CINCH 2015.
18 Ardila Brenøe, Anne and Ramona Molitor. Birth Order and Health of Newborns: What Can We Learn from Danish Registry Data? CINCH 2015.
19 Rossi, Pauline. Strategic Choices in Polygamous Households: Theory and Evidence from Senegal. CINCH 2016.
20 Clarke, Damian and Hanna Mühlrad. The Impact of Abortion Legalization on Fertility and Maternal Mortality: New Evidence from Mexico. CINCH 2016.
21 Jones, Lauren E. and Nicolas R. Ziebarth. US Child Safety Seat Laws: Are they Effective, and Who Complies? CINCH 2016.
22 Koppensteiner, Martin Foureaux and Jesse Matheson. Access to Education and Teenage Pregnancy. CINCH 2016.
23 Hofmann, Sarah M. and Andrea M. Mühlenweg. Gatekeeping in German Primary Health Care – Impacts on Coordination of Care, Quality Indicators and Ambulatory Costs. CINCH 2016.
24 Sandner, Malte. Effects of Early Childhood Intervention on Fertility and Maternal Employment: Evidence from a Randomized Controlled Trial. CINCH 2016.
25 Baird, Matthew, Lindsay Daugherty, and Krishna Kumar. Improving Estimation of Labor Market Disequilibrium through Inclusion of Shortage Indicators. CINCH 2017.
26 Bertoni, Marco, Giorgio Brunello and Gianluca Mazzarella. Does
postponing minimum retirement age improve healthy behaviors before retirement? Evidence from middle-aged Italian workers. CINCH 2017.
27 Berniell, Inés and Jan Bietenbeck. The Effect of Working Hours on Health. CINCH 2017.
28 Cronin, Christopher, Matthew Forsstrom, and Nicholas Papageorge. Mental Health, Human Capital and Labor Market Outcomes. CINCH 2017.
29 Kamhöfer, Daniel and Matthias Westphal. Fertility Effects of College Education: Evidence from the German Educationl Expansion. CINCH 2017.
30 Jones, John Bailey and Yue Li. The Effects of Collecting Income Taxes on Social Security Benefits. CINCH 2017.
31 Hofmann, Sarah and Andrea Mühlenweg. Learning Intensity Effects in Students’ Mental and Physical Health – Evidence from a Large Scale Natural Experiment in Germany. CINCH 2017.
32 Vollmer, Sebastian and Juditha Wójcik. The Long-term
Consequences of the Global 1918 Influenza Pandemic: A Systematic Analysis of 117 IPUMS International Census Data Sets. CINCH 2017.
33 Thamarapani, Dhanushka, Rockmore, Marc, and Willa Friedman. The Educational and Fertility Effects of Sibling Deaths. CINCH 2018.
34 Lemmon, Elizabeth. Utilisation of personal care services in Scotland: the influence of unpaid carers. CINCH 2018.
35 Avdic, Daniel, Büyükdurmus, Tugba, Moscelli, Giuseppe, Pilny, Adam, and Ieva Sriubaite. Subjective and objective quality reporting and choice of hospital: Evidence from maternal care services in Germany. CINCH 2018.
36 Hentschker, Corinna and Ansgar Wübker. Quasi-experimental evidence on the effectiveness of heart attack treatment in Germany. CINCH 2018.
37 Pasha, Mochamad, Rockmore, Marc, and Chih Ming Tan. Early Life Exposure to Above Average Rainfall and Adult Mental Health. CINCH 2018