Early Lessons in Population Health Management and … · Early Lessons in Population Health...
53
Early Lessons in Population Health Management and Risk-based Payment Models Presentation to National Accountable Care Congress November 1, 2012
Transcript of Early Lessons in Population Health Management and … · Early Lessons in Population Health...
Early Lessons in Population Health Management and Risk-based Payment ModelsPresentation to National Accountable Care CongressNovember 1, 2012
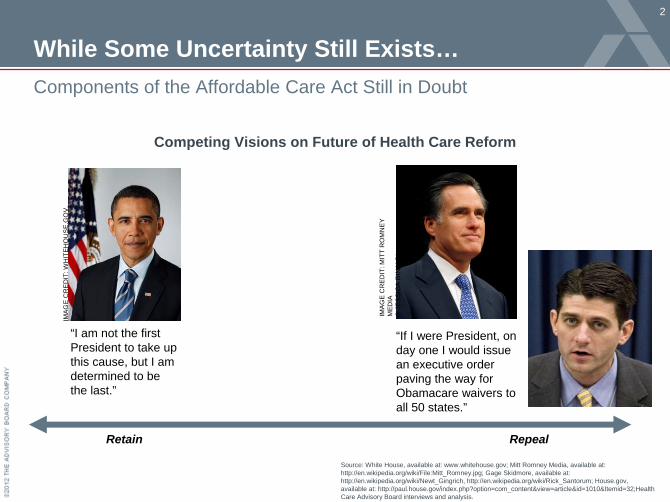
While Some Uncertainty Still Exists…
2
Components of the Affordable Care Act Still in Doubt
Source: White House, available at: www.whitehouse.gov; Mitt Romney Media, available at: http://en.wikipedia.org/wiki/File:Mitt_Romney.jpg; Gage Skidmore, available at: http://en.wikipedia.org/wiki/Newt_Gingrich, http://en.wikipedia.org/wiki/Rick_Santorum; House.gov, available at: http://paul.house.gov/index.php?option=com_content&view=article&id=1010&Itemid=32;Health Care Advisory Board interviews and analysis.
“I am not the first President to take up this cause, but I am determined to be the last.”
“If I were President, on day one I would issue an executive order paving the way for Obamacare waivers to all 50 states.”
RepealRetain
IMAG
E C
RED
IT: W
HIT
EHO
US
E.G
OV.
IMAG
E C
RED
IT: M
ITT
RO
MN
EY
ME
DIA
©JE
SSI
CA
RIN
ALD
I.
Competing Visions on Future of Health Care Reform
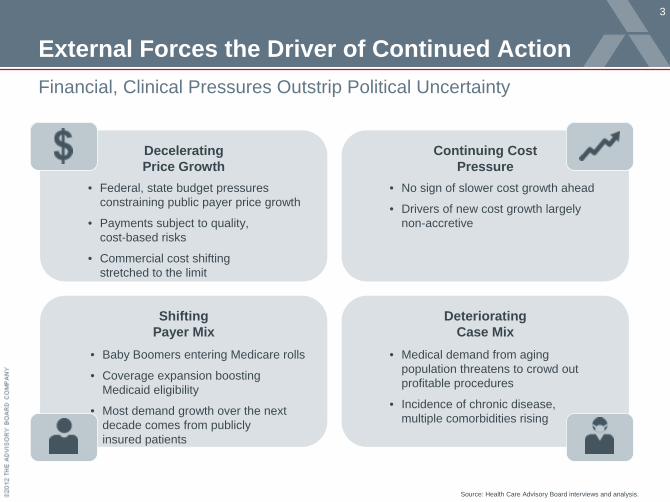
Decelerating Price Growth
Continuing Cost Pressure
Shifting Payer Mix
Deteriorating Case Mix
• Medical demand from aging population threatens to crowd out profitable procedures
• Incidence of chronic disease, multiple comorbidities rising
• No sign of slower cost growth ahead
• Drivers of new cost growth largely non-accretive
• Baby Boomers entering Medicare rolls
• Coverage expansion boosting Medicaid eligibility
• Most demand growth over the next decade comes from publicly insured patients
• Federal, state budget pressures constraining public payer price growth
• Payments subject to quality, cost-based risks
• Commercial cost shifting stretched to the limit
External Forces the Driver of Continued Action
3
Financial, Clinical Pressures Outstrip Political Uncertainty
Source: Health Care Advisory Board interviews and analysis.
No More Blank Checks
4
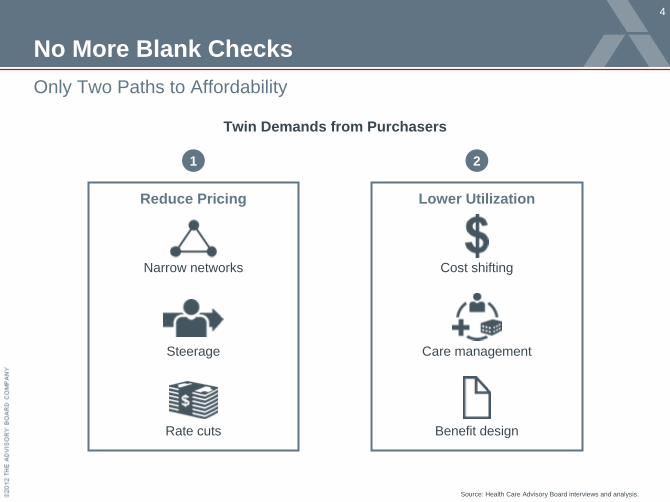
Only Two Paths to Affordability
Source: Health Care Advisory Board interviews and analysis.
Twin Demands from Purchasers
Reduce Pricing
Steerage
Narrow networks
Rate cuts
1
Care management
Cost shifting
Benefit design
Lower Utilization
2
Not Just Within the Medicare Program
5
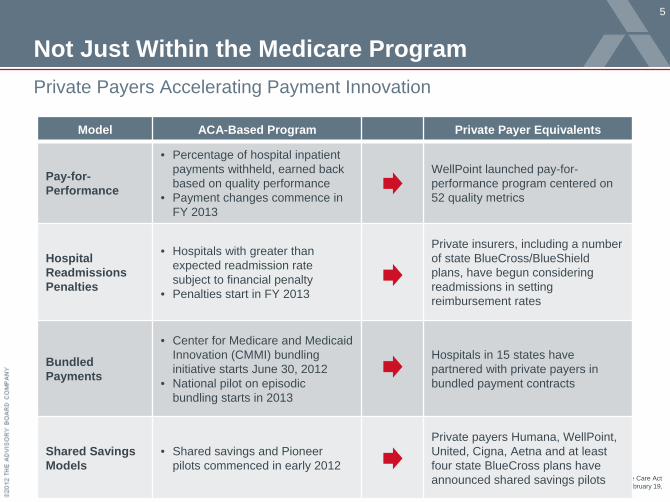
Private Payers Accelerating Payment Innovation
Source: US Senate, “The Patient Protection and Affordable Care Act and the Health Care and Education Reconciliation Act,” February 19, 2010; Health Care Advisory Board interviews and analysis.
Model ACA-Based Program Private Payer Equivalents
Pay-for- Performance
• Percentage of hospital inpatient payments withheld, earned back based on quality performance
• Payment changes commence in FY 2013
WellPoint launched pay-for- performance program centered on 52 quality metrics
Hospital Readmissions Penalties
• Hospitals with greater than expected readmission rate subject to financial penalty
• Penalties start in FY 2013
Private insurers, including a number of state BlueCross/BlueShield plans, have begun considering readmissions in setting reimbursement rates
Bundled Payments
• Center for Medicare and Medicaid Innovation (CMMI) bundling initiative starts June 30, 2012
• National pilot on episodic bundling starts in 2013
Hospitals in 15 states have partnered with private payers in bundled payment contracts
Shared Savings Models
• Shared savings and Pioneer pilots commenced in early 2012
Private payers Humana, WellPoint, United, Cigna, Aetna and at least four state BlueCross plans have announced shared savings pilots
6
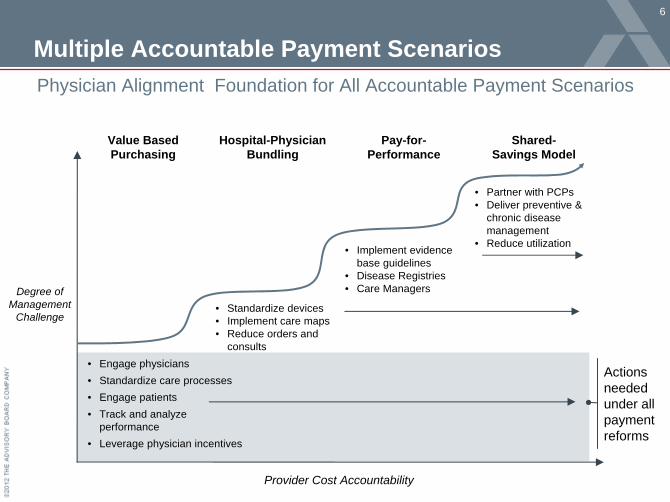
Multiple Accountable Payment ScenariosPhysician Alignment Foundation for All Accountable Payment Scenarios
Value Based Purchasing
Hospital-Physician Bundling
Shared- Savings Model
Degree of Management
Challenge
• Engage physicians• Standardize care processes• Engage patients• Track and analyze
performance• Leverage physician incentives
• Standardize devices• Implement care maps• Reduce orders and
consults
• Implement evidence base guidelines
• Disease Registries• Care Managers
• Partner with PCPs• Deliver preventive &
chronic disease management
• Reduce utilization
Actions needed under all payment reforms
Provider Cost Accountability
Pay-for-Performance
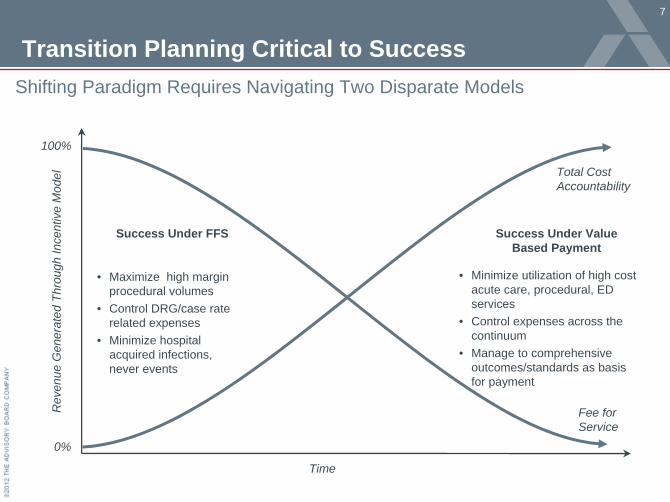
Transition Planning Critical to Success
7
Shifting Paradigm Requires Navigating Two Disparate Models
Time
Rev
enue
Gen
erat
ed T
hrou
gh In
cent
ive
Mod
el
Fee for Service
100%
0%
Total Cost Accountability
• Maximize high margin procedural volumes
• Control DRG/case rate related expenses
• Minimize hospital acquired infections, never events
• Minimize utilization of high cost acute care, procedural, ED services
• Control expenses across the continuum
• Manage to comprehensive outcomes/standards as basis for payment
Success Under FFS Success Under Value Based Payment
Keeping Up with the Joneses
8
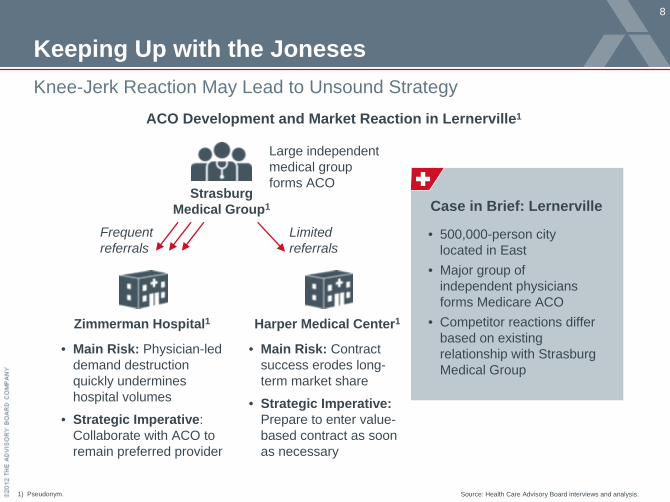
Knee-Jerk Reaction May Lead to Unsound Strategy
Source: Health Care Advisory Board interviews and analysis.1) Pseudonym.
ACO Development and Market Reaction in Lernerville1
Strasburg Medical Group1
• Main Risk: Physician-led demand destruction quickly undermines hospital volumes
• Strategic Imperative: Collaborate with ACO to remain preferred provider
Zimmerman Hospital1
• Main Risk: Contract success erodes long- term market share
• Strategic Imperative: Prepare to enter value- based contract as soon as necessary
Harper Medical Center1
Frequent referrals
Large independent medical group forms ACO
Limited referrals
Case in Brief: Lernerville
• 500,000-person city located in East
• Major group of independent physicians forms Medicare ACO
• Competitor reactions differ based on existing relationship with Strasburg Medical Group
The Business Case for Change
9
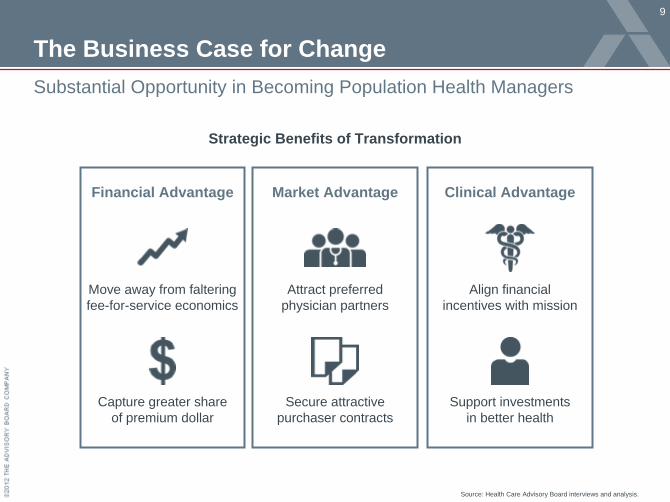
Substantial Opportunity in Becoming Population Health Managers
Source: Health Care Advisory Board interviews and analysis.
Strategic Benefits of Transformation
Capture greater share of premium dollar
Move away from faltering fee-for-service economics
Financial Advantage
Attract preferred physician partners
Secure attractive purchaser contracts
Market Advantage
Align financial incentives with mission
Support investments in better health
Clinical Advantage
So, What’s Stopping Us?
10
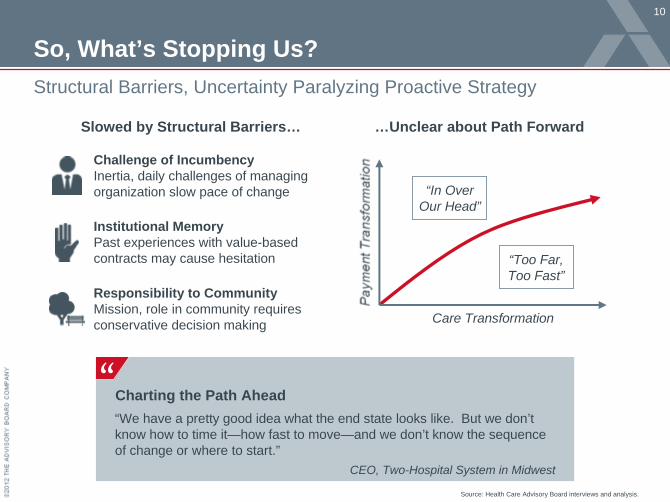
Structural Barriers, Uncertainty Paralyzing Proactive Strategy
Source: Health Care Advisory Board interviews and analysis.
Charting the Path Ahead“We have a pretty good idea what the end state looks like. But we don’t know how to time it—how fast to move—and we don’t know the sequence of change or where to start.”
”
CEO, Two-Hospital System in Midwest
Care Transformation
“In Over Our Head”
“Too Far, Too Fast”
…Unclear about Path ForwardSlowed by Structural Barriers…
Challenge of Incumbency Inertia, daily challenges of managing organization slow pace of change
Responsibility to Community Mission, role in community requires conservative decision making
Institutional Memory Past experiences with value-based contracts may cause hesitation
Inertia Not an Option
11
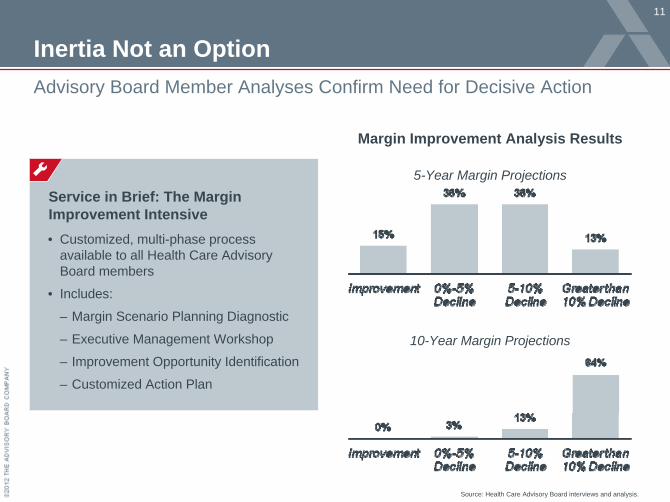
Advisory Board Member Analyses Confirm Need for Decisive Action
Margin Improvement Analysis Results
5-Year Margin Projections
10-Year Margin Projections
Source: Health Care Advisory Board interviews and analysis.
Service in Brief: The Margin Improvement Intensive• Customized, multi-phase process
available to all Health Care Advisory Board members
• Includes:
– Margin Scenario Planning Diagnostic
– Executive Management Workshop
– Improvement Opportunity Identification
– Customized Action Plan
Two Plausible Transition Paths
12
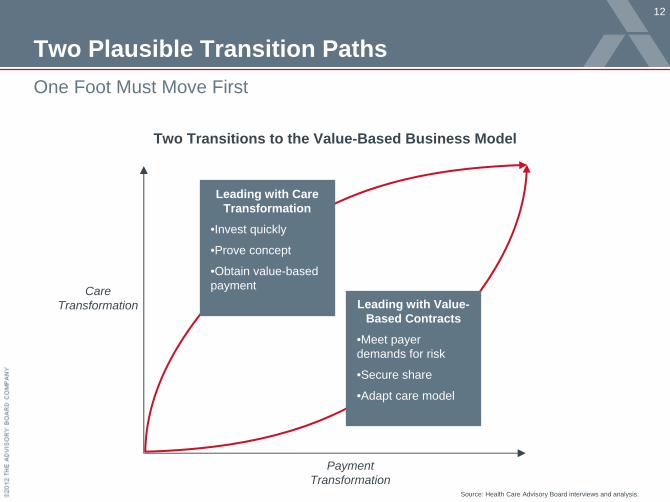
One Foot Must Move First
Two Transitions to the Value-Based Business Model
Source: Health Care Advisory Board interviews and analysis.
Payment Transformation
Care Transformation
Leading with Care Transformation
•Invest quickly
•Prove concept
•Obtain value-based payment
Leading with Value- Based Contracts
•Meet payer demands for risk
•Secure share
•Adapt care model
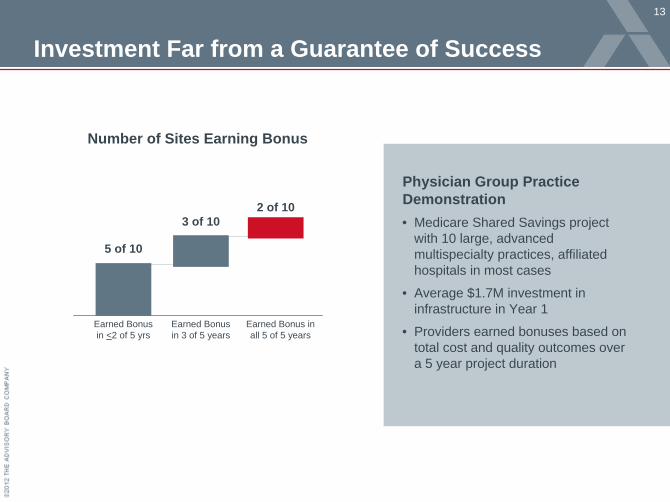
Physician Group Practice Demonstration
13
• Medicare Shared Savings project with 10 large, advanced multispecialty practices, affiliated hospitals in most cases
• Average $1.7M investment in infrastructure in Year 1
• Providers earned bonuses based on total cost and quality outcomes over a 5 year project duration
Number of Sites Earning Bonus
Investment Far from a Guarantee of Success
5 of 10
3 of 102 of 10
Earned Bonus in <2 of 5 yrs
Earned Bonus in 3 of 5 years
Earned Bonus in all 5 of 5 years

Case in Brief: St. John’s Health System
14
• Six‐hospital integrated delivery system
located in Missouri; part of Sisters of
Mercy Health System
• Employs over 450 physicians• Participant in Medicare Physician Group
Practice Demonstration
• $3.1 million bonus earned after
completing IT investments, care
redesign
Total Expenditures Relative to Target
Building Towards a New ModelSt. John’s First Earned PGP Bonus in Year Three
Year 1Year 2 Year 3
$4.5 M
($700 K)
($9.1 M)
Year 2 savings not sufficient to earn bonus
$3.1 MAccountable care infrastructure under construction; institutional willpower drives efforts despite bonus absence
Shared Savings Bonus Earned
$0 $0
Payers Following the Savings
15
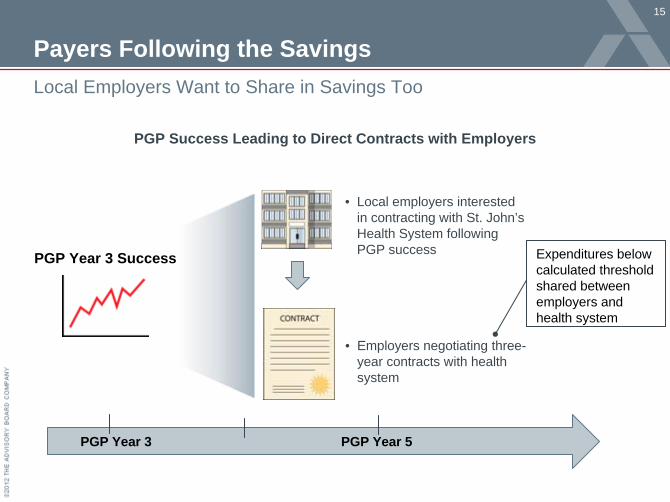
Local Employers Want to Share in Savings Too
PGP Success Leading to Direct Contracts with Employers
PGP Year 3 Success
• Local employers interested in contracting with St. John’s Health System following PGP success
• Employers negotiating three- year contracts with health system
Expenditures below calculated threshold shared between employers and health system
PGP Year 3 PGP Year 5
16
1) Pseudonym.
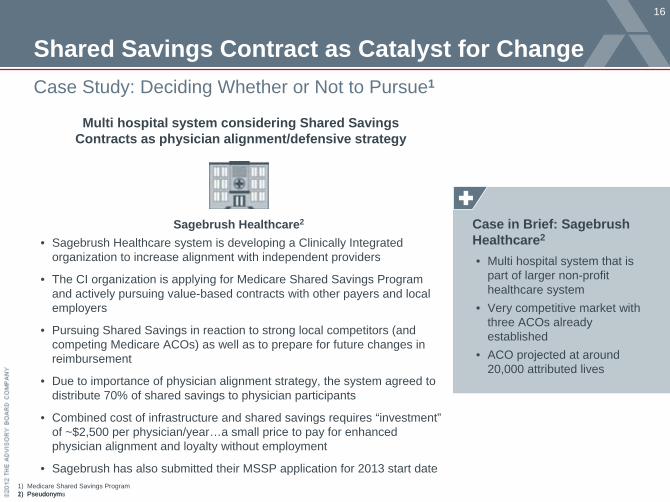
Case in Brief: Sagebrush Healthcare2
• Multi hospital system that is part of larger non-profit healthcare system
• Very competitive market with three ACOs already established
• ACO projected at around 20,000 attributed lives
1) Medicare Shared Savings Program2) Pseudonyms
Multi hospital system considering Shared Savings Contracts as physician alignment/defensive strategy
• Sagebrush Healthcare system is developing a Clinically Integrated organization to increase alignment with independent providers
• The CI organization is applying for Medicare Shared Savings Program and actively pursuing value-based contracts with other payers and local employers
• Pursuing Shared Savings in reaction to strong local competitors (and competing Medicare ACOs) as well as to prepare for future changes in reimbursement
• Due to importance of physician alignment strategy, the system agreed to distribute 70% of shared savings to physician participants
• Combined cost of infrastructure and shared savings requires “investment” of ~$2,500 per physician/year…a small price to pay for enhanced physician alignment and loyalty without employment
• Sagebrush has also submitted their MSSP application for 2013 start date
Shared Savings Contract as Catalyst for ChangeCase Study: Deciding Whether or Not to Pursue1
Sagebrush Healthcare2
Building Differential Market Assets Profitably
17
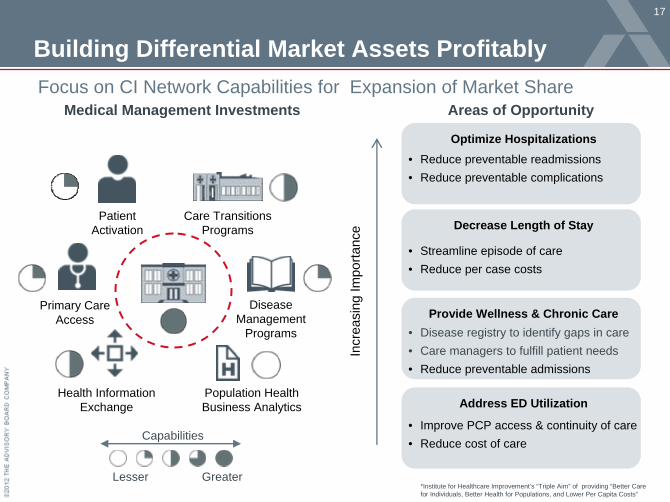
Focus on CI Network Capabilities for Expansion of Market ShareMedical Management Investments
Provide Wellness & Chronic Care
Optimize Hospitalizations
Address ED Utilization
• Reduce preventable readmissions• Reduce preventable complications
• Improve PCP access & continuity of care• Reduce cost of care
• Disease registry to identify gaps in care• Care managers to fulfill patient needs• Reduce preventable admissions
Incr
easi
ng Im
porta
nce
Areas of Opportunity
Population Health Business Analytics
Primary CareAccess
Health InformationExchange
Patient Activation
Care TransitionsPrograms
Disease Management
Programs
Lesser Greater
Capabilities
*Institute for Healthcare Improvement’s “Triple Aim” of providing “Better Care for Individuals, Better Health for Populations, and Lower Per Capita Costs”
Decrease Length of Stay
• Streamline episode of care• Reduce per case costs
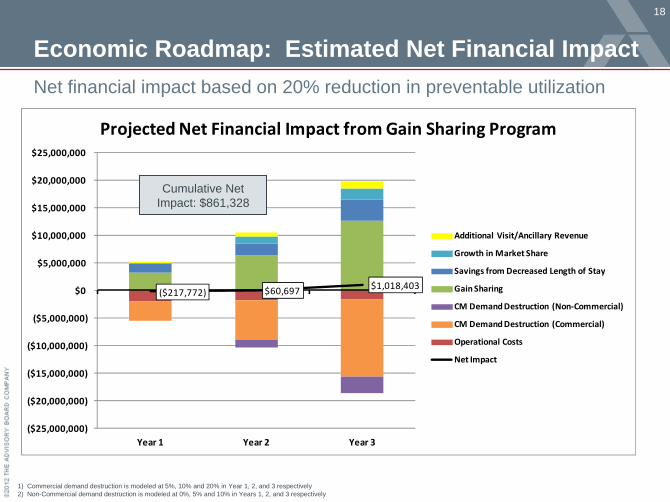
($217,772) $60,697 $1,018,403
($25,000,000)
($20,000,000)
($15,000,000)
($10,000,000)
($5,000,000)
$0
$5,000,000
$10,000,000
$15,000,000
$20,000,000
$25,000,000
Year 1 Year 2 Year 3
Projected Net Financial Impact from Gain Sharing Program
Additional Visit/Ancillary Revenue
Growth in Market Share
Savings from Decreased Length of Stay
Gain Sharing
CM Demand Destruction (Non‐Commercial)
CM Demand Destruction (Commercial)
Operational Costs
Net Impact
Economic Roadmap: Estimated Net Financial ImpactNet financial impact based on 20% reduction in preventable utilization
18
Cumulative Net Impact: $861,328
1) Commercial demand destruction is modeled at 5%, 10% and 20% in Year 1, 2, and 3 respectively2) Non-Commercial demand destruction is modeled at 0%, 5% and 10% in Years 1, 2, and 3 respectively
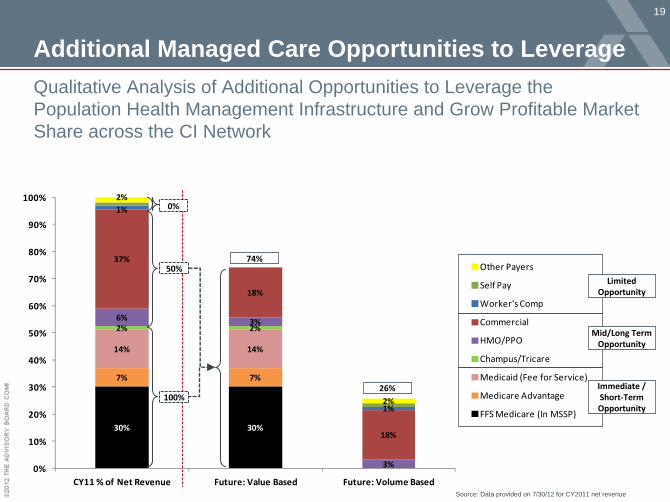
19
30% 30%
7% 7%
14% 14%
2% 2%6% 3%
3%
37%
18%
18%
1%
1%
2%
2%
0%
10%
20%
30%
40%
50%
60%
70%
80%
90%
100%
CY11 % of Net Revenue Future: Value Based Future: Volume Based
Other Payers
Self Pay
Worker's Comp
Commercial
HMO/PPO
Champus/Tricare
Medicaid (Fee for Service)
Medicare Advantage
FFS Medicare (In MSSP)
Additional Managed Care Opportunities to Leverage
74%
26% Immediate / Short‐TermOpportunity
Limited Opportunity
Mid/Long Term
Opportunity
Qualitative Analysis of Additional Opportunities to Leverage the Population Health Management Infrastructure and Grow Profitable Market Share across the CI Network
100%
Source: Data provided on 7/30/12 for CY2011 net revenue
50%
0%
Exam
ples
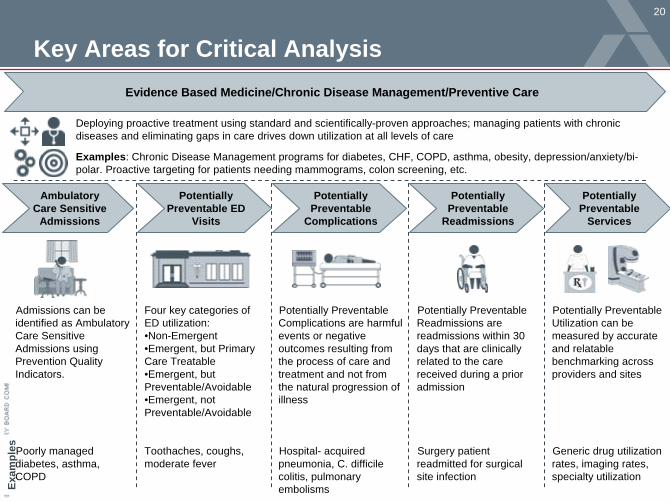
Key Areas for Critical Analysis
20
Potentially Preventable Complications are harmful events or negative outcomes resulting from the process of care and treatment and not from the natural progression of illness
Hospital- acquired pneumonia, C. difficile colitis, pulmonary embolisms
Potentially Preventable Readmissions are readmissions within 30 days that are clinically related to the care received during a prior admission
Surgery patient readmitted for surgical site infection
Admissions can be identified as Ambulatory Care Sensitive Admissions using Prevention Quality Indicators.
Poorly managed diabetes, asthma, COPD
Four key categories of ED utilization:•Non-Emergent•Emergent, but Primary Care Treatable•Emergent, but Preventable/Avoidable•Emergent, not Preventable/Avoidable
Toothaches, coughs, moderate fever
Ambulatory Care Sensitive
Admissions
Potentially Preventable ED
Visits
Potentially Preventable
Readmissions
Potentially Preventable
Complications
Potentially Preventable
Services
Potentially Preventable Utilization can be measured by accurate and relatable benchmarking across providers and sites
Generic drug utilization rates, imaging rates, specialty utilization
Evidence Based Medicine/Chronic Disease Management/Preventive Care
Deploying proactive treatment using standard and scientifically-proven approaches; managing patients with chronic diseases and eliminating gaps in care drives down utilization at all levels of care
Examples: Chronic Disease Management programs for diabetes, CHF, COPD, asthma, obesity, depression/anxiety/bi- polar. Proactive targeting for patients needing mammograms, colon screening, etc.
$‐
$500,000
$1,000,000
$1,500,000
$2,000,000
$2,500,000
$3,000,000
Bacterial Pneumonia CHF COPD Diabetes (Combined) UTI
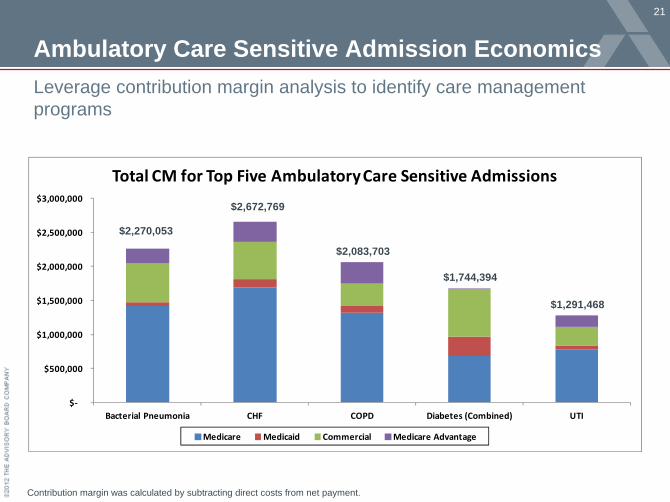
Total CM for Top Five Ambulatory Care Sensitive Admissions
Medicare Medicaid Commercial Medicare Advantage
21
Ambulatory Care Sensitive Admission EconomicsLeverage contribution margin analysis to identify care management programs
Contribution margin was calculated by subtracting direct costs from net payment.
$2,270,053
$2,672,769
$2,083,703
$1,744,394
$1,291,468
22
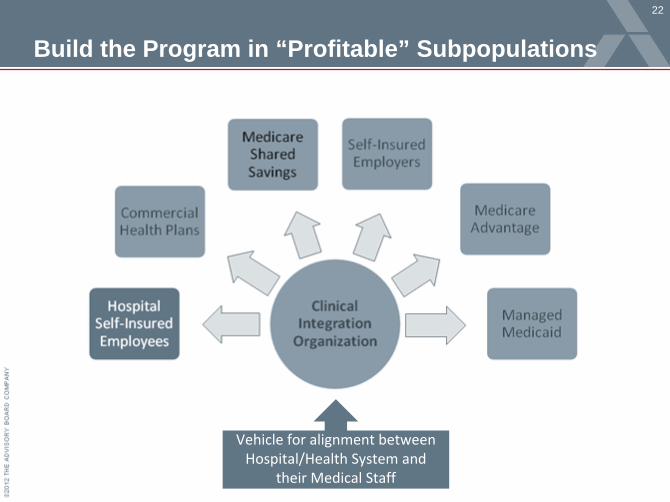
Build the Program in “Profitable” Subpopulations
Vehicle for alignment between
Hospital/Health System and
their Medical Staff

Economically Guided Strategic Roadmap
23
Must develop market ready population health core competencies
Important Next Steps
• Develop economically feasible, clinically targeted Population Health Management capabilities in network, among physicians and management
• Select and Build Population Health Management Tools and Processes within the network and at physician office settings (i.e. EHR; Disease Registry; Risk Stratification; Claims Business Intelligence; Care Managers; Referral Management; Health Information Exchange; Quality; Data Collection and Reporting)
• Operationalize evidence based standards with protocols to address quality and cost opportunities (LOS reductions, improvement on focused quality initiatives, care management protocols.)
• Implement referral management tools to reduce network leakage and capture market share.
• Need network administrative resources to build out network and provide service bureau functions (i.e. IT support, deployment of care plans)
• Build collaboration with recently constructed physician network.
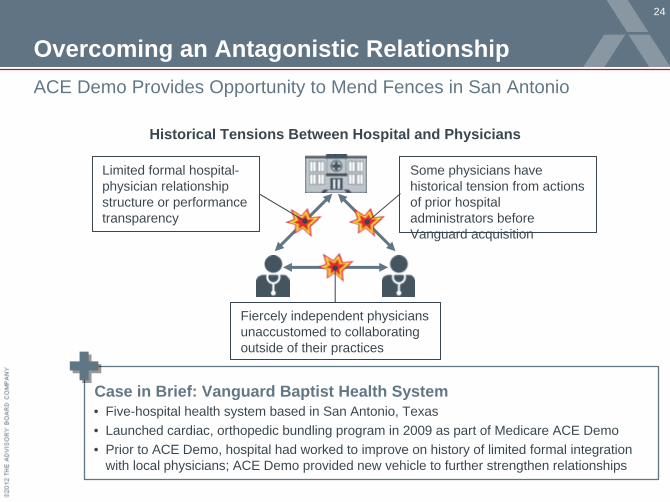
Overcoming an Antagonistic Relationship
24
ACE Demo Provides Opportunity to Mend Fences in San Antonio
Historical Tensions Between Hospital and Physicians
Some physicians have historical tension from actions of prior hospital administrators before Vanguard acquisition
Limited formal hospital- physician relationship structure or performance transparency
Fiercely independent physicians unaccustomed to collaborating outside of their practices
Case in Brief: Vanguard Baptist Health System• Five-hospital health system based in San Antonio, Texas• Launched cardiac, orthopedic bundling program in 2009 as part of Medicare ACE Demo• Prior to ACE Demo, hospital had worked to improve on history of limited formal integration
with local physicians; ACE Demo provided new vehicle to further strengthen relationships
25
Opening the Books for Partner Physicians“Trust evolves over time; you have to prove it along the way. The more openness, cohesiveness and open communication that we have as this project evolves, the more it creates relationships [with orthopedic surgeons] that are tight, because we are both winning.”
Chief Development Officer and SVPVanguard Baptist Health System
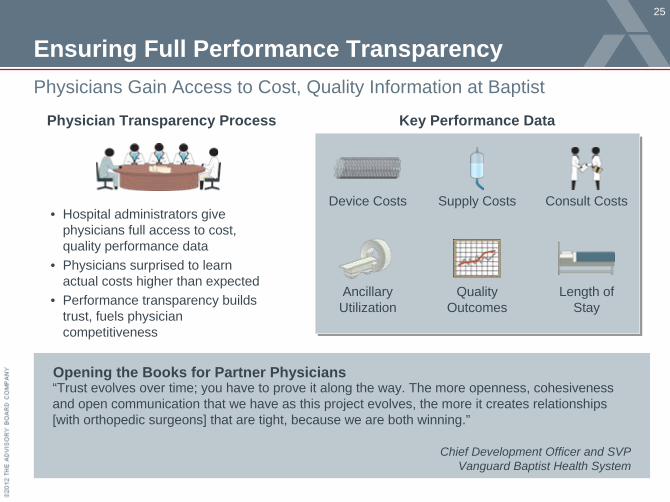
Ensuring Full Performance TransparencyPhysicians Gain Access to Cost, Quality Information at Baptist
Physician Transparency Process
• Hospital administrators give physicians full access to cost, quality performance data
• Physicians surprised to learn actual costs higher than expected
• Performance transparency builds trust, fuels physician competitiveness
Key Performance Data
Quality Outcomes
Ancillary Utilization
Length of Stay
Supply CostsDevice Costs Consult Costs
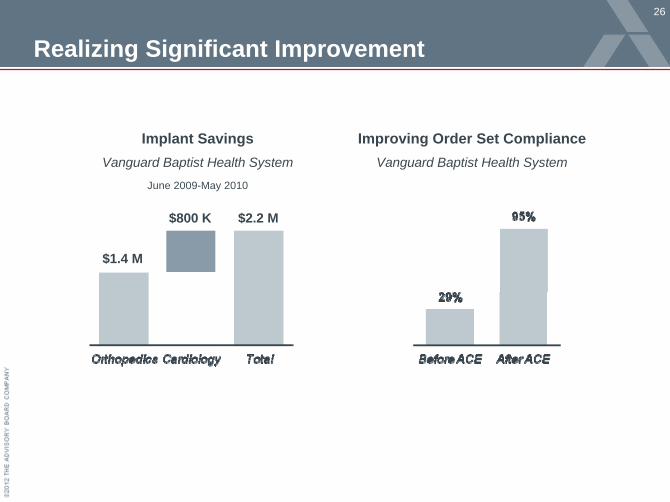
26
June 2009-May 2010
Implant SavingsVanguard Baptist Health System
Improving Order Set ComplianceVanguard Baptist Health System
Realizing Significant Improvement
$1.4 M
$800 K $2.2 M
27
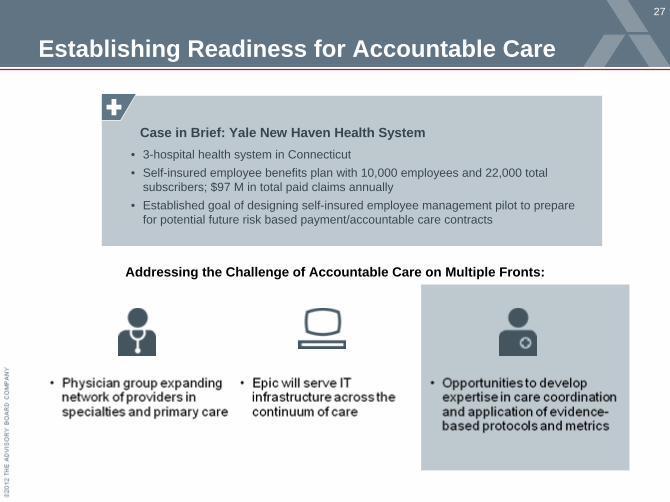
Establishing Readiness for Accountable Care
Addressing the Challenge of Accountable Care on Multiple Fronts:
Case in Brief: Yale New Haven Health System• 3-hospital health system in Connecticut • Self-insured employee benefits plan with 10,000 employees and 22,000 total
subscribers; $97 M in total paid claims annually• Established goal of designing self-insured employee management pilot to prepare
for potential future risk based payment/accountable care contracts
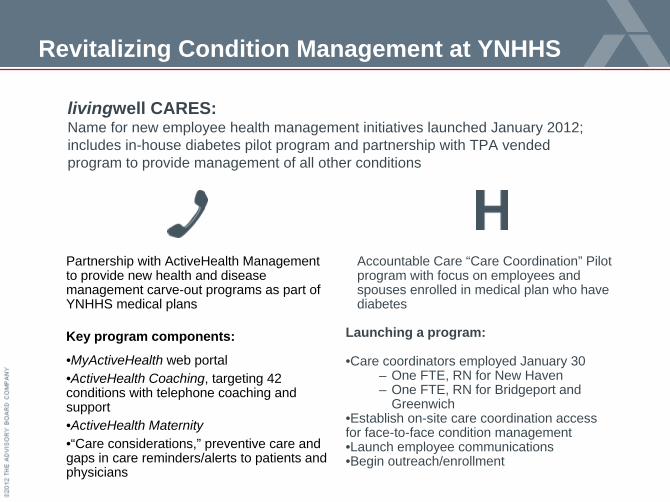
Revitalizing Condition Management at YNHHS
Partnership with ActiveHealth Management to provide new health and disease management carve-out programs as part of YNHHS medical plans
livingwell CARES: Name for new employee health management initiatives launched January 2012; includes in-house diabetes pilot program and partnership with TPA vended program to provide management of all other conditions
Accountable Care “Care Coordination” Pilot program with focus on employees and spouses enrolled in medical plan who have diabetes
Key program components:
•MyActiveHealth web portal•ActiveHealth Coaching, targeting 42 conditions with telephone coaching and support•ActiveHealth Maternity•“Care considerations,” preventive care and gaps in care reminders/alerts to patients and physicians
Launching a program:
•Care coordinators employed January 30– One FTE, RN for New Haven– One FTE, RN for Bridgeport and
Greenwich•Establish on-site care coordination access for face-to-face condition management•Launch employee communications•Begin outreach/enrollment
29
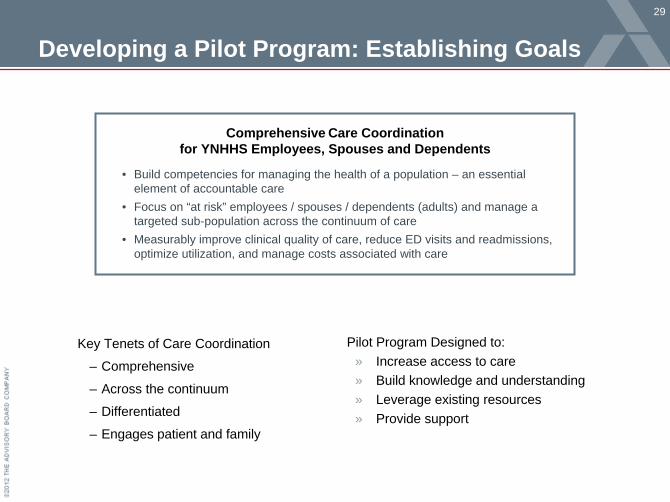
Developing a Pilot Program: Establishing Goals
Comprehensive Care Coordination for YNHHS Employees, Spouses and Dependents
• Build competencies for managing the health of a population – an essential element of accountable care
• Focus on “at risk” employees / spouses / dependents (adults) and manage a targeted sub-population across the continuum of care
• Measurably improve clinical quality of care, reduce ED visits and readmissions, optimize utilization, and manage costs associated with care
Key Tenets of Care Coordination
– Comprehensive
– Across the continuum
– Differentiated
– Engages patient and family
Pilot Program Designed to:» Increase access to care» Build knowledge and understanding» Leverage existing resources» Provide support
30
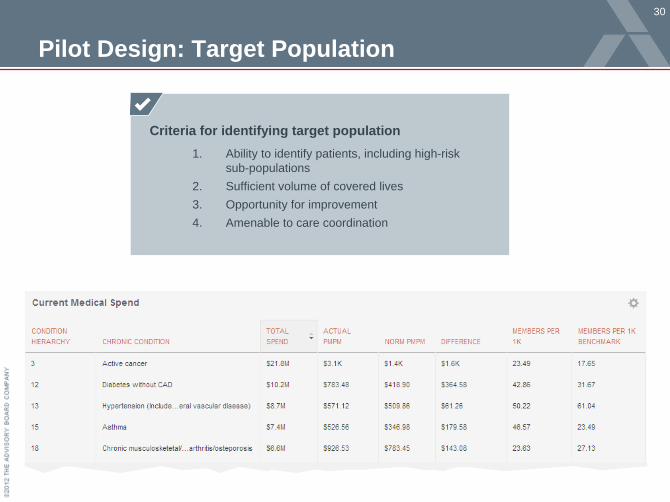
Pilot Design: Target Population
Criteria for identifying target population1. Ability to identify patients, including high-risk
sub-populations2. Sufficient volume of covered lives3. Opportunity for improvement4. Amenable to care coordination
31
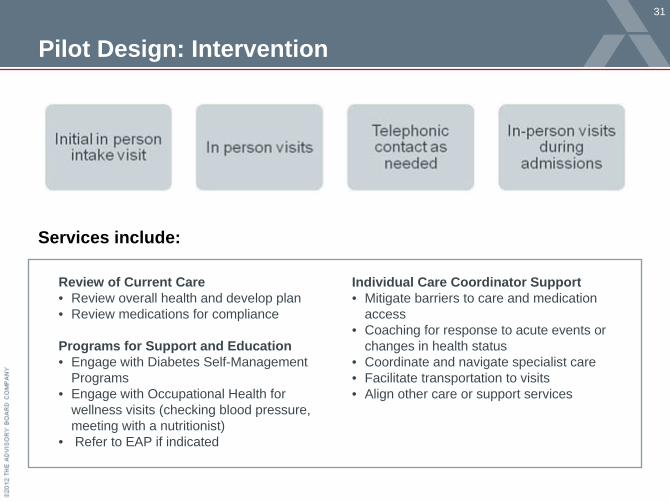
Pilot Design: Intervention
Review of Current Care• Review overall health and develop plan• Review medications for compliance
Programs for Support and Education• Engage with Diabetes Self-Management
Programs• Engage with Occupational Health for
wellness visits (checking blood pressure, meeting with a nutritionist)
• Refer to EAP if indicated
Individual Care Coordinator Support• Mitigate barriers to care and medication
access• Coaching for response to acute events or
changes in health status• Coordinate and navigate specialist care• Facilitate transportation to visits• Align other care or support services
Services include:
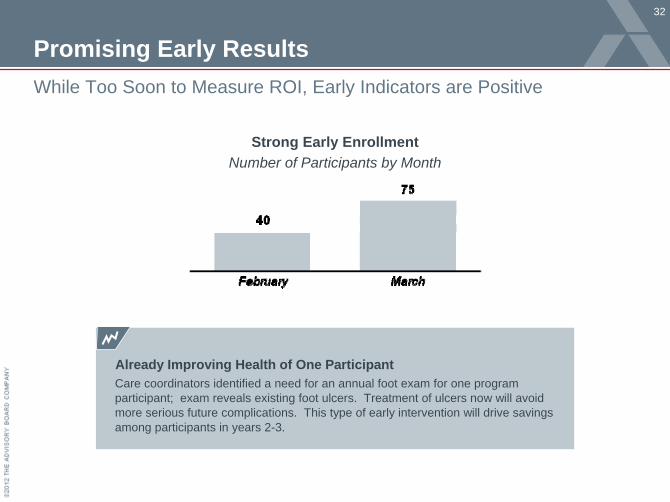
Promising Early Results
32
While Too Soon to Measure ROI, Early Indicators are Positive
Strong Early EnrollmentNumber of Participants by Month
Already Improving Health of One ParticipantCare coordinators identified a need for an annual foot exam for one program participant; exam reveals existing foot ulcers. Treatment of ulcers now will avoid more serious future complications. This type of early intervention will drive savings among participants in years 2-3.
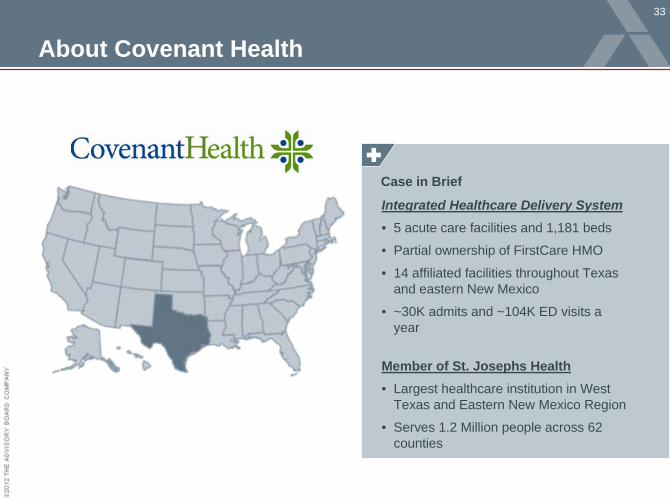
About Covenant Health
33
Case in Brief
Integrated Healthcare Delivery System• 5 acute care facilities and 1,181 beds
• Partial ownership of FirstCare HMO
• 14 affiliated facilities throughout Texas and eastern New Mexico
• ~30K admits and ~104K ED visits a year
Member of St. Josephs Health• Largest healthcare institution in West
Texas and Eastern New Mexico Region
• Serves 1.2 Million people across 62 counties
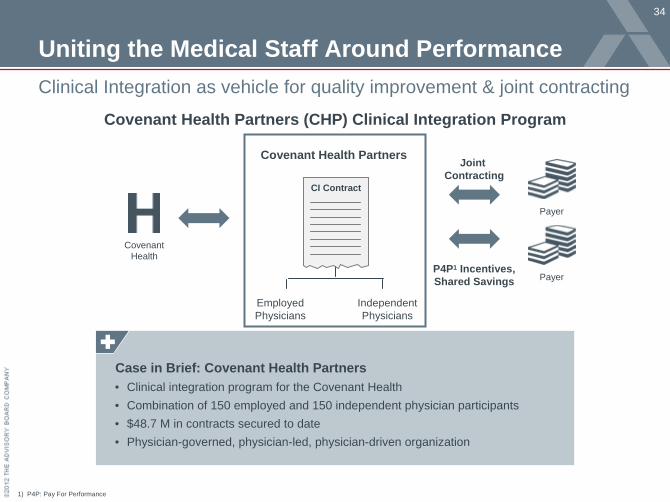
Uniting the Medical Staff Around Performance
34
Clinical Integration as vehicle for quality improvement & joint contracting
1) P4P: Pay For Performance
Covenant Health Partners (CHP) Clinical Integration Program
Case in Brief: Covenant Health Partners• Clinical integration program for the Covenant Health• Combination of 150 employed and 150 independent physician participants• $48.7 M in contracts secured to date• Physician-governed, physician-led, physician-driven organization
Payer
Payer
CI Contract
Employed Physicians
Independent Physicians
Covenant Health
Covenant Health Partners Joint Contracting
P4P1 Incentives,Shared Savings
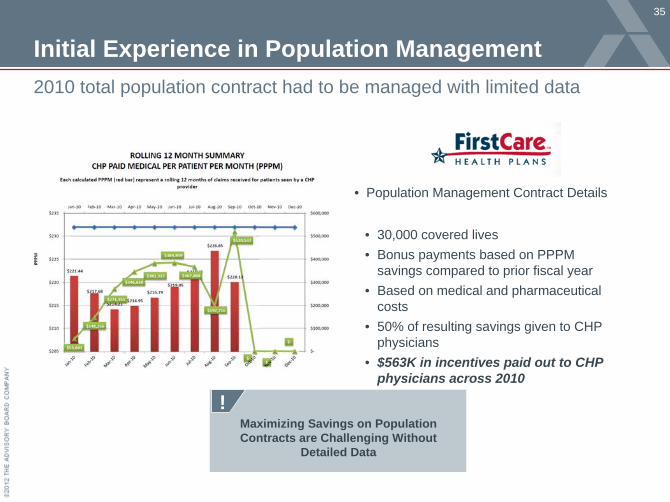
Initial Experience in Population Management
35
2010 total population contract had to be managed with limited data
• Population Management Contract Details
Maximizing Savings on Population Contracts are Challenging Without
Detailed Data
!
• 30,000 covered lives• Bonus payments based on PPPM
savings compared to prior fiscal year• Based on medical and pharmaceutical
costs• 50% of resulting savings given to CHP
physicians• $563K in incentives paid out to CHP
physicians across 2010
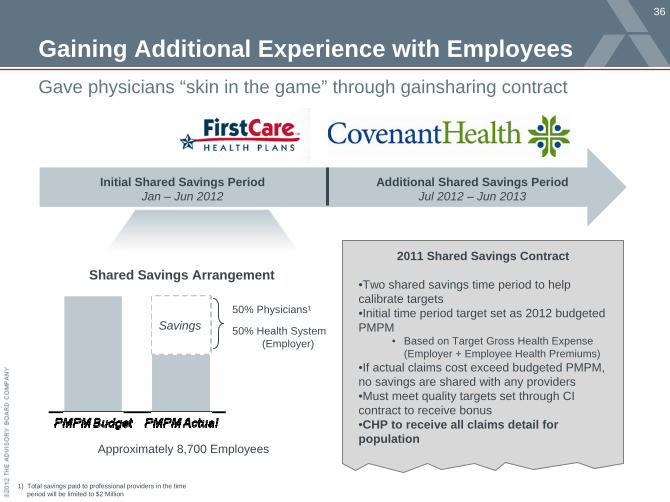
Gaining Additional Experience with Employees
36
Gave physicians “skin in the game” through gainsharing contract
1) Total savings paid to professional providers in the time period will be limited to $2 Million
Initial Shared Savings PeriodJan – Jun 2012
Additional Shared Savings PeriodJul 2012 – Jun 2013
Savings50% Physicians1
50% Health System (Employer)
2011 Shared Savings Contract
•Two shared savings time period to help calibrate targets•Initial time period target set as 2012 budgeted PMPM
• Based on Target Gross Health Expense (Employer + Employee Health Premiums)
•If actual claims cost exceed budgeted PMPM, no savings are shared with any providers•Must meet quality targets set through CI contract to receive bonus•CHP to receive all claims detail for population
Shared Savings Arrangement
Approximately 8,700 Employees
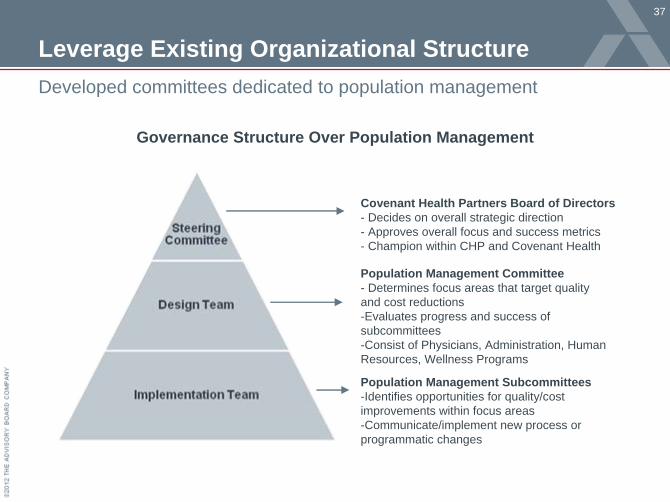
Leverage Existing Organizational Structure
37
Developed committees dedicated to population management
Governance Structure Over Population Management
Covenant Health Partners Board of Directors- Decides on overall strategic direction- Approves overall focus and success metrics- Champion within CHP and Covenant Health
Population Management Committee- Determines focus areas that target quality and cost reductions-Evaluates progress and success of subcommittees -Consist of Physicians, Administration, Human Resources, Wellness Programs
Population Management Subcommittees-Identifies opportunities for quality/cost improvements within focus areas-Communicate/implement new process or programmatic changes
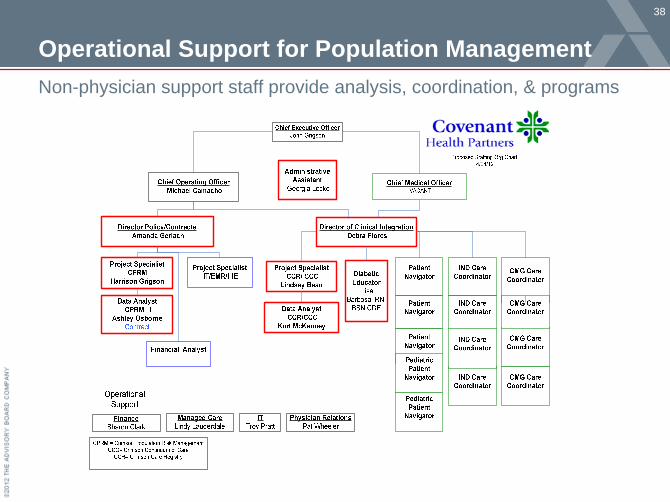
Operational Support for Population Management
38
Non-physician support staff provide analysis, coordination, & programs
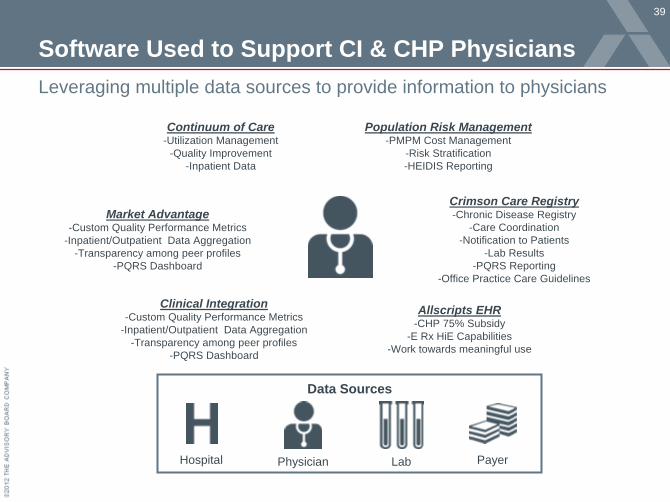
Software Used to Support CI & CHP Physicians
39
Leveraging multiple data sources to provide information to physicians
Continuum of Care-Utilization Management
-Quality Improvement-Inpatient Data
Population Risk Management-PMPM Cost Management
-Risk Stratification-HEIDIS Reporting
Crimson Care Registry-Chronic Disease Registry
-Care Coordination-Notification to Patients
-Lab Results-PQRS Reporting
-Office Practice Care Guidelines
Allscripts EHR-CHP 75% Subsidy
-E Rx HiE Capabilities-Work towards meaningful use
Clinical Integration-Custom Quality Performance Metrics
-Inpatient/Outpatient Data Aggregation-Transparency among peer profiles
-PQRS Dashboard
Market Advantage-Custom Quality Performance Metrics
-Inpatient/Outpatient Data Aggregation-Transparency among peer profiles
-PQRS Dashboard
Data Sources
PayerPhysicianHospital Lab
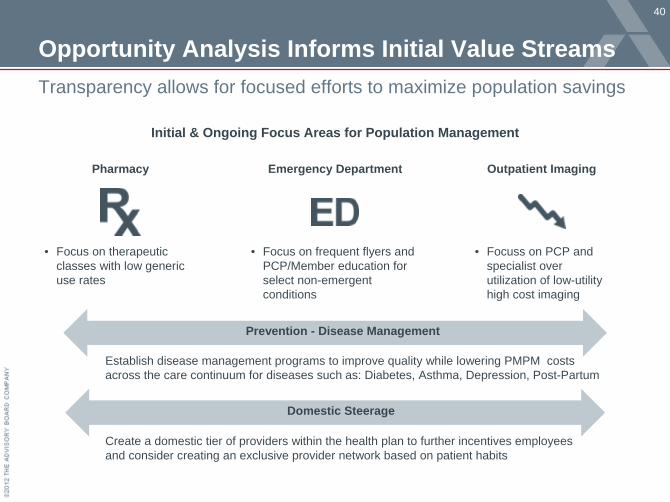
Opportunity Analysis Informs Initial Value Streams
40
Transparency allows for focused efforts to maximize population savings
• Focus on therapeutic classes with low generic use rates
Pharmacy
• Focus on frequent flyers and PCP/Member education for select non-emergent conditions
• Focuss on PCP and specialist over utilization of low-utility high cost imaging
Emergency Department Outpatient Imaging
Prevention - Disease Management
Domestic Steerage
Initial & Ongoing Focus Areas for Population Management
Establish disease management programs to improve quality while lowering PMPM costs across the care continuum for diseases such as: Diabetes, Asthma, Depression, Post-Partum
Create a domestic tier of providers within the health plan to further incentives employees and consider creating an exclusive provider network based on patient habits
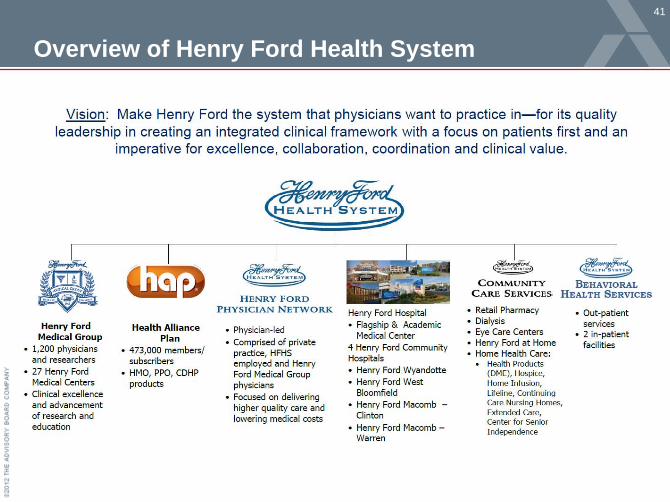
Overview of Henry Ford Health System
41
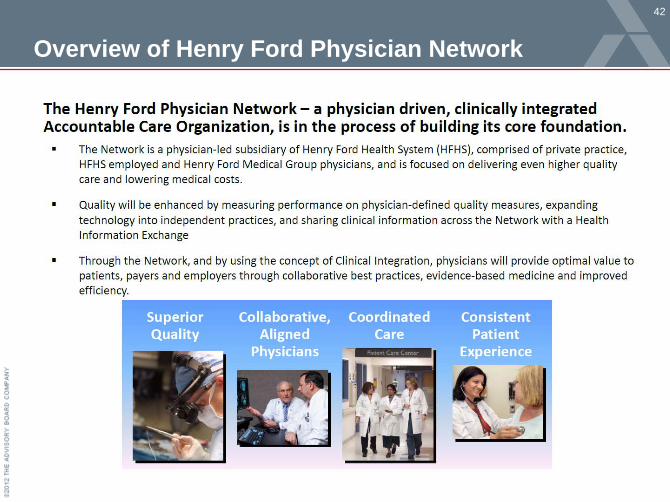
Overview of Henry Ford Physician Network
42
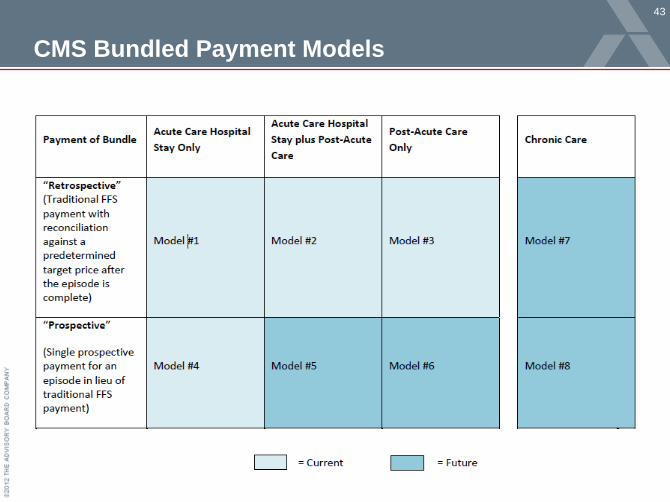
CMS Bundled Payment Models
43
Determining Criteria for Bundle Selection
44
Quantitative Criteria
• High volume of cases across system and within individual facilities; initially targeting DRGs with at least 100 cases across system hospitals
• Low to moderate variation in the cost of the bundle so have relative predictability
• Concentration of services and costs within Henry Ford facilities to ensure controllability
Qualitative Criteria
• Engaged and willing group of specialists and clinicians providing care for the identified DRGs
• Belief among physicians and clinicians that identified DRGs have opportunity for care standardization and improvement
• Areas with existing or planned performance improvement projects
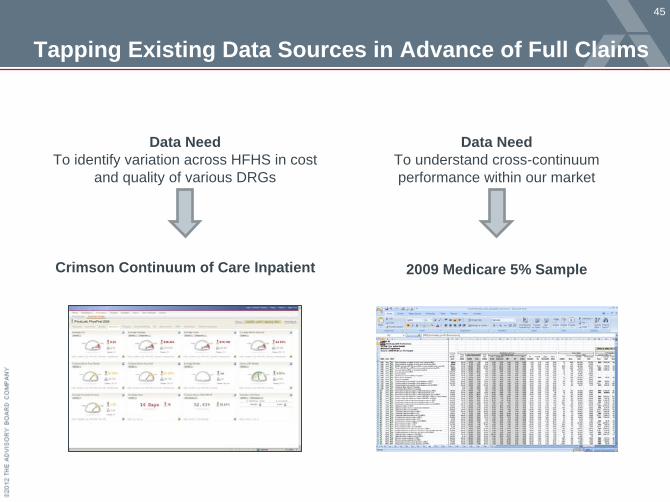
Tapping Existing Data Sources in Advance of Full Claims
45
Data NeedTo identify variation across HFHS in cost
and quality of various DRGs
Data Need To understand cross-continuum performance within our market
Crimson Continuum of Care Inpatient 2009 Medicare 5% Sample
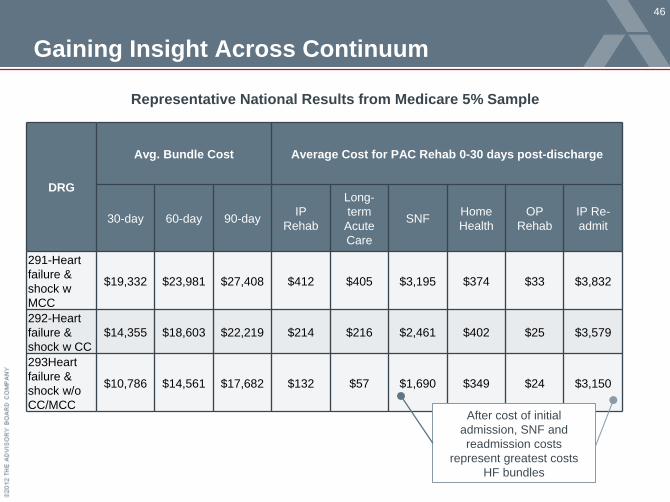
Gaining Insight Across Continuum
46
Representative National Results from Medicare 5% Sample
DRG
Avg. Bundle Cost Average Cost for PAC Rehab 0-30 days post-discharge
30-day 60-day 90-day IP Rehab
Long- term
Acute Care
SNF Home Health
OP Rehab
IP Re- admit
291-Heart failure & shock w MCC
$19,332 $23,981 $27,408 $412 $405 $3,195 $374 $33 $3,832
292-Heart failure & shock w CC
$14,355 $18,603 $22,219 $214 $216 $2,461 $402 $25 $3,579
293Heart failure & shock w/o CC/MCC
$10,786 $14,561 $17,682 $132 $57 $1,690 $349 $24 $3,150
After cost of initial admission, SNF and readmission costs
represent greatest costs HF bundles
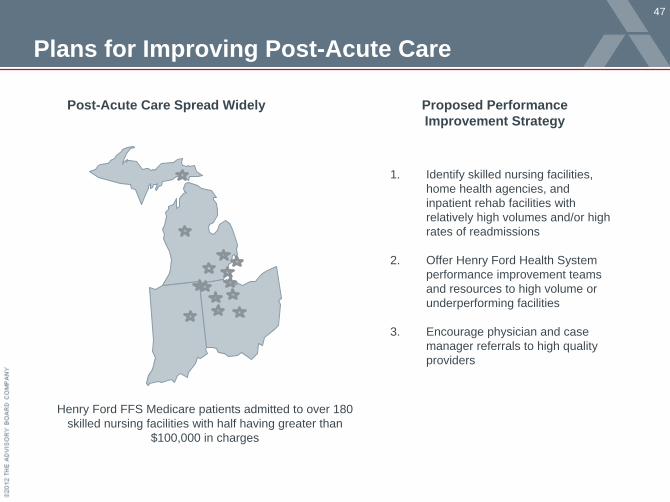
Plans for Improving Post-Acute Care
47
Post-Acute Care Spread Widely
Henry Ford FFS Medicare patients admitted to over 180 skilled nursing facilities with half having greater than
$100,000 in charges
Proposed Performance Improvement Strategy
1. Identify skilled nursing facilities, home health agencies, and inpatient rehab facilities with relatively high volumes and/or high rates of readmissions
2. Offer Henry Ford Health System performance improvement teams and resources to high volume or underperforming facilities
3. Encourage physician and case manager referrals to high quality providers
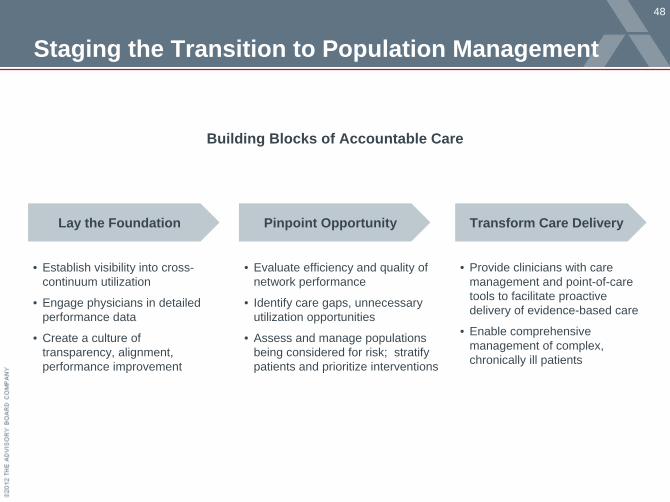
Staging the Transition to Population Management
48
• Establish visibility into cross- continuum utilization
• Engage physicians in detailed performance data
• Create a culture of transparency, alignment, performance improvement
• Evaluate efficiency and quality of network performance
• Identify care gaps, unnecessary utilization opportunities
• Assess and manage populations being considered for risk; stratify patients and prioritize interventions
• Provide clinicians with care management and point-of-care tools to facilitate proactive delivery of evidence-based care
• Enable comprehensive management of complex, chronically ill patients
Pinpoint Opportunity Transform Care DeliveryLay the Foundation
Building Blocks of Accountable Care
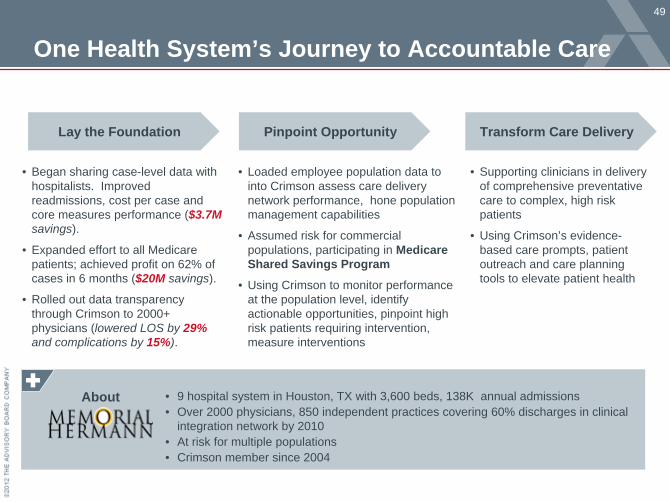
One Health System’s Journey to Accountable Care
49
Pinpoint Opportunity Transform Care DeliveryLay the Foundation
• Began sharing case-level data with hospitalists. Improved readmissions, cost per case and core measures performance ($3.7M savings).
• Expanded effort to all Medicare patients; achieved profit on 62% of cases in 6 months ($20M savings).
• Rolled out data transparency through Crimson to 2000+ physicians (lowered LOS by 29% and complications by 15%).
• Loaded employee population data to into Crimson assess care delivery network performance, hone population management capabilities
• Assumed risk for commercial populations, participating in Medicare Shared Savings Program
• Using Crimson to monitor performance at the population level, identify actionable opportunities, pinpoint high risk patients requiring intervention, measure interventions
• Supporting clinicians in delivery of comprehensive preventative care to complex, high risk patients
• Using Crimson’s evidence- based care prompts, patient outreach and care planning tools to elevate patient health
• 9 hospital system in Houston, TX with 3,600 beds, 138K annual admissions• Over 2000 physicians, 850 independent practices covering 60% discharges in clinical
integration network by 2010• At risk for multiple populations• Crimson member since 2004
About
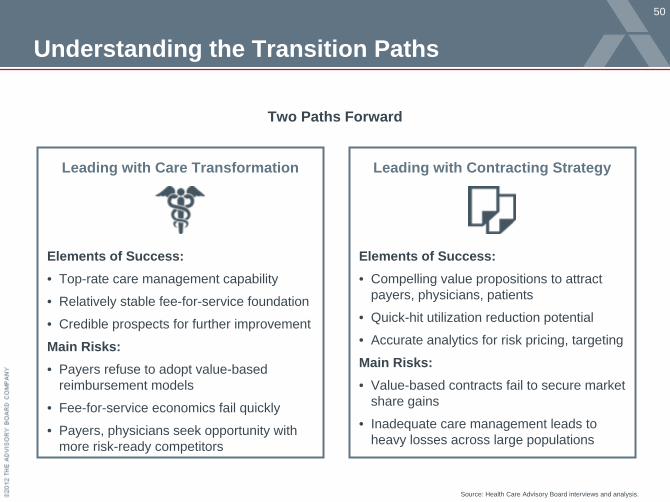
Understanding the Transition Paths
50
Source: Health Care Advisory Board interviews and analysis.
Leading with Care Transformation
Elements of Success:• Top-rate care management capability
• Relatively stable fee-for-service foundation
• Credible prospects for further improvement
Main Risks:• Payers refuse to adopt value-based
reimbursement models
• Fee-for-service economics fail quickly
• Payers, physicians seek opportunity with more risk-ready competitors
Leading with Contracting Strategy
Elements of Success:• Compelling value propositions to attract
payers, physicians, patients
• Quick-hit utilization reduction potential
• Accurate analytics for risk pricing, targeting
Main Risks:• Value-based contracts fail to secure market
share gains
• Inadequate care management leads to heavy losses across large populations
Two Paths Forward
Purpose Beyond Commerce
51
Regardless of Margin, Mission at the Fore
Source: Photo available at: http://en.wikipedia.org/wiki/File:McMasterUMedical.jpg, accessed May 4, 2011; Health Care Advisory Board interviews and analysis.
A Return to Mission
Credit: Rick Cordeiro
• Putting patients and families first in identifying a care plan to achieve individual goals, high-quality outcomes
• Offering high-value care for patients including quality and service
• Building long-term relationships with providers and patients to offer an ongoing, coordinated care experience
• Pillar of community as employer, community stakeholder and partner in improving the overall health and wellness of the population
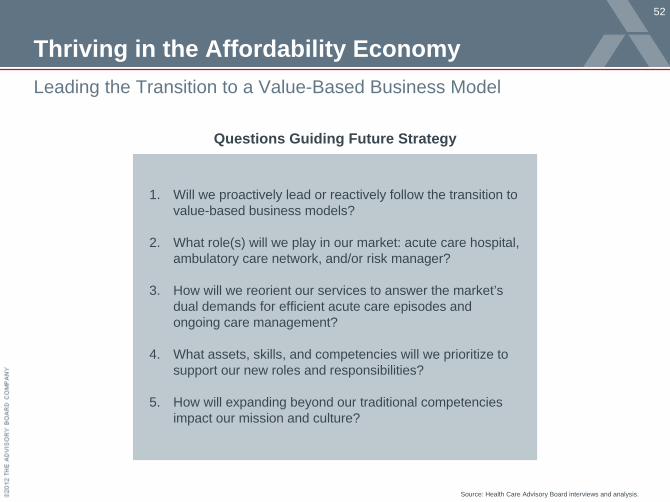
Thriving in the Affordability Economy
52
Leading the Transition to a Value-Based Business Model
Source: Health Care Advisory Board interviews and analysis.
Questions Guiding Future Strategy
1. Will we proactively lead or reactively follow the transition to value-based business models?
2. What role(s) will we play in our market: acute care hospital, ambulatory care network, and/or risk manager?
3. How will we reorient our services to answer the market’s dual demands for efficient acute care episodes and ongoing care management?
4. What assets, skills, and competencies will we prioritize to support our new roles and responsibilities?
5. How will expanding beyond our traditional competencies impact our mission and culture?

2445 M Street NW I Washington DC 20037P 202.266.5600 I F 202.266.5700 advisory.com