
Ana Laura Evangelista RA 0 72776 Gustavo C Macedo RA 071081.

Social EnterprisesKnowledgeable Economiesand Sustainable Communities
Economic Impact of Credit Unionson Rural Communities
Fortunate Mavenga
A thesis prepared under the auspices of the Northern Ontario, Manitoba,and Saskatchewan Regional Node of the Social Economy Suite
Funded by the Social Sciences and Humanities Research Council of CanadaConseil de recherches en sciences humaines du Canada
Entreprises socialeséconomies intelligentes
et communautés durables

ECONOMIC IMPACT OF CREDIT UNIONS ON RURAL
COMMUNITIES
A Thesis
Submitted to the College of Graduate Studies and Research
In Partial Fulfillment of the Requirements
For the Degree of Master of Science
In the Department of Bioresource Policy, Business and Economics
University of Saskatchewan
By
Fortunate Mavenga
© Fortunate Mavenga, May 2010. All Rights Reserved

ii
Permission to Use
The author has agreed that the University of Saskatchewan and its library may make this
thesis available for inspection. The author has also agreed that permission for extensive copying
of this thesis for scholarly work purposes may be granted by the professor or professors who
supervised the thesis work or, in their absence, the Head of the Department or Dean of the
college in which the thesis was done. It is understood that due recognition will be given to the
author of this thesis and the University of Saskatchewan in any use of the material in this thesis.
Copying or publication or any other use for financial gain without the author’s written
permission is prohibited.
Requests for permission to copy or make other use of the material in this thesis in whole or in
part should be addressed to:
Department Head
Department of Bioresource Policy, Business and Economics
University of Saskatchewan
SK S7N 5A8
Canada
This thesis is part of a collection of research materials prepared for the projectLinking, Learning, Leveraging
Social Enterprises, Knowledgeable Economies, and Sustainable Communities,the Northern Ontario, Manitoba, and Saskatchewan
Regional Node of the Social Economy Suite,funded by the Social Sciences and Humanities Research Council of Canada.
The project is managed by four regional partners —the Centre for the Study of Co-operatives and the Community-University
Institute for Social Research at the University of Saskatchewan,inititally the Winnipeg Inner-City Research Alliance
and currently the Institute of Urban Studies at the University of Winnipeg,and the Community Economic and Social Development Unit
at Algoma University College.
The project also includes more than fifty community-based organizationsin four provinces, the United States, Colombia, and Belgium.
This thesis was supervised by M. Rose Olfert,Department of Bioresource Policy, Business and Economics, University of Saskatchewan.
It is reproduced with the permission of Jill Hobbs,head, Department of Bioresource Policy, Business and Economics.The opinions of the author found herein do not necessarily reflect
those of the Centre, the Department of Bioresource Policy, Business and Economics,the Linking, Learning, Leveraging project,
or the Social Sciences and Humanities Research Council of Canada.


v
Abstract
Economic Impact of credit unions on rural communities
Supervisor: Professor M. Rose Olfert
The study contributes to the growing literature on the role of social economy enterprises on
rural vitality, by examining the relationship between credit union activity and community
population growth in rural Canada. A preliminary qualitative inquiry indicated that while most of
the business policies and practices of a chartered bank and a credit union are similar, a credit
union, in addition, extended non-traditional lending to their clients in the form of micro-lending
and also participated actively in community development lending. Following the preliminary
qualitative investigation, the impact of credit unions was examined using spatial regressions
models in seven provinces in Canada using data at Consolidated Census Subdivisions (CCSs)
level to represent communities. Motivated by the potential role of credit unions as community
based financial institutions, the quantitative analysis modeled credit unions as potentially
reducing transactions costs for local businesses.
Regression results indicated that the presence of credit unions was statistically significant and
positive in our most parsimonious models including only natural amenity factors, agglomeration
measures and other social measures as explanatory variables. However, in the full model with
economic variables added the credit union dummy lost its statistical significance. A possible
interpretation is that the credit union dummy is an inadequate representation of credit union
activity. More complete, high quality, quantitative data to reflect their activities in the
community may have produced different results.
Recent credit union mergers are designed to increase their capacity and efficiency in
providing services to their members. However, these new trends could aggravate the principal-

vi
agent problems. As credit unions become more ‘bank-like’ though mergers, individual branches
may lose their links with their local communities and their ability to perform their traditional
functions.

vii
Acknowledgements
I would like to express the sincerest gratitude to my supervisor, M.Rose Olfert, who has
supported me throughout my thesis with her patience and knowledge whilst allowing me the
room to work in my own way. I attribute the level of my Masters degree to her encouragement,
availability, and effort and without her this thesis would not have been completed or written.
Murray Fulton and Lou Hammond Ketilson deserve special thanks as my thesis committee
members and advisors for their guidance and suggestions.
I wish to thank the respondents of the interviews (who remain anonymous for confidentiality
purposes). Their comments and insights created an informative and interesting project. In
addition, a thank you to Mike St. Louis, who helped me with Geographical Information System
(GIS), and Geo-coded the credit union data.
Lastly my deepest gratitude goes to my family and friends for their unflagging love and
support throughout my life. I am indebted to my Husband, Taurai, for his care and love.


ix
Table of Contents
Permission to Use ................................................................................................ i
Abstract ............................................................................................................... ii
Acknowledgements ........................................................................................... iv
Table of Contents ................................................................................................ v
List of Tables ..................................................................................................... ix
List of Figures ...................................................................................................... x
Chapter 1: Introduction ..................................................................................... 1
1.0 Introduction ................................................................................................................... 1
1.1 Purpose and Objectives ................................................................................................ 4
1.2 Hypothesis ...................................................................................................................... 4
1.3 Expected Contribution and Justification of the Study .............................................. 5
1.4 Historical Development of Credit Unions ................................................................... 6
1.4.1 Historical Overview of the Credit Union Development ........................................... 7
1.4.2 Emergence of Credit Unions in Canada .................................................................. 9
1.4.3 Credit Union Structure in Canada ......................................................................... 10
1.4.4 Recent Developments ............................................................................................. 12
1. 5 Organization of the Thesis ........................................................................................ 13
Chapter 2: Background and Motivation ........................................................14
2.0 Introduction ................................................................................................................. 14
2.1 Background Information............................................................................................ 14
2.2 Quality Control of Interview Information ................................................................ 15
2.3 Structural Differences between Banks and Credit Unions ..................................... 17
2.3.1 Operation and Regulation of Chartered Banks ..................................................... 17
2.3.2 Operation and Regulation of Credit Unions in Saskatchewan .............................. 18
2.4 Differences and Similarities between Credit Union and Chartered Bank ............ 19
2.4.1 Nature of the Rural Client Base ............................................................................. 21

x
2.4.2 Lending Portfolios ................................................................................................. 21
2.4.3 Small Business Support .......................................................................................... 23
2.4.4 Lending Process and Defaults Rates ..................................................................... 24
2.4.5 Relationship between Deposits, Lending and Investments .................................... 25
2.4.6 Other Forms of Community Support ...................................................................... 26
2.5 Conclusion ................................................................................................................... 26
Chapter 3: Literature Review ..........................................................................28
3.0 Introduction ................................................................................................................. 28
3.1 Historical Overview of Canadian Rural Development ............................................ 28
3.2 Rural Development Challenges ................................................................................. 31
3.2.1 The Effect of Agglomeration Economies ................................................................ 32
3.2.2 Effects of Spatial Location Advantages ................................................................. 33
3.2.3 Decline of Natural Resource Base and Global Changes ....................................... 34
3.2.4 Decreasing Rural Political Influence .................................................................... 35
3.3 Rural Development Policies and Approaches: Overview ........................................ 36
3.3.1 Place Based Policies .............................................................................................. 37
3.3.1.1 Natural Resources as Amenities ..................................................................... 39
3.3.1.2 Rural- Urban Linkages Approach ................................................................... 40
3.3.2 People Based Policies ............................................................................................ 42
3.4 Local Development Approach to Rural Development ............................................. 43
3.5 Credit Unions and Local Development ..................................................................... 45
3.6 Conclusion ................................................................................................................... 47
Chapter 4: Theoretical Framework ................................................................48
4.0 Introduction ................................................................................................................. 48
4.1 Theoretical Framework .............................................................................................. 48
4.1.1 Household Location Decisions .............................................................................. 49
4.1.2 Firm Location Decisions ........................................................................................ 51
4.1.3 Equilibrium ............................................................................................................ 53

xi
4.2 The General Equilibrium Involving Credit Unions ................................................. 54
4.3 Application of the General Equilibrium Model ....................................................... 55
4.4 Summary ...................................................................................................................... 57
Chapter 5: Empirical Implementation ...........................................................59
5.0 Introduction ................................................................................................................. 59
5.1 Implementation ........................................................................................................... 59
5.1.1 Empirical specification .......................................................................................... 60
5.1.2 Data Sources .......................................................................................................... 67
5.1.3 Estimation .............................................................................................................. 68
5.1.4 Potential Econometric Problems ........................................................................... 69
5.2 Conclusion ................................................................................................................... 71
Chapter 6: Results and discussion ...................................................................72
6.0 Introduction ................................................................................................................. 72
6.1 Descriptive Statistics ................................................................................................... 72
6.2 Regression Results ...................................................................................................... 79
6.2.1 Parsimonious Model (Model 1) ............................................................................. 79
6.2.2 Model 2 .................................................................................................................. 83
6.2.3 Model 3 and the Full Model ................................................................................... 86
6.3 Post Estimation Results .............................................................................................. 90
6.4 Other Sensitivity Checks ............................................................................................ 92
6.5 Hypothesis Testing ...................................................................................................... 93
6.6 Conclusions .................................................................................................................. 94
Chapter 7: Conclusions ....................................................................................95
7.0 Introduction ................................................................................................................. 95
7.1 Summary of Study Findings and Implications ......................................................... 95
7.1.1 Qualitative inquiry ................................................................................................. 95
7.1.2 Regression results .................................................................................................. 97

xii
7.1.2.1 Regulatory Framework ................................................................................... 98
7.1.2.2 The Cost Limitation ........................................................................................ 99
7.1.2.3 Effect of Credit Union Mergers and Globalization ....................................... 100
7.1.2.4 Potential Principal-Agent Problem ............................................................... 100
7.2 Limitations of the Study ........................................................................................... 102
7.3 Areas of Further Study ............................................................................................. 103
References ........................................................................................................104
Appendix A: Semi-structured Interview Guide ...........................................111
Appendix B: Interview Consent Form ..........................................................112
Appendix C: Variable Definitions and Data Sources ..................................116

xiii
List of Tables
TABLE 2.1: CREDIT UNIONS SELECTED RESTRICTIONS ................................................................................................ 19
TABLE 2.2: STRUCTURED INTERVIEW RESULTS ............................................................................................................ 20
TABLE 6.1: DESCRIPTIVE STATISTICS ........................................................................................................................... 76
TABLE 6.2: 1996-2006 POPULATION CHANGE RESULTS ............................................................................................... 80
TABLE 6.3: 1996-2006 POPULATION CHANGE GROUPED F-STATISTICS RESULTS ........................................................ 81
TABLE 6.4: VIF AND TOLERANCE FOR SELECTED VARIABLES ..................................................................................... 92

iv
List of Figures
FIGURE 4.1: THE GENERAL EQUILIBRIUM MODEL FOR VARYING LEVELS OF CREDIT UNION ACTIVITY ...................... 55
FIGURE 4.2: GENERAL EQUILIBRIUM MODEL APPLICATION TO LABOR MARKET ......................................................... 56
FIGURE 6.1: DISTRIBUTION OF CREDIT UNIONS IN RURAL CANADA BY PROVINCE ...................................................... 73
FIGURE 6.2: CREDIT UNION DISTRIBUTION AND POPULATION GROWTH IN THE ATLANTIC PROVINCES ....................... 74
FIGURE 6.3: CREDIT UNION DISTRIBUTION AND POPULATION GROWTH IN THE WESTERN PROVINCES ........................ 75
1
Chapter 1: Introduction
1.0 Introduction
Continued rural depopulation in Canada remains a cause of concern to rural residents and
policy makers at all levels. For example, rural communities tied to the primary sector are
typically losing residents, most notably in the young labor force age groups. This depopulation
has profound implications for social well-being (Rothwell et al. 2002; Bollman and Mendelson
1998). Without a critical mass of population, these rural communities may enter a downward
spiral.
Among the various challenges to rural vitality is the design of appropriate policies and
strategies for sustainable rural development, especially in a context of the rapidly evolving global
economy. The old rules of the game, where traditional assets such as cheap land and labor, or an
abundance of natural resources, determined a region’s success or failure, no longer apply. New
categories of assets are shaping economic prospects of today’s rural communities (Low et al.
2005). Social economy enterprises might be one such asset that has the potential to contribute to
rural growth or reduce decline.
Social economy enterprises are businesses that sell goods or provide services in the market
for the purpose of creating a blended return on investment, both financial and social. Their
profits, if any, are returned to the business or to a social purpose, rather than maximizing profits
to shareholders (Social Enterprise Council of Canada 2010). Credit unions are a form of the
social economy enterprise. They provide financial services to their members, whilst abiding by
co-operative principles that emphasize the importance of service to members and democratic
control.

2
Credit unions and their counterparts in French Canada, caisses populaires,1 are part of the
Canadian co-operative system. A co-operative is a business organization owned by those who
use its services. Control rests equally with all members, and surplus earnings are shared in
proportion to the degree they use the service (Canadian Co-operative Association 2007). The
democratic structure of a co-operative allows members to have a say in its operations. Members
have a voice in who they want to represent their interest within the co-operative.
In Canada credit unions provide the same financial services as do banks and trust companies,
but maximum profits or earnings are not their main motivation instead, service to members and
the community is of equal or greater importance (CCA 2007). Credit unions provide benefits to
their members through the attainment of both their economic and social goals. The number of
shares that each member can hold is limited to one. All members have an equal say regardless of
the amount of their patronage. Returns are allocated on the basis of patronage, not shares. For
this reason profit motivation cannot dominate the activity of the credit union, and this ensures the
needs of the members are represented.
Credit unions are a unique type of financial co-operative straddling the boundary between the
public and private sectors, between the broader economy and communities. They combine in one
organization co-operative principles with financial resources. The role of credit unions may be
particularly critical in an era of globalization, which presents a number of complex challenges
and opportunities, including declining funding to social programs, increased mobility of
international capital and less democratic accountability of corporations to citizens (Della and
Tarrow 2004).
1 Translated literally caisse populaire means ‘people’s bank’. A caisse populaire is effectively a credit union,

3
Credit unions, due to their mandate and structure, may be able to network with other
organizations seeking to address members’ and communities’ needs. There is also the potential
for credit unions to facilitate the achievement of community oriented goals. Credit unions’
democratic control can be applied to local and regional issues including rural vitality.
Traditionally they have been closely tied to their local economies (as they have drawn their
membership and assets from the community) and the same strong link has hold for small
businesses (CCA 2007). In an environment of rapid consolidation this relationship with the local
communities may change. Where members are drawn from multiple and geographical diverse
communities, and loans and investments are made in multiple communities, the ‘community’
served by a credit union may need to be redefined.
Credit unions' community development activities have traditionally been directly linked to
their role as financial organizations — receiving deposits, extending loans and making
investments (Fairbairn et al. 1997). Community development may result from innovative lending
of funds to individuals or businesses. In this regard credit unions may be well-positioned to play
a critical role in entrepreneurship development and firm growth in communities. This is
particularly important in rural communities because entrepreneurship is emerging as key in
regional growth. At present and in the foreseeable future, an overwhelming number of jobs being
created in the economy are by small business expansion and start-ups (Organization for
Economic Co-operation and Development (OECD) 2000). Not only do entrepreneurs create new
local jobs, but they also generate new wealth and new growth (Low et al. 2005). In this context,
credit unions may play a role in attracting and retaining additional economic activity in a
community. Additional benefits flow to the community from having additional employment and
the resulting spin-offs (Fulton and Lou Hammond 1992).
4
In light of these potential benefits of credit unions, an understanding of their role in rural
community growth is of interest. The objective of this research is thus to investigate the
economic impact of credit unions on rural communities’ vitality, as measured by population
growth.
1.1 Purpose and Objectives
The purpose of this study is to empirically examine the economic impact of credit unions on
rural communities. One of the principle that guides the operation of credit unions is their concern
for the community. Credit Union Central of Canada (CUCC) (2008) maintains that responsibility
to communities is core to the roots and daily operations of credit unions. We would therefore
expect that credit union activities in communities may improve vitality of those communities
through promoting business growth and job creation. In addition to direct impacts, there could
also be positive economic spillovers. Both quantitative and qualitative data will be used. First
qualitative information will provide an in-depth understanding of the activities of credit unions
and to inform the quantitative analysis.
The objectives of the study are:
1. To provide an overview of the policies and practices of a credit union and a chartered bank in
Saskatchewan with respect to local community economic activities; and
2. To assess if the presence of credit unions contributes to community population growth and
stability.
1.2 Hypothesis
To achieve these objectives the study will be guided by the following null hypothesis:
There is no difference in population growth outcomes between rural communities
where credit unions are present and those with no credit unions.

5
The hypothesis is stated in the null form for the purposes of statistical significance testing. If
we reject the null hypothesis (at the given level of significance) we can conclude that there is
evidence of a difference in population growth outcomes between the communities where credit
unions are present and those with no credit unions. If we however fail to reject the null
hypothesis, we can conclude that there is insufficient evidence (at the given level of significance)
to indicate a difference in population growth outcomes between the communities where credit
unions are present and those with no credit unions.
1.3 Expected Contribution and Justification of the Study
Rural development policy in North America has moved from a position of primary
importance at the beginning of the 20th century to one of marginality. Globalization has resulted
in a number of complex challenges to rural development such as increased mobility of
international capital, importance of agglomeration economies and the emergence of service and
knowledge based sectors as the drivers of the economy. Hence, many rural communities face
decline and depopulation, and a wide variety of economic problems. Thus, economic
development of rural areas continues to remain a top stated priority of policy makers at all levels.
The ability to enhance employment opportunities, attracting and retaining population and raising
earnings are practically important for rural vitality (Gabe 2007).
Conventional economic development strategies seem to be failing to achieve lasting stability
and prosperity for rural communities. Communities throughout the world continue to search for
alternative ways to achieve local and regional economic development in the face of these
pressures. Credit unions may be one of these alternative ways. The potential ability of credit
unions to play a role in community economic growth is directly linked to the fact that they are
locally controlled. Not only are businesses and organizations owned by outsiders more likely to

6
pull out when profitability falls, they are also likely less sensitive to services required by the
people in the community. Credit unions ‘recycle’ funds by reinvesting their deposits and profits
in the community through personal and business loans, mortgages and dividends paid on
members’ shares.
In Canada credit unions are the only financial services providers in more than 900
communities (CCA 2007). Given this extensive network, credit unions have the potential to
contribute to the success of many rural communities.
This research thus contributes to the study of the social economy, and particularly the credit
union literature, by providing an empirical analysis of credit union economic impact on rural
communities. Findings from this research may help policy makers and other financial
organizations (banks and credit unions) in Canada and around the world to improve performance
of rural economies in the increasingly competitive environment. This is particularly important
for credit unions and banks that remain in sparsely populated rural areas, since improved
performance would ensure that people in rural areas have access to a wide range of services and
economic opportunities. The study also provides the basis for future studies assessing the role of
credit unions in communities that will allow for the tracking of any changes in the role played by
credit unions.
1.4 Historical Development of Credit Unions
This section reviews the emergence of credit unions in the world and in Canada. The
organizational structure and credit union regulation in Canada is also briefly presented, followed
by a section on recent developments in the credit union sector.

7
1.4.1 Historical Overview of the Credit Union Development
The first successful credit unions began in Germany in 1852 under the leadership of co-
operative pioneer Hermann Schulze-Delitzsch and they focused on traders, shop owners and
artisans in urban areas. A decade later, Friedrich Wilhelm Raiffeisen founded the first rural credit
union in a village of Heddesdorf (Germany). Members of Raiffeisen’s credit unions were
generally poorer than their urban counterparts. They had smaller, more seasonal and less
predictable income flows. Raiffeisen’s approach addressed the unique problems of the rural poor
largely by exploiting the strong bonds of solidarity and deep Christian values in the typical
village.
Today many credit unions exist to further community development or sustainable
international development on a local level (World Council of Credit Union (WOCCU) 2009). In
some places credit unions are called by different names, for example, in many African countries
they are called savings and credit co-operative organizations (SACCOs) and credit co-operative
organizations, to emphasize savings before credit. In Spanish speaking countries, they are often
called cooperativas de ahorroy credito. French terms for credit union include caisse populaire
and banque populaire.
At the end of 2006 there were 46,377 credit unions in 97 countries around the world.
Collectively they served 172 million retail members and oversaw US$1.1 trillion in assets. The
top five nations with the greatest number of credit union members include the United States (87
million), India (20 million), Canada (11 million), South Korea (4.7 million), and Japan (3.6
million) (WOCCU 2009).

8
An important characteristic of credit unions is that they operate according to a set of
principles to guide them in putting their values into practice (International Co-operative Alliance
(ICA) 2004).These principles are:
-voluntary and open membership-open to all persons able to use their services and willing to
accept the responsibilities of membership, without gender, social, racial, political or religious
discrimination;
-democratic member control- they are controlled by their members who actively participate
in setting their policies and making decisions. Members have equal voting rights (one member,
one vote). This implies that their affairs should be administered by persons elected or appointed
in a manner agreed upon by the members and accountable to them. Democratic control requires
that credit unions be sensitive to issues that affect ordinary members because it is the ordinary
members who control credit unions;
-member economic participation- members contribute equitably to, and democratically
control, the capital;
-autonomy and independence- they are self-help organizations controlled by their members.
If they enter into agreements with other organizations or raise capital from external sources, they
do so on terms that ensure democratic control by members and maintain their co-operative
autonomy;
-education, training and information- they provide education and training for their members,
elected representatives, managers and employees so that they can contribute effectively to the
development of their co-operatives;

9
-co-operation among co-operatives- they serve their members most effectively and
strengthen the co-operative movement by working together through local, national, regional and
international structures; and
-concern for community- they work for the sustainable development of their communities
through policies approved by their members.
These principles have been adopted internationally as guidelines for all type of co-operatives
including credit unions. A credit union code of ethics, and a statement of environmental
responsibility, has evolved as additional principles that guide credit unions in their operations.
1.4.2 Emergence of Credit Unions in Canada
The first credit union in North America and Canada, the caisse populaire de Levis in
Quebec, began operations in January 1901 with 80 members and $26.40 deposit. Founder
Alphonse Desjardins, a reporter in the Canadian parliament, was motivated to form the credit
union when he heard the growing debate over an anti-usury law (Central 1 Credit Union 2008).
Outside Quebec, the first financial co-operative was Ottawa’s Civil Service Savings and
Loan Society, established in 1908. Credit unions subsequently spread to the Prairie Provinces,
where they developed largely as a response to difficulties faced by farmers in obtaining financing
during the Great depression of the 1930s. Over the next six decades, credit unions, particularly in
Ontario and British Columbia, enjoyed significant growth in response to strong demand for
financial services.
The variety of financial services that a credit union provides depends to some extend on its
size. The Vancouver City Savings Credit Union, for example, at the end of 2002 had more than
340,000 members and $10.5 billion assets, and operated in 42 branches, provided its members
with every kind of financial service that is available (Landcor Data Corporation 2002). There are
10
several large, full service credit unions in each province. Some of them are in urban centers
while others are not. At the opposite end of the size spectrum, there are credit unions that have
about 250 members, approximately $300,000 in assets, and operate only three mornings a week,
for example. All credit unions, though, even the smallest credit unions in the most remote
locations, provide services that their members find valuable. If they did not, credit unions would
cease to exist.
Credit unions play a distinct and growing role in providing financial services to Canadians.
Credit unions are also playing an increasingly important role in the small businesses sector and
are the second largest lender to small businesses in the Canadian economy (Lou Hammond and
Brown 2009). Canada has the world’s largest per capita membership in credit unions with one in
three Canadians a member of credit union. Credit unions are concentrated in Quebec and in the
Western provinces. In 2009 they were approximately 953 credit unions with assets in excess of
$237 billion (CUCC 2009).
1.4.3 Credit Union Structure in Canada
Credit unions in Canada are hierarchically structured in a three tier system of local,
provincial and national organizations. At the base of the system are the local credit unions, which
operate autonomously and are provincially regulated. They are the primary shareholder members
of the provincial centrals, the second tier in the system. The provincial centrals are responsible
for ensuring liquidity at the provincial level and providing services as a trade association. They
also provide wholesale lending and facilitate settlement of checks and electronic payments for
local credit unions.
The provincial centrals are in turn, the primary shareholder members of Credit Union Central
of Canada (CUCC), which functions as the system's national trade association and service

11
provider. CUCC is responsible for establishing liquidity policy and overseeing liquidity
maintenance at the national level. It also works in partnership with the national credit union
system to stimulate growth, improve cost-competitiveness and enhance the effectiveness of the
democratic process. It also gives the credit unions a national voice on financial service issues.
Ownership and corporate governance of credit unions are based on co-operative principles,
and the primary commitment of credit unions is to serve their members’ financial needs.
Membership eligibility may include being part of a ‘common bond of association,’ such as an
industry, trade union, club or community, religious or ethnic background, or being a resident of a
defined geographic area2. Just as members can form a credit union, they can also dissolve their
credit union or merge with another.
All credit unions are provincially incorporated3. Consequently, the industry is almost
exclusively regulated at the provincial level. The federal government does, however, play a
regulatory role in the credit union movement through some of the centrals. The national central,
the CUCC, is chartered and regulated by the federal government, which can provide the CUCC
with liquidity support through the Bank of Canada or the Canada Deposit Insurance Corporation
(CDIC). In addition, the provincial centrals in British Columbia, Alberta, Saskatchewan,
Manitoba, Ontario and Nova Scotia have chosen to register under both federal and provincial
legislation.
The legislative and regulatory framework for credit unions generally parallels that of federal
controlled financial organizations, such as banks. In addition, the provinces provide deposit
insurance for members of credit unions. Alberta, Saskatchewan, British Columbia and Manitoba
provide unlimited deposit insurance, while the other provinces provide coverage at least as
2 Most credit unions today are open to anyone who wishes to join. 3 Every province has a Credit Union Act except Newfoundland, where credit unions are incorporated under the
co-operative societies Act.

12
generous as that provided by CDIC (Department of Finance 2008; Lou Hammond and Brown
2009).
1.4.4 Recent Developments
Today, the credit union movement is keeping pace with product and service developments in
Canada's financial services sector. For example, the movement is becoming more active in the
sale and distribution of mutual funds. In some provinces, such as British Columbia and Quebec,
it is involved in the sale of insurance. In Quebec, where provincially chartered financial
organizations are allowed to sell insurance within branches, credit unions are especially active in
the insurance market.
Technological changes continue to push the credit union movement to re-evaluate the most
appropriate method of delivering services to its members. Many credit unions are now offering
services over the Internet. Some credit unions are loosening their ‘common bond of association’
restrictions to allow them to provide services to a wider clientele (Department of Finance 2008).
Like the rest of Canada’s financial services industry, credit unions are facing challenges of
increasing competitive pressures and continued advances in technology. In recent years, there
have been many amalgamations of credit unions. The total number of credit unions decreased
from 2,700 in 1990, to 1,595 in 2001, to 1,008 in 2008, and to 953 in 2009. This has led to an
increase in the average size of credit unions, particularly in Ontario, British Columbia and the
Prairies (Department of Finance 2008; CUCC 2008; CUCC 2009). These credit union mergers
help to sustain ‘competitive balance’ by strengthening the ability of credit unions to compete
against large commercial banks. Amalgamations also assist credit unions to achieve better
operating efficiency and to be able to support increasing technology costs. Credit unions in
Canada remain smaller compared to the banks due to their limitation of provincial operation.
13
However, they have grown in size through mergers and acquisitions. Costs are lower for larger
credit unions and therefore they can afford to offer better services to their members and a wider
variety of products. However, as credit unions become more and more ‘bank like’, the role they
play in communities, and thus their potential in enhancing community growth, may be
compromised.
1. 5 Organization of the Thesis
The study will be organized into seven chapters. The first chapter has introduced the research
problem and outlined the objective of the thesis. The next chapter highlights the background and
the motivation for the study. Chapter three provides a literature review of Canadian rural growth
challenges and opportunities, and the perceived role of credit unions in community growth.
Chapter four discusses the theoretical framework for the study. Chapter five presents the
empirical implementation of the theoretical framework and discusses the estimation methods,
followed by econometric results and their discussion in chapter six. Chapter seven concludes
giving the summary of the research findings and possible future research extensions.

14
Chapter 2: Background and Motivation
2.0 Introduction
This chapter presents the motivation for the investigation in this study. We use interviews
with a particular credit union and a particular chartered bank in Saskatchewan to inform our
modeling of the role of credit unions in rural communities. Methods used to gather the
background information are discussed, and findings presented.
2.1 Background Information
The mergers of credit unions in recent years have resulted in the growth in asset sizes of
credit unions and a reduction in the number of credit unions. Technological changes in the
financial sector and credit union mergers have created an occasion for credit unions to review the
way that they provide services to their clients.
To gain a better understanding of the activities of credit unions and chartered banks with
respect to rural economic support activities and to inform our quantitative analysis, we conducted
interviews with a particular credit union and a particular chartered bank in Saskatchewan. Our
interview results guide our conceptualization of differences (if any) between credit unions and
chartered banks and provide the basis for the study hypothesis. Further the understanding gained
through this process is also useful in interpreting the results of our formal analysis.
In spite of potential limitations, information gathered through the interview process is usually
valid and reliable and relevant to research question and objectives (Marshall and Rossman 1998).
There is evidence that such qualitative information also reveals the attitude, beliefs, perceptions,
context, constraints and solutions to the problem (Campion et al. 1994). These will be invaluable
in structuring the model, interpreting the results and drawing inferences.

15
Our interviews were semi-structured (face to face) with managers of the chartered bank and
the credit union in Saskatoon. Some of the advantages of interviews are that they: 1) enable the
interviewer to establish rapport with respondent; 2) allow the interviewer to observe as well as
listen; and 3) permit more complex questions to be asked. A semi-structured questionnaire
(attached in the Appendix A) with a list of themes and questions was used to guide the
interviews. The information gathered in these interviews allowed us to compare the practices and
intent of these two types of financial organizations in promoting rural economic vitality.
2.2 Quality Control of Interview Information
Potential problems of qualitative research include: 1) reliability of data collected; 2) forms of
bias; and 3) lack of generalizations. Lack of standardization in the collection methods may lead
to concerns about reliability. Bias may result from either the interviewer or the interviewee.
Interviewer bias may emanate from comments, tones or non-verbal behavior that creates bias in
the way that interviewee respond to the questions being asked. Interviewer bias may also result
from the way responses are interpreted or recorded. Interviewee bias may occur where the
interviewee is unable to develop trust or where the credibility of the interviewer is perceived to
be in doubt. The result is that the value of the information given maybe limited.
To mitigate these concerns the confidentiality of the interview process was stressed before
the interview and participants were given consent forms that outlined how their confidentiality
would be protected and how the information collected would be used and stored4. A copy of the
consent form is attached in Appendix B. It was stressed that under no circumstances would be
the names of the interviewees or their organizations be revealed without their consent.
Participants were also given a copy of the ethics approval from the University Ethics Board that
4 These were signed both by the interviewer and the interviewee confirming that the interviewee understands
how the data will be managed and used and the interviewer agreeing to act as specified.

16
showed that the interviews had been approved on ethical grounds. This was done in part to show
the credibility of interview and in part to show the legitimacy of the study.
Participants were also told that the interview would be recorded and transcribed and they
would have the opportunity to change or delete anything they might wish to before the data were
used in the analysis. The interviewer also stressed that the participants had a right to withdraw
from the interview without penalty and that no data would be used in such an event. They were
also given the option to choose not to answer any questions to which they might not want to
respond. Giving the participants the right to control the information they give helps mitigate
interviewee bias and improves trust levels.
The semi structured instrument was also chosen to mitigate potential problems with
interviewer bias. Semi-structured interviews are conducted with a fairly open framework which
allows for focused, conversational, two-way communication. They can be used both to give and
receive information. Semi structured interviews are flexible (as they use open ended questions)
and they provide the interviewer the opportunity to probe or to build on the responses. The
problem of the interviewer pre-determining what will and what will not be discussed in the
interview is minimized. With few ‘pre-set questions’ involved, the interviewer is not ‘pre-
judging’ what is important and what is not important information. This reduces the probability
that the beliefs of the interviewer influence the outcomes.
A voice recorder was used in both interviews (with the consent of the interviewee) to control
against bias in recording responses5. Use of the recorder also allows undivided attention to
listening and opportunities for probing. At the end of the interview more general open ended
5 Interviewee were given an option of shutting off the recorder should they feel to speak off the record and that
information would not be used.

17
questions were asked to help capture anything that might have been missed but important to the
study.
2.3 Structural Differences between Banks and Credit Unions
The regulatory structure of the Canadian financial services sector plays an important role in
the operations of banks and credit unions. This section looks at the regulatory framework and
structures of credit unions in Saskatchewan and chartered banks.
2.3.1 Operation and Regulation of Chartered Banks
Chartered banks in Canada are regulated by the Bank Act which has three main goals: a)
protecting depositors’ funds; b) insuring maintenance of cash reserves; and 3) promoting
efficiency of the financial system through competition. Under this Act banks are divided into
schedule I and schedule II banks. Under schedule I no single person may control more than 10
percent of voting stock and foreign ownership is limited to 25 percent (Canadian encyclopedia
2009). Schedule II banks are closely held (few people control the majority of voting stock) and
many are owned by their parent companies (who are mostly foreigners). Government controls
the size of schedule II banks except for the U.S.-owned banks which are exempt, in keeping with
the provision of free trade agreement. At least $10 million dollars is a requirement to start a
bank.
Schedule I banks are further divided into a three tier ownership that is based on the size of
the bank. Small banks are less than one billion dollars in equity. Medium banks are between one
and five billion dollars in equity, while large banks have more than five billion dollars in equity.
The insurance deposit for the banks has a limit of up to $100,000 per person (Canadian dollars)
and this is provided through the Canada Deposit Insurance Corporation (CDIC 2009). This
18
insurance is restricted to member registered institutions. Only specific accounts are insured. For
example deposits in foreign currency and mutual funds and stocks are not insured.6
2.3.2 Operation and Regulation of Credit Unions in Saskatchewan7
Each credit union is an autonomous separate entity owned and controlled by its members,
which consist primarily of local people. By purchasing a share in the credit union for a minimal
cost, customers of credit union become members. Each member owns one share and has one
vote. This democratic control helps to ensure that the needs of the members are met as opposed
to investor-owned companies where, the number of vote is shares determined. Members vote on
major decisions, like electing a board of directors, to control financial stake of the owners in the
organization. In the credit union model the board hires the general manager of the credit union
(Saskatchewan Credit Unions 2009).
The Credit Union Act (1998) provides the overall framework for the incorporation and
regulation of credit unions in Saskatchewan. The Act describes the responsibilities, obligations
and powers of credit unions, the Registrar of Credit Unions and the Credit Union Deposit
Guarantee Corporation (CUDGC). Credit Union Deposit Guarantee Corporation is given
responsibility by the provincial government to guarantee the full amount of funds on deposit with
Saskatchewan credit unions and to provide preventive services that support the financial strength
of credit unions.
CUDGC acts as the primary regulator of the credit unions and puts provincial deposit
protection programs in place that require credit unions to operate in a prudent manner by
complying with the standards of sound business practice. In addition to this, the CUDGC
prescribe requirements for the policies and procedures each credit union must have to manage
6 These deposits are deliberately placed to take risks for gains. 7 Credit unions in Canada are provincially regulated hence the reason for focusing on credit unions in
Saskatchewan.

19
and control exposure to risk (CUDGC 2009). The standard areas of sound business practice
include: 1) corporate governance; 2) strategic management; 3) capital and profitability
management; and 4) risk management. The application of these standards depends on the size,
complexity and product and services offerings of a credit union. Some of the restrictions that
guide credit unions are included in table 2.1.
Table 2.1: Credit Unions Selected Restrictions
Credit Unions Selected Restrictions
1. Aggregate loans to any individual must not exceed credit unions loan’s limit. 2. Aggregate of all related party transactions with credit union cannot exceed 20
percent of credit union assets based on the most recent audited financial statements.
3. Loan on residential property cannot exceed 80 percent of fair market value while, loan on real property other than residential cannot exceed 75 percent of fair market value.
4. Maximum net aggregate foreign currency exposure cannot exceed 5 percent of eligible capital.
5. Credit union aggregate overdraft cannot exceed 5 percent of the eligible capital while overdraft per individual cannot exceed 1 percent of the eligible capital.
6. Individual aggregate loans may not exceed 5 percent of credit union assets, while aggregate loans per individual local government body may not exceed 10 percent of assets.
Source: CUDGC
2.4 Differences and Similarities between Credit Union and Chartered Bank
Though each interview was restricted to one hour, the amount of information collected,
comprising of 40 transcribed pages provided valuable insights to this study. The interview results
are divided into five sections and are presented in table 2.2. The five sections are: 1) nature of the
clients’ base in rural communities; 2) lending portfolios and business support; 3) lending process
and default rates in rural areas; 4) relationships between deposits, lending and investments; and
lastly 5) other forms of community support.

20
Table 2.2: Structured Interview Results
Business activity Credit Union Bank
Type of rural client base
Farmers
Agricultural businesses
Other rural businesses
Consumers
Non-profit sector
Municipalities
Lending portfolios and business support
Traditional lending
Consumer lending
Commercial lending
Small and medium enterprise lending
Non-traditional lending
Micro-lending
Community economic development lending
Lending process and default rates Same lending process for both the urban and rural
communities
There is no differences in the default rates between the rural and urban
Relationship between deposits, lending and investments
No geographical relationship between deposits, lending and
investments Other forms of community support
Sponsorships
Staff volunteer time in community activities
The results indicate that the chartered bank and the credit union are comparable in terms of
business activities and client base. What is different between the two is that, in addition to these
activities, the credit union participates in micro-lending and community economic development
lending. Though this cannot be generalized for all credit unions it sheds some light on the
practices of credit unions that may be different from banks.8
8 Because of the national and centralized structure of chartered banks it is more likely that the chartered banks
results can be generalized. Credit unions are more likely to be idiosyncratic due to their local control.

21
2.4.1 Nature of the Rural Client Base
For the bank individuals and personal businesses constitute a large share of their rural clients.
Other rural clients include municipalities, farmers, non-profit sector and agribusinesses. The
credit union rural client base consists of a mixture of farmers, agribusiness, rural businesses,
consumers and the non-profit sector.
Both organizations acknowledge that the nature and type of rural clients is diverse. The
southern and northern parts of the province are different in terms of industry structures, and
agriculture borrowers are no longer confined to the rural population. The credit union confirmed
that agriculture forms a bigger share of urban client base than it used to because some of the
farmers in Saskatchewan are part time farmers, living in urban areas and farming in the rural
areas.
This realization by financial organizations that agriculture is no longer synonymous with
rural is important because today a lot of growth potential, in terms of population base for the
rural economy, is no longer agriculture. A heterogeneous rural client base means that all sectors
are of equal importance and that no sector is marginalised. This is critical given the diversity of
rural areas today.
2.4.2 Lending Portfolios
Both financial organizations have traditional lending as a common lending portfolio. This
traditional lending portfolio includes: consumer lending; commercial lending; and small and
medium enterprise lending. Consumer lending is for personal clients and can include: personal
loans; credit cards; and residential mortgages. Commercial lending provides credit needs to big
businesses with larger and usually more complex credit needs. Small and medium enterprises
lending provides credit needs to businesses with relatively smaller credit needs. These businesses

22
normally have less than a million dollars of income. Neither financial organization makes a
distinction between a farming business and non-farming business. Further, neither financial
organization makes any distinction between rural and urban in their lending portfolios.
In addition to the traditional lending, the credit union has two forms of non-traditional
lending: micro-lending; and community economic development lending. Micro-lending is
extended to small businesses that are not eligible for traditional lending either because they are
considered to have a lack of experience, or they do not have a sufficient credit rating. Because of
this such businesses are considered high risk lending and very few, if any financial organizations
would consider extending loans to them.
The credit union partners with Western Economic Diversification in extending micro-lending
to some of these businesses. Western Economic Diversification provides the credit union a loan
loss provision on all the micro-lending (to cover some of the losses in cases some of the
businesses do not pay back).
Despite the fact that any financial organization can partner with Western Economic
Diversification in micro-lending program very few of the financial organizations take up this
offer mainly because they still consider it high risk lending. The credit union however, has a low
rate of loan default on micro-loans, of about 2.5 percent. Credit union success in micro-lending
was attributed to the amount of mentorship and that the organization puts into the program. Their
staff devotes a lot of time in providing business advice, training and follow-ups.
Community economic development loan program considers mortgage financing, lines of
credit and financing for various types of projects that have strong community support and a good
business track record. In most cases these projects cannot be funded through the traditional loans.
Because these loan types have a strong community bearing, community committees are usually

23
involved and they provide some input into the lending process. Though these committees do not
make the final decision on the loans, they provide information about the business such as local
knowledge that will be considered in the internal loan decision making of the credit union.
These non-traditional lending portfolios are important in that they are one way of addressing
market failure in the small businesses' access to start-ups loans. Information asymmetry might be
the cause of individuals or businesses not qualifying for traditional loans. That is, credit ratings
and other information that banks or credit unions rely on for risk assessment though they offer
valuable information, this information may not be available for some loan applicants. Knowledge
of the individual, business or community, if available, may serve as a substitute for the standard
risk information. In non-traditional lending personal and community information may be
available, and a more detailed personal interview may substitute for standard risk assessment
tools. In addition, mentorship and follow-ups allow credit unions to monitor loan beneficiaries
and lower the risk of defaults.
2.4.3 Small Business Support
Small and medium enterprise lending is a common form of small business support for both
the bank and the credit union. While the credit union offers some non-traditional lending, the
bank is sceptical about the non-traditional lending. They refer businesses that fall outside the
traditional lending to government programs like the Canadian Small Business Financing
Program or to the Business Development Corporation.
Non-traditional lending provided by the credit union is important because small businesses
are a significant contributor to the economy and employment generation, but the securing of
credit by these businesses has been a continuous challenge, mainly in terms of assets that could
back the credit needs. Though the credit union plays a significant role in non-traditional lending,

24
its capacity is limited because regulators restrict non-traditional lending to a maximum of one
percent of their total book value. Credit union mergers and syndication in the last 10 years may
have helped to increase this capacity.
Credit union mergers increase their capacity to provide services to their clients, while
syndication is a process which allows credit unions to partner in providing larger loan sizes
beyond their limits. Some credit unions may have high demand for loans while, others may have
a low demand and syndication allows these credit unions to partner and to share loan demand.
In the U.S. credit unions have a special type of lending called peer to peer lending where,
credit unions may put business plans on their official websites and other members can make
financial contribution towards those businesses. Though there is no guarantee that the members
will get their money back, peer to peer lending has been a success in the U.S. with delinquency
rate of less than 1 percent (American Consumer News 2009).
2.4.4 Lending Process and Defaults Rates
Both financial organizations have the same process of lending to rural and urban areas. Both
the bank and the credit union have some rural branches that are too small to have resident loan
advisors or loan officers. In such cases these branches are serviced by officers who work on
schedules that service several branches. However, clients also have the option of going to bigger
branches directly for such services.
The process of approving traditional loans is basically the same for both organizations. They
have a credit decision model which looks at key ratios such as debt servicing ability, security,
credit history, net worth and other financial information. For both organizations, there are loan
limits for branch loan officers. Beyond those limits, the loan application must go to an
adjudication centre for the bank, and to head office for the credit union.

25
What might be different in the process of loan processing, for both the bank and the credit
union, is the length of time it might take to approve loans across different sectors. Agricultural
loans usually interface with some government programs that impact agriculture. For example,
dairy loans need guarantees that the government gives under milk quotas and guarantees on
livestock so the processing might take a longer time.
For both organizations loan default rates are not different between urban and rural areas. The
economic performance of particular sector drives default rates. If agriculture as a sector faces
more challenges than other sectors, then default rates will be higher. Or if a community depends
on a mine and for some reason that mine closes causing significant job losses then default rates
will be observed geographically, but a priori there are no reasons to believe that there are
differences in default rates between the rural and urban clients.
2.4.5 Relationship between Deposits, Lending and Investments
For both the bank and the credit union there is no relationship between deposits collected in a
geographical area and the amount of lending and investments made in that area. Deposits of
clients in each community may be used for local lending, but may also be used for lending
internationally or in other communities. The lending portfolio depends on the demand for loans
and investment opportunities.
For a credit union loans and investments are regulated by CUDGC. One hundred percent of
all deposits are guaranteed and CUDGC also restricts the operations of credit unions including
loans and investment. In addition to limitations on micro lending, a credit union is also restricted
in terms of the instruments in which it can invest. For example, maximum net aggregate foreign
currency exposure is restricted to a maximum of 5 percent of the eligible capital and a credit

26
union cannot invest in risky instruments like mutual funds. The bank, though regulated by Bank
Act, is less restricted in the instruments it can or cannot invest in.
2.4.6 Other Forms of Community Support
Outside the normal business activities, both organizations are involved in other forms of
community support and these are not necessarily on a ‘for profit’ basis, of interest is that the
bank does not distinguish between sponsorships and community development, while the credit
union clearly make this distinction. Common to both organizations are sponsorships and staff
volunteer time in community activities. Most of these programs focus on the youth, education
and health. For both the credit union and the bank, employees are the face of their respective
organizations and they get support in the activities they take to represent their organizations.
2.5 Conclusion
The interviews provided some insights into the basic operations of a credit union and a
chartered bank. Most of the business operations and practices are the same, and neither
organization makes a specific distinction between rural and urban clients. The major differences
between the credit union and the chartered bank however, were noted in their lending portfolios,
business support and investments. The credit union in addition to the traditional lending,
participates in non-traditional lending that takes personal and community information into
account in assessing the eligibility of the borrower. They also support community economic
development.
The impact of credit unions on rural communities (if any) is likely to be through non-
traditional lending options that chartered banks tend to avoid. A wider network of credit union
branches in most of the rural areas will likely place them in a better position to provide non-
traditional lending to community businesses. Ties with communities might enable credit unions

27
to effectively carry out these non-traditional lending. Because non-traditional lending involves
community committees and mentorship of businesses, this makes them self-policing. Borrowers
are less likely to default on such loans because the community is involved one way or the other
and relationships are formed in the process (social capital). These results may indicate that credit
union presence in the communities might enhance an entrepreneurial spirit in the communities
and promote business growth, especially for those entrepreneurs that cannot access funds from
the mainstream financial providers. Lending to these local entrepreneurs may based on
information other than standard risk assessment methods, thus addressing market failure in the
small business start-ups access to loans.
Results have indicated that credit unions have additional services to offer to the communities
through community economic development lending and micro-lending and thus might have an
impact on the rural communities in terms of small business development. This should, all else
constant translate into better performance by the community in terms of population growth
and/or retention. It should be noted however, that at the maximum, this type of lending is only
one percent of their lending portfolio.
Despite the credit union mergers that have been occurring over the years and the changing
business environment for credit unions, the interview results offer preliminary indications that
credit unions still differentiate themselves from the main stream finance organizations and still
have a commitment to communities. The next step will be to see if evidence of the influence of
credit unions can be found using econometric analysis of the role of credit unions in community
population change.
28
Chapter 3: Literature Review
3.0 Introduction
Rural economic development remains important for rural participation in national economic
growth. Rural areas in Canada experience various constraints in rural revitalization and growth.
This chapter reviews selected literature applicable to Canadian rural areas’ historical
development, challenges, policies and approaches drawing upon the experience of Canada and
United States and from other countries where necessary. Lastly this review looks at the emerging
perceived role of credit unions in community economic development. Both theoretical and
empirical literatures are explored.
3.1 Historical Overview of Canadian Rural Development
Prior to the 20th century, the development of natural resources (fur, fish, minerals, lumber and
agriculture) for export to the European markets offered attractive economic opportunities that
shaped subsequent development of the early Canadian economy. Rural areas had the function of
providing an export base and attracting foreign capital and receiving public investments.
Developing these rural based industries was consistent with national objectives (Partridge and
Olfert 2008; Freshwater 2007; Deavers 1992).
Until the 1930s, the main national policy in Western Canada was settlement driven.
Consequently national policy was rural development policy and the main focus for rural
development was expansion of agriculture, so rural development was targeted through
agricultural policy. Land was surveyed and made available for farming and people were recruited
from Europe to populate the new territory. While urban centers grew rapidly over this period and
their functions expanded to include manufacturing and tertiary services, the main development
focus was on establishing agriculture in the rural areas. The primary function of cities was to

29
provide a transshipment function where goods and people from Europe arrived and raw materials
left (Fowke 1978).
Since the early 20th century, technological changes and falling transport costs gradually led to
the replacement of the primary sector as the primary source of economic value and especially as
a source of employment. Out-migration from rural areas has been persistent and dramatic,
largely because farming became mechanized and scale economies in farming increased
generating surplus labor. Continued out-migration of labor from farming was compounded by
lack of alternative economic activities in the rural areas to absorb the surplus labor.
During the Great Depression exports declined precipitously, farm income fell and policy
shifted from the linkage between national policy and agriculture to farm support as a way to
control out-migration of farm families, reduce environmental degradation in the rural areas and
limit the consequences of a collapsed export market for natural resources. Farm policy was
restricted to enhancing incomes of farmers rather than being the instrument for a larger rural
development policy (Freshwater 2007).
In the years since World War II farming has been replaced by other sources of income and
employment in the majority of rural areas. Though the land base of agriculture has remained
remarkably stable over the last century, the majority of the rural population, even in farm
dependent areas is now employed outside agriculture. As the relative role of farming and farmers
in rural Canada declined, farm policy became less effective in meeting rural development goals
yet rural development was still addressed primarily through funds flowing to farms. Farm lobbies
continued to argue that farmers were disadvantaged even when their incomes approached and
even exceeded national averages. Farm support crowded out funding for other forms of rural
development particularly as farm interests continued to be successful in arguing that the old

30
logic of farm support being synonymous with rural development still held (Partridge and Olfert
2008; Freshwater 2007).
At the same time non-farm related rural interests continued to be neglected. Within the
national government the Department of Agriculture was the main contact point for both farm and
rural policy. All other rural issues were channeled through the agricultural bureaucracy. Not
surprisingly much of the bureaucracy and the political staff in agriculture were neither familiar
with, nor particularly interested, in non-farm rural issues (Freshwater 2007). Efforts by rural
advocates to shift the responsibility to other line agencies that were more familiar with specific
issues such as housing, health care, transportation or industrial development were typically
unsuccessful because these agencies had a largely urban focus and failed to appreciate how rural
was different. Further, because the agriculture department had been assigned the lead role, other
agencies were in a weak position to initiate programs even if they had wanted to.
Rural areas continued to decline and depopulate and the plight of most rural areas did not
improve. The share of population living in the rural and small town areas had declined to 20
percent by 2006 (Statistics Canada 2009).
Rural depopulation makes it hard to achieve the necessary economies of scale for the
provision of public services. Low population densities affect the performance of rural economies
by increasing the per capita costs of infrastructure and other public investments (Moser and
Wessen 1999; Deavers 1992; Mann 2005). Small scale poses similar competitive challenges for
the private sector in rural communities as demand threshold may not be met and economies of
agglomeration not achievable. The low population densities of most rural areas generate very
limited opportunity for new businesses to establish or for the expansion of the existing
businesses.
31
Rural depopulation was synonymous with increased relative importance of urban areas, both
in terms of economic activity and population. The subsequent rise of professional services as a
key sector in the economy requiring large markets, frequent face-to-face contact between buyers
and sellers and access to urban amenities contributed further to urban concentration.
3.2 Rural Development Challenges
Kilkenny (1998) defines rural development as economic diversification, and an increase in
population and welfare. This is the definition adopted in this study. The steadily falling
population in rural communities is an indicator of rural decline as people ‘vote with their feet’ to
relatively preferred places.
Lagging rural areas became an explicit concern during the great depression and since then
have been part of the national policy agendas (Partridge and Olfert 2008). Rural policy fifty
years ago was easily described as a mix of agricultural policy along with a collection of smaller
programs that supported the creation of rural infrastructure through electrification, construction
of water and sewer systems and provision of telephone services. These policies no longer suit
rural areas today.
The shift in rural Canada from being primarily a farm based economy in the 1920s to one
where farming is now just a small part of the rural economy has made farm policy of any type a
limited rural policy tool. One of the likely possible explanations for lagging rural areas is the
absence of a new rural policy for the new rural environment that exists today. The following
factors constitute the new rural environment: 1) the importance of agglomeration economies; 2)
spatial location advantages; 3) decline of natural resource base and the global changes of
economic activity; and 4) the decreasing rural political influence.

32
3.2.1 The Effect of Agglomeration Economies
Agglomeration economies can be defined as the positive externalities that exist outside the
firm but within the industry (localization economies) or within the broader urban area
(urbanization economies) (Rosenthal and Strange 2001; Viladecans-Marsal 2004). Localization
economies arise from spatial concentration of activity within industries. Marshall (1920)
identified three sources of localization economies. First is the sharing of inputs whose production
involves internal increasing returns to scale. The second is labor market pooling, where
agglomeration allows a better match between an employer’s needs and the worker’s skills and
reduces risk for both. The third source is knowledge spillovers that take place when an industry
is localized allowing workers to learn from each other, possibly increasing their productivity.
Urbanization economies are external to both the firm and the industry. Firms find it
profitable to locate in an urban area even when there are no cost advantages to geographic
concentration for their industry. A good example could be the availability of public infrastructure
such as transit system or airports. By providing good highways, public utilities and
communication facilities, an urban area significantly lowers the cost to all firms doing business
in an urban area. Another example of urbanization economies is the city size itself, which
represents access to a big market.
The attraction of agglomeration economies has resulted in the concentration of economic
activity in urban areas. The shifting of comparative advantage and absolute advantage from rural
to urban areas has altered their relative fortunes. Whilst urban areas have continued to grow and
have emerged as drivers of the Canadian economy, rural areas, especially those dependent on
primary production have experienced chronic population loss as new labor-saving technologies
have been continuously adopted (Stabler and Olfert 2002).

33
Key exceptions to this pattern are the rural areas offering amenity- rich life styles or easy
access to urban concentrations, which are emerging as new rural growth areas (Ferguson et al.
2007; McGranahan 2008). These places provide alternatives to urban population who wish to
escape from the negative externalities of agglomeration that includes pollution, congestion and
high land prices. However, many rural areas still continue to suffer from lagging economic
conditions relative to the urban areas, as well as pockets of rural poverty which, remain a
concern for rural Canada.
3.2.2 Effects of Spatial Location Advantages
Spatial locational differences of rural areas are becoming more important but in a different
way than in the past. Historically the wealth of a rural region depended on the presence of
extractable resources, such as soil quality, minerals or trees. Today natural resources that are
most important in terms of supporting population are no longer extracted and are based upon
amenities like scenery, climate and history. In the U.S. rapid population growth has occurred in
the Rocky Mountains, southeast Texas, around Atlanta and in Florida in the 1990s (Goetz 2003).
Further, distance of a rural community from a growing urban center affects its participation in
labor markets and access to higher ordered services available in urban centers.
Demographic shifts based on these spatial characteristics and proximity to growing urban
centers continues to have powerful impacts on rural areas. Some rural communities are being
subjected to rapid development because they are highly desired by higher-income urban residents
seeking to escape congestion and pollution or wishing to establish second homes for weekend
getaways. Many of these rural communities are becoming urbanized as they attract growing
populations. In other places the population continues to fall, leading to concerns that there are
too few people to maintain local government services and retail businesses.

34
3.2.3 Decline of Natural Resource Base and Global Changes
A natural resource base that provided many rural areas with their initial economic base
appears to be experiencing considerably volatility and ongoing price declines. Long time falling
prices in natural resources put pressure to reduce costs. In an internationally competitive
environment and given the available technologies, capital has been continuously substituting
labor resulting in further job losses in rural communities that are dependent on natural resources.
These rural areas will have to search for innovative ways to develop new economic functions if
they are to survive. Traditional commodity production is now been challenged by public pressure
for alternative uses of the resource base that involve passive uses instead of extraction.
For most of the 20th century the substitution of capital for labor in rural areas led to out-
migration to urban areas. Rural workers who were displaced were able to find better paying jobs
in urban areas. Today however, the combination of reduced urban demand for low skilled
workers and an influx of recent immigrants to urban areas have made rural-to-urban migration a
less effective adaptation to ongoing job losses. Moreover, out-migration without good
employment prospects is counter-productive because it may impose higher costs on the
individuals and society than leaving these workers in their current communities. As a result some
rural communities have suffered from labor surplus and continue to suffer from lagging
economic conditions relative to the urban areas. In the U.S. between 1969 and 2000, rural-urban
per capita income differences have widened from a 29 percent gap to a 31 percent gap
(Freshwater and Scorsone 2002).
The dominance of the services sector as the driver of most economies is making human
capital an increasingly important influence on prosperity. In the past rural areas had been less
concerned with making investments in human capital, as they could rely on place specific

35
resources to provide an economic function. Not only is human capital expensive to create but it
also tends to be mobile. Unless rural areas can find ways to compensate workers and retain
workers they will have a hard time keeping skilled people in the community.
More open trade regimes as a result of globalization have had disproportionately large effects
on rural areas because they produce a much higher share of tradable goods than urban areas.
Moreover most of these goods are readily produced in developing countries with lower labor
costs and less stringent environmental regulations (Barkley 1995). As capital flows became less
restricted investments in developing countries in industries that directly compete with rural firms
make the labor cost differential even more significant.
3.2.4 Decreasing Rural Political Influence
Rural political influence continues to decline as population migrates to urban areas. As the
relative population size shifts, so does the relative importance of the region in national economic
goals (Partridge and Olfert 2008). As the urbanites became a stronger political force they may
have little interest in the domestic rural concerns. For many urban people, rural areas are seen
primarily as having value because of natural and cultural amenities, provision of safe food, and
provision of the recreational facilities. Urban interests may try to block changes that reduce their
access to these perceived benefits even if doing so disadvantages rural people.
Most of the benefits of rural development are local in nature and those residing in the
communities are often the main beneficiaries of the process. When there is little national interest
there may be no or little larger public interest. Other claims on federal funds might be seen as
more pressing than those advanced by rural interests, especially if the federal budget is in a
deficit position. This might mean that capital for rural development will have to come mainly
from resources within rural communities.

36
One of the reasons farm support remains a popular public policy and the influence of the
farm lobby continues to be a powerful force is that all citizens eat, so a stable supply of
reasonably priced food is in everyone’s interest. In addition, foods exports contribute to foreign
currency earning that allow the urban consumers to purchase foreign made consumer goods
(Castle1993; Rowley 1996).
As a result of one or a combination of these factors, diversity of rural places has been
increasing over time. When farming dominated rural areas and most farms were similar in size,
technology and production, there was greater similarity among rural places and it was easy to use
sector-based policy approach to rural development. Today even rural areas that are in close
geographic proximity or those that have similar economic functions can be very different. This
sheer diversity of rural Canada, from agricultural communities to manufacturing intensive places
or retirement destination make it difficult for governments to create and manage a coherent set of
rural development polices.
3.3 Rural Development Policies and Approaches: Overview
Differences among rural people and places in Canada make it inappropriate to maintain
sector based policies (Partridge and Olfert 2008). The problem in formulating rural policy is
further complicated by the absence of a common definition of rural and the need for policy
makers to both accommodate rapidly changing conditions and balance diverse interests. To date
policies that has been implemented fall into two broad categories: place based policies and
people based policies.
Place based policies are those policies where the location of the beneficiary is a key criterion
for eligibility. These policies have broad economic and quality of life goals pertaining to a
particular rural location or to rural areas in general. People based policies, on the other hand,

37
target individuals. Place based and people based policies however, are not necessarily mutually
exclusive. Place based policies can also target specific people or sectors. The target of all policy
is ultimately people hence ideally the promotion of place (or commodities or sectors) is only
undertaken if those policies ultimately make people better off. Further, people based policies
need to be delivered in a spatial context, possibly creating a place based orientation. Likewise,
policies that affect governance structures and infrastructure are by definition place based though
individuals may be primary targets (Partridge et al. 2009).
3.3.1 Place Based Policies
Conventional place based policies focused primarily on the recruitment of firms to the rural
communities. Focus on recruitment of manufacturing firms was inspired by massive out-
migration of labor from agriculture primarily due to technological advances. The primary goal
was to create local jobs and the focus was mainly on the job counts rather than wages paid or the
interaction of the recruited firms (Goetz 2003). Firms were encouraged in rural areas by a
combination of low cost access to natural resources, capital grants, tax reductions, the provision
of infrastructure and other cost reducing supports. This approach was based on accountants’
ideas of what a good business climate would be (Henderson 2006). The intent was to offset the
two key impediments of a rural location: transport costs and limited quantities of quality labor.
Despite the increased efforts in modifying industrial incentives many argue that the firms
receiving assistance would have located in that area without the use of incentives (Bartik 1991;
Papke and Papke1986; Fisher and Peters 1998; Schmenner 1991). A firm’s primary goal in
selecting a new industrial site is to find a location that will allow the firm to maximize its profits
and in most instances, production costs including taxes are not the only considerations in
38
searching for a new site. In addition to production costs, firms also look at transportation costs
and agglomeration forces (Johnson 2001; Henry and Drabenstott1996).
Agglomeration economies represent the cost savings that accrue to firms that locate in
communities with a relatively large concentration of manufacturing or commercial business
activity. The concentration of activity tends to provide broader access to markets, business
activities, skilled labor and knowledge spillovers.
The effort to attract new firms into the community has been generally non selective.
Attempts have been undertaken without a comprehensive strategy to maximize the net benefits
of the new investment to the community. Henderson (2006) found that a number of communities
that have succeeded in attracting new industries have found that they have not produced the net
benefits expected. Frequently, there have been offsetting losses to existing businesses. Some
existing businesses have simply been replaced, for example, downtown merchants by suburban
centers, and others have found their resource base destroyed by newcomers. At worst this
approach has simply set into motion an international set of con artists and plain crooks who
demand grants, incentives and tax advantages to set up plants that employ workers at low wages.
They move in, skim off the cream, and then move on to another ‘disadvantaged’ area
(Schmenner 1991). The approach merely pits communities against each other in a competitive
attempt to lure new businesses.
Another problem with industrial recruitment is that as regions race to become more
competitive, this might be a race to the bottom because competing and surrounding regions
quickly match each new incentive. Thus, as regions continue to increase their incentive
packages, especially through lower tax levels they are simply decreasing their ability to provide
public services in the future (Rainey and McNamara 2002). A community that lowers its taxes

39
will not likely see long term competitive benefits but will face lower tax receipts throughout the
future unless the tax reductions are reversed. This could lead to a decrease in public service
quality or quantity in the area, which will make the area less attractive for future investment
activity.
Further, when new jobs are created in a community through industrial recruitments, the jobs
are often filled by outsiders who move into or commute from the surrounding areas largely
because they are more skilled than the local labor force (Courant 1994; Partridge and Rickman
2003). Local unemployment rate may therefore remain unchanged after these new jobs are
created and local residents may not experience expanded employment opportunities.
In recent years rural analysts and the academics have been advocating for different
approaches to place based policies. These approaches focus on spatial characteristics of rural
areas and spatial location in relation to urban areas and advocate the use of place based policies
in conjunction with people based policies. Central to these approaches is the use of natural
resources as amenities and strengthening of rural to urban linkages.
3.3.1.1 Natural Resources as Amenities
Since the 1960s, several forces have come together to alter the manner in which natural
resources act as engines of economic growth. With the exception of oil production recently,
international competition has led to most resource extractive industries in North America to lose
their price competitiveness in world markets. The economic restructuring of the most developed
economies toward a services base has significantly tempered the importance of natural raw
materials as inputs for production (Chevan and Stokes 2000). Further, environmental awareness
and political activism of urban audiences have provided strong criticism of extractive productive

40
practices by emphasizing adverse environmental impacts, threats to bio-diversity and
sustainability and global environmental change.
These regional development issues have forced a re-examination of the uses and management
of natural resources, particularly publicly owned, land-based resources such as forests and water
resources. Natural resource management has broadened its focus to embrace non extractive
environmentally sensitive land management practices that reflect broader non market values.
Natural amenity rich communities have become aware that natural resources provide not only a
source of physical raw material commodities but can also serve as a source of recreational use
that provides a backdrop for tourism (Galston and Baehler 1995; Isserman 2000).
Natural amenities as quality of life factor are perceived to play a critical role in human
migration and firm location decisions (Deller and Dissart 2000).Graves (1983) found that
location specific amenities such as climate were significant in explaining population migration
while, Powell (1982) found that both economic and amenity factors were important determinants
of migration. Proponents of this approach argue that modest population growth in high amenity
areas allows places to remain rural, while allowing the nature of communities to change to serve
tourism and second homes.
3.3.1.2 Rural- Urban Linkages Approach
Approaches to strengthen rural-urban linkages are based on agglomeration economies of
urban areas and positive spillover effects of urban growth to the adjacent rural areas. Economies
of scale, scope in economic activity and the provision of urban amenities generate urban
advantages that perpetuate the concentration of economic activity and population in and in closer
proximity to them. Communities more proximate to a major center may be more attractive in

41
terms of economic strength and quality of life and resulting utility differentials produce net
population flows.
Partridge et al. (2007) found evidence that major centers defined as metropolitan areas
greater than 500,000 populations in size are engines of growth. The engine of growth hypothesis
implies that there are more benefits attributable to major urban center than just the conventional
spillovers due to commuting linkages and access to generic services that apply to any urban
centre and its rural fringe. Proximity to a major center represents access to more potential
markets as well as the highest-order business services and urban amenities.
Rural growth near urban growth centers results from ‘spread effects’. Spread effects are the
positive externalities on the rural peripheral localities as they share in the growth and wealth of
the primary growth centers. Rural areas that are well-linked to urban centers may then
experience population and job growth. Population growth in rural areas may result from urban
congestion as households seek rural amenities (suburbanization) and firms are attracted to lower
land and labor costs in nearby rural areas, while retaining access to the urban center
(decentralization). Rural job growth results from local services provided to the commuting rural
population as they access urban jobs.
Generally, spread effects occur when rural population or employment growth originates from
urban growth, regardless of the source that is agglomeration economies or decentralization or
suburbanization. Partridge et al. (2007) found that adjacent rural areas capture over one third of
the urban growth rates, while positive spread effects are felt up to 175km from the urban center.
Strengthening rural-urban linkages through zoning, environmental and transportation policies
that facilitate commuting access have been advocated by the proponents of this approach.

42
On the other hand, population and employment may decline as a result of increased
economic activities in urban centers through “backwash’ effect. Backwash effect normally
occurs in those rural communities that have no strong rural-urban linkages. A growing urban
center may cause rural-urban migration of households seeking employment opportunities and
access to urban services and amenities. In such cases, then other policy options need to be
pursued to prevent further decline of these rural areas.
3.3.2 People Based Policies
People based policies for economic development were inspired by the decline of natural
resources and manufacturing along with the growing prominence of service and knowledge-
based sectors. The basic idea that rural development should be based upon employment creation
in rural areas was challenged by these policies. Central to people based policy is human resource
enhancement which prepares people to enter the labor force, equip them for occupational
changes and enhance their opportunities to be re-employed if they are displaced.
Proponents of human capital investment pointed to the effects of rapid technological change
that replaces labor with capital and competition with developing countries where labor is
relatively cheaper. They argue that improving human capital should lead to higher rates of labor
productivity that would make rural places and workers competitive. Moreover, it should increase
incomes if workers are able to capture some of the increase in productivity.
Beaulieu (2002) found that communities or regions that have greater shares of individuals
with more years of formal education fare better on a variety of indicators including higher levels
of income or lower unemployment rates. However, it should be noted that education and training
will not necessarily improve earnings. Human capital development needs to be matched with job
quality. To be most effective, a human resource development strategy must be an integral

43
component of high value added economic development to increase demand for skilled workers.
If a rural worker pursues a college degree but is unable to find a job locally that requires college
education that worker will likely leave the area to find work elsewhere that is commensurate
with the new skills.
Though the logic of people based policies is compelling, these policies have not been widely
adopted to address rural decline. One of the impediments in Canada was political. The idea of
subsidiary was introduced as a way to move rural policy design to people based approaches.
Delivery of policy was shifted away from federal government to provinces, primarily because
education and skill development is largely the responsibility of provinces in Canada. However, a
shift to human capital investment by provinces was not adequately supported with funding from
the federal government and provincial governments had limited resources (Freshwater 2007).
Moreover, not everyone can be rescued with this approach. There are inherent immobilities and
pockets of poverty where location specific approaches may be required.
3.4 Local Development Approach to Rural Development
In the 1980s another thread of rural development approach gained importance. The
Community Futures Program was introduced in Canada to address pockets of high
unemployment in rural places by stimulating local business growth (Freshwater and Ehrensaft
1994). Local development strategy nurtures local entrepreneurial creativity, often based upon
local resources (Sharp et al. 2002).The adoption of more locally based development approaches
has shifted the focus of development away from resource extraction and export to improving
internal linkages within communities opening the door for integration of place and people based
policies (Radin at al. 1996). A key component to local development is an assessment of the
limiting factors and the potential for each community and building human capital, in particular

44
entrepreneurial and management skills is a central part of virtually all locally based development
efforts.
Proponents of this approach argue that net job formation today is largely driven by small
businesses and creating small businesses inherently requires attention to local resources and local
markets. A consequence of the focus on local development is the increased importance of
entrepreneurship by creating economic value through the establishment of new or growth of
existing firms. New businesses and self employment contribute jobs, resulting in higher income
levels and increased wealth and enhanced markets (Henderson 2006; Fritsch and Mueller 2004).
Goetz (2003) found that in the U.S. the share of non-farm proprietor jobs in all full and part-
time rural jobs increased from less than 14 percent in 1969, to 18 percent in 2000, and he argues
that if these non-farm proprietorships had not been formed, the population loss from many rural
areas over the last few decades would have been even more pronounced. These proprietors cover
a vast array of businesses ranging from manufacturing of local crafts to services such as tax
consulting or export marketing for farmers.
One of the obvious contributions of entrepreneurship to the increased welfare of society
beyond direct income is the multiplier effects induced by additional income. Minniti (1999)
argues that entrepreneurs are catalysts for economic growth because they generate a networking
externality that promotes the creation of new ideas and new market formations. Another
advantage of the local level development approach is that local entrepreneurs have obvious and
strong ties to the community, which means that they are less likely to be lured away to other
regions. They may reinvest profits locally and they are potentially active philanthropists for local
causes (Pages and Poole 2003). Local entrepreneurs are also more likely to establish firms that
are compatible with the resources and opportunities for the communities than are outsiders.

45
One constraint to the development of entrepreneurship is lack of funding. Small businesses
generally lack a long track record and are often unknown outside their local communities hence
they have been historically turned down by major banks for funding (Sharp et al. 2002). Credit
unions may be considered as an alternative solution to this problem. Credit unions are
community owned and democratically controlled financial organizations which differ from banks
in that they serve their membership and are committed to the development of communities,
largely because their future is also tied to the future of these communities (CCA 2007). Credit
unions have a long history of providing financial services in communities where other
mainstream financial organizations have found it unprofitable to do so. They are also
increasingly playing an important role in small business sector and are the second largest lender
to small businesses in Canada (CCA 2007; Lou Hammond and Brown 2009 ).
3.5 Credit Unions and Local Development
Credit unions are by virtue of their structure involved in local community development
initiatives. As community based organizations, credit unions can contribute together with other
regional or local organizations or individuals to creating a climate favorable for community
development. Credit unions generate local financial resources in communities. They offer the
same services offered by the conventional banks, but as community organizations their goal is
not to maximize profits but to provide services to their members and develop their communities.
These community development activities are directly linked to the basic activities that credit
unions pursue in their role as financial institutions — receiving deposits, placing loans and
investments. In this context, community development means innovative lending of funds to
individuals or businesses (Fairbairn et al. 1997).

46
As part of their business services, credit unions carry out commercial lending and small and
medium enterprise lending and they are also in lending partnerships with Business Development
Corporations (CCA 2007). Business Development Corporations, recently named Community
Development Corporations, are federally funded community development organizations that
provide loans and technical assistance to businesses in a region. Each partner provides a portion
of the risk of lending to a new enterprise.
In addition to the traditional lending some credit unions in the western provinces also engage
in micro-lending in partnership with the Western Economic Diversification Canada (WD), a
department of the Government of Canada. WD works in partnership with the provinces, industry
associations and communities to stimulate and encourage diversification of the western
economy, as well as to represent the interests of the West in national decision-making.
According to WD (2009), the micro-loan agreements established with credit unions are doing
extremely well. They provided 2,345 loans averaging about $14,000 and totaling $32.2 million.
These loans are made to very small and start-up businesses, with insufficient assets and credit
history to obtain traditional financing. The program has also had success in helping to develop
knowledge/technology-based, conservation and agricultural value-added companies.
Micro-lending program enhances credit access for those small business start-ups that have
difficulties in accessing traditional loans mainly because they have no credit history. This
program therefore encourages the growth of small and medium enterprises which generate
multiplier effects in terms of employment, income and population growth.
In Nova Scotia, the Nova Scotia Department of Economic and Rural Development has a joint
initiative program with the Nova Scotia Co-operative Council and Credit Union Central of Nova
Scotia, (on behalf of Credit Unions of Nova Scotia) that help businesses obtain financing to

47
establish new businesses, grow existing businesses and empower entrepreneurs with the support
they need to create employment for themselves and others. This program is delivered
exclusively through credit unions in Nova Scotia (Nova Scotia Department of Economic and
Rural Development 2009).
These examples show the importance of credit unions in small and medium enterprises a
sector which is becoming more and more important in the Canadian economy. Credit unions
having a larger network of branches in the rural areas than chartered banks might be better
placed to promote business growth and rural vitality.
According to Credit Union Central of Canada (CUCC 2008), the greatest strength of credit
unions is their local structure, their sense of community and their focus on individual as an
integral part of the community. This may place credit unions in a position where both place and
people centered approaches are combined and increases their ability to focus on community
development. Studies by McArthur et al. (1993) and Fairburn et al. (1997) highlight, that
community involvement is a key feature of credit unions and through their work they facilitate
and promote capacity building, strength and resilience within the community.
3.6 Conclusion
This chapter reviewed the literature on the history of Canadian rural areas development
process. Challenges facing rural areas were discussed. Policies and approaches that have been
used to address rural vitality were also reviewed. The last section looked at the perceived role of
credit unions in community vitality. Credit unions have been shown to work in partnership and
by themselves in promoting entrepreneurship growth.

48
Chapter 4: Theoretical Framework
4.0 Introduction
This chapter presents the economic framework for our model of population growth which we
use as a measure of community vitality. We use the model to include consideration of the role of
credit unions. The model developed here, will be used in the subsequent chapters to develop the
empirical implementation, and to estimate and analyze the econometric results.
4.1 Theoretical Framework
To investigate the link between credit unions and community economic development, this
study adopts the application of a neoclassical local growth model (Rappaport 2004b). This model
embeds the spatial general equilibrium framework that underlies compensating differential
theory (Roback 1982). The neoclassical local growth model helps us to interpret observed local
population growth determinants. It identifies the origin of possible shocks from which an
observed pattern of local growth can arise. The model focuses on the transition from one steady
state to another (Rappaport 2004b). This model has an advantage of complementing the
extensive New Economic Geography literature (NEG).9 NEG is particularly important in
indicating how a historical incident can shape economic geography, and how gradual changes in
underlying parameters can produce discontinuous change in spatial structure.
The spatial general equilibrium framework recognizes the interdependencies of household
and firm location choices as they respond to spatial differences in utility and profits. Individuals
are hypothesized to weigh both the pecuniary and non-pecuniary benefits of moving against the
alternative of remaining in their current locations. Firms similarly seek those locations that
maximize profits. In a growth context, shifts in exogenous factors or changes in the valuation of 9 The approach has been applied to the economics of cities, the emergence of regional disparities, and the
origins of international inequalities. NEG has also been used to try and answer why is economic activity distributed unevenly across space, with centres of concentrated activity surrounded by ‘peripheral’ regions of lower density?

49
these factors cause growth differences across regions. As the regions transition from one growth
path to another, wages and land rents adjust to move the economy towards spatial equilibrium
(Dumaias et al. 2002; Rappaport 2004b).
4.1.1 Household Location Decisions
A representative household (worker) located in region i is assumed to derive utility from
traded good (𝑋) and non traded housing 𝐻 . By living in the ith region, the worker also
consumes some fixed level of household amenities (Ah) as well as other exogenous factors (G).
The amenity and exogenous factors are taken as given by all potential residents. The utility
function for the worker is then given by:
U (X, H, Aih, Gi) (4.1)
The budget constraint requires that the combined costs of the composite good, available at
price p, and housing, available at rent r, do not exceed the wage income (w). Disposable
household income is determined by the economic conditions (econi) which contribute to
favorable economic opportunities in the community and the distances (disti) to the nearest urban
centers of various sizes that affect commuting access to urban jobs and urban amenities and
services. Access to diverse work opportunities, provided by a large urban, reduces
unemployment risk. Disaggregate favorable economic opportunities are represented by variables
such as the local employment rate and industry structure. The social factors (soci) such as crime
rates or poverty levels may affect tax rates. The indirect utility function is then given by:
V (w, r, p, Ah, Gi, econi, disti, soci) (4.2)
Favorable economic conditions contribute to the probability of access to economic
opportunities. These include earning levels, the probability of finding a job and access to a high
performing economy. Economic conditions have long been considered a major factor driving

50
population movement. Within this literature wages, income, industry mix and unemployment
rates have been used to proxy employment opportunities and income differentials (Renkov and
Hoover 2000).
Distance is an exogenous component that affects access to agglomeration economies and the
availability of urban services. Utility maximization location choices include consideration of
services and markets such as those related to urbanization including diverse consumption
opportunities only available in higher tiered urban areas and a more active social environment
(Glaeser 1997).
Amenities can be defined as location-specific, non-traded attributes of a region or local area
(Scorsone et al. 2001). Amenities help define the character and quality of life of a local
economy. They depend on both a fixed level of natural amenity stocks and fiscal amenities, both
of which could be driving forces in the distribution of population. Natural amenities are those
goods and services that are part of the landscape, such as climate, topography and water access.
Although they are natural to a region, human activities may play a major role in their subsequent
quality and quantity through production and consumption. Fiscal amenities differ from natural
amenities in that they have an explicit cost (taxes and fees) and are a result of human activity.
Social factors include those variables that make community desirable and safe to live in.
Most studies have used measures of social capital to reflect on these social factors. We would
expect less out-migration from socially desirable places, hence higher population retention and
growth in such communities.
In the short run, workers maximize utility by relocating to communities that provide the
highest possible level of utility net the cost of moving. Disequilibrium population flows reveal
geographic utility differentials that capture all dimensions of preferences. Long run equilibrium

51
requires equalization of household utility across regions. Utility differentials may exist in the
short to medium run, owing to household relocation costs as well as information constraints, and
ongoing shocks (Partridge and Rickman 1996).
4.1.2 Firm Location Decisions
Firms are assumed to be profit maximizers with the following production function for the
composite commodity, X:
Xi = f(LBi, Li, Ni, Aif, Gi) (4.3)
Where (LBi) is labor, (Li) is land, (Ni) represents intermediate inputs into production, (Aif) is
the fixed level of firm amenities and (Gi) are the other exogenous factors of the region. The
firm’s objective is to maximize profit subject to input costs used in the production, land rents
costs and labor costs. Also constraining the firms is the distance (disti) from various sizes of
urban centers representing access to inputs and markets. The presence of credit unions represents
access to, and cost of business loans. The indirect profit function, 𝛱i is thus given by:
𝛱i (w, r, n, Aif, Gi, CUi, disti) (4.4)
Where (w) are the wages, (r) is the land rent, (n) are the input costs, (Aif) is the fixed level of
firm amenity stocks, (Gi) are the other exogenous local factors that may include physical
infrastructure and other public goods, (CUi) represents the presence of credit unions and (disti) is
the exogenous distance component that affects access to agglomeration economies and access to
higher order services and specialized labor pools.
Agglomeration economies affect firm’s profit levels through: a) localization economies;
where proximity with other firms within the industry allow the exchange of non-tradable inputs,
labor market pooling and information spillovers that enhance workers productivity; and b)

52
urbanization economies where the size of population enhances access to large markets and public
resources.
Proximity to suppliers of intermediate inputs and customers also lowers transport costs and
increase the market potential. This in turn creates the home market effects where internal returns
to scale in production and greater market potential produce a competitive advantage (Venables
1996). Distance to the nearest urban centre, whether large or small, is associated with access to
agglomeration economies for local area’s firms (Hanson 2005). Being in or near a major urban
centre is also critical for firms most reliant on higher ordered services and specialized labor
pools.
Labor factors like skilled labor pools are associated with higher worker productivity, though
they might increase wages. Higher labor force participation rates lower the firm’s labor search
costs and enhance skill matching. Other local factors may affect the profit levels of a firm for
example, higher levels of public capital in infrastructure lower costs levels for the firms, and
presence of natural assets like water which may be used in the production process also help to
reduce costs.
Credit unions, which are considered as an exogenous asset in this study, are expected to
lower the transaction costs of accessing business loans and advice. Credit unions have a mandate
to support communities they operate in. They are better positioned to make use of personal and
community information in processing loan applications. In this regard credit unions are able to
mitigate against information asymmetry banks face. In addition the business mentorship and
follow-ups that credit unions offer to loan beneficiaries’ help lower the risk of loan defaults
associated with small and upcoming business start-ups.

53
The effect of amenities on firms depends on the nature of the amenity in question. The
amenity may be unproductive, for example clean air that firms may spend resources on non-
polluting technology. In this case, ceteris paribus, wages in these areas would need to be lower
to equalize costs with other regions. Alternatively if the amenity is productive, for example, lack
of severe snow storms firms may be prepared to pay high wages, ceteris paribus.
In the short run lower costs (or higher profitability) in region i relative to the national average
induce a subsequent net movement of firms into i and corresponding expansions or contractions
by existing firms. Long run equilibrium dictates the equalization of regional profit levels.
4.1.3 Equilibrium
The model represented above is a static model. Movements of firms and population occur
instantaneously in response to utility or profit differences resulting from exogenous changes.
Households and firms compete for a fixed number of sites in each area, with households seeking
to maximize utility and firms attempting to maximize profits through locational choices. If the
agents face no informational or mobility-related transactions then this model implies that given a
fixed distribution of amenities and other exogenous factors, households would prefer higher
wages, lower rents and higher amenity areas. Firms would prefer lower cost, lower wage, lower
rent areas, while the effect of amenity on firms depends on the nature of the amenity in question.
In the spatial allocation problem, households and firms cannot all occupy the same space
even if their preferences are identical. Wages and land rents will vary across locations in order to
equilibrate with household utility maximization and firm profit maximization objectives. Hence,
in the static equilibrium, areas with favorable household amenities are associated with lower
nominal and real wage rates,10 higher labor supply and greater demand for housing (higher
rents). Favorable amenities compensate household for lower real wages. Areas with favorable 10 Favourable amenities attract households, increasing labour supply and decreasing wages.

54
firm conditions have higher nominal wage rates as firms are compensated with other lower
production costs.
The long run equilibrium dictates interregional utility and profit maximization, but not
necessarily equal nominal or real wages or equal land or housing prices, since they may reflect
compensating differentials for amenities (Partridge and Rickman 1997). Small changes in
underlying firm and household parameters can take a long time in the adjustment process to
equilibrium due to moving costs, costs of obtaining information, and ongoing shocks.
4.2 The General Equilibrium Involving Credit Unions
Taking credit unions as exogenous financial organizations in a community, we would expect
their presence to reduce transaction costs for firms and potential entrepreneurs with respect to
accessing business loans and advice as well as availability of micro-loans and economic
community loans to those business that fall out of traditional lending. Areas with credit unions
would then attract more firms, enable more small business start-up by entrepreneurs and
expansion of the existing firms. Because firms cannot occupy the same space even if their
preferences are the same, communities with more credit unions would be expected to have
higher land rents and wages rates. Firms can pay these higher land rents and wages rates because
they are compensated by lower transaction costs in accessing business loans and advice.
Figure 4.1 illustrates the respective utility and profit levels resulting in the market clearing
conditions for wages and rents at a given level of credit union activity in a community. The
downward sloping curves show the isoprofit curves. The upward sloping curve (V) represents
the isoutility curve for the households.

55
Figure 4.1: The General Equilibrium Model for Varying Levels of Credit Union Activity
The higher the rent encountered by households, the higher the wages they will have to
receive in order to maintain the same level of utility.
Suppose the presence of credit unions enhances firm profits through lowering transaction
costs for business loans and business advice where 𝛱<𝛱*. Credit union activity increases the
profit levels from 𝛱 to 𝛱*, land prices measured by rent increase from R to R*, whilst wages
increase from W to W*. Where credit unions reduce transaction costs, firms are now able to pay
higher wages and rents as they are compensated by lower transaction costs. Of course, when
transactions costs are added to wages and rents, ‘full-cost’ profits (total revenue-(wages + rents +
transactions costs)) will be equalized across communities.
4.3 Application of the General Equilibrium Model
The Roback (1982) model can be modified to show labor market disequilibrium that follows
from the differences in credit union activities in rural communities. As discussed earlier credit
union activities help to promote the development and expansion of businesses through increased
access to business loans and advice. Assuming that the credit union presence lowers transaction
Rent
Wages
𝛱
V
R*
** R
W*
𝛱*
W

56
costs in communityi, this might result in the influx of more firms into that community. As more
firms choose the community where the credit unions are present, labor demand increases,
bringing in more households units. On the other hand, where communities are in long-term
decline, the presence of transaction-reducing credit unions may slow the rate of decline. Figure
4.2 illustrates these shifts in labor demand.
Figure 4.2: General Equilibrium Model Application to Labor Market
The influx of firms and expansion of firms into a community with lower transaction costs
shifts the demand for labor from D0 to D1 and a respective increase in wage levels from W0 to
W1. Higher wages, ceteris paribus, will attract more labor into a community to take advantage of
these economic opportunities. The respective quantity of labor supplied increase from L0 to L1.
The new higher employment levels in the community would lead to a higher population level for
a given age distribution and labor force participation rate. If increased credit union activity
contributes significantly to business growth, we would expect population growth in the
community through the impact on labor demand and supply.
D1
W0
W1
S
Labor
Wages
D0
L0 L1
57
If a new credit union is established in community i, it is posited to create a disequilibrium11
which might lead to increased labor demand due to influx of firms and expansion of the existing
ones. This pushes nominal wage rates up in communityi , along an upwards sloped short run
labor supply curve, S. These higher wage rates increase the quantity of labor supplied through
increased labor force participation rates and in-migration. Given lags and incomplete migration
responses, labor demand shifts may produce higher wages rates, lower unemployment rates and/
or increased labor force participation rates for an extended period. In a cross-sectional sense,
communities where credit unions lead to lower transaction costs would be expected to support
higher levels of employment and population compared to communities without credit unions,
ceteris paribus.
To empirically implement equations (4.2) and (4.4) the assumption is made that the
percentage population change (%∆popi) between periods 1996 and 2006 is a reduced form
function12 of xi,96, which are the community initial period characteristics: %∆popi(06-96) =
f(xi,96).13A residual term is added and it is assumed that f (.) is a linear function βxi,96, in which β
represents the regression coefficients for the x variables. The individual β terms can be
interpreted as the expected percentage change in population when an individual x variable
changes by one unit.
4.4 Summary
This chapter provided the theoretical framework for the analysis of population dynamics. It
has been shown that these population dynamics can be explained by the interdependencies that
11 The disequilibrium is created by lower transaction costs, which would be expected to support a higher level of
business activity, employment and population. 12 The equations 4.2 and 4.4 are simultaneously solved. 13 Cross sectional regressions of population growth on local characteristics has been shown that they help to
identify past and present changes in the contributions of local characteristics to representative agent welfare (Rappaport 2004b).

58
exist between household utility maximizing decisions and firm profit maximizing decisions in
the local growth context. A shift in any one of the exogenous factors results in population
movements for an extended period of time. Credit unions, to the extent that they reduce
transaction costs, may be expected to positively influence population growth and retention.
59
Chapter 5: Empirical Implementation
5.0 Introduction
This chapter describes the empirical implementation of the theoretical model presented in
chapter 4. The econometric models that were used for estimation, data sources and variables
used, and their meanings are also presented and explained. A priori expected regression signs are
indicated based on the economic theory and literature.
5.1 Implementation
The analysis is restricted to the rural and small towns (RST) in Canada. Statistics Canada
(2001) defines rural and small town population as all that population that lives outside the main
commuting zone of larger urban centers (10,000 people or more). The metric for ‘growth’ of
rural communities in this study is the ability of rural communities to retain and attract population
through net migration. Net migration is the vehicle by which households respond to economic
incentives and access to other non-economic attributes of an area.
Changes in local productivity and/ or quality of life in community i, are expected to
subsequently lead to population flows in response to those changes and that may persist over
several years (Rappaport 2004b). The changing spatial distribution of the population is a
reflection of people ‘voting with their feet’. Thriving communities are in a better position to
retain and attract population, relative to communities that suffer from depopulation.
Cross sectional regressions of population growth on local characteristics can help to identify
past and present contributions of such characteristics. Because of data constraints we cannot
measure the actions of specific households with respect to their location decisions over a period
of time. However, revealed preferences through population change (migration decisions) allow
us to examine the influence of the characteristics of the community in experiencing net gains or

60
losses in population. The assumption is that the average levels of local characteristics constitute a
representative agent household’s access to these characteristics (Rappaport 2004b; Partridge et
al. 2007).
Population change is measured over the period 1996-2006. The 10 year time period is
considered long enough to represent long run population, firm and capital movements and to
avoid contamination by short term idiosyncratic changes (especially in rural small communities).
The period is also long enough to help ensure that the (1996) initial explanatory variables are
predetermined, avoiding direct endogeneity bias in the estimated coefficients where the residual
term could be correlated with the initial period control variables. These periods also coincides
with 1996 and 2006 censuses.
Census Consolidated Subdivisions (CCSs) are the units of observation in this study. A CCS
can be defined as a functional economic area that is used for the provision of services.14 A CCS
is taken to represent a community and only rural CCSs are considered in this study. Seven
Canadian provinces (excluding the Northern territories): Saskatchewan; Nova Scotia; New
Brunswick; Alberta; Manitoba; Prince Edward Island; and British Columbia were used in this
study.15
5.1.1 Empirical specification
The specification is a cross sectional reduced form model that includes credit union variables,
exogenous variables that include natural amenities and distances, and demographic variables
14 The foundation of Canadian statistical units is the CSD, which is usually an incorporated urban or rural town
or municipality (Du Plessis et al. 2002). CSDs however do not form functional economic units for example, on the prairies, a town or village form a CSD, while the surrounding rural municipality forms another CSD. Statistics Canada merges the two into a CCS which is more similar to a ‘community’.
15 We had credit union data for these seven provinces and northern territories were excluded because of data limitations on most variables including the credit union data.

61
while, allowing for economic, human capital and the social factors that influence labor demand
and supply.
The dependent variable is the percentage change in population between the initial period
(1996) and 2006. The empirical model for CCSi located in province, pi is therefore given as
%∆Popip (06-96) = α + β1CUdummyip+ β2Geoip+ β3Amenityip, 96 + β4Demogip,96 + + β5Socip,96 +
β6Econip,96 + δProvp + eip(06-96) (3)
CUdummy is the credit union dummy to account for the presence or absence of a credit
union in a community. One represents the presence of a credit union while zero represents the
absence of a credit union. Geo, Amenity, Demog, Soc and Econ are vectors that represent the
geographic location of a CCS (in relation to different urban sizes as measured by distances),
amenities, demographic factors, social factors, and economic factors respectively. The regression
coefficients are α, β1, β2, β3, β4, β5, β6, and δ. Provp is a vector of zero-one provincial dummies
to capture the provincial fixed effects to adjust for common factors within a province and e is the
error term. The possibility of autocorrelation was adjusted for by the use of cluster command on
census division (CD).16
Credit unions are assumed to be transaction cost reducing organizations with respect to
access to business loans and advice (through mentorship and follow-ups) that enhances firms’
viability. It is the initial period credit union presence that is assumed to affect subsequent growth
of a community. Lower costs may be positively related to community firm and business
retention and growth. The presence and growth of local firms supports local demand for labor,
reflected in wage levels. Availability of business loans as well as mentorship and follow-ups are
16 Statistics Canada defines a Census division as a group of municipalities joined together for the purposes of
regional planning and managing common services. CDs are intermediate geographic areas between the provinces or territory level and the municipality (census subdivision) accessed at http://www12.statcan.ca/english/census06/reference/dictionary/geo008.cfm on 08-11-09.

62
also assumed to nurture the growth of local entrepreneurship (and the growth of small business
start-ups) as financial barriers are expected to be lowered by these local financial organizations.
A positive effect on population change is therefore expected through the labor demand by firms
and household migration to capitalize on these opportunities. Most rural communities in Canada
are facing long term decline. Thus the expected ‘positive’ relationship would translate into lower
rates of decline, perhaps through reducing out-migration.
The Geog vector focuses on how the geographical location of a CCS in relation to urban
centers affects its growth. This vector contains several measures of proximity to urban areas of
various sizes. The first measure is distance to the nearest urban center of any size. CCSs that are
accessible to an urban center could grow faster due to urban sprawl, suburbanization and input-
output linkages. Some of the anticipated growth likely results from commuting access.
Commuters are comprised of both urbanites avoiding urban congestion and other negative
externalities like pollution and crime by choosing to relocate to a rural residence whilst
maintaining their jobs in the urban, and rural residents choosing urban employment but still
maintaining their rural place of residence.
In addition rural areas near urban centers may be attractive locations to firms seeking lower
land rents but still maintaining input-output linkages with the urban center. For households,
recreational opportunities in rural areas near urban centers are another reason for possible spatial
spillovers of urban centers.
Incremental distances to the nearest medium sized urban center and large sized urban center
are also included in the geographic vector to capture how the spatial location of a CCS in the
63
entire urban hierarchy affects its growth.17 In the context of central place theory lower tied places
depend on higher tied places for access to progressively higher ordered goods and services
offered at each tier. The two incremental distance variables included are expected to reflect
additional penalties (or benefits) a household or business encounters because they incur costs to
access the agglomeration economies represented by progressively higher ordered urban centers
(Partridge et al. 2008).18
Demog vector contains variables that represent the market potential of a CCS. The first
variable included is the own population of the CCS (community population) in the initial period
(1996). This variable measures the local market potential of a community. On the supply side
scale economies can be achieved when increased level of demand is present at a given location
(Wensley et al. 1998). The second variable included is the population of the nearest urban center
that represents surrounding market potential.
Closely related to these two market potential variables is the measure of entrepreneurship in
the CCS. The entrepreneurial process is one where the entrepreneur recognizes and acts on an
unexploited opportunity. Opportunity may be related to the presence and size of market
potential. Further, population density may contribute to knowledge creating institutions,
networks and venture capitalists (Zoltan and Attila 2005). If knowledge spillovers are important
in new firm formation and firm growth then we should expect that they should be more easily
identified in places where many people are concentrated. Larger markets enhance business start-
ups as well as expansion of the existing businesses. Thus, the share of people who are self-
17 For the purposes of this study medium sized urban centers are defined as having population size of between
10,000 and 499,000 and large sized urban centers have population greater than 500,000. This also follows from the studies by Partridge et al. 2007.
18 Incremental distances are calculated by subtracting the distance of the nearest urban center from the distance to a respective urban center.

64
employed, is included in this vector as a proxy measurement for the entrepreneurship spirit in the
community.
In sum Geog and Demog variables jointly reflect agglomeration factors including those
stressed by the new economic geography. It is expected that growth ‘spreads’ out from the urban
center where most of the economic activity is concentrated into the rural fringe (Henry et al.
1997). Communities more proximate to urban centers may be more attractive in terms of
economic strength and quality of life. However, it is also possible that urban growth lures people
and businesses from the more distant rural periphery, creating a ‘backwash’ effect.
Distance variables are expected to have a negative sign as they impose increased costs of
accessing higher tier services and transport costs to larger markets, amenities, as well as
commuting access for the households. Knowledge spillovers that might be closely linked to
entrepreneurial activities tend to decrease as distance increases from the core of economic
activity. Population sizes are expected to have a positive sign as they represent market potential.
Greater market potential attracts firms and promotes the entrepreneurship spirit in the CCS. The
share of people who are self-employed is expected to have a positive relationship with
population growth. Entrepreneurs generate job opportunities, improving the economic
attractiveness of the local area.
The Amenity vector reflects natural location advantages including natural topographic and
climatic variables. In the United States natural amenities have been shown to exert a major
influence on local population growth (Deller et al 2001; Rappaport 2004a). Standard deviation of
CCS elevation is included here to represent the degree of variation in terrain. Mountains and hills
are hypothesized to be a desirable topographical feature that enhance recreation and provide
pleasurable scenery for residents. The share of the total area comprised of water is also included

65
to capture the effect of landscape. People are posited to prefer a varied landscape for recreation
and scenery. Other climatic variables included are annual precipitation (mm), annual snow fall
(cm) and mean January temperature (oC). Favorable climatic factors are assumed to make
communities attractive to households. Households tend to avoid areas with both extremes in
favor of the moderate climatic conditions. We would expect negative signs for snow fall and
precipitation. January temperature is expected to have a positive effect on population growth.
The economic vector contains those factors that reflect the economic strength of the
community: employment rate; an income measure; industry mix; and industry diversity. The
employment rate measures the economic opportunities for households in terms of probability of
finding a job. A high initial employment rate will, everything else constant, make a community a
more attractive location for households. A positive sign is expected for this variable.
Earnings per hour are included to reflect the income attractiveness of the community to
households. A positive sign is expected for this variable. The industry mix is represented by the
share of population employed in agriculture, manufacturing and other primary industries.
Industry mix is important because some industries (service sector in particular) are growing more
rapidly at the national level than the primary sector. Most of the communities that depend on
primary industries have been experiencing population loss as more labor has been replaced by
capital and the service sector is becoming an increasingly important sector in the global
economy. A negative sign is expected on the agriculture and other primary sector employment
shares. The sign on the share of manufacturing is ambiguous.
The Herfindahl index coefficient accounts for presence (or lack) of industry diversity. A
more diversified economy offers more stable and more diverse employment opportunities;
diversity cushions the economy from adverse economic shocks. Lower values of this index

66
represent industry diversity, while higher values represent industry concentration (lack of
diversity). We would expect the index to be inversely related with population growth.
Also included in this vector is a measure of human capital endowment. The share of the
population with a university degree is used as a proxy measurement for human capital. A more
educated workforce is expected to attract more idea-oriented jobs or businesses (Simon and
Nardinelli 2002). Skilled labor likely results in higher productivity levels which are expected to
make the community more attractive to firms. However, it may also signal higher wages which
repels firms. A positive sign is expected on this variable assuming the positive effects more than
offset the potential negative effects.
The social vector contains a set of variables to reflect factors that make a community safe
and desirable to live in. Variables included in this vector include the share of population living
below the income cutoff, crime rates and the share of population living in own dwellings.
Households tend to avoid communities with large shares of population living below the income
cutoff as these communities may be linked with social unrest and lower public services access. A
negative sign is therefore expected for this variable. The share of population living in own
households reflects the commitment of the population to the community by investing in property.
A positive sign is therefore expected for this variable. Crime rates are expected to the inversely
related to population growth.
Provp, the provincial dummies are included to control for differences in the historic,
legislative, institutional characteristics and policy differences that exist among provinces. When
fixed effects are included, the other regression coefficients are interpreted as the average
response for within province changes in explanatory variables.
67
5.1.2 Data Sources
Population data were obtained from the 1996 and 2006 Statistics Canada census of
population (CoP) for the 696 rural CCSs in the seven provinces that were part of the study.
Economic and some social variables used were from the 1996 constant boundaries available
through Canada Rural Economy Research Lab (CRERL) special tabulation. Climatic and
environmental variables were adopted from the Environment Canada (EnviroCan) and Natural
Resources Canada (NRC) and were geo coded by CRERL. Distance and population of the
nearest urban center variables were made available through CRERL. All the data are aggregated
to the CCS level, which represents a community for the purpose of this study.
Acquiring credit union data was a challenge for this study. Ideally credit unions would be
represented by measures such as branch locations, asset size, loan and deposit size and
membership size in 1996 to enable analysis of the subsequent impact of credit unions on
communities. Initially letters were sent out the Credit Union Central of Canada (CUCC) and we
were referred to the provincial credit union centrals partly because in Canada credit unions are
provincially regulated and partly because the kind of information we were asking for fell out of
the jurisdiction of the national central.
When we contacted the provincial centrals the only kind of information available was at the
aggregate level by credit union. There was no disaggregation to the community or by branch.
The main branch of a credit union may be located in one community, while its branches may
appear in many other communities. The available data attributed all the credit union
characteristics to the community of the main branch hence this data was of little use to this study.
Efforts to contact individual credit unions were also fruitless as most credit unions were in the
middle of upgrading their banking system and could not be available to participate in the study.

68
Finally, we resorted to the presence or absence of credit unions in the community to represent
credit union activity. Even with this level of data we faced some problems in collecting it from
some of the provincial centrals. Two of the centrals referred us to the public websites where we
manually recorded the location of credit unions by postal codes. The problem with using
websites was they reflected the current locations of credit unions (for the two provinces) not the
desired 1996 locations as with the five other provinces. Considering the large number of credit
union mergers that have occurred in the last few years this might not be representative of the
initial year (1996) measures necessary to avoid direct endogeineity.
Appendix C summarizes a list of variables, description of variables and source of the
variables used in this study.
5.1.3 Estimation
We employ a staged estimation process beginning with the most parsimonious cross sectional
growth specification model. This staged estimation is used to assess whether potential
multicollinearity and endogeneity are affecting the key results. The initial parsimonious model
includes only the presence or absence credit union dummy and the variables that are clearly
exogenous. The latter are the geographic vector (distance variables), the amenity vector (natural
amenity variables) and the provincial fixed effects. The initial stages of estimation ideally avoid
any endogeneity concerns because the variables are exogenous. We acknowledge the fact that the
credit union dummy for two provinces reflects the 2009 situation. If there has been a change
between 1996 and 2006 in this variable, using 2009 violates this assumption.
The second model adds the demographic variables to the parsimonious model to assess the
influence of the market potential variables. The subsequent models include social and economic
variables in stages. The staged estimation allows for the comparison of the models with more

69
complete models of rural growth. These estimations will be used to assess robustness of the
results to alternative possible causes of population change like the economic conditions or
econometric concerns regarding omitted variables (multicollinearity or endogeneity). In this
staged estimation the third model will add the social variables to Model 2 and the fourth model
(the Full Model) will include all variables.
Robustness will be assessed in one or more of the following ways: 1) use of goodness of fit
as represented by adjusted R-squared values; 2) level of significance of the individual
explanatory variables as measured by the coefficient t statistic; 3) assessing whether groupings of
variables are jointly significant as represented by F statistic; and 4) assessing if the individual
variables exhibit the direction of influence on the dependent variable as predicted by theory. A
consistent pattern across these four stages of estimation would be strong evidence that the
findings are not artifact of a particular specification.
5.1.4 Potential Econometric Problems
In conducting regression analysis several fundamental assumptions are made: 1) the
relationship between the independent and the dependent variables is linear; 2) regression
variables disturbances are normally distributed; 3) variables are homoscedastic; 4) variables are
measured with no error; and 5) there is no exact linear relationship between the independent
variables.
When these fundamental assumptions are not valid, the prediction and the estimation model
may be biased and the estimation cannot become asymptotically consistent. When residuals are
not normally distributed it becomes hard to determine where the level of significance or rejection
begins and the estimation of significance become impaired (Gujarati 2004). If observations are
not independent, errors can manifest themselves in terms of residual autocorrelation which can

70
further bias the estimation of significance tests as the error variance becomes artificially
compressed by residual correlation, R2; F and t values become inflated too. When variables are
heteroscedastic, though ordinary least squares estimation is unbiased and consistent, the standard
errors are biased and cannot be used for inference (Greene 2008). Violation of these assumptions
therefore can predispose output toward false statistical significance.
Though the use of the initial period (1996) values of the explanatory variables in the model
mitigates against potential direct endogeneity, it is possible that there could be an autocorrelated
process in which past migration (or shocks) affects both the current residual term and the initial
explanatory variable. Such a process could lead to biased estimates since the residual term and
the explanatory variable will be correlated. Likewise there could be omitted variables that are
correlated with both the initial level of the explanatory variables and the subsequent residual
term creating an endogeneity bias. These concerns are assessed by the use of staging estimation
that was discussed in section 4.1.3. This process helps to disentangle the causal effects and to
assess possible endogeneity. However, controlling for the additional explanatory variables will
likely increase problems related to multicollinearity and or endogeneity.
It is likely that there is spatial autocorrelation19 that exist between adjacent CCSs. To
mitigate against this potential problem a cluster command is specified in the estimation.
Clustering is done by census division (CD). Each function is thus regressed on its own subset of
data with a much smaller residual error. This process produces robust t statistics that adjust for
spatial clustering of the error term within a census division. In summary clustering allows for
differences in the average level across provinces in addition to adjusting the standard errors
taking into account the specific intra group correlation.20
19 Autocorrelation is highly associated with cross sectional data. It is often referred to as spatial autocorrelation. 20 This type of regression can be called spatial regression.

71
5.2 Conclusion
The implementation of the empirical model is based on the theoretical model presented in
chapter four. Data availability guided the particular variable choice. Potential problems and
means to mitigate them were recognized. In the next chapter results of the estimation will be
presented and discussed, starting with the descriptive statistics and following will be the
econometric analysis.
72
Chapter 6: Results and discussion
6.0 Introduction
This chapter presents the results of the study. First some descriptive statistics are presented,
and then the econometric results. The results are presented with respect to the staged estimation
discussed in the previous chapter. Hypothesis test results are also presented and post estimation
tests are presented and discussed, along with various sensitivity results.
6.1 Descriptive Statistics
The sample included 696 rural CCSs. Omitted from the sample are CCSs in the northern
territories and Yukon, urban CCSs and some CCSs that had missing data on most of the
variables. Urban CCSs include all population living in the urban cores, secondary urban cores
and urban fringes of census metropolitan areas (CMAs) and census agglomerations (CAs)21
(Statistics Canada 2002). Figure 6.1 shows the distribution of the credit unions in rural Canada
included in this study by province.
Four of the provinces: Nova Scotia (NS); Saskatchewan (SK); Alberta (AB); and British
Columbia (BC) have credit unions in the majority of their rural CCSs. The respective
percentages of the CCSs with credit unions for these provinces are: 68; 70; 70; and 81. Prince
Edward Island (PEI), New Brunswick (NB) and Manitoba (MB) have lower concentrations of
their rural CCSs with credit unions and their respective percentages are 14, 16 and 2.
21 A census metropolitan area (CMA) or a census agglomeration (CA) is formed by one or more adjacent municipalities centred on a large urban area (known as the urban core). The census population count of the urban core is at least 10,000 to form a census agglomeration and at least 100,000 to form a census metropolitan area. To be included in the CMA or CA, other adjacent municipalities must have a high degree of integration with the central urban area, as measured by commuting flows derived from census place of work data.
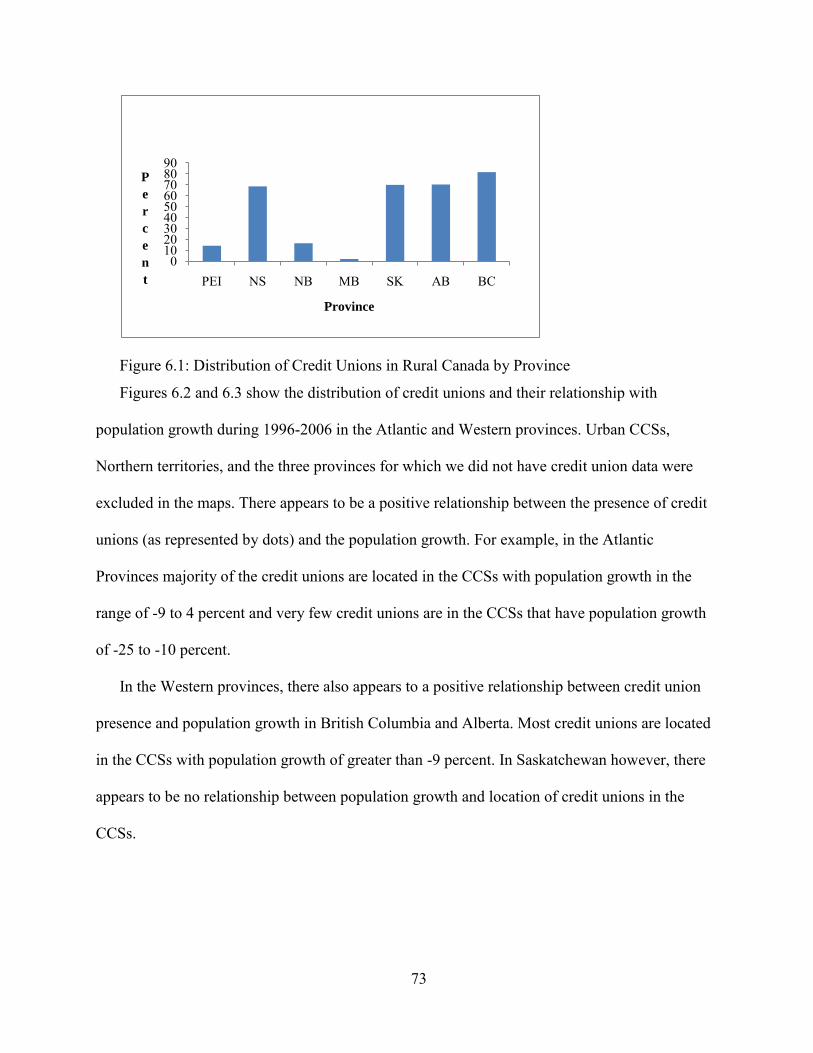
73
Figure 6.1: Distribution of Credit Unions in Rural Canada by Province
Figures 6.2 and 6.3 show the distribution of credit unions and their relationship with
population growth during 1996-2006 in the Atlantic and Western provinces. Urban CCSs,
Northern territories, and the three provinces for which we did not have credit union data were
excluded in the maps. There appears to be a positive relationship between the presence of credit
unions (as represented by dots) and the population growth. For example, in the Atlantic
Provinces majority of the credit unions are located in the CCSs with population growth in the
range of -9 to 4 percent and very few credit unions are in the CCSs that have population growth
of -25 to -10 percent.
In the Western provinces, there also appears to a positive relationship between credit union
presence and population growth in British Columbia and Alberta. Most credit unions are located
in the CCSs with population growth of greater than -9 percent. In Saskatchewan however, there
appears to be no relationship between population growth and location of credit unions in the
CCSs.
0102030405060708090
PEI NS NB MB SK AB BC
P
e
r
c
e
n
t
Province

74
Figure 6.2: Credit Union Distribution and Population Growth in the Atlantic Provinces
Source: Canada Rural Economy Research Lab www.crerl.usask.ca
Legend % Population
change -40--26 -25--10 -9-4 5-19 20-35
Represents 1 credit union branch

Legend % Population change
-40--26 -25--10 -9-4 5-19 20-35
Represents 1 credit union branch
Figure 6.3: Credit Union Distribution and Population growth in the Western Provinces
Source: Canada Rural Economy Research Lab www.crerl.usask.ca
75
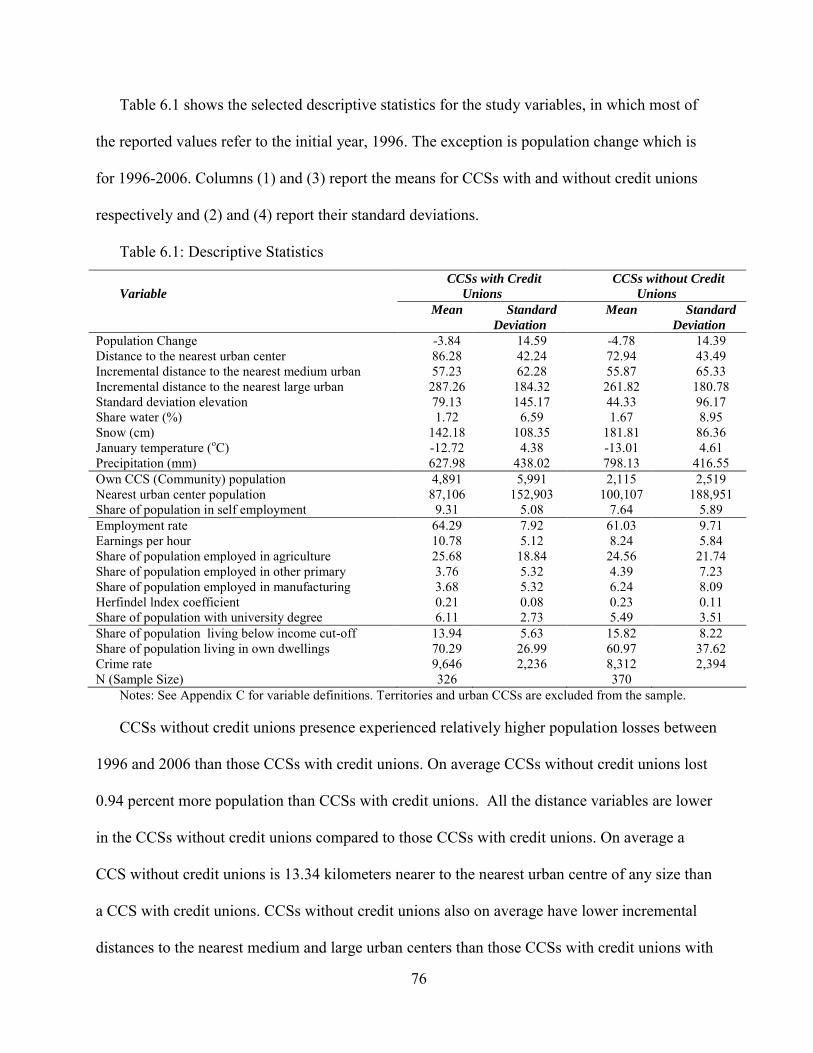
76
Table 6.1 shows the selected descriptive statistics for the study variables, in which most of
the reported values refer to the initial year, 1996. The exception is population change which is
for 1996-2006. Columns (1) and (3) report the means for CCSs with and without credit unions
respectively and (2) and (4) report their standard deviations.
Table 6.1: Descriptive Statistics
Variable
CCSs with Credit
Unions
CCSs without Credit
Unions
Mean Standard
Deviation
Mean Standard
Deviation
Population Change -3.84 14.59 -4.78 14.39 Distance to the nearest urban center 86.28 42.24 72.94 43.49 Incremental distance to the nearest medium urban 57.23 62.28 55.87 65.33 Incremental distance to the nearest large urban 287.26 184.32 261.82 180.78 Standard deviation elevation 79.13 145.17 44.33 96.17 Share water (%) 1.72 6.59 1.67 8.95 Snow (cm) 142.18 108.35 181.81 86.36 January temperature (oC) -12.72 4.38 -13.01 4.61 Precipitation (mm) 627.98 438.02 798.13 416.55 Own CCS (Community) population 4,891 5,991 2,115 2,519 Nearest urban center population 87,106 152,903 100,107 188,951 Share of population in self employment 9.31 5.08 7.64 5.89 Employment rate 64.29 7.92 61.03 9.71 Earnings per hour 10.78 5.12 8.24 5.84 Share of population employed in agriculture 25.68 18.84 24.56 21.74 Share of population employed in other primary 3.76 5.32 4.39 7.23 Share of population employed in manufacturing 3.68 5.32 6.24 8.09 Herfindel lndex coefficient 0.21 0.08 0.23 0.11 Share of population with university degree 6.11 2.73 5.49 3.51 Share of population living below income cut-off 13.94 5.63 15.82 8.22 Share of population living in own dwellings 70.29 26.99 60.97 37.62 Crime rate 9,646 2,236 8,312 2,394 N (Sample Size) 326 370
Notes: See Appendix C for variable definitions. Territories and urban CCSs are excluded from the sample.
CCSs without credit unions presence experienced relatively higher population losses between
1996 and 2006 than those CCSs with credit unions. On average CCSs without credit unions lost
0.94 percent more population than CCSs with credit unions. All the distance variables are lower
in the CCSs without credit unions compared to those CCSs with credit unions. On average a
CCS without credit unions is 13.34 kilometers nearer to the nearest urban centre of any size than
a CCS with credit unions. CCSs without credit unions also on average have lower incremental
distances to the nearest medium and large urban centers than those CCSs with credit unions with

77
respective distance differences of 1.36 and 25.44 kilometers. The set of incremental distances to
successively higher tier places shows that CCSs with credit unions are more remote from the full
urban hierarchy. The average CCS with a credit union is located 431 kilometers from the urban
hierarchy, while the average CCS without a credit union is only 391 kilometers removed from
the urban hierarchy.
The measures of natural amenities were relatively favorable (in terms of population
movements’ literature) in the CCSs with credit unions than the ones without credit unions. On
average CCSs with credit unions receive about 40cm less snow and about 170mm less
precipitation than the CCSs without credit unions, though the standard deviations are relatively
higher for these variables implying greater variability within both the CCSs (with and without
credit unions). CCSs with credit unions have on average 0.3 more degrees of January
temperature and 0.05 percent more share of water than the CCSs without credit unions. The
standard deviations for these two variables are lower implying little variation.
Two of the demographic measures, share of self employed population and own CCS
(community) population were higher in the CCSs with credit unions, while population of the
nearest urban is higher in those CCSs without credit unions. CCSs with credit unions have on
average 1.7 percent more share of population that is self employed than the CCSs without credit
unions. On average CCSs with credit unions have more than double the own CCS (community)
population compared with those CCSs without credit unions. This is likely a reflection of the fact
that the smallest rural communities are not large enough to support any financial organization.
The threshold size population for the presence of a credit union would be near 5,000 (Wensley
and Stabler 1998). Population of the nearest urban centre for CCSs without credit unions is

78
13,000 more than that of CCSs with credit unions. The standard errors for the population
variables are very high, implying a lot of variability.
The economic measures are relatively conducive for population growth in CCSs with credit
unions compared to those without credit unions (in terms of population growth literature), with
the exception of share of population employed in agriculture that is relatively higher in CCSs
with credit unions. The share of population employed in other primary industries is about 0.6
percent more in the CCSs without credit unions than CCSs with credit unions, while earning per
hour are about $2.50 more in the CCSs with credit unions than those CCSs with no credit unions.
All the three social variables are also relatively favorable in the CCSs with credit unions
compared with those without credit unions. CCSs with credit unions have about 1.9 percent less
population living below the low income cut off compared to CCSs without credit unions and
about 9.3 percent more of the population that live in own dwellings compared to those CCSs
without credit unions. On average CCSs with credit unions are socially desirable compared to the
CCSs without credit unions (in terms of population growth literature).
Based on the descriptive statistics on average CCSs with credit unions are better placed to
retain and attract population than the CCSs without credit unions. They fare well for all the
natural amenity, social factors and economic variables with the exception of one (share of
population in agriculture employment). They also fare well on the demographic variables with
the exception of population of the nearest urban center. CCSs without credit unions are better
positioned in terms of the distance variable measures from the urban centers of various sizes. Of
course, the particular roles and importance of these factors cannot be described from the
descriptive statistics alone. A multi-variable regression will reveal the individual influence of
each of these factors on population, holding all others constant.

79
6.2 Regression Results
Table 6.2 presents the results of the models used in the estimation starting with the most
parsimonious model followed by the subsequent models that add the demographic factors, the
social variables and the economic variables. This staged estimation helps to disentangle the
causal effects and address concerns related to multicollinearity and endogeneity. Table 6.3 shows
the grouped variables F-statistics and the associated adjusted R- squares.
6.2.1 Parsimonious Model (Model 1)
This model shows the regression results of the most parsimonious specification that
expresses population change as a function of clearly exogenous variables (natural amenities and
distance variables) and the credit union dummy.
The results indicate a positive impact at 1% significance level of credit union presence on
CCS population growth. The presence of credit unions on average results in about 5.2 percent
greater CCS population growth (or lower decline). When this is measured at the mean of 4,891
this translates into an average of about 254 more people in a CCS over a ten year period. For
communities that are in decline, for example at a rate of 10 percent per year this will reduce the
decline rate to only 4.8 percent per year.
There is a strong inverse relationship between CCS population growth and distances to the
urban centers of all sizes. The negative and significant distance variables suggest that the farther
a CCS is from urban centers, the lower is its population growth. This is consistent with the
literature that points to the large and growing influence of agglomeration economies in driving
the spatial population distribution.

80
Table 6.2: 1996-2006 Population Change Results
1996-2006 Population Changea
Variable Model 1
(Parsimonious)
Model 2
Add
demographic
Model 3
Add social
Model 4
(full model)
Credit union dummy 5.195594
(3.36)***
2.88574
(2.01)**
2.31413
(1.86)*
0.55384
(0.48)
Distance to the nearest urban centre -0.080128 (-4.24)***
-0.06700 (-3.87)***
-0.06535 (-3.86)***
-0.05188 (-3.29)***
Incremental distance to the nearest medium urban
-0.043636 (-3.88)***
-0.02108 (-1.95)*
-0.02230 (-1.99)**
-0.02388 (-2.12)**
Incremental distance to the nearest Large urban
-0.021464 (-3.71)***
-0.01192 (-2.34)**
-0.01267 (-2.4)**
-0.01574 (-2.98)***
Standard deviation elevation 0.022504 (2.15)**
0.02353 (2.63)***
0.02488 (2.55)***
0.01684 (1.93)*
Share of water (%) 0.044704 (1.15)
-0.02330 (-0.50)
-0.02804 (-0.52)
-0.06980 (-1.3)
Snow (cm) -0.007176 (-0.97)
-0.00834 (-1.51)
-0.01003 (-1.71)
-0.01062 (-1.93)*
January temperature (oC) 0.630175 (1.76)*
0.61961 (1.85)*
0.68114 (1.97)**
0.20161 (0.69)
Precipitation (mm) -0.000754 (-0.27)
-0.00092 (-0.36)
-0.00029 (-0.11)
-0.00188 (-0.78)
Own CCS population 0.00069 (4.67)***
0.00066 (4.39)***
0.00045 (3.31)***
Nearest urban population 0.00001 (3.04)***
0.00001 (2.92)***
0.00001 (2.60)***
Share of population self-employed 0.30809 (2.74)***
0.22830 (2.32)**
0.09152 (1.06)
Share living below income cut-off -0.25336 (-3.45)***
-0.25156 (-4.12)***
Share living in own dwellings -0.00304 (-0.21)
0.04153 (2.18)**
Crime rate 0.00011 (0.41)
0.00001 (0.02)
Employment rate 0.37255 (4.54)***
Earnings per hour 0.29097 (2.05)**
Share employed in agriculture -0.21147 (-3.68)***
Share employed in other primary -0.33074 (-4.08)***
Share employed in manufacturing -0.09222 (-0.92)
Herfindel index coefficient -15.05685 (-1.90)*
Share with university degree 0.19954 (1.17)
Provincial dummies yes yes yes yes a Note that the northern territories and urban CCSs are excluded from the sample. Robust t-statistics are reported
in parentheses. The t-statistics are adjusted for spatial autocorrelation of the error term within the census division by STATA cluster command; *, **, and *** denotes statistical significance at 10, 5, and 1 percent respectively.
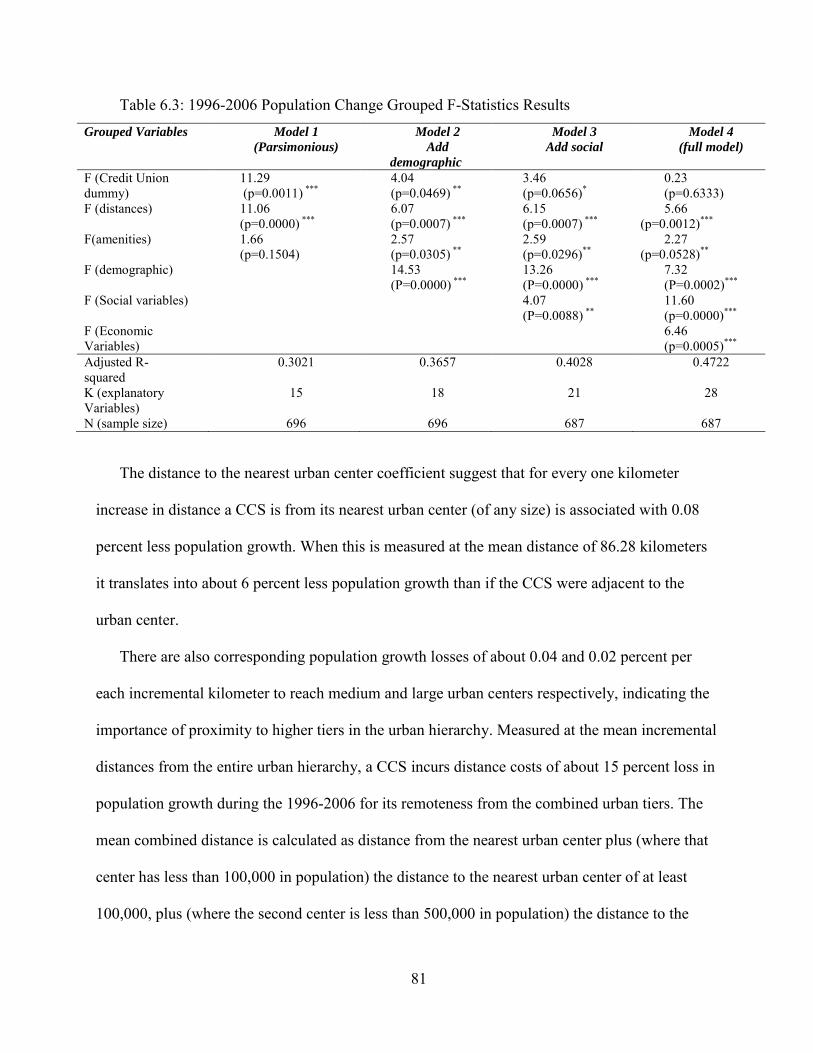
81
Table 6.3: 1996-2006 Population Change Grouped F-Statistics Results
Grouped Variables Model 1
(Parsimonious)
Model 2
Add
demographic
Model 3
Add social
Model 4
(full model)
F (Credit Union
dummy) 11.29
(p=0.0011) ***
4.04 (p=0.0469) **
3.46 (p=0.0656)*
0.23 (p=0.6333)
F (distances) 11.06 (p=0.0000) ***
6.07 (p=0.0007) ***
6.15 (p=0.0007) ***
5.66 (p=0.0012)***
F(amenities) 1.66 (p=0.1504)
2.57 (p=0.0305) **
2.59 (p=0.0296)**
2.27 (p=0.0528)**
F (demographic) 14.53
(P=0.0000) ***
13.26
(P=0.0000) ***
7.32 (P=0.0002)***
F (Social variables) 4.07 (P=0.0088) **
11.60 (p=0.0000)***
F (Economic
Variables) 6.46
(p=0.0005)***
Adjusted R- squared
0.3021 0.3657 0.4028 0.4722
K (explanatory Variables)
15 18 21 28
N (sample size) 696 696 687 687
The distance to the nearest urban center coefficient suggest that for every one kilometer
increase in distance a CCS is from its nearest urban center (of any size) is associated with 0.08
percent less population growth. When this is measured at the mean distance of 86.28 kilometers
it translates into about 6 percent less population growth than if the CCS were adjacent to the
urban center.
There are also corresponding population growth losses of about 0.04 and 0.02 percent per
each incremental kilometer to reach medium and large urban centers respectively, indicating the
importance of proximity to higher tiers in the urban hierarchy. Measured at the mean incremental
distances from the entire urban hierarchy, a CCS incurs distance costs of about 15 percent loss in
population growth during the 1996-2006 for its remoteness from the combined urban tiers. The
mean combined distance is calculated as distance from the nearest urban center plus (where that
center has less than 100,000 in population) the distance to the nearest urban center of at least
100,000, plus (where the second center is less than 500,000 in population) the distance to the

82
centre with at least 500,000 in population. Of course, if the nearest center is more than 500,000
in population then the total distance is simply the distance to the nearest urban center because it
is at the top of our urban hierarchy. The 15 percent population change penalty is calculated by
multiplying the coefficients of the distance variables by the mean distance of from the urban
centers of various ties.
Although, it is notable that there are incremental penalties for a CCS from being farther away
from the urban centers up to the large urban center, the largest marginal penalty for remoteness is
from the nearest urban center. This may suggest that accessibility to commuting and basic urban
services may be of overriding importance. However, results indicate (as shown by the statistical
significance of incremental distance variables) that there still may be desirable urban amenities
and services in higher tied urban centers such as greater diversity in consumption and
employment opportunities and the possibility of developing local input-output with the urban and
the global economy.
These results are consistent with the findings of Partridge et al. (2005; 2007; 2008). They
found that rural areas can benefit from close proximity to successively higher tied centers, while
incurring penalties for increasing remoteness from urban services and amenities. Mueser and
Graves (1995) also found that the cost of accessing higher tiered amenities and services outside
commuting shed increases with greater distances. An increase in their valuation makes proximate
regions more attractive to households, increasing in-migration and population growth, while
more remote regions may experience net out-migration and population decline.
Of the 5 natural amenities variables included in the specification, only January temperature
and standard deviation elevation, which reflects on the CCS topography, were statistically
significant at 10 and 5 percent level respectively. CCS population increases by about 0.6 percent

83
for each one degree increase in January temperature, while population grows by about 0.02
percent for an increase in one standard deviation elevation.
These results are as expected. In Canada January is usually the coldest winter month and
households were hypothesized to have preference for variation in terrain as measured by
standard deviation elevation that proxies mountains and hills. The other three natural amenities
variables (share of water, snow and precipitation), though they had the expected signs, were not
statistically significant in explaining CCS population growth.
The lack of significance of the other three amenities and as a group (as indicated by the F
statistic) results are not surprising because in Canada population is concentrated along the far
southern east-west ‘line’ which might entail lack of climatic variability. Several other variables
were considered including the share of forest land, total sun hours and July relative humidity
(results not shown) but they were all insignificant and some variables had the unexpected signs.
These amenity results counter most of the United States studies that have shown natural
amenities to have significant impact on population growth (Rappaport 2004a; Deller et al. 2001).
In this model specification distance variables were jointly significant at 1percent significance
level in explaining CCS population growth, while the amenity variables were jointly
insignificant in explaining CCS population growth (as shown by the F statistic near the end of
the table). The explanatory power of the model was 30.21 percent.
6.2.2 Model 2
The model 2 adds the demographic variables to the most parsimonious specification. Three
demographic added were: own CCS (Community) population; nearest urban center population;
and the share of population that is self-employed. These variables are included in this

84
specification to analyze the effects of local market size, external market size and the
entrepreneurship spirit in the community.
The credit union dummy remained statistically significant, though now only at 5 percent
significance level. Additional presence of credit union in a CCS on average results in 2.9 percent
increase in population growth. When this is measured at the mean of 4,891 this translates into an
average of about 141 more people in a CCS over a ten year period. For communities that are in
decline, for example at a rate of 10 percent per year this will reduce the decline rate to 7.1
percent per year. The distance variables continue to have an inverse relationship with CCS
population growth. For example, CCS population growth declines by about 0.06 percent for each
kilometer a CCS is farther from the nearest urban center (of any size). Measured at the mean of
86.28 kilometers, this translates into about 5.2 percent population decline between 1996 and
2006, not much below the findings in model 1.
Incrementally, the CCS experience about 0.02 and 0.01 percent population decline for each
kilometer farther from the medium and largest urban center respectively and 8.2 percent
population loss during 1996-2006 period for remoteness from the combined urban tiers. The
distance variables are still jointly statistically significant at 1 percent significance level (as shown
by the F statistic), though the marginal costs have now decreased but this is expected as more
explanatory variables have been added to the most parsimonious model.
Of the amenities variables, both standard deviation elevation and January temperature
remained statistically significant at 1 and 10 percent significance level respectively. As a group
amenities were significant at 5 percent level of significance as shown by the F statistic.
All the demographic variables are significant at the 1 percent level and have the expected
positive signs. Community population shows the greatest impact on population growth of the

85
three, with an expected 0.6 percent increase in CCS population for every 1,000 increase in
community population. These results indicate that the size of the local market plays a greater role
in population growth and retention possibly through increased demand thresholds, which may
lead to firm entry, expansions, and start-up businesses.
A positive relationship exists between share of population that is self-employed and
population growth. A 0.3 percent increase in CCS population is expected to result from a 1
percent increase in the share of the population that is self- employed. This not surprising
because, entrepreneurship is emerging as an important driver of the economy (Minniti 1999;
Pages and Poole 2003) through employment opportunities created as well as the economic
spillovers that results from entrepreneurship.
A positive relationship exists between the CCS population growth and the population of the
nearest urban centre population, reflecting the importance of the market size of the surrounding
areas. For every additional 1,000 in nearest urban center population, there is a 0.01 percent
increase in rural community population. This may indicate that nearby market size may be an
important factor for business start ups, firm growth, and population growth as it represents a
ready market.
As a group the demographic variables are jointly significant at 1 percent level (as shown by
the F statistic). The explanatory power of the model increased to 36.57 percent with the addition
of the demographic variables. Together the results of demographic variables and distance
variables show that agglomeration plays a statistically significant role explaining CCS
population.

86
6.2.3 Model 3 and the Full Model
Models 1 and 2 have a number of important control variables omitted in the specifications.
Therefore two other model specifications were estimated. First the social variables were added in
Model 3, followed by the economic variables in the Full Model to analyze the effect of the social
and economic variables on the estimation results. Results of the Model 3 with social variables are
shown in the third column of table 6.2. The social variables added were: the share of population
living below the income cut off; the share of population living in own-dwellings; and the crime
rates.
The credit union dummy was still statistically significant in model 3, but now only at the 10
percent level. When holding all other variables in the model constant, the additional presence of
credit union in a CCS is expected to result on average in about 2.3 percent greater population
growth in a CCS. When this is measured at the mean of 4,891 this translates into an average of
about 112 more people in a CCS over a ten year period. For communities that are in decline, for
example at a rate of 10 percent per year, this will reduce the decline rate to 7.7 percent per year.
All the distance variables were statistically significant at least at the 5 percent significance level
and as a group the distance variables were jointly significant at 5 percent level (as shown by the
F statistic).
Of the three social variables, only one variable, the share of population living below the
income cut-off was statistically significant at 1 percent level in explaining CCS population
growth. The results indicate that a 1 percent increase in the share of population below low
income cut-off is expected to result in 0.25 percent decrease in CCS population growth. This
result is consistent with expectations as areas with high concentrations of ‘poverty’ (as measured
87
by the share of people living below the income cut-off) are usually associated with less attractive
communities for population growth and retention.
The other two variables, the share of population in own-dwellings and crime rates, were
statistically insignificant in explaining CCS population growth. As a group the social variables
were jointly significant at 5 percent level in explaining population change in CCS (as shown by F
statistic). Addition of social variables increases the explanatory power of the model to 40.28
percent.
The last and Full Model that included all the four groups of the variables results are shown in
column 4 of table 6.2. The economic variables included were: the employment rate; earnings per
hour; the share of population employed in agriculture; the share of population employed in the
other primary industries; the share of population employed in manufacturing; the herfindel index
coefficient; and the share of population with a university degree. This fully specified model is
complete in the sense that it represents as fully as the data allow on all the factors that are
expected to influence rural community population change.
Though the explanatory power of the model (measured by the adjusted R-squared) increased
to 47.22 percent, which is relatively high for cross-sectional data, it resulted in the credit union
dummy, the share of population that is self-employed, and January temperatures losing their
statistical significance, while the share of population in own-dwellings gained significance at 5
percent.
The direct inference from these results is that once all the other variables affecting rural
community population growth have been controlled for, there is no statistically significant
influence of the presence of a credit union.
88
Though, an attempt was been made to lag the independent variables to avoid potential
endogeneity problems with the dependent variable, it is possible that even if all the independent
variables were for the initial year (1996), they might be relationships between independent
variables that might have caused this loss of statistical significance. However, this problem is
less likely to have had a greater impact. Before estimation was done simple correlation were
conducted and all the variables used had low coefficients.
Credit unions might have an impact on CCS population growth but the dummy variable
representing the presence of credit union variable might not have been sufficient to measure the
impact of credit unions. Other measures of credit union activity, like the membership size, asset
size or the size of loans and deposits could be the better indicators as the measures of credit
unions impact, as they are continuous and represent the amount of credit union activity.
It might also be possible that the credit union data that was not lagged for the two provinces
might have caused simultaneity problems that might have led to the credit union dummy to lose
its statistical significance. Again this is highly unlikely because the credit union dummy was
statistically significant in the other three models.
Of the seven economic variables, five were statistically significant, while the other two (the
share of population with a university degree and the share of people employed in the
manufacturing sector) were statistically insignificant in explaining population growth in the
CCS. A 1 percent increase in the employment rate is expected to results in about 0.4 percent
increase in CCS population. A one dollar increase in the earnings per hour (of the 1995 dollars)
is expected to result in about 0.3 percent increase in the population growth.
The share of the population employed in agriculture and in the other primary industries had
the expected negative effect on CCS population growth. Both were statistically significant at 1

89
percent level. A 1 percent increase in share of people employed in agriculture and the other
primary industries is expected to result in about 0.2 and 0.3 percent decrease in CCS population
growth respectively. This is consistent with literature because these two industries are growing
slowly (in terms of jobs) nationally because of the long term and continuing labor saving
technology.
The herfindel index coefficient was statistically significant at 10 percent level and had the
expected inverse relationship with population growth. This index reflects industry concentration
such that the higher the index, the lower the industry diversification in a community. Lack of
diversification limits job opportunities for the residents thus dampening growth.
Though the share of the population with a university degree was statistically insignificant, it
had the expected positive sign. The insignificance is not surprising as education levels are
positively correlated with most of the economic variables (the industry structure, employment
rates, and income measures). The influence of education has thus probably been captured in
some of these variables. The share of population employed in manufacturing was inversely
related to CCS population growth and again this is not surprising because the service and
knowledge based sectors are emerging as the drivers of national economy and becoming more
important in the global economy. Routine manufacturing in rural areas is no longer an economic
driver. As a group the economic variables were jointly significant at 1 percent level (as shown by
the F statistic).
All the distance variables remained statistically significant with the addition of the economic
variables. A one kilometer farther from the nearest urban center is expected to result in 0.05
percent decline in CCS population and measured at the mean distance of 86.28 kilometers this
translates into 4.3 percent CCS population decline. Incrementally the CCS experience about 0.02

90
and 0.0015 percent population decline for every kilometer farther away from the nearest medium
and large urban center respectively. At the mean distances this translates into 5.9 percent
population loss during 1996-2006 for remoteness from the combined urban tiers. The distance
results are consistent with the earlier results that show that the largest marginal penalty continues
to be for remoteness from the nearest urban center (of any size). The consistent results for the
distance variables across all the four models imply that distances are important in explaining
population change in CCS.
Also consistent across the models are the results of the two demographic measures,
community population and nearest urban center population which remained positively related to
the CCS population growth as expected. They were both statistically significant at 1 percent
level. These results indicate that distance and market variables as measures of agglomeration
economies are important in explaining rural community population growth.
The joint significance of the variable groups (as shown by the F statistic) was at least at 5
percent level indicating that as groups all variables were significant in explaining CCS
population growth. The progressive increases of adjusted R-squared with the addition of control
variables indicate that control variables inclusion improve the model specification from the most
parsimonious model. The main finding though is that with the inclusion of economic variables,
the credit union dummy lost its statistical significance in explaining CCS population growth.
6.3 Post Estimation Results
The quantitative analysis and the discussion above provided four ways to assess the
robustness of the four models. These were: 1) use of goodness of fit as represented by adjusted
R-squared values; 2) the level of significance of the individual explanatory variables as measured
by the coefficient t statistic; 3) assessing whether groupings of variables are jointly significant as
91
represented by F-statistic; and 4) assessing if the individual variables exhibit the direction of
influence on the dependent variable as predicted by theory. However, there may be some
underlying problems that could have affected the results. To address these concerns two post
estimation tests were conducted on the Full Model to analyze if it is possible that
multicollenearity or model misspecification might have affected the results.
These two tests were the Ramsey Ovtest and the variance inflation factor (VIF) indicator.
Ovtest can be used to test for specification error of the model in two ways: a) using the powers of
the fitted values (to indicate whether the residuals will have stronger dependency between
themselves); and b) using the powers of independent variables (to indicate whether the residuals
have stronger dependency with the explanatory variables). In both cases the null hypothesis is
that the model has no omitted variables.
Specification error likely results from: 1) the omission of relevant variables or inclusion of
irrelevant variables; 2) misspecification of the estimation model. If P< 0.05 this means that the
model likely suffers from specification error. The tests for model specification error using both
methods produced the following results:
a) Ramsey Ovtest: using the powers of fitted values of population changes.
Prob > F = 0.2611
a) Ramsey Ovtest: using the powers of independent variables.
Prob > F = 0.3219
In both cases the tests results indicate P > 0.05 implying that there is no evidence of
misspecification in our model.
The VIF show by how much the variance of a single β goes up due to the correlation across
explanatory variables. As a rule of thumb, a variable whose VIF values are greater than 10 may

92
imply collinearity. Tolerance, defined as 1/VIF, is also used to check on the degree of
collinearity. A tolerance value lower than 0.1, is comparable to a VIF of 10. It means that the
variable could be considered as a linear combination of other independent variables. Table 6.4
below show the respective VIF and tolerance of the selected variables that were suspected to
have collinearity problems.
Table 6.4: VIF and Tolerance for Selected Variables
VIF and tolerance for selected variables Variable VIF 1/VIF
Share of self employed population 1.64 0.608947 Employment rate 2.39 0.418069 Earnings per hour 3.77 0.264979 Share population employed in agriculture 8.88 0.112595 Share population employed in other primary 1.90 0.527019 Share population employed in manufacturing 2.03 0.49157 Share population with university degree 1.38 0.726322 Credit union dummy 2.05 0.493211
The VIF and tolerance indicators did not reveal any potential collinearity for the variables
used.
6.4 Other Sensitivity Checks
Four other sensitivity estimations were considered to check the robustness of the results: 1)
inclusion of interaction dummies; 2) regional regressions; 3) sub-sample regressions; and 4)
excluding insignificant variables.
Interaction dummies were included because in some cases the regressors may not be
correlated but jointly affect the dependent variable (Fox 1997). However, with this type of
regression multicollinearity is more likely to be a problem because interaction terms tend to be
highly correlated with the dummy variable, as the interaction term is a product of a regressor and
the dummy variable.
To avoid the potential problem of multicollinearity the specifications with the interaction
terms were estimated with each of the economic variables and the credit union dummy one at a
93
time. In all these specifications the interaction term turned out statistically insignificant at the 10
percent level (results not shown) indicating the Full Model results are robust.
Regional regressions were conducted to analyze if different economic regions in Canada
might provide different population growth results and possibly different impact of credit unions
on communities. Regional models were estimated for three groups: the British Columbia; the
prairies (Saskatchewan, Alberta and Manitoba); and Atlantic Canada (Prince Edward Island,
Nova Scotia and New Brunswick). The results for each region were the same as for the Full
Model —the credit union dummy became insignificant once the economic variables were added.
Models were also estimated for two sub-samples: provinces with higher level of credit union
presence (Nova Scotia, Saskatchewan, Alberta and British Columbia) and provinces with lower
credit union presence (Prince Edward Island, Manitoba and New Brunswick). For both these
subsamples the overall results were consistent with the Full Model (results not shown). The only
difference was that credit union dummy was insignificant for all the estimations beginning from
the most parsimonious model in provinces with lower credit union activity.
The last robustness check dropped all the variables in model that were insignificant at 10
percent significance level to test the tradeoff between multicollinearity and omitted variables but
the credit union dummy still remained insignificant indicating the Full Model results are robust.
6.5 Hypothesis Testing
Taking into account the sensitivity checks, robust checks, and the post estimation results, the
Full Model is accepted as the best specification for the study and the one used to test the
hypothesis of the study.

94
The null hypothesis for the study is:
H 0 : There is no difference in population growth outcomes between the communities where
credit unions are present and those with no credit unions.
The significance level adopted for the study is 10 percent. At this significance level the null
hypothesis is rejected if the critical value is greater than 1.645 and the probability (P< 0.1). Our
t- statistic was 0.48 and the p value was 0.6333. Given these critical values and our rejection
criteria we failed to reject the null hypothesis.
The implication is that if there are credit union impacts in rural communities, they are not
discernible with the existing data. More complete and descriptive quantitative data might have
produced different results.
6.6 Conclusions
This chapter presented the results of the econometric estimations. The estimation and the
presentation were done in stages to assess the potential problems of endogeneity and collinearity.
The estimation results, post estimation results and the other sensitivity checks have indicated that
the Full Model with economic variables is the best fit for the problem estimating the
determinants of population change. The credit union dummy was not found to be statistically
significant in explaining the impact of credit unions on community population growth. We failed
to reject the null hypothesis of the study that stated that there is no difference in population
growth outcomes between the communities where credit unions are present and those with no
credit unions.

95
Chapter 7: Conclusions
7.0 Introduction
This study set out to identify the impact of credit unions on rural community vitality as
measured by population growth. A preliminary qualitative inquiry was conducted to gain a better
understanding of the activities of a credit union and a chartered bank. The economic impact of
credit unions was examined using spatial regressions analysis that modeled credit unions as
potentially reducing transactions costs for local businesses thus contributing to population
growth and retention. This chapter provides a summary of the research findings and implications
that can be drawn from the study. A discussion of the limitations of the study and
recommendations for further study are also highlighted.
7.1 Summary of Study Findings and Implications
7.1.1 Qualitative inquiry
The qualitative information was collected through semi-structured interviews with managers
of a credit union and a chartered bank in Saskatchewan. The interview results indicated that most
of their business operations and practices are the same, and neither organization makes a specific
distinction between rural and urban clients. Significant differences, however, were noted in their
lending portfolios, small business support and community investments. The credit union, in
addition to the traditional lending, participates in non-traditional lending that takes personal and
community information into account during the processing of loans. In addition to this the credit
union provides mentorship and follow-ups to loan beneficiaries.
Two activities fall under this non-traditional lending: a) micro-lending; and b) community
economic development lending. Micro-lending is extended to small businesses that fail to qualify
for traditional lending because they are considered to be too high risk, either due to lack of

96
experience or a nonexistent or inadequate credit rating. The credit union partners with Western
Economic Diversification (WD), in delivering micro-lending program. WD provides the credit
union a loan loss provision on all the micro-lending. The low rate of defaults on micro-loans is
attributed to the mentorship and follow-ups that the credit union staff contribute to these
businesses.
Community economic development loan programs consider mortgage financing, lines of
credit and financing for various types of projects that have a solid community support and a good
business track record. In most cases these projects do not meet the funding criteria under the
traditional lending. Because community economic development loans have a strong community
orientation, community committees are usually involved to provide personal and community
input into the lending process. Though these committees do not make the final decision on loan
approval, they provide valuable local knowledge that will be considered in the internal loan
decision making of the credit union.
The impact (if any) of credit unions, as distinct from chartered banks, on communities is
therefore likely to be through these non-traditional lending activities or their mentorship and
support of borrowers. Credit unions might help to promote small business growth through
reducing transactions costs, and thus enhancing entrepreneurial spirit in communities by making
micro-loans and community development loans accessible and providing assistance through
offering information and training. By making use of personal and community information in loan
approvals, the credit unions may be addressing market failure in the small business start-up loans
that results from information asymmetry.
97
7.1.2 Regression results
The quantitative analysis sought evidence of this influence of credit unions through the use of
an econometric analysis of the role of credit unions on community population change, our metric
for community economic vitality.
The staged estimation models used in the regressions showed that the presence of the credit
union dummy was statistically significant and positive in the most parsimonious models
including only natural amenities, agglomeration measures and other social measures as
explanatory variables. The presence of a credit union, holding these factors constant results in net
population growth (or reduction in population decline). However, when the fully specified model
was estimated, including the set of economic variables, the credit union dummy lost its
significance.
Taking into account the sensitivity checks, robust checks, and the post estimation results, the
Full Model was accepted as the best specification for the study and the one used to test the null
hypothesis of the study. There was no evidence that the presence of a credit union had a
statistically significant impact on population growth outcomes in rural communities, holding all
else constant.
Other regression results confirmed earlier research findings on the importance of
agglomeration economies as measured by the distance and market variables in rural population
growth (Partridge et al. 2007; 2008). Rural areas benefit from being in close proximity to urban
centers that provide higher-ordered services and amenities. These findings are consistent with the
New Economic Geography, where proximity to suppliers and customers lowers transport costs
and scale economies may exist in producing non-traded intermediate inputs, thus reducing
relative profitability of producing in the rural areas. Also consistent with earlier research findings

98
was the importance of economic variables in determining rural population growth and the
smaller significant role played by natural amenities in explaining population growth in Canadian
rural communities.
The most likely explanation for the lack of significance of the credit union dummy is that
the credit union dummy might have been an inadequate representation of credit union activity to
capture the economic impact of credit union activity on communities. Data limitations dictated
the presence/absence dummy, and for some provinces only in the current year. More detailed
quantitative measures such as size indicators including the size of the lending portfolio or the
total assets would have been more informative. Further, the theoretical model shows initial
period credit union activity affecting subsequent population growth, requiring lagged credit
union information. More complete quantitative measures could have produced different results.
It might also be that, in spite of the a priori expectations regarding the impact of credit
unions, their impact was not strong enough to be captured by econometric estimations. Various
factors impact the ability of credit unions to participate in non-traditional lending, thus leading to
credit unions losing their potential ability to contribute to community population growth. These
factors may include: a) the regulatory framework; b) the cost limitation; and c) effect of credit
union mergers and changes in the global economy. In addition there may be principal-agent
problems.
7.1.2.1 Regulatory Framework
Credit union deposits are guaranteed 100 percent in most of the provinces. For example, in
Saskatchewan, the Credit Union Deposit Guarantee Corporation (CUDGC) guarantees all
deposits with Saskatchewan credit unions. To minimize the credit unions exposure, the CUDGC,

99
as the regulator, has put in place various preventive measures and regulations to minimize their
risks. This guarantee requirement may be restrictive in terms of their lending activities.
There is also the specific regulation that limits the non-traditional lending activities of a
credit union to only one percent of its book value because non-traditional lending is considered
risky. This regulation therefore implies that the participation of a credit union in non-traditional
lending is very limited and restricted by its size. Large credit unions have greater capacity, while
the smaller credit unions in small rural communities would have very limited funds even if they
may wish to participate more in non-traditional lending. However, even for large credit unions
one percent is a very minor part of the lending portfolio and perhaps unlikely to have much of an
impact on rural communities.
7.1.2.2 The Cost Limitation
Though non-traditional lending is considered to be risky, the credit union that we interviewed
was particularly successful with this type of lending, with a default rate of about 2.5 percent. Key
to this success is the amount of mentorship that the staff put into the program. The credit union
implements mentorship and follow-ups to the beneficiaries of non-traditional loans. This helps to
monitor loan use and thus minimizing loan defaults. For a credit union that has fewer staff or less
experienced staff, it may be too costly to conduct non-traditional lending.
Recent credit union mergers have resulted in an increase in credit union assets and capacity.
The absolute value of non-traditional lending might then have increased, at least for credit unions
that participate in non-traditional lending. Larger credit unions may have a greater capacity for
non-traditional lending in terms of mentorship and assistance to borrowers as well. However,
these mergers may introduce new set of problems to the operations of credit unions.

100
7.1.2.3 Effect of Credit Union Mergers and Globalization
One of the reasons why credit unions have been championed as having potential in
promoting rural community growth is that they are democratically controlled and that they are
owned by the people who use their services. Members are able to directly internalize benefits
that arise from the operation of credit unions and as such members have the power and
motivation to control the direction of the credit union to maximize their net benefits.
However, with increasing globalization and mergers, credit unions are developing more
‘bank-like’ characteristics. The increase in size and complexity requires specialised professionals
and allows for less democratic control by the members. This indicates a move away from the
participatory movement in the history of credit unions to a much more ‘professionalized’ system
that allows for a more ‘efficient’ and ‘businesslike’ running of the credit union.
The implications of this are that credit unions may become less of a social enterprise
differentiated from the mainstream financial economy, and more of a novel competitor in the
financial services industry. As credit unions progress in growth of assets and membership, as
well as an increase in professionalization and standardization with other financial service
providers, they may experience goal displacement as they are lured away from their activist base
into institutional growth. Thus, as credit unions are drawing further and away from localized and
democratic roots, their potential to actively participate in community development might have to
be realized through new avenues.
7.1.2.4 Potential Principal-Agent Problem
Democratic control of credit unions allows members to elect the board of directors from their
membership, to run the credit union on their behalf. To fulfil their functions, the credit union
board’s main role should be to formulate and develop a strategy for the delivery of its core

101
philosophy on behalf of its members. The board of directors then hires managers, who carry out
the day-to-day operations of the credit union.
As managers are in a position of having greater knowledge of credit union’s operation, this
can put them in a position of power and this could lead into principal-agent problem where the
manager may have different objectives and goals than the Board. A principal-agent problem
occurs when an agent (in this case a manager) and the principal (the credit union board) have
different objectives and goals and there is asymmetric information such that an agent uses
information at his/her disposal, and the board’s reliance on management to take advantage of the
situation and pursue their own objectives (Fulton and Larson 2009; Eisenhardt 1989).
With the increase in credit union size through mergers, it becomes increasingly difficult to
monitor management actions. Credit union members and the board are removed from the day-to-
day activities of a credit union and where the principal and agent objectives differ, the agent
typically has more information, and opportunities exist for the agent to behave in a manner not in
the principal's interests. Thus in some cases, even if the members and the board are interested in
promoting community goals, managers may not work towards the attainment of these goals, thus,
reducing credit union’s impact on community growth activities.
In order for the wishes of the credit union members to be evident in the operations of the
credit union there must be clear linkages between their wishes and the manager's activities. There
is a long causal chain between the objectives of the members and the activities of the manager.
The members elect a board which may or may not fully represent their wishes. Then the board
hires a manager who may not fully understand the wishes of the board, or understand but have
his/her own agenda. If communication or information flow breaks down at any of these stages,

102
the members' community economic development intentions may not be realized through the
operations of the credit union.
Nevertheless, expanding non-traditional lending could have an impact on many communities
by making credit available to entrepreneurs that cannot access finance from the mainstream
financial organizations. Credit unions might need to look into ways of expanding these forms of
non-traditional lending. Credit unions may consider ‘peer-to-peer’ lending that some credit
unions in the U.S. are implementing. With this program credit unions may put business proposals
of their members on their public websites and fellow members make financial contributions
towards these businesses. Though peer- to-peer lending has been successful in the U.S., its
success in Canada will depend on how the program is adapted to fit into the Canadian culture.
For example, if there is more sensitivity to privacy issues, a modified form may be required to
protect the privacy of the individuals, perhaps through some assurance of anonymity.
7.2 Limitations of the Study
The study had several limitations in investigating the economic impact of credit unions on
rural communities. Data on the credit unions was limited to only the credit union dummy which,
only reflects on the presence or absence of credit union in the community. The credit union
dummy might not be a sufficient indicator of credit union activity in the community. Further
lagged credit union activity was hypothesized as influencing subsequent population growth and
we were not able to obtain lagged data for two provinces.
The presence of a credit union does not necessarily guarantee economic participation of the
credit unions in communities. It is possible that some credit unions are small and they only
provide basic financial services to the community. Measuring the economic impact of credit
union using a credit union dummy could be misleading in such cases. Other quantitative

103
measures of credit union activity like asset size, credit union membership and the size of loans
and deposits might more completely capture the impact of credit unions.
It is also possible that while the credit union with which we had an interview is actively
involved in non-traditional lending, others might not be and framing the theoretical framework
and implementation of spatial regressions in this way might have been too optimistic in capturing
credit unions economic impact on community population growth. A more detailed investigation
of the mechanisms by which credit unions influence community economic development might
have improved our model specification.
7.3 Areas of Further Study
The study focussed on population change as a measure of credit union impact on community.
While population change is the ultimate indication of community economic health and vitality,
there may be other, more subtle credit union economic impacts on communities worthy of study.
For example, in future it might be useful to use entrepreneurial or other business or firm growth
measures as the dependent variable in measuring the impact of credit unions.
Replicating this study in future with the inclusion of more credit union measures like asset
size, membership size or the size of loans and deposits to measure the impact of credit unions,
would provide a more complete test of the impact of credit unions.
Other avenues of future research would be the use of data from more interviews with
chartered banks and credit unions. These would help in better understanding the operations of
chartered banks and credit unions in a variety of settings.

104
References
American Consumer News. 2009. Peer to Peer Lending Guide. Accessed at http://www.americanconsumernews.com/2009/12/the-peer-to-peer-lending-guide.html on 05 February 2010. Barkley, D. 1995. The Economics of Change in Rural America. American Journal of
Agricultural Economics 77(5):1252-58. Bartik, T. 1991. Who Benefits from State and Local Economic Development policy? W.E UpJohn Institute for Employment Research: Kalamazoo MI.
Beaulieu, L.J. 2002. Creating Vibrant Communities in Rural America. Southern Rural Development Center: Starkville MS. Bollman, R.D and R. Mendelson. 1998. Rural and Small Town Population is Growing in the 1990s. Rural and Small Town Canada Analysis Bulletin. Volume 1(1): Catalogue No 21-006 XIE. Accessed at http://www.statcan.ca/english/freepub/21-006-XIE1998001.pdf on 13 October 2009.
Campion, M.A., J.E. Campion and J.P. Hudson Jr. 1994. Structured Interviewing: A Note on Incremental Validity and Alternative Question Types. Journal of Psychology 79:998-1002. Canada Deposit Insurance Corporation (CDIC). 2009. Who Were Are and What We Do. Accessed at http://www.cdic.ca/e/index.html on 18 December 2009. Canadian Co-operative Association (CCA). 2007. Credit Unions-Banking on Our Communities. Accessed at http://www.coopscanada.coop/assets/firefly/files/files/pdfs/ProvAndSectoralProfiles/credit_union_coops_apr07.pdf on 30 October 2009. Canadian Encyclopedia. 2009. The Bank Act. Accessed at http://www.thecanadianencyclopedia.com/index.cfm?PgNm=TCE&Params=AIARTA0000495 on 19 December 2009.
Castle, E. 1993. Rural Diversity: An American Asset. The Annals 529:12-21. Central 1 Credit Union. 2008. History of credit unions. Accessed at http://www.ontariocreditunions.com/aboutcu_history.asp on 24 April 2010. Chevan, A. and R. Stokes. 2000. Growth in Family Income Inequality 1970-1990: Industrial Restructuring and Demographic Change. Demography 37(3):365-380. Courant, P.N. 1994. How Would You Know a Good Economic Development Policy if you Tripped Over One? Hint Don’t Just Count jobs. National Tax Journal 47(4): 863-81.

105
Credit Union Central of Canada. 2008. Community involvement. Accessed at http://www.cucental.ca/CommunityInvolvement on 01 October 2009. Credit Union Central of Canada. 2009. Statistics. Accessed at http://www.cucentral.ca/Default.aspx?DN=7ec01257-b591-43eb-a4bd-6fe5ea0ccddc&l=English on 28 January 2010. Credit Union Deposit Guarantee Corporation (CUDGC). 2009. Reference Guide for
Saskatchewan Credit Unions. Accessed at http://cudgcqlx.sasktelwebhosting.com/pages/pdf/ssbp.pdf on 20 December 2009. Deavers, K.1992. What is Rural? Policy Studies Journal 20(2):184-189. Della, P.D. and S.Tarrow. 2004. Transnational Protest and Global Activism. Rowman and Littlefield: New York. Deller, S.C. and J.C Dissart. 2000. Quality of Life in the Planning Literature. Journal of
Planning Literature 15(1):135-61. Deller, S.C., T. Tsung-Hsui., D.W. Marcouiller and B.K. Donald. 2001. The Role of Amenities and Quality of Life in Rural Economic Growth. American Journal of agricultural Economics
83(2):352-365. Department of Finance Canada. 2008. Canada’s Credit Unions and Caisses Polulaires. The
Canadian Financial System. Accessed at http://www.fin.gc.ca/toc/2000/ccu_-eng.asp on 23 October 2009. Du Plessis V., R. Beshiri., R.D Bollman and H. Clemenson. 2002. Definition of ‘Rural’. Statistics Canada Agriculture and Rural Working Paper Series Working Paper No 61 (Series 21-60-MIX). Statistics Canada: Canada. Dumaias, G., G. Ellison and E.L Glaeser. 2002. Geographic Concentration as a Dynamic Process. Review of Economics and Statistics 84:193-204. Eisenhardt, K.M. 1989. Agency Theory: An assessment and Review. The Academy of
Management Review 14(1):57-74. Fairbairn, B., K. Lou Hammond and P. Krebs. 1997. Credit Unions and Community Economic
Development. Centre for the Study of Co-operatives: University of Saskatchewan.
Ferguson, M., A. Kamar., R.M. Olfert and M.D. Partridge. 2007. Voting With their Feet: Jobs versus Amenities. Growth and Change 38(1):77-110. Fisher, P. and A. Peters. 1998. Industrial Incentives: Competition among American States and Cities. WE UpJohn Institute for Employment Research: Kalamazoo MI.

106
Fowke, V.C.1978. Canadian Agricultural Policy: The Historical Pattern. University of Toronto Press: Toronto. Fox, J. 1997. Applied Regression Analysis. Linear Models and Related Methods. Newbury Park: CA Sage. Freshwater, D. 2007. Rural Development and the Declining Coherence of Rural Policy: An
American and Canadian perspective. University of Kentucky College of Agriculture. Agricultural Economics staff papers No 467: Lexington KY.
Freshwater, D. and E. Scorsone. 2002. The Search for Effective Rural Policy: An Endless Quest
or an Achievable Goal? University of Kentucky College of Agriculture. Agricultural Economics staff papers No 467: Lexington KY. Freshwater, D. and P. Ehrensaft. 1994. Catalyzing Bottom up Development with National Program: Canada Futures Program in Sears, D and J .N .Reid (Eds) Rural Development
Strategies that Work: Nelson-Hall: Chicago. Fritsch, M. and P. Mueller. 2004. The Effects of New Business Transformation on Regional Development over Time. Regional Studies 38:961-75. Fulton,. M. and K.A Larson. 2009. The Restructuring of the Saskatchewan Wheat Pool: Overconfidence and Agency. Journal of Co-operatives 23: 1-19.
Fulton,. M. and K. Lou Hammond. 1992. The Role of Co-operatives in the Communities: Examples from Saskatchewan. Journal of Agricultural Co-operation:15-42.
Gabe, T. 2007. Special Issue on Opportunities and Challenges Facing the Rural Creative Economy. Agriculture and resource economics review 36(1). Galston, W. and K. Baehler. 1995. Rural Development in the United States: Connecting Theory,
Practice and Possibilities. Island Press: Washington DC. Glaeser, E.L .1997. Are Cities Dying? Journal of Economics Perspectives 12(2):139-160. Goetz, S.J. 2003. Critical Development Issues in Rural Economies. United States department of Agriculture. Agricultural Outlook Forum: Pennsylvania. Graves, P.E. 1983. Migration with a Composite Amenity: The role of Rents. Journal of Regional
Science 23:541-546.
Greene, W.H. 2008. Econometric Analysis, Sixth Edition. Prentice Hall. Gujarati, D.N. 2004. Basic Econometrics. Tata McGraw-Hill Publishing Company Limited: New York.

107
Hanson, H.G. 2005. Market Potential, Increased Returns and Geographic Concentration. Journal
of International Economics 67(1):1-24.
Henderson, J. 2006. Understanding Rural Entrepreneurship at the County Level: Data
Challenges. Federal Reserve Bank of Kansas City: Omaha. Henry, M. and M. Drabenstott. 1996. A New Micro View of the U.S. Rural Economy. Economic
Review 81:53-70.
Henry, S.M, D.L. Barkley and S. Bao. 1997. The Hinterlands Stake in Metropolitan Area Growth. Journal of Regional Science 34:479-501. Ingene, C.A. and A. Ghosh. 1990. Consumer and Producer Behavior in a Multi-purpose Shopping Environment. Geographic analysis 22:70-93. International Co-operative Alliance (ICA). 2004. Co-operative Principles and Values –
Revisions. Accessed at http://www.ica.coop/coop/principles-revisions.html on 20 October 2009.
Isserman, A.M. 2000. The Competitive Advantages of Rural American in the Next Century. International Regional Science Review 24:35-58. Johnson, T.G. 2001. The Rural Economy in a New Century. International Regional Science
Review 24:38-58. Kilkenny, M. 1998. Transport Costs and Rural Development. Journal of Regional Sciences 29: 293-312. Landcor Data Corporation. 2002. Case studies. Accessed on at https://www.landcor.com/about/case_studies/vancity.aspx on 25 April 2010. Lindlof, T.R. and B.C .Taylor. 2002. Qualitative communication research methods. Second Edition. Sage Publication: Thousand Orks CA.
Lou Hammond,K.and K. Brown 2009. Financing Aboriginal Enterprise Development. The
Potential of Using Co-operatives Model. Occasional Paper Series. Centre for the Study of Co-operatives: University of Saskatchewan.
Low, S., J. Henderson and S. Weiler. 2005. Gauging a Region’s Entrepreneurial Potential. Economic Review Third Quarter: 61-89.
Mann, S. 2005. The Depopulation of Rural Areas and the Farming System. Paper presented at the European Association of Agricultural Economists Agroscope FAT. Switzerland.
Marshall, C. and G.B Rossman. 1998. Designing qualitative research. Sage Publication: Thousand Oks CA.

108
McAuthur, A., A. McGregor and R. Stuard. 1993. Credit Unions and Low Income Communities. Urban studies 30(2):399-413.
McGranahan, D.A. 2008. Landscape Influence on Recent Rural Migration in the U.S. Landscape
and Urban Planning 85:228-40.
Minniti, M. 1999. Entrepreneurial Activity and Economic Growth. Global Business and
Economic Review 1(1):31-42. Moser, C.H and P.D Wessen. 1999. The Enhancing Rural Economies Project: Context and
Purpose, Techniques and Procedures, Experience to date. Department of Agricultural, Food, and Resource Economics: Michigan State University. Mueser, P and P. Graves. 1995. Examining the Role of Economic Opportunities and Amenities in Explaining Population Redistribution. Journal of Urban Economics 37:176-200.
Nova Scotia Department of Economic and Rural Development. 2009. The Small Business
Financing Program. Accessed at http://www.ns-credit-unions.com/default.asp?mn=1.19.33.45 on 21 December 2009. Organization for Economic Co-operation and Development. 2000. Local development and Job
creation. Accessed at http://www.oecd.org/dataoecd/3/34/1918339.pdf on 13 October 2009.
Pages, E.R and K. Poole. 2003. Understanding Entrepreneurship Promotion as an Economic
Development Strategy: A Three Stage Survey. National commission on Entrepreneurship and Center for Regional Economic Competitiveness. Papke, J. and L. Papke. 1986. Measuring Differential State and Local Tax Liabilities and their Implications for Business Investment Location. National Tax Journal 39:357-66. Partridge M.D, M.R. Olfert and K. Ali. 2009. Lessons from the Evaluation of Canadian and U.S.
Rural Development Policy. Paper presented on OECD Headquarters Paris. France. Partridge, M. and D.S. Rickman. 2003. Do we know Economic Development when we see it? The Review of Regional Studies 33(1):17-39.
Partridge, M.D. and D.S. Rickman. 1996. The Role of Industry Structure costs and Economic Spillovers in Determining State Employment Growth Rates. The Review of Regional Studies 26:235-264. Partridge, M.D. and D.S. Rickman. 1997. The Dispersion of U.S. State Unemployment rates: The Role of Market and Non-market Equilibrium Factors. Regional Studies 31:593-606. Partridge, M.D., and M.R. Olfert. 2008. Dissention in the Countryside: Bridging the Rural-
Urban Divide with a New Rural Policy. Paper presented at the International Agriculture Trade Research Consortium Symposium. Seoul National University.

109
Partridge, M.D., D.S. Rickman, K.Ali and M.R. Olfert. 2008. Lost in Space: Population Growth in the American Hinterlands and Small Cities. Journal of Economic Geography 8(6):727-757. Partridge, M.D., R. Bollman, M.R. Olfert and A. Alasia. 2007. Riding the Waves or Urban Growth in the Countryside. Land Economics 83(2):128-52.
Partridge. M., M. R. Olfert and A. Alasia. 2007. Canadian Cities as Regional Engines of Growth: Agglomeration and Amenities. Canadian Journal of Economics 40(1):39-68.
Powell, F.W. 1982. Inter-metropolitan Migration and Quality of Life. Journal of Regional
Science 22(2):137-158. Radin, B., R. Agranoff., A. Bowman., C. Buntz., J. Ott., B. Romzek and R. Wilson. 1996. New
governance of Rural America. University Press of Kansas. Lawrence KS. Rainey, D.V. and K.T. McNamara. 2002. Taxes Incentives: Effective Development Strategies for Rural Communities? Journal of Agricultural and Applied Economics. 34(2):319-325.
Rappaport, J. 2004a. Moving to Nice Weather. Working paper, Federal Reserve Bank of Kansas City. Research Division: Kansas.
Rappaport, J. 2004b.Why are Population Flows so Persistent? Journal of Urban Economics 56:554-580. Renkov, M. and D. Hoover. 2000. Commuting, Migration and Rural-Urban Population Dynamics, Journal of Regional Science 40(2):261-287. Roback, J. 1982. Wages, Rents and Quality of Life. The Journal of Political Economy 90(6): 1257-1278.
Rosenthal, S.S. and W.C. Strange. 2001. The Determinants of Agglomeration. Journal of Urban
Economics 50:191-229.
Rothwell, N. R., D. Bollman, J.Tremblay and J. Marshall. 2002. Migration to and from Rural
and Small Town Canada. Catalogue no. 21-006-XIE, Rural and Small Town Canada Analysis Bulletin 3. Statistics Canada: Canada
Rowley, T. 1996. The Value of Rural America. Rural development perspectives 12(1): 2-4. Saskatchewan Credit Unions. 2009. The Credit Union Difference. Accessed at http://www.saskcu.com/pages/The%20Credit%20Union%20Difference.aspx on 20 December 2009. Schmenner, R. 1991. Geography and the Character and Performance of Factories. In Herzog, H. and A. Schlottmann (Eds) Industrial Location and Public Policy. The University of Tennessee Press. Knoxville TN.

110
Scorsone, E., D. Thilmany and S. Davies. 2001. Determinants of Population Change in Regional
Economies: A study of the Colorado Front Range. Paper presented at the American Agricultural Economics Association Annual meeting: Chicago,IL. Sharp, J., K. Agnitsch, B. Ryan and J. Flora. 2002. Social Infrastructure and Community Economic Development Strategies: The Case of Self Development and Industrial Recruitment in Rural Lowa. Journal of Rural Studies 18:405-417. Simon, C. and C. Nardinelli. 2002. Human capital and the Rise of American Cities 1900-1990. Regional Science and Urban Economics 32:59-96.
Social Enterprise Council of Canada. 2010. What is Social Enterprise? Accessed at http://www.enterprisingnonprofits.ca/about_social_enterprise/definitions on 25 April 2010.
Stabler, J.C. and M.R. Olfert. 2002. The Changing Role of Rural Communities in an Urbanizing
World. Saskatchewan 1961-1990. Canadian Plains Research Centre. University of Regina. Saskatchewan. Statistics Canada. 2001. Rural and Small Town Analysis Bulletin. Accessed at http://www.statcan.gc.ca/pub/21-006-x/21-006-x2001003-eng.pdf on 12 February 2010. Statistics Canada. 2002. Geographical Units: Urban Area. Accessed at http://www12.statcan.ca/english/census01/Products/Reference/dict/geo049.htm on 29 December 2009. Statistics Canada. 2009. Population Urban and Rural, by Province and Territory. Accessed at http://www40.statcan.ca/01/cst01/demo on 20 October 2009. Venables, A.J. 1996. Equilibrium Locations of Vertically Linked Industries. Internal Economic
Review 37:341-59. Viladecans-Marsal, E. 2004. Agglomeration and Industrial Location: City Level Evidence. Journal of Economic Geography 4:565-582. Wensley, M.R. and J.C. Stabler. 1998. Demand-threshold Estimation for Business Activities in Rural Saskatchewan. Journal of Regional Science 38(1):155-177. Western Economic Diversification Canada (WD). 2009. Leveraged Loans Agreements. Accessed at http://www.wd-deo.gc.ca/eng/4819.asp on 21 December 2009. World Council of Credit Unions (WOCCU). 2009. What is a Credit Union? Accessed at http://www.woccu.org/about/creditunion?p=pf on 20 October 2009. Zoltan, J.A. and V. Attila. 2005. Entrepreneurship, Agglomeration and Technological Change. Small Business Economics 24:323-334.

111
Appendix A: Semi-structured Interview Guide
A. This section asks about the broad goals, values and policies of your organization towards
involvement in rural areas.
1. Can you describe your perception of the role of your organization in the community? You may distinguish between rural and urban communities if you think this is relevant.
2. Do you see farmers, agricultural businesses, rural business, consumer and nonprofit clients
as all part of your rural base? Do you have a special interest in any of these types of rural clients?
B. This section is about the potential differences in lending in rural and urban areas.
3. Do you have a specific 'small businesses' category of lending? Would the definition of 'small' be different in rural and urban parts of the province? How does this relate to non-traditional lending such as micro-credit or other means of dealing with clients that do not qualify for traditional loans?
4. Describe the differences in the process of lending to rural clients versus urban clients. That
is, would some loan applications from small rural branches need to be approved in larger branches?
C. This section looks at differences between rural and urban clients.
5. What would you say are the average rates of loan application denial? Are there differences between rural and urban clients? Are there differences among types of rural clients?
6. Would there be differences in loan default rates between urban and rural clients?
D. This section is about whether there is a relationship between where deposits come from and
where they are used for loans and investments.
7. Are deposits by rural members/clients any more or less likely to be used for lending in rural areas than for lending anywhere else?
8. For either an urban or rural branch, is there any reason why the lending would be local (or
nearby) rather than national or global?
E. Other Means of Rural Community Support
9. Other than your main deposit and lending activity, are there other means of supporting (rural) communities?
10. Is there anything else you would like to tell us about rural community support?

112
Appendix B: Interview Consent Form
You are invited to participate in a study entitled: The role of credit unions in rural communities. Please read this form carefully, and feel free to ask questions you might have.
Researcher: Fortunate Mavenga, MSc. Candidate
Department of Bioresource Policy, Business and Economics
University of Saskatchewan
Tel: (306) 966-2041
Purpose and procedure: I would like to receive your responses and comments on some
questions about the role of your organization in rural areas. You have been selected because you
are involved in the day-to-day decisions for the financial institution where you are employed and
you have sound knowledge or rich experience of the organization. This study is coordinated by
the Department of Bioresource Policy, Business and Economics (Prof. Olfert), University of
Saskatchewan. The results of this study will form a key part of Ms. Fortunate Mavenga’s MSc.
thesis in Bioresource Policy, Business and Economics. The study is part of a project funded by
the Social Science and Humanities Research Council of Canada (SSHRCC).
The purpose of this study is to examine how credit unions may affect the success of rural
areas. Specifically, it has been argued that rural small businesses do not thrive because they lack
access to business loans from financial institutions. Divergent goals between communities and
financial institutions can make rural vitality difficult, while community residents make savings,
financial institutions look for markets that generate high returns wherever they are. This study
aims to examine if these community based financial institutions have had an impact on rural
communities and to what extent their interests and support are consistent with rural growth.
Your participation in this study is highly appreciated and completely voluntary. It is expected
that the interview should last between 30-60 minutes. During this process you may withdraw at
any time without penalty if you feel uncomfortable or at risk. All interviews will be audio taped

113
and you have the right to shut off the tape recorder at any time if you choose. You should feel
free to decline to answer any particular question(s). If you withdraw from the study, no data
pertaining to your participation will be retained.
Potential benefits: Your participation will help document the role of financial institutions in
rural growth and the mechanisms that have been used to reconcile the interests of the financial
institution and the rural community. Thus, findings from this research may help policy makers
and other financial institutions (banks and credit unions) in Canada and around the world to
improve performance of rural economies in the increasingly competitive environment. For credit
unions and banks that remain in sparsely populated rural areas, improved performance will
ensure that people in rural areas have access to a wide range of services and economic
opportunities. It is possible that you may receive no personal gains from participating in this
study.
Potential risks: Ms. Mavenga will make every effort to protect the confidentiality of your
comments (see below). You should, however, be aware that controversial remarks, in the
unlikely event they are associated with you, could have negative consequences for your
relationships with others in your organization and the other financial organizations. Ms.
Mavenga will try to protect your identity in the ways described below. If for some reason Ms.
Mavenga wishes to quote your comments in some way that might reveal your identity, she will
seek your permission beforehand.
Storage of Data: The transcript and original audio recording of the interview will be securely
stored by the Supervisor (Prof Olfert) at the Department of Bioresource Policy, Business and
Economics for a period of at least five years. Anonymous data will be aggregated with data
gathered from other portions of this research.

114
Confidentiality: Your interview will be recorded and then transcribed by Ms. Mavenga. After
your interview, and prior to the data being included in the final report, you will be given the
opportunity to review the transcript of your interview, and to add, alter, or delete information
from the transcript as you see fit. Only the Researcher and Advisor will have access to the
original audio recording and the transcript.
The research conclusions will be published in a variety of formats, both print and electronic.
These materials may be further used for purposes of conference presentations or publication in
academic journals, books or popular press. In these publications, the data will be reported in a
manner that protects confidentiality and the anonymity of participants. Participants will be
identified without names being used, giving minimal information (for instance, what
organization you are affiliated with). Pseudonyms or composite profiles may be used to disguise
identity further, if necessary. In principle, actual names will not be used; however, participants
whose position involves speaking on behalf of the organization may be asked if certain
comments they have made can be attributed to them by name in publications. Any
communication of these results that has clear potential to compromise your public anonymity
will not proceed without your approval.
Right to Withdraw: Your participation is voluntary, and you can answer only those questions
that you are comfortable with. There is no guarantee that you will personally benefit from your
involvement. The information that is shared will be held in strict confidence and discussed only
with the research team. You may withdraw from the study for any reason, at any time, without
penalty of any sort. If you choose to withdraw from the study at any time, any data that you have
contributed will be destroyed at your request. You will be informed of any major changes that
occur in the circumstances of this study or in the purpose and design of the research that may

115
have a bearing on your decision to remain as a participant. If, after the interview, you think of
something that you would like to change or delete, or you would like to withdraw your interview
response from the research, you may contact the Researcher at the number provided to request
the change or withdrawal.
Questions: If you have any questions concerning the study, please feel free to contact the
Researcher at the number provided.
This study was approved on ethical grounds by the University of Saskatchewan’s
Behavioural Research Ethics Board on __________. Any questions regarding your rights as a
participant may be addressed to that committee through the Ethics Office. This office can be
contacted by e-mail at [email protected] or by phone at (306) 966-2084.
Consent to Participate: I have read and understood the description provided; I have had an
opportunity to ask questions and my questions have been answered. I consent to participate in
the study, understanding that I may withdraw my consent at any time. A copy of this Interview
Consent Form has been given to me for my records.
__________________________ _________________________
(Name of Participant) (Date)
__________________________ _________________________
(Signature of Participant) (Signature of Researcher)

116
Appendix C: Variable Definitions and Data Sources
Variable definitions and data sources
Variable Description Source
POP_CHANGE Dependent variable: Percentage change in population between 1996 and 2006.
1996 and 2006
CoP 22(calculations
by author)
Credit union variables
CU DUMMY Credit union dummy, 1 if a CCS has at least a credit union branch and 0 if a CCS has no credit union branch.
Provincial Credit union centrals, websites, CRERL23
Distance Variables
DNUC
Distance between CCS centroid and centroid of closest nearest urban of any size.
CRERL
IDNMUC
Computed as distance between CCS centroid of the nearest medium urban center minus distance between CCS centroid and centroid of its nearest urban.
CRERL
IDNLUC
Computed as distance between CCS centroid of the nearest large urban center minus distance between CCS centroid and centroid of its nearest urban.
CRERL
Natural amenities variables
STD_DEV_ELEV The standard deviation of CCS elevation as a proxy for hills and mountains.
NRC24, CRERL
SHARE_WATER Percentage of land covered by water. NRC,CRERL
SNOW
Average annual snowfall (cm)
EnviroCan25, CRERL JAN_TEMP Average January temperature (degrees
Celsius) EnviroCan, CRERL
PRECIP
Average annual precipitation (mm) EnviroCan, CRERL
Demographic factors
OWN_POP Own CCS non institutional population in 1996
1996 CoP
NUCP
Nearest urban center population in 1996
CRERL
22 CoP-Statistics Canada census of population. 23 CRERL- Canada Rural Economy Research Lab. 24 NRC-Natural Resources Canada. 30 Environment Canada.

117
SHARE_SELF_EMP Percentage of population 25-54 years with some non-farm self employment.
1996 CoP (calculations by author)
Economic variables
EMPLOY_RATE 1996 employment rate for individuals aged 15+.
1996 CoP(Calculations by author)
EAR_HR
Average 1996 earnings per hour for population 25-54 years (in 1995 constant
1996 CoP
dollars)
SHARE_AGRIC The percentage of the 1996 workforce
that is employed in agriculture. 1996 CoP(calculations by author)
SHARE_OTHER_PRI The percentage of the 1996 workforce that is employed in other primary industries.
1996 CoP(calculations by author)
SHARE_MANU The percentage of the 1996 workforce that is employed in manufacturing sector.
1996 CoP(calculations by author)
HERFINDEX 1996 Herfindahlidex industry concentration at the CCS level. Calculated as ∑s2 where s is the share of employment in industry i.
CoP
SHARE_UNI_DEG Percentage of 1996 population aged 15+ with a university degree
1996 CoP(calculations by author)
Social factors
SHARE_LICO 1996 percentage of population with income below the low income cut-off.
1996 CoP(Calculations by author)
SHARE_OWN_DW 1996 percentage of population in own dwellings.
1996 CoP(Calculations by author)
TOT_CRIME Total crime rate (number of crime per 100,000
CRERL
people)

Regional Partner Organizations
Centre for the Studyof Co-operatives
Community-University Institutefor Social Research
Community Economic and Social Development UnitAlgoma University College
Institute of Urban StudiesUniversity of Winnipeg
Project Funding
Winnipeg Inner-City Research Alliance


