
E-Government Usage in Turkey: An Analysis of the Social Security Institution
5
International Conference on eBusiness, eCommerce, eManagement, eLearning and eGovernance [IC5E] , ı () International Conference on eBusiness, eCommerce, eManagement, eLearning and eGovernance 2015 [IC5E 2015] ISBN 978-81-929742-8-6 VOL 1 Website www.ic5e.org eMail [email protected] Received 01 - January - 2015 Accepted 30 - May - 2015 Article ID IC5E015 eAID IC5E.2015.015 E-Government Usage in Turkey: An Analysis of the Social Security Institution Erginbay Ugurlu 1 , Suleyman Acıkalın 1 1 Department of Economics, FEAS, Hitit University, Corum, Turkey Abstract: This paper investigates the general situation of e-government usage of the Turkey. The monthly reports of Social Security Institution E-Government Gateway of Turkey were published for the years of 2012, 2013 and 2014. In this paper, these data are used as an indicator of e- government usage of Turkey. Basic time series graphs are used in the analysis. The results show that there is no trend in the series. The series move mostly by changes in rules and regulations governing SSI after related news coverage on the media and this could be called as the “curiosity effect”. At last, seasonality of the series was investigated and the seasonal graphs show that generally variables have the lowest level in June. I. INTRODUCTION E-Government or electronic-government could be defined as using the Internet and the other information technology (IT) tools to provide governmental services electronically. It is also called digital-government. Probably the most important aspect of e-government services is its ease to reach information and services electronically without visiting the government offices. Moreover, it reduces costs of providing such services on the government’s side and also reduces bureaucracy and increases transparency and trust. 49.1% of households in Turkey have access to internet according to the Household Information and Communication Technology (ICT) Usage Survey of April 2013. This rate was 47.7 % in March 2012. 35.7% of households that do not have access to the Internet claimed that they do not have need to use Internet [1]. Turkey ranks 21st in the world ranking on financial statements thanks to financial policies implemented in recent years, whereas it ranks 80th in the rate of e-government usage that indicates social capital in the world. In direct proportion to its rate of e-government usage, Turkey ranks 92nd in confidence index [2]. Turkey ranked 80th on United Nations E-Government Development Index in 2012 and even though its position has improved in 2 years and it only ranked 71st in 2014 [3]. [4] states that developing countries such as Turkey and China have to concentrate more on the efforts towards raising the awareness on e-government applications and to increase the extent of the services. [5] argues that the real outcome of e-government is to make public activities transparent and enable citizens to participate more actively and interactively in the country’s administration. The research on e-government activities, their design, effectiveness, and their effects of related parties are limited in Turkey as e- government is relatively a new concept. While most of studies interested in the effects of e-government services on users, [6] analyzed the issue of how public employees think about the e-government activities and to what extent they use the m. [7] explains that there are different types of e-government models such as government-to-citizens, government-to-business, and government-to-government and while establishing an effective e-government system, it is important recognizing the differences among these models. After reviewing the developments on the topic of e-government in the world and in Turkey, [8] reports the main findings of their survey questioning the effect of education and gender among e-government users in Turkey. This paper is prepared exclusively for International Conferenc e on eBusiness, eCommerce, eManagement, eLearning and eGovernance [IC5E] which is published by ASDF International, Registered in London, United Kingdom. Permission to make digital or hard copies of part or all of this work for personal or classroom use is granted without fee provided that copies are not made or distributed for profit or commercial advantage, and that copies bear this notice and the full citation on the first page. Copyrights for third-party components of this work must be honoured. For all other uses, contact the owner/author(s). Copyright Holder can be reached at [email protected] for distribution. 2015 © Reserved by ASDF. international
-
Upload
antonytechno -
Category
Documents
-
view
217 -
download
0
description
This paper investigates the general situation of e-government usage of the Turkey. The monthly reports of Social Security Institution E-Government Gateway of Turkey were published for the years of 2012, 2013 and 2014. In this paper, these data are used as an indicator of egovernment usage of Turkey. Basic time series graphs are used in the analysis. The results show that there is no trend in the series. The series move mostly by changes in rules and regulations governing SSI after related news coverage on the media and this could be called as the “curiosity effect”. At last, seasonality of the series was investigated and the seasonal graphs show that generally variables have the lowest level in June.
Transcript of E-Government Usage in Turkey: An Analysis of the Social Security Institution
7212019 E-Government Usage in Turkey An Analysis of the Social Security Institution
httpslidepdfcomreaderfulle-government-usage-in-turkey-an-analysis-of-the-social-security-institution 15
International Conference on eBusiness eCommerce eManagement eLearning and eGovernance [IC5E] 983089983089983095
983107983145983156983141 983156983144983145983155 983137983154983156983145983139983148983141 983137983155983098 983109983154983143983145983150983138983137983161 983125983143983157983154983148983157 983123983157983148983141983161983149983137983150 983105983139ı983147983137983148983145983150983086 991260983109983085983111983151983158983141983154983150983149983141983150983156 983125983155983137983143983141 983145983150 983124983157983154983147983141983161983098 983105983150 983105983150983137983148983161983155983145983155 983151983142
983156983144983141 983123983151983139983145983137983148 983123983141983139983157983154983145983156983161 983113983150983155983156983145983156983157983156983145983151983150983086991261 983113983150983156983141983154983150983137983156983145983151983150983137983148 983107983151983150983142983141983154983141983150983139983141 983151983150 983141983106983157983155983145983150983141983155983155983084 983141983107983151983149983149983141983154983139983141983084 983141983117983137983150983137983143983141983149983141983150983156983084983141983116983141983137983154983150983145983150983143 983137983150983140 983141983111983151983158983141983154983150983137983150983139983141 (983090983088983089983093)983098 983089983089983095983085983089983090983089983086 983120983154983145983150983156983086
International Conference on eBusiness eCommerce eManagement eLearning and eGovernance2015 [IC5E 2015]
ISBN 978-81-929742-8-6 VOL 1Website wwwic5eorg eMail ic5e2015ic5eorg
Received 01 - January - 2015 Accepted 30 - May - 2015Article ID IC5E015 eAID IC5E2015015
E-Government Usage in Turkey An Analysis of the Social SecurityInstitution
Erginbay Ugurlu1 Suleyman Acıkalın1
1Department of Economics FEAS Hitit University Corum Turkey
Abstract This paper investigates the general situation of e-government usage of the Turkey The monthly reports of Social Security InstitutionE-Government Gateway of Turkey were published for the years of 2012 2013 and 2014 In this paper these data are used as an indicator of e-
government usage of Turkey Basic time series graphs are used in the analysis The results show that there is no trend in the series The series move
mostly by changes in rules and regulations governing SSI after related news coverage on the media and this could be called as the ldquocuriosity effectrdquo Atlast seasonality of the series was investigated and the seasonal graphs show that generally variables have the lowest level in June
I
INTRODUCTION
E-Government or electronic-government could be defined as using the Internet and the other information technology (IT) tools toprovide governmental services electronically It is also called digital-government Probably the most important aspect of e-governmentservices is its ease to reach information and services electronically without visiting the government offices Moreover it reduces costsof providing such services on the governmentrsquos side and also reduces bureaucracy and increases transparency and trust491 of households in Turkey have access to internet according to the Household Information and Communication Technology (ICT)Usage Survey of April 2013 This rate was 477 in March 2012 357 of households that do not have access to the Internet claimedthat they do not have need to use Internet [1]Turkey ranks 21st in the world ranking on financial statements thanks to financial policies implemented in recent years whereas itranks 80th in the rate of e-government usage that indicates social capital in the world In direct proportion to its rate of e-governmentusage Turkey ranks 92nd in confidence index [2]Turkey ranked 80th on United Nations E-Government Development Index in 2012 and even though its position has improved in 2years and it only ranked 71st in 2014 [3] [4] states that developing countries such as Turkey and China have to concentrate more onthe efforts towards raising the awareness on e-government applications and to increase the extent of the services [5] argues that thereal outcome of e-government is to make public activities transparent and enable citizens to participate more actively and interactivelyin the countryrsquos administrationThe research on e-government activities their design effectiveness and their effects of related parties are limited in Turkey as e-government is relatively a new concept While most of studies interested in the effects of e-government services on users [6] analyzedthe issue of how public employees think about the e-government activities and to what extent they use them [7] explains that there aredifferent types of e-government models such as government-to-citizens government-to-business and government-to-government and
while establishing an effective e-government system it is important recognizing the differences among these models After reviewingthe developments on the topic of e-government in the world and in Turkey [8] reports the main findings of their survey questioningthe effect of education and gender among e-government users in Turkey
This paper is prepared exclusively for International Conference on eBusiness eCommerce eManagement eLearning and eGovernance [IC5E] which is published
by ASDF International Registered in London United Kingdom Permission to make digital or hard copies of part or all of this work for personal or classroom useis granted without fee provided that copies are not made or distributed for profit or commercial advantage and that copies bear this notice and the full citation on
the first page Copyrights for third-party components of this work must be honoured For all other uses contact the ownerauthor(s) Copyright Holder can bereached at copyasdfinternational for distribution
2015 copy Reserved by ASDFinternational
7212019 E-Government Usage in Turkey An Analysis of the Social Security Institution
httpslidepdfcomreaderfulle-government-usage-in-turkey-an-analysis-of-the-social-security-institution 25
International Conference on eBusiness eCommerce eManagement eLearning and eGovernance [IC5E] 983089983089983096
983107983145983156983141 983156983144983145983155 983137983154983156983145983139983148983141 983137983155983098 983109983154983143983145983150983138983137983161 983125983143983157983154983148983157 983123983157983148983141983161983149983137983150 983105983139ı983147983137983148983145983150983086 991260983109983085983111983151983158983141983154983150983149983141983150983156 983125983155983137983143983141 983145983150 983124983157983154983147983141983161983098 983105983150 983105983150983137983148983161983155983145983155 983151983142
983156983144983141 983123983151983139983145983137983148 983123983141983139983157983154983145983156983161 983113983150983155983156983145983156983157983156983145983151983150983086991261 983113983150983156983141983154983150983137983156983145983151983150983137983148 983107983151983150983142983141983154983141983150983139983141 983151983150 983141983106983157983155983145983150983141983155983155983084 983141983107983151983149983149983141983154983139983141983084 983141983117983137983150983137983143983141983149983141983150983156983084983141983116983141983137983154983150983145983150983143 983137983150983140 983141983111983151983158983141983154983150983137983150983139983141 (983090983088983089983093)983098 983089983089983095983085983089983090983089983086 983120983154983145983150983156983086
The efforts to build an e-government in Turkey started during the 1990s with the establishment of Information Society The earlyefforts aimed at strengthening Information and Communication Technologies (ICT) capacities in Turkey The main electronic serviceprovided by government was providing simple information to the public via official web sites [9] E-Turkey initiation was started in2001 by the Prime Ministryrsquos ldquoAction Planrdquo circular of 2001352 The idea behind this act was to create a more competitive dynamicand knowledge based economy in Turkey This initiation failed due to economic and politic instability during 2001-2002 in Turkey Anew initiation was started on February 27th 2003 entitled ldquoE-Transformation Turkey Projectrdquo The Information Society Departmentwas established in March 2003 under the control of current Ministry of Development Finally in order to gather all sorts of electronic
government services under the same portal it was decided to constitute an ldquoE-Government Gatewayrdquo by the Council of Ministersdecision dated 2006103016 and started to operate at httpswwwturkiyegovtr web address As stated in [10] thousands ofaddresses could be accessed through e-government gateway since 2008 in Turkey In 2013 the e-government gateway provided 638public services of 80 government organizationsIn order to provide quality health services for all citizens a General Health Insurance program is targeted by the government in 2006and after two years delay a new legislation put into law with the decree of 5510 on October 1st 2008 All sorts of health insuranceconcerns are coordinated under the E-Government GatewayThis study takes the case of e-services provided by the Republic of Turkey Social Security Institution as part of the E-GovernmentGateway Another study [11] discusses the interactions between e-government and the position of e-government application in SSI andthe benefits of these applications for the citizens and accountantsOur aim is to analyze the use of e-government services by public using monthly data from SSI for the period of January 2012 toDecember 2014 We would like to determine how the use of these services has changed through time for the period whether certainchanges took place during this period or not
II E-GOVERNMENT SERVICES OF SOCIAL SECURITY INSTITUTION OF TURKEY
The Social Security Institution (SSI) was established in 2006 with the objective of the realization of a social security system in TurkeyIt is constituted by syndicating three social security institutions which are Social Insurances Institution Retirement Fund and Bağ-Kur(The Social Insurance Institution for Tradesmen and Craftsmen and Other Self-Employed People) under a single roof by Law No 5502of 2006 Briefly duties of the SSI according to Article 3 of the Law No 5502 are summarized as implement the social security policiesinform natural and legal persons follow up international developments to collaborate with the European Union and InternationalorganizationsThere are various e-government applications available on the SSI web site however they are only available in Turkish Moreoverstatistics about e-government applications are available in e-book format titled ldquoSSI E-Government Gateway Statisticsrdquo for the years of2012 2013 and 2014 on the SSI web page (httpwwwsgkgovtr)In this paper we use ldquoSSI E-Government Gateway Statisticsrdquo for 2012 2013 and 2014 The number of service applications providedon SSI web site was increased from 31 in 2012 to 42 applications in 2013 and 2014 In order to have a balanced time series data weomitted the services which are not common to all three years and thus we obtained 26 variables The 27 th variable is the total numberof transactions performed with these 26 applications Table 1 shows the abbreviation of the variables and their definition
TABLE IDEFINATION OF VARIABLES
Abbreviation Definition Abbreviation Definition
AGBRP 4A GermanyBulgaria Retirement Payments BRPI 4B Retiree Pension Information
ACBA 4A Change of Bank and Address BSI 4B Service Information
ARPC 4A Retiree Pension Cuts BPR 4B Payment Record
ARPI 4A Retiree Pension Information BRR 4B Registry Record
ARPAI 4A Retiree Payment Information CCB 4C Change of Banks
ARR 4A Retirement Registration COMSP 4C One Month SalaryPension Preference
ASR 4A Service Record CRPC 4C Retiree Pension Cuts
ADIRR 4A Determination of Insured Registry CRPI 4C Retiree Pension Information
ABDP 4A4B Disability Payments CTRP 4C Tracking of Retirement Process
ABCDTI 4A4B4C Drug Use Time Inquiry CROP 4C Record of Optional Payments
ABCEPFI 4A4B4C Examination Participation Fee CRR 4C Registry Record
BCBA 4B Change of Bank and Address TII Treatment Information Inquiry
BGSI 4B GradeSeniority Information Total Total
BSD 4B Status of Debt
The variables listed on Table 1 are divided into three categories as 4A 4B and 4C This classification is due to Article 4 of Law No5510 The three categories that were covered by previous legislation employees (4A) self-employed (4B) and civil servants (4C) [12]
7212019 E-Government Usage in Turkey An Analysis of the Social Security Institution
httpslidepdfcomreaderfulle-government-usage-in-turkey-an-analysis-of-the-social-security-institution 35
International Conference on eBusiness eCommerce eManagement eLearning and eGovernance [IC5E] 983089983089983097
983107983145983156983141 983156983144983145983155 983137983154983156983145983139983148983141 983137983155983098 983109983154983143983145983150983138983137983161 983125983143983157983154983148983157 983123983157983148983141983161983149983137983150 983105983139ı983147983137983148983145983150983086 991260983109983085983111983151983158983141983154983150983149983141983150983156 983125983155983137983143983141 983145983150 983124983157983154983147983141983161983098 983105983150 983105983150983137983148983161983155983145983155 983151983142
983156983144983141 983123983151983139983145983137983148 983123983141983139983157983154983145983156983161 983113983150983155983156983145983156983157983156983145983151983150983086991261 983113983150983156983141983154983150983137983156983145983151983150983137983148 983107983151983150983142983141983154983141983150983139983141 983151983150 983141983106983157983155983145983150983141983155983155983084 983141983107983151983149983149983141983154983139983141983084 983141983117983137983150983137983143983141983149983141983150983156983084983141983116983141983137983154983150983145983150983143 983137983150983140 983141983111983151983158983141983154983150983137983150983139983141 (983090983088983089983093)983098 983089983089983095983085983089983090983089983086 983120983154983145983150983156983086
III AN ANALYSIS OF ISI E-GOVERNMENT GATEWAY STATISTICS
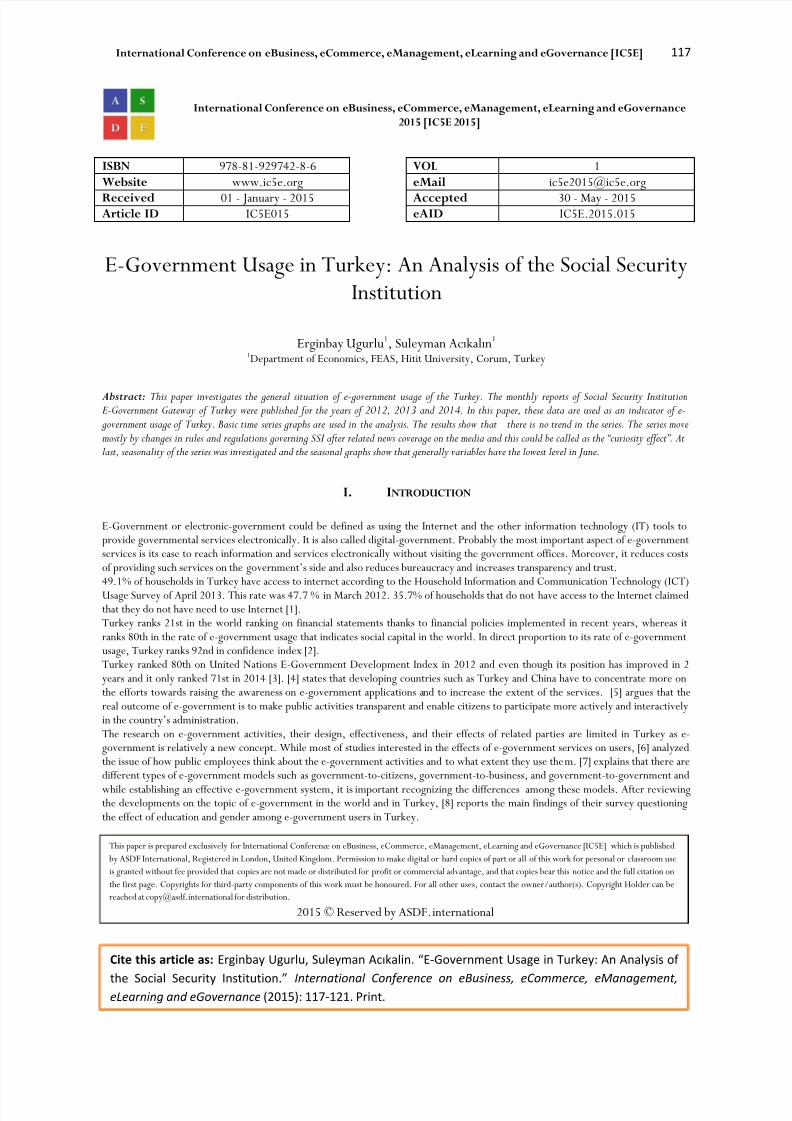
There are total of 26 variables to work with in this data set and performing graphical analysis for ach variable separately would not besuitable for presentation purposes Therefore we gathered similar applications in the same group for presentation and analysispurposesFigure 1 has two panels and while the line graphs of the variables of ABCDTI ABCEPFI ABDP and ACBA are shown on the first panelon the left the line graphs of the variables of ADIRR ARPI BSD ARR CROP and BSI are shown on the second panel on the rightThe first observation on Figure 1 is that the use of applications was clearly high on the first month of 2012 and started to decline
gradually for the following months for almost all of the variables representing various use of e-government applications This situationcould be called as the ldquocuriosity effectrdquo as using SSI web site became easier after December 2011 [13] informs public about a change inregulations related to use of SSI services provided on the web At the beginning people who have social security related inquiries hadto use e-government gateway portal which required a password that could be obtained only at PTT centers for a small fee Thissituation has changed and people are allowed to use SSI web site directly without any password after December 15 2011About the first panel on the left values of all variables (ABCDTI ABCEPFI ABDP ACBA and ADIRR) are approximately on thesame interval of 100000 to 400000 uses for the period under analysis however there is a single peak for ACBA in the fourth monthof 2013 This application is ldquoChange of Address and Bankrdquo for the usersThe panel on the right has two sub-groups where ARR CROP and BSI values are measured on the left vertical axis and the values ofARPI and BSD are measured on the right vertical axis These two-sub groups followed two different patterns for the whole periodwhile variables in each sub-group moved together ARR CROP and BSI started very high back in January 2012 declined graduallyuntil the second quarter of 2013 and they stayed stable at low use values until the middle of 2014 and they started to increase againuntil the end of 2014 ARPI and BSD on the other hand showed more fluctuations but moved together ARPI is retiree pensioninformation and BSD is status of debt services There is a sharp increase on the value of BRPI in the first month of 2013
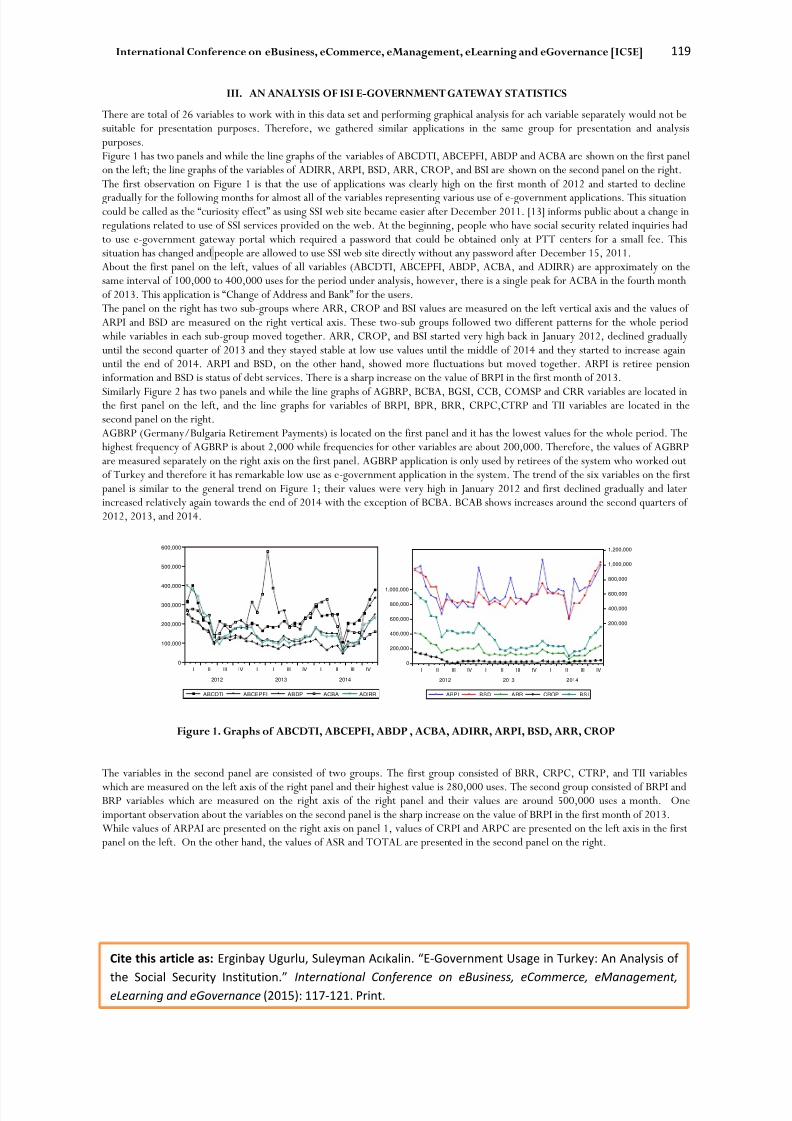
Similarly Figure 2 has two panels and while the line graphs of AGBRP BCBA BGSI CCB COMSP and CRR variables are located inthe first panel on the left and the line graphs for variables of BRPI BPR BRR CRPCCTRP and TII variables are located in thesecond panel on the rightAGBRP (GermanyBulgaria Retirement Payments) is located on the first panel and it has the lowest values for the whole period Thehighest frequency of AGBRP is about 2000 while frequencies for other variables are about 200000 Therefore the values of AGBRPare measured separately on the right axis on the first panel AGBRP application is only used by retirees of the system who worked outof Turkey and therefore it has remarkable low use as e-government application in the system The trend of the six variables on the firstpanel is similar to the general trend on Figure 1 their values were very high in January 2012 and first declined gradually and laterincreased relatively again towards the end of 2014 with the exception of BCBA BCAB shows increases around the second quarters of2012 2013 and 2014
0
100000
200000
300000
400000
500000
600000
I II III IV I II III IV I II III IV
2012 2013 2014
ABCDTI ABCEPFI ABDP ACBA ADIRR
0
200000
400000
600000
800000
1000000
200000
400000
600000
800000
1000000
1200000
I II III IV I II III IV I II III IV
2012 2013 2014
ARPI BSD ARR CROP BSI
Figure 1 Graphs of ABCDTI ABCEPFI ABDP ACBA ADIRR ARPI BSD ARR CROP
The variables in the second panel are consisted of two groups The first group consisted of BRR CRPC CTRP and TII variables
which are measured on the left axis of the right panel and their highest value is 280000 uses The second group consisted of BRPI andBRP variables which are measured on the right axis of the right panel and their values are around 500000 uses a month Oneimportant observation about the variables on the second panel is the sharp increase on the value of BRPI in the first month of 2013While values of ARPAI are presented on the right axis on panel 1 values of CRPI and ARPC are presented on the left axis in the firstpanel on the left On the other hand the values of ASR and TOTAL are presented in the second panel on the right
7212019 E-Government Usage in Turkey An Analysis of the Social Security Institution
httpslidepdfcomreaderfulle-government-usage-in-turkey-an-analysis-of-the-social-security-institution 45
International Conference on eBusiness eCommerce eManagement eLearning and eGovernance [IC5E] 983089983090983088
983107983145983156983141 983156983144983145983155 983137983154983156983145983139983148983141 983137983155983098 983109983154983143983145983150983138983137983161 983125983143983157983154983148983157 983123983157983148983141983161983149983137983150 983105983139ı983147983137983148983145983150983086 991260983109983085983111983151983158983141983154983150983149983141983150983156 983125983155983137983143983141 983145983150 983124983157983154983147983141983161983098 983105983150 983105983150983137983148983161983155983145983155 983151983142
983156983144983141 983123983151983139983145983137983148 983123983141983139983157983154983145983156983161 983113983150983155983156983145983156983157983156983145983151983150983086991261 983113983150983156983141983154983150983137983156983145983151983150983137983148 983107983151983150983142983141983154983141983150983139983141 983151983150 983141983106983157983155983145983150983141983155983155983084 983141983107983151983149983149983141983154983139983141983084 983141983117983137983150983137983143983141983149983141983150983156983084983141983116983141983137983154983150983145983150983143 983137983150983140 983141983111983151983158983141983154983150983137983150983139983141 (983090983088983089983093)983098 983089983089983095983085983089983090983089983086 983120983154983145983150983156983086
0
50000
100000
150000
200000
0
400
800
1200
1600
2000
I II III IV I II III IV I II III IV
2012 2013 2014
AGBRP BCBA BGSI CCB COMSP
CRR
0
40000
80000
120000
160000
200000
240000
280000
0
100000
200000
300000
400000
500000
I II III IV I II III IV I II III IV
2012 2013 2014
BRPI BPR BRR CRPC CTRP
TII
Figure 2 Graphs of AGBRP BCBA BGSI CCB COMSP CRR BRPI BPR BRR CRPCCTRP TII
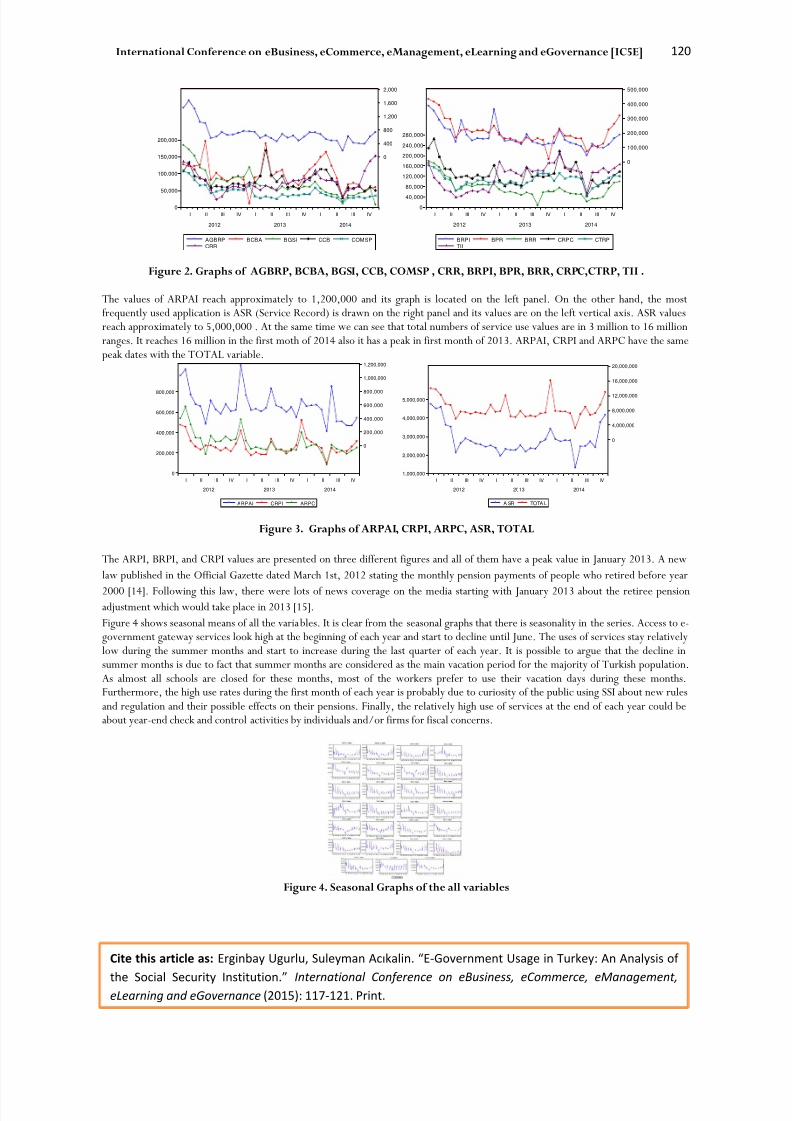
The values of ARPAI reach approximately to 1200000 and its graph is located on the left panel On the other hand the mostfrequently used application is ASR (Service Record) is drawn on the right panel and its values are on the left vertical axis ASR valuesreach approximately to 5000000 At the same time we can see that total numbers of service use values are in 3 million to 16 millionranges It reaches 16 million in the first moth of 2014 also it has a peak in first month of 2013 ARPAI CRPI and ARPC have the samepeak dates with the TOTAL variable
0
200000
400000
600000
800000
0
200000
400000
600000
800000
1000000
1200000
I II III IV I II III IV I II III IV
2012 2013 2014
ARPAI CRPI ARPC
1000000
2000000
3000000
4000000
5000000
0
4000000
8000000
12000000
16000000
20000000
I II III IV I II III IV I II III IV
2012 2013 2014
A SR TOTA L
Figure 3 Graphs of ARPAI CRPI ARPC ASR TOTAL
The ARPI BRPI and CRPI values are presented on three different figures and all of them have a peak value in January 2013 A new
law published in the Official Gazette dated March 1st 2012 stating the monthly pension payments of people who retired before year
2000 [14] Following this law there were lots of news coverage on the media starting with January 2013 about the retiree pensionadjustment which would take place in 2013 [15]
Figure 4 shows seasonal means of all the variables It is clear from the seasonal graphs that there is seasonality in the series Access to e-government gateway services look high at the beginning of each year and start to decline until June The uses of services stay relativelylow during the summer months and start to increase during the last quarter of each year It is possible to argue that the decline insummer months is due to fact that summer months are considered as the main vacation period for the majority of Turkish populationAs almost all schools are closed for these months most of the workers prefer to use their vacation days during these monthsFurthermore the high use rates during the first month of each year is probably due to curiosity of the public using SSI about new rulesand regulation and their possible effects on their pensions Finally the relatively high use of services at the end of each year could beabout year-end check and control activities by individuals andor firms for fiscal concerns
Figure 4 Seasonal Graphs of the all variables
7212019 E-Government Usage in Turkey An Analysis of the Social Security Institution
httpslidepdfcomreaderfulle-government-usage-in-turkey-an-analysis-of-the-social-security-institution 55
International Conference on eBusiness eCommerce eManagement eLearning and eGovernance [IC5E] 983089983090983089
983107983145983156983141 983156983144983145983155 983137983154983156983145983139983148983141 983137983155983098 983109983154983143983145983150983138983137983161 983125983143983157983154983148983157 983123983157983148983141983161983149983137983150 983105983139ı983147983137983148983145983150983086 991260983109983085983111983151983158983141983154983150983149983141983150983156 983125983155983137983143983141 983145983150 983124983157983154983147983141983161983098 983105983150 983105983150983137983148983161983155983145983155 983151983142
983156983144983141 983123983151983139983145983137983148 983123983141983139983157983154983145983156983161 983113983150983155983156983145983156983157983156983145983151983150983086991261 983113983150983156983141983154983150983137983156983145983151983150983137983148 983107983151983150983142983141983154983141983150983139983141 983151983150 983141983106983157983155983145983150983141983155983155983084 983141983107983151983149983149983141983154983139983141983084 983141983117983137983150983137983143983141983149983141983150983156983084983141983116983141983137983154983150983145983150983143 983137983150983140 983141983111983151983158983141983154983150983137983150983139983141 (983090983088983089983093)983098 983089983089983095983085983089983090983089983086 983120983154983145983150983156983086
IV CONCLUSION
SSI E-Government Gateway statistics are used in this study for the period of 2012-2014 Time series characteristics of the series areinvestigated and evaluatedAt first the peak values are determined and possible reasons behind them are investigated It looks like that the news in the mediaabout changes in regulations and adjustments to benefits is the main reason behind the change in the use rate of e-government servicesMoreover the use declines starting after January and reaches its lowest level in June and stays low during the summer months This isprobably because of summer months are used for vacation It is expected to see an increase in use of e-government services through
time since the use of Internet
Furthermore the use of Internet among Turkish households increased only a small percentage from 477 in 2012 to 491 in 2013as mentioned above in introduction Our study shows that while the use of SSI E-Government Gateway services fluctuated during the3-year period any increase in e-government service use could not be found
REFERENCES
1 TUumlİK wwwtuikgovtrPreHaberBultenleridoid=135692 M Ayaz S Oumlzcan and E Zengin ldquoThe Impact of Using E-Government on Social Capitalrdquo Journal of European Social
Research Volume 1 Issue 1 pp 102 ndash 120 March 20153 httpunpan3unorgegovkbPortalsegovkbDocumentsun2014-SurveyE-Gov_Complete_Survey-2014pdf4 Ouml Kuumllcuuml Evolution of e-records management practices in e-government A Turkish perspective The Electronic Library
Vol 27 Issue 6 pp 999 ndash 1009 20095 S Baştan and N Goumlkbunar ldquoKamu Hizmetlerinin Sunumunda E-Devletle İlgili Yeni Gelişmeler Tuumlmleşik E-Devlet
Sistemlerine Doğrurdquo Dokuz Eyluumll Uumlniversitesi İktisadi ve İdari Bilimler Fakuumlltesi Dergisi Vol 19 No 1 PP 71-89
20046
E E Goumlkccedileoğlu and N Yavuz ldquoEvaluating E-Government Initiatives in Turkey From the Perspective of Public EmployeesA Case Study and Preliminary Findingsrdquo 2nd International Conference on Internet E-Learning amp Education Technologies (ICIEET 2013)
7 R Benzer ldquoE-Government in Developed Countries The Case of Turkeyrdquo (IJCSIT) International Journal of ComputerScience and Information Technologies Vol 6 (1) 2015 710-714
8 I Akman A Yazici AMishra and AArifoglu ldquoE-Government A global view and an empirical evaluation of someattributes of citizensrdquo Government Information Quaterly xx (2005) xxxndashxxx (article in press)
9 Y Ogurlu ldquoE-Government Portal and E-Services in Turkeyrdquo Epiphany Journal of Transdisciplinary Studies Vol 7Number 2 2014
10 Abdullah Naralan Ali Kemal Ccedilelik Selccediluk Bakan Research Journal of Economics Business and ICT Vol 8 No 2 pp 44-54October 17 2013
11 A A Tunga A Şahin and Y Ceran ldquoE-Government Applications in SSI an Evaluation of the Application Benefits toCitizens and Accountantsrdquo 6th International Academic Conference - International Institute of Social and Economic Sciences
June 23-26 Bergen Norway s 66 201312 Delegation of the European Commission in Turkey ldquoTechnical Assistance for Capacity Building of The Social Security
Institution Turkeyrdquo httpwwwavrupainfotrfileadminContentFilesImageshaber_arsivi2012MappingStudypdf13 HABERTURK httpwwwhaberturkcomgundemhaber928463-sgk-prim-sorgulama-sayfasi-sgk-prim-sorgulama-
nasil-yapilir14
SSKEMEKLI wwwsskemeklicomintibak-islemlerihtml15 MILLIYET wwwmilliyetcomtrgul-4-5-miyon-kisiyi-ilgilendiren-kanunu-
onayladisiyasetsiyasetdetay180120131657277defaulthtm

7212019 E-Government Usage in Turkey An Analysis of the Social Security Institution
httpslidepdfcomreaderfulle-government-usage-in-turkey-an-analysis-of-the-social-security-institution 25
International Conference on eBusiness eCommerce eManagement eLearning and eGovernance [IC5E] 983089983089983096
983107983145983156983141 983156983144983145983155 983137983154983156983145983139983148983141 983137983155983098 983109983154983143983145983150983138983137983161 983125983143983157983154983148983157 983123983157983148983141983161983149983137983150 983105983139ı983147983137983148983145983150983086 991260983109983085983111983151983158983141983154983150983149983141983150983156 983125983155983137983143983141 983145983150 983124983157983154983147983141983161983098 983105983150 983105983150983137983148983161983155983145983155 983151983142
983156983144983141 983123983151983139983145983137983148 983123983141983139983157983154983145983156983161 983113983150983155983156983145983156983157983156983145983151983150983086991261 983113983150983156983141983154983150983137983156983145983151983150983137983148 983107983151983150983142983141983154983141983150983139983141 983151983150 983141983106983157983155983145983150983141983155983155983084 983141983107983151983149983149983141983154983139983141983084 983141983117983137983150983137983143983141983149983141983150983156983084983141983116983141983137983154983150983145983150983143 983137983150983140 983141983111983151983158983141983154983150983137983150983139983141 (983090983088983089983093)983098 983089983089983095983085983089983090983089983086 983120983154983145983150983156983086
The efforts to build an e-government in Turkey started during the 1990s with the establishment of Information Society The earlyefforts aimed at strengthening Information and Communication Technologies (ICT) capacities in Turkey The main electronic serviceprovided by government was providing simple information to the public via official web sites [9] E-Turkey initiation was started in2001 by the Prime Ministryrsquos ldquoAction Planrdquo circular of 2001352 The idea behind this act was to create a more competitive dynamicand knowledge based economy in Turkey This initiation failed due to economic and politic instability during 2001-2002 in Turkey Anew initiation was started on February 27th 2003 entitled ldquoE-Transformation Turkey Projectrdquo The Information Society Departmentwas established in March 2003 under the control of current Ministry of Development Finally in order to gather all sorts of electronic
government services under the same portal it was decided to constitute an ldquoE-Government Gatewayrdquo by the Council of Ministersdecision dated 2006103016 and started to operate at httpswwwturkiyegovtr web address As stated in [10] thousands ofaddresses could be accessed through e-government gateway since 2008 in Turkey In 2013 the e-government gateway provided 638public services of 80 government organizationsIn order to provide quality health services for all citizens a General Health Insurance program is targeted by the government in 2006and after two years delay a new legislation put into law with the decree of 5510 on October 1st 2008 All sorts of health insuranceconcerns are coordinated under the E-Government GatewayThis study takes the case of e-services provided by the Republic of Turkey Social Security Institution as part of the E-GovernmentGateway Another study [11] discusses the interactions between e-government and the position of e-government application in SSI andthe benefits of these applications for the citizens and accountantsOur aim is to analyze the use of e-government services by public using monthly data from SSI for the period of January 2012 toDecember 2014 We would like to determine how the use of these services has changed through time for the period whether certainchanges took place during this period or not
II E-GOVERNMENT SERVICES OF SOCIAL SECURITY INSTITUTION OF TURKEY
The Social Security Institution (SSI) was established in 2006 with the objective of the realization of a social security system in TurkeyIt is constituted by syndicating three social security institutions which are Social Insurances Institution Retirement Fund and Bağ-Kur(The Social Insurance Institution for Tradesmen and Craftsmen and Other Self-Employed People) under a single roof by Law No 5502of 2006 Briefly duties of the SSI according to Article 3 of the Law No 5502 are summarized as implement the social security policiesinform natural and legal persons follow up international developments to collaborate with the European Union and InternationalorganizationsThere are various e-government applications available on the SSI web site however they are only available in Turkish Moreoverstatistics about e-government applications are available in e-book format titled ldquoSSI E-Government Gateway Statisticsrdquo for the years of2012 2013 and 2014 on the SSI web page (httpwwwsgkgovtr)In this paper we use ldquoSSI E-Government Gateway Statisticsrdquo for 2012 2013 and 2014 The number of service applications providedon SSI web site was increased from 31 in 2012 to 42 applications in 2013 and 2014 In order to have a balanced time series data weomitted the services which are not common to all three years and thus we obtained 26 variables The 27 th variable is the total numberof transactions performed with these 26 applications Table 1 shows the abbreviation of the variables and their definition
TABLE IDEFINATION OF VARIABLES
Abbreviation Definition Abbreviation Definition
AGBRP 4A GermanyBulgaria Retirement Payments BRPI 4B Retiree Pension Information
ACBA 4A Change of Bank and Address BSI 4B Service Information
ARPC 4A Retiree Pension Cuts BPR 4B Payment Record
ARPI 4A Retiree Pension Information BRR 4B Registry Record
ARPAI 4A Retiree Payment Information CCB 4C Change of Banks
ARR 4A Retirement Registration COMSP 4C One Month SalaryPension Preference
ASR 4A Service Record CRPC 4C Retiree Pension Cuts
ADIRR 4A Determination of Insured Registry CRPI 4C Retiree Pension Information
ABDP 4A4B Disability Payments CTRP 4C Tracking of Retirement Process
ABCDTI 4A4B4C Drug Use Time Inquiry CROP 4C Record of Optional Payments
ABCEPFI 4A4B4C Examination Participation Fee CRR 4C Registry Record
BCBA 4B Change of Bank and Address TII Treatment Information Inquiry
BGSI 4B GradeSeniority Information Total Total
BSD 4B Status of Debt
The variables listed on Table 1 are divided into three categories as 4A 4B and 4C This classification is due to Article 4 of Law No5510 The three categories that were covered by previous legislation employees (4A) self-employed (4B) and civil servants (4C) [12]
7212019 E-Government Usage in Turkey An Analysis of the Social Security Institution
httpslidepdfcomreaderfulle-government-usage-in-turkey-an-analysis-of-the-social-security-institution 35
International Conference on eBusiness eCommerce eManagement eLearning and eGovernance [IC5E] 983089983089983097
983107983145983156983141 983156983144983145983155 983137983154983156983145983139983148983141 983137983155983098 983109983154983143983145983150983138983137983161 983125983143983157983154983148983157 983123983157983148983141983161983149983137983150 983105983139ı983147983137983148983145983150983086 991260983109983085983111983151983158983141983154983150983149983141983150983156 983125983155983137983143983141 983145983150 983124983157983154983147983141983161983098 983105983150 983105983150983137983148983161983155983145983155 983151983142
983156983144983141 983123983151983139983145983137983148 983123983141983139983157983154983145983156983161 983113983150983155983156983145983156983157983156983145983151983150983086991261 983113983150983156983141983154983150983137983156983145983151983150983137983148 983107983151983150983142983141983154983141983150983139983141 983151983150 983141983106983157983155983145983150983141983155983155983084 983141983107983151983149983149983141983154983139983141983084 983141983117983137983150983137983143983141983149983141983150983156983084983141983116983141983137983154983150983145983150983143 983137983150983140 983141983111983151983158983141983154983150983137983150983139983141 (983090983088983089983093)983098 983089983089983095983085983089983090983089983086 983120983154983145983150983156983086
III AN ANALYSIS OF ISI E-GOVERNMENT GATEWAY STATISTICS
There are total of 26 variables to work with in this data set and performing graphical analysis for ach variable separately would not besuitable for presentation purposes Therefore we gathered similar applications in the same group for presentation and analysispurposesFigure 1 has two panels and while the line graphs of the variables of ABCDTI ABCEPFI ABDP and ACBA are shown on the first panelon the left the line graphs of the variables of ADIRR ARPI BSD ARR CROP and BSI are shown on the second panel on the rightThe first observation on Figure 1 is that the use of applications was clearly high on the first month of 2012 and started to decline
gradually for the following months for almost all of the variables representing various use of e-government applications This situationcould be called as the ldquocuriosity effectrdquo as using SSI web site became easier after December 2011 [13] informs public about a change inregulations related to use of SSI services provided on the web At the beginning people who have social security related inquiries hadto use e-government gateway portal which required a password that could be obtained only at PTT centers for a small fee Thissituation has changed and people are allowed to use SSI web site directly without any password after December 15 2011About the first panel on the left values of all variables (ABCDTI ABCEPFI ABDP ACBA and ADIRR) are approximately on thesame interval of 100000 to 400000 uses for the period under analysis however there is a single peak for ACBA in the fourth monthof 2013 This application is ldquoChange of Address and Bankrdquo for the usersThe panel on the right has two sub-groups where ARR CROP and BSI values are measured on the left vertical axis and the values ofARPI and BSD are measured on the right vertical axis These two-sub groups followed two different patterns for the whole periodwhile variables in each sub-group moved together ARR CROP and BSI started very high back in January 2012 declined graduallyuntil the second quarter of 2013 and they stayed stable at low use values until the middle of 2014 and they started to increase againuntil the end of 2014 ARPI and BSD on the other hand showed more fluctuations but moved together ARPI is retiree pensioninformation and BSD is status of debt services There is a sharp increase on the value of BRPI in the first month of 2013
Similarly Figure 2 has two panels and while the line graphs of AGBRP BCBA BGSI CCB COMSP and CRR variables are located inthe first panel on the left and the line graphs for variables of BRPI BPR BRR CRPCCTRP and TII variables are located in thesecond panel on the rightAGBRP (GermanyBulgaria Retirement Payments) is located on the first panel and it has the lowest values for the whole period Thehighest frequency of AGBRP is about 2000 while frequencies for other variables are about 200000 Therefore the values of AGBRPare measured separately on the right axis on the first panel AGBRP application is only used by retirees of the system who worked outof Turkey and therefore it has remarkable low use as e-government application in the system The trend of the six variables on the firstpanel is similar to the general trend on Figure 1 their values were very high in January 2012 and first declined gradually and laterincreased relatively again towards the end of 2014 with the exception of BCBA BCAB shows increases around the second quarters of2012 2013 and 2014
0
100000
200000
300000
400000
500000
600000
I II III IV I II III IV I II III IV
2012 2013 2014
ABCDTI ABCEPFI ABDP ACBA ADIRR
0
200000
400000
600000
800000
1000000
200000
400000
600000
800000
1000000
1200000
I II III IV I II III IV I II III IV
2012 2013 2014
ARPI BSD ARR CROP BSI
Figure 1 Graphs of ABCDTI ABCEPFI ABDP ACBA ADIRR ARPI BSD ARR CROP
The variables in the second panel are consisted of two groups The first group consisted of BRR CRPC CTRP and TII variables
which are measured on the left axis of the right panel and their highest value is 280000 uses The second group consisted of BRPI andBRP variables which are measured on the right axis of the right panel and their values are around 500000 uses a month Oneimportant observation about the variables on the second panel is the sharp increase on the value of BRPI in the first month of 2013While values of ARPAI are presented on the right axis on panel 1 values of CRPI and ARPC are presented on the left axis in the firstpanel on the left On the other hand the values of ASR and TOTAL are presented in the second panel on the right
7212019 E-Government Usage in Turkey An Analysis of the Social Security Institution
httpslidepdfcomreaderfulle-government-usage-in-turkey-an-analysis-of-the-social-security-institution 45
International Conference on eBusiness eCommerce eManagement eLearning and eGovernance [IC5E] 983089983090983088
983107983145983156983141 983156983144983145983155 983137983154983156983145983139983148983141 983137983155983098 983109983154983143983145983150983138983137983161 983125983143983157983154983148983157 983123983157983148983141983161983149983137983150 983105983139ı983147983137983148983145983150983086 991260983109983085983111983151983158983141983154983150983149983141983150983156 983125983155983137983143983141 983145983150 983124983157983154983147983141983161983098 983105983150 983105983150983137983148983161983155983145983155 983151983142
983156983144983141 983123983151983139983145983137983148 983123983141983139983157983154983145983156983161 983113983150983155983156983145983156983157983156983145983151983150983086991261 983113983150983156983141983154983150983137983156983145983151983150983137983148 983107983151983150983142983141983154983141983150983139983141 983151983150 983141983106983157983155983145983150983141983155983155983084 983141983107983151983149983149983141983154983139983141983084 983141983117983137983150983137983143983141983149983141983150983156983084983141983116983141983137983154983150983145983150983143 983137983150983140 983141983111983151983158983141983154983150983137983150983139983141 (983090983088983089983093)983098 983089983089983095983085983089983090983089983086 983120983154983145983150983156983086
0
50000
100000
150000
200000
0
400
800
1200
1600
2000
I II III IV I II III IV I II III IV
2012 2013 2014
AGBRP BCBA BGSI CCB COMSP
CRR
0
40000
80000
120000
160000
200000
240000
280000
0
100000
200000
300000
400000
500000
I II III IV I II III IV I II III IV
2012 2013 2014
BRPI BPR BRR CRPC CTRP
TII
Figure 2 Graphs of AGBRP BCBA BGSI CCB COMSP CRR BRPI BPR BRR CRPCCTRP TII
The values of ARPAI reach approximately to 1200000 and its graph is located on the left panel On the other hand the mostfrequently used application is ASR (Service Record) is drawn on the right panel and its values are on the left vertical axis ASR valuesreach approximately to 5000000 At the same time we can see that total numbers of service use values are in 3 million to 16 millionranges It reaches 16 million in the first moth of 2014 also it has a peak in first month of 2013 ARPAI CRPI and ARPC have the samepeak dates with the TOTAL variable
0
200000
400000
600000
800000
0
200000
400000
600000
800000
1000000
1200000
I II III IV I II III IV I II III IV
2012 2013 2014
ARPAI CRPI ARPC
1000000
2000000
3000000
4000000
5000000
0
4000000
8000000
12000000
16000000
20000000
I II III IV I II III IV I II III IV
2012 2013 2014
A SR TOTA L
Figure 3 Graphs of ARPAI CRPI ARPC ASR TOTAL
The ARPI BRPI and CRPI values are presented on three different figures and all of them have a peak value in January 2013 A new
law published in the Official Gazette dated March 1st 2012 stating the monthly pension payments of people who retired before year
2000 [14] Following this law there were lots of news coverage on the media starting with January 2013 about the retiree pensionadjustment which would take place in 2013 [15]
Figure 4 shows seasonal means of all the variables It is clear from the seasonal graphs that there is seasonality in the series Access to e-government gateway services look high at the beginning of each year and start to decline until June The uses of services stay relativelylow during the summer months and start to increase during the last quarter of each year It is possible to argue that the decline insummer months is due to fact that summer months are considered as the main vacation period for the majority of Turkish populationAs almost all schools are closed for these months most of the workers prefer to use their vacation days during these monthsFurthermore the high use rates during the first month of each year is probably due to curiosity of the public using SSI about new rulesand regulation and their possible effects on their pensions Finally the relatively high use of services at the end of each year could beabout year-end check and control activities by individuals andor firms for fiscal concerns
Figure 4 Seasonal Graphs of the all variables
7212019 E-Government Usage in Turkey An Analysis of the Social Security Institution
httpslidepdfcomreaderfulle-government-usage-in-turkey-an-analysis-of-the-social-security-institution 55
International Conference on eBusiness eCommerce eManagement eLearning and eGovernance [IC5E] 983089983090983089
983107983145983156983141 983156983144983145983155 983137983154983156983145983139983148983141 983137983155983098 983109983154983143983145983150983138983137983161 983125983143983157983154983148983157 983123983157983148983141983161983149983137983150 983105983139ı983147983137983148983145983150983086 991260983109983085983111983151983158983141983154983150983149983141983150983156 983125983155983137983143983141 983145983150 983124983157983154983147983141983161983098 983105983150 983105983150983137983148983161983155983145983155 983151983142
983156983144983141 983123983151983139983145983137983148 983123983141983139983157983154983145983156983161 983113983150983155983156983145983156983157983156983145983151983150983086991261 983113983150983156983141983154983150983137983156983145983151983150983137983148 983107983151983150983142983141983154983141983150983139983141 983151983150 983141983106983157983155983145983150983141983155983155983084 983141983107983151983149983149983141983154983139983141983084 983141983117983137983150983137983143983141983149983141983150983156983084983141983116983141983137983154983150983145983150983143 983137983150983140 983141983111983151983158983141983154983150983137983150983139983141 (983090983088983089983093)983098 983089983089983095983085983089983090983089983086 983120983154983145983150983156983086
IV CONCLUSION
SSI E-Government Gateway statistics are used in this study for the period of 2012-2014 Time series characteristics of the series areinvestigated and evaluatedAt first the peak values are determined and possible reasons behind them are investigated It looks like that the news in the mediaabout changes in regulations and adjustments to benefits is the main reason behind the change in the use rate of e-government servicesMoreover the use declines starting after January and reaches its lowest level in June and stays low during the summer months This isprobably because of summer months are used for vacation It is expected to see an increase in use of e-government services through
time since the use of Internet
Furthermore the use of Internet among Turkish households increased only a small percentage from 477 in 2012 to 491 in 2013as mentioned above in introduction Our study shows that while the use of SSI E-Government Gateway services fluctuated during the3-year period any increase in e-government service use could not be found
REFERENCES
1 TUumlİK wwwtuikgovtrPreHaberBultenleridoid=135692 M Ayaz S Oumlzcan and E Zengin ldquoThe Impact of Using E-Government on Social Capitalrdquo Journal of European Social
Research Volume 1 Issue 1 pp 102 ndash 120 March 20153 httpunpan3unorgegovkbPortalsegovkbDocumentsun2014-SurveyE-Gov_Complete_Survey-2014pdf4 Ouml Kuumllcuuml Evolution of e-records management practices in e-government A Turkish perspective The Electronic Library
Vol 27 Issue 6 pp 999 ndash 1009 20095 S Baştan and N Goumlkbunar ldquoKamu Hizmetlerinin Sunumunda E-Devletle İlgili Yeni Gelişmeler Tuumlmleşik E-Devlet
Sistemlerine Doğrurdquo Dokuz Eyluumll Uumlniversitesi İktisadi ve İdari Bilimler Fakuumlltesi Dergisi Vol 19 No 1 PP 71-89
20046
E E Goumlkccedileoğlu and N Yavuz ldquoEvaluating E-Government Initiatives in Turkey From the Perspective of Public EmployeesA Case Study and Preliminary Findingsrdquo 2nd International Conference on Internet E-Learning amp Education Technologies (ICIEET 2013)
7 R Benzer ldquoE-Government in Developed Countries The Case of Turkeyrdquo (IJCSIT) International Journal of ComputerScience and Information Technologies Vol 6 (1) 2015 710-714
8 I Akman A Yazici AMishra and AArifoglu ldquoE-Government A global view and an empirical evaluation of someattributes of citizensrdquo Government Information Quaterly xx (2005) xxxndashxxx (article in press)
9 Y Ogurlu ldquoE-Government Portal and E-Services in Turkeyrdquo Epiphany Journal of Transdisciplinary Studies Vol 7Number 2 2014
10 Abdullah Naralan Ali Kemal Ccedilelik Selccediluk Bakan Research Journal of Economics Business and ICT Vol 8 No 2 pp 44-54October 17 2013
11 A A Tunga A Şahin and Y Ceran ldquoE-Government Applications in SSI an Evaluation of the Application Benefits toCitizens and Accountantsrdquo 6th International Academic Conference - International Institute of Social and Economic Sciences
June 23-26 Bergen Norway s 66 201312 Delegation of the European Commission in Turkey ldquoTechnical Assistance for Capacity Building of The Social Security
Institution Turkeyrdquo httpwwwavrupainfotrfileadminContentFilesImageshaber_arsivi2012MappingStudypdf13 HABERTURK httpwwwhaberturkcomgundemhaber928463-sgk-prim-sorgulama-sayfasi-sgk-prim-sorgulama-
nasil-yapilir14
SSKEMEKLI wwwsskemeklicomintibak-islemlerihtml15 MILLIYET wwwmilliyetcomtrgul-4-5-miyon-kisiyi-ilgilendiren-kanunu-
onayladisiyasetsiyasetdetay180120131657277defaulthtm
7212019 E-Government Usage in Turkey An Analysis of the Social Security Institution
httpslidepdfcomreaderfulle-government-usage-in-turkey-an-analysis-of-the-social-security-institution 45
International Conference on eBusiness eCommerce eManagement eLearning and eGovernance [IC5E] 983089983090983088
983107983145983156983141 983156983144983145983155 983137983154983156983145983139983148983141 983137983155983098 983109983154983143983145983150983138983137983161 983125983143983157983154983148983157 983123983157983148983141983161983149983137983150 983105983139ı983147983137983148983145983150983086 991260983109983085983111983151983158983141983154983150983149983141983150983156 983125983155983137983143983141 983145983150 983124983157983154983147983141983161983098 983105983150 983105983150983137983148983161983155983145983155 983151983142
983156983144983141 983123983151983139983145983137983148 983123983141983139983157983154983145983156983161 983113983150983155983156983145983156983157983156983145983151983150983086991261 983113983150983156983141983154983150983137983156983145983151983150983137983148 983107983151983150983142983141983154983141983150983139983141 983151983150 983141983106983157983155983145983150983141983155983155983084 983141983107983151983149983149983141983154983139983141983084 983141983117983137983150983137983143983141983149983141983150983156983084983141983116983141983137983154983150983145983150983143 983137983150983140 983141983111983151983158983141983154983150983137983150983139983141 (983090983088983089983093)983098 983089983089983095983085983089983090983089983086 983120983154983145983150983156983086
0
50000
100000
150000
200000
0
400
800
1200
1600
2000
I II III IV I II III IV I II III IV
2012 2013 2014
AGBRP BCBA BGSI CCB COMSP
CRR
0
40000
80000
120000
160000
200000
240000
280000
0
100000
200000
300000
400000
500000
I II III IV I II III IV I II III IV
2012 2013 2014
BRPI BPR BRR CRPC CTRP
TII
Figure 2 Graphs of AGBRP BCBA BGSI CCB COMSP CRR BRPI BPR BRR CRPCCTRP TII
The values of ARPAI reach approximately to 1200000 and its graph is located on the left panel On the other hand the mostfrequently used application is ASR (Service Record) is drawn on the right panel and its values are on the left vertical axis ASR valuesreach approximately to 5000000 At the same time we can see that total numbers of service use values are in 3 million to 16 millionranges It reaches 16 million in the first moth of 2014 also it has a peak in first month of 2013 ARPAI CRPI and ARPC have the samepeak dates with the TOTAL variable
0
200000
400000
600000
800000
0
200000
400000
600000
800000
1000000
1200000
I II III IV I II III IV I II III IV
2012 2013 2014
ARPAI CRPI ARPC
1000000
2000000
3000000
4000000
5000000
0
4000000
8000000
12000000
16000000
20000000
I II III IV I II III IV I II III IV
2012 2013 2014
A SR TOTA L
Figure 3 Graphs of ARPAI CRPI ARPC ASR TOTAL
The ARPI BRPI and CRPI values are presented on three different figures and all of them have a peak value in January 2013 A new
law published in the Official Gazette dated March 1st 2012 stating the monthly pension payments of people who retired before year
2000 [14] Following this law there were lots of news coverage on the media starting with January 2013 about the retiree pensionadjustment which would take place in 2013 [15]
Figure 4 shows seasonal means of all the variables It is clear from the seasonal graphs that there is seasonality in the series Access to e-government gateway services look high at the beginning of each year and start to decline until June The uses of services stay relativelylow during the summer months and start to increase during the last quarter of each year It is possible to argue that the decline insummer months is due to fact that summer months are considered as the main vacation period for the majority of Turkish populationAs almost all schools are closed for these months most of the workers prefer to use their vacation days during these monthsFurthermore the high use rates during the first month of each year is probably due to curiosity of the public using SSI about new rulesand regulation and their possible effects on their pensions Finally the relatively high use of services at the end of each year could beabout year-end check and control activities by individuals andor firms for fiscal concerns
Figure 4 Seasonal Graphs of the all variables
7212019 E-Government Usage in Turkey An Analysis of the Social Security Institution
httpslidepdfcomreaderfulle-government-usage-in-turkey-an-analysis-of-the-social-security-institution 55
International Conference on eBusiness eCommerce eManagement eLearning and eGovernance [IC5E] 983089983090983089
983107983145983156983141 983156983144983145983155 983137983154983156983145983139983148983141 983137983155983098 983109983154983143983145983150983138983137983161 983125983143983157983154983148983157 983123983157983148983141983161983149983137983150 983105983139ı983147983137983148983145983150983086 991260983109983085983111983151983158983141983154983150983149983141983150983156 983125983155983137983143983141 983145983150 983124983157983154983147983141983161983098 983105983150 983105983150983137983148983161983155983145983155 983151983142
983156983144983141 983123983151983139983145983137983148 983123983141983139983157983154983145983156983161 983113983150983155983156983145983156983157983156983145983151983150983086991261 983113983150983156983141983154983150983137983156983145983151983150983137983148 983107983151983150983142983141983154983141983150983139983141 983151983150 983141983106983157983155983145983150983141983155983155983084 983141983107983151983149983149983141983154983139983141983084 983141983117983137983150983137983143983141983149983141983150983156983084983141983116983141983137983154983150983145983150983143 983137983150983140 983141983111983151983158983141983154983150983137983150983139983141 (983090983088983089983093)983098 983089983089983095983085983089983090983089983086 983120983154983145983150983156983086
IV CONCLUSION
SSI E-Government Gateway statistics are used in this study for the period of 2012-2014 Time series characteristics of the series areinvestigated and evaluatedAt first the peak values are determined and possible reasons behind them are investigated It looks like that the news in the mediaabout changes in regulations and adjustments to benefits is the main reason behind the change in the use rate of e-government servicesMoreover the use declines starting after January and reaches its lowest level in June and stays low during the summer months This isprobably because of summer months are used for vacation It is expected to see an increase in use of e-government services through
time since the use of Internet
Furthermore the use of Internet among Turkish households increased only a small percentage from 477 in 2012 to 491 in 2013as mentioned above in introduction Our study shows that while the use of SSI E-Government Gateway services fluctuated during the3-year period any increase in e-government service use could not be found
REFERENCES
1 TUumlİK wwwtuikgovtrPreHaberBultenleridoid=135692 M Ayaz S Oumlzcan and E Zengin ldquoThe Impact of Using E-Government on Social Capitalrdquo Journal of European Social
Research Volume 1 Issue 1 pp 102 ndash 120 March 20153 httpunpan3unorgegovkbPortalsegovkbDocumentsun2014-SurveyE-Gov_Complete_Survey-2014pdf4 Ouml Kuumllcuuml Evolution of e-records management practices in e-government A Turkish perspective The Electronic Library
Vol 27 Issue 6 pp 999 ndash 1009 20095 S Baştan and N Goumlkbunar ldquoKamu Hizmetlerinin Sunumunda E-Devletle İlgili Yeni Gelişmeler Tuumlmleşik E-Devlet
Sistemlerine Doğrurdquo Dokuz Eyluumll Uumlniversitesi İktisadi ve İdari Bilimler Fakuumlltesi Dergisi Vol 19 No 1 PP 71-89
20046
E E Goumlkccedileoğlu and N Yavuz ldquoEvaluating E-Government Initiatives in Turkey From the Perspective of Public EmployeesA Case Study and Preliminary Findingsrdquo 2nd International Conference on Internet E-Learning amp Education Technologies (ICIEET 2013)
7 R Benzer ldquoE-Government in Developed Countries The Case of Turkeyrdquo (IJCSIT) International Journal of ComputerScience and Information Technologies Vol 6 (1) 2015 710-714
8 I Akman A Yazici AMishra and AArifoglu ldquoE-Government A global view and an empirical evaluation of someattributes of citizensrdquo Government Information Quaterly xx (2005) xxxndashxxx (article in press)
9 Y Ogurlu ldquoE-Government Portal and E-Services in Turkeyrdquo Epiphany Journal of Transdisciplinary Studies Vol 7Number 2 2014
10 Abdullah Naralan Ali Kemal Ccedilelik Selccediluk Bakan Research Journal of Economics Business and ICT Vol 8 No 2 pp 44-54October 17 2013
11 A A Tunga A Şahin and Y Ceran ldquoE-Government Applications in SSI an Evaluation of the Application Benefits toCitizens and Accountantsrdquo 6th International Academic Conference - International Institute of Social and Economic Sciences
June 23-26 Bergen Norway s 66 201312 Delegation of the European Commission in Turkey ldquoTechnical Assistance for Capacity Building of The Social Security
Institution Turkeyrdquo httpwwwavrupainfotrfileadminContentFilesImageshaber_arsivi2012MappingStudypdf13 HABERTURK httpwwwhaberturkcomgundemhaber928463-sgk-prim-sorgulama-sayfasi-sgk-prim-sorgulama-
nasil-yapilir14
SSKEMEKLI wwwsskemeklicomintibak-islemlerihtml15 MILLIYET wwwmilliyetcomtrgul-4-5-miyon-kisiyi-ilgilendiren-kanunu-
onayladisiyasetsiyasetdetay180120131657277defaulthtm


![alex_hadjiev/Turkey [2]/15th MC of Turkey (2)/sert.pdf · need to add sulfuric acid to decrease PI I of the make- up water declined Usage of 71120 leads to the Increasing of sulfate](https://static.fdocuments.in/doc/165x107/5e42b80f2974de108d6dcf57/alexhadjievturkey-215th-mc-of-turkey-2sertpdf-need-to-add-sulfuric-acid.jpg)