e-Commerce Metrics for Net-Enhanced Organizations: Assessing
21
1047-7047/02/1303/0275$05.00 1526-5536 electronic ISSN Information Systems Research, 2002 INFORMS Vol. 13, No. 3, September 2002, pp. 275–295 e-Commerce Metrics for Net-Enhanced Organizations: Assessing the Value of e-Commerce to Firm Performance in the Manufacturing Sector Kevin Zhu* • Kenneth L. Kraemer Graduate School of Management, University of California, Irvine, California 92697-3125 [email protected] • [email protected] I n this study, we developed a set of constructs to measure e-commerce capability in Internet- enhanced organizations. The e-commerce capability metrics consist of four dimensions: information, transaction, customization, and supplier connection. These measures were em- pirically validated for reliability, content, and construct validity. Then we examined the no- mological validity of these e-commerce metrics in terms of their relationships to firm perfor- mance, with data from 260 manufacturing companies divided into high IT-intensity and low IT-intensity sectors. Grounded in the dynamic capabilities perspective and the resource-based theory of the firm, a series of hypotheses were developed. After controlling for variations of industry effects and firm size, our empirical analysis found a significant relationship between e-commerce capability and some measures of firm performance (e.g., inventory turnover), indicating that the proposed metrics have demonstrated value for capturing e-commerce ef- fects. However, our analysis showed that e-commerce tends to be associated with the increased cost of goods sold for traditional manufacturing companies, but there is an opposite relation- ship for technology companies. This result seems to highlight the role of resource complemen- tarity for the business value of e-commerce—traditional companies need enhanced alignment between e-commerce capability and their existing IT infrastructure to reap the benefits of e-commerce. (Electronic Commerce; IT Intensity; e-Commerce Metrics; Measurement; Validation; Firm Performance; Net-Enhanced Organizations) 1. Introduction Despite controversies surrounding electronic com- merce (e-commerce or EC) and the burst of the “dot com” bubble, many large companies continue to de- ploy e-commerce extensively in their enterprise value chains and develop Internet-enabled initiatives to manage inventory using electronic links to suppliers, to strengthen online integration with distributors and business partners, to design and customize products and services, and to attempt to serve customers more effectively. 1 As indicated by a recent survey, “con- necting to customers and suppliers electronically” is *Corresponding author. 1 In our study, e-commerce is defined as business activities conducted over the Internet. Net-enhanced organizations are traditional, “brick and mortar” firms that are using the Internet to enhance their existing businesses (Straub et al. 2002).
Transcript of e-Commerce Metrics for Net-Enhanced Organizations: Assessing

1047-7047/02/1303/0275$05.001526-5536 electronic ISSN
Information Systems Research, � 2002 INFORMSVol. 13, No. 3, September 2002, pp. 275–295
e-Commerce Metrics for Net-EnhancedOrganizations: Assessing the Value ofe-Commerce to Firm Performance in the
Manufacturing Sector
Kevin Zhu* • Kenneth L. KraemerGraduate School of Management, University of California, Irvine, California 92697-3125
[email protected] • [email protected]
In this study, we developed a set of constructs to measure e-commerce capability in Internet-enhanced organizations. The e-commerce capability metrics consist of four dimensions:
information, transaction, customization, and supplier connection. These measures were em-pirically validated for reliability, content, and construct validity. Then we examined the no-mological validity of these e-commerce metrics in terms of their relationships to firm perfor-mance, with data from 260 manufacturing companies divided into high IT-intensity and lowIT-intensity sectors. Grounded in the dynamic capabilities perspective and the resource-basedtheory of the firm, a series of hypotheses were developed. After controlling for variations ofindustry effects and firm size, our empirical analysis found a significant relationship betweene-commerce capability and some measures of firm performance (e.g., inventory turnover),indicating that the proposed metrics have demonstrated value for capturing e-commerce ef-fects. However, our analysis showed that e-commerce tends to be associated with the increasedcost of goods sold for traditional manufacturing companies, but there is an opposite relation-ship for technology companies. This result seems to highlight the role of resource complemen-tarity for the business value of e-commerce—traditional companies need enhanced alignmentbetween e-commerce capability and their existing IT infrastructure to reap the benefits ofe-commerce.(Electronic Commerce; IT Intensity; e-CommerceMetrics;Measurement;Validation;FirmPerformance;Net-Enhanced Organizations)
1. IntroductionDespite controversies surrounding electronic com-merce (e-commerce or EC) and the burst of the “dotcom” bubble, many large companies continue to de-ploy e-commerce extensively in their enterprise valuechains and develop Internet-enabled initiatives tomanage inventory using electronic links to suppliers,to strengthen online integration with distributors andbusiness partners, to design and customize products
and services, and to attempt to serve customers moreeffectively.1 As indicated by a recent survey, “con-necting to customers and suppliers electronically” is
*Corresponding author.1In our study, e-commerce is defined as business activities conductedover the Internet. Net-enhanced organizations are traditional, “brickand mortar” firms that are using the Internet to enhance their existingbusinesses (Straub et al. 2002).

ZHU AND KRAEMERAssessing the Value of e-Commerce
Information Systems Research276 Vol. 13, No. 3, September 2002
one of the top-ranked information technology (IT)management issues (Computer Sciences Corp. 2001).While sizeable investments in e-commerce are being
made, researchers and practitioners are struggling todetermine whether and how these expenditures im-prove the business performance of firms, or even howto measure the Internet-based, e-commerce initiativesin the first place. There has been much speculation butvery little empirical data to gauge the scale and char-acteristics of the Internet-based initiatives and theirimpact on firm performance, especially of large manu-facturing companies. Because of the difficulty of de-termining what data to collect and of actually collect-ing them, most of the existing evidence regarding suchissues tends to be either anecdotal or qualitative in na-ture. Case studies on companies such as Dell and Ciscoprovided insights into business use and benefits of e-commerce, but are the findings of these case studiesspecific to a few “leading edge” firms, or are the les-sons more widely applicable? At the same time, thereare also cases where many firms, concerned about fall-ing behind on the technology curve, engage in e-commerce initiatives without deriving any benefits.Thus, we still know relatively little about the impactsof e-commerce on most firms. To answer this question,we need evidence from large-sample statistical analy-sis. Such studies cannot be undertaken until we havefound a set of metrics that will reveal relevantrelationships.Key research questions that motivate our work are:
What are the relevant metrics for studying e-commerce?How are these e-commerce metrics related to the busi-ness performance of a firm in terms of profitability, costreduction, and operational efficiency? Are the relation-ships between EC metrics and firm performance dif-ferent for various types of companies? What are thedeterminants that explain cross-sectional variations?What kind of relationship (substitute or complement)exists between Internet systems and pre-Internet ITinfrastructure?To answer these questions, we proposed a set of
e-commerce metrics for EC capabilities related to cus-tomers and suppliers. We then collected data to vali-date these metrics and examined their nomological ef-ficacy in terms of relationships to firm performance,and the strength of the relationships. Grounded in a
resource-based theory of the firm (also known as RBVor resource-based view of the firm), a series of hypoth-eses were developed to test the presence (or absence)of the EC effects in terms of whether e-commerce ca-pabilities, in conjunction with a firm’s IT infrastruc-ture, are associated with performance measures suchas profit margin, cost reduction, and supply chain ef-ficiency. This will help provide empirical evidence asto which of the proposed metrics have value for study-ing the scale, characteristics, and impacts of e-commerceon firm performance.Placed in the larger context of information system
(IS) literature, this study can be considered to be anextension of the IT-productivity research stream intothe Internet domain, motivated by the shift from pre-Internet IT infrastructure to Internet-based systemsthat enable e-commerce capabilities. E-commerce ca-pability is modeled as a new type of technological re-source that, combined with firm IT infrastructure, mayhave certain relationships to firm performance. Theserelationships are empirically tested with data from themanufacturing sector.
2. Theory and HypothesesBecause most large firms are still in the early stage ofpositioning themselves to exploit the business oppor-tunities enabled by the Internet, it is difficult to knowhow best to measure e-commerce capability. Thispoints to the need for a theoretical framework thatmayoffer some guidance. In this section, we review therelevant theoretical perspectives in conjunction withthe existing information systems (IS) and e-commerceliterature.
2.1. Business Value of Information TechnologyThe literature in IT productivity and business value canbe classified into two categories: (1) the production-economics-based approach and (2) the process-orientedapproach (Barua and Mukhopadhyay 2000). Theproduction-economics-based approach uses production func-tions to study the relationship between output measuresand production inputs such as IT and non-IT capital andlabor. Aftermany years’ debate on the “productivity par-adox,” several researchers have estimated productionfunctions and found a positive relationship between IT

ZHU AND KRAEMERAssessing the Value of e-Commerce
Information Systems ResearchVol. 13, No. 3, September 2002 277
and productivity. Their resultswere corroborated by sev-eral other studies and triggered a large stream of litera-ture in this area, which is extensively reviewedelsewhere(cf. Chan 2000, Dewan and Min 1997, Brynjolfsson andYang 1996). As Hitt and Brynjolfsson (1996) point out,while the theory of production predicts that lower pricesfor IT will create benefits in the form of lower productioncosts for a given level of output, it is silent on thequestionof whether firms will gain performance advantages interms of supra-normal firm profitability.The process-oriented approach attempts to explain the
process through which IT investments improve inter-mediate operational performance, which in turn mayaffect higher levels of financial performance (Barua etal. 1995). Among other studies, Mukhopadhyay et al.(1995) assessed the business value of electronic datainterchange (EDI) in a manufacturing setting. Theyfound that EDI enabled effective use of information tocoordinate material movements between the manufac-turer and its suppliers, which resulted in significantcost savings and inventory reduction. As an interor-ganizational information system, EDI has some fea-tures in common with the Internet-based initiatives,but it also exhibits significant differences as EDI is typ-ically a more expensive, proprietary technology con-trolled by one large manufacturer or supplier. In con-trast, Internet technologies may induce large-scaletransformations within an organization as well as inits relationships with customers and suppliers. Thus,while there is some evidence of economic impacts fromIT such as EDI, it is not clear whether this can be di-rectly extended to the Internet-based electronicbusiness.Becausemost of these studieswere conducted before
the widespread use of the Internet, they naturally didnot include variables associated with Internet initia-tives and e-commerce capabilities. Given the shift toInternet-based systems as a new IT architecture, weseek to extend the IT value literature to the Internetdomain. Our goal is to gauge the recent Internet-based,e-commerce initiatives and their links to performancemeasures, with the focus moving away from pre-InternetIT infrastructure and legacy systems toward Internet ande-commerce capabilities. This should complement andextend the existing literature. To achieve this, we needa new theoretical framework that goes beyond the
production-economics and business-process ap-proaches in the mainstream IT literature.
2.2. Resource-Based Theory for Net-EnhancedOrganizations
A potential framework for augmenting the theoreticalbasis of e-commerce value is the resource-based view ofthe firm, which links firm performance to organiza-tional resources and capabilities. Firms create perfor-mance advantages by assembling resources that worktogether to create organizational capabilities (Penrose1959, Wernerfelt 1984, Peteraf 1993). To create sustain-able advantages, these resources, or resource combi-nations, would have to be economically valuable, rela-tively scarce, difficult to imitate, or imperfectly mobileacross firms (Barney 1991). Resources can be combinedand integrated into unique clusters that enable distinc-tive abilities within a firm (Teece et al. 1997). RBV hasbeen widely accepted in strategic managementliterature.In the IS literature, the resource-based view has been
used to explain how firms can create competitive valuefrom IT assets, and how sustainability resides more inthe organization’s skills to leverage IT than in the tech-nology itself. IT payoffs depend heavily on “fitting thepieces together,” i.e., on exploiting relationshipsamong complementary resources.2 Computers, data-bases, technical platforms, and communication net-works form the core of a firm’s overall IT infrastructureresources. Although the individual components thatgo into the IT infrastructure are commodity-like, theprocess of integrating the components to develop anintegrative infrastructure tailored to a firm’s strategiccontext is complex and imperfectly understood(Milgrom and Roberts 1990, Weill and Broadbent1998).The resource-based view has been extendedwith the
dynamic capabilities perspective (DCP) to address therealities of high-velocity markets and rapid technolog-ical change. DCP refers to the ability of a firm to
2See, e.g., Clemons and Row (1991), Ross et al. (1996), Jarvenpaa andLeidner (1998), Mata et al. (1995), and Bharadwaj (2000). Resourcesexamined in these studies included managerial skills, IT expertise,organizational skills, and intangible assets. All of these studies wereconducted before the Internet; e-commerce has not yet been studiedfrom a resource-based perspective.

ZHU AND KRAEMERAssessing the Value of e-Commerce
Information Systems Research278 Vol. 13, No. 3, September 2002
achieve new forms of competitive advantage by re-newing technological, organizational, and managerialresources to achieve congruence with the changingbusiness environment (Teece et al. 1997, EisenhardtandMartin 2000). In this environment, capabilities thatenable rapid and purposeful reconfiguration of a firm’sresources are the means through which both industryposition and timely, unique resources can be obtained.This model suggests that dynamic capabilities are es-sentially change-oriented capabilities that help firmsreconfigure their resource base to meet evolving cus-tomer demands and competitor strategies. The abilityto foresee technological change and adopt the appro-priate strategies may create a trajectory of growth thatwould create a performance advantage (Teece et al.1997).Capabilities are dynamic because the firmmust con-
tinually build, adapt, and reconfigure internal and ex-ternal competences to achieve congruence with thechanging business environment when the rate of tech-nological change is rapid, time-to-market is critical,and the nature of future competition and markets aredifficult to determine (Teece et al. 1997). Dynamic ca-pabilities create resource configurations that generatevalue-creating strategies (Eisenhardt andMartin 2000).As digital networks provide business processeswith
capabilities for speed, strategy is fast becoming a dy-namic process of recreating and executing innovationoptions to gain competitive advantage (Teece et al.1997). Applying the dynamic capabilities theory forunderstanding a firm’s ability to create value throughthe business use of digital networks, Wheeler (2002)proposes the Net-enabled Business Innovation Cycle(NeBIC), which identifies that Net-enabled business in-novations require timely and ongoing reconfigurationof firm resources. Zahra and George’s 2002 article re-inforces its appropriateness in the IS context.Consistent with DCP, e-commerce can be considered
to be a dynamic capability. Net-enhanced organiza-tions continually reconfigure their internal and exter-nal resources to employ digital networks to exploitbusiness opportunities. Thus, Net-enhanced organi-zations exemplify the characteristics of dynamic ca-pabilities as they engage routines, prior and emergentknowledge, analytic processes, and simple rules to
turn IT into customer value (Wheeler 2002, Bharadwajet al. 2000, Sambamurthy et al. 2001).Because this study seeks to extend the IT value lit-
erature to the domain of Internet-enabled e-businessinitiatives, it is natural to ask if Internet initiatives aredifferent from pre-Internet technologies (e.g., PC,mainframe, legacy systems). In fact, the economic char-acteristics of the Internet are significantly differentfrom those of pre-Internet computer technologies. TheInternet is unique in terms of connectivity, interactivity,and open-standard network integration (Shapiro andVarian 1999, Kauffman et al. 2001). These characteris-tics have very different impacts on customer reach andrichness of information. Prior to the Internet, firms of-ten used stand-alone, proprietary systems to commu-nicate limited data. It was difficult or costly for a firmto connect to its customers, suppliers, and businesspartners. In contrast, the Internet enables a two-way,real-time information exchange between a firm and itscustomers and suppliers (Straub et al. 2002).Given these unique characteristics of the Internet,
many organizations have embraced e-commerce. Yet,the way that e-commerce is embedded in business pro-cesses differs. In fact, it is how firms leverage their in-vestments to create unique Internet-enabled resourcesand firm-specific capabilities that determines a firm’soverall EC effectiveness.3 Firms benefit from the Inter-net when they embed e-commerce capability in theirorganizational fabric in a way that produces sustain-able resource complementarity.Complementarity represents an enhancement of re-
source value and arises when a resource producesgreater returns in the presence of another resourcethan it does alone. For example, the integration of e-commerce capability and IT infrastructure may im-prove connectivity, compatibility, and responsivenessof firm information systems, which leads to greater ef-ficiency and lower costs. Information systems can em-body rigidity and incompatibility, especially whenthey are based on proprietary pre-Internet platforms
3Straub and Klein (2001) apply the RBV perspective to the Internetspace in their arguments that Net-enablement conveys to the firm aresource that cannot be substituted for or imitated (such as customerproprietary data, shared information). Exploitation of these re-sources, they assert, will lead to sustainable competitive advantagefor Net-enabled organizations.

ZHU AND KRAEMERAssessing the Value of e-Commerce
Information Systems ResearchVol. 13, No. 3, September 2002 279
for software and hardware. “Islands of automation”(McKenney and McFarlan 1982) are often seen in themanufacturing industry, where various stages ofmanufacturing might be highly automated because ofthe use of CAD, CAM, and CIM technologies in thelast two decades. Yet many of such systems are iso-lated from each other and not integrated internallywith other parts of the corporate information systemsor externally with suppliers and business partners.Data reentry is often needed to be done manually, in-creasing costs and errors. The business processes cap-tured in such systems can become easily outdated.The connectivity and open-standard data exchange
of the Internet may help remove incompatibility of thelegacy information systems. A mainframe-based leg-acy IT system (such as EDI) that only marginally im-proves performance under ordinary conditions mayproduce substantial advantages when combined withthe Internet—its greater connectivity allows more di-rect interaction with customers and tighter data shar-ing with suppliers. Internet-based e-commerce can beutilized to enhance traditional IT systems in manyways. For example, using Web-based, graphical inter-face to improve the user-friendliness of ERP systems,implementing Internet-based middleware to makeEDI-connections more flexible and affordable forsmaller businesses, connecting various legacy data-bases by common Internet protocol and open standard,using XML-based communication to increase the abil-ity of exchanging invoice and payment documents on-line between companies, and analyzing online data tobetter understand customer demand.For these reasons, it is important to focus on resource
complementarity as a feasible path to e-commerce ef-fectiveness. The resource-based view provides a solidtheoretical foundation for studying the contexts andconditions under which EC may produce performancegains. Particularly, it points toward a more balancedperspective, one that acknowledges the commodityview of the technology per se, while allowing the pos-sibility of performance associations arising from com-bining EC capabilities with IT infrastructure and othercomplementary resources.The above discussion also suggests that a study of
e-commerce has to develop appropriate metrics of ECcapability, IT infrastructure, and firmperformance.We
needmeasures to capture the characteristics of Internetfunctionalities and integration that can help build cus-tomer and supplier relationships across the valuechain. It is a complex task to measure this kind of in-tegration. Nonetheless, e-commerce functionalitiesmay serve as a proxy. As discussed in §3, e-commercefunctionalities represent the level of integration withcustomers and suppliers, upstream and downstreamof the value chain.Throughout this paper, we use three related terms:
EC initiatives, EC capabilities, and EC functionalities.EC initiatives taken by firms result in EC capabilities,which are reflected by EC functionality indicators. ECcapabilities are the main theoretical metrics of interest.Specifically, e-commerce capabilities reflect a com-pany’s strategic initiatives to use the Internet to shareinformation, facilitate transactions, improve customerservices, and strengthen supplier integration. To a cer-tain extent, these EC capabilities should be reflected inthe functionalities of the company’s Web site, becausethe Web site serves as a gateway for dealing with cus-tomers and business partners in the Internet age (For-tune 2000). E-commerce functionalities may rangefrom static information to online order tracking andfrom digital product catalogues to integration withsuppliers’ databases. These functionalities exhibit vari-ous levels of sophistication, which can be measured.
2.3. Hypothesis DevelopmentThe theoretical perspectives discussed above lead usto believe that e-commerce capabilities can combinewith IT infrastructure and produce complementaritiesthat contribute to firm performance. The testing of therelationships in the theoretical model may be thoughtof as a form of nomological validity. Nomological va-lidity examines linkages that are specified in theory. Ifthese linkages are found to be significant, particularlyin spite of variants in measurement (Boudreau et al.2001), then the instrumentation may be said to be nom-ologically validated (Campbell 1960, Bagozzi 1980).The hypotheses developed below allow us to explorethese predicted relationships and to verify our metricsthrough this means.With respect to Hypothesis 1, prior IT investment is
critical to enabling e-commerce capabilities. Given thiscomplementary nature between IT and EC, our first

ZHU AND KRAEMERAssessing the Value of e-Commerce
Information Systems Research280 Vol. 13, No. 3, September 2002
Figure 1 Conceptual Framework
hypothesis is that EC capabilities, combined with ITinfrastructure, create resource complementarities thatexplain performance variance across firms.
Hypothesis 1. EC capability and IT intensity exhibit asignificant reinforcing interaction effect. That is, the inter-action effect will be more significant than the main effects ofeither IT or EC alone.
This is illustrated by the conceptual framework shownin Figure 1. In this framework, two sets of independentvariables—EC capability and IT intensity—are jointlyassociated with performance measures. As discussedlater in greater detail, EC capability is a composite indexgenerated from a set of specific variables measuringEC functionalities related to customers and suppliers.IT infrastructure is represented by an index termed ITintensity, which is equal to a firm’s total value of ITstock divided by the number of employees. Interactioneffect is calculated by the product of the two variables—EC capability and IT intensity.As discussed above in the theoretical section, the use
of e-commerce may improve information flow andreduce transaction costs and inefficiencies. Firms’e-commerce initiatives will result in varying degreesof EC capability, and we might assume that the moredeveloped this capability, the greater the positive re-lationship to the firm’s profitability, and the greater thenegative relationship to cost measures of the firm (costreduction). Therefore, we have the following twohypotheses:
Hypothesis 2. Greater EC capability, in conjunctionwith IT intensity, is associated with lower cost measures.
Hypothesis 3. Greater EC capability, in conjunction
with IT intensity, is associated with higher profitabilitymeasures.
Notice that the hypotheses represent multiplicativepropositions, reflecting the interaction effect betweenEC and IT. As discussed earlier, EC capability alonemay be insufficient to impact performance measures;rather it may have to be integrated with the firm’s ex-isting IT infrastructure. The IT infrastructure providesthe platform to launch innovative EC applications fas-ter or more effectively than the competition.Another area which should benefit from Internet-
based e-commerce initiatives is inventory manage-ment. As documented in the supply chain literature,the poor quality of information exchange among sup-pliers and manufactures led to inventory bufferbuildup along the supply chain, a phenomenon termedas the “bullwhip effect.”4 The use of Internet-based ini-tiatives should improve the flow of information. Betterinformation flow along the supply chainwill makema-terial flowmore efficient. This is the notion of replacinginventory with information (Milgrom and Roberts1988). This is important for the manufacturing indus-try as a whole, but it seems to be particularly relevantfor high-tech manufacturing firms, where inventoriesanywhere along the supply chain can become obsoletein a matter of months. Hence, by improving the qualityof information exchange through establishing elec-tronic information linkages, the average inventoryturnover rate should increase as the inventory stockdecreases along the supply chain. This leads to ournext hypothesis.
Hypothesis 4. Greater EC capability, in conjunctionwith IT intensity, is associated with improved supply chainefficiency.
The latter three hypotheses explore the relationships ofe-commerce to cost reduction, profit generation, andinventory management. Yet, these relationships mightbe different for different types of companies (e.g., high-tech vs. traditional manufacturing), because of thevarying nature of resource bases and IT infrastructure.High-tech companies and traditional manufacturing
4The bullwhip effect is defined as the artificial amplification of vol-atility in supply chains due to information distortion and demanduncertainties (Lee et al. 1997).

ZHU AND KRAEMERAssessing the Value of e-Commerce
Information Systems ResearchVol. 13, No. 3, September 2002 281
companies have different experience paths and re-source bases in their IT infrastructure and Internet us-age. Viewed from the resource-based perspective, firmIT infrastructure is an important business resource; itsunique characteristics can enable firms to implementthe right applications at the right time. The IT infra-structure underpins a firm’s competitive position byenabling initiatives such as Internet-based electronicintegration of supply chains. “It is the IT platform thatdetermines the business degrees of freedom a firm en-joys in its business plans,” as noted by Keen (1991, p.184). On the other hand, a nonintegrated IT infrastruc-ture dominated by system incompatibilities severelyrestricts an organization’s business choices.Hence, existing IT infrastructure and legacy infor-
mation systems can be either advantages or liabilities.This is related to the dual nature of resources: Currentcapabilities may both propel and constrain future in-vestment activity. For example, information systemscan embody rigidities, especially when they are basedon proprietary platforms for software and hardware(which is observed more often in traditional manufac-turing companies than in technology companies). Thebusiness processes captured in such software andhardware could become outdated easily. Such incom-patibility may hinder firm ability to exploit the valueof a new technology such as the Internet.As elaborated later, high-tech firms, relative to tra-
ditional manufacturing, tend to have a more intensiveand flexible IT infrastructure, which may make theire-commerce initiatives more effective. Hence, our finalhypothesis tests the possible differential effects ofe-commerce on two types of firms: high IT-intensityvs. low IT-intensity manufacturing firms.
Hypothesis 5. E-commerce metrics may exhibit strongerassociation with firm performance in high IT-intensity firmsthan in low IT-intensity firms.
3. Research MethodMeasurement characteristics and nomological validitywere tested for 260 manufacturing companies usingprimary data and secondary data from public data-bases andWeb sites. Coding of the secondary data wassupplemented by a primary data collection via a field
study/survey for certain key variables. Data were col-lected and analyzed for a two-year study period.
3.1. Metrics DesignE-commerce metrics yield information about key at-tributes in e-commerce initiatives in a Net-enhancedorganization. As articulated by Straub et al. (2002),metrics are important because they provide compara-bility and a rigorous research procedure. “Good met-rics earn credence and subsequently relieve researchersfrom repeated efforts at construct and instrumentationdevelopment. Metrics enable research to accumulate ina subject area as direct comparisons become possiblebetween persons, time periods, industries, cultures, orgeographic regions” (Straub et al. 2002).The variables used for this study fall into three main
categories: dependent, independent, and control vari-ables. Their relationships are illustrated in the concep-tual framework shown above in Figure 1, where eachset of variables is represented in a box. We describethese variables in turn below.
3.1.1. Dependent Variables—Performance Met-rics. To assess the value of e-commerce capability,weemployed multiple financial measures of firm perfor-mance, as we believe that the business value ofInternet-enabled initiatives is best measured by gainsin financial performance (Porter 2001). Specifically, foreach company, we measured performance along threedimensions: profitability, cost reduction, and inven-tory efficiency. Four major variables were used to op-erationalize these three dimensions; they also servedas dependent variables in the regression analysis. Asdefined in Appendix Table A1, the four performancemetrics are as follows: (1) Two profitability metrics aresales per employee and grossmargin. Ratioswere usedto normalize profits and account for size differencesamong firms. (2) Cost of goods sold (COGS) is a gen-erally accepted accounting measure that indicates thecost side of a firm’s operations. (3) Inventory turnover(INVX) was used to measure a firm’s supply chain ef-ficiency, as widely cited in supply chain managementliterature (Lee et al. 1997). Again, this variablewas cho-sen because it was a ratio and hence corrected withfirm size. All of these performance metrics are objec-tive secondary data in the sense that they are reflected

ZHU AND KRAEMERAssessing the Value of e-Commerce
Information Systems Research282 Vol. 13, No. 3, September 2002
on firm financial filings to the Security and ExchangeCommission (SEC).5 These measures have been usedin previous studies (e.g., Venkatraman 1989, Bharadwaj2000, Mukhopadhyay et al. 1995).
3.1.2. Independent Variables. (a) IT Infrastruc-ture Metrics. The first group of independent variablesmeasures the IT infrastructure of each company, in-cluding PC, LAN, MIPS, and IT Stock, as defined inAppendix Table A2. These objective measures havebeen commonly utilized in the IT-productivity litera-ture (e.g., Hitt and Brynjolfsson 1996). IT intensity,ITINT, is a derived variable created by dividing ITStock by the number of employees, EMP. By revealingIT value in dollars per employee and controlling forsize differences, IT intensity indicates the relative em-phasis put on IT and computer systems in eachorganization.(b) e-Commerce Capability Metrics. The second group
of independent variables was e-commerce capabilities.Based on our detailed content analysis, 20 variableswere used to characterize a company’s EC capabilities.These variables are shown in Appendix Table A3. To-gether they are intended to measure EC capabilitiesalong four dimensions:• Information: useful information about products
and services.• Transaction: capabilities to facilitate transactions
online.• Interaction and Customization: capabilities that
enable online interactions between the users and thecompany, and allow users to customize products ac-cording to their personal preferences.• Supplier Connection: electronic linkages to inte-
grate suppliers via information sharing.We recognized that there might be some variations
among companies in terms of the features of products,the needs of customers, and the nature of interactionswith customers and business partners. This added ex-tra challenge for the design of the measures. After go-ing through several cycles of consultation with indus-try experts and e-commerce managers (some of themwere sponsors of this project), we pretested the vari-ables on 12 companies. We then consulted with a panelof academic experts to ensure all variables were on
5Companies in our sample are public companies.
solid conceptual grounds. Based on the feedback fromthese academic and industry experts, we revised thevariables, refined the definitions, interviewed users,and pilot-tested on 22 additional companies. Also,some EC measures that were considered to be biasedin favor of high-tech firms were removed. This processresulted in the 20 variables that were used to charac-terize a firm’s e-commerce capabilities (Table A3).Manufacturers today are closer to their customers
than ever before, partly because of the increasing con-nection enabled by information and communicationtechnologies in general and the Internet in particular.Our design of measures reflects this trend. Pioneeredby high-tech manufacturers like Dell and Cisco, the“go-direct” model allows manufacturers to interactwith customers more directly (e.g., provide informa-tion, sell products, and receive feedback). While thehigh-tech firms are the forerunners on the e-businesscurve, traditional manufacturers are following suit.For example, cars are being made in modules that aresimply snapped together in small assembly lines closeto the consumer, where details can be adapted to cus-tomer preferences. This trend is being driven largelyby the growing demand for customization (or “build-to-order”) in the auto, appliance, and other industries,and is being influenced by earlier developments in thehigh-tech industry (see reports in Economist 2002, For-tune 2001). This reflects a key strength of the Internettechnologies—the ability to provide informational,transactional, and interactive capabilities to customersand suppliers across time and space. Together withthe supplier-related variables, the EC measures arebelieved to fairly closely represent a common set ofe-commerce capabilities associated with typical busi-nesses in an average company. Collectively, they canserve as a proxy of e-commerce capabilities.In addition to the individual EC functionality indi-
cators, a higher-level composite metric was created foreach of the four dimensions of EC capabilities: Infor-mation, Transaction, Interaction (customization), andSupplier Connection. These composite metrics repre-sent a more aggregated measure of the level of capa-bility along these four dimensions. For example, theSupplier Connection index is an aggregation of all in-dividual capability variables in this category. The

ZHU AND KRAEMERAssessing the Value of e-Commerce
Information Systems ResearchVol. 13, No. 3, September 2002 283
higher the score, themore capable EC capability a com-pany has. By measuring the degree of electronic con-nectivity with suppliers and business partners, thismetric reflects the networked connections that extendthe firm to the outer world along the supply chain.Finally, a total EC capability index was created by
aggregating these four composite metrics. The use ofthese composite metrics transforms the binary vari-ables of individual functionalities into continuouscomposite measures, which helps to alleviate some po-tential statistical issues associated with using a largenumber of binary variables as independent variablesin the regression models.
3.1.3. Control Variables. Some of the cross-sectional variations in performance can be explainedonly if controls are appropriately applied. To controlfor firm-specific and industry effects, we employedtwo control variables to account for firm size and in-dustry concentration. Controlling for firm size mini-mizes confounding effects from size. Among severalpossible measures of firm size, such as total assets andsales, we chose to use number of employees, EMP, asa firm size indicator, following the tradition of the ITliterature.6 The rationale to control for industry con-centration comes from microeconomic theory, postu-lating that firm profitability is associated with the de-gree of competitiveness of the industry sector (Tirole1988, Milgrom and Roberts 1990). For example, profitmargins tend to be low in highly competitive sectors.To control for industry concentration, we used theHerfindahl-Herschmann Index (HHI) as a measure ofthe concentration level in each of the 4-digit SICcategory.7
3.2. Sample Selection: Manufacturing IndustryWe chose to focus on the manufacturing industry forseveral reasons. First, we believe that the key potential
6For example, Brynjolfsson et al. (1994) used number of employeesas a control for firm size. Our data showed a high correlation amongthese various size indicators.7The Herfindahl-Herschmann Index is a truncated index and is cal-culated by squaring the concentration ratio for each of the top 50companies or the entire sector (whichever is lower), and summingthose squares to a cumulative total. The higher the index, the moreconcentrated the industry sector is at the top (Tirole 1988, p. 221).
of e-commerce lies in efficiency gains and cost reduc-tion for large traditional companies, rather than pure-play “dot com” companies. More importantly, concen-trating on a single industry limits the scope of theproject, but helps to minimize the differences of in-dustry structure, business activity, and other effectsthat may confound the analysis (Steinfield et al. 2000).We analyzed all manufacturing companies from the
Fortune 1000 list. After eliminating those companiesfor which we were unable to obtain data on variablessuch as supplier connection, we generated a databaseof 260 companies; all of them belong to SIC Division 4manufacturing. Data used in this study were obtainedfrom both secondary data collection and public data-bases. First, data on e-commerce capabilities were col-lected through detailed content analysis on each com-pany’s Web site. These capabilities data were thenmatched with IT-infrastructure variables from theHarte-Hanks database of computer equipment (for-merly the Computer Intelligence database), andfinancial-performance variables from Standard &Poor’s Compustat database.Based on our earlier discussions on RBV and dy-
namic capabilities theory, manufacturing companies indifferent sectors should have a different history oftechnology investment, and thus may have accumu-lated different resource bases and IT intensity. Suchdifferences may affect the payoff of the more recente-commerce initiatives. To examine the possible differ-ential effects of e-commerce, we divided the originalset of 260 manufacturing companies into two samplescorresponding to two types of manufacturing compa-nies: (1) technology-oriented, or “high-tech,” compa-nies, and (2) traditional manufacturing companies.They were classified primarily on the basis of the
four-digit SIC codes. The high-tech manufacturinggroup included companies in the following four-digitSIC codes: 3570 � 3579 (computer hardware), 3600 �3691 (semiconductor and electronics), and 3825 � 3861(instruments, etc.). This sample included such com-panies as Dell, Cisco, HP, Apple, Gateway, Lucent,Nortel, and Honeywell. The traditional manufacturinggroup included companies in the following four-digitSIC codes: 2000 � 3490 (appliance, packaged goods,apparel, furniture and chemicals), 3510 (engines andturbines), 3523 (farm machinery), 3537 (industrial

ZHU AND KRAEMERAssessing the Value of e-Commerce
Information Systems Research284 Vol. 13, No. 3, September 2002
trucks and tractors), and 3714 (automobiles and parts).This sample included companies such as Ford, Good-year, Case, Mattel, Otis, and Whirlpool.As supported by the descriptive statistics, technology-
oriented companies tended to be high IT-intensityfirms, and traditional manufacturing companies tendto be low IT-intensity firms. The former category ismainly IT-producing firms, while the latter category ismainly IT-using firms. This division is consistent withthe literature (e.g., Stiroh 2001).
3.3. Coding ProcedureTo code the data from both secondary data collectionand public databases, data on e-commerce capabilitieson the company Web site were subjected to detailedcontent analysis. These capabilities data were thenmatched with IT-infrastructure variables from theHarte-Hanks database of computer equipment (for-merly the Computer Intelligence database), andfinancial-performance variables from Standard &Poor’s Compustat database.Coding for e-commerce capability turned out to be
the most time-consuming part of the data collectionand creation effort, as this type of data was not readilyavailable because of the lack of publicly accessiblemeasures for each company. As discussed above, aftergoing through several cycles of consultation, inter-view, pilot-testing, and revising, a coding system witha standard coding form and the definitions of variableswere finalized. Through a series of intensive sessions,three groups of coders were trained to code the ECfunctionalities according to the coding system. Theyperformed content analysis and examined each Website of the companies on our list, filling out a standarddata form. Each EC functionality attribute was codedusing a binary variable, representing whether or not aWeb site had the particular functionality, where onewas “yes,” zero was “no,” and undefined variableswere considered missing values. A random sample of34 Web sites was used for reliability testing. Twogroups of the coders analyzed the full Web sites. Thethird group reviewed the items, on which disagree-ment occurred, and a majority rule was used to deter-mine the coding. Intercoder reliability was then cal-culated by using the per item agreement methodsuggested in the literature (Kassarjian 1977). Overallintercoder reliability of 0.92 was achieved.
While this method worked well for customer-oriented functionalities, we encountered difficulty incollecting data on supplier-related functionalities.Some companies used extranets or EDI to conductbusinesses with their suppliers, which might not beobservable from the Web site. To collect data on sup-plier connection and backend systems, we designed asurvey of IT executives and e-business managers, ask-ing six specific questions as towhether their companieshave the six supplier functionalities (shown at the bot-tom of Appendix Table A3). Each of these items wasreviewed for its content, scope and purpose (contentvalidity). To increase response rate, the survey waskept brief and specific. The execution of the surveywasmanaged by a professional survey firm. After we re-ceived the data, we checked for consistency and valid-ity. The responses were then incorporated into the cod-ing of EC capabilities.The data collection procedure described above was
repeated twice for two years. The functionality datawere then matched to IT variables from the Harte-Hanks database and financial data from the Compus-tat database for the same time period.
3.4. Validity of the InstrumentationAccording to the guidelines for validation provided byStraub (1989) and Boudreau et al. (2001), we performedmultiple tests on construct validity and reliability.Confirmatory factor analysis (CFA) was conducted toexamine the validity of the constructs and to justify thee-commerce index categorization, in which 20 indica-tors were grouped into four latent variables. A soft-ware package, AMOS 4.0, was used to implement theCFA. The results and statistical measures are providedin Table 1.
3.4.1. Reliability. Reliability is an indication ofmeasurement accuracy, that is, the extent to which in-strumentation produces consistent or error-free re-sults. Cronbach’s � reliabilities in the test ranged from0.65 to 0.93, hence internal consistency appeared to behigh, as shown in Table 1. Factor loadings were allpositive, significant, and above the cutoff value of 0.4(Gefen et al. 2000). Further, construct reliability wasevaluated in two ways: composite reliability and var-iance extracted. Both measures were above 0.7 for all

ZHU AND KRAEMERAssessing the Value of e-Commerce
Information Systems ResearchVol. 13, No. 3, September 2002 285
Table 1 e-Commerce Capability Constructs
High-Tech Sample Traditional Sample
Constructs IndicatorsFactor
LoadingConvergent
ValidityCronbach
AlphaFactor
LoadingConvergent
ValidityCronbach
Alpha
Information Product information 0.588 3.119*** 0.657 0.407 3.086*** 0.673Search capability 0.572 2.723*** 0.750 4.070***Product review 0.464 1.952* 0.446 1.936*Product update 0.458 — 0.452 —
Transaction Buy capability 0.982 12.816*** 0.929 0.907 11.912*** 0.904Online order tracking 0.898 14.849*** 0.945 17.060***Account management 0.922 16.369*** 0.856 14.650***Return 0.419 — 0.408 —Security 0.417 4.037*** 0.405 4.987***
Interaction Configuration capability 0.446 4.041*** 0.842 0.452 3.262*** 0.802Customer registration 0.721 3.878*** 0.794 6.056***Online recommendation 0.475 — 0.468 —Content personalization 0.508 2.918** 0.507 4.680***Real-time support 0.526 4.554*** 0.509 4.119***
Supplier Connection Online procurement 0.452 2.453** 0.703 0.443 1.847* 0.651EDIIntegrat. to backend IS
0.6520.454
2.652**2.372**
0.6140.438
2.916***1.905*
FulfillmentInventory data sharing
0.4120.750
—3.784***
0.5610.593
—2.772**
Note. Significance levels: ***p � 0.01; **0.01 � p � 0.05; * 0.05 � p � 0.10.
four EC capability constructs (information, transac-tion, interaction, and supplier connection), based onwhich we may conclude that the reliability for theseconstructs is adequate (Straub 1989).
3.4.2. Content and Construct Validity. Val-idating one’s instrumentation includes content andconstruct validity. Content validity is the degree towhich items in an instrument reflect the content uni-verse to which the instrument will be generalized(Boudreau et al. 2001). This validity was verified bychecking the various indicators’ managerial meaningsand by a careful literature review. The items used inthis study were based on strong theoretical groundsand distilled from extensive research interviews andliterature review. Our carefully designed instrumen-tation followed by checks, pretests, and balances im-posed during and after the data collection added to theconfidence we felt we could place in the content valid-ity of our data set.
Construct validity is the extent to which an opera-tionalization measures the concepts that it purports tomeasure (Straub 1989). It has two components: con-vergent and discriminant validity.8 Convergent valid-ity was verified through the t statistic for each factorloading. Only one indicator, supplier virtual commu-nity, had an insignificant contribution to the supplierconnection construct. After dropping this variable, allloadings were significant, as reported in the middlecolumn of Table 1. Hence, we may conclude an ac-ceptable convergent validity for both samples. By com-paring construct variance extracted with correlationsamong constructs, using the conceptual discriminationprocess articulated originally by Campbell and Fiske(1959), discriminant validity was found to be accept-able as well. In their evaluative procedure, items inconstructs should correlate more highly with items in
8We treat nomological validation separately in later sections.

ZHU AND KRAEMERAssessing the Value of e-Commerce
Information Systems Research286 Vol. 13, No. 3, September 2002
Table 2 Validity Statistics
Goodness-of-Fit IndicesHigh-Tech
SampleTraditional
Sample
Absolute FitChi-Square 85.830 88.233p value 0.281 0.168
Incremental FitNormed Fit Index (NFI) 0.950 0.959Relative Fit Index (RFI) 0.924 0.932Incremental Fit Index (IFI) 0.996 0.993Tucker-Lewis Index (TLI) 0.994 0.988Comparative Fit Index (CFI) 0.996 0.992
Parsimonious FitNormed Chi-Square 1.086 1.209Root Mean Square Error of
Approximation (RMSEA) 0.032 0.033RMSEA Lower Bound 0.000 0.000RMSEA Upper Bound 0.071 0.055
the same construct than with items thought to be the-oretically distinct constructs. By this logic, the in-strumentation demonstrated good measurementproperties.
3.4.3. Overall Model Fit Table 2 listed severalgoodness-of-fit statistics to assess how well the speci-fied model explains the observed data from three as-pects: absolute fit, incremental fit, and model parsi-mony. The two insignificant p-values (p � 0.281 and0.168) for the chi-square statistics imply good absolutefit. Five incremental fit indices are all above 0.9, theconventional cut-off point as suggested by Gefen et al.(2000) and Hair et al. (1998), indicating an excellentmodel fit comparing to a baseline null model. Each ofthese indices is briefly discussed below:• Tucker-Lewis Index (TLI) combines a measure of
parsimony into a relative index between the proposedand null models, resulting in values ranging from zeroto one. This measure can also be used for comparingbetween alternative models by substituting the alter-native model for the null model.• Normed Fit Index (NFI) represents the proportion
of total covariance among observed variables ex-plained by a target model when using the null modelas a baseline model. Similar to TLI, it is a relative com-parison of the proposed model to the null model, rang-ing from zero (no fit at all) to one (perfect fit).
• Relative Fit Index (RFI): The difference betweenRFI and NFI is that RFI is derived by adjusting thediscrepancy (chi-square) of the proposed and baselinemodels by their respective degrees of freedom. RFI val-ues close to one indicate a good fit.• Incremental Fit Index (IFI) is the ratio of the dif-
ference between discrepancy (chi-square) of the pro-posed and baseline models over the difference of therespective degrees of freedom. It also serves as a com-parison of two models, with values close to one beinga good fit.• Comparative Fit Index (CFI) estimates each non-
centrality parameter by the difference between its t sta-tistic and the corresponding degrees of freedom.As to the parsimonious fit, the normed chi-square isthe ratio of the chi-square divided by the degrees offreedom, such that the chi-square is adjusted by thedegrees of freedom to assessmodel fit for variousmod-els. The root mean square error of approximation(RMSEA) is the square root of the mean of the popu-lation discrepancy per degree of freedom. SmallRMSEA values mean low residual variance and, there-fore, a good fitting model. As shown in Table 2, thenormed chi-square is well below two, the upperthreshold suggested by Carmines et al. (1981). RMSEAis below the cutoff value 0.08 suggested by Browne etal. (1993). Hence, both samples satisfied these recom-mended criteria.In conclusion, based on these tests for validity and
reliability, we felt that the data and constructs havebeen adequately validated. The overall fit statistics, va-lidity, and reliability measures lend substantial sup-port for confirmation of the proposed model. This alsoreflects the fact that the items have been pretested andrefined over several rounds of data collection.
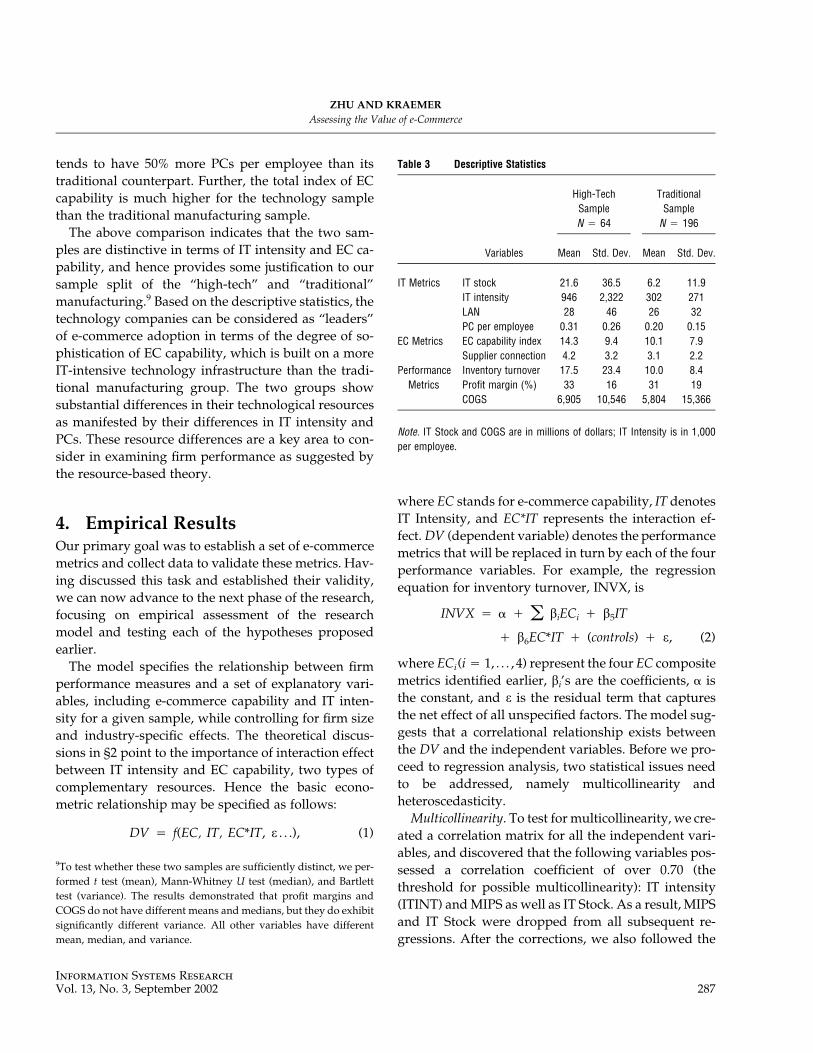
3.5. Descriptive StatisticsThe summary statistics offered several interestingcharacteristics about the sample, as shown in Table 3.First, the two samples, technology and traditionalmanufacturing, show a considerable difference in ITintensity. While an average traditional manufacturerhas 6.2 million dollars of IT stock, an average technol-ogy firm has 3.5 times more IT stock. Consequently, ITintensity is substantially higher for the technologysample. Similarly, an average technology company
ZHU AND KRAEMERAssessing the Value of e-Commerce
Information Systems ResearchVol. 13, No. 3, September 2002 287
Table 3 Descriptive Statistics
High-TechSampleN � 64
TraditionalSample
N � 196
Variables Mean Std. Dev. Mean Std. Dev.
IT Metrics IT stock 21.6 36.5 6.2 11.9IT intensity 946 2,322 302 271LAN 28 46 26 32PC per employee 0.31 0.26 0.20 0.15
EC Metrics EC capability index 14.3 9.4 10.1 7.9Supplier connection 4.2 3.2 3.1 2.2
Performance Inventory turnover 17.5 23.4 10.0 8.4Metrics Profit margin (%) 33 16 31 19
COGS 6,905 10,546 5,804 15,366
Note. IT Stock and COGS are in millions of dollars; IT Intensity is in 1,000per employee.
tends to have 50% more PCs per employee than itstraditional counterpart. Further, the total index of ECcapability is much higher for the technology samplethan the traditional manufacturing sample.The above comparison indicates that the two sam-
ples are distinctive in terms of IT intensity and EC ca-pability, and hence provides some justification to oursample split of the “high-tech” and “traditional”manufacturing.9 Based on the descriptive statistics, thetechnology companies can be considered as “leaders”of e-commerce adoption in terms of the degree of so-phistication of EC capability, which is built on a moreIT-intensive technology infrastructure than the tradi-tional manufacturing group. The two groups showsubstantial differences in their technological resourcesas manifested by their differences in IT intensity andPCs. These resource differences are a key area to con-sider in examining firm performance as suggested bythe resource-based theory.
4. Empirical ResultsOur primary goal was to establish a set of e-commercemetrics and collect data to validate these metrics. Hav-ing discussed this task and established their validity,we can now advance to the next phase of the research,focusing on empirical assessment of the researchmodel and testing each of the hypotheses proposedearlier.The model specifies the relationship between firm
performance measures and a set of explanatory vari-ables, including e-commerce capability and IT inten-sity for a given sample, while controlling for firm sizeand industry-specific effects. The theoretical discus-sions in §2 point to the importance of interaction effectbetween IT intensity and EC capability, two types ofcomplementary resources. Hence the basic econo-metric relationship may be specified as follows:
DV � f(EC, IT, EC*IT, e . . .), (1)
9To test whether these two samples are sufficiently distinct, we per-formed t test (mean), Mann-Whitney U test (median), and Bartletttest (variance). The results demonstrated that profit margins andCOGS do not have different means and medians, but they do exhibitsignificantly different variance. All other variables have differentmean, median, and variance.
where EC stands for e-commerce capability, IT denotesIT Intensity, and EC*IT represents the interaction ef-fect.DV (dependent variable) denotes the performancemetrics that will be replaced in turn by each of the fourperformance variables. For example, the regressionequation for inventory turnover, INVX, is
INVX � � � b EC � b IT� i i 5
� b EC*IT � (controls) � e, (2)6
where ECi(i � 1, . . . , 4) represent the four EC compositemetrics identified earlier, bi’s are the coefficients, � isthe constant, and e is the residual term that capturesthe net effect of all unspecified factors. The model sug-gests that a correlational relationship exists betweenthe DV and the independent variables. Before we pro-ceed to regression analysis, two statistical issues needto be addressed, namely multicollinearity andheteroscedasticity.Multicollinearity. To test for multicollinearity, we cre-
ated a correlation matrix for all the independent vari-ables, and discovered that the following variables pos-sessed a correlation coefficient of over 0.70 (thethreshold for possible multicollinearity): IT intensity(ITINT) andMIPS as well as IT Stock. As a result, MIPSand IT Stock were dropped from all subsequent re-gressions. After the corrections, we also followed the

ZHU AND KRAEMERAssessing the Value of e-Commerce
Information Systems Research288 Vol. 13, No. 3, September 2002
Table 4 Regression Results on COGS
High-Tech Sample Traditional Sample
Overall Model :R2 Adj.Significance
0.321**0.016
0.421**0.049
0.301***0.001
0.343***0.0001
EC Capability :Overall Index
InformationTransactionInteractionSupplier Connection
�2352.318**913.013
1608.062�2341.265*�568.446*
1574.869**4088.288
�2431.2501468.520
�481.778*IT Intensity 76.812* 76.707 58.90* �55.670Interaction Effect:
EC*IT �2710.342**�2757.996* 1077.00** 992.808**
Note. Under each sample, two regressions are reported—The first one usedthe overall EC capability index, while the second one replaced it with the fourEC capability constructs in the regression. Entries reported above are coef-ficients. Significance levels: ***p � 0.01; **0.01 � p � 0.05; *0.05 � p� 0.10.
approach of Belsley et al. (1980) and found that allBKW conditional indices were below the thresholdlevel of 30.Heteroscedasticity.With our cross-sectional data, var-
iance of disturbances may not be constant among ob-servations because of differing factors related to spe-cific firms. This may increase the possibility ofheteroscedasticity. To account for this possible prob-lem, many of the variables used in our analysis werenormalized for the size of the firm, by expressing themas ratios rather than raw numbers.10 To check for het-eroskedasticity, we performed the White test (White1980); heteroskedasticity was detected, at the 5% level,in the regressions using INVX (both samples), COGS(traditional sample), and profit margins (traditionalsample). Heteroskedasticity was not significant inother regressions. The White heteroskedasticity-consistent standard errors were used for all cases if theWhite heteroskedasticity test statistic was significant at5% level.
4.1. Cost MeasuresTo test Hypothesis 2, the regression model is specifiedas follows:
COGS � � � b EC � b IT� i i 5
� b EC*IT � (controls) � e. (3)6
As shown in Table 4, the adjusted R2 is consistentlyassociated with significant p values, indicating a rea-sonably good fit of the overall model. As shown by itsnegative coefficient and significance level, higher over-all EC capability tends to be associated with lowerCOGS for the high-tech sample. The IT intensity ismarginally significant with a positive coefficient. Theinteraction effect is found to be statistically significant,but showed opposite relationships on the two samples:a negative coefficient for the high-tech sample and apositive coefficient for the traditional sample. This im-plies that the interaction effect tends to be associated
10Ratios were used in many areas of our analysis. For instance, ITStock was divided by number of employees (EMP) to normalize theIT infrastructure variable into a single ratio (ITINT). The samemethod was used to normalize differences in revenues and profit-ability. Sales (SALE) was divided by EMP to get a normalized mea-sure of per-person productivity, while gross margin was divided bySALE.
with decreasedCOGS for the technology companies, butincreased COGS for their traditional counterparts. Thisis a surprise in the sense that the use of e-commerce,together with IT investment, is associated with in-creased COGS for the traditional manufacturingcompanies.11
It is possible that these companies have not yetreached a level of IT infrastructure, as well as experi-ence and learning curve, where costs would be de-creased. Higher costs might reflect learning cost, ad-justment costs, IT infrastructure misalignment andinefficiencies (e.g., legacy information systems anddata platforms), and the costs of integrating such ITsystems with existing organizational and businessprocesses. Perhaps our data did not capture enoughdetails of the differences in the nature of EC and ITresources between traditional and technology compa-nies, but we learned from field interviews and casestudies that the level of integration is greater in tech-nology companies (Mendelson 1999, Kraemer and
11Even though the theory does not predict this opposite relationship,this finding shows that something other than IT alone affects therelationship. In this sense, it is consistent with RBV.

ZHU AND KRAEMERAssessing the Value of e-Commerce
Information Systems ResearchVol. 13, No. 3, September 2002 289
Table 5 Regression Results on INVX
High-Tech Sample Traditional Sample
Overall Model :R2 Adj.Significance
0.412**0.040
0.556***0.002
0.221**0.019
0.348**0.018
EC Capability :Overall IndexInformationTransactionInteractionSupplier Connection
0.458*0.0290.097*
�0.1040.272**
0.022*0.014
�0.0030.0060.004*
IT Intensity �0.125* �0.137* �0.017 �0.016Interaction Effect:
EC*IT 0.025*** 0.027*** 0.004** 0.003*
Note. Under each sample, two regressions are reported—The first one usedthe overall EC capability index, while the second one replaced it with the fourEC capability constructs in the regression. Entries reported above are coef-ficients. Significance levels: ***p � 0.01; **0.01 � p � 0.05; *0.05 � p� 0.10.
Dedrick 2002). That is, the technology resource base isricher, more extensive, interconnected and responsive.Also, it is based on larger investment, considerablelearning and expertise that comes from being a high-tech vs. traditional manufacturing company. In con-trast, traditional manufacturing companies suffer fromincompatible legacy systems in their IT infrastructure.As discussed in §2, resource-based theory suggeststhat these differences lead to differences in firmperformance.
4.2. Profitability MeasuresTo test Hypothesis 3, we regressed gross marginagainst the same set of independent variables as above.For the traditional manufacturing sample, the adjustedR2 is 0.069 with p value � 0.285, hence we cannot rejectthe null hypothesis. For the technology sample, the ad-justed R2 is 0.16 with p value � 0.14. We cannot rejectthe null hypothesis either, even though the result im-proved slightly. A similar weak result was obtainedwhen sales per employee was used as the dependentvariable. These weak results indicate that overall ag-gregate measures of firm performance such as totalsales and profit margins appear to be too “remote” tobe significantly associatedwith e-commerce capability.
It is also possible that a time lag exists between the useand consequence of e-commerce initiatives. Given theshort history of e-commerce, it may be too early to ob-serve its effects on overall aggregate measures of firmperformance.
4.3. Inventory TurnoverUsing INVX as the dependent variable as proposed inHypothesis 4, the regression results were mixed. Asshown in Table 5, regression on the technology samplegenerated reasonably good adjusted R2 with signifi-cant p values, leading us to reject the null hypothesis.The overall EC capability index, as well as the Trans-action and Supply Connection subindices, was foundto be significant, indicating a positive association ofthese EC capabilities to INVX. The result for the tra-ditional manufacturing sample turned out to be rela-tively weaker than that of the high-tech sample, butstill statistically significant (as indicated by the pvalues).12
These results provide empirical evidence on thepositive association of e-commerce with inventorymanagement and supply chain efficiency, consistentwith the theoretical predictions we made in §2. Theresult also seems to support the theoretical argumentthat better information flow along the supply chain cansubstitute for physical inventory (Milgrom andRoberts 1988).
4.4. Interaction Effects Between IT and ECWe have noticed that the interaction effect is statisticallysignificant for COGS, though it showed opposite re-lationships on the two samples. For INVX, the inter-action effect is found to be statistically significant forboth samples. It is stronger in the high-tech samplethan in the traditional sample, as indicated by the sig-nificance levels and the relative magnitude of the co-efficients in Table 5. Putting together these resultsdemonstrates the importance of the interaction effect,which has been proposed as our main hypothesis in§2.3.
12The two control variables, EMP and HHI, were found to be statis-tically insignificant, and hence were not reported to avoid crowdingthe table.

ZHU AND KRAEMERAssessing the Value of e-Commerce
Information Systems Research290 Vol. 13, No. 3, September 2002
Figure 2 Interaction Effect of IT Intensity and EC Capability
Figure 2 depicts the nature of the interaction be-tween EC capability and IT intensity for INVX. For lowIT intensity firms, more e-commerce use did not leadto improvement of INVX. However, for high IT inten-sity firms, greater EC capability was positively asso-ciated with higher INVX. This makes sense, in that,when the IT infrastructure was not there, merely build-ing a fancy Web site would not help firm performance.The failures of many dot com firms have testified tothis. Only when the firm has an intensive IT infrastruc-ture, e-commerce initiatives become capable of im-proving firm performance. Further, as shown in Figure2, the lines with higher EC have a positive, steeperslope (i.e., higher first derivative). This means thathigher levels EC capability tend to make IT infrastruc-ture more valuable. Once again, this suggests the com-plementarity of EC and IT, as theorized in §2.2.
4.5. Differential Relationships: High-Tech vs.Traditional Companies
Comparing the two samples, we noticed that the tech-nology sample exhibited stronger links betweene-commerce metrics and firm performance measures.The model was statistically stronger in terms of higherR2 and more significant coefficients. The interaction ef-fect was stronger as well for both INVX and COGS, aswe discussed above. Together, these results supportedHypothesis 5.Among other possible explanations, the differential
resource base might imply an experience curve or ad-justment cost that has to be overcome before realizingcost savings. Based on the complementarity concept of
resource-based theory, traditionalmanufacturing com-panies may need significantly enhanced alignmentwith their existing IT infrastructure in order to reapthe benefits of Internet-based initiatives. A reasonablenetworked communication and information infra-structure, replacing the rigid legacy systems,may needto be in place before e-business benefits can be har-vested by these organizations.These findings indicate that the high-tech and tra-
ditional samples exhibit distinctive characteristics interms of EC capability and IT infrastructure, whichlead to differential relationships to firm performance.This shows that the high-tech vs. traditional manufac-turing classification scheme has value for studying dif-ferential effects of e-commerce initiatives.
5. DiscussionBy examining substantive relationships of the e-commerce measures to firm performance in the abovesection, we were empirically testing to see if the mea-sures are consistent with theory. Such empirical as-sessment helps to establish nomological validity of theconstructs. One must consider the relationship of theconcept under investigation to other concepts in anoverall context of a theoretical network. “This is animportant component of the construct assessmentsince it moves the logic of assessment from statisticaldomain of intercorrelations among the multiple indi-cators designed to capture the underlying trait (i.e.,reliability, convergent, and discriminant validity) to-wards the substantive domain focusing on relation-ships that are best interpreted in the light of the re-ceived theory” (Venkatraman 1989, p. 954).Together with the validity and reliability statistics
discussed in §3.4, we believe that we have validatedour e-commerce constructs. They can be used for fu-ture studies or further refinements by other IS re-searchers who wish to measure these constructs moreextensively. They can also be used as starting points toinvestigate the various research issues related to Net-enabled organizations as articulated by Straub andWatson (2001).In addition, we have shown that the theories of RBV
and dynamic capabilities offer a relevant framework

ZHU AND KRAEMERAssessing the Value of e-Commerce
Information Systems ResearchVol. 13, No. 3, September 2002 291
to study the value of e-commerce. Firms differ in termsof their ability to adapt to changes induced by digitaltechnologies (Christensen 1997). Net-enabled organi-zations, such as high-tech firms, are likely to be moreagile and capable of competing in dynamic marketsthan traditional manufacturing companies. These tra-ditional manufacturing firms have to build their dy-namic capabilities needed to exploit new IT resources.Success in this process depends on the firm’s reservesof relevant knowledge, managerial commitment toadopting the new technologies, and the entrepreneur-ial process that pervades the firm’s operations (Teeceet al. 1997, Wheeler 2002). As shown by our study,high-tech firms are adept at developing systems andprocesses that create and expand their dynamic capa-bilities, while traditional manufacturing companies arestruggling to benefit from digitally induced transfor-mations. Future research should examine the processesthat firms use to develop and renew their dynamiccapabilities.Many limitations of the study could be cited, but we
focus on key limitations here. First, in our empiricalanalysis, we compared high-tech vs. traditional manu-facturing companies to examine the differences andsimilarities of the role of EC capability metrics on thesecompanies. However, our samplemay not be fully rep-resentative of the true population of high-tech and tra-ditional sectors due to possible bias of sample selec-tion. Despite this possibility, we felt that the use of asample of Fortune 1000 manufacturing firms was suit-able as a proxy for our research purpose. Second,whilewe took steps to reduce bias in the data collection pro-cess, noise is inevitable. The content analysis alonemay underestimate some EC capabilities related tobusiness-to-business interactions, especially for somecompanies that relied on extranet, EDI, or private net-works for dealing with suppliers. Nonetheless, we be-lieve that the survey data on supplier connectionhelped to alleviate this problem.Our study has numerous implications for managers.
Increasing levels of e-commerce capabilities by tech-nology companies over time have been accompaniedby complementary investments in IT infrastructureand business processes, as well as a steady “digitiza-tion” and “informatization” of production and supply
chain management. All of this serves to enhance theeffectiveness of the more recent investments inInternet-based e-commerce initiatives. By the same to-ken, one explanation for the less significant estimatedrelationship of e-commerce metrics and firm perfor-mance in the traditional manufacturing sector is therelatively low level of IT intensity, a key EC-enhancingcomplementary resource.It is possible that there is path dependence such that
companies must invest in complementary resourcesand transform their old accumulated resources (suchas technical platforms, databases, and legacy infor-mation systems) to the Internet before investment inthis relatively new technology becomes productive.13
Compared to high-tech companies, traditional com-panies suffer from the lack of complementary digiti-zation in their value chains, as suggested by the dif-ferences in EC capability and IT intensity shown in thedata.Hence, for managers, positioning e-commerce to lev-
erage other complementary resources such as IT infra-structure and connectivity with suppliers should be anecessary condition for those companies to benefitfrom e-commerce. In addition, the success of the Inter-net initiatives of a firm depends not only on its ownefforts to digitize its value chain, but also on the read-iness of its customers, suppliers, and business partnersto simultaneously engage in electronic interactions andtransactions. While it is conventional to think of thisreadiness as something external to the firm, our studypoints to the need to consider it as a driver that re-quires a proactive commitment of resources.
6. ConclusionThis study, through successive stages of testing andrefinement, has arrived at a set of e-commerce mea-sures that satisfied necessary measurement properties.The result is a parsimonious, 20-item instrument andinstrumentation procedure. The four scales demon-strate acceptable levels of reliability and validity, asempirically verified. We categorized the major metrics
13Such practices have been shown effective in many high-tech com-panies such as Cisco, Dell, Sun, and Gateway.
ZHU AND KRAEMERAssessing the Value of e-Commerce
Information Systems Research292 Vol. 13, No. 3, September 2002
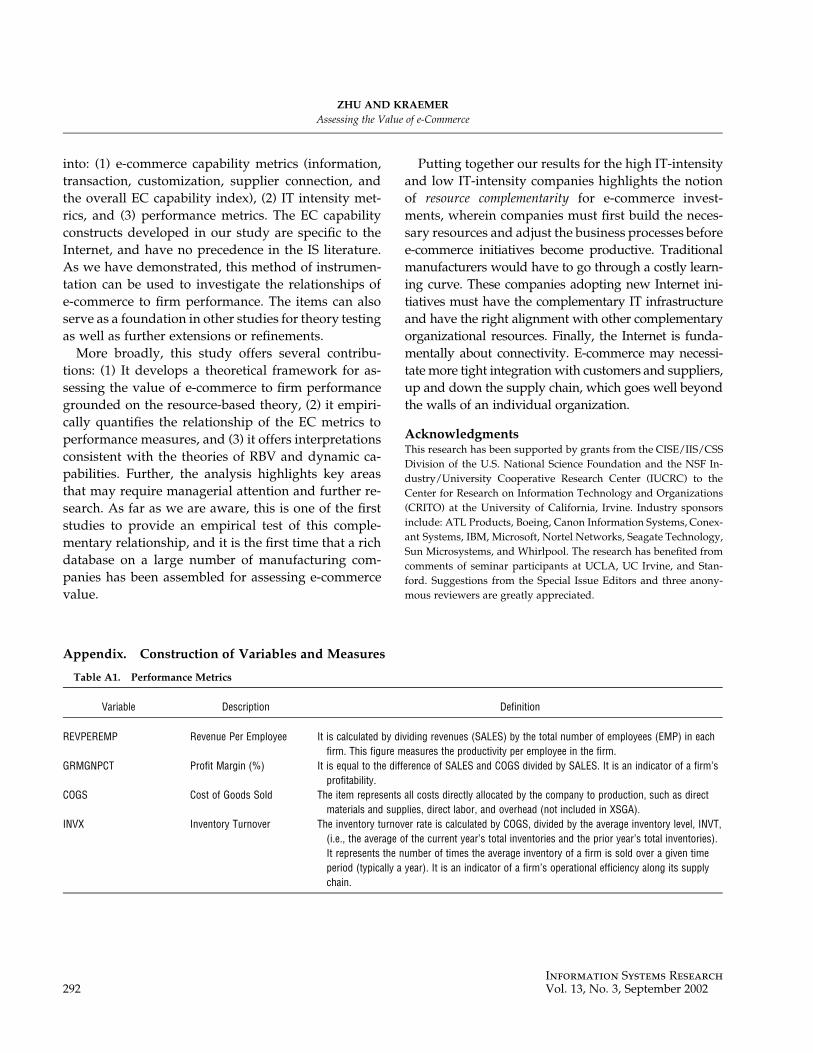
into: (1) e-commerce capability metrics (information,transaction, customization, supplier connection, andthe overall EC capability index), (2) IT intensity met-rics, and (3) performance metrics. The EC capabilityconstructs developed in our study are specific to theInternet, and have no precedence in the IS literature.As we have demonstrated, this method of instrumen-tation can be used to investigate the relationships ofe-commerce to firm performance. The items can alsoserve as a foundation in other studies for theory testingas well as further extensions or refinements.More broadly, this study offers several contribu-
tions: (1) It develops a theoretical framework for as-sessing the value of e-commerce to firm performancegrounded on the resource-based theory, (2) it empiri-cally quantifies the relationship of the EC metrics toperformance measures, and (3) it offers interpretationsconsistent with the theories of RBV and dynamic ca-pabilities. Further, the analysis highlights key areasthat may require managerial attention and further re-search. As far as we are aware, this is one of the firststudies to provide an empirical test of this comple-mentary relationship, and it is the first time that a richdatabase on a large number of manufacturing com-panies has been assembled for assessing e-commercevalue.
Putting together our results for the high IT-intensityand low IT-intensity companies highlights the notionof resource complementarity for e-commerce invest-ments, wherein companies must first build the neces-sary resources and adjust the business processes beforee-commerce initiatives become productive. Traditionalmanufacturers would have to go through a costly learn-ing curve. These companies adopting new Internet ini-tiatives must have the complementary IT infrastructureand have the right alignment with other complementaryorganizational resources. Finally, the Internet is funda-mentally about connectivity. E-commerce may necessi-tate more tight integrationwith customers and suppliers,up and down the supply chain, which goes well beyondthe walls of an individual organization.
AcknowledgmentsThis research has been supported by grants from the CISE/IIS/CSSDivision of the U.S. National Science Foundation and the NSF In-dustry/University Cooperative Research Center (IUCRC) to theCenter for Research on Information Technology and Organizations(CRITO) at the University of California, Irvine. Industry sponsorsinclude: ATL Products, Boeing, Canon Information Systems, Conex-ant Systems, IBM, Microsoft, Nortel Networks, Seagate Technology,Sun Microsystems, and Whirlpool. The research has benefited fromcomments of seminar participants at UCLA, UC Irvine, and Stan-ford. Suggestions from the Special Issue Editors and three anony-mous reviewers are greatly appreciated.
Appendix. Construction of Variables and Measures
Table A1. Performance Metrics
Variable Description Definition
REVPEREMP Revenue Per Employee It is calculated by dividing revenues (SALES) by the total number of employees (EMP) in eachfirm. This figure measures the productivity per employee in the firm.
GRMGNPCT Profit Margin (%) It is equal to the difference of SALES and COGS divided by SALES. It is an indicator of a firm’sprofitability.
COGS Cost of Goods Sold The item represents all costs directly allocated by the company to production, such as directmaterials and supplies, direct labor, and overhead (not included in XSGA).
INVX Inventory Turnover The inventory turnover rate is calculated by COGS, divided by the average inventory level, INVT,(i.e., the average of the current year’s total inventories and the prior year’s total inventories).It represents the number of times the average inventory of a firm is sold over a given timeperiod (typically a year). It is an indicator of a firm’s operational efficiency along its supplychain.

ZHU AND KRAEMERAssessing the Value of e-Commerce
Information Systems ResearchVol. 13, No. 3, September 2002 293
Table A2. IT Infrastructure Metrics
Variable Description Definition
PC Number of PCs PC is the total number of personal computers (including laptops) in the company.LAN Total Number of Local
Area NetworksLAN represents the total number of installed local area networks in an organization, which
denotes the extent of the connectivity of the organization’s IT infrastructure. In general, LANsare measured by “bridges.”
MIPS Total Installed MIPS MIPS is the total level of installed processing power, measured in millions of instructions persecond (excluding personal computers).
IT Stock Total Purchase Value ofSystems
It is the total purchase value of all computer systems in the organization, which was calculatedby CI and was based on the current value of the installed base.
IT Intensity Intensity of IT Investment It is created during this study by dividing IT Stock by the number of employees, EMP. Byrevealing IT value in dollars per employee, IT intensity indicates the relative emphasis put onIT and computer systems in each organization.
Table A3. e-Commerce Capability Indicators
Category Description Definition
Information ec1 Product InformationOnline
This signifies whether a product catalog or other product availability information isavailable online.
ec2Search Capability This indicates whether the Web site offers attribute-based search capability. It assists
customers in finding a specifically needed product quickly.ec3 Product Review Information provided to potential customers about product quality, usability, and reliability
(e.g., through third-party reviews or customer ratings).ec4 Product Update Indicates whether a Web site posts product updates, maintenance and repair FAQs, e-mail
based support or other pre- and post-sale support.
Transaction ec5 Buy Capability This enables the customer to place the order through the Web site.ec6 Online Order Tracking This enables the customer to log on the Web site to view the status of the order. It helps
the buyer to become aware of product movement in the order processing cycle.ec7 Account Management A simplified procedure to complete transactions for registered users.ec8 Return Information, procedure, and mechanism to facilitate returns.ec9 Security Indications about the security of transactions and customers’ sensitive data.
Interaction andCustomization
ec10 Configuration Capability This enables the user to configure product features via the Web site. This functionalityallows products to be “built-to-order” on the basis of the customer’s preference.
ec11 Customer Registration A feature where users can register with the Web site to gain access to personalizedaccounts or private messages.
ec12 Online Recommendation Describes the use of dynamic real-time online product recommendationsec13 Content Personalization A functionality allowing online visitors to customize the content viewed on the Web site.ec14 Real-Time Support Online technical support handled by live representatives through either Web-enabled voice
communication or instant messaging based communication.
Supplier Connection ec15 Online Procurement This corresponds to Internet-enabled procurement of raw materials, supplies and parts bythe manufacturer (including placing orders and tracking orders online).
ec16 EDI Links Whether the company uses electronic data interchange or extranet for supply chainmanagement.
ec17 Supplier VirtualCommunity
Whether the company offers an online community dedicated to suppliers (e.g., discussionforms, chat rooms, message boards, online FAQ’s . . .).
ec18 Integration to BackendInfo. Systems
An indication of online integration with databases and backend information systems withsuppliers.
Ec19 Fulfillment and Logistics A functionality to facilitate shipment and logistics management with suppliers anddistributors via the Internet.
ec20 Inventory Data Sharing Whether inventory information is updated and shared online with suppliers and businesspartners through electronic links.

ZHU AND KRAEMERAssessing the Value of e-Commerce
Information Systems Research294 Vol. 13, No. 3, September 2002
ReferencesBagozzi, R. P. 1980. Causal Methods in Marketing. John Wiley and
Sons, New York.Barney, J. 1991. Firm resources and sustained competitive advan-
tage. J. Management 17(1) 99–120.Barua, A., T. Mukhopadhyay. 2000. Information technology and
business performance: Past, present and future. R. Zmud, ed.Framing the Domains of IT Management: Projecting the FutureThrough the Past. Pinnaflex Educational Resources, Cincinnati,OH.
——, C. H. Kriebel, T. Mukhopadhyay. 1995. Information technol-ogies and business value: An analytic and empirical investi-gation. Inform. Systems Res. 6(1) 3–23.
Belsley, D., E. Kuh, R. Welsch. 1980. Regression Diagnostics. Wiley,New York.
Bharadwaj, A. 2000. A resource-based perspective on IT capabilityand firm performance: An empirical investigation. MIS Quart.24(1) 169–196.
Boudreau, M., D. Gefen, D. Straub. 2001. Validation in IS research:A state-of-the-art assessment. MIS Quart. 25(1) 1–24.
Browne, M., R. Cudeck. 1993. Alternative ways of assessing modelfit. K. A. Bollen and J. S. Long, eds. Testing Structural EquationModels. Sage Publications, London, U.K., 136–162.
Brynjolfsson, E., S. Yang. 1996. Information technology and produc-tivity: A review of the literature. Adv. Comput. 43 179–214.
——, T. Malone, V. Gurbaxani, A. Kambil. 1994. Does informationtechnology lead to smaller firms? Management Sci. 40 12.
Campbell, D. T. 1960. Recommendations for APA test standards re-garding construct, trait, discriminant validity. Amer. Psych. 15(August) 546–553.
——, D. W. Fiske. 1959. Convergent and discriminant validation bythe multitrait-multimethod matrix. Psych. Bull. 56(2) 81–105.
Carmines, E., J. McIver. 1981. Analyzing models with unobservedvariables: Analysis of covariance structures. G. Bohrnstedt andE. Borgatta, eds. Social Measurement: Current Issues. Sage Pub-lications, Beverly Hills, CA, 65–115.
Chan, Y. 2000. IT value: The great divide between qualitative andquantitative and individual and organizational measures. J.Management Inform. Systems 16(4) 225–261.
Christensen, C. 1997. The Innovator’s Dilemma: When New TechnologiesCause Great Firms to Fail. Harvard Business School Press, Cam-bridge, MA.
Clemons, E., M. Row. 1991. Sustaining IT advantage: The role ofstructural differences. MIS Quart. 15(3) 275–292.
Computer Sciences Corp. 2001. Critical issues of information systemsmanagement. Annual survey, El Segundo, CA.
Dewan, S., C. Min. 1997. The substitution of information technologyfor other factors of production: A firm level analysis. Manage-ment Sci. 43(12) 1660–1675.
Economist. 2002. Incredible shrinking plants. The Economist specialreport on car manufacturing, February 23. 71–73.
Eisenhardt, K., J. Martin. 2000. Dynamic capabilities: What are they?Strategic Management J. 21 1105–122.
Fortune. 2000. The website is the business. December 1, 142(12) 144–150.
——. 2001. The e-factory. July 23, 200(A)–200(H).Gefen, D., D. W. Straub, M. C. Boudreau. 2000. Structural equation
modeling and regression: Guidelines for research practice.Comm. AIS 4(7) 1–78.
Hair, J., R. Anderson, R. Tatham, W. Black. 1998. Multivariate DataAnalysis, 5th ed. Prentice Hall, Upper Saddle River, NJ.
Hitt, L., E. Brynjolfsson. 1996. Productivity, business profitability,and consumer surplus: Three different measures of informationtechnology value. MIS Quart. 20(2) 121–42.
Jarvenpaa, S., D. Leidner. 1998. An information company in Mexico:Extending the resource-based view of the firm to a developingcountry context. Inform. Systems Res. 9(4) 342–361.
Kassarjian, H. 1977. Content analysis in consumer research. J. Con-sumer Res. 4 8–18.
Kauffman, R., E. Walden. 2001. Economics and electronic commerce:Survey and directions for research. Internat. J. Electronic Com-merce 5(4) 5–116.
Keen, P. G. W. 1991. Shaping the Future: Business Design Through In-formation Technology. Harvard Business Press, Cambridge, MA.
Kraemer, K., J. Dedrick. 2002. Strategic use of the Internet ande-commerce: Cisco Systems. J. Strategic Inform. Systems. 11(1)5–29.
Lee, H., V. Padmanabhan, S. Whang. 1997. Information distortion ina supply chain: The bullwhip effect.Management Sci. 43(4) 546–558.
Mata, F., W. Fuerst, J. Barney. 1995. Information technology and sus-tained competitive advantage: A resource-based analysis.MISQuart. 19(4) 487–505.
McKenney, J. L., F. W. McFarlan. 1982. The information archipelago:Maps and bridges. Harvard Bus. Rev. 109–119.
Mendelson, H. 1999. Dell Direct, Graduate School of Business. Stan-ford University, Stanford, CA.
Milgrom, P., J. Roberts. 1988. Communication and inventory as sub-stitutes in organizing production. Scandinavian J. Econom. 90(3)275–289.
——, ——. 1990. The economics of modern manufacturing: Tech-nology, strategy, and organization. Amer. Econom. Rev. 80(3)511–528.
Mukhopadhyay, T., S. Kekre, S. Kalathur. 1995. Business value ofinformation technology: A study of electronic data interchange.MIS Quart. 19(2) 137–156.
Penrose, E. T. 1959. The Theory of the Growth of the Firm. Wiley, NewYork.
Peteraf, M. A. 1993. The cornerstones of competitive advantage: Aresource-based view. Strategic Management J. 14(3) 179–191.
Porter, M. 2001. Strategy and the internet. Harvard Bus. Rev. 79(3)63–78.
Ross, J., C. Beath, D. Goodhue. 1996. Develop long-term competi-tiveness through IT assets. Sloan Management Rev. (Fall) 31–42.
Sambamurthy, V., A. Bharadwaj, V. Grover. 2001. Shaping agilitythrough digital options: Reconceptualizing the role of IT in con-temporary firms. Working paper, University of Maryland, Col-lege Park, MD.
Shapiro, C., H. Varian. 1999. Information Rules: A Strategic Guide to

ZHU AND KRAEMERAssessing the Value of e-Commerce
Information Systems ResearchVol. 13, No. 3, September 2002 295
the Network Economy. Harvard Business School Press, Boston,MA.
Steinfield, C., A. Chan, R. Kraut. 2000. Computer mediatedmarkets:An introduction and preliminary test of market structure im-pacts. J. Comput. Mediated Comm. 5(3).
Stiroh, K. 2001. Information technology and the U.S. productivityrevival: What do the industry data say? Federal Reserve Bankof New York.
Straub, D. W. 1989. Validating instruments in MIS research. MISQuart. 13(2) 147–169.
——, R. Klein. 2001. E-competitive transformations. Bus. Horizons44(3) 3–12.
——, R. Watson. 2001. Transformational issues in researching IS andnet-enabled organizations. Inform. Systems Res. 12(4) 337–345.
——, D. Hoffman, B. Weber, C. Steinfield. 2002. Measuring e-commerce in Net-enabled organizations: An introduction to thespecial issue. Inform. Systems Res. 13(2) 115–124.
Teece, D. J., G. Pisano, A. Shuen. 1997. Dynamic capabilities andstrategic management. Strategic Management J. 18 509–533.
Tirole, J. 1988. The Theory of Industrial Organization. The MIT Press,Cambridge, MA.
Venkatraman, N. 1989. Strategic orientation of business enterprises:The construct, dimensionality, and measurement. ManagementSci. 35(8) 942–962.
Weill, P., M. Broadbent. 1998. Leveraging the New Infrastructure: HowMarket Leaders Capitalize on Information Technology. HarvardBusiness School Press, Cambridge, MA.
Wernerfelt, B. 1984. A resource based view of the firm. StrategicMan-agement J. 5 171–180.
Wheeler, B. C. 2002. NEBIC: A dynamic capabilities theory for as-sessing Net-enablement. Inform. Systems Res. 13(2) 125–146.
White, H. 1980. A heteroscedasticity-consistent covariancematrix es-timator and a direct test for heteroscedasticity. Econometrica48(4) 817–838.
Zahra, S. A., G. George. 2002. The Net-enabled business innovationcycle and the evolution of dynamic capabilities. Inform. SystemsRes. 13(2) 147–150.
Charles Steinfield, Special Issue Editor. This paper was received on January 14, 2001, and was with the authors 6 months for 3 revisions.