DYNEX CAPITAL, INC. - AnnualReports.com · ANNUAL REPORT Sound Strategy. Unique Advantages. DYNEX...
118
ANNUAL REPORT Sound Strategy. Unique Advantages. DYNEX CAPITAL, INC. DYNEX CAPITAL, INC.
Transcript of DYNEX CAPITAL, INC. - AnnualReports.com · ANNUAL REPORT Sound Strategy. Unique Advantages. DYNEX...
ANNUAL REPORT
Sound Strategy. Unique Advantages.DYNEX CAPITAL, INC.DYNEX CAPITAL, INC.
Sound Strategy. Unique Advantages.DYNEX CAPITAL, INC.DYNEX CAPITAL, INC.
4991 Lake Brook Drive, Suite 100 Glen Allen, VA 23060
Phone: 804-217-5800 • www.dynexcapital.com
DYNEX CAPITAL, INC. 2011 ANNUAL REPORT
1 2 3
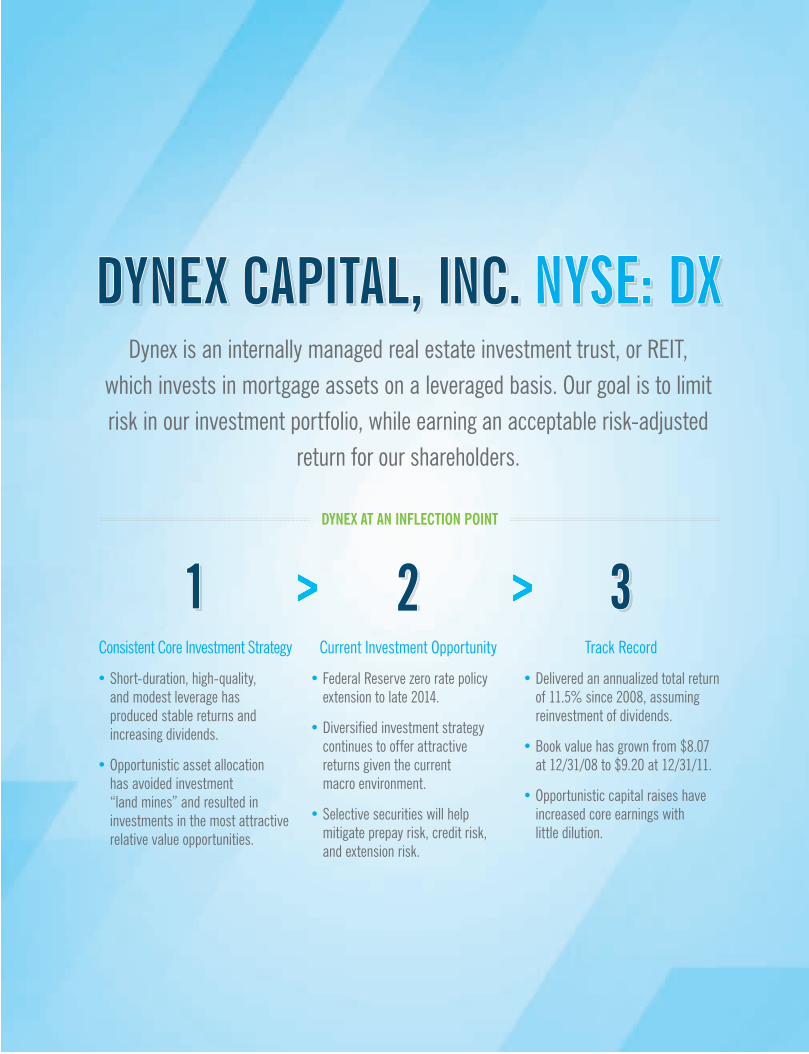
Dynex is an internally managed real estate investment trust, or REIT, which invests in mortgage assets on a leveraged basis. Our goal is to limit risk in our investment portfolio, while earning an acceptable risk-adjusted
return for our shareholders.
DYNEX CAPITAL, INC. NYSE: DXDYNEX CAPITAL, INC. NYSE: DX
DYNEX AT AN INfLECTION POINT
Consistent Core Investment Strategy
• Short-duration, high-quality, and modest leverage has produced stable returns and increasing dividends.
• Opportunistic asset allocation has avoided investment “land mines” and resulted in investments in the most attractive relative value opportunities.
Current Investment Opportunity
• Federal Reserve zero rate policy extension to late 2014.
• Diversified investment strategy continues to offer attractive returns given the current macro environment.
• Selective securities will help mitigate prepay risk, credit risk, and extension risk.
Track Record
• Delivered an annualized total return of 11.5% since 2008, assuming reinvestment of dividends.
• Book value has grown from $8.07 at 12/31/08 to $9.20 at 12/31/11.
• Opportunistic capital raises have increased core earnings with little dilution.
1 2 3
Thomas B. AkinChairman of the Board of Directors Chief Executive Officer Principal, Talkot Capital, LLC
Thomas B. AkinChairman of the Board of Directors Chief Executive Officer
Michael R. HughesAnalyst Ascend Capital, LLC
Stephen J. BenedettiExecutive Vice President Chief Financial Officer Chief Operating Officer
Barry A. IgdaloffSole Proprietor Rose Capital
Byron L. BostonPresident Chief Investment Officer
Daniel K. OsborneManaging Member Vantage Pointe Capital, LLC
James C. Wheat, IIIPresident Blanfield Associates, LLC
Corporate Offices4991 Lake Brook Drive, Suite 100 Glen Allen, Virginia 23060 804-217-5800 phone 804-217-5860 fax dynexcapital.com
Investor RelationsAlison G. GriffinVice President [email protected] 804-217-5897
Stock Transfer AgentComputershare 480 Washington Boulevard Jersey City, NJ 07310-1900 866-280-0407 bnymellon.com/shareowner/equityaccess
Independent AuditorsBDO Seidman, LLP 300 Arboretum Place, Suite 520 Richmond, VA 23236
Annual Meeting of ShareholdersThe Annual Meeting of Shareholders will be held at 9:00 A.M. Pacific Time on Monday, May 14, 2012 at:
The Stanford Court Renaissance Hotel905 California Street, San Francisco, CA 94108
SEC FilingsDynex makes available on its website, free of charge, its annual reports on Form 10-K, Quarterly Reports on Form 10-Q, and Current Reports on Form 8-K as filed with the Securities and Exchange Commission, as well as other Company information. Such information is also furnished to shareholders, free of charge, upon request. Please direct your request to Investor Relations.
Dynex has filed the certification of its principal executive and financial officers required by Section 302 of the Sarbanes-Oxley Act of 2002 with the Securities and Exchange Commission as an exhibit to its Annual Report on Form 10-K for the year ended December 31, 2011. Dynex has included a copy of this certification in this Annual Report to Shareholders. In addition, the Company’s executive officers annually certify to the New York Stock Exchange that they are not aware of any violation by the Company of the New York Stock Exchange’s corporate governance listing standards. This certification was submitted, without qualification, as required after the 2011 annual meeting of shareholders.
Equity SecuritiesCommon StockNYSE: DX
CORPORATE INfORmATION
BoArD of DIrECTorS
EXECuTIvE offICErS

1
Q4 2011: 15.6%Q4 2011: 15.6%6.94%6.94%
HigH insider OwnersHip As of December 31, 2011
COMpeTiTiVe reTUrns On eQUiTY
High Insider Ownership • Competitive Returns • Short-Duration, High Credit Quality Portfolio Low Debt-to-Equity • Consistent Core Investment Strategy • Investment Opportunity • Track Record
WHY DYNEX
8.0%
7.0%
6.0%
5.0%
4.0%
3.0%
2.0%
1.0%
DX PEERS1
1 Typical Peer Ownership2 As presented, Q3-2011 return on average equity excludes the impact of certain items including litigation settlement and related defense costs of $8.2 million, a loss of $2.0 million on redemption of non-recourse collateralized financings, and $1.3 million in net accelerated premium amortization due to an increase in forecasted prepayment speeds. For Q3-2011 reported annualized ROE was 1.6%.
16.0%
18.0%
12.0%
14.0%
10.0%
6.0%
8.0%
4.0%
2.0%
13.6% 13.2% 13.7%16.1%
14.1%
Q4-2011Q3-20112 Q2-2011Q1-2011Q4-2010Q3-2010
<5 Yrs: 69%<5 Yrs: 69% AAA: 89%AAA: 89%
sHOrT-dUraTiOn pOrTfOliO As of December 31, 2011
HigH CrediT QUaliTY pOrTfOliO As of December 31, 2011
BELOW A: 3%
A: 4%
AA: 4%
40.0%
35.0%
30.0%
25.0%
20.0%
15.0%
10.0%
5.0%
33% 36%
29%
2%
0-2 yrs 2-5 yrs 5-10 yrs >10Reset/Maturity

32
TO OUR SHAREHOLDERSTO OUR SHAREHOLDERS
By conventional measures, this past year could be viewed
as disappointing. During 2011, our book value per
common share decreased for the first time since 2008,
and our earnings year over year fell on a fully diluted
basis. The primary unexpected earnings item in 2011 was
the settlement of litigation from securities issued in the
late 1990s. We took an $8.2 million charge in the third
quarter to resolve that litigation and move forward with
our business plan. The principal reason for the decline
in book value was the mark to market volatility in asset
prices from persistent concerns over the Eurozone and the
aforementioned litigation charge. Given these results and
overall market conditions, our stock price traded down for
2011 from $10.92 at the beginning of the year to close
at $9.13 at year-end. Our stock price started 2011 at a
healthy premium to book value and finished essentially flat
to book value. Happily, our portfolio cash flow was strong
and dividends for the year increased from $0.98 in 2010
to $1.09, and we were able to increase our quarterly
dividend again to $0.28 per common share in the final
quarter of the year. We have now increased our dividend
five times since reestablishing it in 2008.
Conventional measures, however, do not necessarily tell
the story for 2011 and certainly do not incorporate the
long-term perspective that we have on our business.
We have now increased our dividend five times since reestablishing it in 2008.While the litigation settlement was painful, it removed
a significant uncertainty and allows us to focus on the
future of the Company. In addition, during the year
we grew our capital base by $79 million and grew our
investment portfolio by $900 million to $2.5 billion.
We slowly rotated our investment strategy from Hybrid
ARMs into Agency and non-Agency CMBS during the year
to take advantage of better return opportunities. In doing
so we reduced our prepayment risk profile while increasing
our overall net interest spread and the earnings potential
for our investment portfolio. By dollar premium on our
investments, almost two-thirds of our investment portfolio
now has some prepayment protection, an important
consideration in this very low interest rate environment.
Finally, we continued to maintain our discipline of
investing in only higher quality, short-duration investments.
As we move into 2012 and beyond, we feel that 2011
was an important year for positioning our business for the
continued uncertain economic and political environment.

32
Our focus continues to be on delivering long-term
performance to our shareholders and a stable dividend.
We believe focusing on the long term presents the best
opportunity to generate stable cash flows and a consistent
dividend while keeping portfolio volatility to a minimum.
We slowly rotated our investment strategy from Hybrid ARMs into Agency and non-Agency CMBS during the year to take advantage of better return opportunities.We continue to manage our business as an opportunistic
MBS investor. We are exploring ways to expand our
business model and asset classes. There is currently
much uncertainty in the housing market and the future
role of Fannie Mae and Freddie Mac. Just a few weeks ago
acting chairman of the FHFA Edward DeMarco presented
his vision of the future of GSE reform over the $10 trillion
single-family mortgage market. The DeMarco letter
encouraged Congress and the Administration to come up
with a GSE reform plan for the FHFA to implement that
would transfer the risk of mortgage lending to the private
sector and away from the U.S. taxpayer. At present there
is very little lending to the mortgage market other than
from Fannie Mae and Freddie Mac. The DeMarco letter
added little if any original thinking about how the process
could proceed except to say that it would have to be
gradual. With this year being an election year, there is
diminished hope that any significant progress will be
made on the myriad of policy and regulatory initiatives
with respect to the mortgage market. With current
ownership of over one half of the existing mortgage
market, the direction of Freddie Mac and Fannie Mae will
continue to be of great interest to all market participants.
While one can never be sure of the outcome as it relates
to government policy, it can be expected that any
significant change will be slow and will occur in small
increments. We believe there will be opportunities
in the future to expand our investment strategies to
accommodate the changing dynamics of the mortgage
landscape. We feel our size and strategy give us greater
opportunity to take advantage of these changes and
benefit our shareholders long term.
Generate Dividends For Shareholders • Manage Leverage Conservatively Retain Owner-Operator Mentality • Maintain A Culture Of Integrity And Employ
The Highest Ethical Standards • Strong Risk Management Culture And Best In Class Risk Management Processes • Focus On Long-Term Shareholder Value
COre ValUesOUr

54
We feel our size and strategy give us greater opportunity to take advantage of these changes and benefit our shareholders long term.Despite improved performance, the economic recovery
remains fragile in large part due to the continued issues
in the housing market. Recently we have seen the
government institute or rehash several programs seeking
to diminish the effects of the crisis. We have also seen the
Federal Reserve use its monetary powers in extraordinary
ways through Operation Twist and ZIRP (zero interest rate
policy). In fact, since 2008 the Federal Reserve has tripled
the size of its balance sheet, effectively providing some
$2 trillion in stimulus. Most recently, the Fed pushed ZIRP
out into the year 2014, essentially promising another two
years of low rates. The effect of the Fed’s monetary policy
has been to flatten the yield curve and reduce volatility
in the shorter maturities of the Treasury curve. This
bodes well for our current investment portfolio and only
reinforces our investment strategy.
In February 2012, we raised additional capital and moved
total equity market capitalization in excess of $500 million.
We feel that at this level of capital we now have the
economies of scale to be competitive in our marketplace.
Our general and administrative expense, which last year
averaged 2.8% of shareholders’ capital, should fall even
lower, making us more competitive. At the same time,
we are still small enough to deliver returns that reflect our
ability to find attractive, complementary niche investments.
Most recently, we announced that Byron Boston
would add the additional title of President to his role
as Chief Investment Officer. Byron has the leadership
and qualifications to expand his role here at Dynex and
this additional responsibility will create a more efficient
management structure. Besides having an impeccable
reputation and decades of experience in the mortgage
market, Byron has built a solid investment team over
the past four years and the results speak for themselves.
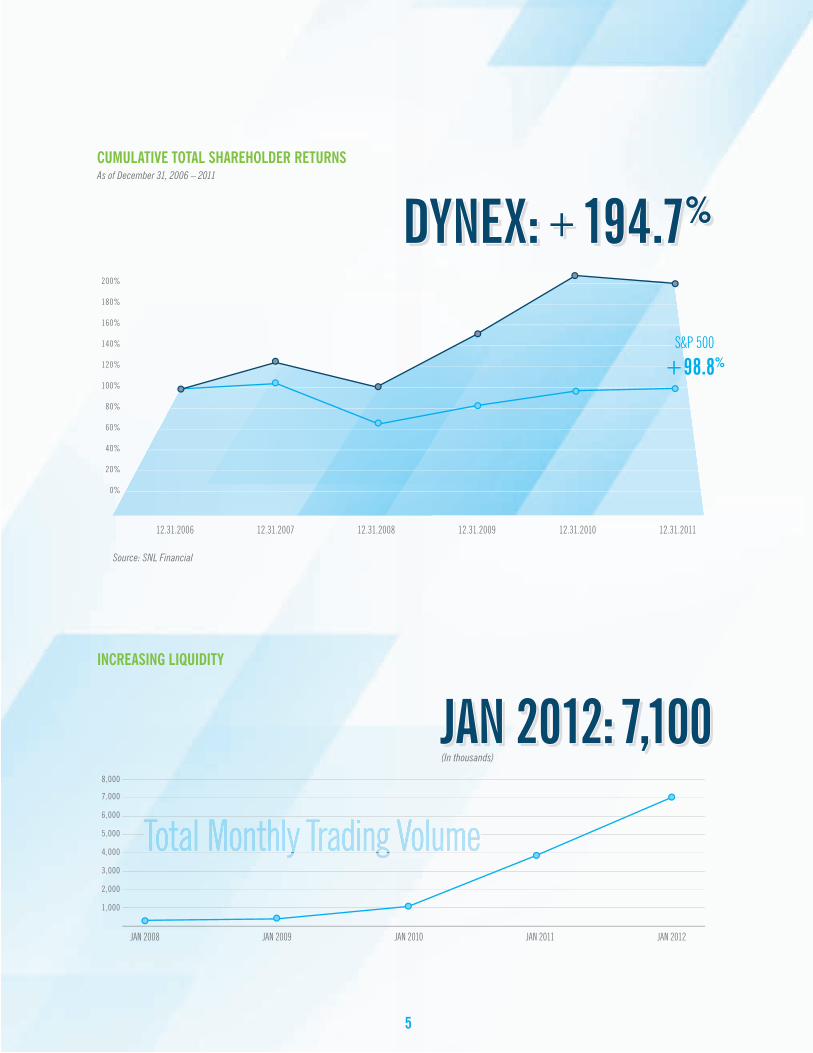
Since 2006, we have steadily increased our earnings,
shareholders’ equity, book value, and dividends paid
out. The Cumulative Total Shareholder Returns chart
on page 5 is our track record, a record that the entire
Dynex team is proud to present.
Today, we stand poised to continue that progress and add
to that track record into the future. Over the last several
years, we have faced a very difficult investment landscape
and thrived. Going forward, we realize that there will be
many uncertain outcomes that need to be faced and we
continue to diligently pursue every opportunity with the
same historical regard for risk and return. The Dynex
Board and management own a substantial amount of
common equity and sit shoulder to shoulder with our
shareholders in the risk and the return of our company.
We are confident that we have positioned Dynex for
long-term success and thank all our shareholders for
their ongoing support. We look forward to our annual
meeting on May 14, 2012 in San Francisco and invite
all our shareholders to attend.
With regards,
THOMas B. akin Chairman of the Board of Directors Chief Executive Officer
54
DYNEX: +194.7%DYNEX: +194.7%
20%
0%
40%
60%
80%
100%
120%
140%
160%
180%
200%
S&P 500
+98.8%
Source: SNL Financial
inCreasing liQUidiTY
CUMUlaTiVe TOTal sHareHOlder reTUrns As of December 31, 2006 – 2011
12.31.2010 12.31.201112.31.200912.31.200812.31.200712.31.2006
JAN 2008 JAN 2009 JAN 2010 JAN 2011 JAN 2012
8,000
7,000
6,000
5,000
4,000
3,000
2,000
1,000
Total Monthly Trading Volume Total Monthly Trading Volume Total Monthly Trading Volume
JAN 2012: 7,100JAN 2012: 7,100(In thousands)
6
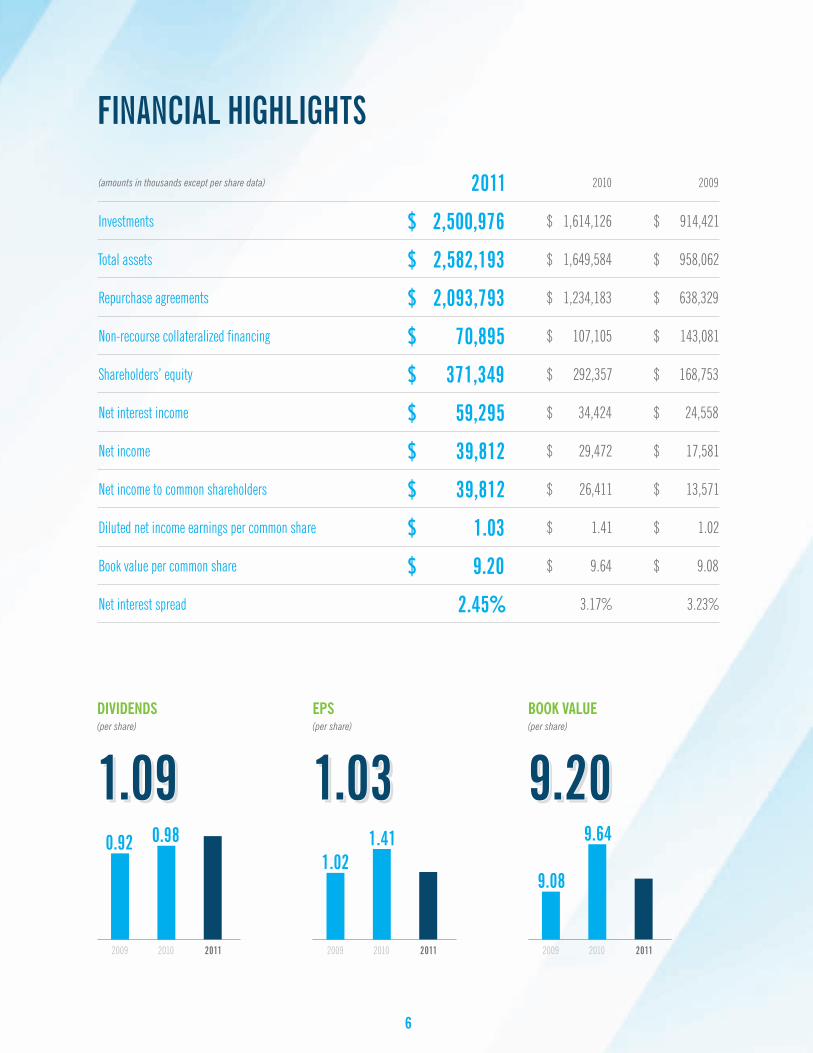
FINANCIAL HIGHLIGHTS
(amounts in thousands except per share data) 2011 2010 2009
Investments $ 2,500,976 $ 1,614,126 $ 914,421
Total assets $ 2,582,193 $ 1,649,584 $ 958,062
Repurchase agreements $ 2,093,793 $ 1,234,183 $ 638,329
Non-recourse collateralized financing $ 70,895 $ 107,105 $ 143,081
Shareholders’ equity $ 371,349 $ 292,357 $ 168,753
Net interest income $ 59,295 $ 34,424 $ 24,558
Net income $ 39,812 $ 29,472 $ 17,581
Net income to common shareholders $ 39,812 $ 26,411 $ 13,571
Diluted net income earnings per common share $ 1.03 $ 1.41 $ 1.02
Book value per common share $ 9.20 $ 9.64 $ 9.08
Net interest spread 2.45% 3.17% 3.23%
1.091.090.980.92
2009 2010 2011
diVidends (per share)
1.031.031.41
1.02
2009 2010 2011
eps (per share)
9.209.209.64
9.08
2009 2010 2011
BOOk ValUe (per share)

UNITED STATESSECURITIES AND EXCHANGE COMMISSION
Washington, D.C. 20549
FORM 10-K
Annual Report Pursuant to Section 13 or 15(d) of the Securities Exchange Act of 1934
For the fiscal year ended December 31, 2011
or
Transition Report Pursuant to Section 13 or 15(d) of the Securities Exchange Act of 1934
Commission File Number: 1-9819
DYNEX CAPITAL, INC.(Exact name of registrant as specified in its charter)
Virginia(State or other jurisdiction ofincorporation or organization)
4991 Lake Brook Drive, Suite 100, Glen Allen, Virginia
(Address of principal executive offices)
(804) 217-5800(Registrant’s telephone number, including area code)
Securities registered pursuant to Section 12(b) of the Act:
Title of each classCommon Stock, $.01 par value
Securities registered pursuant to Section 12(g) of the Act: None
52-1549373(I.R.S. Employer
Identification No.)
23060-9245(Zip Code)
Name of each exchange on which registeredNew York Stock Exchange
Indicate by check mark if the registrant is a well-known seasoned issuer, as defined in Rule 405 of the Securities Act.Yes No
Indicate by check mark if the registrant is not required to file reports pursuant to Section 13 or 15(d) of the Act.Yes No
Indicate by check mark whether the registrant (1) has filed all reports required to be filed by Section 13 or 15(d) of the Securities Exchange Act of 1934 during the preceding 12 months (or for such shorter period that the registrant was required to file such reports), and (2) has been subject to such filing requirements for the past 90 days.Yes No
Indicate by check mark whether the registrant has submitted electronically and posted on its corporate Web site, if any, every Interactive Data File required to be submitted and posted pursuant to Rule 405 of Regulation S-T (§232.405 of this chapter) during the preceding 12 months (or for such shorter period that the registrant was required to submit and post such files).Yes No

Indicate by check mark if disclosure of delinquent filers pursuant to Item 405 of Regulation S-K (§229.405 of this chapter) is not contained herein, and will not be contained, to the best of registrant's knowledge, in definitive proxy or information statements incorporated by reference in Part III of this Form 10-K or any amendment to this Form 10-K. Indicate by check mark whether the registrant is a large accelerated filer, an accelerated filer, a non-accelerated filer, or a smaller reporting company. See the definitions of “large accelerated filer,” “accelerated filer” and “smaller reporting company” in Rule 12b-2 of the Exchange Act.
Large accelerated filerNon-accelerated filer (Do not check if a smaller reporting company)
Accelerated filerSmaller reporting company
Indicate by check mark whether the registrant is a shell company (as defined in Rule 12b-2 of the Act).Yes No
As of June 30, 2011, the aggregate market value of the voting stock held by non-affiliates of the registrant was approximately $356,632,999 based on the closing sales price on the New York Stock Exchange of $9.68.
On February 24, 2012, the registrant had 54,118,828 shares outstanding of common stock, $0.01 par value, which is the registrant’s only class of common stock.
DOCUMENTS INCORPORATED BY REFERENCEPortions of the Definitive Proxy Statement for the registrant's 2012 annual meeting of shareholders, expected to be filed pursuant to Regulation 14A within 120 days from December 31, 2011, are incorporated by reference into Part III.

i
TABLE OF CONTENTS
PART I.
PART II.
PART III.
PART IV.
SIGNATURES
Item 1.Item 1A.Item 1B.Item 2.Item 3.Item 4.
Item 5.
Item 6.Item 7.
Item 7A.Item 8.Item 9.
Item 9A.Item 9B.
Item 10.Item 11.Item 12.
Item 13.
Item 14.
Item 15.
BusinessRisk FactorsUnresolved Staff CommentsPropertiesLegal ProceedingsMine Safety Disclosures
Market for Registrant’s Common Equity, Related Stockholder Mattersand Issuer Purchases of Equity SecuritiesSelected Financial DataManagement’s Discussion and Analysis of Financial Condition andResults of OperationsQuantitative and Qualitative Disclosures About Market RiskFinancial Statements and Supplementary DataChanges in and Disagreements with Accountants on Accounting andFinancial DisclosureControls and ProceduresOther Information
Directors, Executive Officers and Corporate GovernanceExecutive CompensationSecurity Ownership of Certain Beneficial Owners and Managementand Related Stockholder MattersCertain Relationships and Related Transactions, and DirectorIndependencePrincipal Accountant Fees and Services
Exhibits, Financial Statement Schedules
Page Number
1624242425
26
28
29
5459
59
5960
6161
61
61
62
62
65

1
CAUTIONARY STATEMENT – This Annual Report on Form 10-K may contain “forward-looking” statements within the meaning of Section 27A of the Securities Act of 1933, as amended (or “1933 Act”), and Section 21E of the Securities Exchange Act of 1934, as amended (or “Exchange Act”). We caution that any such forward-looking statements made by us are not guarantees of future performance, and actual results may differ materially from those expressed or implied in such forward-looking statements. Some of the factors that could cause actual results to differ materially from estimates expressed or implied in our forward-looking statements are set forth in this Annual Report on Form 10-K for the year ended December 31, 2011. See Item 1A. “Risk Factors” as well as “Forward-Looking Statements” set forth in Item 7. “Management’s Discussion and Analysis of Financial Condition and Results of Operations” of this Annual Report on Form 10-K.
In this Annual Report on Form 10-K, we refer to Dynex Capital, Inc. and its subsidiaries as “the Company,” “we,” “us,” or “our,” unless we specifically state otherwise or the context indicates otherwise.
PART I
ITEM 1. BUSINESS
COMPANY OVERVIEW
We are an internally managed mortgage real estate investment trust, or mortgage REIT, which invests in mortgage assets on a leveraged basis. Our objective is to provide attractive risk-adjusted returns to our shareholders over the long term that are reflective of a leveraged, high quality fixed income portfolio with a focus on capital preservation. We seek to provide returns to our shareholders through regular quarterly dividends and through capital appreciation.
We were formed in 1987 and commenced operations in 1988. Beginning with our inception through 2000, our operations largely consisted of originating and securitizing various types of loans, principally single-family and commercial mortgage loans and manufactured housing loans. Since 2000, we have been an investor in Agency and non-Agency mortgage-backed securities (“MBS”).
Our primary source of income is net interest income, which is the excess of the interest income earned on our investments over the cost of financing these investments. Our investment strategy as approved by our Board of Directors is a diversified investment strategy that targets higher credit quality, shorter duration investments in Agency MBS and non-Agency MBS. Investments considered to be of higher credit quality have less or limited exposure to loss of principal while investments which have shorter durations have less or limited exposure to changes in interest rates. We currently target an overall investment portfolio composition of 60%-80% in Agency MBS with the balance in non-Agency MBS and securitized mortgage loans. Our securitized mortgage loans are single-family and commercial mortgage loans which were originated or purchased by us during the 1990s. We are no longer actively originating or purchasing mortgage loans.
Agency MBS. Agency MBS are comprised of residential mortgage-backed securities (“RMBS”) and commercial
mortgage-backed securities (“CMBS”) issued or guaranteed by a federally chartered corporation, such as Federal National Mortgage Corporation, or Fannie Mae, or Federal Home Loan Mortgage Corporation, or Freddie Mac, or an agency of the U.S. government, such as Government National Mortgage Association, or Ginnie Mae. The Company’s Agency RMBS are comprised primarily of hybrid Agency adjustable-rate mortgage loans ("ARMs") and Agency ARMs. Hybrid Agency ARMs are MBS collateralized by hybrid adjustable-rate mortgage loans which are loans that have a fixed rate of interest for a specified period (typically three to ten years) and which then adjust their interest rate at least annually to an increment over a specified interest rate index as further discussed below. Agency ARMs are MBS collateralized by adjustable-rate mortgage loans which have interest rates that generally will adjust at least annually to an increment over a specified interest rate index. Agency ARMs also include hybrid Agency ARMs that are past their fixed-rate periods or within twelve months of their initial reset period.
Interest rates on the adjustable-rate mortgage loans collateralizing hybrid Agency ARMs or Agency ARMs are based on specific index rates, such as the one-year constant maturity treasury rate, or CMT, the London Interbank Offered Rate, or LIBOR, the Federal Reserve U.S. 12-month cumulative average one-year CMT, or MTA, or the 11th District Cost of Funds Index, or COFI. These loans will typically have interim and lifetime caps on interest rate adjustments, or interest rate caps, limiting the amount that the rates on these loans may reset in any given period.

2
The Company’s Agency CMBS are typically comprised of fixed-rate securities issued by Fannie Mae or Freddie Mac. Securities of both of these issuers are collateralized by first mortgage loans on multifamily properties that are usually either locked out of prepayment options or have yield maintenance provisions which provide the Company protection against prepayment of the investment. A portion of the Company's Agency CMBS also include interest only securities ("IOs") which represent the right to receive contractual interest flows (but not principal cash flows) from the underlying unamortized principal balance of specific Agency CMBS.
Non-Agency MBS. The Company’s non-Agency MBS are comprised of RMBS and CMBS, the majority of which are rated as investment grade. Unlike Agency MBS, non-Agency MBS do not have a guaranty of payment by a federally chartered corporation or an agency of the U.S. government. Interest rates for non-Agency MBS collateralized with ARMs are based on indices similar to those of Agency MBS. A portion of the Company's non-Agency CMBS also includes non-Agency IOs that, as with Agency IOs, represent the right to receive contractual interest flows (but not principal cash flows) from the underlying unamortized principal balance of specific non-Agency CMBS.
Operating Policies and Restrictions
We operate our business pursuant to Investment Management and Investment Risk Policies (together our "Operating Policies") approved by our Board of Directors which set forth investment and risk limitations for the Company. These policies are reviewed annually by the Board. We also manage our operations and investments to comply with various REIT limitations (as discussed further below in “Federal Income Tax Considerations”) and to avoid qualifying as an investment company as such term is defined in the Investment Company Act of 1940.
Currently, our Operating Policies permit the investment of new capital in Agency MBS and high-quality non-Agency MBS. In implementing the Operating Policies with respect to non-Agency MBS, we generally limit our purchases to MBS which are rated investment-grade by at least one nationally recognized statistical ratings organization. We also conduct our own independent evaluation of the credit risk on any non-Agency MBS, such that we do not rely solely on the security’s credit rating. Our investment portfolio as of December 31, 2011 consists of $1,965.2 million in Agency MBS, $421.1 million in non-Agency MBS, and $114.7 million in securitized mortgage loans and other investments. As of December 31, 2011, our allocation to Agency MBS was at the high end of our targeted range. We expect to increase our investment positions in non-Agency MBS during 2012 as part of our investment strategy for portfolio composition as we identify suitable investments with attractive risk-adjusted returns.
The Operating Policies also limit the overall leverage of the Company to seven times our shareholders’ equity capital, up to ten times our equity capital invested in Agency MBS, and six times our equity capital invested in non-Agency MBS. In addition, among other things, there are limitations on interest rate and convexity risk, and our earnings at risk and our shareholders’ equity at risk due to changes in interest rates, prepayment rates, investment prices and spreads. The Operating Policies require us to perform a variety of stress tests on the investment portfolio value and liquidity from adverse market conditions.
Investment Philosophy and Strategy Our investment philosophy is based on a top-down approach and forms the foundation of our investment strategy. We focus on the expected risk-adjusted outcome of any investment which, given our use of leverage, must include the terms of financing and the expected liquidity of the investment. Key points of our investment philosophy and strategy include the following:
• understanding macroeconomic conditions including the current state of the U.S. and global economies, the regulatory environment, competition for assets, and the availability of financing;
• sector analysis including understanding absolute returns, relative returns and risk-adjusted returns;• security and financing analysis including sensitivity analysis on credit, interest rate volatility, and market value risk;
and• managing performance and portfolio risks, including interest rate, credit, prepayment, and liquidity.
In executing our investment strategy, we seek to balance the various risks of owning mortgage assets, such as interest rate, credit, prepayment, and liquidity risks, with the earnings opportunity on the investment. We believe our strategy of investing

3
in Agency and non-Agency mortgage assets provides superior diversification of these risks across our investment portfolio and therefore provides ample opportunities to generate attractive risk-adjusted returns while preserving our shareholders’ capital. We also believe that our shorter duration strategy will provide less volatility in our results and our book value per common share than strategies which invest in longer duration assets with potentially more interest rate risk.
The performance of our investment portfolio will depend on many factors including interest rates, trends of interest rates, the steepness of interest rate curves, prepayment rates on our investments, competition for investments, economic conditions and their impact on the credit performance of our investments, and actions taken by the U.S. government, including the U.S. Federal Reserve and the United States Department of the Treasury (the “Treasury”). In addition, our business model may be impacted by other factors such as the state of the overall credit markets, which could impact the availability and costs of financing. See “Factors that Affect Our Results of Operations and Financial Condition” in Item 7 of this Annual Report on Form 10-K for further discussion.
Financing and Hedging Strategy
We finance our investments through a combination of repurchase agreements and non-recourse collateralized financing such as securitization financing and financing provided by the Federal Reserve Bank of New York under its Term Asset-Backed Securities Loan Facility (“TALF” financing).
Repurchase Agreements. Repurchase agreement financing is uncommitted short-term financing in which we pledge our MBS as collateral to secure loans made by the repurchase agreement counterparty. Repurchase agreements generally have terms of 30-90 days, though in some instances longer terms may be available, and carry a rate of interest which is usually based on a spread to one-month LIBOR and fixed for the term of the agreement. The amount borrowed under a repurchase agreement is usually limited by the lender to a percentage of the estimated market value of the pledged collateral, which is generally up to 95% of the estimated market value for Agency MBS and up to 90% for higher credit quality non-Agency MBS. The difference between the market value of the pledged MBS collateral and the amount of the repurchase agreement is the amount of equity we have in the position and is intended to provide the lender some protection against fluctuations of value in the collateral and/or the failure by us to repay the borrowing.
If the fair value of the MBS pledged as collateral declines, lenders may require that we pledge additional assets to collateralize the outstanding repurchase agreement borrowings by initiating a margin call. Our pledged collateral fluctuates in value primarily as a result of principal payments and changes in market interest rates and spreads, prevailing market yields, actual or anticipated prepayment speeds and other market conditions. Lenders may also initiate margin calls during periods of market stress as a result of actual or expected volatility in asset prices. There is no minimum amount of collateral value decline required before the lender could initiate a margin call. If we fail to meet any margin call, our lenders have the right to terminate the repurchase agreement and sell the collateral pledged. In order to manage our exposure to margin calls from fluctuations in values of our collateral pledged, we attempt to maintain cash and other liquid instruments in amounts management believes is sufficient to meet any margin call.
Repurchase agreement financing is provided principally by major financial institutions and broker-dealers. A significant source of liquidity for the repurchase agreement market is money market funds which provide collateral-based lending to the financial institutions and broker-dealer community that, in turn, is provided to the repurchase agreement market. In order to reduce our exposure to counterparty-related risk, we generally seek to diversify our exposure by entering into repurchase agreements with multiple lenders.
For further discussion of repurchase agreement financing, please refer to Item 7, "Liquidity and Capital Resources" in Part II of this Annual Report on Form 10-K.
Securitization and TALF Financing. We have utilized securitization and TALF financing to finance securitized mortgage loans and certain MBS. As noted above, securitization financing is term financing collateralized by securitized mortgage loans and is non-recourse to us. Each series of securitization financing may consist of various classes of bonds at either fixed or variable rates of interest and having varying repayment terms. Payments received on securitized mortgage loans and reinvestment income earned thereon is used to make payments on the securitization financing bonds. In February 2012, we repaid the remaining balance of our TALF financing outstanding as of December 31, 2011.
4
Hedging Strategy. Our hedging strategy is designed to reduce the impact on our income and shareholders’ equity caused by the adverse effects of changes in interest rates. Generally in a period of rising rates our net income may be negatively impacted from our borrowing costs increasing faster than income on our assets, and our shareholders’ equity may decline as a result of declining market values of our MBS. In hedging the risk of changes in interest rates, we principally utilize interest rate swap agreements, but may also utilize interest rate cap or floor agreements, futures contracts, put and call options on securities or securities underlying futures contracts, or forward rate agreements.
As of December 31, 2011, our hedging instruments consisted solely of interest rate swap agreements. Typically in an interest rate swap transaction, we will pay an agreed upon fixed rate of interest determined at the time of entering into the agreement for a period typically between two and seven years while receiving interest based on a floating rate such as LIBOR. We intend to comply with REIT and tax limitations on our hedging instruments and also intend to limit our use of hedging instruments to only those described above. We also intend to enter into hedging transactions only with counterparties that we believe have a strong credit rating to help mitigate the risk of counterparty default or insolvency.
INDUSTRY OVERVIEW
The public mortgage REIT industry has grown significantly since the beginning of 2008 and which we estimate includes approximately 30 companies with a total market capitalization of $43.0 billion as of December 31, 2011. Mortgage REITs use a variety of investment strategies and invest in a number of different asset classes including Agency MBS and non-Agency MBS. The business models of mortgage REITs range from investing only in Agency MBS to investing substantially in non-investment grade MBS and loans. Each mortgage REIT will assume risks in its investment strategy. Whereas we invest in shorter-duration and higher quality MBS in order to mitigate interest rate risk and credit risk, other mortgage REITs may be willing to accept more of these risks than we are and invest in longer-duration or lower-quality assets.
Given the uncertainty in the recovery of the housing market in the U.S. and the need for private capital to replace the capital currently supporting mortgage finance (from governmental and quasi-governmental public entities such as Fannie Mae, Freddie Mac, GNMA and the Federal Reserve), we believe that mortgage REITs will continue to increase in importance to the U.S. housing and mortgage finance industries. In addition, the uncertainty around regulation of financial institutions under the Dodd-Frank Act and minimum capital standards that may be implemented under the Basel III Accord, as well as other potential regulatory changes, may further impact capital formation in the U.S. mortgage market which could favor mortgage REITs. Notwithstanding, as further discussed in Item 1A. "Risk Factors" below, the Securities and Exchange Commission ("SEC") is reviewing the exemption currently used by most mortgage REITs under the Investment Company Act of 1940. If the SEC ultimately restricts the use of such exemption, mortgage REIT business models will likely be severely restricted.
COMPETITION
The financial services industry in which we compete is a highly competitive market. In purchasing investments and obtaining financing, we compete with other mortgage REITs, investment banking firms, mutual funds, banks, hedge funds, mortgage bankers, insurance companies, federal agencies, and other entities, many of which have greater financial resources and a lower cost of capital than we do. Increased competition in the market may reduce the available supply of investments and may drive prices of investments to unacceptable levels. In addition, competition could reduce the availability of borrowing capacity at our repurchase agreement counterparties.
FEDERAL INCOME TAX CONSIDERATIONS
As a REIT, we are required to abide by certain requirements for qualification as a REIT under the Internal Revenue Code of 1986, as amended (the “Code”). To retain our REIT status, the REIT rules generally require that we invest primarily in real estate-related assets, that our activities be passive rather than active and that we distribute annually to our shareholders substantially all of our taxable income, after certain deductions, including deductions for our tax net operating loss (“NOL”) carryforward. We could be subject to income tax if we failed to satisfy those requirements. We use the calendar year for both tax and financial reporting purposes.
There may be differences between taxable income and income computed in accordance with U.S. generally accepted

5
accounting principles (“GAAP”). These differences primarily arise from timing differences in the recognition of revenue and expense for tax and GAAP purposes. We had an NOL carryforward of approximately $146.3 million as of December 31, 2011, subject to the completion of our 2011 federal income tax return, which expires principally in 2020.
Failure to satisfy certain Code requirements could cause us to lose our status as a REIT. If we failed to qualify as a REIT for any taxable year, we may be subject to federal income tax (including any applicable alternative minimum tax) at regular corporate rates and would not receive deductions for dividends paid to shareholders. We could, however, utilize our NOL carryforward to offset any taxable income. In addition, given the size of our NOL carryforward, we could pursue a business plan in the future in which we would voluntarily forego our REIT status. If we lost or otherwise surrendered our status as a REIT, we could not elect REIT status again for five years. Several of our investments in securitized mortgage loans have ownership restrictions limiting their ownership to REITs. Therefore, if we chose to forego our REIT status, we would have to sell these investments or otherwise provide for REIT ownership of these investments. In addition, many of our repurchase agreement lenders require us to maintain our REIT status. If we lost our REIT status these lenders have the right to terminate any repurchase agreement borrowings at that time.
We also have a taxable REIT subsidiary (“TRS”), which had a NOL carryforward of approximately $4.2 million as of December 31, 2011, subject to the completion of our 2011 federal income tax return. The TRS has limited operations, and, accordingly, we have established a full valuation allowance for the related deferred tax asset.
Qualification as a REIT
Qualification as a REIT requires that we satisfy a variety of tests relating to our income, assets, distributions and ownership. The significant tests are summarized below.
Sources of Income. To continue qualifying as a REIT, we must satisfy two distinct tests with respect to the sources of our income: the “75% income test” and the “95% income test.” The 75% income test requires that we derive at least 75% of our gross income (excluding gross income from prohibited transactions) from certain real estate-related sources. In order to satisfy the 95% income test, 95% of our gross income for the taxable year must consist of either income that qualifies under the 75% income test or certain other types of passive income.
If we fail to meet either the 75% income test or the 95% income test, or both, in a taxable year, we might nonetheless continue to qualify as a REIT, if our failure was due to reasonable cause and not willful neglect and the nature and amounts of our items of gross income were properly disclosed to the Internal Revenue Service. However, in such a case we would be required to pay a tax equal to 100% of any excess non-qualifying income.
Nature and Diversification of Assets. At the end of each calendar quarter, we must meet multiple asset tests. Under the “75% asset test”, at least 75% of the value of our total assets must represent cash or cash items (including receivables), government securities or real estate assets. Under the “10% asset test,” we may not own more than 10% of the outstanding voting power or value of securities of any single non-governmental issuer, provided such securities do not qualify under the 75% asset test or relate to taxable REIT subsidiaries. Under the “5% asset test,” ownership of any stocks or securities that do not qualify under the 75% asset test must be limited, in respect of any single non-governmental issuer, to an amount not greater than 5% of the value of our total assets (excluding ownership of any taxable REIT subsidiaries).
If we inadvertently fail to satisfy one or more of the asset tests at the end of a calendar quarter, such failure would not cause us to lose our REIT status, provided that (i) we satisfied all of the asset tests at the close of the preceding calendar quarter and (ii) the discrepancy between the values of our assets and the standards imposed by the asset tests either did not exist immediately after the acquisition of any particular asset or was not wholly or partially caused by such an acquisition. If the condition described in clause (ii) of the preceding sentence was not satisfied, we still could avoid disqualification by eliminating any discrepancy within 30 days after the close of the calendar quarter in which it arose.
Ownership. In order to maintain our REIT status, we must not be deemed to be closely held and must have more than 100 shareholders. The closely held prohibition requires that not more than 50% of the value of our outstanding shares be owned by five or fewer persons at anytime during the last half of our taxable year. The "more than 100 shareholders" rule requires that we have at least 100 shareholders for 335 days of a twelve-month taxable year. In the event that we failed to satisfy the ownership
6
requirements we would be subject to fines and be required to take curative action to meet the ownership requirements in order to maintain our REIT status.
EMPLOYEES
As of December 31, 2011, we have 15 employees and one corporate office in Glen Allen, Virginia. None of our employees are covered by any collective bargaining agreements, and we are not aware of any union organizing activity relating to our employees.
Executive Officers of the Registrant
Name (Age)Thomas B. Akin (59)
Stephen J. Benedetti (49)
Byron L. Boston (53)
Current TitleChairman of the Board and Chief Executive Officer
Executive Vice President,Chief Operating Officer andChief Financial Officer
President, Chief InvestmentOfficer and Director
Business ExperienceChief Executive Officer since February 2008; Chairman of the Board since 2003; managing general partner of Talkot Capital, LLC since 1995.
Executive Vice President and Chief Operating Officer since November 2005; Executive Vice President and Chief Financial Officer from September 2001 to November 2005 and beginning again in February 2008.
President and Director effective March 1, 2012; ChiefInvestment Officer since April 2008; President of BostonConsulting Group from November 2006 to April 2008; ViceChairman and Executive Vice President of Sunset Financial
AVAILABLE INFORMATION
We are subject to the reporting requirements of the Exchange Act and its rules and regulations. The Exchange Act requires us to file reports, proxy statements, and other information with the SEC. Copies of these reports, proxy statements, and other information can be read and copied at:
SEC Public Reference Room100 F Street, N.E.Washington, D.C. 20549
Information on the operation of the Public Reference Room may be obtained by calling the SEC at 1-800-SEC-0330. The SEC maintains a website that contains reports, proxy statements, and other information regarding issuers that file electronically with the SEC. These materials may be obtained electronically by accessing the SEC’s home page at www.sec.gov.
Our website can be found at www.dynexcapital.com. Our annual reports on Form 10-K, our quarterly reports on Form 10-Q and our current reports on Form 8-K, and amendments to those reports, filed or furnished pursuant to Section 13(a) or 15(d) of the Exchange Act, are made available free of charge through our website as soon as reasonably practicable after such material is electronically filed with or furnished to the SEC.
We have adopted a Code of Business Conduct and Ethics (“Code of Conduct”) that applies to all of our employees, officers and directors. Our Code of Conduct is also available free of charge on our website, along with our Audit Committee Charter, our Nominating and Corporate Governance Committee Charter, and our Compensation Committee Charter. We will post on our website amendments to the Code of Conduct or waivers from its provisions, if any, which are applicable to any of our directors or executive officers in accordance with SEC or NYSE requirements.
7
ITEM 1A. RISK FACTORS
Our business is subject to various risks, including those described below. Our business, operating results, and financial condition could be materially and adversely affected by any of these risks. Please note that additional risks not presently known to us or that we currently deem immaterial could also impair our business, operating results, and financial condition.
Risks Related to Our BusinessRisks Related to Regulatory and Legal RequirementsRisks Related to Owning Our Stock
Page Number72023
Risks Related to Our Business
A recently initiated SEC review of Section 3(c)5(C) of the the 1940 Act and the regulations and regulatory interpretations promulgated thereunder that we rely on to exempt us from regulation under the 1940 Act could eventually result in regulatory changes relating thereto, which could require us to change our business and operations in order to continue to rely on an exemption from the 1940 Act or operate without the benefit of exemption from the 1940 Act.
On August 31, 2011, the SEC issued a concept release relating to the exclusion from registration as an investment company provided to mortgage companies by Section 3(c)5(C) of the 1940 Act. This release raises concerns regarding the ability of mortgage REITs to continue to rely on the exclusion in the future. In particular, the release states the SEC is concerned that certain types of mortgage-related pools today appear to resemble in many respects investment companies such as closed-end funds and may not be the kinds of companies that were intended to be excluded from regulation under the 1940 Act by Section 3(c)5(C).
Although we believe that we are properly relying on Section 3(c)5(C) to exempt us from regulation under the 1940 Act (which in large part has been based on no-action letters issued by the SEC with respect to operations of other mortgage REITs), the SEC review could eventually affect our ability to rely on that exemption or could eventually require us to change our business and operations in order for us to continue to rely on that exemption. If the SEC changes or narrows this exemption, we could be required to sell a substantial amount of our MBS under potentially adverse market conditions, which could have a material adverse effect on our financial condition and results of operations. We could also be forced to materially alter our business model and investment strategies which could materially and adversely affect our profitability.
The outcome of the review by the SEC at this time is not determinable, and the SEC may take no action as a result of its review of the Section 3(c)5(C) exemption from the 1940 Act. It is also possible that the SEC issues interpretative guidance for mortgage REITs as to how their operations must be structured in order to avoid being considered an investment company, and compliance with any such guidance could limit our operations and our profitability as indicated above. Finally, it is possible that the SEC requires mortgage REITs to be considered investment companies and to register under the 1940 Act which would severely limit our operations and profitability and likely have a material adverse effect on our financial condition and results of operations.
The success of our business model depends on our ability to access the credit markets to finance our investments. Failure to access credit markets on reasonable terms, or at all, could adversely affect our profitability and may, in turn, negatively affect the market price of shares of our common stock.
We depend heavily upon the availability of adequate funding for our investment activities. Our access to financing depends upon a number of factors, over which we have little or no control, including:
• general market and economic conditions;• the actual or perceived financial condition of credit market participants including banks, broker-dealers, hedge
funds, and money-market funds, among others;

8
• the impact of governmental policies and/or regulations on institutions with respect to activities in the credit markets; • market perception of quality and liquidity of the type of assets in which we invest; and• market perception of our financial strength, our growth potential and the quality of assets specific to our portfolio.
Disruptions in the credit markets have periodically occurred over the last several years, resulting in diminished financing capacity for mortgage securities. This period of volatility demonstrated that general market conditions and the perceived effect on market participants can severely restrict the flow of capital to the credit markets. Many participants in the credit markets during these disruptions were negatively impacted (such as Bear Stearns, Lehman Brothers and MF Global), resulting in a meaningful reduction in the amount of liquidity available for participants. These events led to adverse impacts on the values of mortgage securities. If a severe event were to occur again, lenders may be unwilling or unable to provide financing for our investments or may be willing to provide financing only at much higher rates. This may impact our profitability by increasing our borrowing costs or by forcing us to sell assets. In an extreme case, this may also result in our inability to finance some or all of our securities which could force us to liquidate all or portions of our investment portfolio, potentially in an adverse market environment.
Most of our investments are in securities where the timely receipt of principal and interest is guaranteed by Fannie Mae and Freddie Mac (together, the "GSEs"). Both Fannie Mae and Freddie Mac are currently under federal conservatorship, and the Treasury has committed to purchasing preferred stock from each of these entities in order to ensure their adequate capitalization. The conservatorship of Fannie Mae and Freddie Mac, their reliance upon the U.S. government for solvency, and related efforts that may significantly affect Fannie Mae and Freddie Mac and their relationship with the U.S. government may adversely affect our business, operations and financial condition.
In 2008, Congress passed the Housing and Economic Recovery Act of 2008 ("HERA") due to market concerns about Fannie Mae and Freddie Mac’s ability, without the direct support of the U.S. government, to withstand credit losses associated with securities guaranteed by the GSEs or securities held in their investment portfolios. Among other things, HERA established the Federal Housing Finance Agency, or FHFA, which has broad regulatory powers over the GSEs and which placed both Fannie Mae and Freddie Mac into conservatorship. Together with the Treasury, FHFA established a program designed to boost investor confidence in Fannie Mae’s and Freddie Mac’s debt and Agency MBS. As the conservator of Fannie Mae and Freddie Mac, the FHFA controls and directs their operations and may (1) take over the assets of and operate Fannie Mae and Freddie Mac with all the powers of their shareholders, directors, and officers and conduct all business of Fannie Mae and Freddie Mac; (2) collect all obligations and money due to Fannie Mae and Freddie Mac; (3) perform all functions of Fannie Mae and Freddie Mac which are consistent with the conservator’s appointment; (4) preserve and conserve the assets and property of Fannie Mae and Freddie Mac; and (5) contract for assistance in fulfilling any function, activity, action or duty of the conservator.
In addition to FHFA becoming the conservator of Fannie Mae and Freddie Mac, the Treasury and Fannie Mae and Freddie Mac have entered into Preferred Stock Purchase Agreements (“PSPAs”) pursuant to which the Treasury has ensured that each of Fannie Mae and Freddie Mac maintains a positive net worth through the end of 2012. On December 24, 2009, the Treasury amended the terms of the PSPAs to remove the $200 billion per institution limit that was previously established by the PSPAs, effective through the end of 2012. Beginning in 2013, the PSPAs will impose a $200 billion per institution limit unless the PSPAs are further amended.
The problems faced by Fannie Mae and Freddie Mac, which resulted in their placement into federal conservatorship and receipt of significant U.S. government support, have sparked debate among some federal policy makers regarding the continued role of the U.S. government in providing liquidity for mortgage loans and Agency MBS. With Fannie Mae’s and Freddie Mac’s future under debate, and recent comments by members of the Treasury and the U.S. Presidential administration that support winding down the GSEs, the nature of the GSEs' guarantee obligations could be considerably limited relative to historical measurements. Any changes to the nature of their guarantee obligations could redefine what constitutes an Agency MBS and could have broad adverse implications for the market and our business, operations and financial condition. If Fannie Mae or Freddie Mac are eliminated, or their structures change radically (e.g., limitation or removal of the guarantee obligation), we may be unable to acquire additional Agency MBS. This would remove a material component of our investment strategy and would make it more difficult for us to comply with the provisions of the Investment Company Act of 1940 (see further discussion below regarding the Investment Company Act).
Although the Treasury has committed capital to Fannie Mae and Freddie Mac through 2012, there can be no assurance
9
that these actions will be adequate for their needs. If these actions are inadequate, Fannie Mae and Freddie Mac could fail to honor their guarantees and other obligations. If the GSEs were unwilling or unable to honor the guarantee of payment on Agency MBS, or were perceived to be less likely to honor fully such guarantees, we could potentially incur substantial losses on such securities and experience extreme market price volatility. We rely on our Agency MBS as collateral for our financings under our repurchase agreements. Any decline in their value, or perceived market uncertainty about their value, would make it more difficult for us to obtain financing on acceptable terms or at all, or to maintain our compliance with the terms of any financing transactions.
Future policies that change the relationship between Fannie Mae and Freddie Mac and the U.S. government, including those that result in their winding down, nationalization, privatization, or elimination, may create market uncertainty and have the effect of reducing the actual or perceived credit quality of securities issued or guaranteed by Fannie Mae and Freddie Mac. As a result, such policies could increase the risk of loss on investments in Agency MBS guaranteed by Fannie Mae and/or Freddie Mac. It also is possible that such policies could adversely impact the market for such securities and spreads at which they trade. All of the foregoing could materially and adversely affect our business, operations and financial condition.
The potential limitation or wind-down of the role Fannie Mae and Freddie Mac play in the MBS market may adversely affect our business, operations and financial condition.
On February 11, 2011, the Treasury issued a White Paper titled “Reforming America's Housing Finance Market” (or the White Paper) that lays out, among other things, proposals to limit or potentially wind down the role that Fannie Mae and Freddie Mac play in the mortgage market. Similar proposals to limit or potentially wind down the role of Fannie Mae and Freddie Mac have also been proposed by politicians, housing industry observers, and government regulators. Any such proposals, if enacted, may have broad adverse implications for the MBS market and our business, operations and financial condition. Such proposals have been, and we expect them to continue to be, the subject of significant discussion. It is not yet possible to determine whether such proposals will be enacted and, if so, when or what form any final legislation or policies might take or how proposals, legislation or policies emanating from the White Paper or other proposals may impact the MBS market and our business, operations and financial condition. We are evaluating, and will continue to evaluate, the potential impact of the proposals set forth in the White Paper on our business, financial position, and results of operations.
The Federal Reserve Bank of New York owns substantial amounts of fixed-rate Agency MBS as a result of its efforts to stabilize the financial system and the housing market after the credit crisis of 2008. As of December 31, 2011, the Federal Reserve Bank of New York owned in excess of $837 billion in Agency MBS. If the Federal Reserve Bank of New York were to sell these assets into the market in material amounts, the prices of all Agency MBS could be materially impacted.
In an effort to support the U.S. housing market and to lower mortgage rates, the Federal Reserve has become a substantial buyer of fixed-rate Agency MBS, primarily 15- and 30-year Agency RMBS. The ultimate disposition of these Agency MBS by the Federal Reserve is not known, but if it sells Agency MBS in material amounts, price volatility in all Agency MBS could occur. In such a case, it is likely that prices could decline which would cause a decline in our book value and also could result in margin calls by our lenders for Agency MBS that are pledged as collateral for repurchase agreements. If declines in prices are substantial, this could force us to sell assets at a loss or at an otherwise inopportune time in order to meet margin calls or repay lenders.
The Treasury and Congress continue to seek ways to support the U.S. housing market and the overall U.S. economy, including seeking ways to make it easier to refinance loans owned or guaranteed by Fannie Mae or Freddie Mac where the borrower may have negative equity. In addition, mortgage loan modification programs and future legislative action may adversely affect the value of and the return on Agency RMBS securities in which we invest. Since we own our Agency RMBS at premiums to their par balance, we could incur substantial losses on our Agency RMBS if mortgage loan refinancings increased.
The Treasury Department and the Department of Housing and Urban Development ("HUD") have implemented the Home Affordable Refinance Program (or "HARP"), which allows borrowers who are current on their mortgage payments to refinance loans originated on or before May 31, 2009, at loan-to-value ratios up to 125 percent, in order to reduce their monthly mortgage payments. HARP specifically targets borrowers that are current on their mortgage payment but who have negative equity in their home and, as a result, have been unable to refinance into a lower cost mortgage (given the decline in current

10
mortgage rates compared to pre-May 31, 2009). Many of our Agency RMBS that are collateralized by mortgage loans whose coupons exceed current mortgage interest rates are owned at premiums to their par balance. HARP has generally not been as successful as hoped given other impediments to refinancing (such as the unwillingness of servicers to refinance the loans, borrower unemployment or higher than 125 percent loan-to-value ratios). Recent changes to HARP have been introduced, however, intending to make it easier for borrowers to refinance under the program. If refinance activity materially increases for Agency RMBS in which we invest, we would incur losses on those Agency RMBS that we own at a premium (equal to the excess of the premium paid on the RMBS versus its principal balance) and could experience significant volatility in Agency RMBS fair values. Such volatility could lead to margin calls from our repurchase agreement lenders and could force us to sell these securities at a loss.
The Treasury Department and HUD have also created a number of different programs intended to assist borrowers that are struggling to make their mortgage payment that may involve, among other things, the modification of mortgage loans to reduce the principal amount of the loans (through forbearance and/or forgiveness) and/or the rate of interest payable on the loans, or to extend the payment terms of the loans. Loan modifications such as these could result in our ultimately receiving less than we are contractually due on certain of our investments. A significant number of loan modifications with respect to a given security could negatively impact the realized yields and cash flows on such security. These loan modification programs, future legislative or regulatory actions, including new mortgage loan modification programs and possible amendments to the bankruptcy laws, which result in the modification of outstanding residential mortgage loans, as well as changes in the requirements necessary to qualify for refinancing mortgage loans with Fannie Mae, Freddie Mac or Ginnie Mae, may adversely affect the value of, and the returns on, our securitized single-family mortgage loans and Agency RMBS.
The downgrade of the U.S. credit rating and Europe's debt crisis could have a material adverse effect on our business, financial condition and liquidity.
Standard & Poor's Rating Service (“S&P”) lowered its long term sovereign credit rating on the United States of America from AAA to AA+ on August 5, 2011, largely due to the current U.S. budget deficit. On November 21, 2011, a Congressional committee that was formed to achieve $1.2 trillion in deficit reduction measures announced that it had failed to achieve its stated purpose by the deadline imposed by Congress's August 2011 agreement to raise the U.S. Government's debt ceiling. S&P then affirmed its AA+ rating following the Congressional committee's announcement. Moody's Investors Services, which changed its U.S. Government rating outlook to negative on August 2, 2011, also reaffirmed its rating following the Congressional committee's announcement. On November 28, 2011, Fitch Ratings downgraded its U.S. Government rating outlook to negative and stated that a downgrade of the U.S. sovereign credit rating would occur without a credible plan in place by 2013 to reduce the U.S. Government's deficit.
Further downgrades to the U.S. Government's sovereign credit rating by any of these rating agencies, as well as negative changes to the perceived creditworthiness of U.S. Government-related obligations, could have a material adverse impact on financial markets and economic conditions in the United States and worldwide, and on the availability of financing as well as the price of securities that we own. Any such adverse impact could have a material adverse effect on our liquidity, financial condition and results of operations.
In addition, Fannie Mae and Freddie Mac are under conservatorship of the U.S. Government and both Fannie Mae and Freddie Mac and the U.S. Treasury have entered into PSPAs pursuant to which the Treasury has ensured that each of Fannie Mae and Freddie Mac maintains a positive net worth as discussed previously. The PSPAs legally bind the U.S. Government, through the U.S. Treasury, to provide capital for Fannie Mae and Freddie Mac to continue their operations, including the performance under the guaranty of payment on Agency MBS. It is unclear if a further downgrade in the credit rating of the United States would impact its ability to perform under the PSPAs.
Additionally, certain European nations continue to experience varying degrees of financial stress. Despite assistance packages, worries about European financial institutions and sovereign credit persist. On January 13, 2012, S&P downgraded the credit ratings of France, Italy and seven other European nations in part as a result of the failure of leaders to address systemic stresses in the Eurozone. Market concerns over the direct and indirect exposure of European banks and insurers to these European Union nations and each other have resulted in a widening of credit spreads and increased costs of funding for some European financial institutions. Several European governments have coordinated plans to attempt to shore up their financial institutions through loans, credit guarantees, capital infusions, promises of continued liquidity funding and interest rate cuts. Some of these
11
institutions have U.S. banking subsidiaries which have provided financing to us. If the European credit crisis continues to impact these major European banks, there is the possibility that it will also impact the operations of their U.S. banking subsidiaries. This could adversely affect our financing and operations as well (either through increasing our borrowing costs or limiting the availability to access credit) as those of the entire mortgage sector in general. More broadly, risks related to the European economic crisis have had, and are likely to continue to have, a negative impact on global economic activity and the financial markets, and it is difficult to predict the exposure that financial institutions which provide us financing directly or liquidity to the credit markets in general may have to European financial markets. As financial stress persists in the Eurozone and in individual European nations, our access to financing could be adversely affected, and our financial condition and results of operations could be materially adversely affected.
The Federal Open Market Committee ("FOMC") of the Federal Reserve has announced actions intended to put downward pressure on longer-term interest rates, which could have a material adverse effect on our business and on returns on our investments and, in turn, have a material adverse effect our financial condition and results of operations.
On September 21, 2011, the FOMC announced its intention to sell short-term Treasury securities and purchase longer-term Treasury securities in response to weakening economic conditions in a policy operation which has become known as 'Operation Twist'. The stated intention of the FOMC in Operation Twist is to put downward pressure on longer-term interest rates and to help make broader financial conditions more accommodative. Purchases of longer-term Treasury securities may occur through June 2012. In the same announcement, the FOMC indicated that, to support conditions in the mortgage market, the FOMC would reinvest principal payments received on its existing Agency debt and Agency MBS in purchases of additional Agency MBS. In addition to attempting to lower longer-term interest rates (and therefore flattening the yield curve) through Operation Twist, the purchase of additional Agency RMBS by the Federal Reserve may also reduce mortgage rates, further increasing the incentive of borrowers in Agency RMBS to refinance their loan. Although we cannot predict the actual impact of Operation Twist on interest rates or mortgage refinancing activity, a reduction in mortgage rates could result in our investments experiencing faster levels of prepayments than currently expected. Increases in prepayments on our investments would cause our premium amortization to accelerate, lowering the yield on such assets and decreasing our net interest income, which could have a material adverse effect on our financial condition and results of operations.
A possible additional impact of Operation Twist is widening of credit spreads on our investments relative to Treasury rates which could have the impact of causing price declines in our investments, resulting in margin calls by our repurchase agreement lenders. We could also experience margin calls on our interest rate swaps as movements in interest rate swap rates generally follow directional movements in Treasury rates.
Changes in prepayment rates on the mortgage loans underlying our investments may adversely affect our profitability and subject us to reinvestment risk.
Our investments subject us to prepayment risk to the extent that we own these investments at premiums to their par value. In the case of Agency RMBS, we own these assets at a weighted average amortized cost basis of 105.7% and in the case of Agency CMBS, we own these securities at a weighted average amortized cost basis of 108.1%. We use the effective yield method of accounting for amortization of premiums which is impacted by the borrowers' prepayments of principal on the loans (whether on a voluntary or involuntary basis) underlying our investments. Under the effective yield method of accounting, we recognize yields on our assets based on assumptions regarding future cash flows. Variations in actual cash flows from those assumed as a result of prepayments and subsequent changes in future cash flow expectations will cause adjustments in yields on assets which could contribute to volatility in our future results. For example, if we experience actual prepayments in excess of forecasts or increase our expectations of future prepayment activity, we will amortize premiums on investments on an accelerated basis which may adversely affect our profitability.
Prepayments occur on both a voluntary or involuntary basis. Voluntary prepayments tend to increase when interest rates are declining or, in the case of adjustable-rate mortgages ("ARMs") or hybrid ARMs, based on the shape of the yield curve as discussed further below. CMBS in which we invest generally are protected in the case of voluntary prepayments either from absolute prepayment lock-out on the loan or compensation for future lost interest income on the loan through yield maintenance payments. The actual level of prepayments will be impacted by economic and market conditions, including loan-to-value and

12
income documentation requirements. Involuntary prepayments tend to increase when the yield curve is steep, evidencing economic stress and increasing delinquencies on the underlying loans. Involuntary prepayments occur for all of our investment types, including Agency RMBS and CMBS and non-Agency RMBS and CMBS.
If we receive increased prepayments of our principal in a declining interest rate environment, we may earn a lower return on our new investments as compared to the MBS that prepay given the declining interest rate environment. If we reinvest our capital in lower yielding investments, we will likely have lower net interest income and reduced profitability unless the cost of financing these investments declines faster than the rate at which we may reinvest.
We invest in interest only ("IO") derivative securities issued by CMBS securitization trusts which are backed principally by multifamily mortgage loans. We could lose some or all of our investment in CMBS IO securities if the loans in the CMBS securitization trusts unexpectedly prepay.
IO securities have no principal amounts outstanding and consist only of the right to receive excess interest payments on the underlying CMBS loans included in the securitization trust. While the underlying loans are protected from voluntary prepayment (either through lock-out or yield maintenance provisions) we could lose some or all of our investment in our IO securities if the underlying loans in the CMBS default and are liquidated, restructured or are otherwise repaid or refinanced prior to their expected repayment date. Such an event would cause our net income to decline and could also result in declines in market prices on our CMBS IO securities, thereby reducing our book value, resulting in margin calls from repurchase agreement lenders, and adversely affecting our financial condition.
A flat or inverted yield curve may adversely affect prepayment rates and the supply of hybrid ARMs and ARMs.
When the differential between short-term and long-term benchmark interest rates narrows, as is intended by Operation Twist, the yield curve is said to be “flattening.” When short-term interest rates increase and exceed long-term interest rates, the yield curve is said to be “inverted”. When this flattening or inversion occurs, borrowers have an incentive to refinance into fixed-rate mortgages, or hybrid ARMs with longer initial fixed rate periods, which could cause our investments to experience faster levels of prepayments than expected. As noted above, increases in prepayments on our investments would cause our premium amortization to accelerate, lowering the yield on such assets and decreasing our net interest income. In addition, a decrease in the supply of hybrid ARMs and ARMs will decrease the supply of securities collateralized by these types of loans, which could force us to change our investment strategy.
During 2011 we increased the overall amount of our leverage and have also increased the amount of repurchase agreement financing collateralized by our non-Agency MBS. These increases expose the Company to more liquidity risk and potential losses given the volatility in non-Agency MBS prices relative to Agency MBS, the limited number of repurchase agreement counterparties which finance non-Agency MBS, and the reduced financial flexibility of the Company from higher leverage.
We have increased our non-Agency MBS portfolio in recent quarters and have $295.5 million outstanding in repurchase agreements collateralized by non-Agency MBS with a fair value of $349.7 million as of December 31, 2011. Historically, non-Agency MBS prices have been more volatile than Agency MBS, and fewer counterparties accept non-Agency MBS as collateral for repurchase agreement financing compared to Agency MBS. We currently finance our non-Agency MBS with nine counterparties that have offered to finance our non-Agency MBS investments on reasonable terms. The failure of one or more of these counterparties, the reduction in the availability of counterparties to finance non-Agency MBS, or volatility in the prices of non-Agency MBS due to the performance of the MBS or general market conditions, could result in margin calls and/or the forced liquidation of the non-Agency MBS which could cause us to incur losses or a decline in our book value.
In addition, our overall leverage has increased from 4.6 times shareholders' equity as of December 31, 2010 to 6.0 times shareholders' equity as of December 31, 2011. The increase in overall leverage reduces our financial flexibility for managing through times of market stress. While we believe we have adequate liquidity to withstand market stress such as was experienced in 2008, including cash and unencumbered Agency MBS of $134.1 million as of December 31, 2011 (equal to 6.4% of our total repurchase agreements outstanding), there can be no assurance that we will have adequate liquidity to withstand future periods of market stress. If our available cash, unencumbered Agency MBS, and other liquidity sources do not provide sufficient liquidity during a period of market stress, we may be subject to margin calls and/or the forced liquidation of our investments, which could have a material adverse effect on our results of operations and financial condition.
13
A decrease or lack of liquidity in our investments may adversely affect our business, including our ability to value and sell our assets.
We invest in securities that are not publicly traded in liquid markets. Though Agency MBS are generally deemed to be a very liquid security, turbulent market conditions in the past have at times significantly and negatively impacted the liquidity of these assets. This has resulted in periods of reduced pricing for Agency MBS from our repurchase agreement lenders. In some extreme cases, financing might not be available for certain Agency MBS. Generally, our lenders will value Agency MBS based on liquidation value in periods of significant market volatility.
With respect to non-Agency MBS, such securities typically experience greater price volatility than Agency MBS as there is no guaranty of payment by Fannie Mae and Freddie Mac, and they generally can be more difficult to value. In addition, third-party pricing for non-Agency MBS may be more subjective than for Agency MBS. As such, non-Agency MBS are typically less liquid than Agency MBS and are subject to a greater risk of repurchase agreement financing not being available, market value reductions, and/or lower advance rates and higher costs from lenders.
The illiquidity of our investment securities may make it difficult for us to sell any such investments if the need or desire arises. In addition, if we are required to liquidate all or a portion of our portfolio quickly, we may realize significantly less than the value at which we have previously recorded certain of our investment securities. As a result, our ability to vary our portfolio in response to changes in economic and other conditions may be relatively limited, which could adversely affect our results of operations and financial condition.
Repurchase agreements are uncommitted financings and changes to the availability and terms of such financing may adversely affect our profitability and result in losses and/or reduced cash available for distribution to our shareholders.
Repurchase agreements are uncommitted financings from lenders with an average term of ninety days or less. We use repurchase agreements to finance a substantial portion of our investment portfolio and our earnings are heavily influenced by the cost of our repurchase agreements. Since we rely heavily on borrowings under repurchase agreements to finance certain of our investments, our ability to achieve our investment and profitability objectives depends on our ability to borrow in sufficient amounts and on favorable terms and to renew or replace maturing borrowings on a continuous basis. Our ability to access repurchase agreement financing could be impacted in times of market stress or if we or our lenders suffer financial stress or if the liquidity of securities pledged as collateral is reduced in any meaningful way. If we are not able to renew or replace maturing borrowings, we could be forced to sell some of our assets, potentially under adverse circumstances, which would adversely affect our profitability. In addition, if the terms on which we borrow change in a meaningful way, our profitability may be impacted which could reduce distributions to our shareholders.
In addition, if repurchase agreement financing were not available or if it were not available on reasonable terms, we could implement a strategy of reducing our leverage by selling assets or not replacing MBS as they amortize and/or prepay, thereby decreasing the outstanding amount of our related borrowings. Such an action would likely reduce interest income, interest expense and net income, the extent of which would depend on the level of reduction in assets and liabilities as well as the sale prices for which the assets were sold.
Adverse developments involving major financial institutions or one of our lenders could also result in a rapid reduction in our ability to borrow and adversely affect our business and profitability.
Since 2008, events in the financial markets relating to major financial institutions have raised concerns that a material adverse development involving one or more major financial institutions could result in our lenders reducing our access to funds available under our repurchase agreements. Such a disruption could cause our lenders to reduce or terminate our access to future borrowings. In such a scenario, we may be forced to sell investments under adverse market conditions. We may also be unable to purchase additional investments without access to additional financing. Either of these events could adversely affect our business and profitability.
If a lender to us in a repurchase transaction defaults on its obligation to resell the underlying security back to us at the end of the transaction term, or if we default on our obligations under a repurchase agreement, we will incur losses.

14
Repurchase agreement transactions are legally structured as the sale of a security to a lender in return for cash from the lender. These transactions are accounted for as financing agreements because the lenders are obligated to resell the same securities back to us at the end of the transaction term. Because the cash we receive from the lender when we initially sell the securities to the lender is less than the value of those securities, if the lender defaults on its obligation to resell the same securities back to us, we would incur a loss on the transaction equal to the difference between the value of the securities sold and the amount borrowed from the lender. The lender may default on its obligation to resell if it experiences financial difficulty or if the lender has re-hypothecated the security to another party who fails to transfer the security to the lender. Additionally, if we default on one of our obligations under a repurchase agreement, the lender can terminate the transaction, sell the underlying collateral and cease entering into any other repurchase transactions with us. Any losses we incur on our repurchase transactions could adversely affect our earnings and reduce our ability to pay dividends to our shareholders.
A decline in the market value of our assets may cause our book value to decline and may result in margin calls that may force us to sell assets under adverse market conditions.
The market value of our assets is generally determined by the marketplace on a spread to the Treasury and or LIBOR swap interest rate curves and generally will move inversely to changes in interest rates (i.e., as Treasury and/or LIBOR rates increase, the value of our investments will decrease). The movement of the Treasury and LIBOR swap curves can result from a variety of factors, including but not limited to factors such as Federal Reserve policy, market inflation expectations, and market perceptions of risk. In particular, in periods of high volatility, spreads on our investments to the respective interest rate curve may increase which would have the same consequence for the value of our assets as if the underlying interest rate curve had increased. As most of our investments are considered available for sale under GAAP and are therefore carried at fair value in our financial statements, the decline in value would cause our shareholders’ equity to correspondingly decline.
In addition, since we utilize recourse collateralized financing such as repurchase agreements, a decline in the market value of our investments may limit our ability to borrow against these assets or result in our lenders initiating margin calls and requiring a pledge of additional collateral or cash. Posting additional collateral or cash to support our borrowings would reduce our liquidity and limit our ability to leverage our assets, which could adversely affect our business. As a result, we could be forced to sell some of our assets in order to maintain liquidity. Forced sales typically result in lower sales prices than do market sales made in the normal course of business. If our investments were liquidated at prices below the amortized cost basis of such investments, we would incur losses, which could result in a rapid deterioration of our financial condition.
Credit ratings assigned to debt securities by the credit rating agencies may not accurately reflect the risks associated with those securities. Changes in credit ratings for securities we own or for similar securities might negatively impact the market value of these securities.
Rating agencies rate securities based upon their assessment of the safety of the receipt of principal and interest payments on the securities. Rating agencies do not consider the risks of fluctuations in fair value or other factors that may influence the value of securities and, therefore, the assigned credit rating may not fully reflect the true risks of an investment in securities. Also, rating agencies may fail to make timely adjustments to credit ratings based on available data or changes in economic outlook or may otherwise fail to make changes in credit ratings in response to subsequent events, so our investments may be better or worse than the ratings indicate. We attempt to reduce the impact of the risk that a credit rating may not accurately reflect the risks associated with a particular debt security by not relying solely on credit ratings as the indicator of the quality of an investment. We make our acquisition decisions after factoring in other information that we have obtained about the loans underlying the security and the credit subordination structure of the security. Despite these efforts, our assessment of the quality of an investment may also prove to be inaccurate and we may incur credit losses in excess of our initial expectations.
Credit rating agencies may change their methods of evaluating credit risk and determining ratings on securities backed by real estate loans and securities. These changes may occur quickly and often. The market’s ability to understand and absorb these changes, and the impact to the securitization market in general, are difficult to predict. Such changes may have a negative impact on the value of securities that we own.
Our ownership of securitized mortgage loans subjects us to credit risk and, although we provide for an allowance for loan losses on these loans as required under GAAP, the loss reserves are based on estimates. As a result, actual losses incurred
15
may be larger than our reserves, requiring us to provide additional reserves, which would impact our financial position and results of operations.
We are subject to credit risk as a result of our ownership of securitized mortgage loans. Credit risk is the risk of loss to us from the failure by a borrower (or the proceeds from the liquidation of the underlying collateral) to fully repay the principal balance and interest due on a mortgage loan. A borrower’s ability to repay the loan and the value of the underlying collateral could be negatively impacted by economic and market conditions. These conditions could be global, national, regional or local in nature.
We provide reserves for losses on securitized mortgage loans based on the current performance of the respective pool or on an individual loan basis. If losses are experienced more rapidly due to declining property performance, market conditions or other factors, than we have provided for in our reserves, we may be required to provide additional reserves for these losses. In addition, our allowance for loan losses is based on estimates and to the extent that proceeds from the liquidation of the underlying collateral are less than our estimates, we will record a reduction in our profitability for that period equal to the shortfall.
Our efforts to manage credit risk may not be successful in limiting delinquencies and defaults in underlying loans or losses on our investments. If we experience higher than anticipated delinquencies and defaults, our earnings, our book value and our cash flow may be negatively impacted.
There are many aspects of credit performance for our investments that we cannot control. Third party servicers provide for the primary and special servicing of our single-family and commercial mortgage loans and non-Agency securities and CMBS. In that capacity these service providers control all aspects of loan collection, loss mitigation, default management and ultimate resolution of a defaulted loan. We have a risk management function which oversees the performance of these servicers and provides limited asset management services. Loan servicing companies may not cooperate with our risk management efforts, or such efforts may be ineffective. We have no contractual rights with respect to these servicers and our risk management operations may not be successful in limiting future delinquencies, defaults, and losses.
The securitizations in which we have invested may not receive funds that we believe are due from mortgage insurance companies and other counterparties. Service providers to securitizations, such as trustees, bond insurance providers, guarantors and custodians, may not perform in a manner that promotes our interests or may default on their obligation to the securitization trust. The value of the properties collateralizing the loans may decline causing higher losses than anticipated on the liquidation of the property. The frequency of default and the loss severity on loans that do default may be greater than we anticipated. If loans become “real estate owned” (“REO”), servicing companies will have to manage these properties and may not be able to sell them. Changes in consumer behavior, bankruptcy laws, tax laws, and other laws may exacerbate loan losses. In some states and circumstances, the securitizations in which we invest have recourse, as the owner of the loan, against the borrower’s other assets and income in the event of loan default; however, in most cases, the value of the underlying property will be the sole source of funds for any recoveries.
We invest in commercial mortgage loans and CMBS collateralized by commercial mortgage loans which are secured by income producing properties. Such loans are typically made to single-asset entities, and the repayment of the loan is dependent principally on the net operating income from performance and value of the underlying property. The volatility of income performance results and property values may adversely affect our commercial mortgage loans and CMBS.
Our commercial mortgage loans and CMBS are secured by multifamily and commercial property and are subject to risks of delinquency, foreclosure, and loss. Commercial mortgage loans generally have a higher principal balance and the ability of a borrower to repay a loan secured by an income-producing property typically is dependent upon the successful operation of the property rather than upon the existence of independent income or assets of the borrower. If the net operating income of the property is reduced, the borrower's ability to repay the loan may be impaired. Net operating income of an income-producing property can be affected by, among other things: tenant mix, success of tenant businesses, property management decisions, property location and condition, competition from comparable types of properties, changes in laws that increase operating expenses or limit rents that may be charged, any need to address environmental contamination at the property, changes in national, regional or local economic conditions and/or specific industry segments, declines in regional or local real estate values and declines in regional or local rental or occupancy rates, increases in interest rates, real estate tax rates and other operating expenses,

16
changes in governmental rules, regulations and fiscal policies, including environmental legislation, and acts of God, terrorism, social unrest and civil disturbances.
Commercial and multifamily property values and net operating income derived from them are subject to volatility and may be affected adversely by a number of factors, including, but not limited to, national, regional and local economic conditions; local real estate conditions; changes or continued weakness in specific industry segments; perceptions by prospective tenants, retailers and shoppers of the safety, convenience, services and attractiveness of the property; the willingness and ability of the property's owner to provide capable management and adequate maintenance; construction quality, age and design; demographic factors; retroactive changes to building or similar codes; and increases in operating expenses (such as energy costs).
Declines in the borrowers' net operating income and/or declines in property values of collateral securing commercial mortgage loans could result in defaults on such loans, declines in our book value from reduced earnings and/or reductions to the market value of the investment.
Guarantors may fail to perform on their obligations to our securitization trusts, which could result in additional losses to us.
In certain instances we have guaranty of payment on commercial and single-family mortgage loans pledged to securitization trusts (see Item 7A, “Quantitative and Qualitative Disclosures About Market Risk”). These guarantors have reported substantial losses since 2007, eroding their respective capital bases and potentially adversely impacting their ability to make payments where required. Generally the guarantors will only make payment in the event of the default and liquidation of the collateral supporting the loan. If these guarantors fail to make payment, we may experience losses on the loans that we otherwise would not have experienced.
We may be subject to the risks associated with inadequate or untimely services from third-party service providers, which may harm our results of operations. We also rely on corporate trustees to act on behalf of us and other holders of securities in enforcing our rights.
Our loans and loans underlying non-Agency MBS we own are serviced by third-party service providers. Should a servicer experience financial difficulties, it may not be able to perform these obligations. Due to application of provisions of bankruptcy law, servicers who have sought bankruptcy protection may not be required to make advance payments to us of amounts due from loan borrowers. Even if a servicer were able to advance amounts in respect of delinquent loans, its obligation to make the advances may be limited to the extent that is does not expect to recover the advances due to the deteriorating credit of the delinquent loans. In addition, as with any external service provider, we are subject to the risks associated with inadequate or untimely services for other reasons. Servicers may not advance funds to us that would ordinarily be due because of errors, miscalculations, or other reasons. Many borrowers require notices and reminders to keep their loans current and to prevent delinquencies and foreclosures, which our servicers may fail to provide. In the current economic environment, many servicers are experiencing higher volumes of delinquent loans than they have in the past and, as a result, there is a risk that their operational infrastructures cannot properly process this increased volume. A substantial increase in our delinquency rate resulting from improper servicing or loan performance in general may result in credit losses.
We also rely on corporate trustees to act on behalf of us and other holders of securities in enforcing our rights. Under
the terms of most securities we hold we do not have the right to directly enforce remedies against the issuer of the security, but instead must rely on a trustee to act on behalf of us and other security holders. Should a trustee not be required to take action under the terms of the securities, or fail to take action, we could experience losses.
Fluctuations in interest rates may have various negative effects on us and could lead to reduced profitability and a lower book value.
Fluctuations in interest rates impact us in a number of ways. For example, as more fully explained below, in a period of rising rates, we may experience a decline in our profitability from borrowing rates increasing faster than our assets reset or from our investments adjusting less frequently or relative to a different index (e.g., one-year LIBOR) from our borrowings (which are typically based on one-month LIBOR). We may also experience a reduction in the market value of our Agency MBS and non-Agency MBS as a result of higher yield requirements for these types of securities by the market. In a period of declining interest rates, we may experience increasing prepayments resulting in reduced profitability and returns of our capital in lower

17
yielding investments as discussed elsewhere.
Many of our investments are financed with borrowings which have shorter maturity or interest-reset terms than the associated investment. In addition, both our Agency and non-Agency CMBS are fixed-rate, and a significant portion of our Agency RMBS have a fixed rate of interest for a certain period of time and then reset semi-annually or annually based on an index such as the six-month or one-year LIBOR or one-year CMT. These securities are financed with repurchase agreements which bear interest based predominantly on one-month LIBOR, and generally have initial maturities between 30 and 90 days. In a period of rising rates our borrowings will typically increase in rate faster than our assets may reset resulting in a reduction in our net interest income. The severity of any such decline would depend on our asset/liability composition at the time as well as the magnitude and period over which interest rates increase.
Additionally, increases in interest rates may negatively affect the market value of our securities. In some instances increases in short-term rates are rapid enough that short-term rates equal or exceed medium/long-term rates resulting in a flat or inverted yield curve. Any fixed-rate or hybrid ARM investments will generally be more negatively affected by these increases than securities whose interest-rate periodically adjusts. For those securities that we carry at estimated market value in our financial statements, we are required to reduce our shareholders’ equity, or book value, by the amount of any decrease in the market value of these securities. In addition, as mentioned elsewhere in these Risk Factors, reductions in market value of our securities could result in margin calls from our lenders and could result in our being forced to sell securities at a loss.
Interest rate caps on the adjustable-rate mortgage loans collateralizing our investments may adversely affect our profitability if interest rates increase.
Because the interest rates on the mortgage loans collateralizing ARM securities are typically based on an interest rate index such as LIBOR, the coupons earned on ARM securities adjust over time. The level of adjustment on the interest rates on ARM securities is limited by contract and is based on the limitations of the underlying adjustable-rate mortgage loans. Such mortgage loans typically have interim and lifetime interest rate caps which limit the amount by which the interest rates on such assets can adjust. Interim interest rate caps limit the amount interest rates can adjust during any given period. Lifetime interest rate caps limit the amount interest rates can increase from inception through maturity of a particular loan. The financial markets primarily determine the interest rates that we pay on the repurchase transactions used to finance the acquisition of our investments. These repurchase transactions are not subject to interim and lifetime interest rate caps unlike the securities as previously noted. Accordingly, in a sustained period of rising interest rates or a period in which interest rates rise rapidly, we could experience a decrease in net income or a net loss because the interest rates paid by us on our borrowings could increase without limitation (as new repurchase transactions are entered into upon the maturity of existing repurchase transactions) while increases in the interest rates earned on the adjustable-rate mortgage loans collateralizing our investments could be limited due to interim or lifetime interest rate caps.
Our use of hedging strategies to mitigate our interest rate exposure may not be effective, may adversely affect our income, may expose us to counterparty risks, and may increase our contingent liabilities.
We may pursue various types of hedging strategies, including interest rate swap agreements, interest rate caps and other derivative transactions (collectively, “hedging instruments”). We expect hedging to assist us in mitigating and reducing our exposure to higher interest expenses, and to a lesser extent, losses in book value, from adverse changes in interest rates. Our hedging activity will vary in scope based on the level and volatility of interest rates, the type of assets in our investment portfolio and financing sources used. No hedging strategy, however, can completely insulate us from the interest rate risks to which we are exposed, and there is no assurance that the implementation of any hedging strategy will have the desired impact on our results of operations or financial condition. Certain of the U.S. federal income tax requirements that we must satisfy in order to qualify as a REIT may limit our ability to hedge against such risks. In addition, these hedging strategies may adversely affect us because hedging activities involve an expense that we will incur regardless of the effectiveness of the hedging activity.
Interest rate hedging may fail to protect or could adversely affect us because, among other things:
• interest rate hedging can be expensive, particularly during periods of rising and volatile interest rates;• available interest rate hedges may not correspond directly with the interest rate risk from which we seek protection;• the duration of the hedge may not match the duration of the related liability;
18
• the amount of income that a REIT may earn from hedging transactions (other than through taxable REIT subsidiaries) to offset interest rate losses may be limited by U.S. federal income tax provisions governing REITs;
• the credit quality of the party owing money on the hedge may be downgraded to such an extent that it impairs our ability to sell or assign our side of the hedging transaction;
• the party owing money in the hedging transaction may default on its obligation to pay; • the value of derivatives used for hedging may be adjusted from time to time in accordance with GAAP to reflect
changes in fair value, and downward adjustments, or “mark-to-market losses,” would reduce our shareholders’ equity and book value; and
• hedge accounting under GAAP is extremely complex and any ineffectiveness of our hedges under GAAP will impact our statement of operations.
We expect to primarily use interest rate swap agreements to hedge against anticipated future increases in interest expense from our repurchase agreements. Should an interest rate swap agreement counterparty be unable to make required payments pursuant to the agreement, the hedged liability would cease to be hedged for the remaining term of the interest rate swap agreement. In addition, we may be at risk of loss of any collateral held by a hedging counterparty to an interest rate swap agreement, should the counterparty become insolvent or file for bankruptcy. Our hedging transactions, which are intended to limit losses, may actually adversely affect our earnings, which could reduce our ability to pay dividends to our shareholders.
Hedging instruments involve risk since they often are not traded on regulated exchanges, guaranteed by an exchange or its clearing house, or regulated by any U.S. or foreign governmental authorities. Consequently, there are no requirements with respect to record keeping, financial responsibility or segregation of customer funds and positions. Furthermore, the enforceability of hedging instruments may depend on compliance with applicable statutory, commodity and other regulatory requirements and, depending on the identity of the counterparty, applicable international requirements. The business failure of a hedging counterparty with whom we enter into a hedging transaction will most likely result in its default. Default by a party with whom we enter into a hedging transaction may result in the loss of unrealized profits and force us to cover our commitments, if any, at the then current market price. Although generally we will seek to reserve the right to terminate our hedging positions, it may not always be possible to dispose of or close out a hedging position without the consent of the hedging counterparty, and we may not be able to enter into an offsetting contract in order to cover our risk. In certain circumstances a liquid secondary market may not exist for hedging instruments purchased or sold, and we may be required to maintain a position until exercise or expiration, which could result in losses.
Hedging instruments could also require us to fund cash payments in certain circumstances (such as the early termination of a hedging instrument caused by an event of default or other voluntary or involuntary termination event or the decision by a hedging counterparty to request the posting of collateral it is contractually owed under the terms of the hedging instrument). With respect to the termination of an existing interest rate swap agreement, the amount due would generally be equal to the unrealized loss of the open interest rate swap agreement position with the hedging counterparty and could also include other fees and charges. These economic losses would be reflected in our results of operations, and our ability to fund these obligations will depend on the liquidity of our assets and access to capital at the time. Any losses we incur on our hedging instruments could adversely affect our earnings and reduce our ability to pay dividends to our shareholders.
We may change our investment strategy, operating policies, dividend policy and/or asset allocations without shareholder consent.
We may change our investment strategy, operating policies, dividend policy and/or asset allocation with respect to investments, acquisitions, leverage, growth, operations, indebtedness, capitalization and distributions at any time without the consent of our shareholders. A change in our investment strategy may increase our exposure to interest rate and/or credit risk, default risk and real estate market fluctuations. Furthermore, a change in our asset allocation could result in our making investments in asset categories different from our historical investments. These changes could adversely affect our financial condition, results of operations, the market price of our common stock or our ability to pay dividends to our shareholders.
During 2011, we declared $1.09 per common share in dividends to our common shareholders. Given our ability to offset most of our taxable income with our NOL carryforward, we may not be required to distribute any of our taxable income to common shareholders in order to maintain our REIT status. Our Board of Directors reviews the status of our common dividend on a quarterly basis. We may change our dividend strategy in the future and elect to retain all or a greater portion of our earnings
19
by using our NOL carryforward.
Competition may prevent us from acquiring new investments at favorable yields, and we may not be able to achieve our investment objectives which may potentially have a negative impact on our profitability.
Our net income will largely depend on our ability to acquire mortgage-related assets at favorable spreads over our borrowing costs. The availability of mortgage-related assets meeting our investment criteria depends upon, among other things, the level of activity in the real estate market and the quality of and demand for securities in the mortgage securitization and secondary markets. The size and level of activity in the residential real estate lending market depends on various factors, including interest rates, regional and national economic conditions and real estate values. In acquiring investments, we may compete with other purchasers of these types of investments, including but not limited to other mortgage REITs, broker-dealers, hedge funds, banks, savings and loans, insurance companies, mutual funds, and other entities that purchase assets similar to ours, many of which have greater financial resources than we do. As a result of all of these factors, we may not be able to acquire sufficient assets at acceptable spreads to our borrowing costs, which would adversely affect our profitability.
New assets we acquire may not generate yields as attractive as yields on our current assets, resulting in a decline in our earnings per share over time.
We believe the assets we acquire have the potential to generate attractive economic returns and GAAP yields, but acquiring new assets poses risks. Potential cash flow and mark-to-market returns from new asset acquisitions could be negative, including both new assets that are backed by newly-originated loans, as well as new acquisitions that are backed by more seasoned assets that may experience higher than expected levels of delinquency and default.
In order to maintain our portfolio size and our earnings, we must reinvest in new assets a portion of the cash flows we
receive from principal, interest, calls, and sales. We receive monthly payments from many of our assets, consisting of principal and interest. In addition, occasionally some of our securities can be called by the issuer (which means it is effectively sold by us). Principal payments and calls reduce the size of our portfolio and generate cash for us. We may also sell assets from time to time as part of our portfolio management strategy.
If the assets we acquire in the future earn lower GAAP yields than the assets we currently own, our reported earnings per share will likely decline over time as the older assets pay down, are called, or are sold.
Loss of key management could result in material adverse effects on our business.
We are dependent to a significant extent on the continued services of our executive management team. Our executive officers consist of Thomas Akin, our Chairman and Chief Executive Officer; Byron Boston, our Chief Investment Officer; and Stephen Benedetti, our Chief Operating Officer and Chief Financial Officer. The loss of one or more of Messrs. Akin, Boston or Benedetti could have an adverse effect on our business, financial condition, liquidity, and results of operations regardless of the existence of any future key employee insurance policies.
Our Chairman and Chief Executive Officer devotes a portion of his time to another company in a capacity that could create conflicts of interest that may harm our investment opportunities; this lack of a full-time commitment could also harm our operating results.
Our Chairman and Chief Executive Officer, Thomas Akin, is the managing general partner of Talkot Capital, LLC, where he devotes a portion of his time. Talkot Capital invests in both private and public companies, including investments in common and preferred stocks of other public mortgage REITs. Mr. Akin’s activities with respect to Talkot Capital result in his spending only a portion of his time and effort on managing our activities, as he is under no contractual obligation which mandates that he devote a minimum amount of time to our company. Since he is not fully focused on us at all times, this may harm our overall management and operating results. In addition, though the investment strategy and activities of Talkot Capital are not directly related to us, Mr. Akin’s activities with respect to Talkot Capital may create conflicts. Our corporate governance policies include formal notification policies with respect to potential issues of conflict of interest for competing business opportunities. Compliance by Mr. Akin, and all employees, is closely monitored by our Chief Financial Officer and Board of Directors. Nonetheless, Mr. Akin’s activities with respect to Talkot Capital could create conflicts of interest.
20
Risks Related to Regulatory and Legal Requirements
Risks Specific to Our REIT Status
Qualifying as a REIT involves highly technical and complex provisions of the Code, and a technical or inadvertent violation could jeopardize our REIT qualification. Maintaining our REIT status may reduce our flexibility to manage our operations.
Qualification as a REIT involves the application of highly technical and complex Code provisions for which only limited judicial and administrative authorities exist. Even a technical or inadvertent violation could jeopardize our REIT qualification. Our qualification as a REIT will depend on our satisfaction of certain asset, income, organizational, distribution, stockholder ownership and other requirements on a continuing basis. Our operations and use of leverage also subjects us to interpretations of the Code, and technical or inadvertent violations of the Code could cause us to lose our REIT status or to pay significant penalties and interest. In addition, our ability to satisfy the requirements to qualify as a REIT depends in part on the actions of third parties over which we have no control or only limited influence, including in cases where we own an equity interest in an entity that is classified as a partnership for U.S. federal income tax purposes.
Maintaining our REIT status may limit flexibility in managing our operations. For instance:
• If we make frequent asset sales from our REIT entities to persons deemed customers, we could be viewed as a “dealer,” and thus subject to 100% prohibited transaction taxes or other entity level taxes on income from such transactions.
• Compliance with the REIT income and asset requirements may limit the type or extent of hedging that we can undertake.
• Our ability to own non-real estate related assets and earn non-real estate related income is limited. Our ability to own equity interests in other entities is limited. If we fail to comply with these limits, we may be forced to liquidate attractive assets on short notice on unfavorable terms in order to maintain our REIT status.
• Our ability to invest in taxable subsidiaries is limited under the REIT rules. Maintaining compliance with this limitation could require us to constrain the growth of future taxable REIT affiliates.
• Notwithstanding our NOL carryforward, meeting minimum REIT dividend distribution requirements could reduce our liquidity. Earning non-cash REIT taxable income could necessitate our selling assets, incurring debt, or raising new equity in order to fund dividend distributions.
• Stock ownership tests may limit our ability to raise significant amounts of equity capital from one source.
If we do not qualify as a REIT or fail to remain qualified as a REIT, we may be subject to tax as a regular corporation and could face a tax liability, which would reduce the amount of cash available for distribution to our shareholders.
We intend to operate in a manner that will allow us to qualify as a REIT for federal income tax purposes. Our qualification as a REIT will depend on our satisfaction of certain asset, income, organizational, distribution, stockholder ownership and other requirements on a continuing basis. Our ability to satisfy the asset tests depends upon our analysis of the characterization and fair market values of our assets, some of which are not susceptible to a precise determination, and for which we will not obtain independent appraisals. Our compliance with the REIT income and quarterly asset requirements also depends upon our ability to successfully manage the composition of our income and assets on an ongoing basis.
If we were to fail to qualify as a REIT in any taxable year, we would be subject to federal income tax, after consideration
of our NOL carryforward but not considering any dividends paid to our shareholders during the respective tax year. If we could not otherwise offset this taxable income with our NOL carryforward, the resulting corporate tax liability could be material to our results and would reduce the amount of cash available for distribution to our shareholders, which in turn could have an adverse impact on the value of our common stock. Unless we were entitled to relief under certain Code provisions, we also would be disqualified from taxation as a REIT for the four taxable years following the year in which we failed to qualify as a REIT.
We have a tax NOL carryforward that we have used to partially offset our REIT distribution requirements. If we incur an ownership shift pursuant to Section 382 of the Code, our use of the tax NOL carryforward would be limited in the future.
21
Further, if we had previously inadvertently incurred an ownership shift pursuant to Section 382 and continued to utilize the NOL on an unlimited basis, we may have failed to meet the distribution requirements of a REIT and therefore we could lose our REIT status.
Our tax NOL carryforward allows us to offset the distribution requirements of a REIT and retain some or all of our tax earnings. Section 382 of the Code limits the amount of NOL that could be used to offset this distribution requirement, after an “ownership shift” occurs. A Section 382 ownership shift generally occurs if one or more shareholders who own at least 5% of our stock, or certain groups of shareholders, increase their aggregate ownership by more than 50 percentage points over their lowest ownership percentage within a rolling three-year period. While we believe we have complied with Section 382, if we inadvertently incurred an ownership shift under Section 382, the use of the NOL could have been limited and we may have utilized more of the NOL than we otherwise may have been allowed. In such an instance we may be required to pay taxes, penalties and interest on the excess amount of NOL used, or we may be required to declare a deficiency dividend to our shareholders for the excess amount. In addition as a result of our failure to comply with the REIT distribution requirements, we may fail to qualify as a REIT.
Even if we have complied with Section 382 in the past, we may incur an ownership shift under Section 382 in the future, in which case the use of our NOL could be limited. Future issuances or sales of our common stock (including transactions involving our common stock that are out of our control) could result in an ownership shift under Section 382. If an ownership shift occurs, Section 382 would impose an annual limit on the amount of pre-ownership shift NOLs and other losses we could use to reduce our taxable income.
Because NOLs generally may be carried forward for up to 20 years, if the annual limitation were to be triggered, it may effectively limit the cumulative amount of pre-ownership shift losses, including certain recognized built-in losses that we may utilize. This would result in higher taxable income and greater distribution requirements in order to maintain REIT qualification than if such limitation were not in effect.
On February 1, 2012, the Company closed a public offering of 13,332,487 shares of its common stock. We will not be able to ascertain whether a Section 382 "ownership shift" has occurred as a result of this offering until all Schedule 13 filings are made by our shareholders for the first quarter of 2012.
The failure of investments subject to repurchase agreements to qualify as real estate assets could adversely affect our ability to qualify as a REIT.
Repurchase agreement financing arrangements are structured legally as a sale and repurchase whereby we sell certain of our investments to a counterparty and simultaneously enter into an agreement to repurchase these securities at a later date in exchange for a purchase price. Economically, these agreements are financings which are secured by the investments sold pursuant thereto. We believe that we would be treated for REIT asset and income test purposes as the owner of the securities that are the subject of any such sale and repurchase agreement, notwithstanding that such agreements may legally transfer record ownership of the securities to the counterparty during the term of the agreement. It is possible, however, that the IRS could assert that we did not own the securities during the term of the sale and repurchase agreement, in which case we could fail to qualify as a REIT.
Even if we remain qualified as a REIT, we may face other tax liabilities that reduce our cash flow and our profitability.
Even if we remain qualified for taxation as a REIT, we may be subject to certain federal, state and local taxes on our income and assets, including taxes on any undistributed income, tax on income from some activities conducted as a result of a foreclosure or considered prohibited transactions under the Code, and state or local income taxes. Any of these taxes would decrease cash available for distribution to our shareholders. In addition, in order to meet the REIT qualification requirements, or to avert the imposition of a 100% tax that applies to certain gains derived by a REIT from prohibited transactions (i.e., dealer property or inventory), we may hold some of our assets through a taxable REIT subsidiary (“TRS”) or other subsidiary corporations that will be subject to corporate-level income tax at regular rates to the extent that such TRS does not have an NOL carryforward. Any of these taxes would decrease cash available for distribution to our shareholders.
If we fail to maintain our REIT status, our ability to utilize repurchase agreements as a source of financing and to enter into interest rate swap agreements may be impacted.
22
Most of our repurchase agreements and the agreements governing our interest rate swaps require that we maintain our REIT status as a condition to engaging in a transaction with us. Even though repurchase agreements are not committed facilities with our lenders, if we failed to maintain our REIT status our ability to enter into new repurchase agreement transactions or renew existing, maturing repurchase agreements will likely be limited. Some of our repurchase agreements and swap agreements have cross-default provisions which provide for lenders to terminate these agreements if we default under any of our repurchase agreements or swap agreements. As such, we may be required to sell investments, potentially under adverse circumstances, that were previously financed with repurchase agreements and we may be forced to terminate our interest rate swap agreements.
Certain of our securitization trusts, which qualify as “taxable mortgage pools,” require us to maintain equity interests in the securitization trusts. If we do not, our profitability and cash flow may be reduced.
Certain of our commercial mortgage and single-family mortgage securitization trusts are considered taxable mortgage pools for federal income tax purposes. These securitization trusts are exempt from taxes so long as we, or another REIT, own 100% of the equity interests in the trusts. If we fail to maintain sufficient equity interest in these securitization trusts or if we fail to maintain our REIT status, then the trusts may be considered separate taxable entities. If the trusts are considered separate taxable entities, they will be required to compute taxable income and pay tax on such income. Our profitability and cash flow will be impacted by the amount of taxes paid. Moreover, we may be precluded from selling equity interests, including debt securities issued in connection with these trusts that might be considered to be equity interests for tax purposes, to certain outside investors.
Risks Related to Accounting and Reporting Requirements
Our reported income depends on GAAP and conventions in applying GAAP which are subject to change in the future and which may not have a favorable impact on our reported income.
Accounting rules for our assets and for the various aspects of our current and future business change from time to time. Changes in GAAP, or the accepted interpretation of these accounting principles, can affect our reported income and shareholders’ equity.
Estimates are inherent in the process of applying GAAP, and management may not always be able to make estimates which accurately reflect actual results, which may lead to adverse changes in our reported GAAP results.
Interest income on our assets and interest expense on our liabilities may be partially based on estimates of future events. These estimates can change in a manner that negatively impacts our results or can demonstrate, in retrospect, that revenue recognition in prior periods was too high or too low. For example, we use the effective yield method of accounting for many of our investments which involves calculating projected cash flows for each of our assets. Calculating projected cash flows involves making assumptions about the amount and timing of credit losses, loan prepayment rates, and other factors. The yield we recognize for GAAP purposes generally equals the discount rate that produces a net present value for actual and projected cash flows that equals our GAAP basis in that asset. We update the yield recognized on these assets based on actual performance and as we change our estimates of future cash flows. The assumptions that underlie our projected cash flows and effective yield analysis may prove to be overly optimistic, or conversely, overly conservative. In these cases, our GAAP yield on the asset or cost of the liability may change, leading to changes in our reported GAAP results.
Other Regulatory Risks
In the event of bankruptcy either by ourselves or one or more of our third party lenders, assets pledged as collateral under repurchase agreements may not be recoverable by us. We may incur losses equal to the excess of the collateral pledged over the amount of the associated repurchase agreement borrowing.
Borrowings made under repurchase agreements may qualify for special treatment under the U.S. Bankruptcy Code. In the event that a lender under our repurchase agreements files for bankruptcy, it may be difficult for us to recover our assets pledged as collateral to such lender. In addition, if we ever file for bankruptcy, lenders under our repurchase agreements may be able to avoid the automatic stay provisions of the U.S. Bankruptcy Code and take possession of and liquidate our collateral

23
under our repurchase agreements without delay. In the event of a bankruptcy, we may incur losses equal to the excess of our collateral pledged over the amount of repurchase agreement borrowing due to the lender.
If we fail to properly conduct our operations we could become subject to regulation under the Investment Company Act of 1940. Conducting our business in a manner so that we are exempt from registration under and compliance with the Investment Company Act of 1940 may reduce our flexibility and could limit our ability to pursue certain opportunities.
We seek to conduct our operations so as to avoid falling under the definition of an investment company pursuant to the Investment Company Act of 1940 (the “1940 Act”). Specifically, we currently seek to conduct our operations under one of the exemptions afforded under the 1940 Act. We primarily expect to use the exemption provided under Section 3(c)(5)(C) of the 1940 Act, a provision available to companies primarily engaged in the business of purchasing and otherwise acquiring mortgages and other liens on and interests in real estate. According to SEC no-action letters, companies relying on this exemption must ensure that at least 55% of their assets are mortgage loans and other qualifying assets, and at least 80% of their assets are real estate-related. The 1940 Act requires that we and each of our subsidiaries evaluate our qualification for exemption under the Act. Our subsidiaries will rely either on Section 3(c)(5)(C) or other sections that provide exemptions from registering under the 1940 Act, including Sections 3(a)(1)(C) and 3(c)(7).
Under the 1940 Act, an investment company is required to register with the SEC and is subject to extensive restrictive and potentially adverse regulations relating to, among other things, operating methods, management, capital structure, dividends, and transactions with affiliates. If we were determined to be an investment company, our ability to use leverage and conduct business as we do today would be impaired.
Risks Related to Owning Our Stock
The stock ownership limit imposed by the Code for REITs and our Articles of Incorporation may restrict our business combination opportunities. The stock ownership limitation may also result in reduced liquidity in our stock and may result in losses to an acquiring shareholder.
To qualify as a REIT under the Code, not more than 50% in value of our outstanding stock may be owned, directly or indirectly, by five or fewer individuals (as defined in the Code to include certain entities) at any time during the last half of each taxable year after our first year in which we qualify as a REIT. Our Articles of Incorporation, with certain exceptions, authorize our Board of Directors to take the actions that are necessary and desirable to qualify as a REIT. Pursuant to our Articles of Incorporation, no person may beneficially or constructively own more than 9.8% of our common stock. Our Board of Directors may grant an exemption from this 9.8% stock ownership limitation, in its sole discretion, subject to such conditions, representations and undertakings as it may determine are reasonably necessary. Our Board of Directors has waived this ownership limitation with respect to Talkot Capital, LLC, of which Thomas Akin, our Chairman and Chief Executive Officer, is managing general partner. Per the terms of the waiver, Talkot Capital may own up to 15% of our outstanding common stock on a fully diluted basis, provided, however, that no single beneficial owner has a greater than two-thirds ownership stake in Talkot Capital.
The ownership limits imposed by the tax law are based upon direct or indirect ownership by “individuals,” but only during the last half of a tax year. The ownership limits contained in our Articles of Incorporation apply to the ownership at any time by any “person,” which includes entities, and are intended to assist us in complying with the tax law requirements and to minimize administrative burdens. However, these ownership limits might also delay or prevent a transaction or a change in our control that might involve a premium price for our common stock or otherwise be in the best interest of our shareholders.
Whether we would waive the ownership limitation for any other shareholder will be determined by our Board of Directors on a case by case basis. Our Articles of Incorporation’s constructive ownership rules are complex and may cause the outstanding stock owned by a group of related individuals or entities to be deemed to be constructively owned by one individual or entity. As a result, the acquisition of less than these percentages of the outstanding stock by an individual or entity could cause that individual or entity to own constructively in excess of these percentages of the outstanding stock and thus be subject to the ownership limit. The Board of Directors has the right to refuse to transfer any shares of our common stock in a transaction that would result in ownership in excess of the ownership limit. In addition, we have the right to redeem shares of our common stock held in excess of the ownership limit.
24
Dividends payable by REITs do not qualify for the reduced tax rates available for some dividends.
The maximum tax rate applicable to income from “qualified dividends” payable to domestic shareholders that are individuals, trusts and estates has been reduced by legislation to 15% through the end of 2012. Dividends payable by REITs, however, generally are not eligible for the reduced rates. Although this legislation does not adversely affect the taxation of REITs or dividends payable by REITs, the more favorable rates applicable to regular corporate qualified dividends could cause investors who are individuals, trusts and estates to perceive investments in REITs to be relatively less attractive than investments in the stocks of non-REIT corporations that pay dividends, which could adversely affect the value of the stock of REITs, including our common stock.
Recognition of excess inclusion income by us could have adverse consequences to us or our shareholders.
Certain of our securities have historically generated excess inclusion income and may continue to do so in the future. Certain categories of shareholders, such as foreign shareholders eligible for treaty or other benefits, shareholders with NOLs, and certain tax-exempt shareholders that are subject to unrelated business income tax, could be subject to increased taxes on a portion of their dividend income from us that is attributable to excess inclusion income. In addition, to the extent that our stock is owned by tax-exempt “disqualified organizations,” such as certain government-related entities and charitable remainder trusts that are not subject to tax on unrelated business income, we may incur a corporate level tax on a portion of our income. In that case, we may reduce the amount of our distributions to any disqualified organization whose stock ownership gave rise to the tax.
Item 1B. UNRESOLVED STAFF COMMENTS
There are no unresolved comments from the SEC Staff.
ITEM 2. PROPERTIES
We lease one facility located at 4991 Lake Brook Drive, Suite 100, Glen Allen, Virginia 23060 under two separate leases which provides a total of 9,280 square feet of office space for our executive officers and administrative staff. The term of the first lease for 7,068 square feet expires in December 2013, but may be renewed at our option for one additional five-year period at a rental rate 3% greater than the rate in effect during the preceding 12-month period. The term of the second lease for 2,212 square feet expires in January 2017 and is not subject to a renewal option. We believe that our property is maintained in good operating condition and is suitable and adequate for our purposes.
ITEM 3. LEGAL PROCEEDINGS
The Company and its subsidiaries are parties to various legal proceedings, including those described below. Although the ultimate outcome of these legal proceedings cannot be ascertained at this time, and the results of legal proceedings cannot be predicted with certainty, the Company believes, based on current knowledge, that the resolution of any of these proceedings, including those described below, will not have a material adverse effect on the Company’s consolidated financial condition or liquidity. However, the resolution of any of the proceedings described below could have a material impact on consolidated results of operations or cash flows in a given future reporting period as the proceedings are resolved. One of the Company's subsidiaries, GLS Capital, Inc. (“GLS”), and the County of Allegheny, Pennsylvania are defendants in a class action lawsuit filed in 1997 in the Court of Common Pleas of Allegheny County, Pennsylvania (the “Court”). Between 1995 and 1997, GLS purchased from Allegheny County delinquent property tax receivables for properties located in the County. The plaintiffs in this matter have alleged that GLS improperly recovered or sought recovery for certain fees, costs, interest, and attorneys' fees and expenses in connection with GLS' collection of the property tax receivables. The Court granted class action status in this matter in August 2007. In February 2011, as a result of motions filed by GLS, the Court refined the class to include only owners of real estate in the County of Allegheny who paid an attorneys' fee between 1996 and 2003 in connection with the forced collection of delinquent property tax receivables by GLS (generally through the initiation of a foreclosure action). As a result, the Court dismissed all claims against GLS and narrowed the issues being litigated to whether attorneys' fees and related expenses charged by GLS in connection with the collection of the receivables was reasonable.

25
Such attorneys' fees and related expenses were assessed by GLS in its collection efforts pursuant to prevailing County ordinance. Plaintiffs have not enumerated their damages in this matter. In January 2012, Plaintiffs' counsel presented the Court a petition to discontinue and a proposed noticed to class members of the discontinuance and their right to opt out of the class actions. The Court granted Plaintiffs' petition. A hearing date has been set for April 17, 2012 on the proposed discontinuance of the remaining claim.
Dynex Capital, Inc. and Dynex Commercial, Inc., a former affiliate of the Company and now known as DCI Commercial, Inc. ("DCI"), are appellees (or respondents) in the matter of Basic Capital Management, Inc. et al. (collectively, “BCM” or the “Plaintiffs”) versus DCI et al. currently pending in the Fifth Court of Appeals in Dallas. The matter was initially filled in the state court in Dallas County, Texas in April 1999 against DCI, and in March 2000, BCM amended the complaint and added the Company as a defendant. The appeal seeks to overturn a judgment rendered by the trial court in the favor of the Company and DCI. Specifically, Plaintiffs are seeking reversal of the trial court's judgment and rendition of judgment against the Company for alleged breach of loan agreements for tenant improvements in the amount of $0.3 million. They also seek reversal of the trial court's judgment and rendition of judgment against DCI in favor of BCM under two mutually exclusive damage models, for $2.2 million and $25.6 million, respectively, related to the alleged breach by DCI of a $160 million “master” loan commitment. Plaintiffs also seek reversal and rendition of a judgment in their favor for attorneys' fees in the amount of $2.1 million. Alternatively, Plaintiffs seek a new trial. Even if Plaintiffs were to be successful on appeal, management does not believe the Company would be obligated for any amounts awarded against DCI.
Dynex Capital, Inc., MERIT Securities Corporation, a subsidiary of Dynex ("MERIT"), and the former President/Chief Executive Officer and current Chief Operating Officer/Chief Financial Officer of Dynex Capital, Inc., (together, the "Defendants") are defendants in a class action brought by the Teamsters Local 445 Freight Division Pension Fund (the "Teamsters") in the United States District Court for the Southern District of New York (the "District Court"). The original complaint alleging violations of the federal securities laws was filed on February 7, 2005, and was purportedly brought on behalf of a class of purchasers between February 2000 and May 2004 of MERIT Series 12-1 and MERIT Series 13 securitization financing bonds (the "Bonds"), which are collateralized by manufactured housing loans. After a series of court rulings, the case proceeded to discovery on the basis of a second amended complaint filed August 6, 2008. The amended complaint sought unspecified damages and alleged, among other things, fraud and misrepresentation in connection with the issuance of and subsequent reporting related to the Bonds. On March 7, 2011, the District Court granted the Teamsters' motion to certify a class of purchasers of the Bonds from February 2000 through May 2004. In September, 2011, the Defendants entered into a memorandum of understanding with the Teamsters, reflecting an agreement in principle to settle all claims asserted in the action, as well as any claims that could have been asserted in the action, for $7.5 million, and in December 2011, the Defendants and the Teamsters entered into a definitive settlement agreement. The Company has funded an escrow account in the amount of $7.5 million for the benefit of the class. The escrow will be disbursed upon final approval of the settlement by the District Court, and satisfaction of any other conditions contained in the definitive settlement agreement. The Court will consider final approval of the settlement at a hearing scheduled for March 13, 2012. The Company continues to deny that it violated any federal securities laws and has agreed in principle to this settlement solely to eliminate the expense, burden, and uncertainty of the litigation.
ITEM 4. MINE SAFETY DISCLOSURES
Not applicable.

26
PART II
ITEM 5. MARKET FOR REGISTRANT'S COMMON EQUITY, RELATED STOCKHOLDER MATTERS, AND ISSUER PURCHASES OF EQUITY SECURITIES
Our common stock is traded on the New York Stock Exchange under the trading symbol “DX”. The common stock was held by approximately 18,756 holders of record as of February 29, 2012. On that date, the closing price of our common stock on the New York Stock Exchange was $9.51 per share. During the last two years, the high and low stock prices and cash dividends declared on common stock were as follows:
2011:First quarterSecond quarterThird quarterFourth quarter
2010:First quarterSecond quarterThird quarterFourth quarter
High
$10.98$10.14$9.87$9.65
$9.36$9.85$10.92$11.00
Low
$9.93$9.40$8.06$7.25
$8.57$8.70$9.04$10.42
DividendsDeclared
$0.27$0.27$0.27$0.28
$0.23$0.23$0.25$0.27
During the years ended December 31, 2011 and December 31, 2010, the Company declared common dividends totaling $1.09 per share $0.98 per share, respectively. Any dividends declared by the Board of Directors have generally been for the purpose of maintaining our REIT status and maintaining compliance with dividend requirements of the Series D Preferred Stock. During October 2010, the Company converted all 4,221,539 shares of its Series D 9.50% Cumulative Convertible Preferred Stock (the “Series D Preferred Stock”) into an equivalent number of common shares, pursuant to provisions of the Company's articles of incorporation. The stated quarterly dividend on Series D Preferred Stock was $0.2375 per share, which was declared and paid in full for the first two quarters of the 2010 fiscal period. Due to its participation feature, the quarterly dividend on the Series D Preferred Stock in the third quarter of 2010 was $0.25 per share. No dividend was declared on the Series D Preferred Stock in 2011 or the fourth quarter of 2010 due to the redemption of the Series D Preferred Stock in 2010.
The following graph is a five year comparison of cumulative total returns for the shares of our common stock, the Standard & Poor’s 500 Stock Index (“S&P 500”), the Bloomberg Mortgage REIT Index, and the SNL U.S. Finance REIT Index. The table below assumes $100 was invested at the close of trading on December 31, 2006 in each of our common stock, the S&P 500, the Bloomberg Mortgage REIT Index, and the SNL U.S. Finance REIT Index.
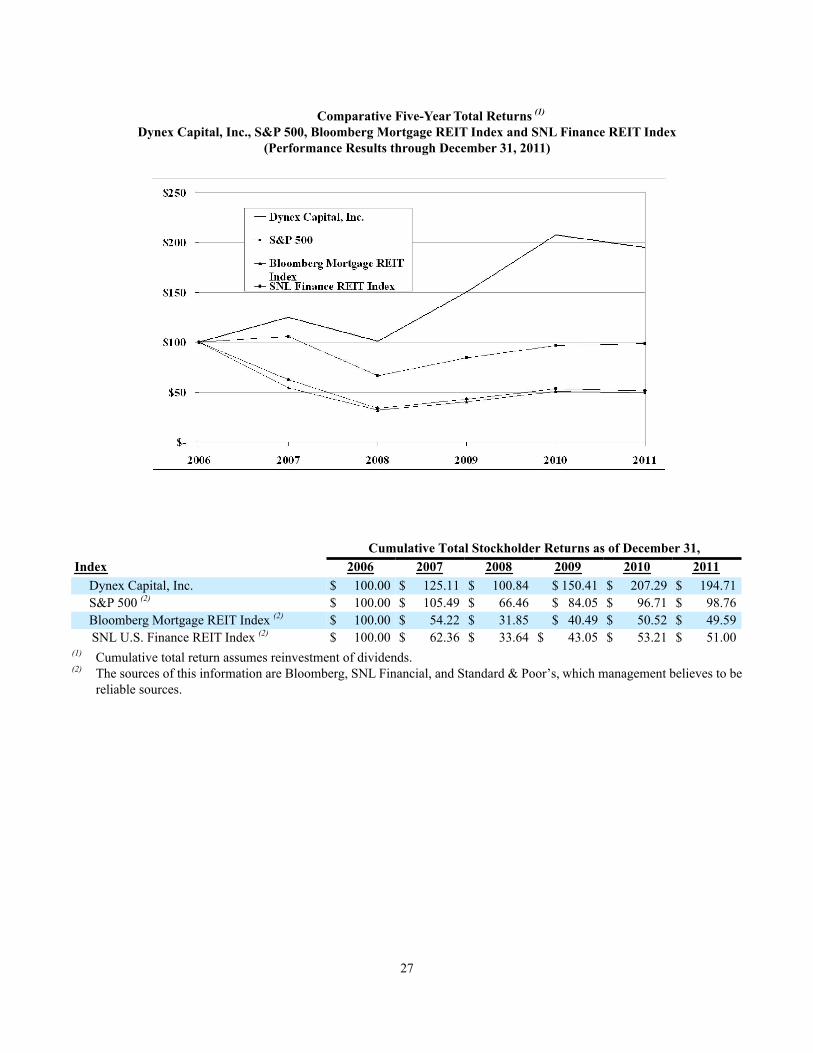
27
Comparative Five-Year Total Returns (1)
Dynex Capital, Inc., S&P 500, Bloomberg Mortgage REIT Index and SNL Finance REIT Index(Performance Results through December 31, 2011)
IndexDynex Capital, Inc.S&P 500 (2)
Bloomberg Mortgage REIT Index (2)
SNL U.S. Finance REIT Index (2)
Cumulative Total Stockholder Returns as of December 31,2006
$ 100.00$ 100.00$ 100.00$ 100.00
2007$ 125.11$ 105.49$ 54.22$ 62.36
2008$ 100.84$ 66.46$ 31.85$ 33.64
2009$ 150.41$ 84.05$ 40.49
$ 43.05
2010$ 207.29$ 96.71$ 50.52$ 53.21
2011$ 194.71$ 98.76$ 49.59$ 51.00
(1) Cumulative total return assumes reinvestment of dividends. (2) The sources of this information are Bloomberg, SNL Financial, and Standard & Poor’s, which management believes to be
reliable sources.

28
ITEM 6. SELECTED FINANCIAL DATA
The following selected financial information should be read in conjunction with the audited consolidated financial statements of the Company and notes thereto contained in Item 8 of this Annual Report on Form 10-K.
($ in thousands except per share data)Net interest incomeNet interest income after provision for loan
lossesGain (loss) on sale of investmentsFair value adjustments, netOther income (expense), netGeneral and administrative expensesNet incomeNet income to common shareholdersNet income per common share:
Basic Diluted
Dividends declared per share:CommonSeries D Preferred
Average interest earning assets (1)
Average interest bearing liabilities (1)
Average effective yield earned on assets(2)(3)
Average effective rate on liabilities(2)(3)
Net interest spread (2) (3)
For the Year EndedDecember 31,
2011$ 59,295
58,4242,096(676)134
(9,956)39,81239,812
$ 1.03$ 1.03
$ 1.09$ —
$2,283,440(2,002,981)
3.64 %(1.19)%2.45 %
2010$ 34,424
33,0452,891
2941,498
(8,817)29,47226,411
$ 1.50$ 1.41
$ 0.98$ 0.71
$1,012,520(865,920)
4.81 %(1.64)%3.17 %
2009$ 24,558
23,776171205145
(6,716)17,58113,571
$ 1.04$ 1.02
$ 0.92$ 0.95
$ 740,640(627,848)
5.29 %(2.06)%3.23 %
2008$ 10,547
9,5562,3167,1471,734
(5,632)15,12111,111
$ 0.91$ 0.91
$ 0.71$ 0.95
$ 421,796(327,687)
6.79 %(5.28)%1.51 %
2007$ 10,683
11,964755
–176
(3,996)8,8994,889
$ 0.40$ 0.40
$ —$ 0.95
$ 333,084(265,379)
8.45 %(6.77)%1.68 %
(1) Average balances are calculated as a simple average of the daily balances and exclude unrealized gains and losses on available-for-sale securities. Average balances also exclude funds held by trustees except proceeds from defeased loans held by trustees.
(2) Certain income and expense items of a one-time nature are not annualized for the calculation of effective yields or rates. Examples of such one-time items include retrospective adjustments of discount and premium amortization arising from adjustments of effective interest rates.
(3) Cash and cash equivalents are excluded from the effective yield and rate calculations for each period presented.

29
(amounts in thousands except share and pershare data)InvestmentsTotal assetsRepurchase agreementsNon-recourse collateralized financingTotal liabilitiesShareholders’ equityCommon shares outstandingBook value per common share
As of December 31,
2011$ 2,500,976
2,582,1932,093,793
70,8952,210,844
$ 371,34940,382,530
$ 9.20
2010$ 1,614,126
1,649,5841,234,183
107,1051,357,227
$ 292,35730,342,897
$ 9.64
2009$ 914,421
958,062638,329143,081789,309
$ 168,75313,931,512
$ 9.08
2008$ 572,876
607,191274,217177,157466,782
$ 140,40912,169,762
$ 8.07
2007$ 333,735
374,7584,612
203,199232,822
$ 141,93612,136,262
$ 8.22
ITEM 7. MANAGEMENT'S DISCUSSION AND ANALYSIS OF FINANCIAL CONDITION AND RESULTS OF OPERATIONS
The following discussion should be read in conjunction with our financial statements and the related notes included in Item 8. “Financial Statements and Supplementary Data” in this Annual Report on Form 10-K. This discussion contains forward-looking statements that involve risks and uncertainties. Our actual results could differ materially from those anticipated in these forward-looking statements as a result of various factors including, but not limited to, those disclosed in Item 1A. “Risk Factors” elsewhere in this Annual Report on Form 10-K and in other documents filed with the SEC and otherwise publicly disclosed. Please refer to “Forward-Looking Statements” contained within this Item 7 for additional information.
EXECUTIVE OVERVIEW
In executing our investment strategy, we seek to balance the various risks of owning mortgage assets on a leveraged basis, such as interest rate, credit, prepayment, and liquidity risk with the earnings opportunity on our invested capital. We view our strategy of investing in Agency and non-Agency mortgage assets to provide superior diversification of these risks across our investment portfolio and therefore provides plentiful opportunities to generate attractive risk-adjusted returns while preserving our shareholders’ capital.
We continue to believe that the outlook for our business model is favorable in light of current economic conditions and anticipated monetary policy. Recent statements by the Federal Open Market Committee ("FOMC") of the Federal Reserve indicate that the FOMC expects to maintain a highly accommodative monetary policy and keep the federal funds target rate at 0%-0.25% until 2014 as a result of economic conditions including low rates of resource utilization and a subdued inflation over the medium run. As our cost of repurchase agreement financing is highly correlated to the federal funds target rate, we expect our borrowing costs to remain low for the next several years and our net interest spread to continue to remain wide by historical standards. Further, despite the uncertainty regarding government policy and its potential affects on prepayments of our investments, we anticipate impediments to mortgage refinancing will keep prepayment rates on our Agency RMBS at reasonable levels. Notwithstanding this expectation, during 2011 we expanded our investment portfolio to include Agency CMBS IOs and non-Agency CMBS, including non-Agency CMBS IOs, to diversify our prepayment risk. As of December 31, 2011, our Agency MBS constituted 79% of our investment portfolio versus 74% as of December 31, 2010. As of December 31, 2011, our investment portfolio consisted of 66% of RMBS and securitized single-family mortgage loans and 34% of CMBS and securitized commercial mortgage loans.
During the year ended December 31, 2011, we earned net income of $39.8 million, or $1.03 per diluted common share versus net income of $29.5 million, or $1.41 per diluted common share for the year ended December 31, 2010. The decline in earnings per common share was due primarily to litigation settlement and related costs, expenses from the redemption of securitization financing, increased premium amortization on our investments and increased interest expense from our interest rate swap activities during 2011. Our net interest spread for the year ended December 31, 2011 was 2.45% versus 3.17% for
30
the year ended December 31, 2010. The decline in net interest spread resulted principally from lower yields on new investment purchases and an increase in premium amortization on our investments as we added higher premium investments during the year. We also expanded our investment portfolio by $886.9 million, or 54.9%, as we increased our shareholders' equity $79.0 million to $371.3 million as of December 31, 2011. Please refer to "Financial Condition" and "Results of Operations" contained within this Item 7 for further discussion.
On February 1, 2012, we closed a public offering of 13,332,487 shares of our common stock for total net proceeds of approximately $120.0 million. We expect to deploy the proceeds from this offering to purchase selective investments in Agency MBS and non-Agency MBS during the first quarter of 2012 in a manner consistent with our current investment strategy. We expect that our deployment of this capital will result in the addition of approximately $700 million in assets and an increase in our repurchase agreement borrowings by approximately $600 million. We have capacity available with our repurchase agreement counterparties to be able to add these borrowings. Depending on the assets purchased and the risk profile of our overall investment portfolio, we may add additional interest rate swaps to hedge our exposure to increases in interest rates on our borrowings.
Factors that Affect Our Results of Operations and Financial Condition
Our financial condition and results of operations are affected by a variety of factors, many of which are beyond our control. The success of our investment strategy and our results of operations and financial condition are impacted by a variety of industry and economic factors including interest rates, trends of interest rates, the steepness of interest rate curves, prepayment rates on our investments, competition for investments, economic conditions and their impact on the credit performance of our investments, and actions taken by the U.S. government, including the U.S. Federal Reserve and/or the Treasury.
Our investment strategy may also be impacted by other factors such as the state of the overall credit markets, which could impact the availability and costs of financing. Reductions in the availability of financing for our investments could significantly impact our business and force us to sell assets that we otherwise would not sell, potentially at losses or at amounts below their true fair value.
Investing in mortgage-related securities on a leveraged basis subjects us to liquidity risk and interest rate risk which are discussed in further detail in Item 7A, "Quantitative and Qualitative Disclosures About Market Risk" and in the "Liquidity and Capital Resources" section of this Item 7. With respect to interest rate risk, such risk arises from changes in the absolute level of rates (e.g., the level of LIBOR or Treasury securities rates), changes in relationships between rate indices (e.g., LIBOR versus Treasury securities rates), and changes in the relationships between short-term and long-term rates (e.g., the 2-year Treasury securities rate versus the 10-year Treasury securities rate). Interest rate risk also arises from changes in market spreads reflecting the perceived riskiness of assets (e.g., swap rates and mortgage rates relative to the Treasury securities rates). Because we leverage our capital, changes in interest rates can be disproportionately favorable or unfavorable on our results of operations and our book value. We attempt to manage our exposure to changes in interest rates by investing in shorter duration instruments and managing our investment portfolio within risk tolerances set by our Board of Directors. Our current goal is to maintain a portfolio duration target (a measure of interest rate risk) within a range of 0.5 to 1.5 years. Our portfolio duration could drift outside of our target range due to changes in market conditions, interest rates, market spreads, and activity in our investment portfolio. We will use interest rate swaps and other instruments to help manage our interest rate risk and, where practical, we will attempt to fund our assets with financings that have similar terms as the related investments. In general, mortgage portfolios have interest rate risk and, when financed with repurchase agreements, will underperform in a period of rising interest rates and outperform in a period of declining interest rates.
The interest rates on our assets will generally reset less frequently than the interest rates on our liabilities, particularly our repurchase agreement financing. As such, during periods of rising interest rates, we will generally experience a reduction in our net interest income, notwithstanding our efforts to manage interest rate risk. This reduction in net interest income will be larger when short-term interest rates are rising rapidly. With the maturities of our assets generally of longer term than those of our liabilities, interest rate increases will also tend to decrease the market value of our assets (and therefore our book value).
Many of our investments are purchased at premiums to their par balance. Because we amortize premiums based on contractual payments as well as actual and expected future principal prepayments on the investments, changes in actual and expected prepayment rates will impact our yield on these investments and our operating results for the period in which any such

31
change occurs. Principal prepayments on our investments are influenced by changes in market interest rates and a variety of economic, geographic, and other factors beyond our control. In addition, actions taken by the U.S. government could increase prepayments as discussed further below under “Trends and Recent Market Impacts”. Increasing prepayments on premium assets will reduce their overall yield, negatively impacting our results. We attempt to manage the risks of purchasing assets at a premium by purchasing assets with protection from prepayments (e.g., Agency CMBS) and by purchasing assets which we believe will have less susceptibility to prepayments (e.g., hybrid Agency ARMs collateralized by interest-only loans).
Trends and Recent Market Impacts
The following marketplace conditions and prospective trends have impacted and may continue to impact our future results of operations and our financial condition. For additional information about risks that may be posed by these trends, please refer to Item 1A, "Risk Factors" contained within this Annual Report on form 10-K, as well as "Quantitative and Qualitative Disclosures about Market Risk" contained within Item 7 of this Annual report on Form 10-K.
Credit Markets and Liquidity Risk
Our business model requires that we have access to leverage, principally the repurchase agreement market. Repurchase agreement financing is uncommitted financing and as such, there can be no guarantee that we will always have access to such financing. During periods of sustained volatility in the credit markets, such as was experienced in 2008, or other disruptions to the credit and financing markets, access to repurchase agreement financing may be limited as liquidity providers reduce their exposure to the short-term funding credit markets or may be available on less favorable terms. In an attempt to manage this risk, we seek to diversify our exposure to repurchase agreement counterparties and seek to extend the maturity dates of our repurchase agreements where practicable. We believe the diversification of counterparties reduces, but does not eliminate, our liquidity risk resulting from the exit or failure of one or more of our repurchase agreement counterparties.
Short-term Interest Rates
In response to the volatility and lack of liquidity in the credit markets in 2008, the FOMC lowered the Federal Funds Target Rate (the rate at which U.S. banks may borrow from each other) from 4.25% at the beginning of 2008 to its current targeted rate of 0.25% and purchased sizeable quantities of Agency MBS and Treasury securities. While the credit markets are functioning more normally and liquidity has generally returned, economic activity in the U.S. has remained muted. As noted above, the FOMC has pledged to keep the Federal Funds Target Rate at the historically low target range of 0% to 0.25% until 2014. As economic activity improves, the Federal Reserve may decide to increase the Federal Funds Target Rate. Such an increase would likely increase our funding costs because, as discussed above, our repurchase agreement financing is based on LIBOR, which typically closely tracks the Federal Funds Target Rate. Yield Curve
As of December 31, 2011, the spread between the two-year Treasury security and the ten-year Treasury security was 1.64% versus 2.70% as of December 31, 2010. While our borrowing costs are based on short-term market rates such as LIBOR and the Federal Funds Target Rate, our asset yields more closely correlate with longer-term Treasury rates and longer-term swap rates. As discussed previously, we hedge our exposure to changes in interest rates principally by entering into pay-fixed interest rate swaps. A flattening of the yield curve will generally result in a reduction in value of our interest rate swaps and an increase in value of our MBS. The relationship is not one-to-one, however, and the value of our interest rate swaps have declined in amounts in excess of the increase in our MBS, due primarily to the widening of credit spreads in our MBS investments. This resulted in a decline in our book value from a reduction in AOCI and also resulted in margin calls on our interest rate swaps.
A flattening of the yield curve generally will also result in reduced net interest spread on new investments that we may purchase from reinvestment of prepayments or if we raise additional capital. Despite the flattening of the yield curve, we continue to see attractive investment opportunities to purchase MBS at acceptable yields relative to the cost of financing such investments.
Prepayments and Agency MBS
We experienced favorable prepayment activity on our Agency RMBS throughout most of 2011. We believe this is

32
primarily due to the inability of borrowers to refinance their mortgages. Our average constant prepayment rate, or CPR, for our Agency RMBS during the fourth quarter of 2011 was 24.9% versus 23.9% for the third quarter of 2011, 23.4% for the second quarter of 2011, 21.9% for the first quarter of 2011, and 25.8% for all of 2010. As of December 31, 2011, the weighted average coupon on the mortgage loans underlying our Agency RMBS was 5.07%, while the average for the past twelve months of the 30-year fixed mortgage rate and the 5-year hybrid ARM mortgage rate, as published by Freddie Mac, were 4.45% and 3.31%, respectively. Generally, this type of interest rate environment encourages the average borrower to refinance their mortgage loans at lower rates. However, in many cases, obstacles exist to refinancing, including but not limited to, the lack of borrower’s equity in the underlying real estate and the lack of an acceptable level of income. We believe these obstacles contributed to the limited refinancing of loans in our Agency RMBS portfolio and kept prepayment speeds on our Agency RMBS relatively low during 2011. However, given the continued low level of interest rates, the proposed changes to the Home Affordable Refinance Program ("HARP"), and the commitment by the Federal Reserve to keep long-term rates low through "Operation Twist" (discussed further below), we expect our prepayment speeds to increase in 2012. Our forecasted prepayment speeds on our Agency RMBS for 2012 is currently 28.0% CPR. As discussed earlier, increased prepayments may impact our net interest income by increasing the amortization expense on any investments which we own at premiums to their par balance.
GSE Reform
On February 11, 2011, the Treasury released proposals to limit or potentially wind down the role that Fannie Mae and Freddie Mac play in the mortgage market. Similar proposals to limit or wind down the role of Fannie Mae and Freddie Mac were proposed during 2011 by politicians, housing industry observers and government regulators. Any such proposals, if enacted, may have broad adverse implications for the MBS market and our business, results of operations, and financial condition. Such proposals have been, and we expect them to continue to be, the subject of significant discussion, and it is not yet possible to determine whether such proposals will be enacted.
Financial Regulatory Reform and Other Government Activity
In July 2010 the Dodd-Frank Wall Street Reform and Consumer Protection Act (the “Dodd-Frank Act”) was enacted into law. This legislation aims to restore responsibility and accountability to the financial system. It is unclear how this legislation may impact the borrowing environment, the investing environment for Agency and non-Agency MBS, or interest rate swaps and other derivatives because much of the Dodd-Frank Act’s implementation has not yet been defined by regulators.
In addition to the lowering of the Federal Funds Target Rate discussed above, the Federal Reserve also responded to market instability and economic weakness by purchasing Agency MBS and Treasury securities. From January 2009 through June 2011 the Federal Reserve purchased approximately $1.25 trillion of Agency MBS and $600 billion in Treasury securities of varying maturities. In September 2011, the FOMC announced its intention to sell shorter-term Treasury securities and purchase longer-term Treasury securities in response to weakening economic conditions in a policy operation which has become known as "Operation Twist". The stated intention of the FOMC in Operation Twist is to put downward pressure on longer-term interest rates and to help make broader financial conditions more accommodative. We cannot predict whether, and if so to what extent, the Federal Reserve will continue its purchasing activities in future periods, and we cannot predict the impact of the Federal Reserve's purchasing activities and large holdings of Agency MBS and Treasury securities on financial markets and asset values.
The U.S. government is providing homeowners with assistance in avoiding residential mortgage loan foreclosures. The programs may involve, among other things, the modification of mortgage loans to reduce the principal amount of the loans, the rate of interest payable on the loans, or to extend the payment terms of the loans. While the effect of these programs has not been as extensive as originally expected, the government may change them or add new programs in the future. Recent changes to HARP are designed to support the U.S. housing market and make it easier for borrowers to refinance residential mortgages, which could increase prepayment rates on mortgage loans underlying our investment securities. The impact of these programs may have the effect of increasing prepayment rates and reducing the principal or interest payments on residential mortgage loans held by certain types of borrowers. The effect of such programs for holders of Agency RMBS could be that such holders would experience changes in the anticipated yields of their Agency RMBS due to increased prepayment rates and lower interest and principal payments.

33
RECENT ACCOUNTING PRONOUNCEMENTS
The following Accounting Standards Updates (“ASUs” or “Updates”) have been issued by FASB, but are not effective for this Annual Report on Form 10-K for the year ended December 31, 2011.
In April 2011, FASB issued Accounting Standards Updated ("ASU" or "Update") No. 2011-03 to improve the accounting for repurchase agreements and other agreements that both entitle and obligate a transferor to repurchase or redeem financial assets before their maturity. ASC Topic 860 prescribes when an entity may or may not recognize a sale upon transfer of financial assets subject to repurchase agreements. That determination is based, in part, on whether the entity has maintained effective control over the transferred financial assets. Previously, under ASC Topic 860, the transferor was required to have the ability to repurchase the same or substantially the same assets in order to assert that it has maintained effective control over the transferred assets. ASU No. 2011-03 removes the criterion requiring the transferor to have the ability to repurchase or redeem the financial assets on substantially the agreed terms, and also removes the collateral maintenance implementation guidance related to that criterion. The FASB concluded that the assessment of effective control should focus on a transferor's contractual rights and obligations with respect to transferred financial assets, not on whether the transferor has the practical ability to perform in accordance with those rights or obligations. These amendments are effective for the first interim or annual reporting period beginning on or after December 15, 2011 and are to be applied prospectively. Management has evaluated these amendments and does not believe that they will have a material impact on the Company's financial condition or results of operations.
In May 2011, FASB issued ASU No. 2011-04 to amend ASC Topic 820 to clarify the FASB's intent about the application of existing fair value measurement and disclosure requirements as well as to change certain principles or requirements for measuring fair value or disclosing information about fair value measurements. One of its amendments which will apply to the Company is the disclosure of quantitative information about the unobservable inputs used in a fair value measurement that is categorized within Level 3 of the fair value hierarchy. In addition, the amendments will require more information from the Company about the valuation processes used by the reporting entity for fair value measurements categorized within Level 3 and the sensitivity of those measurements to changes in unobservable inputs. These amendments (and others included in the Update which are not discussed here as they are not applicable to the Company) are effective during interim and annual reporting periods beginning after December 15, 2011 and are to be applied prospectively. Early application by public entities is not permitted. Management has evaluated these amendments and does not believe that they will have a material impact on the Company's financial condition or results of operations.
In June 2011, FASB issued ASU No. 2011-05 to amend ASC Topic 220 regarding the presentation of comprehensive income. The amendment allows an entity the option of presenting the total of comprehensive income, the components of net income, and the components of other comprehensive income in either a single continuous statement of comprehensive income or in two separate but consecutive statements. In both choices, an entity is required to present each component of net income along with total net income, each component of other comprehensive income along with a total for other comprehensive income, and a total amount for comprehensive income. ASU 2011-05 eliminated the option to present the components of other comprehensive income as part of the statement of stockholder's equity. The amendments did not change the items that must be reported in other comprehensive income or when an item of other comprehensive income must be reclassified to net income. These amendments are effective for fiscal years, and interim periods within those years, beginning after December 15, 2011 and should be applied retrospectively. Early adoption is permitted. The Company is already in compliance with these amendments, which do not have a material impact on the Company's financial condition or results of operations.
ASU No. 2011-05 also included an amendment regarding the presentation of reclassification adjustments out of AOCI. However, FASB subsequently issued ASU No. 2011-12 in December 2011 which deferred the effective date for that amendment to allow FASB time to reconsider whether to present on the face of the financial statements the effects of reclassifications out of AOCI on the components of net income and other comprehensive income for all periods presented. ASU No. 2011-12 is effective at the same time as ASU No. 2011-05.
In December 2011, FASB issued ASU No. 2011-11 which amends ASC Topic 210 to require an entity to disclose information about offsetting assets and liabilities and related arrangements to enable users of its financial statements to understand the effect of those arrangements on its financial position. Offsetting, otherwise known as netting, is the presentation of assets and liabilities as a single net amount in the balance sheet. GAAP gives companies the option to present in their consolidated
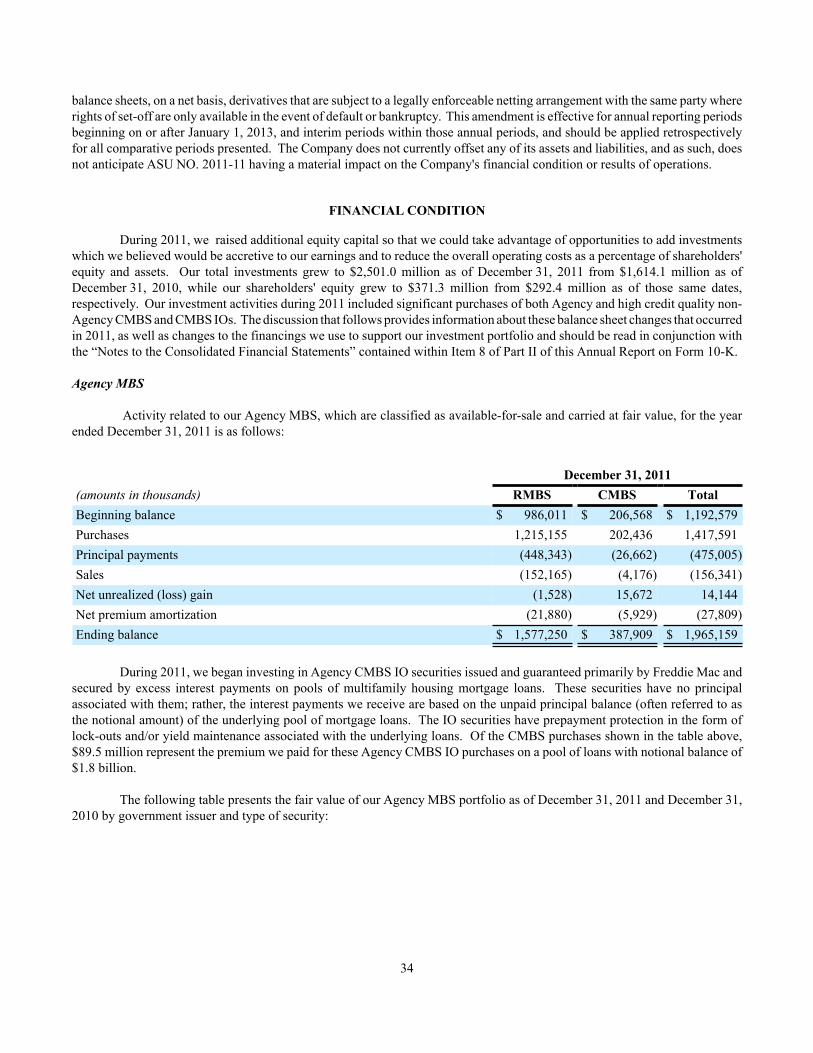
34
balance sheets, on a net basis, derivatives that are subject to a legally enforceable netting arrangement with the same party where rights of set-off are only available in the event of default or bankruptcy. This amendment is effective for annual reporting periods beginning on or after January 1, 2013, and interim periods within those annual periods, and should be applied retrospectively for all comparative periods presented. The Company does not currently offset any of its assets and liabilities, and as such, does not anticipate ASU NO. 2011-11 having a material impact on the Company's financial condition or results of operations.
FINANCIAL CONDITION
During 2011, we raised additional equity capital so that we could take advantage of opportunities to add investments which we believed would be accretive to our earnings and to reduce the overall operating costs as a percentage of shareholders' equity and assets. Our total investments grew to $2,501.0 million as of December 31, 2011 from $1,614.1 million as of December 31, 2010, while our shareholders' equity grew to $371.3 million from $292.4 million as of those same dates, respectively. Our investment activities during 2011 included significant purchases of both Agency and high credit quality non-Agency CMBS and CMBS IOs. The discussion that follows provides information about these balance sheet changes that occurred in 2011, as well as changes to the financings we use to support our investment portfolio and should be read in conjunction with the “Notes to the Consolidated Financial Statements” contained within Item 8 of Part II of this Annual Report on Form 10-K.
Agency MBS
Activity related to our Agency MBS, which are classified as available-for-sale and carried at fair value, for the year ended December 31, 2011 is as follows:
(amounts in thousands)Beginning balancePurchasesPrincipal paymentsSalesNet unrealized (loss) gainNet premium amortizationEnding balance
December 31, 2011RMBS
$ 986,0111,215,155(448,343)(152,165)
(1,528)(21,880)
$ 1,577,250
CMBS$ 206,568
202,436(26,662)(4,176)15,672(5,929)
$ 387,909
Total$ 1,192,579
1,417,591(475,005)(156,341)
14,144(27,809)
$ 1,965,159
During 2011, we began investing in Agency CMBS IO securities issued and guaranteed primarily by Freddie Mac and secured by excess interest payments on pools of multifamily housing mortgage loans. These securities have no principal associated with them; rather, the interest payments we receive are based on the unpaid principal balance (often referred to as the notional amount) of the underlying pool of mortgage loans. The IO securities have prepayment protection in the form of lock-outs and/or yield maintenance associated with the underlying loans. Of the CMBS purchases shown in the table above, $89.5 million represent the premium we paid for these Agency CMBS IO purchases on a pool of loans with notional balance of $1.8 billion.
The following table presents the fair value of our Agency MBS portfolio as of December 31, 2011 and December 31, 2010 by government issuer and type of security:

35
(amounts in thousands)Hybrid ARMsARMsCMBS IOFixed rate
December 31, 2011Fannie Mae$ 835,061
178,0363,459
302,300$ 1,318,856
Freddie Mac$ 379,605
162,79382,20621,699
$ 646,303
Total$ 1,214,666
340,82985,665
323,999$ 1,965,159
December 31, 2010Fannie Mae$ 496,601
198,638—
206,641$ 901,880
Freddie Mac$ 262,878
27,821—?
$ 290,699
Total$ 759,479
226,459—
206,641$ 1,192,579
The following table presents the weighted average coupon (“WAC”) for our Agency MBS based on par value as of December 31, 2011 and December 31, 2010 by weighted average months-to-reset (“MTR”):
(amounts in thousands)MTR:0-12 months13-24 months25-36 monthsOver 36 monthsFixed rate
December 31, 2011
Par Value (1)
$ 321,942384,184142,321618,318288,584
$ 1,755,349
WAC (1) (2)
4.32%5.09%4.78%4.33%5.00%4.64%
December 31, 2010
Par Value
$ 216,420189,841304,713226,329190,584
$ 1,127,887
WAC(3)
3.35%5.50%5.10%3.81%5.41%4.62%
(1) The par value and WAC presented for December 31, 2011 exclude our CMBS IO investments; there were no CMBS IO investments as of December 31, 2010.
(2) As of December 31, 2011, approximately 2% of our Agency ARMs and hybrid ARMs reset based upon the level of six month LIBOR, 89% reset based on the level of one-year LIBOR and 9% reset based on the level of one-year CMT.
(3) As of December 31, 2010, approximately 5% of our Agency ARMs and hybrid ARMs reset based upon the level of six month LIBOR, 92% reset based on the level of one-year LIBOR and 3% reset based on the level of one-year CMT.
Non-Agency MBS
Activity related to our non-Agency MBS, which are classified as available-for-sale and carried at fair value, for the year ended December 31, 2011 is as follows:
(amounts in thousands)Beginning balancePurchasesPrincipal paymentsSalesNet unrealized lossNet discount accretion (premium amortization)Ending balance
December 31, 2011RMBS
$ 15,4087,000
(2,374)(3,765)(1,131)
132$ 15,270
CMBS$ 251,948
182,228(23,350)
—(1,799)(3,201)
$ 405,826
Total$ 267,356
189,228(25,724)(3,765)(2,930)(3,069)
$ 421,096
During 2011, we began investing in non-Agency CMBS IO securities which have similar characteristics as the Agency CMBS IO securities. Of the CMBS purchases shown in the table above, $52.9 million represents the premium we paid for these non-Agency CMBS IO purchases on a pool of loans with a notional balance of $906.2 million. The weighted average months to maturity for non-Agency CMBS as of December 31, 2011 is 64 months. The vintage for 54% of our non-Agency CMBS

36
portfolio is 2009 or later while 17% have vintage dates between 2000 and 2005, and the remainder have vintage dates prior to 2000.
The following table presents the fair value and related unrealized gain (loss) and associated borrowings, including both recourse and non-recourse financings, for our non-Agency MBS portfolio by investment rating as of December 31, 2011:
(amounts in thousands)AAAAAABelow A/Not Rated
Non-Agency RMBS
Fair Value$ 8,878
20171
6,120$ 15,270
UnrealizedGain (Loss)$ (768)
(15)(22)(41)
$ (846)
RelatedBorrowings$ (6,623)
——
(5,572)$ (12,195)
Non-Agency CMBS
Fair Value$ 229,559
78,02494,0154,228
$ 405,826
UnrealizedGain (Loss)
$ 9,5722,255
(3,037)(191)
$ 8,599
RelatedBorrowings$ (195,936)
(64,964)(75,038)
—$ (335,938)
Of the $12.2 million related borrowings shown in the table above for non-Agency RMBS, $5.6 million relate to two non-Agency RMBS which are not rated by any of the rating agencies, however, we felt comfortable financing the purchase of these two non-Agency RMBS using short-term repurchase financing because the weighted average life remaining of these RMBS is less than one year.
The following table presents the geographic diversification of the collateral underlying our non-Agency CMBS by the top 5 states as of December 31, 2011:
(amounts in thousands)FloridaCaliforniaTexasNorth CarolinaNew YorkRemaining states (with no state exceeding 6.0% individually)
Market Valueof Collateral
$ 58,86046,83547,03527,23224,916
205,942$ 410,820
Percentage14.3%11.4%11.4%6.6%6.1%
50.2%100.0%
Derivative Assets and Liabilities
Our volume of derivative instruments, which currently consist entirely of interest rate swap agreements, has increased significantly since December 31, 2010. The notional amount outstanding for our interest rate swap agreements as of December 31, 2011 is $1,092.0 million with a weighted average fixed rate swapped of 1.58% compared to a notional amount outstanding of $345.0 million with a weighted average fixed rate swapped of 1.67% as of December 31, 2010. We use interest rate swaps primarily to hedge our exposure to increases in interest rates resulting from the repurchase agreements we use to fund our investment purchases. As such, we have increased our volume of interest rate swap activity to compensate for the growth in our repurchase agreement borrowings used to fund our investment portfolio.
Since December 31, 2010, we have entered into and designated three of our interest rate swaps as trading instruments. These derivatives are carried on our consolidated balance sheet as a liability with a fair value of $2.5 million as of December 31, 2011. We did not have any derivative instruments that were designated as trading instruments as of December 31, 2010. The changes in fair value for these instruments is recognized immediately in the current period's statement of income which is discussed under "Fair Value Adjustments, Net" within "Results of Operations" of Item 7 of this Annual Report on Form 10-K.
Our remaining interest rate swap agreements are designated as cash flow hedging instruments. As of December 31, 2011, our consolidated balance sheet includes derivative liabilities with a fair value of $25.5 million compared to derivative
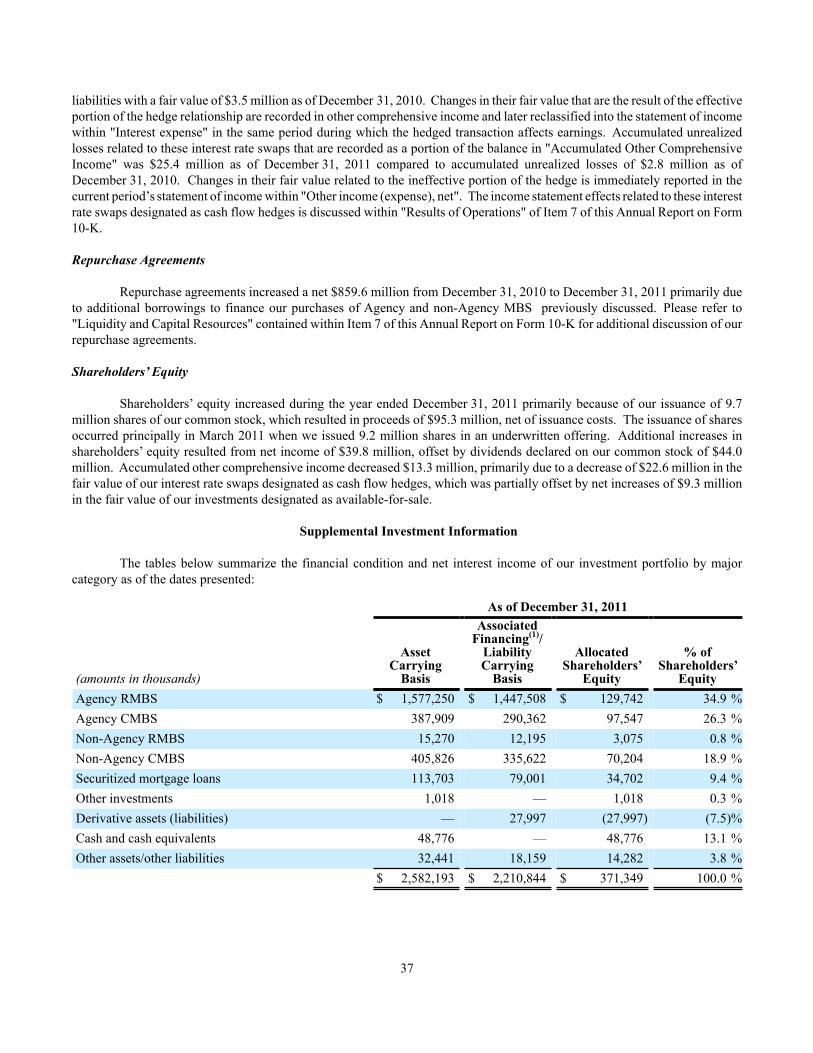
37
liabilities with a fair value of $3.5 million as of December 31, 2010. Changes in their fair value that are the result of the effective portion of the hedge relationship are recorded in other comprehensive income and later reclassified into the statement of income within "Interest expense" in the same period during which the hedged transaction affects earnings. Accumulated unrealized losses related to these interest rate swaps that are recorded as a portion of the balance in "Accumulated Other Comprehensive Income" was $25.4 million as of December 31, 2011 compared to accumulated unrealized losses of $2.8 million as of December 31, 2010. Changes in their fair value related to the ineffective portion of the hedge is immediately reported in the current period’s statement of income within "Other income (expense), net". The income statement effects related to these interest rate swaps designated as cash flow hedges is discussed within "Results of Operations" of Item 7 of this Annual Report on Form 10-K.
Repurchase Agreements
Repurchase agreements increased a net $859.6 million from December 31, 2010 to December 31, 2011 primarily due to additional borrowings to finance our purchases of Agency and non-Agency MBS previously discussed. Please refer to "Liquidity and Capital Resources" contained within Item 7 of this Annual Report on Form 10-K for additional discussion of our repurchase agreements.
Shareholders’ Equity
Shareholders’ equity increased during the year ended December 31, 2011 primarily because of our issuance of 9.7 million shares of our common stock, which resulted in proceeds of $95.3 million, net of issuance costs. The issuance of shares occurred principally in March 2011 when we issued 9.2 million shares in an underwritten offering. Additional increases in shareholders’ equity resulted from net income of $39.8 million, offset by dividends declared on our common stock of $44.0 million. Accumulated other comprehensive income decreased $13.3 million, primarily due to a decrease of $22.6 million in the fair value of our interest rate swaps designated as cash flow hedges, which was partially offset by net increases of $9.3 million in the fair value of our investments designated as available-for-sale.
Supplemental Investment Information
The tables below summarize the financial condition and net interest income of our investment portfolio by major category as of the dates presented:
(amounts in thousands)Agency RMBSAgency CMBSNon-Agency RMBSNon-Agency CMBSSecuritized mortgage loansOther investmentsDerivative assets (liabilities)Cash and cash equivalentsOther assets/other liabilities
As of December 31, 2011
AssetCarrying
Basis$ 1,577,250
387,90915,270
405,826113,703
1,018—
48,77632,441
$ 2,582,193
Associated Financing(1)/
Liability Carrying
Basis$ 1,447,508
290,36212,195
335,62279,001
—27,997
—18,159
$ 2,210,844
AllocatedShareholders’
Equity$ 129,742
97,5473,075
70,20434,7021,018
(27,997)48,77614,282
$ 371,349
% ofShareholders’
Equity34.9 %26.3 %0.8 %
18.9 %9.4 %0.3 %
(7.5)%13.1 %3.8 %
100.0 %

38
(amounts in thousands)Agency RMBSAgency CMBSNon-Agency RMBSNon-Agency CMBSSecuritized mortgage loansOther investmentsDerivative assets (liabilities)Cash and cash equivalentsOther assets/other liabilities
As of December 31, 2010
AssetCarrying
Basis$ 986,011
206,56815,408
251,948152,962
1,229692
18,83615,930
$ 1,649,584
Associated Financing(1)/
Liability Carrying
Basis$ 869,537
150,17812,126
200,328109,119
—3,532
—12,407
$ 1,357,227
AllocatedShareholders’
Equity$ 116,474
56,3903,282
51,62043,8431,229
(2,840)18,8363,523
$ 292,357
% ofShareholders’
Equity39.8 %19.3 %1.1 %
17.7 %15.0 %0.4 %
(1.0)%6.4 %1.2 %
100.0 %
(1) Associated financing related to investments includes repurchase agreements, securitization financing issued to third parties, and TALF financing (the latter two of which are presented on the Company’s balance sheet as “non-recourse collateralized financing”). Associated financing for derivative instruments represents the fair value of the interest rate swap agreements in a liability position.
RESULTS OF OPERATIONS
Year Ended December 31, 2011 Compared to Year Ended December 31, 2010
Net Interest Income – Agency MBS
The following table provides a summary of the results of our Agency MBS investments and related financings by type of collateral for the periods indicated:
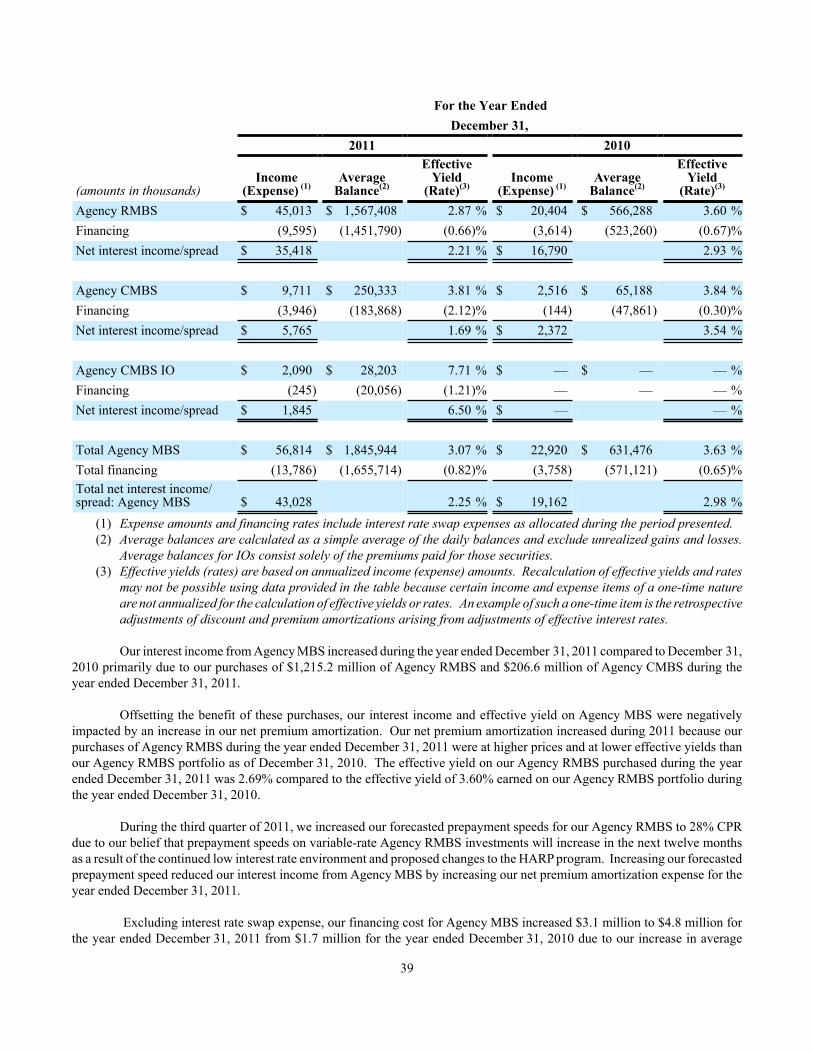
39
(amounts in thousands)Agency RMBSFinancingNet interest income/spread
Agency CMBSFinancingNet interest income/spread
Agency CMBS IOFinancingNet interest income/spread
Total Agency MBSTotal financingTotal net interest income/spread: Agency MBS
For the Year EndedDecember 31,
2011
Income(Expense) (1)
$ 45,013(9,595)
$ 35,418
$ 9,711(3,946)
$ 5,765
$ 2,090(245)
$ 1,845
$ 56,814(13,786)
$ 43,028
AverageBalance(2)
$ 1,567,408(1,451,790)
$ 250,333(183,868)
$ 28,203(20,056)
$ 1,845,944(1,655,714)
Effective Yield
(Rate)(3)
2.87 %(0.66)%2.21 %
3.81 %(2.12)%1.69 %
7.71 %(1.21)%6.50 %
3.07 %(0.82)%
2.25 %
2010
Income (Expense)
(1)
$ 20,404(3,614)
$ 16,790
$ 2,516(144)
$ 2,372
$ ——
$ —
$ 22,920(3,758)
$ 19,162
AverageBalance(2)
$ 566,288(523,260)
$ 65,188(47,861)
$ ——
$ 631,476(571,121)
Effective Yield
(Rate)(3)
3.60 %(0.67)%2.93 %
3.84 %(0.30)%3.54 %
— %— %— %
3.63 %(0.65)%
2.98 %(1) Expense amounts and financing rates include interest rate swap expenses as allocated during the period presented. (2) Average balances are calculated as a simple average of the daily balances and exclude unrealized gains and losses.
Average balances for IOs consist solely of the premiums paid for those securities.(3) Effective yields (rates) are based on annualized income (expense) amounts. Recalculation of effective yields and rates
may not be possible using data provided in the table because certain income and expense items of a one-time nature are not annualized for the calculation of effective yields or rates. An example of such a one-time item is the retrospective adjustments of discount and premium amortizations arising from adjustments of effective interest rates.
Our interest income from Agency MBS increased during the year ended December 31, 2011 compared to December 31, 2010 primarily due to our purchases of $1,215.2 million of Agency RMBS and $206.6 million of Agency CMBS during the year ended December 31, 2011.
Offsetting the benefit of these purchases, our interest income and effective yield on Agency MBS were negatively impacted by an increase in our net premium amortization. Our net premium amortization increased during 2011 because our purchases of Agency RMBS during the year ended December 31, 2011 were at higher prices and at lower effective yields than our Agency RMBS portfolio as of December 31, 2010. The effective yield on our Agency RMBS purchased during the year ended December 31, 2011 was 2.69% compared to the effective yield of 3.60% earned on our Agency RMBS portfolio during the year ended December 31, 2010.
During the third quarter of 2011, we increased our forecasted prepayment speeds for our Agency RMBS to 28% CPR due to our belief that prepayment speeds on variable-rate Agency RMBS investments will increase in the next twelve months as a result of the continued low interest rate environment and proposed changes to the HARP program. Increasing our forecasted prepayment speed reduced our interest income from Agency MBS by increasing our net premium amortization expense for the year ended December 31, 2011.
Excluding interest rate swap expense, our financing cost for Agency MBS increased $3.1 million to $4.8 million for the year ended December 31, 2011 from $1.7 million for the year ended December 31, 2010 due to our increase in average
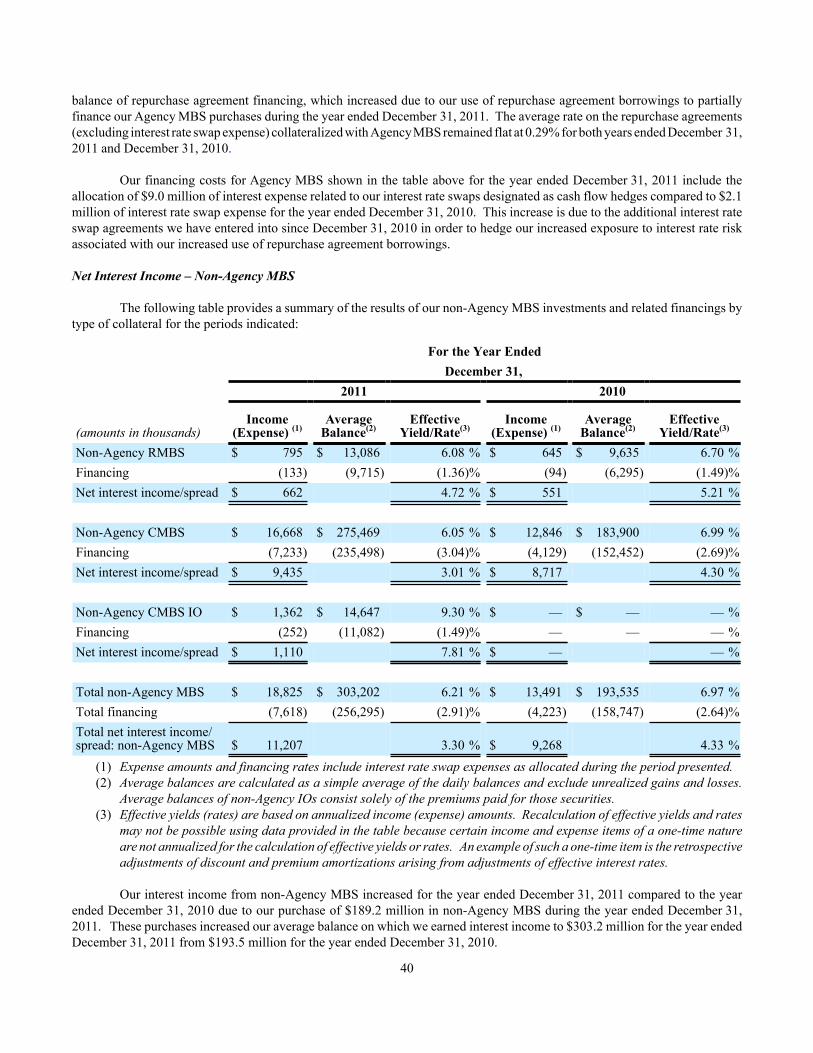
40
balance of repurchase agreement financing, which increased due to our use of repurchase agreement borrowings to partially finance our Agency MBS purchases during the year ended December 31, 2011. The average rate on the repurchase agreements (excluding interest rate swap expense) collateralized with Agency MBS remained flat at 0.29% for both years ended December 31, 2011 and December 31, 2010.
Our financing costs for Agency MBS shown in the table above for the year ended December 31, 2011 include the allocation of $9.0 million of interest expense related to our interest rate swaps designated as cash flow hedges compared to $2.1 million of interest rate swap expense for the year ended December 31, 2010. This increase is due to the additional interest rate swap agreements we have entered into since December 31, 2010 in order to hedge our increased exposure to interest rate risk associated with our increased use of repurchase agreement borrowings.
Net Interest Income – Non-Agency MBS
The following table provides a summary of the results of our non-Agency MBS investments and related financings by type of collateral for the periods indicated:
(amounts in thousands)Non-Agency RMBSFinancingNet interest income/spread
Non-Agency CMBSFinancingNet interest income/spread
Non-Agency CMBS IOFinancingNet interest income/spread
Total non-Agency MBSTotal financingTotal net interest income/spread: non-Agency MBS
For the Year EndedDecember 31,
2011
Income(Expense) (1)
$ 795(133)
$ 662
$ 16,668(7,233)
$ 9,435
$ 1,362(252)
$ 1,110
$ 18,825(7,618)
$ 11,207
AverageBalance(2)
$ 13,086(9,715)
$ 275,469(235,498)
$ 14,647(11,082)
$ 303,202(256,295)
EffectiveYield/Rate(3)
6.08 %(1.36)%4.72 %
6.05 %(3.04)%3.01 %
9.30 %(1.49)%7.81 %
6.21 %(2.91)%
3.30 %
2010
Income(Expense) (1)
$ 645(94)
$ 551
$ 12,846(4,129)
$ 8,717
$ ——
$ —
$ 13,491(4,223)
$ 9,268
AverageBalance(2)
$ 9,635(6,295)
$ 183,900(152,452)
$ ——
$ 193,535(158,747)
EffectiveYield/Rate(3)
6.70 %(1.49)%5.21 %
6.99 %(2.69)%4.30 %
— %— %— %
6.97 %(2.64)%
4.33 %(1) Expense amounts and financing rates include interest rate swap expenses as allocated during the period presented. (2) Average balances are calculated as a simple average of the daily balances and exclude unrealized gains and losses.
Average balances of non-Agency IOs consist solely of the premiums paid for those securities.(3) Effective yields (rates) are based on annualized income (expense) amounts. Recalculation of effective yields and rates
may not be possible using data provided in the table because certain income and expense items of a one-time nature are not annualized for the calculation of effective yields or rates. An example of such a one-time item is the retrospective adjustments of discount and premium amortizations arising from adjustments of effective interest rates.
Our interest income from non-Agency MBS increased for the year ended December 31, 2011 compared to the year ended December 31, 2010 due to our purchase of $189.2 million in non-Agency MBS during the year ended December 31, 2011. These purchases increased our average balance on which we earned interest income to $303.2 million for the year ended December 31, 2011 from $193.5 million for the year ended December 31, 2010.

41
Of the $189.2 million of non-Agency MBS purchases during the year ended December 31, 2011, $52.9 million represents the premiums we paid for non-Agency CMBS IOs which increased our net premium amortization on non-Agency MBS to $3.1 million for the year ended December 31, 2011 compared to $1.4 million for the year ended December 31, 2010. This increased net premium amortization contributed to the 0.76% decrease in our effective yield on our non-Agency MBS for the year ended December 31, 2011 compared to the year ended December 31, 2010. Also contributing to this decrease in effective yield is the average coupon on the remaining $136.3 million non-Agency MBS purchases for the year ended December 31, 2011 was 4.86% compared to the average coupon of 6.97% for non-Agency CMBS for the year ended December 31, 2010.
During the years ended December 31, 2011 and December 31, 2010, our non-Agency MBS portfolio was financed using recourse repurchase agreements and non-recourse securitization and TALF financings. Interest expense from non-recourse financing was $2.5 million for the year ended December 31, 2011 and $2.2 million for the year ended December 31, 2010. Interest expense from recourse financing increased to $2.5 million (excluding interest rate swap expense) for the year ended December 31, 2011 compared to $1.6 million for the year ended December 31, 2010, an increase primarily driven by the increased volume of repurchase agreement borrowings used to finance our 2011 non-Agency MBS purchases. The overall financing rate for non-Agency MBS shown in the table above increased 27 basis points from the year ended December 31, 2010 to the year ended December 31, 2011 because of interest rate swap expense that was allocated to the repurchase agreements collateralized by non-Agency CMBS, which was $2.6 million for the year ended December 31, 2011 compared to $0.4 million for the year ended December 31, 2010.
Net Interest Income – Securitized Mortgage Loans
The following table provides a summary of the results of our securitized mortgage loans and related financing for the periods indicated:
(amounts in thousands)Securitized mortgage loansFinancingNet interest income/spreadProvision for loan losses
For the Year EndedDecember 31,
2011
Income(Expense)
$ 7,615(2,678)
$ 4,937(871)
$ 4,066
AverageBalance (1)
$ 133,198(90,972)
EffectiveYield/Rate(2)
5.70 %(2.94)%2.76 %
2010
Income(Expense)
$ 12,234(6,376)
$ 5,858(1,194)
$ 4,664
AverageBalance (1)
$ 185,807(136,052)
EffectiveYield/Rate(2)
6.58 %(4.62)%1.96 %
(1) Average balance excludes funds held by trustees except proceeds from defeased loans held by trustees.(2) Effective yields (rates) are based on annualized income (expense) amounts. Recalculation of effective yields and rates
may not be possible using data provided in the table because certain income and expense items of a one-time nature are not annualized for the calculation of effective yields or rates. An example of such a one-time item is the retrospective adjustments of discount and premium amortizations arising from adjustments of effective interest rates.
The decrease in interest income on securitized mortgage loans is the result of the lower average balance of the securitized mortgage loans outstanding for the year ended December 31, 2011 compared to the year ended December 31, 2010. These balances have decreased year over year because we are no longer adding mortgage loans to our investment portfolio. Principal payments, including unscheduled payments, were $37.6 million for the year ended December 31, 2011.
Interest income also declined as a result of the decrease in the average yield earned on the securitized mortgage loan portfolio. The primary cause of this decline was related to the average yield on our securitized commercial mortgage loans declining by 94 basis points from 2010 to 2011. This decline is primarily related to an increase in the average balance of commercial mortgage loans on nonaccrual status which was approximately $18.0 million for the year ended December 31, 2011 compared to $12.9 million for the year ended December 31, 2010. The average balance increased due to one delinquent commercial mortgage loan, which was restructured in bankruptcy court subsequent to December 31, 2011. See Note 16 in the
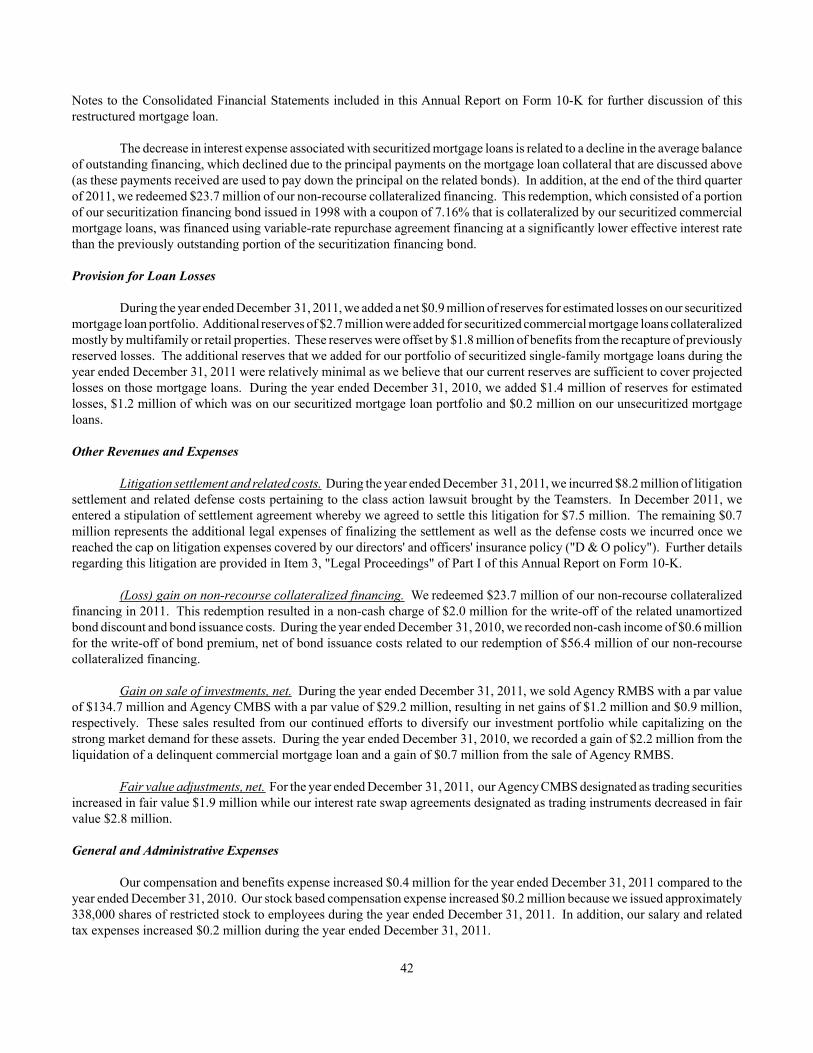
42
Notes to the Consolidated Financial Statements included in this Annual Report on Form 10-K for further discussion of this restructured mortgage loan.
The decrease in interest expense associated with securitized mortgage loans is related to a decline in the average balance of outstanding financing, which declined due to the principal payments on the mortgage loan collateral that are discussed above (as these payments received are used to pay down the principal on the related bonds). In addition, at the end of the third quarter of 2011, we redeemed $23.7 million of our non-recourse collateralized financing. This redemption, which consisted of a portion of our securitization financing bond issued in 1998 with a coupon of 7.16% that is collateralized by our securitized commercial mortgage loans, was financed using variable-rate repurchase agreement financing at a significantly lower effective interest rate than the previously outstanding portion of the securitization financing bond.
Provision for Loan Losses
During the year ended December 31, 2011, we added a net $0.9 million of reserves for estimated losses on our securitized mortgage loan portfolio. Additional reserves of $2.7 million were added for securitized commercial mortgage loans collateralized mostly by multifamily or retail properties. These reserves were offset by $1.8 million of benefits from the recapture of previously reserved losses. The additional reserves that we added for our portfolio of securitized single-family mortgage loans during the year ended December 31, 2011 were relatively minimal as we believe that our current reserves are sufficient to cover projected losses on those mortgage loans. During the year ended December 31, 2010, we added $1.4 million of reserves for estimated losses, $1.2 million of which was on our securitized mortgage loan portfolio and $0.2 million on our unsecuritized mortgage loans.
Other Revenues and Expenses
Litigation settlement and related costs. During the year ended December 31, 2011, we incurred $8.2 million of litigation settlement and related defense costs pertaining to the class action lawsuit brought by the Teamsters. In December 2011, we entered a stipulation of settlement agreement whereby we agreed to settle this litigation for $7.5 million. The remaining $0.7 million represents the additional legal expenses of finalizing the settlement as well as the defense costs we incurred once we reached the cap on litigation expenses covered by our directors' and officers' insurance policy ("D & O policy"). Further details regarding this litigation are provided in Item 3, "Legal Proceedings" of Part I of this Annual Report on Form 10-K.
(Loss) gain on non-recourse collateralized financing. We redeemed $23.7 million of our non-recourse collateralized
financing in 2011. This redemption resulted in a non-cash charge of $2.0 million for the write-off of the related unamortized bond discount and bond issuance costs. During the year ended December 31, 2010, we recorded non-cash income of $0.6 million for the write-off of bond premium, net of bond issuance costs related to our redemption of $56.4 million of our non-recourse collateralized financing.
Gain on sale of investments, net. During the year ended December 31, 2011, we sold Agency RMBS with a par value of $134.7 million and Agency CMBS with a par value of $29.2 million, resulting in net gains of $1.2 million and $0.9 million, respectively. These sales resulted from our continued efforts to diversify our investment portfolio while capitalizing on the strong market demand for these assets. During the year ended December 31, 2010, we recorded a gain of $2.2 million from the liquidation of a delinquent commercial mortgage loan and a gain of $0.7 million from the sale of Agency RMBS.
Fair value adjustments, net. For the year ended December 31, 2011, our Agency CMBS designated as trading securities increased in fair value $1.9 million while our interest rate swap agreements designated as trading instruments decreased in fair value $2.8 million.
General and Administrative Expenses
Our compensation and benefits expense increased $0.4 million for the year ended December 31, 2011 compared to the year ended December 31, 2010. Our stock based compensation expense increased $0.2 million because we issued approximately 338,000 shares of restricted stock to employees during the year ended December 31, 2011. In addition, our salary and related tax expenses increased $0.2 million during the year ended December 31, 2011.

43
Our other general and administrative expenses increased $0.7 million for the year ended December 31, 2011 compared to the year ended December 31, 2010. Increases in our consulting, relocation, and shareholder expenses account for 39%, 20%, and 18%, respectively, of this increase with the remainder resulting from other miscellaneous expenses.
Year Ended December 31, 2010 Compared to Year Ended December 31, 2009
Net Interest Income - Agency MBS
The following table provides a summary of the results of our Agency MBS investments and related financings by type of collateral for the periods indicated:
(amounts in thousands)Agency RMBSFinancingNet interest income/spread
Agency CMBSFinancingNet interest income/spread
Total Agency MBSTotal financingTotal net interest income/spread: Agency MBS
For the Year EndedDecember 31,
2010
Income(Expense) (1)
$ 20,404(3,614)
$ 16,790
$ 2,516(144)
$ 2,372
$ 22,920(3,758)
$ 19,162
AverageBalance(2)
$ 566,288(523,260)
$ 65,188(47,861)
$ 631,476(571,121)
Effective Yield
(Rate)(3)
3.60 %(0.67)%2.93 %
3.84 %(0.30)%3.54 %
3.63 %(0.65)%
2.98 %
2009
Income (Expense)
(1)
$ 20,962(2,847)
$ 18,115
$ ——
$ —
$ 20,962(2,847)
$ 18,115
AverageBalance(2)
$ 492,900(448,279)
$ ——
$ 492,900(448,279)
Effective Yield
(Rate)(3)
4.25 %(0.64)%3.61 %
— %— %— %
4.25 %(0.64)%
3.61 %(1) Expense amounts and financing rates include interest rate swap expenses as allocated during the period presented. (2) Average balances are calculated as a simple average of the daily balances and exclude unrealized gains and losses.(3) Effective yields (rates) are based on annualized income (expense) amounts. Recalculation of effective yields and rates
may not be possible using data provided in the table because certain income and expense items of a one-time nature are not annualized for the calculation of effective yields or rates. An example of such a one-time item is the retrospective adjustments of discount and premium amortizations arising from adjustments of effective interest rates.
Although our average balance of Agency RMBS increased during the year ended December 31, 2010 compared to the year ended December 31, 2009, we experienced a decrease in our net interest income on Agency RMBS due to a decline in the effective interest yield earned during the year ended December 31, 2010. The average yield on Agency RMBS decreased due to decreases in the average coupon to 4.37% for the year ended December 31, 2010 from 4.97% for the year ended December 31, 2009. The lower average coupon reflects our acquisition of newer Agency securities with lower interest rates on the underlying collateral as well as the resetting to lower interest rates on the loans underlying our existing Agency MBS. Additionally, although our total Agency RMBS purchases for the year ended December 31, 2010 were $696.5 million, approximately 74% of those purchases were during the fourth quarter of 2010.
Our net premium amortization, which decreases interest income and the effective rate earned on the securities owned, increased 46.7% to $4.4 million for the year ended December 31, 2010 compared to $3.0 million for the year ended December 31, 2009. This increase in net premium amortization is related to our acquisition of Agency MBS at higher prices since December 31, 2009. In addition, the rate at which we amortized our premiums increased for the first and second quarters of 2010 as a result of the buyouts of delinquent mortgage loans by Fannie Mae and Freddie Mac.
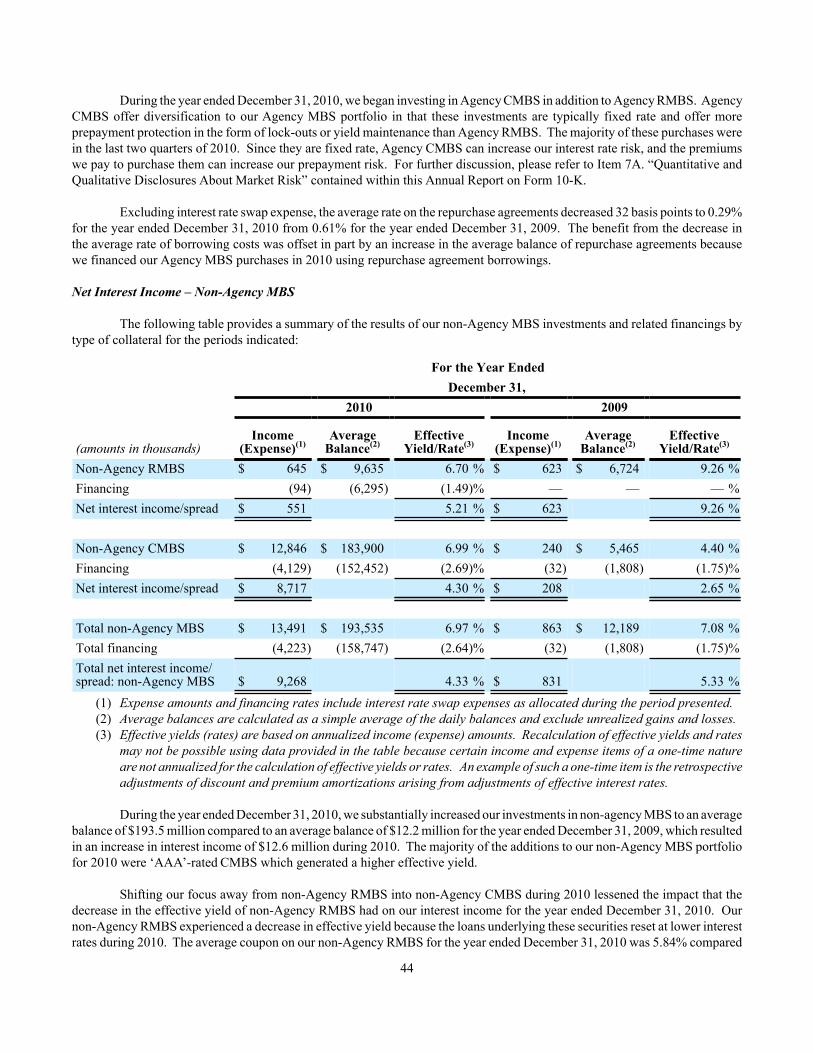
44
During the year ended December 31, 2010, we began investing in Agency CMBS in addition to Agency RMBS. Agency CMBS offer diversification to our Agency MBS portfolio in that these investments are typically fixed rate and offer more prepayment protection in the form of lock-outs or yield maintenance than Agency RMBS. The majority of these purchases were in the last two quarters of 2010. Since they are fixed rate, Agency CMBS can increase our interest rate risk, and the premiums we pay to purchase them can increase our prepayment risk. For further discussion, please refer to Item 7A. “Quantitative and Qualitative Disclosures About Market Risk” contained within this Annual Report on Form 10-K.
Excluding interest rate swap expense, the average rate on the repurchase agreements decreased 32 basis points to 0.29% for the year ended December 31, 2010 from 0.61% for the year ended December 31, 2009. The benefit from the decrease in the average rate of borrowing costs was offset in part by an increase in the average balance of repurchase agreements because we financed our Agency MBS purchases in 2010 using repurchase agreement borrowings.
Net Interest Income – Non-Agency MBS The following table provides a summary of the results of our non-Agency MBS investments and related financings by
type of collateral for the periods indicated:
(amounts in thousands)Non-Agency RMBSFinancingNet interest income/spread
Non-Agency CMBSFinancingNet interest income/spread
Total non-Agency MBSTotal financingTotal net interest income/spread: non-Agency MBS
For the Year EndedDecember 31,
2010
Income(Expense)(1)
$ 645(94)
$ 551
$ 12,846(4,129)
$ 8,717
$ 13,491(4,223)
$ 9,268
AverageBalance(2)
$ 9,635(6,295)
$ 183,900(152,452)
$ 193,535(158,747)
EffectiveYield/Rate(3)
6.70 %(1.49)%5.21 %
6.99 %(2.69)%4.30 %
6.97 %(2.64)%
4.33 %
2009
Income(Expense)(1)
$ 623—
$ 623
$ 240(32)
$ 208
$ 863(32)
$ 831
AverageBalance(2)
$ 6,724—
$ 5,465(1,808)
$ 12,189(1,808)
EffectiveYield/Rate(3)
9.26 %— %
9.26 %
4.40 %(1.75)%2.65 %
7.08 %(1.75)%
5.33 %(1) Expense amounts and financing rates include interest rate swap expenses as allocated during the period presented. (2) Average balances are calculated as a simple average of the daily balances and exclude unrealized gains and losses.(3) Effective yields (rates) are based on annualized income (expense) amounts. Recalculation of effective yields and rates
may not be possible using data provided in the table because certain income and expense items of a one-time nature are not annualized for the calculation of effective yields or rates. An example of such a one-time item is the retrospective adjustments of discount and premium amortizations arising from adjustments of effective interest rates.
During the year ended December 31, 2010, we substantially increased our investments in non-agency MBS to an average balance of $193.5 million compared to an average balance of $12.2 million for the year ended December 31, 2009, which resulted in an increase in interest income of $12.6 million during 2010. The majority of the additions to our non-Agency MBS portfolio for 2010 were ‘AAA’-rated CMBS which generated a higher effective yield.
Shifting our focus away from non-Agency RMBS into non-Agency CMBS during 2010 lessened the impact that the decrease in the effective yield of non-Agency RMBS had on our interest income for the year ended December 31, 2010. Our non-Agency RMBS experienced a decrease in effective yield because the loans underlying these securities reset at lower interest rates during 2010. The average coupon on our non-Agency RMBS for the year ended December 31, 2010 was 5.84% compared

45
to 7.60% for the year ended December 31, 2009.
Non-Agency MBS is financed using recourse repurchase agreements and non-recourse securitization and TALF financings. Interest expense from recourse financing collateralized by non-Agency MBS increased to $1.6 million (excluding interest rate swap expense) for the year ended December 31, 2010 because we financed these security purchases in 2010 using repurchase agreements. The average rate on these repurchase agreements (excluding interest rate swap expense) was 1.53% for the year ended December 31, 2010.
In December 2009, we exercised certain redemption rights and redeemed ‘AAA’ rated non-Agency CMBS that we refinanced through a securitization transaction. As of December 31, 2010, the fair value of these non-Agency CMBS is $16.8 million, and the related financing balance is $14.5 million. In addition, we also purchased ‘AAA’ rated non-Agency CMBS during 2010 using non-recourse TALF financing which is fixed at a weighted average interest rate of 2.73%. The fair value of these non-Agency CMBS is $64.1 million with a financing balance of $50.6 million as of December 31, 2010.
Net Interest Income – Securitized Mortgage Loans
The following table provides a summary of the results of our securitized mortgage loans and related financing for the periods indicated:
(amounts in thousands)Securitized mortgage loansFinancingNet interest income/spreadProvision for loan losses
For the Year EndedDecember 31,
2010Income
Expense)$ 12,234
(6,376)$ 5,858
(1,194)$ 4,664
AverageBalance(1)
$ 185,807(136,052)
EffectiveYield/Rate(2)
6.58 %(4.62)%1.96 %
2009Income
(Expense)$ 17,169
(11,819)$ 5,350
(585)$ 4,765
AverageBalance(1)
$ 233,120(177,760)
EffectiveYield/Rate(2)
7.36 %(5.67)%1.69 %
(1) Average balance excludes funds held by trustees except proceeds from defeased loans held by trustees.(2) Effective yields (rates) are based on annualized income (expense) amounts. Recalculation of effective yields and rates
may not be possible using data provided in the table because certain income and expense items of a one-time nature are not annualized for the calculation of effective yields or rates. An example of such a one-time item is the retrospective adjustments of discount and premium amortizations arising from adjustments of effective interest rates.
The majority of the decrease in interest income on securitized mortgage loans is related to the lower average balance of the securitized mortgage loans outstanding for the year ended December 31, 2010, which decreased approximately $47.3 million compared to the average balance for the year ended December 31, 2009. The decrease in the average balance is primarily related to principal payments received of $55.0 million from December 31, 2009 to December 31, 2010, which includes both scheduled and unscheduled payments, net of amounts received on defeased loans. These balances have decreased year over year because we are no longer adding mortgage loans to our investment portfolio.
Interest income also declined as a result of an approximately 128 basis point decrease in the average yield on the single-family mortgage loan portion of our portfolio to 4.19% for the year ended December 31, 2010 from 5.47% for the year ended December 31, 2009. The average yield on the single-family mortgage loans declined as the interest rates on the underlying ARM loans reset at lower interest rates to a weighted average of 4.92% as of December 31, 2010 from a weighted average of 5.54% as of December 31, 2009.
The decrease in interest expense is related to a decline in the average balance of outstanding financing. The average balance declined due to the principal payments on the mortgage loan collateral noted above as well as the redemption during the third quarter of 2010 of $56.4 million of securitization financing we had issued in 1997. These bonds were collateralized
46
by commercial mortgage loans which were originated by us.
The decrease in the average balance was offset by a decrease of $0.9 million in bond premium amortization (which reduces interest expense) for the year ended December 31, 2010 compared to the year ended December 31, 2009. The decrease in bond premium amortization was primarily related to the redemption of outstanding bonds noted above as well as changes in the estimated future cash flows resulting from changes in the prepayment expectations on the underlying loans securing the collateralized borrowings.
Other Interest-Related Expenses Other interest-related expense during 2009 was related to an obligation under payment agreement we had with a joint venture which was settled in the fourth quarter of 2009.
Provision for Loan Losses
During the year ended December 31, 2010, we added approximately $1.2 million of reserves for estimated losses on our securitized mortgage loan portfolio, all of which was related to our securitized commercial mortgage loans. The reserves we provided during the year ended December 31, 2010 primarily related to a hospitality property in California that became delinquent during the year and had an unpaid principal balance of $2.4 million as of December 31, 2010. We did not provide any additional reserves for our portfolio of securitized single-family mortgage loans during the year ended December 31, 2010, because we believe that our current reserves are sufficient to cover projected losses on our securitized single-family mortgage loans. Considerations included in our estimate for losses on our single-family mortgage loans include the age of these loans, pool insurance, and other credit support. During the year ended December 31, 2009, we added approximately $0.8 million of reserves for estimated losses on our securitized mortgage loan portfolio.
Gain on sale of Investments, net
Gain on sale of investments, net increased by $2.7 million for the year ended December 31, 2010 compared to the year ended December 31, 2009. We recorded a gain of $2.2 million from the liquidation of a delinquent commercial mortgage loan and a gain of $0.7 million from the sale of Agency RMBS during 2010. The majority of the $0.2 million gain on sale of investments, net for the year ended December 31, 2009 resulted primarily from the net gain on sale of equity securities we owned during 2009.
Other Income, net
Other income, net for the year ended December 31, 2010 increased to $2.1 million from $0.1 million for the year ended December 31, 2009. This increase primarily consists of $0.6 million in net premium discounts related to our partial redemption of securitization financing bonds, $0.8 million in fees paid by the guarantor on certain delinquent commercial mortgage loans in connection with the repayment of those loans, and the reversal of $0.4 million in valuation impairment on a non-Agency CMBS. The reversal of the $0.4 million in valuation impairment resulted from the cash receipt received upon liquidation of a delinquent mortgage loan in the non-Agency CMBS.
Other income, net for the year ended December 31, 2009 consisted mostly of $2.4 million of income related to our equity in the income of a joint venture in which we owned a non-controlling interest of less than 50%, offset by an expense of $2.5 million related to our acquisition of all interests remaining in that joint venture prior to 2010.
General and Administrative Expenses
The increase of $2.1 million, or approximately 31.3%, in general and administrative expenses for the year ended December 31, 2010 compared to the year ended December 31, 2009 is primarily due to a $1.3 million increase in salary and benefits expenses, a $0.3 million increase in accounting and legal expenses, and a $0.3 million increase in consulting expenses. Our increased salary and benefits expense is primarily due to a fourth quarter bonus expense accrual of $1.1 million as a result of the attainment of certain key initiatives by management during 2010.

47
LIQUIDITY AND CAPITAL RESOURCES
Our primary sources of liquidity include borrowings under repurchase arrangements, non-recourse collateralized financings, monthly principal and interest payments we receive on our investments, and cash. Additional sources may also include proceeds from the sale of investments, equity offerings, and payments received from counterparties from interest rate swap agreements. We use our liquidity to fund our investment purchases and other operating costs, to pay down borrowings, to make payments to counterparties as required under interest rate swap agreements, and to pay dividends on our common stock. Repurchase Agreements The following table presents certain quantitative information regarding our short-term borrowings (excluding interest rate swap expense) under repurchase agreements for the periods indicated:
($ in thousands)Average balance outstandingWeighted average borrowing rateMaximum balance outstanding
For the Year EndedDecember 31,
2011$ 1,904,489
0.42%$ 2,167,302
2010$ 718,788
0.54%$ 1,256,406
2009$ 470,956
0.67%$ 638,746
Our repurchase agreement borrowings generally have a term of between one and three months and carry a rate of interest based on a spread to an index such as LIBOR. Repurchase agreements are renewable at the discretion of our lenders and do not contain guaranteed roll-over terms. Given the short-term and uncommitted nature of repurchase agreement borrowings, we seek to maintain lending arrangements with multiple counterparties. As of December 31, 2011, we had 24 repurchase agreement counterparties and $2,093.8 million in repurchase agreement borrowings outstanding with 20 of these counterparties with a weighted average borrowing rate of 0.61%. As of December 31, 2010, we had $1,234.2 million outstanding with 14 counterparties with a weighted average borrowing rate of 0.50%. The increase in the borrowing rate is primarily the result of year-end funding pressures as well as developing Eurozone concerns.
The counterparties with whom we have the greatest amounts of equity at risk vary significantly during any given period due to the short-term and uncommitted nature of the repurchase agreement borrowings. The following table presents the five counterparties with whom the Company had the greatest amounts of equity at risk as of December 31, 2011, none of which exceeded 10% of the Company's shareholders' equity:
(amounts in thousands)Bank of America Securities LLCGuggenheim SecuritiesDeutsche Bank SecuritiesNomura Securities International, Inc.Jefferies & Company, Inc.Remaining counterparties
December 31, 2011RepurchaseAgreement
AmountOutstanding$ 226,728
214,695178,284113,122101,354
1,259,610$ 2,093,793
Equity atrisk
$ 34,34111,3439,305
15,50218,09885,930
$ 174,519

48
For our repurchase agreement borrowings, we are required to post margin to the lender (i.e., collateral in excess of the repurchase agreement financing) in order to support the amount of the financing. This excess collateral is often referred to as a "haircut". As of December 31, 2011 our weighted average haircut was 5.5% for repurchase agreements collateralized by Agency MBS and 16.9% for those collateralized by non-Agency MBS. Our weighted average haircuts have not changed materially over any given period. As the collateral pledged is Agency MBS and non-Agency MBS, the value of the collateral can fluctuate with changes in market conditions. If the fair value of the collateral falls below the initial haircut amount, the lender has the right to demand additional collateral to increase the haircut back to the initial amount. These demands are typically referred to as "margin calls". There is no minimum amount of collateral value decline required before the lender could initiate a margin call.
Declines in the value of investments occur for any number of reasons including but not limited to changes in interest rates, changes in ratings on an investment, changes in actual or perceived liquidity of the investment, or changes in overall market risk perceptions. Additionally, values in Agency MBS will also decline from the payment delay feature of those securities. Agency MBS have a payment delay feature whereby Fannie Mae and Freddie Mac announce principal payments on Agency MBS but do not remit the actual principal payments and interest for 20 days in the case of Fannie Mae and 40 days in the case of Freddie Mac. Because Agency MBS are financed with repurchase agreements, the repurchase agreement lender generally makes a margin call for an amount equal to the product of their advance rate on the repurchase agreement and the announced principal payments on the Agency MBS. This causes a temporary use of our resources to meet the margin call until we receive the principal payments and interest 20 to 40 days later.
In order to manage our exposure to margin calls from fluctuations in values of our collateral pledged, we attempt to maintain cash and other liquid instruments in amounts management believes is sufficient to meet any margin call. As of December 31, 2011, we had $134.1 million in unencumbered cash and unpledged Agency MBS. In addition, because non-Agency MBS are less liquid and their fair values are more volatile than Agency MBS, we are more conservative in leveraging non-Agency MBS as evidenced by a lower targeted debt-to-equity ratio as discussed further below. Furthermore, when the Company borrows under repurchase agreements or other recourse borrowings subject to margin calls, it generally borrows less than is permitted by its counterparties under their respective master repurchase agreements. This reduces the number and amount of potential margin calls in the event of a decline in the value of the securities pledged as collateral to the borrowings.
We believe monitoring and maintaining our debt-to-equity ratios is important to managing our liquidity. Our current operating policies provide that recourse borrowings including repurchase agreements used to finance investments will be in the range of four to nine times our invested equity capital. Our current operating policies also limit our overall debt-to-equity ratio to no more than seven times our invested equity capital and up to ten times our equity capital invested in Agency and non-Agency MBS. Our current target is up to nine times our invested equity capital in Agency MBS and up to five times our invested equity capital in non-Agency MBS. We also attempt to maintain unused capacity under our existing repurchase agreement credit lines with multiple counterparties which protects us in the event of a counterparty's failure to renew existing repurchase agreements either with favorable terms or at all.
Our repurchase agreement counterparties require us to comply with various operating and financial covenants. The financial covenants include requirements that we maintain minimum shareholders' equity (usually a set minimum, or a percentage of the highest amount of shareholders' equity since the date of the agreement), maximum decline in shareholders' equity (expressed as a percentage decline in any given period), and limits on maximum leverage (as a multiple of shareholders' equity). Operating requirements include, among other things, requirements to maintain our status as a REIT and to maintain our listing on the NYSE. Violations of one or more of these covenants could result in the lender declaring an event of default which would result in the immediate termination of the repurchase agreement and immediate acceleration of amounts due thereunder. In addition, some of the agreements contain cross default features, whereby default with one lender simultaneously causes default under agreements with other lenders. Violations could also restrict us from paying dividends or engaging in other transactions that are necessary for us to maintain our REIT status.
Management monitors and evaluates on an ongoing basis the impact these customary financial covenants may have on our operating and financing flexibility. Currently, management does not believe we are subject to any covenants that materially restrict our financing flexibility, nor do we believe that we are in danger of breaching any of these covenants.
We are also subject to margin calls on our outstanding interest rate swap agreements. Under our agreements with

49
counterparties, we and the counterparty have the right to require collateral to be posted as credit support for performance under the respective interest rate swap agreement. The collateral typically can be in the form of cash, Agency MBS or Treasury securities. Generally, as interest rates decline we will have to post collateral with the counterparty and as interest rates increase the counterparty will deposit collateral with us (typically when the amount of collateral required to be posted exceeds a certain dollar amount). As of December 31, 2011, we had Agency MBS with a fair value of $29.1 million posted as credit support under the agreements compared to Agency MBS with a fair value of $30.7 million as of September 30, 2011 and Agency MBS with a fair value of $3.2 million and $0.9 million in cash as of December 31, 2010.
While management does not currently anticipate significant changes to our availability or cost of financing in the near-term, the current credit market environment makes it difficult to make long-term predictions. Over the past several years, overall conditions in the general credit markets have improved. However, global credit markets remain fragile, particularly given the continued economic weakness and challenges in the Eurozone. Further changes in economic conditions, heightened risk concerns, or problems with our counterparties could reduce our repurchase agreement availability or negatively affect the terms of available financing. In times of severe market stress, repurchase agreement availability could rapidly be reduced and the terms on which we can borrow could be materially altered as was experienced during the credit crisis in 2008. Competition from other REITs, banks, hedge funds, and the federal government for capacity with our repurchase agreement lenders could also reduce our repurchase agreement availability. While we do not anticipate such events in the near term, a reduction in our borrowing capacity could force us to sell assets in order to repay our lenders or could otherwise restrict our ability to operate our business. Dividends
As a REIT, we are required to distribute to our shareholders amounts equal to at least 90% of our REIT taxable income for each taxable year after consideration of our tax NOL carryforwards. We generally fund our dividend distributions through our cash flows from operations. If we make dividend distributions in excess of our operating cash flows during the period, whether for purposes of meeting our REIT distribution requirements or other strategic reasons, those distributions are generally funded either through our existing cash balances or through the return of principal from our investments (either through repayment or sale). Additionally, we have the option of utilizing our NOL carryforwards to offset taxable income, thereby reducing our REIT distribution requirements. This would allow us to retain capital and increase our liquidity by reducing or eliminating our dividend payout to common shareholders.
Because of our recent public offering which occurred in February 2012, we may have had an ownership shift pursuant to Section 382 of the Code, which may limit our use of our NOL carryforwards in the future to offset our taxable income distribution requirements. We will not be able to ascertain whether this has occurred until all Schedule 13 filings for the first quarter of 2012 are made by our shareholders. Please refer to Item 1A, "Risk Factors" within Part I of this Annual Report on Form 10-K for information regarding the effects of Section 382 ownership shifts on our ability to fully utilize NOL tax carryforwards to offset taxable income distribution requirements.
Off-Balance Sheet Arrangements
As of December 31, 2011, we do not believe that any off-balance sheet arrangements exist that are reasonably likely to have a material current or future effect on our financial condition, results of operations, liquidity or capital resources.
CONTRACTUAL OBLIGATIONS AND COMMITMENTS
The following table summarizes our contractual obligations by payment due date as of December 31, 2011:

50
(amounts in thousands)
Contractual Obligations:(1)
Repurchase agreements (2)
Securitization financing (2) (3)
TALF financing (2) (3)
Operating lease obligationsTotal
Payments due by periodTotal
$ 2,093,79333,92837,672
335$ 2,165,728
< 1 year
$ 2,093,7936,109
—119
$ 2,100,021
1-3 years
$ —17,35237,672
216$ 55,240
3-5 years
$ —6,214
——
$ 6,214
> 5 years
$ —4,253
——
$ 4,253(1) As the master servicer for certain of the series of non-recourse securitization financing securities which we have issued,
and certain loans which have been securitized but for which we are not the master servicer, we have an obligation to advance scheduled principal and interest on delinquent loans in accordance with the underlying servicing agreements should the primary servicer of the loan fail to make such advance. Because such advance amounts are generally repaid in the same month as they are made or shortly thereafter, the contractual obligation with respect to these advances is excluded from the above table. The outstanding servicing advances were $0.2 million as of December 31, 2011 and December 31, 2010.
(2) Amounts presented exclude interest on the related obligations.(3) Represents financing that is non-recourse to us as the debt is payable solely from loans and securities pledged as
collateral. Payments due by period were estimated based on the principal repayments forecasted for the underlying loans and securities, substantially all of which is used to repay the associated financing outstanding.
In addition, we have contractual commitments under interest rate swap agreements as of December 31, 2011 for which we are contractually required to make interest payments at a weighted average fixed rate of 1.58% but receive variable interest rate payments based on various LIBOR rates. These agreements are for a total notional amount of $1,092.0 million and have a weighted average term remaining of 36 months.
FORWARD-LOOKING STATEMENTS
Certain written statements in this Annual Report on Form 10-K that are not historical facts constitute “forward-looking statements” within the meaning of Section 27A of the 1933 Act and Section 21E of the Exchange Act. Statements in this report addressing expectations, assumptions, beliefs, projections, future plans and strategies, future events, developments that we expect or anticipate will occur in the future, and future operating results are forward-looking statements. Forward-looking statements are based upon management’s beliefs, assumptions, and expectations as of the date of this report regarding future events and operating performance, taking into account all information currently available to us, and are applicable only as of the date of this report. Forward-looking statements generally can be identified by use of words such as “believe”, “expect”, “anticipate”, “estimate”, “plan” “may”, “will”, “intend”, “should”, “could” or similar expressions. We caution readers not to place undue reliance on our forward-looking statements, which are not historical facts and may be based on projections, assumptions, expectations, and anticipated events that do not materialize. Except as required by law, we are not obligated to, and do not intend to, update or revise any forward-looking statement whether as a result of new information, future events, or otherwise.
We make forward-looking statements in this Annual Report on Form 10-K regarding:
• Our business and investment strategy including investing proceeds of equity offerings and our ability to generate acceptable risk-adjusted returns;
• Our financing and hedging strategy, including financing initiatives to support portfolio growth;• Our investment portfolio composition and target investments;• Our investment portfolio performance, including the value and yields of our investment portfolio;• Our liquidity and ability to access financing, and the anticipated availability and cost of financing;• Our use of our tax NOL carryfoward;• Market, industry and economic trends; and• Interest rates.
51
Forward-looking statements are inherently subject to risks, uncertainties and other factors that could cause our actual results to differ materially from historical results or from any results expressed or implied by such forward-looking statements. Not all of these risks and other factors are known to us. New risks and uncertainties arise over time, and it is not possible to predict those events or how they may affect us. The projections, assumptions, expectations or beliefs upon which the forward-looking statements are based can also change as a result of these risks or other factors. If such a risk or other factor materializes in future periods, our business, financial condition, liquidity and results of operations may vary materially from those expressed or implied in our forward-looking statements.
While it is not possible to identify all factors, some of the factors that may cause actual results to differ from historical results or from any results expressed or implied by forward-looking statements, or that may cause our projections, assumptions, expectations or beliefs to change, include the following:
• the risks and uncertainties referenced in this Annual Report on Form 10-K, particularly those set forth under Item 1A. “Risk Factors”;
• our ability to find suitable reinvestment opportunities;• changes in economic conditions;• changes in interest rates and interest rate spreads;• our investment portfolio performance particularly as it relates to cash flow, prepayment rates and credit
performance;• the cost and availability of financing;• the cost and availability of new equity capital;• changes in our use of leverage;• the quality of performance of third-party servicer providers of our loans and loans underlying our securities; • the level of defaults by borrowers on loans we have securitized;• changes in our industry;• increased competition;• changes in government regulations affecting our business;• government initiatives to support the U.S financial system and U.S. housing and real estate markets;• GSE reform or other government policies and actions; and• an ownership shift under Section 382 of the Code that impacts the use of our tax NOL carryforward.
CRITICAL ACCOUNTING ESTIMATES
The discussion and analysis of our financial condition and results of operations are based in large part upon our consolidated financial statements, which have been prepared in accordance with GAAP. The preparation of the financial statements requires management to make estimates and assumptions that affect the reported amounts of assets and liabilities and disclosure of contingent assets and liabilities at the date of the financial statements and the reported amounts of revenue and expenses during the reported period. Actual results may differ from the estimated amounts we have recorded.
Critical accounting policies are defined as those that are reflective of significant judgments or uncertainties, and which may result in materially different results under different assumptions and conditions, or the application of which may have a material impact on our financial statements.
Amortization of Investment Premiums. We amortize premiums and accrete discounts associated with the purchase of our investment securities into interest income over the projected lives of our securities, including contractual payments and estimated prepayments, using the effective yield method in accordance with ASC Topic 310-20. Estimates and judgments related to future levels of mortgage prepayments are critical to this determination, and they are difficult for management to predict. Mortgage prepayment expectations can change based on how changes in current and projected interest rates impact a borrower's likelihood of refinancing as well as other factors, including but not limited to real estate prices, borrowers' credit quality, changes in the stringency of loan underwriting practices, and lending industry capacity constraints. In addition, further modifications to existing programs such as HARP, or the implementation of new programs can have a significant impact on the rate of prepayments. Further GSE buyouts of loans in imminent risk of default, loans that have been modified, or loans that have defaulted will generally be reflected as prepayments on our securities and increase the uncertainty around management's estimates.

52
We estimate long-term prepayment rates on our investments using a third-party service and market data. The third-party service estimates prepayment rates using models that incorporate the forward yield curve, current mortgage rates and characteristics of the outstanding loans, such as loan age and current interest rates. We review the third-party service estimates and compare the results to any available market consensus prepayment speeds. We also consider historical prepayment rates and current market conditions to validate the reasonableness of the prepayment rates estimated by the third-party service and, based on management's judgment, we may make adjustments if deemed necessary. Actual and anticipated prepayment experience is reviewed quarterly and effective yields are recalculated when differences arise between the previously estimated future prepayments and the amounts actually received plus current anticipated future prepayments.
Other-than-Temporary Impairments. When the fair value of an available-for-sale security is less than its amortized cost as of the reporting date, the security is considered impaired. We assess our securities for impairment on at least a quarterly basis and determine if the impairments are either temporary or "other-than-temporary" in accordance with ASC Topic 320-10. Accounting literature does not define what it considers an other-than-temporary impairment ("OTTI") to be; however, it does state that an OTTI does not mean permanent impairment. The literature does provide some examples of factors which may be indicative of an OTTI, such as: (a) the length of time and extent to which market value has been less than cost; (b) the financial condition and near-term prospects of the issuer; and (c) the intent and ability of the holder to retain its investment in the issuer for a period of time sufficient to allow for any anticipated recovery in market value.
We assess our ability to hold any Agency MBS or non-Agency MBS with an unrealized loss until the recovery in its value. This assessment is based on the amount of the unrealized loss and significance of the related investment as well as our current leverage and anticipated liquidity. Although the government-sponsored entities ("GSEs") Fannie Mae and Freddie Mac are not explicitly backed by the full faith and credit of the United States, given their guarantee as well as the credit quality inherent in Agency MBS, we do not consider any of the unrealized losses on our Agency MBS to be credit-related. For our non-Agency MBS, we review the credit ratings of these MBS and the seasoning of the mortgage loans collateralizing these securities as well as the estimated future cash flows which include any projected losses in order to evaluate whether we believe any portion of the unrealized loss at the reporting date is related to credit losses.
The determination as to whether an OTTI exists as well as its amount is subjective, as such determinations are based not only on factual information available at the time of assessment but also on management’s estimates of future performance and cash flow projections. As a result, the timing and amount of OTTIs may constitute material estimates that are susceptible to significant change. Our expectations with respect to our securities in an unrealized loss position may change over time, given, among other things, the dynamic nature of markets and other variables. For example, although we believe that the conservatorship of Fannie Mae and Freddie Mac has further strengthened their credit worthiness, there can be no assurance that these actions will be adequate for their needs. Accordingly, if these government actions are inadequate and the GSEs continue to suffer losses or cease to exist, our view of the credit worthiness of our Agency MBS could materially change, which may affect our assessment of OTTI for Agency MBS in future periods. Future sales or changes in our expectations with respect to Agency or non-Agency securities in an unrealized loss position could result in us recognizing other-than-temporary impairment charges or realizing losses on sales of MBS in the future.
Allowance for Loan Losses. An allowance for loan losses has been estimated and established for currently existing and probable losses for mortgage loans that are considered impaired. Provisions made to increase the allowance are charged as a current period expense. Commercial mortgage loans are secured by income-producing real estate and are evaluated individually for impairment when the debt service coverage ratio on the mortgage loan is less than 1:1 or when the mortgage loan is delinquent. An allowance may be established for a particular impaired commercial mortgage loan. Commercial mortgage loans not evaluated for individual impairment or not deemed impaired are evaluated for a general allowance. Certain of the commercial mortgage loans are covered by mortgage loan guarantees that limit the Company’s exposure on these mortgage loans. Single-family mortgage loans are considered homogeneous and are evaluated on a pool basis for a general allowance.
We consider various factors in determining our specific and general allowance requirements. Such factors include whether a loan is delinquent, our historical experience with similar types of loans, historical cure rates of delinquent loans, and historical and anticipated loss severity of the mortgage loans as they are liquidated. The factors may differ by mortgage loan type (e.g., single-family versus commercial) and collateral type (e.g., multifamily versus office property). The allowance for loan losses is evaluated and adjusted periodically by management based on the actual and estimated timing and amount of probable credit losses as well as industry loss experience.
53
Derivatives. As required by ASC Topic 815, we record all derivatives on our balance sheet at fair value. The accounting for changes in the fair value of each derivative depends on whether we designate the derivative as a trading position or as a hedging position for a financial instrument or forecasted transaction. If we designate a derivative as a trading position, changes in its fair value are immediately recognized in the current period’s consolidated statement of income as trading income or loss. If we designate a derivative as a hedging position and we satisfy certain criteria established within ASC Topic 815, then we may apply hedge accounting to record changes in the derivative’s fair value. Hedge accounting involves evaluating the effectiveness of the hedge against the financial instrument or transaction being hedged. The ineffective portion of the hedge relationship is immediately recognized in the current period’s statement of income as a portion of other income (expense) while the effective portion of the hedge relationship is reported in accumulated other comprehensive income (“AOCI”) and later reclassified into the statement of income as a portion of interest expense in the same period during which the hedged financial instrument or transaction affects earnings. If our management decides to terminate any or all derivatives designated as hedging positions or if our management decides to sell or terminate the underlying financial instruments being hedged, any changes in fair value of the associated derivatives recorded in other comprehensive income at the time of termination will be recognized in that period’s statement of income. In addition, our interest rate agreements contain covenants which require us to maintain a minimum level of equity and earnings as well as maintain our REIT status. If we breach any of these covenants, our counterparties will be allowed to immediately terminate any interest rate agreement they have with us. At the time of this termination, any changes in fair value of the derivatives recorded in other comprehensive income will be recognized in that period’s statement of income.
Fair Value. As defined in ASC Topic 820, the fair value of a financial instrument is the exchange price in an orderly transaction, that is not a forced liquidation or distressed sale, between market participants to sell an asset or transfer a liability in the market in which the reporting entity would transact for the asset or liability, that is, the principal or most advantageous market for the asset/liability. The transaction to sell the asset or transfer the liability is a hypothetical transaction at the measurement date, considered from the perspective of a market participant that holds the asset/liability. ASC Topic 820 provides a consistent definition of fair value which focuses on exit price and prioritizes, within a measurement of fair value, the use of market-based inputs over entity-specific inputs. In addition, ASC Topic 820 provides a framework for measuring fair value and establishes a three-level hierarchy for fair value measurements based upon the transparency of inputs to the valuation of an asset or liability as of the measurement date.
The three levels of valuation hierarchy established by ASC Topic 820 are as follows:
• Level 1 — Inputs are unadjusted, quoted prices in active markets for identical assets or liabilities at the measurement date. Our investments included in Level 1 fair value generally are equity securities listed in active markets.
• Level 2 — Inputs (other than quoted prices included in Level 1) are either directly or indirectly observable for the asset or liability through correlation with market data at the measurement date and for the duration of the instrument’s anticipated life. Fair valued assets and liabilities that are generally included in this category are Agency MBS, which are valued based on the average of multiple dealer quotes that are active in the Agency MBS market, and interest rate swaps, which are valued using a third-party pricing service, and the valuations are tested with internally developed models that apply readily observable market variables.
• Level 3 — Inputs reflect management’s best estimate of what market participants would use in pricing the asset or liability at the measurement date. Consideration is given to the risk inherent in the valuation technique and the risk inherent in the inputs to the model. Generally, assets and liabilities carried at fair value and included in this category are non-Agency MBS, delinquent property tax receivables and the obligation under payment agreement liability.
Estimates of fair value for financial instruments are based primarily on management’s judgment. Since the fair value of our financial instruments is based on estimates, actual fair values recognized may differ from those estimates recorded in the consolidated financial statements.

54
ITEM 7A. QUANTITATIVE AND QUALITATIVE DISCLOSURES ABOUT MARKET RISK
We seek to manage various risks inherent in our business strategy, which include interest rate, prepayment, reinvestment, market value, credit, and liquidity risks. We do not seek to avoid risk completely, but rather, we attempt to manage these risks while earning an acceptable risk-adjusted return for our shareholders.
Interest Rate Risk
Investing in interest-rate sensitive investments on a leveraged basis subjects us to interest rate risk because the interest rates we pay on associated borrowings used to finance our investments could rise higher or more quickly than the interest rates we receive on our investments. Interest-rate risk applies to both fixed-rate and adjustable-rate investments. The following section discusses the interest rate risks inherent in our business model with respect to our investment and financing activities.
Interest Rate Reset Risk. The rates on our borrowings are based primarily on LIBOR and will generally reset on a more frequent basis than the interest rates on our investments. During a period of rising short-term interest rates, our net interest income will generally decrease because the interest rates on our borrowings may reset at a higher interest rate more quickly than the interest rates on our investments. Conversely, in a period of falling short-term interest rates, our net interest income will typically increase. Any increase or decrease in our net interest income for at least a portion of our investment portfolio may be temporary as the yields on Agency ARMs and securitized adjustable-rate mortgage loans adjust to new interest rates after a lag period.
Net interest income may be impacted by the proceeds or costs of derivatives designated as hedging instruments such as interest rate swap or cap agreements. We enter into these agreements with the intention of hedging our exposure to rising costs of our borrowings from future interest rate increases. Interest rate swap agreements generally result in interest savings in a rising interest rate environment when the current market interest rate we receive on the swap (which generally is equal to one-month LIBOR) rises higher than the stated fixed rate we pay on the notional amount for each interest rate swap agreement. Alternatively, a declining or stable interest rate environment generally results in interest expense equal to the difference between the stated fixed rate we pay less the current market interest rate we receive.
The table below sets forth the nature and time frames for the prospective reset of interest rates on our investments and on our borrowings as of December 31, 2011. For borrowings, this table includes the impact of our interest rate swaps designated as cash flow hedging instruments, but excludes future changes to our portfolio and the potential impact of prepayments on our investments.
(amounts in thousands)Fixed RateAdjustable Rate:
0-12 months13-24 months25-36 months37-60 monthsOver 60 months
Total
InvestmentsAmounts (1)
$ 890,467
$ 390,199412,555151,082486,722172,450
$ 2,503,475
Percent35.6%
15.6%16.5%6.0%
19.4%6.9%
100.0%
BorrowingsAmounts
$ 52,357
$ 1,197,331—
465,000360,00090,000
$ 2,164,688
Percent2.4%
55.3%
—%21.5%16.6%4.2%
100.0%(1) The investment amount represents the fair value of the related securities and amortized cost basis of the related loans,
excluding any related allowance for loan losses.
Interest Rate Cap Risk. Our ARM MBS have interest rates which are predominantly based upon six-month and one-year LIBOR, and generally contain periodic (interim) or lifetime interest rate caps which often limit the amount by which the interest rate may reset. Periodic caps on our investments typically range from 1-5% annually, and lifetime caps are typically
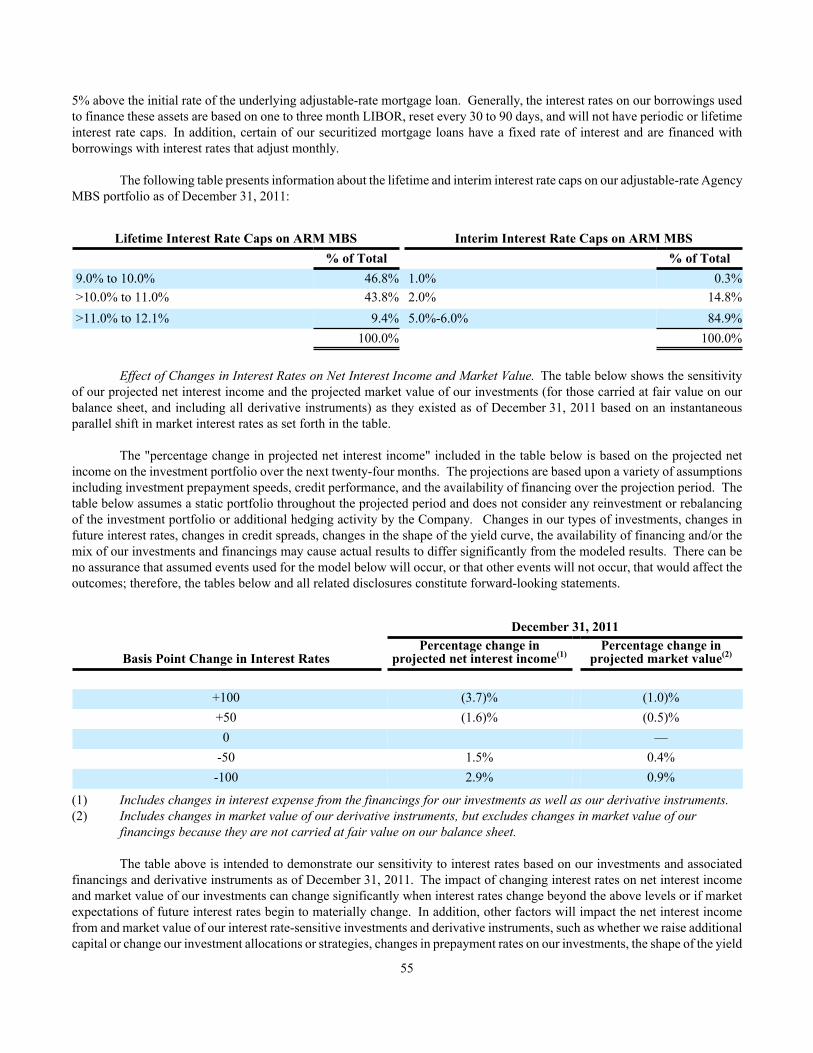
55
5% above the initial rate of the underlying adjustable-rate mortgage loan. Generally, the interest rates on our borrowings used to finance these assets are based on one to three month LIBOR, reset every 30 to 90 days, and will not have periodic or lifetime interest rate caps. In addition, certain of our securitized mortgage loans have a fixed rate of interest and are financed with borrowings with interest rates that adjust monthly.
The following table presents information about the lifetime and interim interest rate caps on our adjustable-rate Agency MBS portfolio as of December 31, 2011:
Lifetime Interest Rate Caps on ARM MBS 9.0% to 10.0%>10.0% to 11.0%>11.0% to 12.1%
% of Total46.8%43.8%9.4%
100.0%
Interim Interest Rate Caps on ARM MBS 1.0%2.0%5.0%-6.0%
% of Total0.3%
14.8%84.9%
100.0%
Effect of Changes in Interest Rates on Net Interest Income and Market Value. The table below shows the sensitivity of our projected net interest income and the projected market value of our investments (for those carried at fair value on our balance sheet, and including all derivative instruments) as they existed as of December 31, 2011 based on an instantaneous parallel shift in market interest rates as set forth in the table.
The "percentage change in projected net interest income" included in the table below is based on the projected net income on the investment portfolio over the next twenty-four months. The projections are based upon a variety of assumptions including investment prepayment speeds, credit performance, and the availability of financing over the projection period. The table below assumes a static portfolio throughout the projected period and does not consider any reinvestment or rebalancing of the investment portfolio or additional hedging activity by the Company. Changes in our types of investments, changes in future interest rates, changes in credit spreads, changes in the shape of the yield curve, the availability of financing and/or the mix of our investments and financings may cause actual results to differ significantly from the modeled results. There can be no assurance that assumed events used for the model below will occur, or that other events will not occur, that would affect the outcomes; therefore, the tables below and all related disclosures constitute forward-looking statements.
Basis Point Change in Interest Rates
+100+50
0-50-100
December 31, 2011Percentage change in
projected net interest income(1)
(3.7)%(1.6)%
1.5%2.9%
Percentage change in projected market value(2)
(1.0)%(0.5)%
—0.4%0.9%
(1) Includes changes in interest expense from the financings for our investments as well as our derivative instruments.(2) Includes changes in market value of our derivative instruments, but excludes changes in market value of our
financings because they are not carried at fair value on our balance sheet.
The table above is intended to demonstrate our sensitivity to interest rates based on our investments and associated financings and derivative instruments as of December 31, 2011. The impact of changing interest rates on net interest income and market value of our investments can change significantly when interest rates change beyond the above levels or if market expectations of future interest rates begin to materially change. In addition, other factors will impact the net interest income from and market value of our interest rate-sensitive investments and derivative instruments, such as whether we raise additional capital or change our investment allocations or strategies, changes in prepayment rates on our investments, the shape of the yield

56
curve, market expectations as to future interest rate changes and other market conditions. Accordingly, interest income would likely differ from that shown above, and such difference might be material.
Prepayment and Reinvestment Risk
Prepayment risk is the risk of an early, unscheduled return of principal on an investment. We are subject to prepayment risk from premiums paid on investments which we acquire. In general, purchase premiums on our investments are amortized as a reduction in interest income using the effective yield method under GAAP, adjusted for the actual and anticipated prepayment activity of the investment. An increase in the actual or expected rate of prepayment will typically accelerate the amortization of purchase premiums, thereby reducing the yield/interest income earned on such assets.
The majority of our prepayment risk results from our RMBS securities. The loans underlying our CMBS and CMBS IO securities generally have prepayment protection provisions, such as prepayment lock-outs or yield maintenance payment requirements. These provisions create an economic disincentive for the loans to prepay, thereby reducing the prepayments on the related securities, and compensate us in the event that there are prepayments. Therefore amortization of premiums on CMBS and CMBS IO securities is generally stable from period to period. There are no prepayment protections if the loan defaults.
The following table discloses the net premium (discount) by months until interest rate reset as well as the net premium (discount) as a percentage of par value (or notional value in the case of CMBS IO) for Agency and non-Agency MBS in our investment portfolio as of December 31, 2011:
(amounts in thousands)0-12 months to resetGreater than 12 months to resetFixed rate
Total premium (discount), netPar/notional balancePremium (discount) as a % ofpar value
Agency
RMBS$ 15,338
70,150(17)
$ 85,471$ 1,488,397
5.7%
CMBS$ —
—21,627
$ 21,627$ 266,952
8.1%
CMBS IO$ —
—86,358
$ 86,358$ 1,813,096
4.8%
Non-Agency
RMBS$ (540)
—(463)
$ (1,003)$ 17,119
(5.9)%
CMBS$ —
—(13,865)
$ (13,865)$ 359,853
(3.9)%
CMBS IO$ —
—51,239
$ 51,239$ 906,202
5.7%
We seek to manage our prepayment risk by diversifying our investments, seeking investments which we believe will have superior prepayment performance, and investing in securities which have some sort of prepayment prohibition or yield maintenance (as is the case with CMBS and CMBS IO).
We are also subject to reinvestment risk as a result of the prepayment, repayment or sale of our investments. Yields on assets in which we invest now are generally lower than yields on existing assets that we may sell or which may be repaid, due to lower overall interest rates and more competition for these as investment assets. As a result, our interest income may decline in the future, thereby reducing earnings per share. In order to maintain our investment portfolio size and our earnings, we need to reinvest our capital into new interest-earning assets. If we are unable to find suitable reinvestment opportunities, interest income on our investment portfolio and investment cash flows could be negatively impacted.
Credit Risk
Credit risk is the risk that we will not receive all contractual amounts due on investments that we have purchased or funded due to default by the borrower or due to a deficiency in proceeds from the liquidation of the collateral securing the obligation. To mitigate credit risk, certain of our investments, such as Agency MBS and portions of our securitized mortgage loan portfolio, contain a guaranty of payment from third parties. For example, our Agency MBS have credit risk to the extent that Fannie Mae or Freddie Mac fails to remit payments on these MBS for which they have issued a guaranty of payment. In addition, certain of our securitized mortgage loans have “pool” guarantees by which certain parties provide guarantees of repayment on pools of loans up to a limited amount. The following tables present information as of December 31, 2011 and
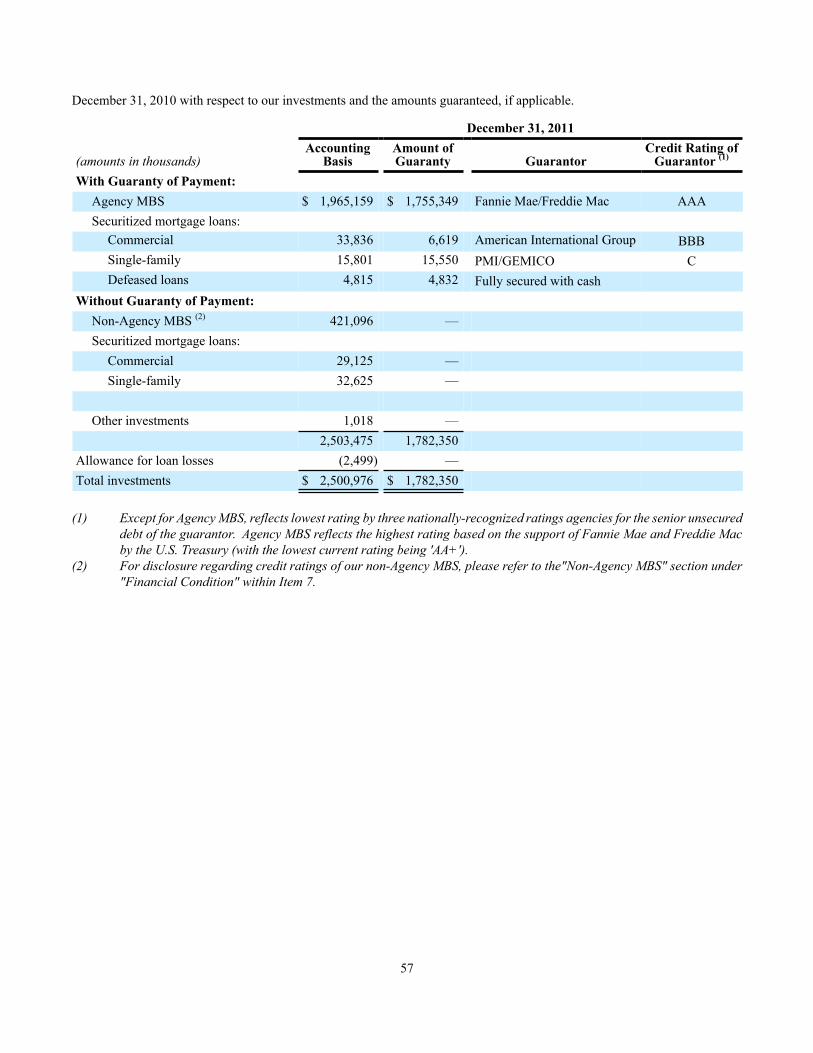
57
December 31, 2010 with respect to our investments and the amounts guaranteed, if applicable.
(amounts in thousands)With Guaranty of Payment:
Agency MBSSecuritized mortgage loans:
CommercialSingle-familyDefeased loans
Without Guaranty of Payment:Non-Agency MBS (2)
Securitized mortgage loans:CommercialSingle-family
Other investments Allowance for loan lossesTotal investments
December 31, 2011Accounting
Basis $ 1,965,159
33,83615,8014,815
421,096
29,12532,625
1,0182,503,475
(2,499)$ 2,500,976
Amount ofGuaranty
$ 1,755,349
6,619
15,5504,832
—
——
—1,782,350
—$ 1,782,350
Guarantor Fannie Mae/Freddie Mac American International GroupPMI/GEMICOFully secured with cash
Credit Rating of Guarantor (1)
AAA
BBB
C
(1) Except for Agency MBS, reflects lowest rating by three nationally-recognized ratings agencies for the senior unsecured
debt of the guarantor. Agency MBS reflects the highest rating based on the support of Fannie Mae and Freddie Mac by the U.S. Treasury (with the lowest current rating being 'AA+').
(2) For disclosure regarding credit ratings of our non-Agency MBS, please refer to the"Non-Agency MBS" section under "Financial Condition" within Item 7.
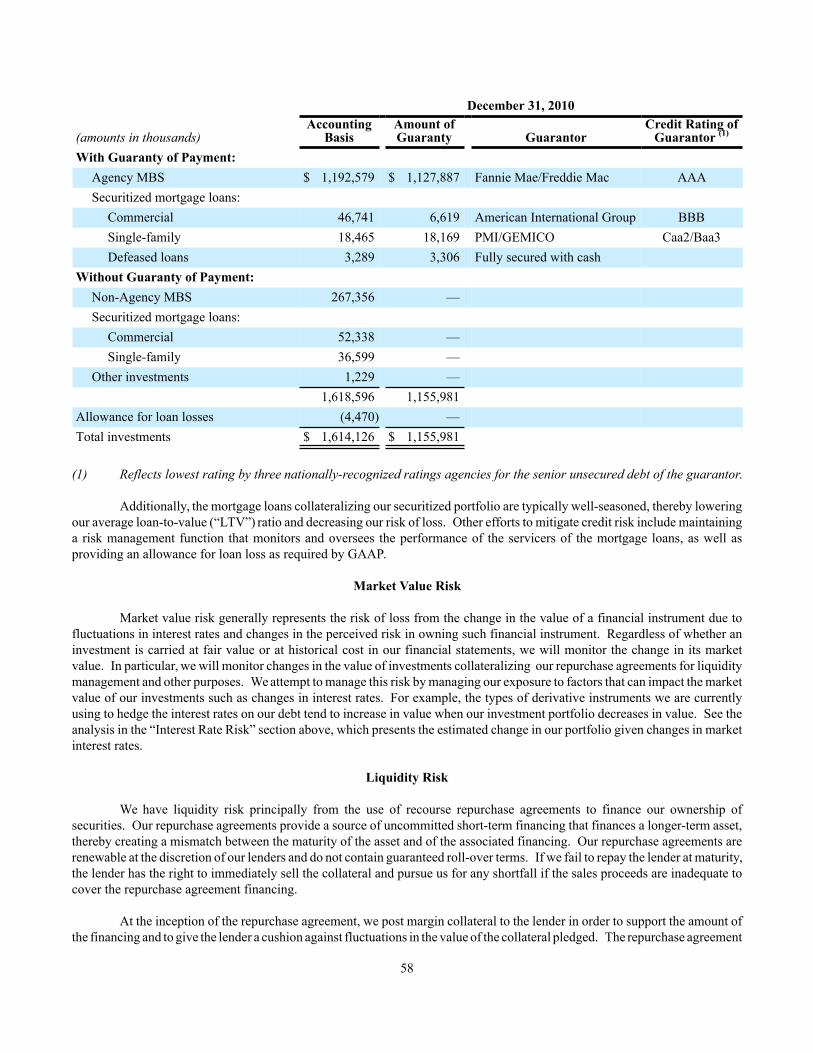
58
(amounts in thousands)With Guaranty of Payment:
Agency MBSSecuritized mortgage loans:
CommercialSingle-familyDefeased loans
Without Guaranty of Payment:Non-Agency MBSSecuritized mortgage loans:
CommercialSingle-family
Other investments Allowance for loan lossesTotal investments
December 31, 2010Accounting
Basis $ 1,192,579
46,74118,4653,289
267,356
52,33836,5991,229
1,618,596(4,470)
$ 1,614,126
Amount ofGuaranty
$ 1,127,887
6,619
18,1693,306
—
———
1,155,981—
$ 1,155,981
Guarantor Fannie Mae/Freddie Mac American International GroupPMI/GEMICOFully secured with cash
Credit Rating of Guarantor (1)
AAA
BBB
Caa2/Baa3
(1) Reflects lowest rating by three nationally-recognized ratings agencies for the senior unsecured debt of the guarantor.
Additionally, the mortgage loans collateralizing our securitized portfolio are typically well-seasoned, thereby lowering our average loan-to-value (“LTV”) ratio and decreasing our risk of loss. Other efforts to mitigate credit risk include maintaining a risk management function that monitors and oversees the performance of the servicers of the mortgage loans, as well as providing an allowance for loan loss as required by GAAP.
Market Value Risk
Market value risk generally represents the risk of loss from the change in the value of a financial instrument due to fluctuations in interest rates and changes in the perceived risk in owning such financial instrument. Regardless of whether an investment is carried at fair value or at historical cost in our financial statements, we will monitor the change in its market value. In particular, we will monitor changes in the value of investments collateralizing our repurchase agreements for liquidity management and other purposes. We attempt to manage this risk by managing our exposure to factors that can impact the market value of our investments such as changes in interest rates. For example, the types of derivative instruments we are currently using to hedge the interest rates on our debt tend to increase in value when our investment portfolio decreases in value. See the analysis in the “Interest Rate Risk” section above, which presents the estimated change in our portfolio given changes in market interest rates.
Liquidity Risk
We have liquidity risk principally from the use of recourse repurchase agreements to finance our ownership of securities. Our repurchase agreements provide a source of uncommitted short-term financing that finances a longer-term asset, thereby creating a mismatch between the maturity of the asset and of the associated financing. Our repurchase agreements are renewable at the discretion of our lenders and do not contain guaranteed roll-over terms. If we fail to repay the lender at maturity, the lender has the right to immediately sell the collateral and pursue us for any shortfall if the sales proceeds are inadequate to cover the repurchase agreement financing.
At the inception of the repurchase agreement, we post margin collateral to the lender in order to support the amount of the financing and to give the lender a cushion against fluctuations in the value of the collateral pledged. The repurchase agreement

59
lender may also request that we post additional collateral (“margin calls”) in the event of a decline in market value of the collateral pledged, which may happen for market reasons or as a result of the payment delay feature on Agency MBS as discussed in “Liquidity and Capital Resources” in Item 7 of Part II to this Annual Report on Form 10-K. Such margin calls could adversely change our liquidity position. If we fail to meet this margin call, the lender has the right to terminate the repurchase agreement and immediately sell the collateral. If the proceeds from the sale of the collateral are insufficient to repay the entire amount of the repurchase agreement outstanding, we would be required to repay any shortfall. All of our repurchase agreements provide that the lender is responsible for obtaining collateral valuations, which must be from a generally recognized source agreed to by both us and the lender, or the most recent closing quotation of such source. Given the uncommitted nature of repurchase agreement financing and the varying collateral requirements, we cannot assume that we will always be able to roll over our repurchase agreements as they mature.
For further information, including how we attempt to mitigate liquidity risk and recent developments, please refer to “Liquidity and Capital Resources” in Item 7 of Part II to this Annual Report on Form 10-K.
ITEM 8. FINANCIAL STATEMENTS AND SUPPLEMENTARY DATA
Our consolidated financial statements and the related notes, together with the Reports of the Independent Registered Public Accounting Firm thereon, are set forth on pages F-1 through F-33 of this Annual Report on Form 10-K.
ITEM 9. CHANGES IN AND DISAGREEMENTS WITH ACCOUNTANTS ON ACCOUNTING AND FINANCIAL DISCLOSURE
Not applicable.
ITEM 9A. CONTROLS AND PROCEDURES
Disclosure Controls and Procedures
Our management evaluated, with the participation of our Principal Executive Officer and Principal Financial Officer, the effectiveness of our disclosure controls and procedures, as defined in Exchange Act Rule 13a-15(e), as of the end of the period covered by this report. Based on that evaluation, our Principal Executive Officer and Principal Financial Officer concluded that our disclosure controls and procedures were effective as of December 31, 2011 to ensure that information required to be disclosed in the reports that we file or submit under the Exchange Act is recorded, processed, summarized and reported, within the time periods specified in the SEC’s rules and forms, and that such information is accumulated and communicated to our management, including our Principal Executive Officer and Principal Financial Officer, as appropriate, to allow timely decisions regarding required disclosure.
Changes in Internal Control over Financial Reporting
There were no changes in our internal control over financial reporting during the three months ended December 31, 2011 that materially affected, or are reasonably likely to materially affect, our internal control over financial reporting.
Management’s Report on Internal Control over Financial Reporting
Our management is responsible for establishing and maintaining adequate internal control over financial reporting as defined in Rule 13a-15(f) of the Exchange Act. Because of inherent limitations, a system of internal control over financial reporting may not prevent or detect misstatements. Also, projections of any evaluation of effectiveness to future periods are subject to the risk that controls may become inadequate due to change in conditions, or that the degree of compliance with policies or procedures may deteriorate.
Our management evaluated, with the participation of our principal executive officer and principal financial officer, the effectiveness of our internal control over financial reporting using the criteria set forth by the Committee of Sponsoring Organizations of the Treadway Commission (“COSO”) in “Internal Control-Integrated Framework.” Based on that evaluation,

60
our principal executive officer and principal financial officer concluded that our internal control over financial reporting was effective as of the end of the period covered by this report.
The Company’s internal control over financial reporting as of December 31, 2011 has been audited by BDO USA, LLP, the independent registered public accounting firm that also audited the Company’s consolidated financial statements included in this Annual Report on Form 10-K. The attestation report of BDO USA, LLP on the effectiveness of the Company’s internal control over financial reporting appears on page F-3 herein.
ITEM 9B. OTHER INFORMATION
None.

61
PART III
ITEM 10. DIRECTORS, EXECUTIVE OFFICERS AND CORPORATE GOVERNANCE
The information about our executive officers required by this item is included in Part I, Item I of this Annual Report on Form 10-K under the caption “Executive Officers of the Registrant”. The remaining information required by Item 10 will be included in our definitive proxy statement for use in connection with our 2012 Annual Meeting of Shareholders (“2012 Proxy Statement”) under the captions “Election of Directors,” “Committees of the Board,” “Code of Ethics” and “Section 16(a) Beneficial Ownership Reporting Compliance,” and is incorporated herein by reference.
ITEM 11. EXECUTIVE COMPENSATION
The information required by Item 11 will be included in the 2012 Proxy Statement under the captions “Compensation Committee,” “Executive Compensation” and “Directors’ Compensation,” and is incorporated herein by reference.
ITEM 12. SECURITY OWNERSHIP OF CERTAIN BENEFICIAL OWNERS AND MANAGEMENT AND RELATED STOCKHOLDER MATTERS
The following table sets forth information as of December 31, 2011, with respect to the Company’s equity compensation plans, under which shares of our common stock are authorized for issuance.
Equity Compensation Plans Approved byShareholders:
2004 Stock Incentive Plan2009 Stock and Incentive Plan
Equity Compensation Plans Not Approved by Shareholders(3)
Total
Number of Securities to Be Issued upon
Exercise of Outstanding Options,
Warrants and Rights (1)
30,000——
30,000
Weighted-AverageExercise Price of
Outstanding Options, Warrants
and Rights
$ 9.42——
$ 9.42
Number of Securities Remaining Available for Future Issuance Under Equity Compensation
Plans(2)
—2,041,939
—
2,041,939(1) Amount includes all outstanding stock option awards, but excludes all outstanding stock appreciation rights, which can
only be settled for cash.(2) Reflects shares available to be granted under the 2009 Stock and Incentive Plan in the form of stock options, stock
appreciation rights, stock awards, dividend equivalent rights, performance share awards, stock units and incentive awards. No new awards may be issued under the 2004 Stock Incentive Plan effective May 13, 2009.
(3) The Company does not have any equity compensation plans that have not been approved by shareholders.
The remaining information required by Item 12 will be included in the 2012 Proxy Statement under the caption “Ownership of Stock” and is incorporated herein by reference.
ITEM 13. CERTAIN RELATIONSHIPS AND RELATED TRANSACTIONS, AND DIRECTOR INDEPENCENCE
The information required by Item 13 will be included in the 2012 Proxy Statement under the captions “Related Person Transactions” and “Director Independence,” and is incorporated herein by reference.

62
ITEM 14. PRINCIPAL ACCOUNANT FEES AND SERVICES
The information required by Item 14 will be included in the 2012 Proxy Statement under the caption “Audit Information,” and is incorporated herein by reference.
PART IV
ITEM 15. EXHIBITS, FINANCIAL STATEMENT SCHEDULES
(a) Documents filed as part of this report:
1. and 2. Financial Statements and Schedules:The information required by this section of Item 15 is set forth in the Consolidated Financial Statements and Reports of Independent Registered Public Accounting Firm beginning at page F-1 of this Annual Report on Form 10-K. The index to the Financial Statements is set forth at page F-2 of this Annual Report on Form 10-K.
Number3.1
3.2
10.1*
10.1.1*
10.2*
10.3*
10.5*
ExhibitRestated Articles of Incorporation, effective July 9, 2008 (incorporated herein by reference to Exhibit 3.1 to Dynex’s Current Report on Form 8-K filed July 11, 2008).
Amended and Restated Bylaws, effective March 26, 2008 (incorporated herein by reference to Exhibit 3.2 to Dynex’s Current Report on Form 8-K filed April 1, 2008).
Dynex Capital, Inc. 2004 Stock Incentive Plan (incorporated herein by reference to Exhibit 10.1 to Dynex’s Annual Report on Form 10-K for the year ended December 31, 2004).
409A Amendment to Dynex Capital, Inc. 2004 Stock Incentive Plan, dated December 31, 2008 (incorporated herein by reference to Exhibit 10.1.1 to Dynex’s Annual Report on Form 10-K for the year ended December 31, 2008).
Form of Stock Option Agreement for Non-Employee Directors under the Dynex Capital, Inc. 2004 Stock Incentive Plan (incorporated herein by reference to Exhibit 10.2 to Dynex’s Quarterly Report on Form 10-Q for the quarter ended June 30, 2005).
Form of Stock Appreciation Rights Agreement for Senior Executives under the Dynex Capital, Inc. 2004 Stock Incentive Plan (incorporated herein by reference to Exhibit 10.3 to Dynex’s Quarterly Report on Form 10-Q for the quarter ended June 30, 2005).
Severance Agreement between Dynex Capital, Inc. and Stephen J. Benedetti dated June 11, 2004 (incorporated herein by reference to Exhibit 10.5 to Dynex’s Annual Report on Form 10-K for the year ended December 31, 2007).
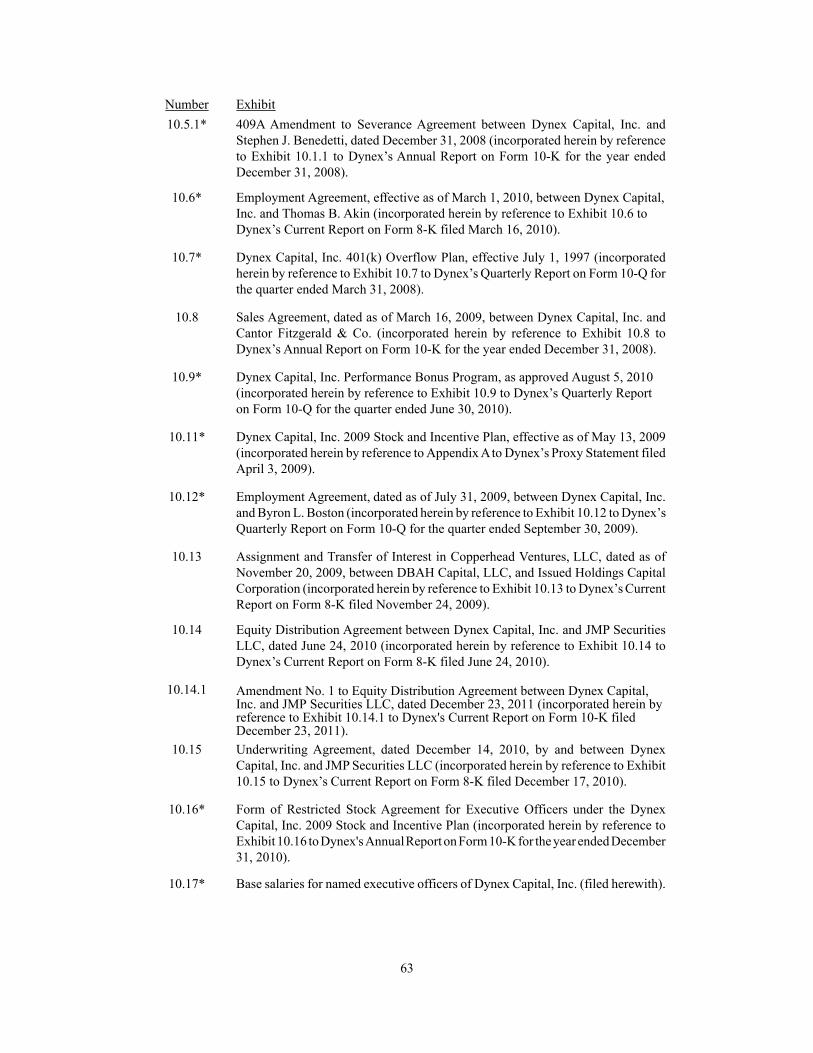
63
Number10.5.1*
10.6*
10.7*
10.8
10.9*
10.11*
10.12*
10.13
10.14
10.14.1
10.15
10.16*
10.17*
Exhibit409A Amendment to Severance Agreement between Dynex Capital, Inc. and Stephen J. Benedetti, dated December 31, 2008 (incorporated herein by reference to Exhibit 10.1.1 to Dynex’s Annual Report on Form 10-K for the year ended December 31, 2008).
Employment Agreement, effective as of March 1, 2010, between Dynex Capital, Inc. and Thomas B. Akin (incorporated herein by reference to Exhibit 10.6 to Dynex’s Current Report on Form 8-K filed March 16, 2010).
Dynex Capital, Inc. 401(k) Overflow Plan, effective July 1, 1997 (incorporated herein by reference to Exhibit 10.7 to Dynex’s Quarterly Report on Form 10-Q for the quarter ended March 31, 2008).
Sales Agreement, dated as of March 16, 2009, between Dynex Capital, Inc. and Cantor Fitzgerald & Co. (incorporated herein by reference to Exhibit 10.8 to Dynex’s Annual Report on Form 10-K for the year ended December 31, 2008).
Dynex Capital, Inc. Performance Bonus Program, as approved August 5, 2010 (incorporated herein by reference to Exhibit 10.9 to Dynex’s Quarterly Report on Form 10-Q for the quarter ended June 30, 2010).
Dynex Capital, Inc. 2009 Stock and Incentive Plan, effective as of May 13, 2009 (incorporated herein by reference to Appendix A to Dynex’s Proxy Statement filed April 3, 2009).
Employment Agreement, dated as of July 31, 2009, between Dynex Capital, Inc. and Byron L. Boston (incorporated herein by reference to Exhibit 10.12 to Dynex’s Quarterly Report on Form 10-Q for the quarter ended September 30, 2009).
Assignment and Transfer of Interest in Copperhead Ventures, LLC, dated as of November 20, 2009, between DBAH Capital, LLC, and Issued Holdings Capital Corporation (incorporated herein by reference to Exhibit 10.13 to Dynex’s Current Report on Form 8-K filed November 24, 2009).
Equity Distribution Agreement between Dynex Capital, Inc. and JMP Securities LLC, dated June 24, 2010 (incorporated herein by reference to Exhibit 10.14 to Dynex’s Current Report on Form 8-K filed June 24, 2010).
Amendment No. 1 to Equity Distribution Agreement between Dynex Capital,Inc. and JMP Securities LLC, dated December 23, 2011 (incorporated herein byreference to Exhibit 10.14.1 to Dynex's Current Report on Form 10-K filedDecember 23, 2011).Underwriting Agreement, dated December 14, 2010, by and between Dynex Capital, Inc. and JMP Securities LLC (incorporated herein by reference to Exhibit 10.15 to Dynex’s Current Report on Form 8-K filed December 17, 2010).
Form of Restricted Stock Agreement for Executive Officers under the Dynex Capital, Inc. 2009 Stock and Incentive Plan (incorporated herein by reference to Exhibit 10.16 to Dynex's Annual Report on Form 10-K for the year ended December 31, 2010).
Base salaries for named executive officers of Dynex Capital, Inc. (filed herewith).
64
Number10.18*
10.19
10.20*
10.21
21.1
23.1
31.1
31.2
32.1
101
ExhibitNon-employee directors’ annual compensation for Dynex Capital, Inc. (incorporated herein by reference to Exhibit 10.18 to Dynex's Annual Report on Form 10-K for the year ended December 31, 2010).Underwriting Agreement, dated March 4, 2011, by and among Dynex Capital, Inc., Merrill Lynch, Pierce, Fenner & Smith Incorporated and Credit Suisse Securities (USA) LLC (incorporated herein by reference to Exhibit 1.1 to Dynex’s Current Report on Form 8-K filed March 9, 2011).
Letter Agreement between Dynex Capital, Inc. and Byron L. Boston, datedSeptember 7, 2011 (incorporated by reference to Exhibit 10.20 to Dynex'sCurrent Report on Form 8-K filed September 9, 2011).Underwriting Agreement, dated January 27, 2012, by and among Dynex Capital,Inc., Credit Suisse Securities (USA) LLC, Merrill Lynch, Pierce, Fenner &Smith Incorporated and JMP Securities LLC (incorporated herein by referenceto Exhibit 1.1 to Dynex's Current Report on Form 8-K filed January 31, 2012).List of consolidated entities of Dynex (filed herewith).
Consent of BDO USA, LLP (filed herewith).
Certification of principal executive officer pursuant to Section 302 of the Sarbanes-Oxley Act of 2002 (filed herewith).
Certification of principal financial officer pursuant to Section 302 of the Sarbanes-Oxley Act of 2002 (filed herewith).
Certification of principal executive officer and principal financial officer pursuant to Section 906 of the Sarbanes-Oxley Act of 2002 (filed herewith).
The following materials from Dynex Capital, Inc.'s Annual Report on Form 10-K for the year ended December 31, 2011, formatted in XBRL (ExtensibleBusiness Reporting Language), furnished herewith: (i) Consolidated BalanceSheets (unaudited), (ii) Consolidated Statements of Income (unaudited), (iii)Consolidated Statements of Comprehensive Income (unaudited), (iv)Consolidated Statements of Shareholder's Equity (unaudited), (v) ConsolidatedStatements of Cash Flows (unaudited), and (vi) Notes to Consolidated FinancialStatements (unaudited).
________________________________________
* Denotes management contract.
(b) Exhibits: See Item 15(a)(3) above.
(c) Financial Statement Schedules: None.

65
SIGNATURES
Pursuant to the requirements of Section 13 or 15(d) of the Securities Exchange Act of 1934, the registrant has duly caused this report to be signed on its behalf by the undersigned, thereunto duly authorized.
March 2, 2012
DYNEX CAPITAL, INC.(Registrant)
/s/ Stephen J. BenedettiStephen J. Benedetti, Executive Vice President, ChiefOperating Officer and Chief Financial Officer
Pursuant to the requirements of the Securities Exchange Act of 1934, this report has been signed below by the following persons on behalf of the registrant and in the capacities and on the dates indicated.
Signature
/s/ Thomas B. AkinThomas B. Akin
/s/ Stephen J. BenedettiStephen J. Benedetti
/s/ Byron L. BostonByron L. Boston
/s/ Jeffrey L. ChildressJeffrey L. Childress
/s/ Michael R. HughesMichael R. Hughes
/s/ Barry IgdaloffBarry Igdaloff
/s/ Daniel K. OsborneDaniel K. Osborne
/s/ James C. Wheat, IIIJames C. Wheat, III
Title
Chairman and Chief Executive Officerand Director(Principal Executive Officer)
Executive Vice President, Chief OperatingOfficer and Chief Financial Officer(Principal Financial Officer)
President, Chief Investment Officer, andDirector
Vice President and Controller(Principal Accounting Officer)
Director
Director
Director
Director
Date
March 2, 2012
March 2, 2012
March 2, 2012
March 2, 2012
March 2, 2012
March 2, 2012
March 2, 2012
March 2, 2012

F-1
DYNEX CAPITAL, INC.
CONSOLIDATED FINANCIAL STATEMENTS AND
REPORTS OF INDEPENDENT REGISTERED PUBLIC ACCOUNTING FIRM
For Inclusion in Form 10-K
Annual Report Filed with
Securities and Exchange Commission
December 31, 2011

F-2
DYNEX CAPITAL, INC.INDEX TO FINANCIAL STATEMENTS
Reports of Independent Registered Public Accounting Firm
Consolidated Balance Sheets – As of December 31, 2011 and 2010
Consolidated Statements of Income – For the Years Ended December 31, 2011, 2010 and 2009
Consolidated Statements of Comprehensive Income – For the Years Ended December 31, 2011, 2010 and 2009
Consolidated Statements of Shareholders’ Equity – For the Years Ended December 31, 2011, 2010 and 2009
Consolidated Statements of Cash Flows – For the Years Ended December 31, 2011, 2010 and 2009
Notes to the Consolidated Financial Statements
Page
F-3
F-5
F-6
F-7
F-8
F-9
F-10
F-3
Report of Independent Registered Public Accounting Firm
Board of Directors and ShareholdersDynex Capital, Inc.Glen Allen, Virginia
We have audited the accompanying consolidated balance sheets of Dynex Capital, Inc. (Dynex) as of December 31, 2011 and 2010 and the related consolidated statements of income and comprehensive income, shareholders' equity, and cash flows for each of the three years in the period ended December 31, 2011. These financial statements are the responsibility of the Company's management. Our responsibility is to express an opinion on these financial statements based on our audits.
We conducted our audits in accordance with the standards of the Public Company Accounting Oversight Board (United States). Those standards require that we plan and perform the audit to obtain reasonable assurance about whether the financial statements are free of material misstatement. An audit also includes examining, on a test basis, evidence supporting the amounts and disclosures in the financial statements, assessing the accounting principles used and significant estimates made by management, as well as evaluating the overall financial statement presentation. We believe that our audits provide a reasonable basis for our opinion.
In our opinion, the consolidated financial statements referred to above present fairly, in all material respects, the financial position of Dynex at December 31, 2011 and 2010, and the results of its operations and its cash flows for each of the three years in the period ended December 31, 2011, in conformity with accounting principles generally accepted in the United States of America.
We also have audited, in accordance with the standards of the Public Company Accounting Oversight Board (United States), Dynex's internal control over financial reporting as of December 31, 2011, based on criteria established in Internal Control - Integrated Framework issued by the Committee of Sponsoring Organizations of the Treadway Commission (COSO) and our report dated March 2, 2012 expressed an unqualified opinion thereon.
BDO USA, LLP
Richmond, VirginiaMarch 2, 2012
F-4
Report of Independent Registered Public Accounting Firm
Board of Directors and ShareholdersDynex Capital, Inc.Glen Allen, Virginia
We have audited Dynex Capital, Inc.'s (Dynex) internal control over financial reporting as of December 31, 2011, based on criteria established in Internal Control - Integrated Framework issued by the Committee of Sponsoring Organizations of the Treadway Commission (the COSO criteria). Dynex's management is responsible for maintaining effective internal control over financial reporting and for its assessment of the effectiveness of internal control over financial reporting, included in the accompanying Item 9A, "Management's Report on Internal Control Over Financial Reporting”. Our responsibility is to express an opinion on the company's internal control over financial reporting based on our audit.
We conducted our audit in accordance with the standards of the Public Company Accounting Oversight Board (United States). Those standards require that we plan and perform the audit to obtain reasonable assurance about whether effective internal control over financial reporting was maintained in all material respects. Our audit included obtaining an understanding of internal control over financial reporting, assessing the risk that a material weakness exists, and testing and evaluating the design and operating effectiveness of internal control based on the assessed risk. Our audit also included performing such other procedures as we considered necessary in the circumstances. We believe that our audit provides a reasonable basis for our opinion.
A company's internal control over financial reporting is a process designed to provide reasonable assurance regarding the reliability of financial reporting and the preparation of financial statements for external purposes in accordance with generally accepted accounting principles. A company's internal control over financial reporting includes those policies and procedures that (1) pertain to the maintenance of records that, in reasonable detail, accurately and fairly reflect the transactions and dispositions of the assets of the company; (2) provide reasonable assurance that transactions are recorded as necessary to permit preparation of financial statements in accordance with generally accepted accounting principles, and that receipts and expenditures of the company are being made only in accordance with authorizations of management and directors of the company; and (3) provide reasonable assurance regarding prevention or timely detection of unauthorized acquisition, use, or disposition of the company's assets that could have a material effect on the financial statements.
Because of its inherent limitations, internal control over financial reporting may not prevent or detect misstatements. Also, projections of any evaluation of effectiveness to future periods are subject to the risk that controls may become inadequate because of changes in conditions, or that the degree of compliance with the policies or procedures may deteriorate.
In our opinion, Dynex maintained, in all material respects, effective internal control over financial reporting as of December 31, 2011, based on the COSO criteria.
We also have audited, in accordance with the standards of the Public Company Accounting Oversight Board (United States), the consolidated balance sheets of Dynex Capital, Inc. as of December 31, 2011 and 2010, and the related consolidated statements of income and comprehensive income, shareholders' equity, and cash flows for each of the three years in the period ended December 31, 2011 and our report dated March 2, 2012 expressed an unqualified opinion thereon.
BDO USA, LLP
Richmond, VirginiaMarch 2, 2012

F-5
DYNEX CAPITAL, INC.CONSOLIDATED BALANCE SHEETS(amounts in thousands except share data)
ASSETSAgency MBS (including pledged of $1,879,831 and$1,090,174, respectively)Non-Agency MBS (including pledged of $415,195 and $259,350,respectively)Securitized mortgage loans, netOther investments, net Cash and cash equivalentsDerivative assetsPrincipal receivable on investmentsAccrued interest receivableOther assets, net
Total assetsLIABILITIES AND SHAREHOLDERS’ EQUITYLiabilities:Repurchase agreementsNon-recourse collateralized financingDerivative liabilitiesAccrued interest payableAccrued dividends payableOther liabilities
Total liabilitiesCommitments and Contingencies (Note 12)Shareholders’ equity:Common stock, par value $.01 per share, 100,000,000 sharesauthorized; 40,382,530 and 30,342,897 shares issued and outstanding, respectivelyAdditional paid-in capitalAccumulated other comprehensive (loss) incomeAccumulated deficit
Total shareholders' equityTotal liabilities and shareholders’ equity
December 31, 2011
$ 1,965,159
421,096113,703
1,0182,500,976
48,776—
13,82612,6096,006
$ 2,582,193
$ 2,093,79370,89527,9972,165
11,3074,687
2,210,844
404634,683
(3,255)(260,483)371,349
$ 2,582,193
December 31, 2010
$ 1,192,579
267,356152,962
1,2291,614,126
18,836692
3,7396,1056,086
$ 1,649,584
$ 1,234,183107,105
3,5321,0798,1923,136
1,357,227
303538,30410,057
(256,307)292,357
$ 1,649,584
See notes to the consolidated financial statements.
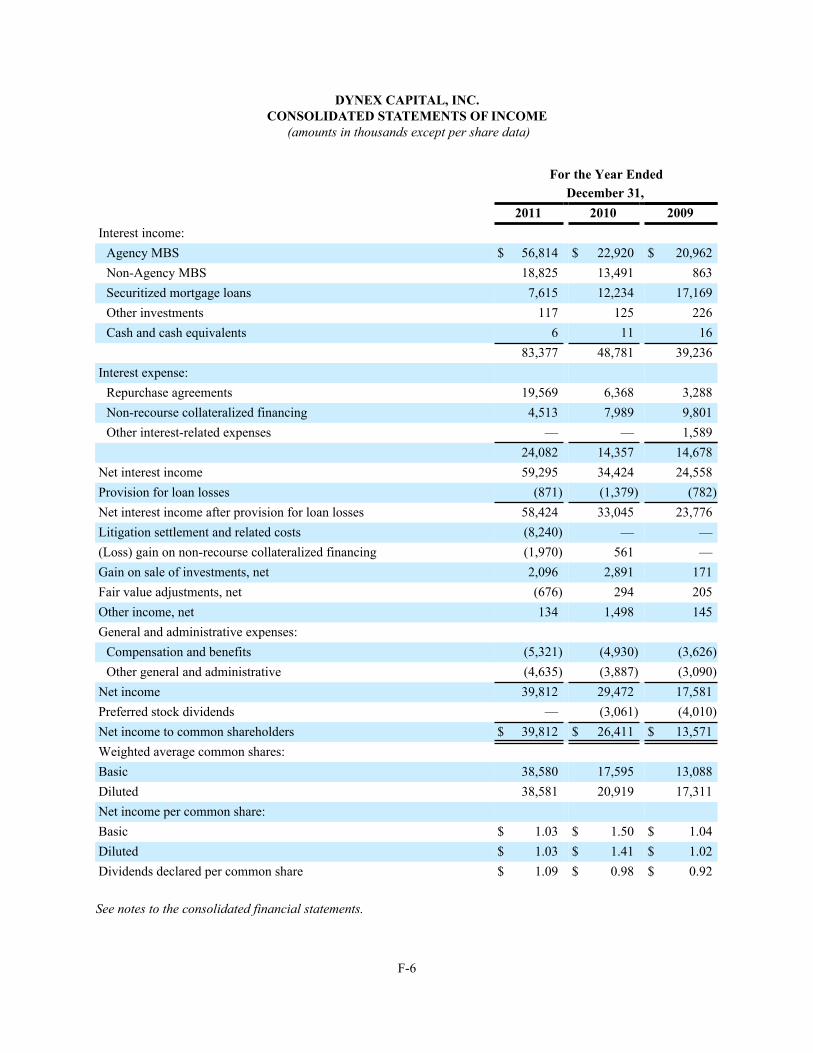
F-6
DYNEX CAPITAL, INC.CONSOLIDATED STATEMENTS OF INCOME
(amounts in thousands except per share data)
Interest income:
Agency MBSNon-Agency MBSSecuritized mortgage loansOther investmentsCash and cash equivalents
Interest expense:
Repurchase agreementsNon-recourse collateralized financingOther interest-related expenses
Net interest incomeProvision for loan lossesNet interest income after provision for loan lossesLitigation settlement and related costs(Loss) gain on non-recourse collateralized financingGain on sale of investments, netFair value adjustments, netOther income, netGeneral and administrative expenses:
Compensation and benefitsOther general and administrative
Net incomePreferred stock dividendsNet income to common shareholdersWeighted average common shares:BasicDilutedNet income per common share:BasicDilutedDividends declared per common share
For the Year EndedDecember 31,
2011
$ 56,81418,8257,615
1176
83,377
19,5694,513
—24,08259,295
(871)58,424(8,240)(1,970)2,096(676)134
(5,321)(4,635)39,812
—$ 39,812
38,58038,581
$ 1.03$ 1.03$ 1.09
2010
$ 22,92013,49112,234
12511
48,781
6,3687,989
—14,35734,424(1,379)33,045
—561
2,891294
1,498
(4,930)(3,887)29,472(3,061)
$ 26,411
17,59520,919
$ 1.50$ 1.41$ 0.98
2009
$ 20,962863
17,16922616
39,236
3,2889,8011,589
14,67824,558
(782)23,776
——
171205145
(3,626)(3,090)17,581(4,010)
$ 13,571
13,08817,311
$ 1.04$ 1.02$ 0.92
See notes to the consolidated financial statements.
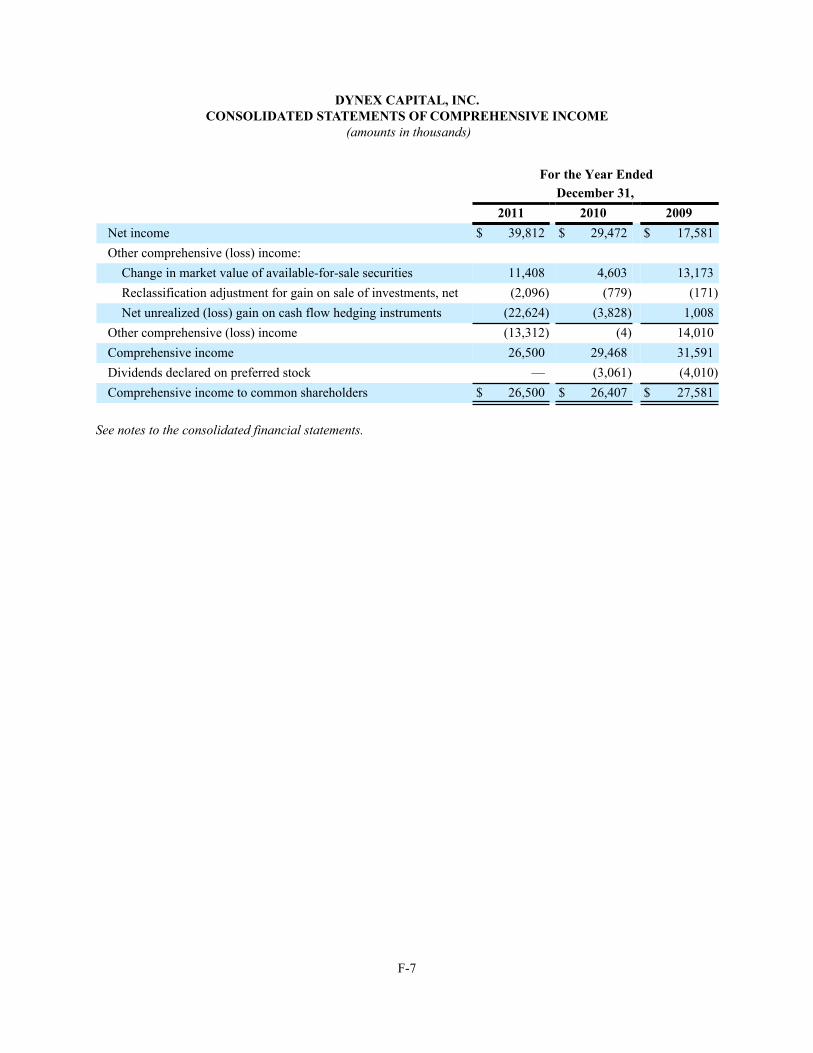
F-7
DYNEX CAPITAL, INC.CONSOLIDATED STATEMENTS OF COMPREHENSIVE INCOME
(amounts in thousands)
Net incomeOther comprehensive (loss) income:
Change in market value of available-for-sale securitiesReclassification adjustment for gain on sale of investments, netNet unrealized (loss) gain on cash flow hedging instruments
Other comprehensive (loss) incomeComprehensive incomeDividends declared on preferred stockComprehensive income to common shareholders
For the Year EndedDecember 31,
2011$ 39,812
11,408(2,096)
(22,624)(13,312)26,500
—$ 26,500
2010$ 29,472
4,603(779)
(3,828)(4)
29,468(3,061)
$ 26,407
2009$ 17,581
13,173(171)
1,00814,01031,591(4,010)
$ 27,581
See notes to the consolidated financial statements.

F-8
DYNEX CAPITAL, INC.CONSOLIDATED STATEMENTS OF SHAREHOLDERS’ EQUITY
(amounts in thousands)
Balance as of January 1, 2009Common stock issuanceGranting and vesting ofrestricted stockNet incomeDividends on preferred stockDividends on common stockOther comprehensive incomeBalance as of December 31,2009Common stock issuanceGranting and vesting ofrestricted stockConversion of preferred sharesto common sharesCapitalized expenses associatedwith stock issuancesCumulative effect of adoptionof new accounting principleNet incomeDividends on preferred stockDividends on common stockOther comprehensive lossBalance as of December 31,2010Common stock issuanceGranting and vesting ofrestricted stockCapitalized expenses associatedwith stock issuancesNet incomeDividends on common stockOther comprehensive lossBalance as of December 31,2011
PreferredStock
$ 41,749—
—————
41,749—
—(41,749)
—
—
————
——
——
———
$ —
CommonStock
$ 12217
—————
139122
—42
—
—
————
30397
4—
———
$ 404
AdditionalPaid-inCapital
$ 366,81712,782
118————
379,717116,948
6041,707
(128)
—
————
538,30495,327
1,194(142)
———
$ 634,683
Accumulated Other
Comprehensive (Loss)
Income$ (3,949)
–
————
14,010
10,061—
——
—
—
———(4)
10,057—
—–
——
(13,312)
$ (3,255)
AccumulatedDeficit
$ (264,330)—
—17,581(4,010)
(12,154)—
(262,913)—
——
—
12
29,472(3,061)
(19,817)—
(256,307)—
——
39,812(43,988)
—
$ (260,483)
Total$ 140,409
12,799
11817,581(4,010)
(12,154)14,010
168,753117,070
60—
(128)
12
29,472(3,061)
(19,817)(4)
292,35795,424
1,198(142)
39,812(43,988)(13,312)
$ 371,349
See notes to the consolidated financial statements.
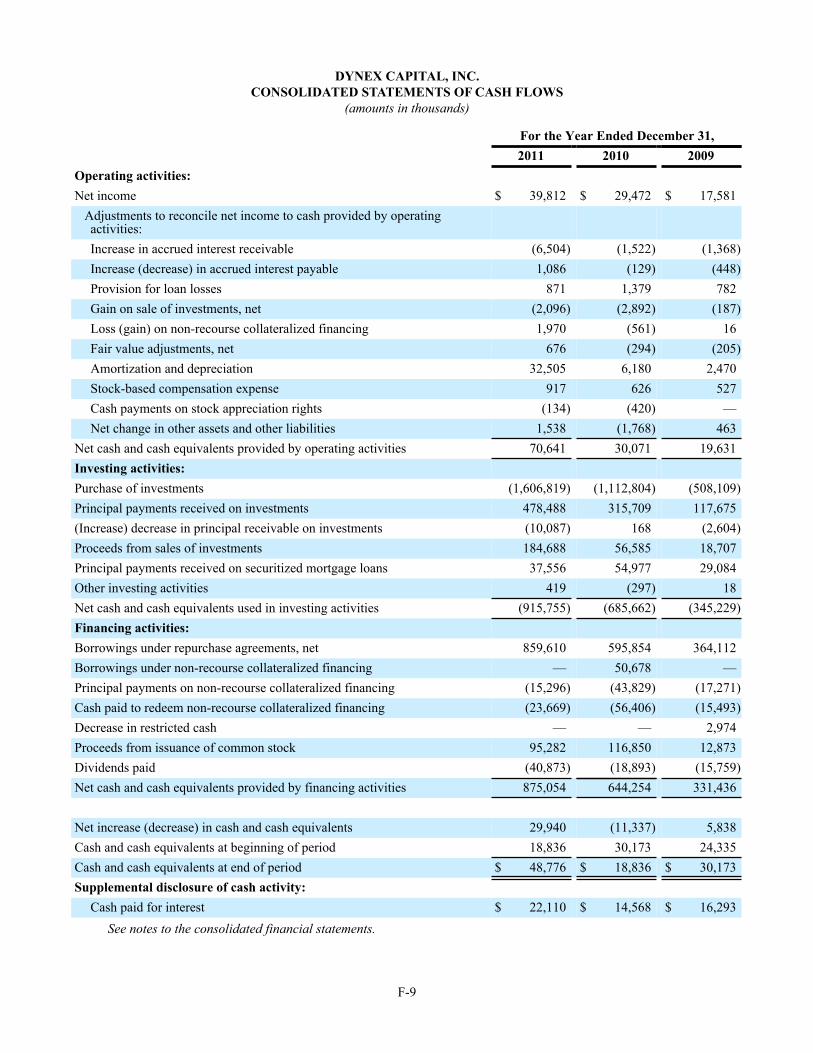
F-9
DYNEX CAPITAL, INC.CONSOLIDATED STATEMENTS OF CASH FLOWS
(amounts in thousands)
Operating activities:Net income
Adjustments to reconcile net income to cash provided by operatingactivities:Increase in accrued interest receivableIncrease (decrease) in accrued interest payableProvision for loan lossesGain on sale of investments, netLoss (gain) on non-recourse collateralized financingFair value adjustments, netAmortization and depreciationStock-based compensation expenseCash payments on stock appreciation rightsNet change in other assets and other liabilities
Net cash and cash equivalents provided by operating activitiesInvesting activities:Purchase of investmentsPrincipal payments received on investments(Increase) decrease in principal receivable on investmentsProceeds from sales of investmentsPrincipal payments received on securitized mortgage loansOther investing activitiesNet cash and cash equivalents used in investing activitiesFinancing activities:Borrowings under repurchase agreements, netBorrowings under non-recourse collateralized financingPrincipal payments on non-recourse collateralized financingCash paid to redeem non-recourse collateralized financingDecrease in restricted cashProceeds from issuance of common stockDividends paidNet cash and cash equivalents provided by financing activities
Net increase (decrease) in cash and cash equivalentsCash and cash equivalents at beginning of periodCash and cash equivalents at end of periodSupplemental disclosure of cash activity:
Cash paid for interest
For the Year Ended December 31,2011
$ 39,812
(6,504)1,086
871(2,096)1,970
67632,505
917(134)
1,53870,641
(1,606,819)
478,488(10,087)184,68837,556
419(915,755)
859,610
—(15,296)(23,669)
—95,282
(40,873)875,054
29,94018,836
$ 48,776
$ 22,110
2010 $ 29,472
(1,522)
(129)1,379
(2,892)(561)(294)
6,180626
(420)(1,768)30,071
(1,112,804)315,709
16856,58554,977
(297)(685,662)
595,85450,678
(43,829)(56,406)
—116,850(18,893)644,254
(11,337)30,173
$ 18,836
$ 14,568
2009
$ 17,581
(1,368)(448)782
(187)16
(205)2,470
527—
46319,631
(508,109)117,675
(2,604)18,70729,084
18(345,229)
364,112—
(17,271)(15,493)
2,97412,873
(15,759)331,436
5,83824,335
$ 30,173
$ 16,293See notes to the consolidated financial statements.
F-10
NOTES TO THE CONSOLIDATED FINANCIAL STATEMENTSDYNEX CAPITAL, INC.(amounts in thousands except share and per share data)
NOTE 1 – SUMMARY OF SIGNIFICANT ACCOUNTING POLICIES Basis of Presentation
The accompanying consolidated financial statements of Dynex Capital, Inc. and its qualified real estate investment trust (“REIT”) subsidiaries and its taxable REIT subsidiary (together, “Dynex” or the “Company”) have been prepared in accordance with the generally accepted accounting principles in the United States ("GAAP") and the instructions to the Annual Report on Form 10-K and Article 3 of Regulation S-X promulgated by the Securities and Exchange Commission (the “SEC”).
Certain items in the prior years' consolidated financial statements have been reclassified to conform to the current year’s presentation. The Company’s consolidated balance sheet for December 31, 2010 now presents separately its "principal receivable on investments", which was previously included within the fair value amounts shown for Agency and non-Agency mortgage-backed securities ("MBS"). The Company's consolidated statements of income for the years ended December 31, 2010 and December 31, 2009 now exclude certain components of its "other interest (income) expense" from its "net interest income". This amount is currently included within "other income, net". The Company's consolidated statements of income for the years ended December 31, 2010 and December 31, 2009 now present separately "(loss) gain on non-recourse collateralized financing", which was previously included within "other (loss) income, net" for those periods. The Company’s consolidated statements of cash flows for the years ended December 31, 2010 and December 31, 2009 now present separately “(increase) decrease in principal receivable on investments”, which was previously included within “other investing activities” for those periods. In addition, the line item "gain on redemption of securitization financing bonds" on the statement of cash flows for the years ended December 31, 2010 and December 31, 2009 has been renamed "(loss) gain on non-recourse collateralized financing" and the line item "redemption of securitization financing" on the statement of cash flows for the years ended December 31, 2010 and December 31, 2009 has been renamed "cash paid to redeem non-recourse collateralized financing." These presentation changes have no effect on reported total assets, total liabilities, results of operations, or cash flow activities.
Consolidation
The consolidated financial statements include the accounts of the Company, its qualified REIT subsidiaries and its taxable REIT subsidiary. The consolidated financial statements represent the Company’s accounts after the elimination of intercompany balances and transactions. The Company consolidates entities in which it owns more than 50% of the voting equity and control does not rest with others and variable interest entities in which it is determined to be the primary beneficiary in accordance with Financial Accounting Standards Board (“FASB”) Accounting Standards Codification (“ASC”) Topic 810-10. The Company follows the equity method of accounting for investments with greater than a 20% and less than 50% interest in partnerships and corporate joint ventures or when it is able to influence the financial and operating policies of the investee but owns less than 50% of the voting equity. As of December 31, 2011 and December 31, 2010, the Company does not have any investments in which is owns less than a 50% interest.
In accordance with ASC Topic 810-10, the Company also consolidates certain trusts through which it has securitized mortgage loans and non-Agency CMBS. Additional information regarding the accounting policy for securitized mortgage loans is provided below under "Investments" and "Allowance for Loan Losses".
Use of Estimates
The preparation of financial statements in conformity with GAAP requires management to make estimates and assumptions that affect the reported amounts of assets and liabilities and the disclosure of contingent assets and liabilities at the date of the financial statements as well as the reported amounts of revenue and expenses during the reported period. Actual results could differ from those estimates. The most significant estimates used by management include but are not limited to fair value measurements of its investments, allowance for loan losses, other-than-temporary impairments, commitments and contingencies, and amortization of premiums and discounts. These items are discussed further below within this note to the consolidated financial statements.
Federal Income Taxes

F-11
The Company believes it has complied with the requirements for qualification as a REIT under the Internal Revenue Code of 1986, as amended (the “Code”). As such, the Company believes that it qualifies as a REIT for federal income tax purposes, and it generally will not be subject to federal income tax on the amount of its income or gain that is distributed as dividends to shareholders. The Company uses the calendar year for both tax and financial reporting purposes. There may be differences between taxable income and income computed in accordance with GAAP.
Cash and Cash Equivalents
Cash and cash equivalents include cash on hand and highly liquid investments with original maturities of three months or less.
Investments
The Company’s investments include Agency MBS, non-Agency MBS, securitized mortgage loans, and other investments.
Agency MBS. The Company accounts for its Agency MBS in accordance with ASC Topic 320, which requires that investments in debt and equity securities be designated as either “held-to-maturity,” “available-for-sale” or “trading” at the time of acquisition. As of December 31, 2011, the Company has Agency MBS that are designated as either available-for-sale or trading. Although the Company generally intends to hold its available-for-sale securities until maturity, it may, from time to time, sell any of these securities as part of the overall management of its business. The available-for-sale designation provides the Company with this flexibility.
All of the Company’s Agency MBS are recorded at their fair value on the consolidated balance sheet. The Company determines the fair value of its Agency MBS based upon prices obtained from a third-party pricing service and broker quotes. Changes in the fair value of Agency MBS designated as trading are recognized in net income within “fair value adjustments, net”. Gains (losses) realized upon the sale, impairment, or other disposal of a trading security are also recognized within “fair value adjustments, net”. Alternatively, changes in the fair value of Agency MBS designated as available-for-sale are reported in other comprehensive income as unrealized gains (losses) until the security is collected, disposed of, or determined to be other than temporarily impaired. Upon the sale of an available-for-sale security, any unrealized gain or loss is reclassified out of accumulated other comprehensive income (“AOCI”) into net income as a realized “gain (loss) on sale of investments, net” using the specific identification method.
Non-Agency MBS. Like Agency MBS, the Company accounts for its non-Agency MBS in accordance with ASC Topic 320. As of December 31, 2011, all of the Company’s non-Agency MBS are designated as available-for-sale and are recorded at their fair value on the consolidated balance sheet. Changes in fair value are reported in other comprehensive income until the security is collected, disposed of, or determined to be other than temporarily impaired. Like Agency MBS, the Company generally intends to hold its investments in non-Agency MBS until maturity, but it may, from time to time sell any of these securities as part of the overall management of its business. Upon the sale of an available-for-sale security, any unrealized gain or loss is reclassified out of AOCI into net income as a realized “gain (loss) on sale of investments, net” using the specific identification method.
The Company determines the fair value for certain of its non-Agency MBS based upon prices obtained from a third-party pricing service and broker quotes. The remainder of the non-Agency MBS are valued by discounting the estimated future cash flows derived from pricing models that utilize information such as the security’s coupon rate, estimated prepayment speeds, expected weighted average life, collateral composition, estimated future interest rates, expected losses, credit enhancement, as well as certain other relevant information.
Securitized Mortgage Loans. Securitized mortgage loans consist of loans pledged to support the repayment of securitization financing bonds that were issued by the Company prior to 2000. The associated securitization financing bonds are treated as debt of the Company and are presented as a portion of "non-recourse collateralized financing" on the consolidated balance sheet. The Company no longer securitizes any of its financial assets. In accordance with ASC Topic 310-10, the Company's securitized mortgage loans are reported at amortized cost. Securitized mortgage loans can only be sold subject to the lien of the respective securitization financing indenture. An allowance has been established for currently existing and probable losses on such loans as further discussed below.
F-12
Other Investments. Other investments include unsecuritized single-family and commercial mortgage loans which are carried at amortized cost in accordance with ASC Topic 310-10. An allowance has been established for currently existing and probable losses on these loans as further discussed below.
Allowance for Loan Losses. An allowance for loan losses has been estimated and established for currently existing and probable losses for securitized and unsecuritized mortgage loans that are considered impaired in accordance with ASC Topic 310-10. Provisions made to increase the allowance are charged as a current period expense. Commercial mortgage loans are secured by income-producing real estate and are evaluated individually for impairment when the debt service coverage ratio on the mortgage loan is less than 1:1 or when the mortgage loan is delinquent. An allowance may be established for a particular impaired commercial mortgage loan. Commercial mortgage loans not evaluated for individual impairment are evaluated for a general allowance. Certain of the commercial mortgage loans are covered by mortgage loan guarantees that limit the Company’s exposure on these mortgage loans. Single-family mortgage loans are considered homogeneous and are evaluated on a pool basis for a general allowance.
The Company considers various factors in determining its specific and general allowance requirements, including whether a loan is delinquent, the Company’s historical experience with similar types of loans, historical cure rates of delinquent loans, and historical and anticipated loss severity of the mortgage loans as they are liquidated. The factors may differ by mortgage loan type (e.g., single-family versus commercial) and collateral type (e.g., multifamily versus office property). The allowance for loan losses is evaluated and adjusted periodically by management based on the actual and estimated timing and amount of probable credit losses, using the above factors, as well as industry loss experience.
Repurchase Agreements
Repurchase agreements are treated as financings in accordance with the provision of ASC Topic 860 under which the Company pledges its securities as collateral to secure a loan, which is equal in value to a specified percentage of the estimated fair value of the pledged collateral. The Company retains beneficial ownership of the pledged collateral. At the maturity of a repurchase agreement, the Company is required to repay the loan and concurrently receives back its pledged collateral from the lender or, with the consent of the lender, the Company may renew the agreement at the then prevailing financing rate. A repurchase agreement lender may require the Company to pledge additional collateral in the event of a decline in the fair value of the collateral pledged. Repurchase agreement financing is recourse to the Company and the assets pledged. The Company’s repurchase agreements are based on the September 1996 version of the Bond Market Association Master Repurchase Agreement, which generally provides that the lender, as buyer, is responsible for obtaining collateral valuations from a generally recognized source agreed to by both the Company and the lender, or, in an instance when such source is not available, the value determination is made by the lender. Derivative Instruments
The Company may enter into interest rate swap agreements, interest rate cap agreements, interest rate floor agreements, financial forwards, financial futures and options on financial futures (“interest rate agreements”) to manage its sensitivity to changes in interest rates. The Company accounts for its interest rate agreements under ASC Topic 815, designating each as either a cash flow hedging position or a trading position using criteria established therein. In order to qualify as a cash flow hedge, ASC Topic 815 requires formal documentation to be prepared at the inception of the interest rate agreement that meets certain conditions. If these conditions are not met, an interest rate agreement will be classified as a trading position.
For interest rate agreements designated as trading positions, the Company records these instruments at fair value on the Company’s balance sheet in accordance with ASC Topic 815. Changes in their market value are measured at each reporting date and recognized in the current period’s consolidated statement of income within "fair value adjustments, net".
For interest rate agreements designated as cash flow hedges, the Company evaluates the effectiveness of these hedges against the financial instrument being hedged. The effective portion of the hedge relationship on an interest rate agreement designated as a cash flow hedge is reported in AOCI and is later reclassified into the consolidated statement of income in the same period during which the hedged transaction affects earnings. The ineffective portion of such hedge is immediately reported in the current period’s consolidated statement of income. These derivative instruments are carried at fair value on the Company’s

F-13
consolidated balance sheet in accordance with ASC Topic 815. Cash posted to meet margin calls, if any, is included on the consolidated balance sheet in other assets.
In the event a hedging instrument is terminated, any basis adjustments or changes in the fair value of hedges recorded in AOCI are recognized into income or expense in conjunction with the original hedge or hedged exposure.
If the underlying asset, liability or commitment is sold or matures, the hedge is deemed partially or wholly ineffective, or if the criterion that was established at the time the hedging instrument was entered into no longer exists, the interest rate agreement no longer qualifies as a designated hedge. Under these circumstances, such changes in the market value of the interest rate agreement are recognized in the current period’s statement of income.
Interest Income, Premium Amortization, and Discount Accretion
Interest income is accrued based on the outstanding principal balance (or notional balance in the case of IOs) on the Company's investment securities and their contractual terms. Premiums and discounts on Agency and non-Agency MBS and on loans are recognized over the expected life of the investment using the effective yield method in accordance with ASC Topic 310-20. Adjustments to premium amortization are made for actual prepayment activity as well as changes in projected future cash flows. Interest income on non-Agency MBS that are rated lower than “AA” are recognized over the expected life as adjusted for the estimated prepayments and credit losses of the securities in accordance with ASC Topic 310-30. Actual prepayment and credit loss experience are reviewed and effective yields are adjusted when projected prepayments and credit losses differ from the amounts actually received as well as for changes in anticipated future prepayments.
The Company's projections of future cash flows is based on input and analysis received from external sources and internal models, and includes assumptions about the amount and timing of credit losses, loan prepayment rates, fluctuations in interest rates, and other factors. On at least a quarterly basis, the Company reviews and makes any necessary adjustments to its cash flow projections and updates the yield recognized on these assets.
For securities, the accrual of interest is discontinued when, in the opinion of management, it is probable that all amounts contractually due will not be collected, and in certain instances, as a result of the other-than-temporary impairment analysis. For loans, the accrual of interest is discontinued when, in the opinion of management, the interest is not collectible in the normal course of business, when the loan is significantly past due or when the primary servicer of the loan fails to advance the interest and/or principal due on the loan. Loans are considered past due when the borrower fails to make a timely payment in accordance with the underlying loan agreement. All interest accrued but not collected for investments that are placed on a non-accrual status or are charged-off is reversed against interest income. Interest on these investments is accounted for on the cash-basis or cost-recovery method until qualifying for return to accrual status. Investments are returned to accrual status when all the principal and interest amounts contractually due are brought current and future payments are reasonably assured.
Other-than-Temporary Impairment
The Company evaluates all debt securities in its investment portfolio for other-than-temporary impairments by applying the guidance prescribed in ASC Topic 320-10. If the Company has decided to sell a debt security with a fair value less than its amortized cost as of the balance sheet date of a reporting period, the debt security is considered to be other-than-temporarily impaired, and the Company will recognize an other-than-temporary impairment in the related period's income statement equal to the entire difference between the amortized cost basis and the fair value of the debt security as of the balance sheet date. If the Company does not intend to sell the debt security, the Company assesses whether it more likely than not will be able to recover its entire amortized cost basis before it is sold. If the Company determines that it will not be able to recover the entire amortized cost basis of the debt security before it is sold, the Company recognizes in the related period's income statement the difference between the present value of cash flows expected to be collected and the amortized cost basis of the debt security as an other-than-temporary impairment related to credit loss, and the difference between the amortized cost basis and the fair value of the debt security as of the balance sheet date is recognized in other comprehensive income.
In periods after the recognition of an other-than-temporary impairment loss for debt securities, the Company shall account for the other-than-temporarily impaired debt security as if the debt security had been purchased on the measurement date of the other-than-temporary impairment at an amortized cost basis equal to the previous amortized cost basis less the other-than-temporary impairment recognized in earnings. For debt securities for which other-than-temporary impairments were
F-14
recognized in earnings, the difference between the new amortized cost basis and the cash flows expected to be collected shall be accreted into interest income using the effective interest method. The Company shall continue to estimate the present value of cash flows expected to be collected over the life of the debt security. For all other debt securities, if upon subsequent evaluation, there is a significant increase in the cash flows expected to be collected or if actual cash flows are significantly greater than cash flows previously expected, such changes shall be accounted for as a prospective adjustment to the accretable yield in accordance with Subtopic 310-30 even if the debt security would not otherwise be within the scope of that Subtopic. Subsequent increases and decreases in the fair value of available-for-sale securities that are not other-than-temporary shall be included in other comprehensive income.
Please see Note 10 for additional information related to the Company's evaluation for other-than-temporary impairments.
Stock-Based Compensation
Pursuant to the Company’s 2009 Stock and Incentive Plan ("SIP"), the Company may grant stock-based compensation to eligible employees, directors or consultants or advisers to the Company, including stock awards, stock options, stock appreciation rights (“SARs”), dividend equivalent rights, performance shares, and restricted stock units. Currently, the Company's stock options and restricted stock issued under this plan may be settled only in shares of its common stock, and therefore are treated as equity awards with their fair value measured at the grant date as required by ASC Topic 718. Outstanding SARs issued by the Company may be settled only in cash, and therefore have been treated as liability awards with their fair value estimated at the grant date and remeasured at the end of each reporting period using the Black-Scholes option valuation model as required by ASC Topic 718. Please see Note 11 for additional disclosures regarding the Company's SIP plan. Contingencies
In the normal course of business, there are various lawsuits, claims, and other contingencies pending against the Company. We evaluate whether to establish provisions for estimated losses from those matters in accordance with ASC Topic 450, which states that a liability is recognized for a contingent loss when: (a) the underlying causal event has occurred prior to the balance sheet date; (b) it is probable that a loss has been incurred; and (c) there is a reasonable basis for estimating that loss. A liability is not recognized for a contingent loss when it is only possible or remote that a loss has been incurred, however, possible contingent losses shall be disclosed. Please refer to Note 12 for details on the most significant matters currently pending.
Recent Accounting Pronouncements
In April 2011, FASB issued Accounting Standards Update ("ASU" or "Update") No. 2011-03 to improve the accounting for repurchase agreements and other agreements that both entitle and obligate a transferor to repurchase or redeem financial assets before their maturity. ASC Topic 860 prescribes when an entity may or may not recognize a sale upon transfer of financial assets subject to repurchase agreements. That determination is based, in part, on whether the entity has maintained effective control over the transferred financial assets. Previously, under ASC Topic 860, the transferor was required to have the ability to repurchase the same or substantially the same assets in order to assert that it has maintained effective control over the transferred assets. ASU No. 2011-03 removes the criterion requiring the transferor to have the ability to repurchase or redeem the financial assets on substantially the agreed terms, and also removes the collateral maintenance implementation guidance related to that criterion. The FASB concluded that the assessment of effective control should focus on a transferor's contractual rights and obligations with respect to transferred financial assets, not on whether the transferor has the practical ability to perform in accordance with those rights or obligations. These amendments are effective for the first interim or annual reporting period beginning on or after December 15, 2011 and are to be applied prospectively. Management has evaluated these amendments and does not believe that they will have a material impact on the Company's financial condition or results of operations.
In May 2011, FASB issued ASU No. 2011-04 to amend ASC Topic 820 to clarify the FASB's intent about the application of existing fair value measurement and disclosure requirements as well as to change certain principles or requirements for measuring fair value or disclosing information about fair value measurements. One of its amendments which will apply to the Company is the disclosure of quantitative information about the unobservable inputs used in a fair value measurement that is categorized within Level 3 of the fair value hierarchy. In addition, the amendments will require more information from the Company about the valuation processes used by the reporting entity for fair value measurements categorized within Level 3 and the sensitivity of those measurements to changes in unobservable inputs. These amendments (and others included in the Update
F-15
which are not discussed here as they are not applicable to the Company) are effective during interim and annual reporting periods beginning after December 15, 2011 and are to be applied prospectively. Early application by public entities is not permitted. Management has evaluated these amendments and does not believe that they will have a material impact on the Company's financial condition or results of operations.
In June 2011, FASB issued ASU No. 2011-05 to amend ASC Topic 220 regarding the presentation of comprehensive income. The amendment allows an entity the option of presenting the total of comprehensive income, the components of net income, and the components of other comprehensive income in either a single continuous statement of comprehensive income or in two separate but consecutive statements. In both choices, an entity is required to present each component of net income along with total net income, each component of other comprehensive income along with a total for other comprehensive income, and a total amount for comprehensive income. ASU 2011-05 eliminated the option to present the components of other comprehensive income as part of the statement of stockholder's equity. The amendments did not change the items that must be reported in other comprehensive income or when an item of other comprehensive income must be reclassified to net income. These amendments are effective for fiscal years, and interim periods within those years, beginning after December 15, 2011 and should be applied retrospectively. Early adoption is permitted. The Company is already in compliance with these amendments, which do not have a material impact on the Company's financial condition or results of operations.
ASU No. 2011-05 also included an amendment regarding the presentation of reclassification adjustments out of AOCI. However, FASB subsequently issued ASU No. 2011-12 in December 2011 which deferred the effective date for that amendment to allow FASB time to reconsider whether to present on the face of the financial statements the effects of reclassifications out of AOCI on the components of net income and other comprehensive income for all periods presented. ASU No. 2011-12 is effective at the same time as ASU No. 2011-05.
In December 2011, FASB issued ASU No. 2011-11 which amends ASC Topic 210 to require an entity to disclose information about offsetting assets and liabilities and related arrangements to enable users of its financial statements to understand the effect of those arrangements on its financial position. Offsetting, otherwise known as netting, is the presentation of assets and liabilities as a single net amount in the balance sheet. GAAP gives companies the option to present in their consolidated balance sheets, on a net basis, derivatives that are subject to a legally enforceable netting arrangement with the same party where rights of set-off are only available in the event of default or bankruptcy. This amendment is effective for annual reporting periods beginning on or after January 1, 2013, and interim periods within those annual periods, and should be applied retrospectively for all comparative periods presented. The Company does not currently offset any of its assets and liabilities, and as such, does not anticipate ASU NO. 2011-11 having a material impact on the Company's financial condition or results of operations.
NOTE 2 – NET INCOME PER COMMON SHARE
Net income per common share is presented on both a basic and diluted basis. Diluted net income per common share assumes the exercise of stock options using the treasury stock method, and, for the years ended December 31, 2010 and December 31, 2009, the conversion of the Company’s formerly outstanding convertible preferred stock into common stock using the two-class method, but only if these items are dilutive. The following tables reconcile the numerator and denominator for both basic and diluted net income per common share:
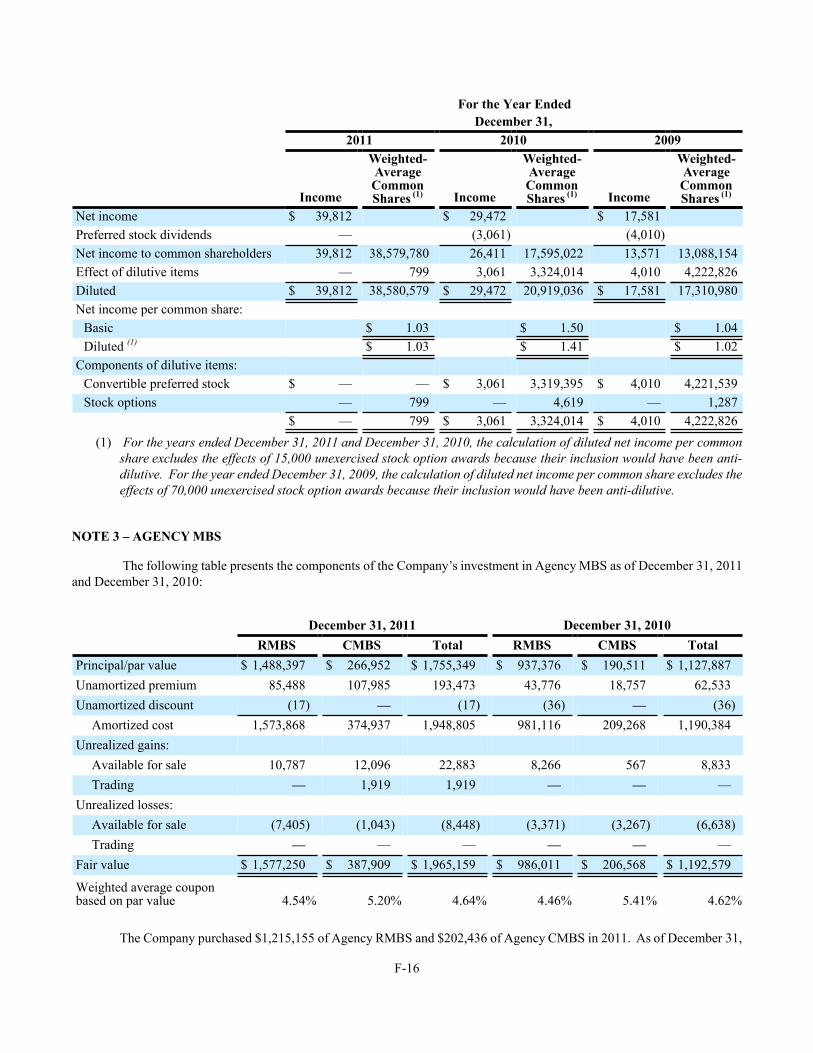
F-16
Net incomePreferred stock dividendsNet income to common shareholdersEffect of dilutive itemsDilutedNet income per common share:
BasicDiluted (1)
Components of dilutive items:Convertible preferred stockStock options
For the Year EndedDecember 31,
2011
Income
$ 39,812—
39,812—
$ 39,812
$ ——
$ —
Weighted-Average Common Shares (1)
38,579,780799
38,580,579
$ 1.03$ 1.03
—799799
2010
Income
$ 29,472(3,061)26,4113,061
$ 29,472
$ 3,061—
$ 3,061
Weighted-Average Common Shares (1)
17,595,0223,324,014
20,919,036
$ 1.50$ 1.41
3,319,3954,619
3,324,014
2009
Income
$ 17,581(4,010)13,5714,010
$ 17,581
$ 4,010—
$ 4,010
Weighted-Average Common Shares (1)
13,088,1544,222,826
17,310,980
$ 1.04$ 1.02
4,221,5391,287
4,222,826(1) For the years ended December 31, 2011 and December 31, 2010, the calculation of diluted net income per common
share excludes the effects of 15,000 unexercised stock option awards because their inclusion would have been anti-dilutive. For the year ended December 31, 2009, the calculation of diluted net income per common share excludes the effects of 70,000 unexercised stock option awards because their inclusion would have been anti-dilutive.
NOTE 3 – AGENCY MBS
The following table presents the components of the Company’s investment in Agency MBS as of December 31, 2011 and December 31, 2010:
Principal/par valueUnamortized premiumUnamortized discount
Amortized costUnrealized gains:
Available for saleTrading
Unrealized losses:Available for saleTrading
Fair value
Weighted average couponbased on par value
December 31, 2011RMBS
$ 1,488,39785,488
(17)1,573,868
10,787
—
(7,405)—
$ 1,577,250
4.54%
CMBS$ 266,952
107,985—
374,937
12,0961,919
(1,043)
—$ 387,909
5.20%
Total$ 1,755,349
193,473(17)
1,948,805
22,8831,919
(8,448)
—$ 1,965,159
4.64%
December 31, 2010RMBS
$ 937,37643,776
(36)981,116
8,266
—
(3,371)—
$ 986,011
4.46%
CMBS$ 190,511
18,757—
209,268
567—
(3,267)
—$ 206,568
5.41%
Total$ 1,127,887
62,533(36)
1,190,384
8,833—
(6,638)
—$ 1,192,579
4.62%
The Company purchased $1,215,155 of Agency RMBS and $202,436 of Agency CMBS in 2011. As of December 31,
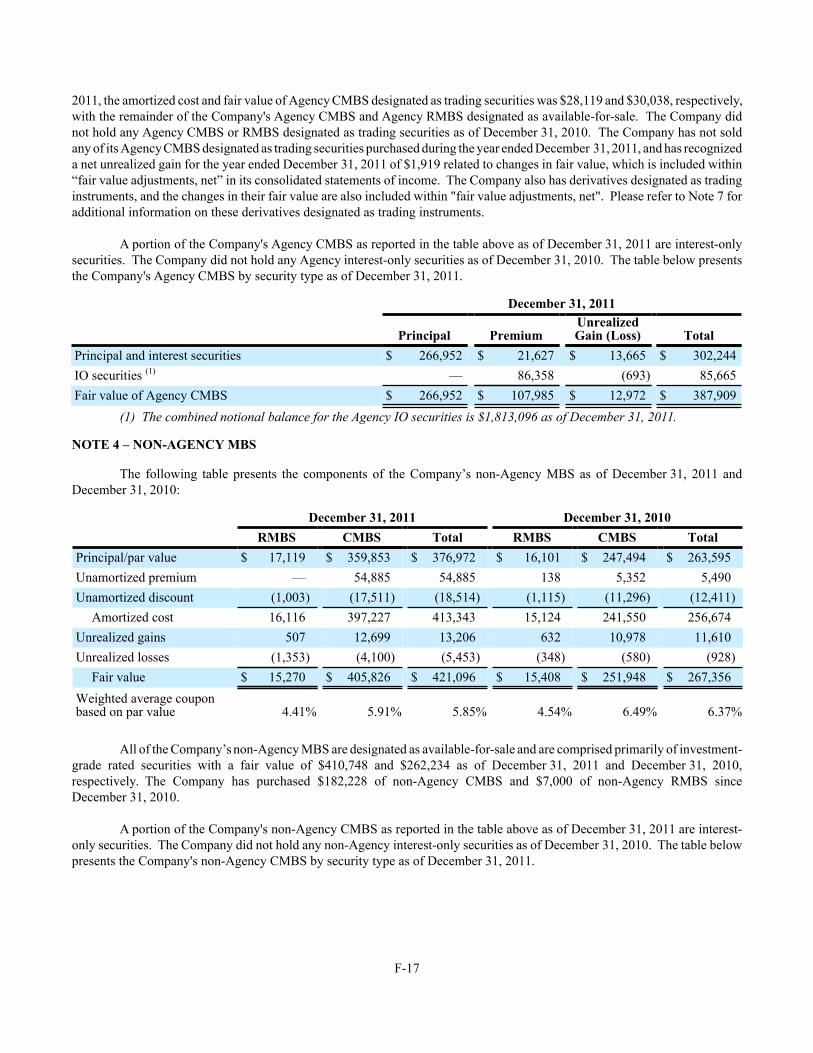
F-17
2011, the amortized cost and fair value of Agency CMBS designated as trading securities was $28,119 and $30,038, respectively, with the remainder of the Company's Agency CMBS and Agency RMBS designated as available-for-sale. The Company did not hold any Agency CMBS or RMBS designated as trading securities as of December 31, 2010. The Company has not sold any of its Agency CMBS designated as trading securities purchased during the year ended December 31, 2011, and has recognized a net unrealized gain for the year ended December 31, 2011 of $1,919 related to changes in fair value, which is included within “fair value adjustments, net” in its consolidated statements of income. The Company also has derivatives designated as trading instruments, and the changes in their fair value are also included within "fair value adjustments, net". Please refer to Note 7 for additional information on these derivatives designated as trading instruments.
A portion of the Company's Agency CMBS as reported in the table above as of December 31, 2011 are interest-only securities. The Company did not hold any Agency interest-only securities as of December 31, 2010. The table below presents the Company's Agency CMBS by security type as of December 31, 2011.
Principal and interest securitiesIO securities (1)
Fair value of Agency CMBS
December 31, 2011
Principal$ 266,952
—$ 266,952
Premium$ 21,627
86,358$ 107,985
UnrealizedGain (Loss)
$ 13,665(693)
$ 12,972
Total$ 302,244
85,665$ 387,909
(1) The combined notional balance for the Agency IO securities is $1,813,096 as of December 31, 2011.
NOTE 4 – NON-AGENCY MBS
The following table presents the components of the Company’s non-Agency MBS as of December 31, 2011 and December 31, 2010:
Principal/par valueUnamortized premiumUnamortized discount
Amortized costUnrealized gainsUnrealized losses
Fair valueWeighted average couponbased on par value
December 31, 2011RMBS
$ 17,119—
(1,003)16,116
507(1,353)
$ 15,270
4.41%
CMBS$ 359,853
54,885(17,511)397,22712,699(4,100)
$ 405,826
5.91%
Total$ 376,972
54,885(18,514)413,34313,206(5,453)
$ 421,096
5.85%
December 31, 2010RMBS
$ 16,101138
(1,115)15,124
632(348)
$ 15,408
4.54%
CMBS$ 247,494
5,352(11,296)241,55010,978
(580)$ 251,948
6.49%
Total$ 263,595
5,490(12,411)256,67411,610
(928)$ 267,356
6.37%
All of the Company’s non-Agency MBS are designated as available-for-sale and are comprised primarily of investment-grade rated securities with a fair value of $410,748 and $262,234 as of December 31, 2011 and December 31, 2010, respectively. The Company has purchased $182,228 of non-Agency CMBS and $7,000 of non-Agency RMBS since December 31, 2010. A portion of the Company's non-Agency CMBS as reported in the table above as of December 31, 2011 are interest-only securities. The Company did not hold any non-Agency interest-only securities as of December 31, 2010. The table below presents the Company's non-Agency CMBS by security type as of December 31, 2011.

F-18
Principal and interest securitiesIO securities (1)
Fair value of non-Agency CMBS
December 31, 2011
Principal$ 359,853
—$ 359,853
Net Premium(Discount)
$ (13,865)51,239
$ 37,374
UnrealizedGain
$ 8,082517
$ 8,599
Total$ 354,070
51,756$ 405,826
(1) The combined notional balance for the non-Agency CMBS IO securities is $906,202 as of December 31, 2011.
NOTE 5 – SECURITIZED MORTGAGE LOANS, NET
All of the Company's securitized mortgage loans are pledged as collateral for its associated securitization financing bonds, which are discussed further in Note 9. Please also refer to Note 6 for disclosures related to impaired securitized mortgage loans and the related allowance for loans losses. The following table summarizes the components of securitized mortgage loans as of December 31, 2011 and December 31, 2010:
Principal/par valueFHBT(1)
Unamortized premium, netUnamortized discount, net
Amortized costAllowance for loan losses
December 31, 2011
Commercial$ 62,822
5,207—
(254)67,775(2,268)
$ 65,507
Single-family
$ 47,657—
770—
48,427(231)
$ 48,196
Total$ 110,479
5,207770
(254)116,202
(2,499)$ 113,703
December 31, 2010
Commercial$ 99,432
3,455—
(520)102,367
(4,200)$ 98,167
Single-family
$ 54,181—
884—
55,065(270)
$ 54,795
Total$ 153,613
3,455884
(520)157,432
(4,470)$ 152,962
(1) Funds held by trustees includes $4,832 and $3,306 as of December 31, 2011 and December 31, 2010, respectively, of
cash and cash equivalents held by the trust for defeased commercial mortgage loans. These funds were paid by the borrower to the securitization trust pursuant to the contractual terms of the mortgage loan and represent replacement collateral for defeased loans. In accordance with the underlying agreements, cash payments are made by the securitization trust using these defeased amounts until the funds held for that particular defeased mortgage loan equal the scheduled principal balance of the original loan. At that point a final distribution is made to the trust as payment in full of the principal amount due on the loan.
The balance of the Company's securitized commercial mortgage loans has decreased since December 31, 2010 primarily due to principal payments, including amounts received on defeased loans, of $31,093. The Company's securitized commercial mortgage loans were originated principally in 1996 and 1997 and are collateralized by first deeds of trust on income producing properties. Approximately 77% of these securitized commercial mortgage loans are secured by multifamily properties. As of December 31, 2011 and December 31, 2010, the loan-to-value ratio based on original appraisal was 42% and 45%, respectively. The unpaid principal balance of the securitized commercial mortgage loans identified as seriously delinquent (60 or more days past due) and therefore on nonaccrual status is $14,997 as of December 31, 2011 compared to $14,089 as of December 31, 2010.
The balance of the Company's securitized single-family mortgage loans have decreased since December 31, 2010 primarily due to principal payments on the loans of $6,463, of which 49% were unscheduled. These single-family mortgage loans are secured by first deeds of trust on residential real estate and were originated principally from 1992 to 1997. As of December 31, 2011 and December 31, 2010, the loan-to-value ratio based on original appraisal was approximately 46% and 48%, respectively. The unpaid principal balance of the Company's securitized single-family mortgage loans identified as seriously delinquent as of December 31, 2011 is $3,366 compared to $3,658 as of December 31, 2010. The Company continues accruing interest on any seriously delinquent securitized single-family mortgage loan so long as the primary servicer continues to advance the interest and/or principal due on the loan.

F-19
NOTE 6 – ALLOWANCE FOR LOAN LOSSES
As discussed in Note 1, the Company estimates for currently existing and probable losses for its mortgage loans that are considered impaired. A loan can be considered impaired even if it is not delinquent. The following table summarizes the aggregate activity for the portion of the allowance for loan losses that relates to the securitized mortgage loan portfolio for the periods indicated:
Allowance at beginning ofperiodProvision for loan losses (1)
Credit losses, net of recoveries (2)
Allowance at end of period (3)
For the Year EndedDecember 31,
2011
Commercial
$ 4,200848
(2,780)$ 2,268
Single-family
$ 27023
(62)$ 231
2010
Commercial
$ 3,9351,194
(929)$ 4,200
Single-family
$ 277—
(7)$ 270
2009
Commercial
$ 3,527433
(25)$ 3,935
Single-family
$ 180254
(157)$ 277
(1) Activity shown for provision for loan losses for the years ended December 31, 2010 and December 31, 2009 excludes provision of $185 and $96, respectively related to the Company’s unsecuritized mortgage loan portfolio.
(2) Activity shown for credit losses for the year ended December 31, 2009 excludes $(281) related to the Company's unsecuritized mortgage loan portfolio.
(3) The amount of allowance related to the Company's unsecuritized mortgage loan portfolio is $0 as of December 31, 2011, $0 as of December 31, 2010, and $96 as of December 31, 2009.
The following table presents certain information on impaired securitized commercial and single-family mortgage loans as of December 31, 2011 and December 31, 2010:
Unpaid principal balance of impaired securitized loansBasis adjustments related to impaired securitized loansAmortized cost basis of impaired securitized loansAllowance for loan lossesInvestment in excess of allowance
December 31, 2011Commercial
$ 4,7248
4,732(2,268)
$ 2,464
Single-family$ 3,000
483,048(231)
$ 2,817
December 31, 2010Commercial
$ 18,219(65)
18,154(4,200)
$ 13,954
Single-family$ 3,587
593,646(270)
$ 3,376
The Company recognized $109 of interest income on impaired securitized commercial mortgage loans for the year ended December 31, 2011 compared to $609 and $1,423 of interest income for the years ended December 31, 2010 and December 31, 2009. The Company recognized $162 of interest income on impaired securitized single-family mortgage loans for the year ended December 31, 2011 compared to $205 and $319 on impaired single-family mortgage loans for the years ended December 31, 2010 and December 31, 2009.
NOTE 7 – DERIVATIVES
Please see Note 1 for additional information related to the Company’s accounting policies for derivative instruments.
As of December 31, 2011 and December 31, 2010, the Company’s derivative financial instruments are comprised entirely of interest rate swaps, and are designated as either hedging instruments or trading instruments. With respect to hedging
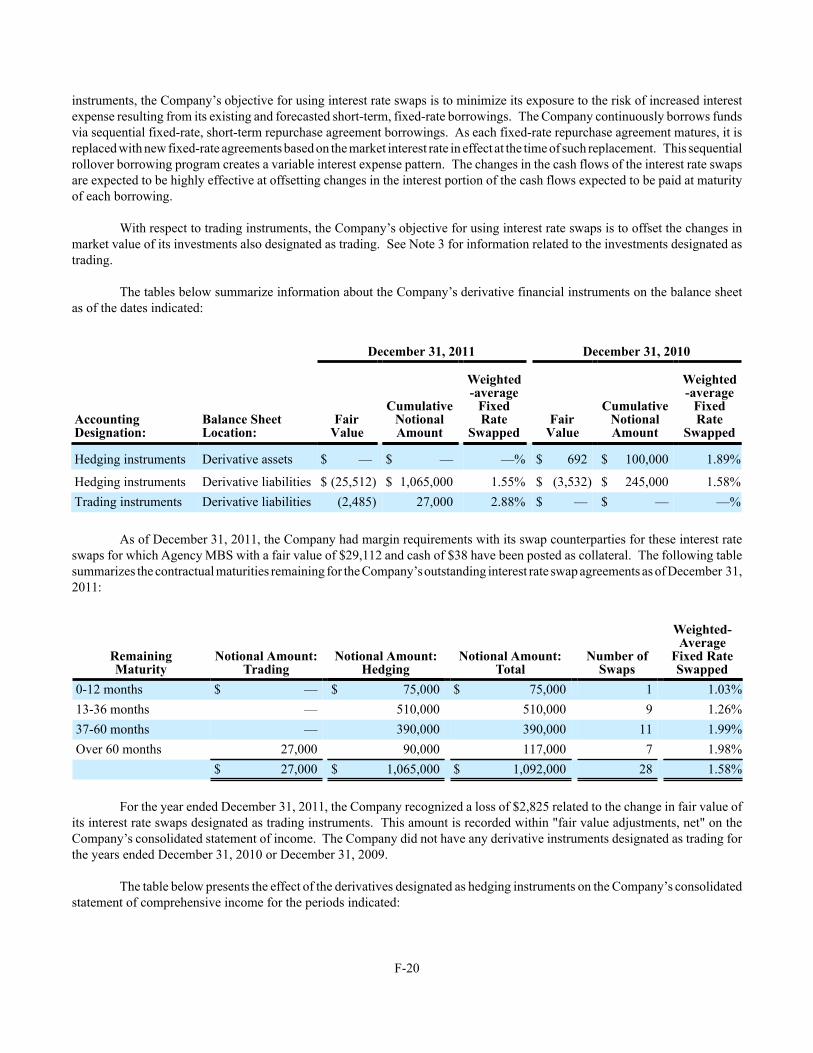
F-20
instruments, the Company’s objective for using interest rate swaps is to minimize its exposure to the risk of increased interest expense resulting from its existing and forecasted short-term, fixed-rate borrowings. The Company continuously borrows funds via sequential fixed-rate, short-term repurchase agreement borrowings. As each fixed-rate repurchase agreement matures, it is replaced with new fixed-rate agreements based on the market interest rate in effect at the time of such replacement. This sequential rollover borrowing program creates a variable interest expense pattern. The changes in the cash flows of the interest rate swaps are expected to be highly effective at offsetting changes in the interest portion of the cash flows expected to be paid at maturity of each borrowing.
With respect to trading instruments, the Company’s objective for using interest rate swaps is to offset the changes in market value of its investments also designated as trading. See Note 3 for information related to the investments designated as trading.
The tables below summarize information about the Company’s derivative financial instruments on the balance sheet as of the dates indicated:
AccountingDesignation:
Hedging instruments
Hedging instrumentsTrading instruments
Balance SheetLocation:
Derivative assets
Derivative liabilitiesDerivative liabilities
December 31, 2011
FairValue
$ —
$ (25,512)(2,485)
CumulativeNotionalAmount
$ —
$ 1,065,00027,000
Weighted-average
Fixed Rate
Swapped
—%
1.55%2.88%
December 31, 2010
FairValue
$ 692
$ (3,532)$ —
CumulativeNotionalAmount
$ 100,000
$ 245,000$ —
Weighted-average
Fixed Rate
Swapped
1.89%
1.58%—%
As of December 31, 2011, the Company had margin requirements with its swap counterparties for these interest rate
swaps for which Agency MBS with a fair value of $29,112 and cash of $38 have been posted as collateral. The following table summarizes the contractual maturities remaining for the Company’s outstanding interest rate swap agreements as of December 31, 2011:
RemainingMaturity
0-12 months13-36 months37-60 monthsOver 60 months
Notional Amount:Trading
$ ———
27,000$ 27,000
Notional Amount:
Hedging$ 75,000
510,000390,00090,000
$ 1,065,000
Notional Amount:
Total$ 75,000
510,000390,000117,000
$ 1,092,000
Number of
Swaps19
117
28
Weighted-Average
Fixed Rate Swapped
1.03%1.26%1.99%1.98%1.58%
For the year ended December 31, 2011, the Company recognized a loss of $2,825 related to the change in fair value of its interest rate swaps designated as trading instruments. This amount is recorded within "fair value adjustments, net" on the Company’s consolidated statement of income. The Company did not have any derivative instruments designated as trading for the years ended December 31, 2010 or December 31, 2009.
The table below presents the effect of the derivatives designated as hedging instruments on the Company’s consolidated statement of comprehensive income for the periods indicated:
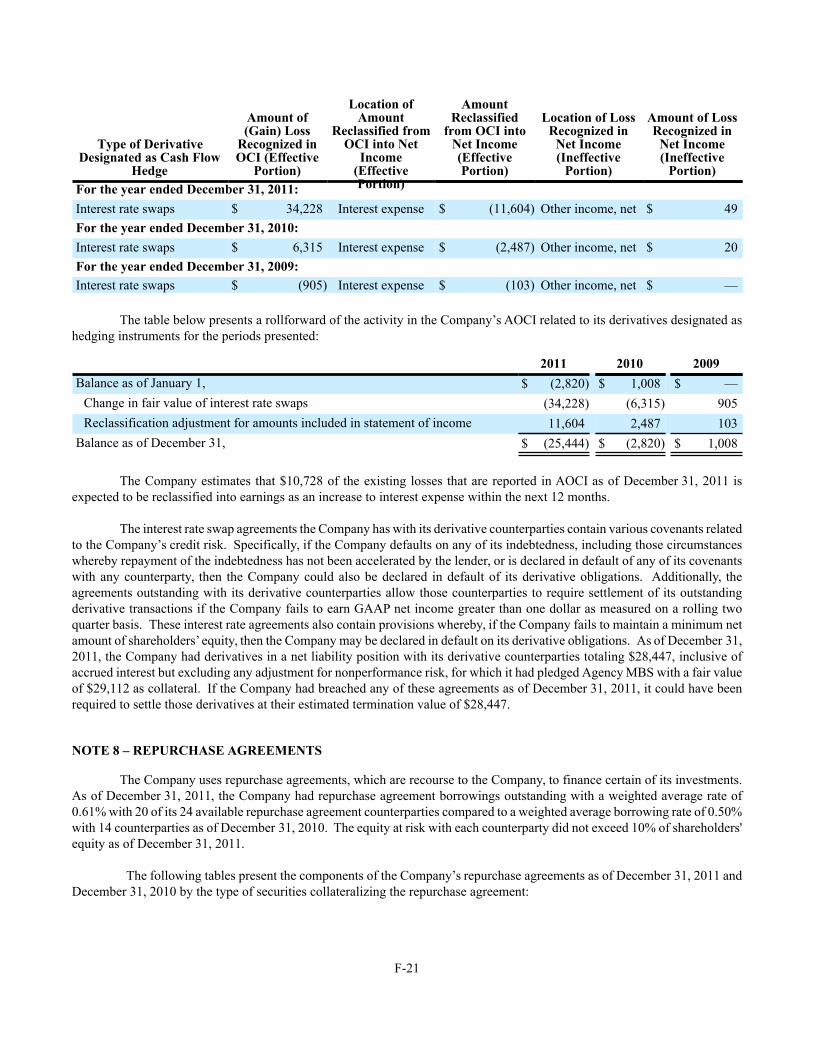
F-21
Type of DerivativeDesignated as Cash Flow
HedgeFor the year ended December 31, 2011:Interest rate swapsFor the year ended December 31, 2010:Interest rate swapsFor the year ended December 31, 2009:Interest rate swaps
Amount of(Gain) Loss
Recognized inOCI (Effective
Portion)
$ 34,228
$ 6,315
$ (905)
Location ofAmount
Reclassified fromOCI into Net
Income(EffectivePortion)
Interest expense
Interest expense
Interest expense
AmountReclassified
from OCI intoNet Income(EffectivePortion)
$ (11,604)
$ (2,487)
$ (103)
Location of Loss Recognized in
Net Income (Ineffective
Portion)
Other income, net
Other income, net
Other income, net
Amount of LossRecognized in
Net Income(Ineffective
Portion)
$ 49
$ 20
$ —
The table below presents a rollforward of the activity in the Company’s AOCI related to its derivatives designated as hedging instruments for the periods presented:
Balance as of January 1,
Change in fair value of interest rate swapsReclassification adjustment for amounts included in statement of income
Balance as of December 31,
2011$ (2,820)
(34,228)11,604
$ (25,444)
2010$ 1,008
(6,315)2,487
$ (2,820)
2009$ —
905103
$ 1,008
The Company estimates that $10,728 of the existing losses that are reported in AOCI as of December 31, 2011 is expected to be reclassified into earnings as an increase to interest expense within the next 12 months.
The interest rate swap agreements the Company has with its derivative counterparties contain various covenants related to the Company’s credit risk. Specifically, if the Company defaults on any of its indebtedness, including those circumstances whereby repayment of the indebtedness has not been accelerated by the lender, or is declared in default of any of its covenants with any counterparty, then the Company could also be declared in default of its derivative obligations. Additionally, the agreements outstanding with its derivative counterparties allow those counterparties to require settlement of its outstanding derivative transactions if the Company fails to earn GAAP net income greater than one dollar as measured on a rolling two quarter basis. These interest rate agreements also contain provisions whereby, if the Company fails to maintain a minimum net amount of shareholders’ equity, then the Company may be declared in default on its derivative obligations. As of December 31, 2011, the Company had derivatives in a net liability position with its derivative counterparties totaling $28,447, inclusive of accrued interest but excluding any adjustment for nonperformance risk, for which it had pledged Agency MBS with a fair value of $29,112 as collateral. If the Company had breached any of these agreements as of December 31, 2011, it could have been required to settle those derivatives at their estimated termination value of $28,447.
NOTE 8 – REPURCHASE AGREEMENTS
The Company uses repurchase agreements, which are recourse to the Company, to finance certain of its investments. As of December 31, 2011, the Company had repurchase agreement borrowings outstanding with a weighted average rate of 0.61% with 20 of its 24 available repurchase agreement counterparties compared to a weighted average borrowing rate of 0.50% with 14 counterparties as of December 31, 2010. The equity at risk with each counterparty did not exceed 10% of shareholders' equity as of December 31, 2011.
The following tables present the components of the Company’s repurchase agreements as of December 31, 2011 and December 31, 2010 by the type of securities collateralizing the repurchase agreement:
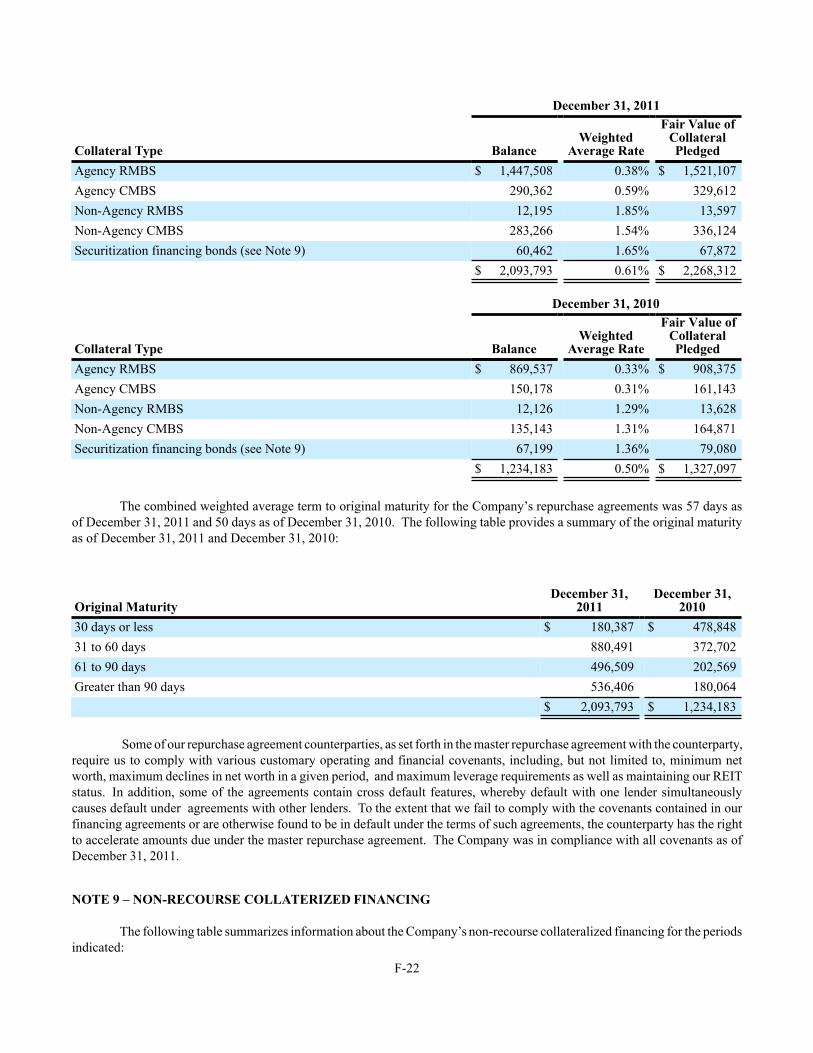
F-22
Collateral TypeAgency RMBSAgency CMBSNon-Agency RMBSNon-Agency CMBSSecuritization financing bonds (see Note 9)
December 31, 2011
Balance$ 1,447,508
290,36212,195
283,26660,462
$ 2,093,793
WeightedAverage Rate
0.38%0.59%1.85%1.54%1.65%0.61%
Fair Value of Collateral Pledged
$ 1,521,107329,61213,597
336,12467,872
$ 2,268,312
Collateral TypeAgency RMBSAgency CMBSNon-Agency RMBSNon-Agency CMBSSecuritization financing bonds (see Note 9)
December 31, 2010
Balance$ 869,537
150,17812,126
135,14367,199
$ 1,234,183
WeightedAverage Rate
0.33%0.31%1.29%1.31%1.36%0.50%
Fair Value ofCollateralPledged
$ 908,375161,14313,628
164,87179,080
$ 1,327,097
The combined weighted average term to original maturity for the Company’s repurchase agreements was 57 days as of December 31, 2011 and 50 days as of December 31, 2010. The following table provides a summary of the original maturity as of December 31, 2011 and December 31, 2010:
Original Maturity30 days or less31 to 60 days61 to 90 daysGreater than 90 days
December 31,2011
$ 180,387880,491496,509536,406
$ 2,093,793
December 31,2010
$ 478,848372,702202,569180,064
$ 1,234,183
Some of our repurchase agreement counterparties, as set forth in the master repurchase agreement with the counterparty, require us to comply with various customary operating and financial covenants, including, but not limited to, minimum net worth, maximum declines in net worth in a given period, and maximum leverage requirements as well as maintaining our REIT status. In addition, some of the agreements contain cross default features, whereby default with one lender simultaneously causes default under agreements with other lenders. To the extent that we fail to comply with the covenants contained in our financing agreements or are otherwise found to be in default under the terms of such agreements, the counterparty has the right to accelerate amounts due under the master repurchase agreement. The Company was in compliance with all covenants as of December 31, 2011.
NOTE 9 – NON-RECOURSE COLLATERIZED FINANCING
The following table summarizes information about the Company’s non-recourse collateralized financing for the periods indicated:
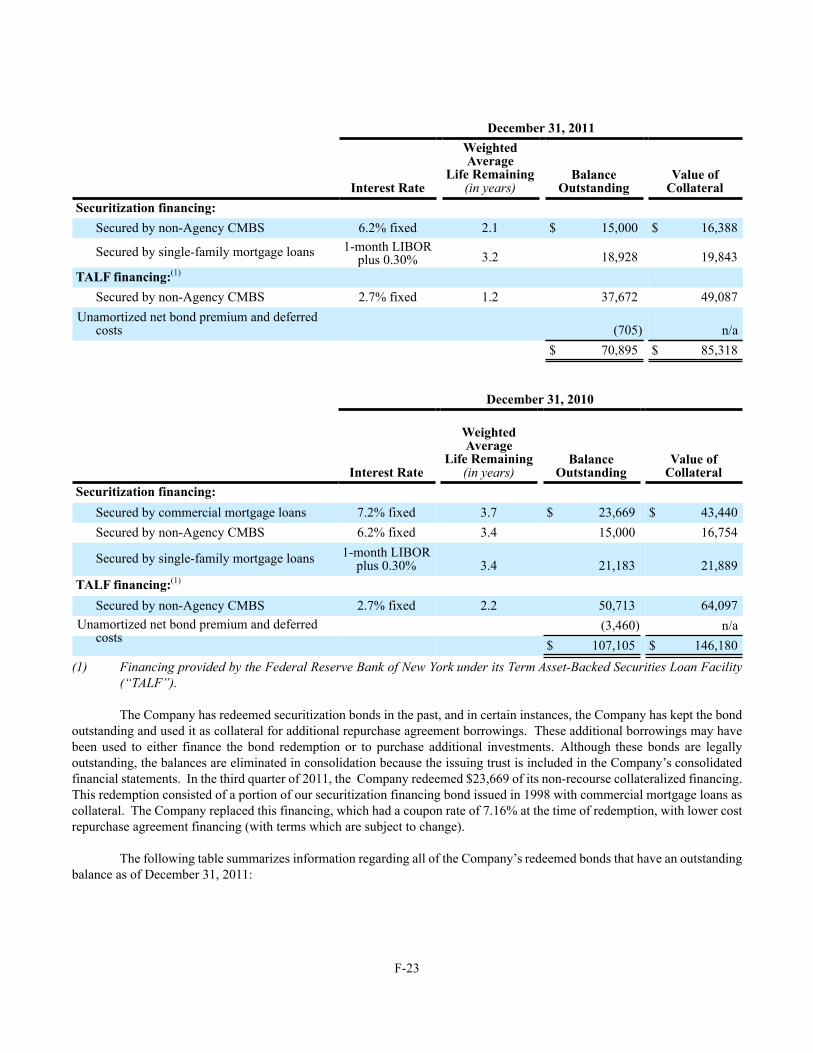
F-23
Securitization financing:Secured by non-Agency CMBS
Secured by single-family mortgage loans
TALF financing:(1)
Secured by non-Agency CMBSUnamortized net bond premium and deferred
costs
December 31, 2011
Interest Rate
6.2% fixed1-month LIBOR
plus 0.30%
2.7% fixed
Weighted Average
Life Remaining(in years)
2.1
3.2
1.2
BalanceOutstanding
$ 15,000
18,928
37,672
(705)$ 70,895
Value ofCollateral
$ 16,388
19,843
49,087
n/a$ 85,318
Securitization financing:Secured by commercial mortgage loansSecured by non-Agency CMBS
Secured by single-family mortgage loans
TALF financing:(1)
Secured by non-Agency CMBSUnamortized net bond premium and deferred
costs
December 31, 2010
Interest Rate
7.2% fixed6.2% fixed
1-month LIBORplus 0.30%
2.7% fixed
Weighted Average
Life Remaining(in years)
3.73.4
3.4
2.2
BalanceOutstanding
$ 23,66915,000
21,183
50,713(3,460)
$ 107,105
Value ofCollateral
$ 43,44016,754
21,889
64,097n/a
$ 146,180(1) Financing provided by the Federal Reserve Bank of New York under its Term Asset-Backed Securities Loan Facility
(“TALF”).
The Company has redeemed securitization bonds in the past, and in certain instances, the Company has kept the bond outstanding and used it as collateral for additional repurchase agreement borrowings. These additional borrowings may have been used to either finance the bond redemption or to purchase additional investments. Although these bonds are legally outstanding, the balances are eliminated in consolidation because the issuing trust is included in the Company’s consolidated financial statements. In the third quarter of 2011, the Company redeemed $23,669 of its non-recourse collateralized financing. This redemption consisted of a portion of our securitization financing bond issued in 1998 with commercial mortgage loans as collateral. The Company replaced this financing, which had a coupon rate of 7.16% at the time of redemption, with lower cost repurchase agreement financing (with terms which are subject to change).
The following table summarizes information regarding all of the Company’s redeemed bonds that have an outstanding balance as of December 31, 2011:

F-24
Collateral TypeSingle-family mortgage loansCommercial mortgage loans
December 31, 2011
Par Value Outstanding
$ 21,47749,220
$ 70,697
Fair Value$ 18,616
49,256$ 67,872
Repurchase Agreement
Balance$ 16,980
43,482$ 60,462
NOTE 10 – FAIR VALUE OF FINANCIAL INSTRUMENTS
The Company utilizes fair value measurements at various levels within the hierarchy established by ASC Topic 820 for certain of its assets and liabilities. The three levels of valuation hierarchy established by ASC Topic 820 are as follows:
• Level 1 – Inputs are unadjusted, quoted prices in active markets for identical assets or liabilities at the measurement date.
• Level 2 – Inputs (other than quoted prices included in Level 1) are either directly or indirectly observable for the asset or liability through correlation with market data at the measurement date and for the duration of the instrument’s anticipated life. The Company’s fair valued assets and liabilities that are generally included in this category are Agency MBS, certain non-Agency CMBS, and derivatives.
• Level 3 – Inputs reflect management’s best estimate of what market participants would use in pricing the asset or liability at the measurement date. Consideration is given to the risk inherent in the valuation technique and the risk inherent in the inputs to the model. Generally, the Company’s assets and liabilities carried at fair value and included in this category are non-Agency MBS.
The following table presents the fair value of the Company’s assets and liabilities measured at fair value on a recurring basis as of December 31, 2011, segregated by the hierarchy level of the fair value estimate:
Assets:
Agency MBSNon-Agency MBS:
CMBSRMBS
Other investmentsTotal assets carried at fair valueLiabilities:
Derivative liabilitiesTotal liabilities carried at fair value
Fair Value
$ 1,965,159
405,82615,270
25$ 2,386,280
$ 27,997$ 27,997
Fair Value MeasurementsLevel 1
$ —
———
$ —
$ —$ —
Level 2 $ 1,965,159
279,969
7,127—
$ 2,252,255
$ 27,997$ 27,997
Level 3 $ —
125,857
8,14325
$ 134,025
$ —$ —
The Company’s Agency MBS, as well a portion of its non-Agency CMBS, are substantially similar to securities that either are currently actively traded or have been recently traded in their respective market. Their fair values are derived from an average of multiple dealer quotes and thus are considered Level 2 fair value measurements.
The Company’s remaining non-Agency CMBS and non-Agency RMBS are comprised of securities for which there are not substantially similar securities that trade frequently. As such, the Company determines the fair value of those securities by discounting the estimated future cash flows derived from pricing models using assumptions that are confirmed to the extent possible by third party dealers or other pricing indicators. Significant inputs into those pricing models are Level 3 in nature due
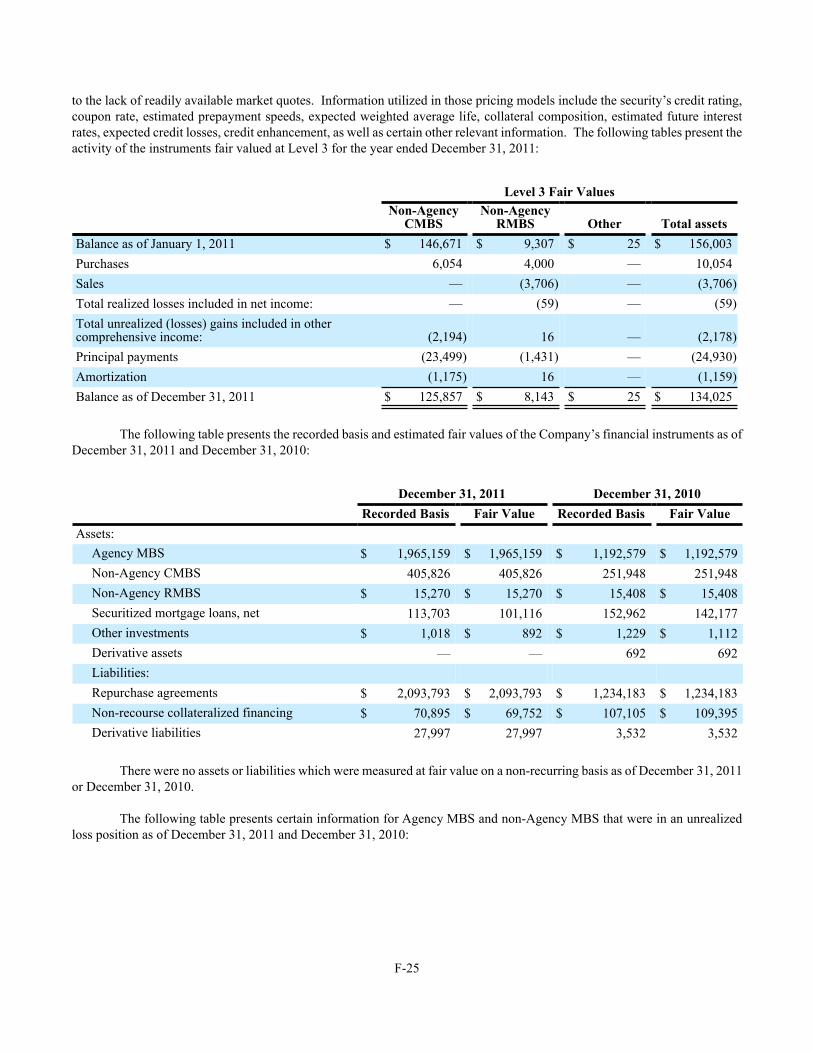
F-25
to the lack of readily available market quotes. Information utilized in those pricing models include the security’s credit rating, coupon rate, estimated prepayment speeds, expected weighted average life, collateral composition, estimated future interest rates, expected credit losses, credit enhancement, as well as certain other relevant information. The following tables present the activity of the instruments fair valued at Level 3 for the year ended December 31, 2011:
Balance as of January 1, 2011PurchasesSalesTotal realized losses included in net income:Total unrealized (losses) gains included in othercomprehensive income:Principal paymentsAmortizationBalance as of December 31, 2011
Level 3 Fair ValuesNon-Agency
CMBS$ 146,671
6,054——
(2,194)(23,499)(1,175)
$ 125,857
Non-AgencyRMBS
$ 9,3074,000
(3,706)(59)
16(1,431)
16$ 8,143
Other$ 25
———
———
$ 25
Total assets$ 156,003
10,054(3,706)
(59)
(2,178)(24,930)(1,159)
$ 134,025
The following table presents the recorded basis and estimated fair values of the Company’s financial instruments as of December 31, 2011 and December 31, 2010:
Assets:
Agency MBSNon-Agency CMBSNon-Agency RMBSSecuritized mortgage loans, netOther investmentsDerivative assetsLiabilities:Repurchase agreementsNon-recourse collateralized financingDerivative liabilities
December 31, 2011Recorded Basis $ 1,965,159
405,826$ 15,270
113,703$ 1,018
—
$ 2,093,793$ 70,895
27,997
Fair Value $ 1,965,159
405,826$ 15,270
101,116$ 892
—
$ 2,093,793$ 69,752
27,997
December 31, 2010Recorded Basis $ 1,192,579
251,948$ 15,408
152,962$ 1,229
692
$ 1,234,183$ 107,105
3,532
Fair Value $ 1,192,579
251,948$ 15,408
142,177$ 1,112
692
$ 1,234,183$ 109,395
3,532
There were no assets or liabilities which were measured at fair value on a non-recurring basis as of December 31, 2011 or December 31, 2010.
The following table presents certain information for Agency MBS and non-Agency MBS that were in an unrealized loss position as of December 31, 2011 and December 31, 2010:

F-26
Unrealized loss position for:
Less than one year:Agency MBSNon-Agency MBS
One year or more:Agency MBSNon-Agency MBS
December 31, 2011
Fair Value $ 680,101
153,974
160,5442,993
$ 997,612
UnrealizedLoss
$ 6,765
5,075
1,684379
$ 13,903
December 31, 2010
Fair Value $ 695,854
45,602
—3,494
$ 744,950
UnrealizedLoss
$ 6,638
592
—337
$ 7,567
Because the principal and interest related to Agency MBS are guaranteed by the government-sponsored entities Fannie Mae and Freddie Mac who have the implicit guarantee of the U.S. government, the Company does not consider any of the unrealized losses on its Agency MBS to be credit related. However, because these guarantors are not explicitly backed by the full faith and credit of the United States, the Company has assessed its ability to hold any Agency MBS with an unrealized loss until the recovery in its value. This assessment is based on the amount of the unrealized loss and significance of the related investment as well as the Company’s current leverage and anticipated liquidity. Based on this analysis, the Company has determined that the unrealized losses on its Agency MBS as of December 31, 2011 are temporary.
The Company reviews any non-Agency MBS in an unrealized loss position to evaluate whether any decline in fair value represents an other-than-temporary impairment. The evaluation includes a review of the credit ratings of these MBS and the seasoning of the mortgage loans collateralizing these securities as well as the estimated future cash flows which include projected losses. The Company performed this evaluation for the non-Agency MBS in an unrealized loss position as of December 31, 2011 and has determined that there have not been any adverse changes in the timing or amount of estimated future cash flows that necessitate a recognition of other-than-temporary impairment amounts as of December 31, 2011.
NOTE 11 – SHAREHOLDERS' EQUITY Common Stock
During the year ended December 31, 2011, the Company offered and sold pursuant to its continuous equity placement program (also known as an "at the market" program, or "ATM") through its sales agent, JMP Securities LLC, 409,237 shares of its common stock at an average price of $10.75 in negotiated transactions or transactions that are deemed to be “at the market offerings,” as defined in Rule 415 under the 1933 Act, including sales made directly on the New York Stock Exchange or sales made to or through a market maker other than on an exchange. The Company received proceeds of $4,332, net of broker sales commission. During December 2011, the Company amended its Equity Distribution Agreement with JMP Securities LLC to issue and sell up to 8,000,000 shares of the Company's common stock. As of December 31, 2011, the Company had not issued any shares under this amended ATM program. Please refer to Note 16 regarding issuances of the Company's common stock subsequent to December 31, 2011.
During the year ended December 31, 2011, the Company closed a public offering of 9,200,000 shares of its common stock, including 1,200,000 shares pursuant to an overallotment option that was fully exercised by the underwriters, at a public offering price of $10.35 per share for total net proceeds of $90,459 after deduction of underwriting discounts, commissions, and expenses. The Company has used these proceeds to acquire additional investments consistent with its investment policy.
The Company implemented a Dividend Reinvestment and Share Purchase Plan ("DRIP") in 2011 which allows registered shareholders to automatically reinvest some or all of their quarterly dividends in shares of the Company’s stock and provides an opportunity for investors to purchase shares of the Company’s stock, potentially at a discount to the prevailing market price. During 2011, the Company issued 4,365 shares pursuant to the DRIP for total proceeds of $39.

F-27
During the year ended December 31, 2010, the Company redeemed each outstanding share of the Company's Series D 9.50% Cumulative Convertible Preferred Stock (the "Series D Preferred Stock") in exchange for one share of its common stock. as of December 31, 2011 and December 31, 2010, the Company does not have any outstanding shares of the Series D Preferred Stock.
The following table presents a summary of the changes in the number of common shares outstanding for the periods indicated:
Balance at beginning of periodCommon stock issued under ATM programsCommon stock issued via public offeringsCommon stock issued under DRIPCommon stock redeemed under 2004 Stock and Incentive PlanCommon stock issued under 2009 Stock and Incentive PlanConversion of preferred stock to common stockBalance at end of period
For the Year EndedDecember 31,
201130,342,897
409,2379,200,000
4,36515,000
411,031—
40,382,530
201013,931,5125,192,8166,900,000
050,00047,030
4,221,53930,342,897
200912,169,7621,751,750
———
10,000—
13,931,512 Incentive Plans. Of the 2,500,000 shares of common stock authorized for issuance under the Company's 2009 Stock and Incentive Plan, 2,041,939 shares remain available as of December 31, 2011. Although the Company is no longer issuing stock-based compensation under its 2004 Stock Incentive Plan, there are stock options, SARs, and restricted stock still outstanding (and exercisable if vested) thereunder as of December 31, 2011.
The Company has not granted any stock options since the year ended December 31, 2008, and the compensation cost related to all stock options has been expensed in prior periods. The following table presents a rollforward of the stock option activity for the periods presented:
Stock options outstanding at beginning of periodStock options forfeitedStock options exercisedStock options outstanding at end of period
For the Year EndedDecember 31,
2011
Quantity
45,000—
(15,000)
30,000
Weighted-Average
Price
$ 8.75—
7.43
$ 9.42
2010
Quantity
95,000—
(50,000)
45,000
Weighted-Average
Price
$ 8.59—
8.45
$ 8.75
2009
Quantity
110,000(15,000)
—
95,000
Weighted-Average
Price
$ 8.618.30
—
$ 8.59
As of December 31, 2011, the fair value of the Company’s outstanding restricted stock remaining to be amortized into net income is $2,633. The following table presents a rollforward of the restricted stock activity for the periods presented:

F-28
Restricted stock outstanding at beginning of periodRestricted stock grantedRestricted stock vestedRestricted stock outstanding at end of period
For the Year EndedDecember 31,
201125,000
358,006(17,500)365,506
201032,50010,000
(17,500)25,000
200930,00010,000(7,500)32,500
As of December 31, 2011 and December 31, 2010, the fair value of the Company’s outstanding SARs of $77 and $492, respectively, are recorded as liabilities on its consolidated balance sheet for the respective periods. The fair value of SARs is estimated using the Black-Scholes option valuation model based upon the assumptions in the table below.
Expected volatilityWeighted-average volatilityEstimated dividend yieldExpected term (in months)Weighted-average risk-free rateRange of risk-free rates
December 31,2011
27.9%-37.0%31.7%12.2%
100.69%
0.66%-0.72%
December 31,2010
16.2%-18.6%17.3%
9.9%-10.3%12
0.81%0.4%-1.3%
The following table presents a rollforward of the SARs activity for the periods presented:
SARs outstanding at beginning of periodSARs exercisedSARs outstanding at end of period
For the Year EndedDecember 31,
2011
Quantity136,875(77,500)59,375
Weighted-Average
Price$ 7.31
7.64$ 6.87
2010
Quantity278,146
(141,271)136,875
Weighted-Average
Price$ 7.27
7.24$ 7.31
2009
Quantity278,146
—278,146
Weighted-Average
Price$ 7.27
—$ 7.27
As of December 31, 2011, all of the Company's outstanding SARs are vested and exercisable at a weighted average price of $6.87 at any time prior to their expiration dates. The weighted average remaining contractual term on these outstanding SARs as of December 31, 2011 is 19 months, and 25,000 of the outstanding SARs are set to expire if they are not exercised on or before December 31, 2012.
Total stock-based compensation expense recognized by the Company for the year ended December 31, 2011 is $917 compared to $627 and $526 for the years ended December 31, 2010 and December 31, 2009, respectively.
Additional Paid-In Capital
The following table presents a rollforward of the Company's changes in additional paid-in capital for the year ended December 31, 2011:

F-29
Balance as of January 1, 2011Common stock issuances:
DRIP issuancesATM issuancesPublic offeringsIncentive plans
Amortization of restricted stockCapitalized expensesBalance as of December 31, 2011
Additional Paid-In Capital
$ 538,304
404,284
90,343656
1,198(142)
$ 634,683
Accumulated Other Comprehensive Income
Accumulated other comprehensive income as of December 31, 2011 and December 31, 2010 is comprised of the following items:
Available for sale investments:Unrealized gainsUnrealized losses Hedging instruments:Unrealized gainsUnrealized losses Accumulated other comprehensive (loss) income
December 31,2011
$ 36,091
(13,902)22,189
—
(25,444)(25,444)
$ (3,255)
December 31,2010
$ 20,443
(7,566)12,877
692
(3,512)(2,820)
$ 10,057
Due to the Company’s REIT status, the items comprising other comprehensive income do not have related tax effects.
Accumulated Deficit The following table presents a rollforward of the Company's accumulated deficit for the year ended December 31, 2011:

F-30
Balance as of January 1, 2011Net income for the quarter ended March 31, 2011Dividends declared ($0.27 per share) for the quarter ended March 31, 2011Net income for the quarter ended June 30, 2011Dividends declared ($0.27 per share) for the quarter ended June 30, 2011Net income for the quarter ended September 30, 2011Dividends declared ($0.27 per share) for the quarter ended September 30, 2011Net income for the quarter ended December 31, 2011Dividends declared ($0.28 per share) for the quarter ended December 31, 2011Balance as of December 31, 2011
Accumulated Deficit$ (256,307)
10,280(10,886)13,594
(10,892)1,532
(10,903)14,406
(11,307)$ (260,483)
NOTE 12 – COMMITMENTS AND CONTINGENCIES
The Company and its subsidiaries are parties to various legal proceedings, including those described below. Although the ultimate outcome of these legal proceedings cannot be ascertained at this time, and the results of legal proceedings cannot be predicted with certainty, the Company believes, based on current knowledge, that the resolution of any of these proceedings, including those described below, will not have a material effect on the Company’s consolidated financial condition or liquidity. However, the resolution of any of the proceedings described below could have a material impact on consolidated results of operations or cash flows in a given future reporting period as the proceedings are resolved. One of the Company's subsidiaries, GLS Capital, Inc. (“GLS”), and the County of Allegheny, Pennsylvania are defendants in a class action lawsuit filed in 1997 in the Court of Common Pleas of Allegheny County, Pennsylvania (the “Court”). Between 1995 and 1997, GLS purchased from Allegheny County delinquent property tax receivables for properties located in the County. The plaintiffs in this matter have alleged that GLS improperly recovered or sought recovery for certain fees, costs, interest, and attorneys' fees and expenses in connection with GLS' collection of the property tax receivables. The Court granted class action status in this matter in August 2007. In February 2011, as a result of motions filed by GLS, the Court refined the class to include only owners of real estate in the County of Allegheny who paid an attorneys' fee between 1996 and 2003 in connection with the forced collection of delinquent property tax receivables by GLS (generally through the initiation of a foreclosure action). As a result, the Court dismissed all claims against GLS and narrowed the issues being litigated to whether attorneys' fees and related expenses charged by GLS in connection with the collection of the receivables was reasonable. Such attorneys' fees and related expenses were assessed by GLS in its collection efforts pursuant to prevailing County ordinance. Plaintiffs have not enumerated their damages in this matter. In January 2012, Plaintiffs' counsel presented the Court a petition to discontinue and a proposed noticed to class members of the discontinuance and their right to opt out of the class actions. The Court granted Plaintiffs' petition. A hearing date has been set for April 17, 2012 on the proposed discontinuance of the remaining claim.
Dynex Capital, Inc. and Dynex Commercial, Inc., a former affiliate of the Company and now known as DCI Commercial, Inc. ("DCI"), are appellees (or respondents) in the matter of Basic Capital Management, Inc. et al. (collectively, “BCM” or the “Plaintiffs”) versus DCI et al. currently pending in the Fifth Court of Appeals in Dallas. The matter was initially filled in the state court in Dallas County, Texas in April 1999 against DCI, and in March 2000, BCM amended the complaint and added the Company as a defendant. The appeal seeks to overturn a judgment rendered by the trial court in the favor of the Company and DCI. Specifically, Plaintiffs are seeking reversal of the trial court's judgment and rendition of judgment against the Company for alleged breach of loan agreements for tenant improvements in the amount of $253. They also seek reversal of the trial court's judgment and rendition of judgment against DCI in favor of BCM under two mutually exclusive damage models, for $2,200 and $25,600, respectively, related to the alleged breach by DCI of a $160,000 “master” loan commitment. Plaintiffs also seek reversal and rendition of a judgment in their favor for attorneys' fees in the amount of $2,100. Alternatively, Plaintiffs seek a new trial. Even if Plaintiffs were to be successful on appeal, management does not believe the Company would be obligated for any amounts awarded against DCI.

F-31
Dynex Capital, Inc., MERIT Securities Corporation, a subsidiary of Dynex ("MERIT"), and the former President/Chief Executive Officer and current Chief Operating Officer/Chief Financial Officer of Dynex Capital, Inc., (together, the "Defendants") are defendants in a class action brought by the Teamsters Local 445 Freight Division Pension Fund (the "Teamsters") in the United States District Court for the Southern District of New York (the "District Court"). The original complaint alleging violations of the federal securities laws was filed on February 7, 2005, and was purportedly brought on behalf of a class of purchasers between February 2000 and May 2004 of MERIT Series 12-1 and MERIT Series 13 securitization financing bonds (the "Bonds"), which are collateralized by manufactured housing loans. After a series of court rulings, the case proceeded to discovery on the basis of a second amended complaint filed August 6, 2008. The amended complaint sought unspecified damages and alleged, among other things, fraud and misrepresentation in connection with the issuance of and subsequent reporting related to the Bonds. On March 7, 2011, the District Court granted the Teamsters' motion to certify a class of purchasers of the Bonds from February 2000 through May 2004. In September, 2011, the Defendants entered into a memorandum of understanding with the Teamsters, reflecting an agreement in principle to settle all claims asserted in the action, as well as any claims that could have been asserted in the action, for $7,500, and in December 2011, the Defendants and the Teamsters entered into a definitive settlement agreement. The Company has funded an escrow account in the amount of $7,500 for the benefit of the class. The escrow will be disbursed upon final approval of the settlement by the District Court, and satisfaction of any other conditions contained in the definitive settlement agreement. The Court will consider final approval of the settlement at a hearing scheduled for March 13, 2012. The Company continues to deny that it violated any federal securities laws and has agreed in principle to this settlement solely to eliminate the expense, burden, and uncertainty of the litigation.
NOTE 13 – RELATED PARTY TRANSACTIONS
As discussed in Note 12, the Company and DCI have been jointly named in litigation regarding the activities of DCI while it was an operating subsidiary of an affiliate of the Company. The Company and DCI entered into a Litigation Cost Sharing Agreement whereby the parties set forth how the costs of defending against litigation would be shared, and whereby the Company agreed to fund all costs of such litigation, including DCI’s portion. DCI’s cumulative portion of costs associated with litigation and funded by the Company is $3,482 and is secured by the proceeds of any counterclaims that DCI may receive in the litigation. DCI costs funded by the Company are loans and bear simple interest at the rate of Prime plus 8.0% per annum. As of December 31, 2011, the total amount due the Company under the Litigation Cost Sharing Agreement, including interest, was $7,417, which has been fully reserved by the Company. DCI is currently wholly owned by ICD Holding, Inc. An executive of the Company is the sole shareholder of ICD Holding, Inc.
NOTE 14 – NON-CONSOLIDATED AFFILIATES
The Company holds a 1% limited partnership interest in a partnership that owns a low-income housing tax credit multifamily housing property located in Texas. The Company has loaned the partnership $1,212 as of December 31, 2011 to cover operating expenses of the partnership and for maintaining the multifamily housing property. These advances and the accrued interest thereon are due on demand. The Company, through a subsidiary, has made a first mortgage loan to the partnership secured by the property, with a current unpaid principal balance of $1,131. Because the Company does not have control or exercise significant influence over the operations of this partnership, its investment in the partnership is accounted for using the cost method as per ASC Topic 325.
NOTE 15 – SUMMARY OF QUARTERLY RESULTS (UNAUDITED)
The unaudited information provided in these tables includes all reclassifications for prior periods as discussed in Note 1.

F-32
Operating results:Net interest incomeNet interest income after provision for loan lossesNet incomeBasic net income per common shareDiluted net income per common shareCash dividends declared per common share
Year Ended December 31, 2011
First Quarter
$ 12,73112,48110,280
$ 0.31$ 0.31$ 0.27
SecondQuarter
$ 15,03314,83313,594
$ 0.34$ 0.34$ 0.27
Third Quarter
$ 14,55914,2591,532
$ 0.04$ 0.04$ 0.27
FourthQuarter
$ 16,97216,85114,406
$ 0.36$ 0.36$ 0.28
Operating results:Net interest incomeNet interest income after provision for loan lossesNet incomeBasic net income per common shareDiluted net income per common shareCash dividends declared per common share
Year Ended December 31, 2010
First Quarter
$ 7,1976,7885,537
$ 0.32$ 0.30$ 0.23
SecondQuarter
$ 7,9327,7827,267
$ 0.41$ 0.38$ 0.23
Third Quarter
$ 8,4008,1907,022
$ 0.35$ 0.33$ 0.25
FourthQuarter
$ 10,89510,2859,646
$ 0.41$ 0.40$ 0.27
Operating results:Net interest incomeNet interest income after provision for loan lossesNet incomeBasic net income per common shareDiluted net income per common shareCash dividends declared per common share
Year Ended December 31, 2009
First Quarter
$ 5,0374,8593,134
$ 0.18$ 0.18$ 0.23
SecondQuarter
$ 5,8795,7404,370
$ 0.26$ 0.25$ 0.23
Third Quarter
$ 6,5996,3516,001
$ 0.37$ 0.34$ 0.23
FourthQuarter
$ 7,0436,8264,076
$ 0.23$ 0.23$ 0.23
NOTE 16 – SUBSEQUENT EVENTS
Management has evaluated events and circumstances occurring as of and through the date this Annual Report on Form 10-K was filed with the SEC and made available to the public and has determined that there have been no significant events or circumstances that qualify as "recognized" subsequent events as defined by ASC Topic 855.
The following events, which occurred subsequent to December 31, 2011 and before the filing of this Annual Report on Form 10-K, qualify as “nonrecognized" subsequent events as defined by ASC Topic 855: On February 1, 2012, the Company closed a public offering of 13,332,487 shares of its common stock which includes 832,487 shares issued pursuant to an option to purchase additional shares that was exercised by the underwriters, at a public offering price of $9.12 per share for total net proceeds of approximately $119,992 after deduction of underwriters' compensation and estimated expenses. We will not be able to ascertain whether a Section 382 "ownership shift" has occurred as a result of

F-33
this offering until all Schedule 13 filings are made by our shareholders for the first quarter of 2012.
The Company has issued 402,494 shares of its common stock through its ATM program since December 31, 2011 at an average price of $9.39 for total net proceeds of $3,721 after deduction of underwriters' compensation and estimated expenses. In February 2012, the Company repaid its remaining TALF non-recourse financing, which had a fixed interest rate of 2.7%, and replaced it with $41,723 of repurchase agreement financing, which currently has a variable interest rate of 1.4%.
The Company owns a portion of a seriously delinquent commercial mortgage loan which was restructured in bankruptcy court subsequent to December 31, 2011. Under the terms of the bankruptcy court confirmation order, the interest rate on the loan was decreased from 8.3% to 6.0% while the unpaid principal balance was increased by approximately 17%. The present value of the loan's expected future cash flows under its new terms, discounted using the loan's original interest rate of 8.3% as the effective rate, exceeds the Company's recorded investment in the loan under its original terms, therefore, the loan is not impaired based on the terms specified in the bankruptcy court confirmation order. The Company expects that the modification of the loan's terms will not have a material impact on the Company's financial results for the first quarter of 2012.

This page intentionally left blank.

Exhibit 21.1
DYNEX CAPITAL, INC.LIST OF CONSOLIDATED ENTITIES
As of December 31, 2011
Mortgage Investment CorporationInvestment Capital Access, Inc. Commercial Capital Access One, Inc. MERIT Securities Corporation Financial Asset Securitization, Inc.GLS Capital Services, Inc. GLS Development, Inc.SMFC Funding CorporationMSC I L.P.Issued Holdings Capital Corporation GLS Capital, Inc. GLS Properties, LLC Allegheny Commercial Properties I, LLC Allegheny Income Properties I, LLC Allegheny Special Properties, LLC
NOTE: All companies were incorporated in Virginia except for GLS Properties, LLC, Allegheny Commercial Properties I, LLC, Allegheny Income Properties I, LLC, and Allegheny Special Properties, LLC, which were incorporated in Pennsylvania.

Exhibit 23.1
CONSENT OF INDEPENDENT REGISTERED PUBLIC ACCOUNTING FIRM
Dynex Capital, Inc.Glen Allen, Virginia
We hereby consent to the incorporation by reference in the Registration Statements on Form S-3 (Nos. 333-22859, 333-10783, 333-10587, 333-35769, 333-149475, and 333-173551) and Form S-8 (Nos. 333-32663, 333-159426 and 333-159427) of Dynex Capital, Inc. of our reports dated March 2, 2012, relating to the consolidated financial statements, and the effectiveness of Dynex Capital, Inc.'s internal control over financial reporting, which appear in this Annual Report on Form 10-K.
BDO USA, LLPRichmond, Virginia
March 2, 2012
Exhibit 31.1
CERTIFICATION
I, Thomas B. Akin, certify that:
1. I have reviewed this Annual Report on Form 10-K of Dynex Capital, Inc.;
2. Based on my knowledge, this report does not contain any untrue statement of a material fact or omit to state a material fact necessary to make the statements made, in light of the circumstances under which such statements were made, not misleading with respect to the period covered by this report;
3. Based on my knowledge, the financial statements, and other financial information included in this report, fairly present in all material respects the financial condition, results of operations and cash flows of the registrant as of, and for, the periods presented in this report;
4. The registrant's other certifying officer and I are responsible for establishing and maintaining disclosure controls and procedures (as defined in Exchange Act Rules 13a-15(e) and 15d-15(e)) and internal control over financial reporting (as defined in Exchange Act Rules 13a-15(f) and 15d-15(f)) for the registrant and have:
(a) Designed such disclosure controls and procedures, or caused such disclosure controls and procedures to be designed under our supervision, to ensure that material information relating to the registrant, including its consolidated subsidiaries, is made known to us by others within those entities, particularly during the period in which this report is being prepared;
(b) Designed such internal control over financial reporting, or caused such internal control over financial reporting to be designed under our supervision, to provide reasonable assurance regarding the reliability of financial reporting and the preparation of financial statements for external purposes in accordance with generally accepted accounting principles;
(c) Evaluated the effectiveness of the registrant's disclosure controls and procedures and presented in this report our conclusions about the effectiveness of the disclosure controls and procedures, as of the end of the period covered by this report based on such evaluation; and
(d) Disclosed in this report any change in the registrant's internal control over financial reporting that occurred during the registrant's most recent fiscal quarter (the registrant's fourth fiscal quarter in the case of an annual report) that has materially affected, or is reasonably likely to materially affect, the registrant's internal control over financial reporting; and
5. The registrant's other certifying officer and I have disclosed, based on our most recent evaluation of internal control over financial reporting, to the registrant's auditors and the audit committee of the registrant's board of directors (or persons performing the equivalent functions):
(a) All significant deficiencies and material weaknesses in the design or operation of internal control over financial reporting which are reasonably likely to adversely affect the registrant's ability to record, process, summarize and report financial information; and
(b) Any fraud, whether or not material, that involves management or other employees who have a significant role in the registrant's internal control over financial reporting.
Date: March 2, 2012/s/ Thomas B. AkinThomas B. AkinPrincipal Executive Officer

Exhibit 31.2
CERTIFICATION
I, Stephen J. Benedetti, certify that:
1. I have reviewed this Annual Report on Form 10-K of Dynex Capital, Inc.;
2. Based on my knowledge, this report does not contain any untrue statement of a material fact or omit to state a material fact necessary to make the statements made, in light of the circumstances under which such statements were made, not misleading with respect to the period covered by this report;
3. Based on my knowledge, the financial statements, and other financial information included in this report, fairly present in all material respects the financial condition, results of operations and cash flows of the registrant as of, and for, the periods presented in this report;
4. The registrant's other certifying officer and I are responsible for establishing and maintaining disclosure controls and procedures (as defined in Exchange Act Rules 13a-15(e) and 15d-15(e)) and internal control over financial reporting (as defined in Exchange Act Rules 13a-15(f) and 15d-15(f)) for the registrant and have:
(a) Designed such disclosure controls and procedures, or caused such disclosure controls and procedures to be designed under our supervision, to ensure that material information relating to the registrant, including its consolidated subsidiaries, is made known to us by others within those entities, particularly during the period in which this report is being prepared;
(b) Designed such internal control over financial reporting, or caused such internal control over financial reporting to be designed under our supervision, to provide reasonable assurance regarding the reliability of financial reporting and the preparation of financial statements for external purposes in accordance with generally accepted accounting principles;
(c) Evaluated the effectiveness of the registrant's disclosure controls and procedures and presented in this report our conclusions about the effectiveness of the disclosure controls and procedures, as of the end of the period covered by this report based on such evaluation; and
(d) Disclosed in this report any change in the registrant's internal control over financial reporting that occurred during the registrant's most recent fiscal quarter (the registrant's fourth fiscal quarter in the case of an annual report) that has materially affected, or is reasonably likely to materially affect, the registrant's internal control over financial reporting; and
5. The registrant's other certifying officer and I have disclosed, based on our most recent evaluation of internal control over financial reporting, to the registrant's auditors and the audit committee of the registrant's board of directors (or persons performing the equivalent functions):
(a) All significant deficiencies and material weaknesses in the design or operation of internal control over financial reporting which are reasonably likely to adversely affect the registrant's ability to record, process, summarize and report financial information; and
(b) Any fraud, whether or not material, that involves management or other employees who have a significant role in the registrant's internal control over financial reporting.
Date: March 2, 2012/s/ Stephen J. BenedettiStephen J. BenedettiPrincipal Financial Officer

Exhibit 32.1
CERTIFICATION OF PRINCIPAL EXECUTIVE OFFICER AND PRINCIPAL FINANCIAL OFFICER PURSUANT TO SECTION 906
In connection with the Annual Report on Form 10-K of Dynex Capital, Inc. (the “Company”) for the fiscal year ended December 31, 2011, as filed with the Securities and Exchange Commission on the date hereof (the “Report”), the undersigned, as the Principal Executive Officer of the Company and the Principal Financial Officer of the Company, respectively, certify, pursuant to and for purposes of 18 U.S.C. Section 1350, as adopted pursuant to Section 906 of the Sarbanes-Oxley Act of 2002, that to their knowledge:
(1) The Report fully complies with the requirements of Section 13(a) or 15(d) of the Securities Exchange Act of 1934; and
(2) The information contained in the Report fairly presents, in all material respects, the financial condition and results of operations of the Company.
Date: March 2, 2012
Date: March 2, 2012
/s/ Thomas B. AkinThomas B. AkinPrincipal Executive Officer
/s/ Stephen J. BenedettiStephen J. BenedettiPrincipal Financial Officer

This page intentionally left blank.

1 2 3
Dynex is an internally managed real estate investment trust, or REIT, which invests in mortgage assets on a leveraged basis. Our goal is to limit risk in our investment portfolio, while earning an acceptable risk-adjusted
return for our shareholders.
DYNEX CAPITAL, INC. NYSE: DXDYNEX CAPITAL, INC. NYSE: DX
DYNEX AT AN INfLECTION POINT
Consistent Core Investment Strategy
• Short-duration, high-quality, and modest leverage has produced stable returns and increasing dividends.
• Opportunistic asset allocation has avoided investment “land mines” and resulted in investments in the most attractive relative value opportunities.
Current Investment Opportunity
• Federal Reserve zero rate policy extension to late 2014.
• Diversified investment strategy continues to offer attractive returns given the current macro environment.
• Selective securities will help mitigate prepay risk, credit risk, and extension risk.
Track Record
• Delivered an annualized total return of 11.5% since 2008, assuming reinvestment of dividends.
• Book value has grown from $8.07 at 12/31/08 to $9.20 at 12/31/11.
• Opportunistic capital raises have increased core earnings with little dilution.
1 2 3
Thomas B. AkinChairman of the Board of Directors Chief Executive Officer Principal, Talkot Capital, LLC
Thomas B. AkinChairman of the Board of Directors Chief Executive Officer
Michael R. HughesAnalyst Ascend Capital, LLC
Stephen J. BenedettiExecutive Vice President Chief Financial Officer Chief Operating Officer
Barry A. IgdaloffSole Proprietor Rose Capital
Byron L. BostonPresident Chief Investment Officer
Daniel K. OsborneManaging Member Vantage Pointe Capital, LLC
James C. Wheat, IIIPresident Blanfield Associates, LLC
Corporate Offices4991 Lake Brook Drive, Suite 100 Glen Allen, Virginia 23060 804-217-5800 phone 804-217-5860 fax dynexcapital.com
Investor RelationsAlison G. GriffinVice President [email protected] 804-217-5897
Stock Transfer AgentComputershare 480 Washington Boulevard Jersey City, NJ 07310-1900 866-280-0407 bnymellon.com/shareowner/equityaccess
Independent AuditorsBDO Seidman, LLP 300 Arboretum Place, Suite 520 Richmond, VA 23236
Annual Meeting of ShareholdersThe Annual Meeting of Shareholders will be held at 9:00 A.M. Pacific Time on Monday, May 14, 2012 at:
The Stanford Court Renaissance Hotel905 California Street, San Francisco, CA 94108
SEC FilingsDynex makes available on its website, free of charge, its annual reports on Form 10-K, Quarterly Reports on Form 10-Q, and Current Reports on Form 8-K as filed with the Securities and Exchange Commission, as well as other Company information. Such information is also furnished to shareholders, free of charge, upon request. Please direct your request to Investor Relations.
Dynex has filed the certification of its principal executive and financial officers required by Section 302 of the Sarbanes-Oxley Act of 2002 with the Securities and Exchange Commission as an exhibit to its Annual Report on Form 10-K for the year ended December 31, 2011. Dynex has included a copy of this certification in this Annual Report to Shareholders. In addition, the Company’s executive officers annually certify to the New York Stock Exchange that they are not aware of any violation by the Company of the New York Stock Exchange’s corporate governance listing standards. This certification was submitted, without qualification, as required after the 2011 annual meeting of shareholders.
Equity SecuritiesCommon StockNYSE: DX
CORPORATE INfORmATION
BoArD of DIrECTorS
EXECuTIvE offICErS

ANNUAL REPORT
Sound Strategy. Unique Advantages.DYNEX CAPITAL, INC.DYNEX CAPITAL, INC.
Sound Strategy. Unique Advantages.DYNEX CAPITAL, INC.DYNEX CAPITAL, INC.
4991 Lake Brook Drive, Suite 100 Glen Allen, VA 23060
Phone: 804-217-5800 • www.dynexcapital.com
DYNEX CAPITAL, INC. 2011 ANNUAL REPORT