Dynamic Work Distribution by Workflow Management …wvdaalst/publications/p145.pdf · Dynamic Work...
32
1 Dynamic Work Distribution in Workflow Management Systems: How to balance quality and performance? Akhil Kumar 1 , Wil M.P. van der Aalst 2 and Eric M.W. Verbeek 2 1 Database Systems Research Department, Bell Laboratories, 600 Mountain Ave., 2A-406, Murray Hill, NJ 07974, USA. 3 2 Faculty of Technology and Management, Eindhoven University of Technology, PO Box 513, NL-5600 MB, Eindhoven, The Netherlands. E-mail: [email protected], [email protected], [email protected] Abstract Today’s workflow management systems offer work items to workers using rather primitive mechanisms. While most workflow systems support a role-based distribution of work, they have problems dealing with unavailability of workers as a result of vacation or illness, overloading, context dependent suitability, deadlines, and delegation. As a result, the work is offered to too few, too many, or even the wrong set of workers. Current practice is to offer a work item to one person, thus causing problems when the person is not present or too busy, or to offer it to a set of people sharing a given role, thus not incorporating the qualifications and preferences of people. Literature on work distribution is typically driven by considerations related to authorizations and permissions. However, workflow processes are operational processes where there is a highly dynamic trade-off between security and performance. For example, an approaching deadline and an overloaded specialist may be the trigger to offer work items to lesser-qualified workers. This paper addresses this problem by proposing a systematic approach to dynamically create a balance between quality and performance issues in workflow systems. We illustrate and evaluate the proposed approach with a realistic example and also compare how a workflow system would implement this scenario to highlight the shortcomings of current, state of the art workflow systems. Finally, a detailed simulation model is used to validate our approach. 1. Introduction Workflow management systems are “organizationally aware”, i.e., the distribution of work to workers is based on explicit models of organizational structures and capabilities of workers [23,26,43,44]. For the successful application of workflow technology it is crucial that there be a good fit between work practice and the models/mechanisms used by the workflow management system [3]. Unfortunately, most of today’s workflow management systems focus on the process dimension (i.e., routing, control flow, etc.) and oversimplify the organizational dimension. As a result the systems are either inflexible or too liberal. Inflexibility results in bad performance, e.g., long or highly variable flow times. On the other hand, if the system is too liberal, the wrong people are allowed to execute work. The latter may result in low quality, insecurity, or even fraud. There are two basic mechanisms for work distribution or allocation in a workflow system: Push mechanism: A work item is pushed to a single resource. Pull mechanism: A resource pulls work items from a view of a common pool of work items. 3 On leave from University of Colorado, Boulder. A large part of this work was done while the author was visiting Faculty of Technology and Management, University of Eindhoven.
Transcript of Dynamic Work Distribution by Workflow Management …wvdaalst/publications/p145.pdf · Dynamic Work...
1
Dynamic Work Distribution in Workflow Management Systems: How to balance quality and performance?
Akhil Kumar1, Wil M.P. van der Aalst2 and Eric M.W. Verbeek2
1 Database Systems Research Department, Bell Laboratories, 600 Mountain Ave., 2A-406, Murray Hill, NJ 07974, USA.3
2 Faculty of Technology and Management, Eindhoven University of Technology, PO Box 513, NL-5600 MB, Eindhoven, The Netherlands. E-mail: [email protected], [email protected], [email protected]
Abstract Today’s workflow management systems offer work items to workers using rather primitive mechanisms. While most workflow systems support a role-based distribution of work, they have problems dealing with unavailability of workers as a result of vacation or illness, overloading, context dependent suitability, deadlines, and delegation. As a result, the work is offered to too few, too many, or even the wrong set of workers. Current practice is to offer a work item to one person, thus causing problems when the person is not present or too busy, or to offer it to a set of people sharing a given role, thus not incorporating the qualifications and preferences of people. Literature on work distribution is typically driven by considerations related to authorizations and permissions. However, workflow processes are operational processes where there is a highly dynamic trade-off between security and performance. For example, an approaching deadline and an overloaded specialist may be the trigger to offer work items to lesser-qualified workers. This paper addresses this problem by proposing a systematic approach to dynamically create a balance between quality and performance issues in workflow systems. We illustrate and evaluate the proposed approach with a realistic example and also compare how a workflow system would implement this scenario to highlight the shortcomings of current, state of the art workflow systems. Finally, a detailed simulation model is used to validate our approach.
1. Introduction Workflow management systems are “organizationally aware”, i.e., the distribution of work to workers is based on explicit models of organizational structures and capabilities of workers [23,26,43,44]. For the successful application of workflow technology it is crucial that there be a good fit between work practice and the models/mechanisms used by the workflow management system [3]. Unfortunately, most of today’s workflow management systems focus on the process dimension (i.e., routing, control flow, etc.) and oversimplify the organizational dimension. As a result the systems are either inflexible or too liberal. Inflexibility results in bad performance, e.g., long or highly variable flow times. On the other hand, if the system is too liberal, the wrong people are allowed to execute work. The latter may result in low quality, insecurity, or even fraud. There are two basic mechanisms for work distribution or allocation in a workflow system:
Push mechanism: A work item is pushed to a single resource. Pull mechanism: A resource pulls work items from a view of a common pool of work items.
3 On leave from University of Colorado, Boulder. A large part of this work was done while the author was visiting Faculty of Technology and Management, University of Eindhoven.
2
The push mechanism is a special case of the pull mechanism in that only one resource can view a given work item. It suffers from the drawback that if an item is “pushed” to a worker who is on vacation, this item could be sitting in the workbasket of this worker until she returns from her holiday. On the other hand, with a pull mechanism, multiple workers are “offered” this work item and chances are higher that one of them will be available to perform it. Therefore, current, state of the art workflow systems (such as Staffware [37], etc.) consider the pull mechanism as the basic paradigm for work distribution because this mechanism gives more flexibility. Nevertheless, today’s workflow management systems have several shortcomings. Consider:
Selectivity: The work is offered to too many, too few, or simply the wrong people. Examples:
o A work item is offered to just two persons and both are on vacation for the next two weeks. The workflow system did not know about it.
o A work item is offered to all employees of the sales department, but only a few of them are known to the customer.
o A work item is offered to the chief engineer, and only his predecessor can answer the question concerning a previous version of the product.
Advanced constraints: Constraints like “The subsequent task should be executed by a member of the same department”, “The check should be signed by someone who has not performed any of the preceding tasks”, “A task which involves more than $1 million should be executed by a manager with two years of experience” are difficult, if not impossible, to handle in today’s workflow management systems. Context dependent constraints: Sometimes constraints are not only based on the characteristics of a case but also on criteria related to the utilization of the resources within the organization. For example, specialists are only offered work items of a general nature if their utilization over the last two days was less than 70 percent. Hard/soft constraints: There is no support for distinguishing between soft constraints that may be dropped under certain circumstances (or are merely “nice to have”) and hard constraints that should never be violated. Delegation: There is no support for delegation.
This paper addresses some of these shortcomings by making the distribution of work fluid and context dependent. The distribution mechanisms we propose are closely linked to delegation. Whenever delegation is used, workers are offered work items they would normally not see. Current research typically focuses on delegation in the context of security considerations. This perspective is too narrow and far from reality in that, in most workflow processes, there is a trade-off between security and performance. Consider for example the approval of insurance claims related to fire damage: If all fire damage experts are overloaded, one might consider involving experts from different areas (e.g., water damage). In fact, there are examples where the workflow process itself changes as a result of overloading. For instance, the processing of customs declarations changes under various workloads, e.g., physical checks are replaced by administrative checks. An editor of a journal that normally requests four reviews of an article may decide to publish it based on only three reviews if the fourth review has not been received in a timely manner. The goal of this paper is to provide a more flexible approach that integrates security and performance considerations. We also want to deal with allocation and delegation, i.e., work distribution, in a unified way. Given the fact that work distribution (or allocation) and delegation are closely related, we first consider the various dimensions of delegation. Below we classify delegation as follows:
3
What is being delegated? o Resource: All work items currently in the in-basket of a resource or items that
will be offered to a resource at a later time. o Role: All work items currently in the in-basket of a role, or items that will be
offered to a role at a later time. o Task: All work items corresponding to the execution of a given task. o Work item: A specific work item, i.e., an instance of a task for a given case.
Who triggers the delegation? o A worker who has been offered a work item. o A worker responsible for a task. o A worker responsible for a role. o A supervisor supervising a case (case manager). o A supervisor supervising a task (task manager). o A supervisor supervising a role (role manager). o A supervisor supervising resources (resource manager).
Why is the delegation triggered? o Unavailability of a resource:
Planned absence (on account of vacation or business trip). Unplanned absence (due to illness or last minute trips). Overloading (from being too busy to do the job).
o Urgency of a work item (e.g., an approaching deadline). o Non-performance:
Lack of responsiveness (perhaps unwilling to do the job). Unsatisfactory work.
To whom is the work being delegated? o Specific resources. o Roles.
What is the time period to which the delegation pertains? o An instant of time (i.e., delegate what is in the in-basket at time t). o A calendar time period (t1,t2). o Vacation or business trip or illness period (t1,t2). o Any well-defined time period (e.g., “All Tuesdays,” weekends, etc.).
This classification shows that there are several dimensions that must be considered in designing a delegation model. The scope of what is being delegated ranges from a single work item to all the items that a role or a specific resource may receive during a given time period. The delegation may be initiated by a worker or by a manager. There are various reasons for the delegation to be triggered and these are also enumerated, such as unavailability, urgency and non-performance. The recipient of delegated work may be a generic role or a specific resource. The time period is the last dimension of this model, and it may be represented in various different ways. The purpose of a delegation model is to ensure that delegation takes place according to well-defined rules and constraints that are consistent with the policy of a company. The above classification does not show such constraints. An example of such a constraint is the policy regarding sub-delegation, i.e., is it possible for a worker who has received work from another role or worker to further delegate this work item? Moreover, does a delegate receive the same approval authority as the role that is doing the delegation? Such issues have to be addressed by means of rules and constraints. In this paper we address this issue from a different and novel perspective.
4
The outline of this paper is as follows. We start with an overview of related literature in Section 2. Section 3 describes our basic terminology, presents a model for dynamic work distribution, and also gives a metric for such distribution. Then Section 4 describes how the various parameters of this metric can be quantified. Section 5 gives concrete examples to demonstrate how this methodology can be applied to workflow scenarios, and the performance benefits from doing so. Section 6 describes the implementation of these scenarios in Staffware 2000 (Staffware PLC, [37]). This section also illustrates the possibilities and limitations of existing workflow products. A “proof of concept” is given in Section 7 where, using simulation, various work distribution mechanisms are compared. Section 8 concludes the paper.
2. Related work In the last decade many workflow management systems have become available [23,26]. Although workflow technology has become a standard component of many enterprise information systems, the introduction of this technology has not been without problems. Several failures associated with the introduction of workflow management systems have been reported [20] and many researchers in the Computer Supported Cooperative Work (CSCW) have questioned their usefulness [17,38,39,40]. Nevertheless, workflow technology is becoming an important part of everyday life for many office workers and is integrated in software products ranging from ERP-systems such as SAP, Peoplesoft, and Baan to the call-center products of Siebel and Vantive. At this point in time, scientific contributions mainly come from researchers in the database, information systems, and process modeling communities [2]. The fact that researchers from the CSCW community, or more generally the social sciences, have neglected workflow technology may perhaps explain why the topic of work distribution in the context of workflow management systems has not received attention. Research on work distribution can be divided into two branches. The first branch is driven by security considerations. The second branch is driven by performance considerations. The work reported in this paper builds on and is inspired by results from both branches. A typical example of results reported in the first branch is the RBAC (Role-Based Access Control) model [18,19,34,35]. The salient features of RBAC are that permissions are associated with roles and users are made members of roles, thereby acquiring the associated permissions. RBAC models are useful but they have limitations, in particular they do not adequately address issues related to dynamic assignments taking into account organizational meta models and economic criteria [43]. Bussler and Jablonski [10] have also pointed out many limitations of workflow systems in modeling policy and organizational issues. Several researchers have developed so-called meta models, i.e., object models describing the relation between workflow concepts, which include work allocation aspects. Consider for example some of the papers by Zur Mühlen [43,44]. Other authors have examined the issues of security in workflow systems from various different perspectives. A partial list of these efforts and their salient features follows next. Nyanchama and Osborn [29] present a rich discussion of conflicts of interest in terms of users/groups, roles, privileges and their inter-relationships. Dynamic mechanisms requiring history are acknowledged but not discussed. Simon and Zurko [36] survey and summarize separation of duty constraint types, both static and dynamic. The different types of constraints are then implemented in Adage, a rule-based authorization system for distributed applications. Bertino et al. [9] present a powerful logic-based model that emphasizes history-based constraints. Castano and Fugini [15] propose an active-rule based model that is implemented on top of the WIDE (Workflow Interactive Development Environment) workflow system [13]. The approach is based on the concept of
5
role, agent and task, and on authorization patterns and rules. Atluri and Huang [5, 6] introduce dynamic activation and revocation of privileges based on the flow of execution. Their idea is that users should only be granted privileges to access objects in the context of authorized tasks. Though the above list is far from complete, yet it gives an overview of the type of research being conducted. The research is typically of a qualitative nature, i.e., quantitative aspects such as costs, utilization, and flow time are not taken into account. The second branch is more diverse and ranges from simple heuristics to improve business processes, to detailed allocation rules based on queuing theory. A nice example of research on the performance of work allocation mechanisms is the study conducted by Zapf and Heinzl [42]. This study investigates the trade-off between generalist workers (i.e., ones having generic roles) and specialists (i.e., those having specific roles) in the context of workflow processes in a call center. Many of these studies use queuing theory. Queuing theory [25], in particular the analysis of queuing networks [8,16], provides many results and has been applied in the domain of (flexible) manufacturing systems [12], computer networks [8], and telecommunication systems. However, the results described in literature are only applicable to specific situations, require advanced tools, and do not provide concrete guidelines for reengineering and work distribution. Nevertheless, it is clear that queuing theory could provide a firm, theoretical basis for workflow reengineering and work distribution. Simulation is a very flexible technique. Modern simulation packages allow for both, the visualization and performance analysis, of a given process [4,22]. Unfortunately, it takes a lot of time to build a simulation model, accurate interpretation of simulation results requires statistical knowledge, and simulation only supports “what-if analysis”, i.e., it does not suggest improvements, nor does it provide concrete work distribution rules. Literature on BPR [21,24,27,28,31] typically addresses performance issues from a qualitative point of view, i.e., no concrete rules are given in terms of quantitative data. For example, the 36 “process improvement rules” provided by Poyssick and Hannaford in [31] are of a qualitative nature and lack any concrete support for the design of the control of a given workflow process. The paper by Buzacott [11] is one of the few papers targeted at quantitative redesign rules for business processes. Thus, the above discussion shows that there are two research directios in dealing with work distribution: one focusing on security related issues (roles, separation of duties, etc.), and the other one focusing on performance issues (throughput, utilization, etc.). In this paper, we view work distribution from both the security and performance perspectives, and try to create a balance between them. For example, we combine the security advantages of a push approach with the performance benefits of a pull mechanism by considering both the deadlines of various work items and the workloads and suitability of individual workers.
3. Terminology and Model for dynamic work distribution In this section we first introduce our terminology that includes terms such as case, task, resource, role and work item, and then present a basic model for dynamic work distribution. 3.1. Terminology
The fundamental property of a workflow process is that it is case-based [1]. This means that every piece of work is executed for a specific case. Examples of cases are an insurance claim, a tax declaration, a customer complaint, a mortgage, an order, or a request for information. Thus, handling of an insurance claim, a tax declaration, or a customer complaint are typical examples of workflow processes. Though cases are usually generated by an external customer, it is also possible that a case is generated by another department within the same
6
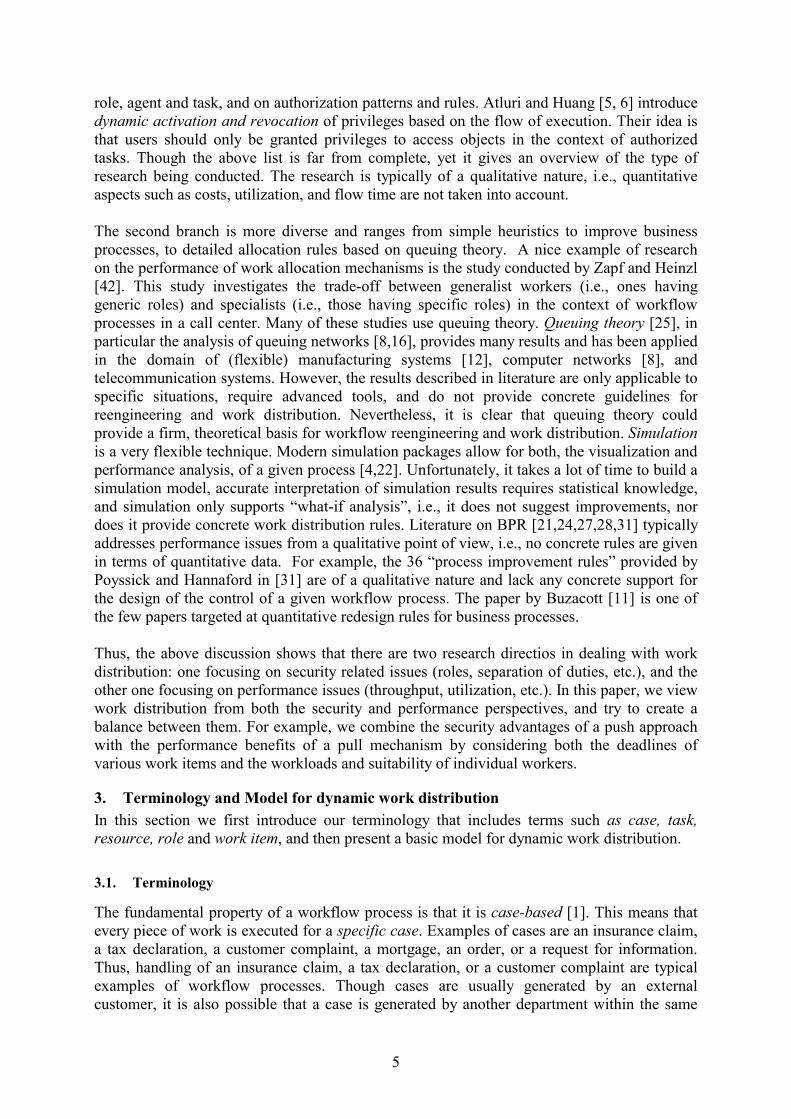
organization (an internal customer). A typical example of a process that is not case-based, and hence, not a workflow process, is a production process such as the assembly of bicycles. The task of putting a tire on a wheel is (generally) independent of the specific bicycle for which the wheel will be used. Note that the production of bicycles to order, i.e., procurement, production, and assembly, are driven by individual orders, and can be considered as a workflow process. The goal of workflow management is to handle cases as efficiently and effectively as possible. A workflow process is designed to handle large numbers of similar cases. Handling one customer complaint is usually not much different from handling another one. The most important aspect of a workflow process is the workflow process definition [23]. This process definition specifies the order in which tasks must be executed. Some alternative terms for a workflow process are: “procedure”, “workflow schema”, “flow diagram”, and “routing definition”. Tasks are ordered by specifying for each task the conditions that need to be fulfilled before it may be performed. In addition, it is necessary to specify which conditions are fulfilled upon executing a specific task. Thus, a partial ordering of tasks is obtained. In a workflow process definition, standard routing elements are used to describe sequential, alternative, parallel, and iterative routing, thus specifying the appropriate route of a case. The workflow management coalition (WfMC) has standardized a few basic building blocks for constructing workflow process definitions [26]. An OR-split is used to specify a choice between several alternatives; an OR-join specifies that several alternatives in the workflow process definition come together. An AND-split and an AND-join can be used to specify the beginning and the end of parallel branches in the workflow process definition. The routing decisions in OR-splits are often based on data, such as the age of a customer, the department responsible, or the contents of a letter from the customer. Using these building blocks one can specify the four basic routing types shown in Figure 1. On the other hand, if only one of task B or task C needs to be executed, an OR-split can be used to choose between the two tasks, and an OR-join to merge the alternative paths. If task B and task C can be executed in parallel, an AND-split is used to enable both tasks and an AND-join is used to synchronize the two paths.
7
sequential routing A B C D
A
B
C
D conditional routing OR-split OR-join
A
B
C
D parallel routing AND-split AND-join
iterative routing A B C D
OR-split OR-join
Figure 1: Four basic routing types using AND/OR and split/join building blocks
Many cases can be handled by following the same workflow process definition. As a result, the same task has to be executed for many cases. A task that needs to be executed for a specific case is called a work item. An example of a work item is the order to execute task “send refund form to customer” for case “complaint of customer Baker”. Most work items need a resource in order to be executed. A resource is either a machine (e.g., a printer or a fax) or a person (e.g., a participant, a worker, or an employee). Besides a resource, a work item often needs a trigger. A trigger specifies who or what initiates the execution of a work item. Often, the trigger for a work item is the resource that must execute the work item. Other common triggers are external triggers and time triggers. An example of an external trigger is an incoming phone call from a customer; a time trigger could occur upon expiration of a deadline. A work item that is being executed is called an activity. If we take a photograph of the state of a workflow, we see cases, work items, and activities. Work items link cases and tasks. Activities link cases, tasks, triggers, and resources. From the viewpoint of maintenance and flexibility, it does not seem desirable to assign work items to a specific machine or person. Instead, it is better to uncouple the workflow process definition, on the one hand, from the organizational structure and population on the other. Resources, ranging from humans to machines, form the organizational population, and are mapped onto roles [23,26,43]. In office environments, where workflow management systems are typically used, the resources are mainly human. However, because workflow management is not restricted to office environments, we prefer the term resource. To facilitate the allocation of work items to resources, resources are grouped into roles. A role, also referred to as resource class, is a group of resources with similar characteristics. There may be many resources in the same role, and a resource may be a member of multiple roles. A role may be based on the capabilities (i.e., functional requirements) of its members. The classification into roles may also be based on the structure of the organization, e.g., team, organizational unit,
8
branch, or department. Although this paper deals mainly with human resources, the concepts are quite general and extend easily to machine resources as well. As an example, a group of laser printers represents a resource class of machines. A printing task would be sent to the resource class and any printer may perform it. 3.2. Dynamic Model
In this subsection we develop a model using the above terminology. The purpose of our model is to build a more comprehensive mechanism for the allocation of work in a workflow system. Consequently, we will introduce various parameters for a metric to be used as a basis for allocation. At any point in time there is a set of work items W, an item of this set being denoted as w. Naturally, a very important measure to consider in allocating a work item (w) to a resource (rs) is the inherent qualification of the resource to perform the task. This is called suitability: suitability(w,rs)∈[0,1]. The suitability information can be stored in a suitability table. Moreover, since a work item is an instance of a task, this table may be inherited from a more general resource/task suitability table. Finally, the latter table is in turn inherited from a role/task suitability table that is even more general. Later sections will explain this idea further. In addition to suitability, there are other parameters that are considered in the metric. Each work item w has a time dependent urgency: urgency(w)∈[0,1]. The urgency is an important parameter of our model and will be one of the factors in the metric for allocation. Intuitively, a combination of factors affects the urgency of a task. These are, for example, an approaching deadline (or missed deadline), amount of money involved, size of an order, repeated customer inquiries, etc. Work items will have varying levels of urgency, and higher values will tend to favor early assignment. T is the set of tasks. Each work item w is an instance of a task from this set. Thus, every work item has an associated task: task(w)∈T. There is also a set of roles RO, and a set of resources RS. Each role ro is mapped onto a set of resources: resources(ro)⊆RS. Moreover, each resource rs is mapped onto a set of roles: roles(rs) ⊆RO. Every task t is mapped onto a role by function t_role: t_role(t)∈RO, and each work item w is mapped onto a role by function w_role: w_role(w)=t_role(task(w)). C is a set of constraints. Each constraint c has a penalty: penalty(c)∈[0,1]. If the penalty is 1, it means that this constraint should never be violated. Such constraints are called hard constraints. On the other hand if the penalty is strictly less than 1, then the constraint is a soft constraint. Thus, the set C can be partitioned into two subsets HC (hard constraints) and SC (soft constraints) based on the penalty values. The penalties associated with constraints are used to determine a measure called conformance that is used in the allocation metric. A constraint (c), work item (w), and resource (rs) are arguments of a Boolean function violate: violate(c,w,rs)∈{true,false}. The violate function determines if such an assignment produces a violation. Then, the penalties associated with the violated constraints are combined together to determine a conformance factor:
9
∏=
∈
−=
truerswcviolate
Cc
cpenaltyrsweconformanc),,(
)(1(),( )
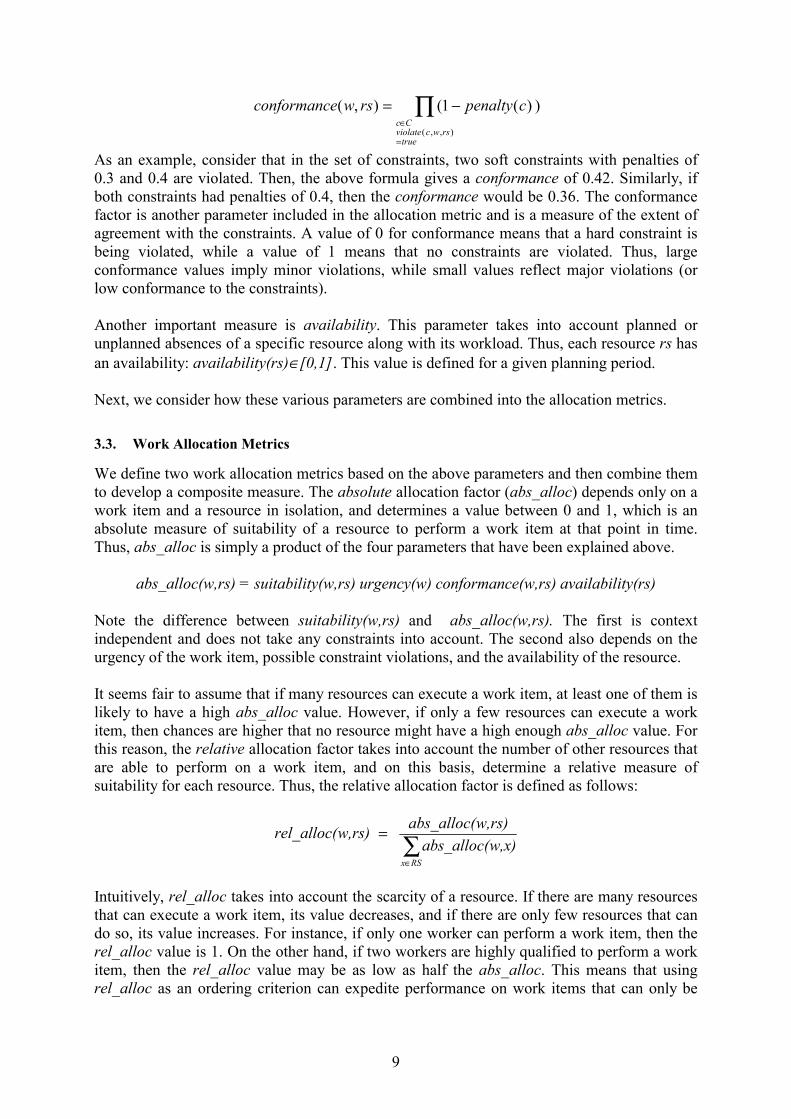
As an example, consider that in the set of constraints, two soft constraints with penalties of 0.3 and 0.4 are violated. Then, the above formula gives a conformance of 0.42. Similarly, if both constraints had penalties of 0.4, then the conformance would be 0.36. The conformance factor is another parameter included in the allocation metric and is a measure of the extent of agreement with the constraints. A value of 0 for conformance means that a hard constraint is being violated, while a value of 1 means that no constraints are violated. Thus, large conformance values imply minor violations, while small values reflect major violations (or low conformance to the constraints). Another important measure is availability. This parameter takes into account planned or unplanned absences of a specific resource along with its workload. Thus, each resource rs has an availability: availability(rs)∈[0,1]. This value is defined for a given planning period. Next, we consider how these various parameters are combined into the allocation metrics. 3.3. Work Allocation Metrics
We define two work allocation metrics based on the above parameters and then combine them to develop a composite measure. The absolute allocation factor (abs_alloc) depends only on a work item and a resource in isolation, and determines a value between 0 and 1, which is an absolute measure of suitability of a resource to perform a work item at that point in time. Thus, abs_alloc is simply a product of the four parameters that have been explained above.
abs_alloc(w,rs) = suitability(w,rs) urgency(w) conformance(w,rs) availability(rs) Note the difference between suitability(w,rs) and abs_alloc(w,rs). The first is context independent and does not take any constraints into account. The second also depends on the urgency of the work item, possible constraint violations, and the availability of the resource. It seems fair to assume that if many resources can execute a work item, at least one of them is likely to have a high abs_alloc value. However, if only a few resources can execute a work item, then chances are higher that no resource might have a high enough abs_alloc value. For this reason, the relative allocation factor takes into account the number of other resources that are able to perform on a work item, and on this basis, determine a relative measure of suitability for each resource. Thus, the relative allocation factor is defined as follows:
∑∈
=
RSx
w,x)abs_alloc(w,rs)abs_alloc( w,rs) rel_alloc(
Intuitively, rel_alloc takes into account the scarcity of a resource. If there are many resources that can execute a work item, its value decreases, and if there are only few resources that can do so, its value increases. For instance, if only one worker can perform a work item, then the rel_alloc value is 1. On the other hand, if two workers are highly qualified to perform a work item, then the rel_alloc value may be as low as half the abs_alloc. This means that using rel_alloc as an ordering criterion can expedite performance on work items that can only be
10
done by one individual. To the best of our knowledge no workflow system on the market takes this factor into account. The rel_alloc measure is helpful but suffers from the drawback that, if 20 people are qualified to perform a job, then the maximum value of rel_alloc will be 0.05. Thus, in general, the rel_alloc value could become very small and drop below a threshold. Therefore, a still more useful and meaningful measure is obtained by combining abs_alloc and rel_alloc as follows.
alloc(w, rs) = abs_alloc(w, rs) + α(w) rel_alloc(w, rs) Where α(w) is defined as:
|}0),(_|{|
),(_1)(
>∈
−= ∈
xwallocabsRSx
xwallocabsMaxw RSxα
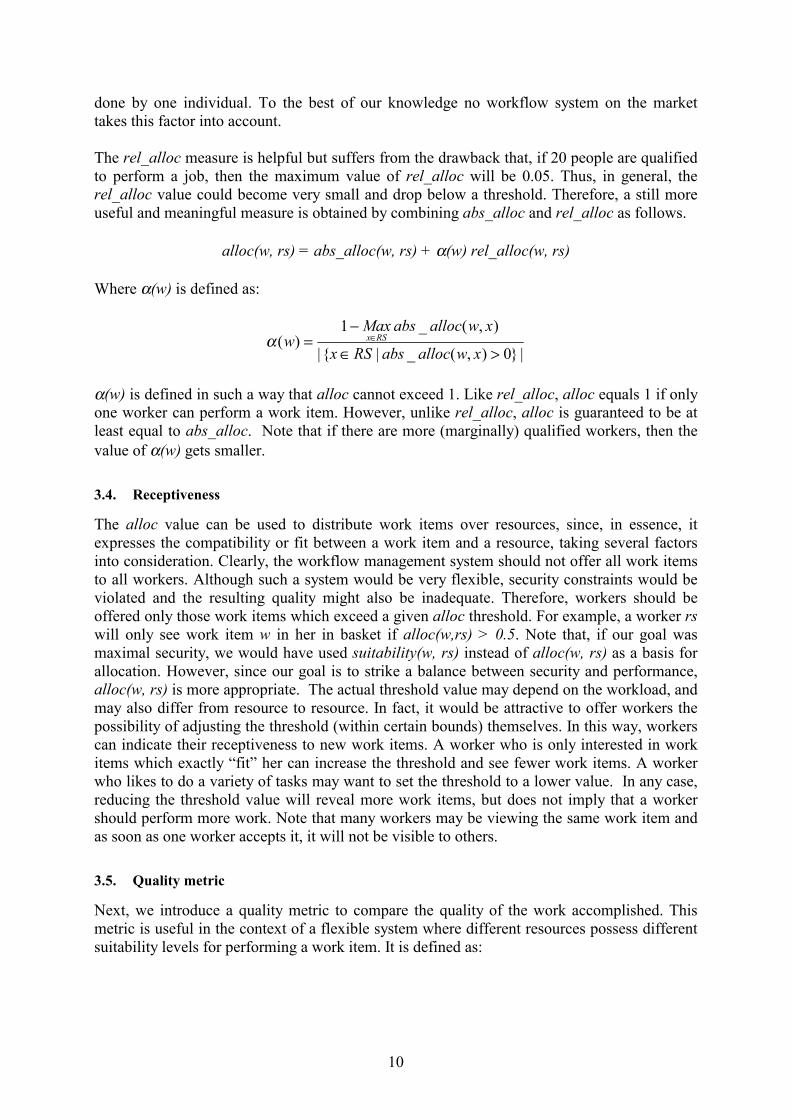
α(w) is defined in such a way that alloc cannot exceed 1. Like rel_alloc, alloc equals 1 if only one worker can perform a work item. However, unlike rel_alloc, alloc is guaranteed to be at least equal to abs_alloc. Note that if there are more (marginally) qualified workers, then the value of α(w) gets smaller. 3.4. Receptiveness
The alloc value can be used to distribute work items over resources, since, in essence, it expresses the compatibility or fit between a work item and a resource, taking several factors into consideration. Clearly, the workflow management system should not offer all work items to all workers. Although such a system would be very flexible, security constraints would be violated and the resulting quality might also be inadequate. Therefore, workers should be offered only those work items which exceed a given alloc threshold. For example, a worker rs will only see work item w in her in basket if alloc(w,rs) > 0.5. Note that, if our goal was maximal security, we would have used suitability(w, rs) instead of alloc(w, rs) as a basis for allocation. However, since our goal is to strike a balance between security and performance, alloc(w, rs) is more appropriate. The actual threshold value may depend on the workload, and may also differ from resource to resource. In fact, it would be attractive to offer workers the possibility of adjusting the threshold (within certain bounds) themselves. In this way, workers can indicate their receptiveness to new work items. A worker who is only interested in work items which exactly “fit” her can increase the threshold and see fewer work items. A worker who likes to do a variety of tasks may want to set the threshold to a lower value. In any case, reducing the threshold value will reveal more work items, but does not imply that a worker should perform more work. Note that many workers may be viewing the same work item and as soon as one worker accepts it, it will not be visible to others. 3.5. Quality metric
Next, we introduce a quality metric to compare the quality of the work accomplished. This metric is useful in the context of a flexible system where different resources possess different suitability levels for performing a work item. It is defined as:
11
∑∑
∈ ∈
∈=
casew RSrs
casew
rsweconformancrswysuitabilitMax
wexecweconformancwexecwysuitabilitcasequality
)],(),([(
))(,())(,()(
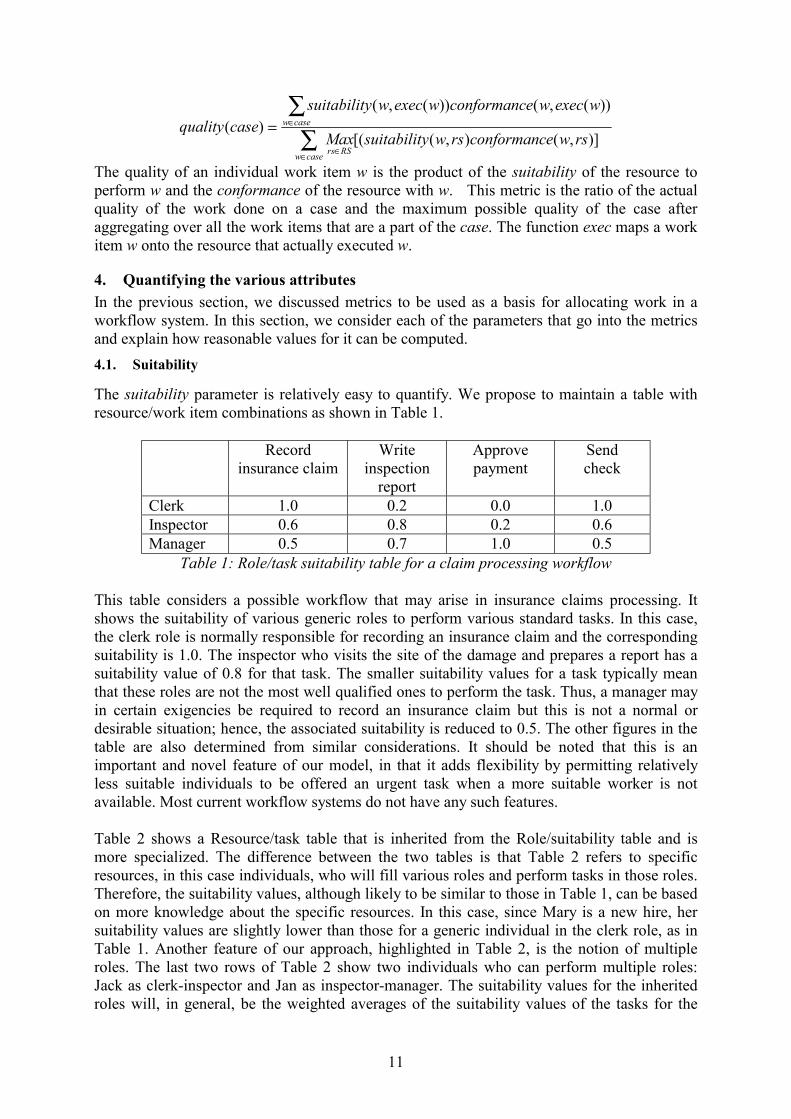
The quality of an individual work item w is the product of the suitability of the resource to perform w and the conformance of the resource with w. This metric is the ratio of the actual quality of the work done on a case and the maximum possible quality of the case after aggregating over all the work items that are a part of the case. The function exec maps a work item w onto the resource that actually executed w.
4. Quantifying the various attributes In the previous section, we discussed metrics to be used as a basis for allocating work in a workflow system. In this section, we consider each of the parameters that go into the metrics and explain how reasonable values for it can be computed. 4.1. Suitability
The suitability parameter is relatively easy to quantify. We propose to maintain a table with resource/work item combinations as shown in Table 1.
Record insurance claim
Write inspection
report
Approve payment
Send check
Clerk 1.0 0.2 0.0 1.0 Inspector 0.6 0.8 0.2 0.6 Manager 0.5 0.7 1.0 0.5
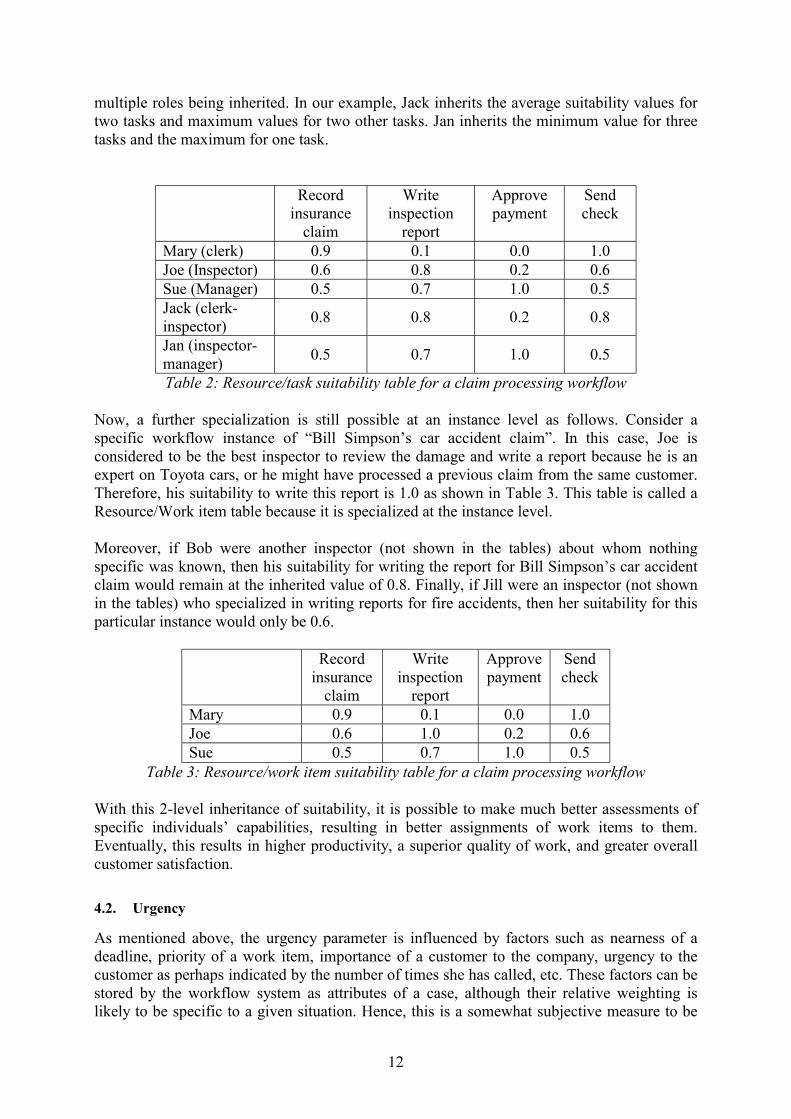
Table 1: Role/task suitability table for a claim processing workflow This table considers a possible workflow that may arise in insurance claims processing. It shows the suitability of various generic roles to perform various standard tasks. In this case, the clerk role is normally responsible for recording an insurance claim and the corresponding suitability is 1.0. The inspector who visits the site of the damage and prepares a report has a suitability value of 0.8 for that task. The smaller suitability values for a task typically mean that these roles are not the most well qualified ones to perform the task. Thus, a manager may in certain exigencies be required to record an insurance claim but this is not a normal or desirable situation; hence, the associated suitability is reduced to 0.5. The other figures in the table are also determined from similar considerations. It should be noted that this is an important and novel feature of our model, in that it adds flexibility by permitting relatively less suitable individuals to be offered an urgent task when a more suitable worker is not available. Most current workflow systems do not have any such features. Table 2 shows a Resource/task table that is inherited from the Role/suitability table and is more specialized. The difference between the two tables is that Table 2 refers to specific resources, in this case individuals, who will fill various roles and perform tasks in those roles. Therefore, the suitability values, although likely to be similar to those in Table 1, can be based on more knowledge about the specific resources. In this case, since Mary is a new hire, her suitability values are slightly lower than those for a generic individual in the clerk role, as in Table 1. Another feature of our approach, highlighted in Table 2, is the notion of multiple roles. The last two rows of Table 2 show two individuals who can perform multiple roles: Jack as clerk-inspector and Jan as inspector-manager. The suitability values for the inherited roles will, in general, be the weighted averages of the suitability values of the tasks for the
12
multiple roles being inherited. In our example, Jack inherits the average suitability values for two tasks and maximum values for two other tasks. Jan inherits the minimum value for three tasks and the maximum for one task.
Record insurance
claim
Write inspection
report
Approve payment
Send check
Mary (clerk) 0.9 0.1 0.0 1.0 Joe (Inspector) 0.6 0.8 0.2 0.6 Sue (Manager) 0.5 0.7 1.0 0.5 Jack (clerk-inspector) 0.8 0.8 0.2 0.8
Jan (inspector-manager) 0.5 0.7 1.0 0.5
Table 2: Resource/task suitability table for a claim processing workflow Now, a further specialization is still possible at an instance level as follows. Consider a specific workflow instance of “Bill Simpson’s car accident claim”. In this case, Joe is considered to be the best inspector to review the damage and write a report because he is an expert on Toyota cars, or he might have processed a previous claim from the same customer. Therefore, his suitability to write this report is 1.0 as shown in Table 3. This table is called a Resource/Work item table because it is specialized at the instance level. Moreover, if Bob were another inspector (not shown in the tables) about whom nothing specific was known, then his suitability for writing the report for Bill Simpson’s car accident claim would remain at the inherited value of 0.8. Finally, if Jill were an inspector (not shown in the tables) who specialized in writing reports for fire accidents, then her suitability for this particular instance would only be 0.6.
Record insurance
claim
Write inspection
report
Approve payment
Send check
Mary 0.9 0.1 0.0 1.0 Joe 0.6 1.0 0.2 0.6 Sue 0.5 0.7 1.0 0.5
Table 3: Resource/work item suitability table for a claim processing workflow With this 2-level inheritance of suitability, it is possible to make much better assessments of specific individuals’ capabilities, resulting in better assignments of work items to them. Eventually, this results in higher productivity, a superior quality of work, and greater overall customer satisfaction. 4.2. Urgency
As mentioned above, the urgency parameter is influenced by factors such as nearness of a deadline, priority of a work item, importance of a customer to the company, urgency to the customer as perhaps indicated by the number of times she has called, etc. These factors can be stored by the workflow system as attributes of a case, although their relative weighting is likely to be specific to a given situation. Hence, this is a somewhat subjective measure to be
13
determined by a case manager who is responsible for the specific work item. We propose that its initial value be set to 0.8 to indicate a relatively high level of urgency for all tasks and then adjusted upwards in increments as a deadline approaches. When a deadline is passed without the task completion, the urgency should be increased to 1. 4.3. Conformance
The conformance parameter is a measure of the level of agreement with the constraints. A high level reflects good conformance, while a low value indicates that one or more constraints are being violated. As mentioned above, every constraint has an associated penalty between 0 and 1, the exact value being based on its importance. For example, a constraint such as “the same worker who takes the order must handle complaints related to it” may have a penalty of 0.1 to reflect relatively lesser importance. On the other hand, a constraint such as “three vice-presidents must approve a director level appointment” may have a penalty of 0.95 to suggest that this constraint can be violated only very rarely. Some constraints may depend on the attributes of a case also. For instance, a constraint may specify that if the amount of money involved in a work item is more than $1 Million, then only the CEO can approve it, and a violation would mean a penalty of 0.99. Thus, in general, these penalties are assessed based on the perceived importance of each constraint and combined using the formula given in Section 3. 4.4. Availability
The availability parameter measures overall availability taking into account the time available to a worker during a planning period, his/her workload, planned absences, etc. Therefore, its exact value depends upon a variety of considerations. A pull mechanism does not lend itself to detailed scheduling because of its nature, i.e., a work item is typically offered to multiple resources at the same time and any one of them may work on it. Hence, availability is again determined in a somewhat subjective way. Our proposal is that, in general, availability will lie between 0.8 and 1.0, and intuitively, the values in this range will mean as follows: Low availability: 0.8 Medium availability: 0.9 High availability: 1.0 Moreover, an availability of 0 will indicate that a certain individual is away on vacation, on a business trip, or on sick leave, etc., and should not be offered any work items. Initially, a resource will be assumed to have high availability by default. However, if it becomes busier, its availability will be reduced in increments to a low of 0.8. In order to handle the case of temporary workers and part-timers who have various kinds of work arrangements (e.g., half-time, quarter-time, etc.), we propose that on days or hours that they are working, their availability be maintained in the range of 0.8 to 1.0, and during other hours it is set to 0 so no new work is offered to them during those periods. In order to achieve this the workflow system must maintain the schedules of these workers.
14
5. A complete illustration of the methodology This section gives a complete and realistic example to illustrate how our approach works. 5.1. Workflow in a university admissions process
Reviewtranscriptsand testscores
Reviewpersonal
essay
Review lettersof reference
Receiveapplication
Initial reviewby director
Write report/recommendation
Make finaldecision Notify applicant
(C) (D)
(AO1)
(AO2)
(AO3)
(AO1,AO2,AO3) (D)C:ClerkD: DirectorAO1: Admissions officer 1AO2: Admissions officer 2AO3: Admissions officer 3
(C)
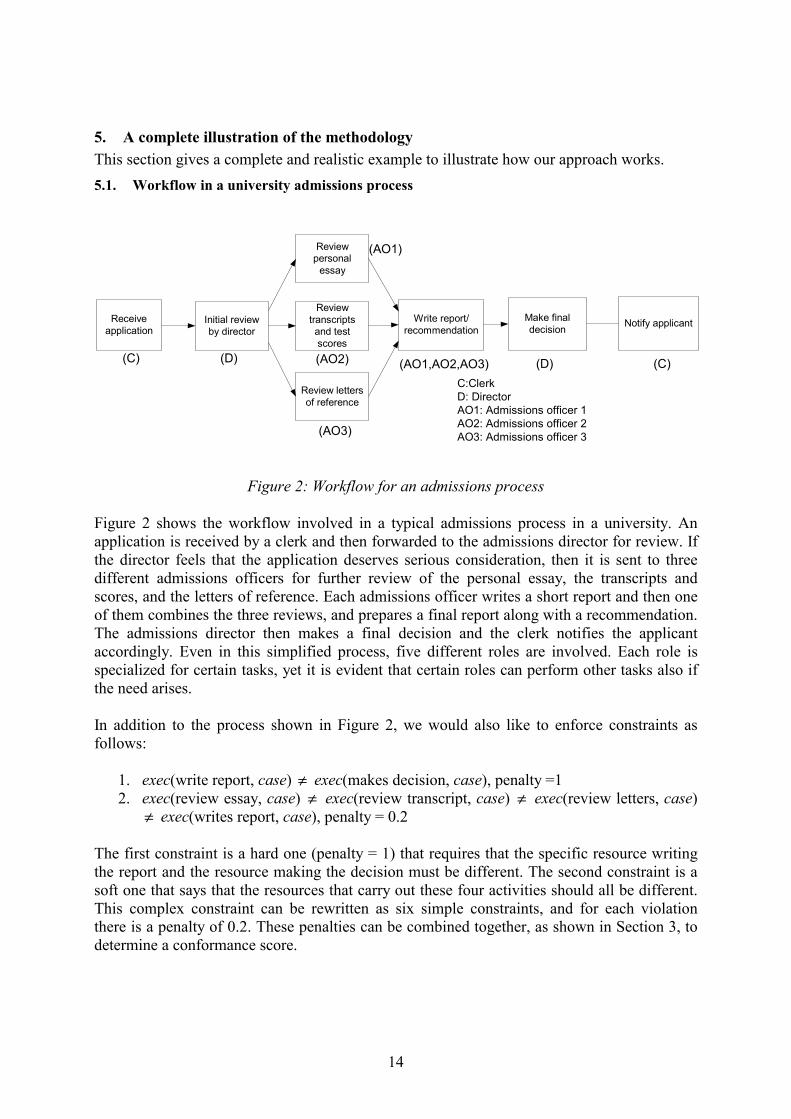
Figure 2: Workflow for an admissions process
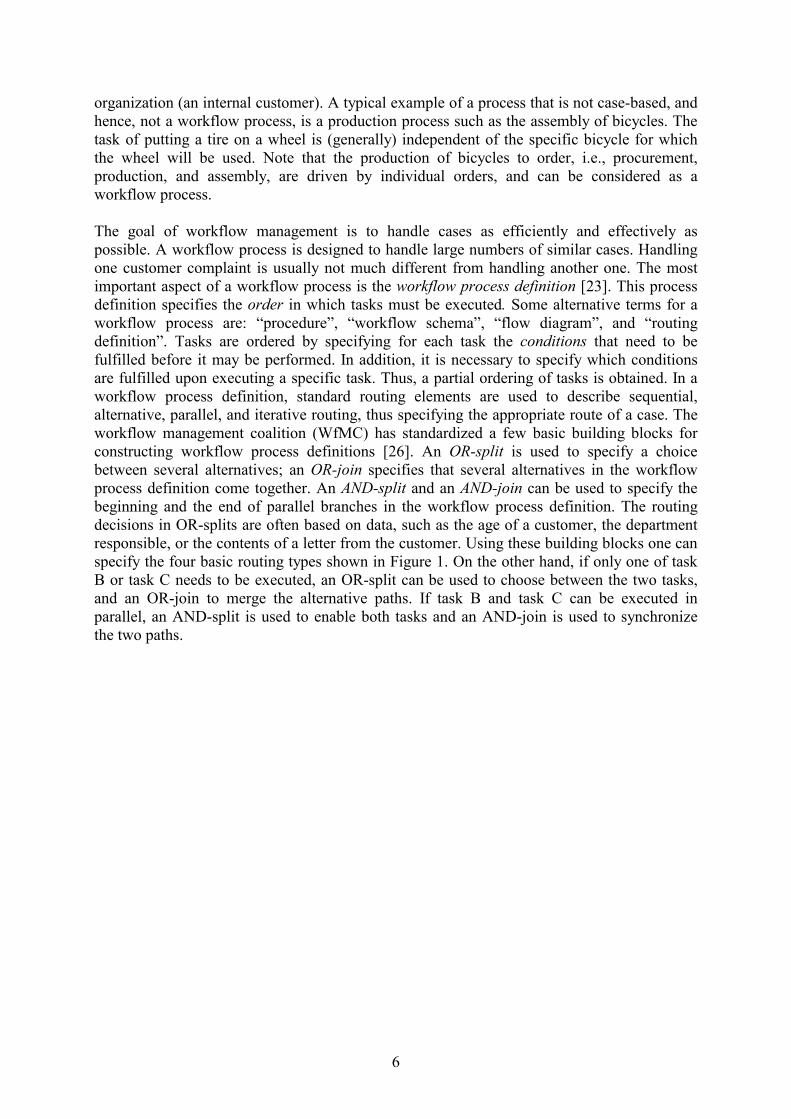
Figure 2 shows the workflow involved in a typical admissions process in a university. An application is received by a clerk and then forwarded to the admissions director for review. If the director feels that the application deserves serious consideration, then it is sent to three different admissions officers for further review of the personal essay, the transcripts and scores, and the letters of reference. Each admissions officer writes a short report and then one of them combines the three reviews, and prepares a final report along with a recommendation. The admissions director then makes a final decision and the clerk notifies the applicant accordingly. Even in this simplified process, five different roles are involved. Each role is specialized for certain tasks, yet it is evident that certain roles can perform other tasks also if the need arises. In addition to the process shown in Figure 2, we would also like to enforce constraints as follows:
1. exec(write report, case) ≠ exec(makes decision, case), penalty =1 2. exec(review essay, case) ≠ exec(review transcript, case) ≠ exec(review letters, case)
≠ exec(writes report, case), penalty = 0.2 The first constraint is a hard one (penalty = 1) that requires that the specific resource writing the report and the resource making the decision must be different. The second constraint is a soft one that says that the resources that carry out these four activities should all be different. This complex constraint can be rewritten as six simple constraints, and for each violation there is a penalty of 0.2. These penalties can be combined together, as shown in Section 3, to determine a conformance score.
15
Receive
Appln. Initial Review
Review essay
Review transcripts
Review letters
Write Report
Make Decision
Notify
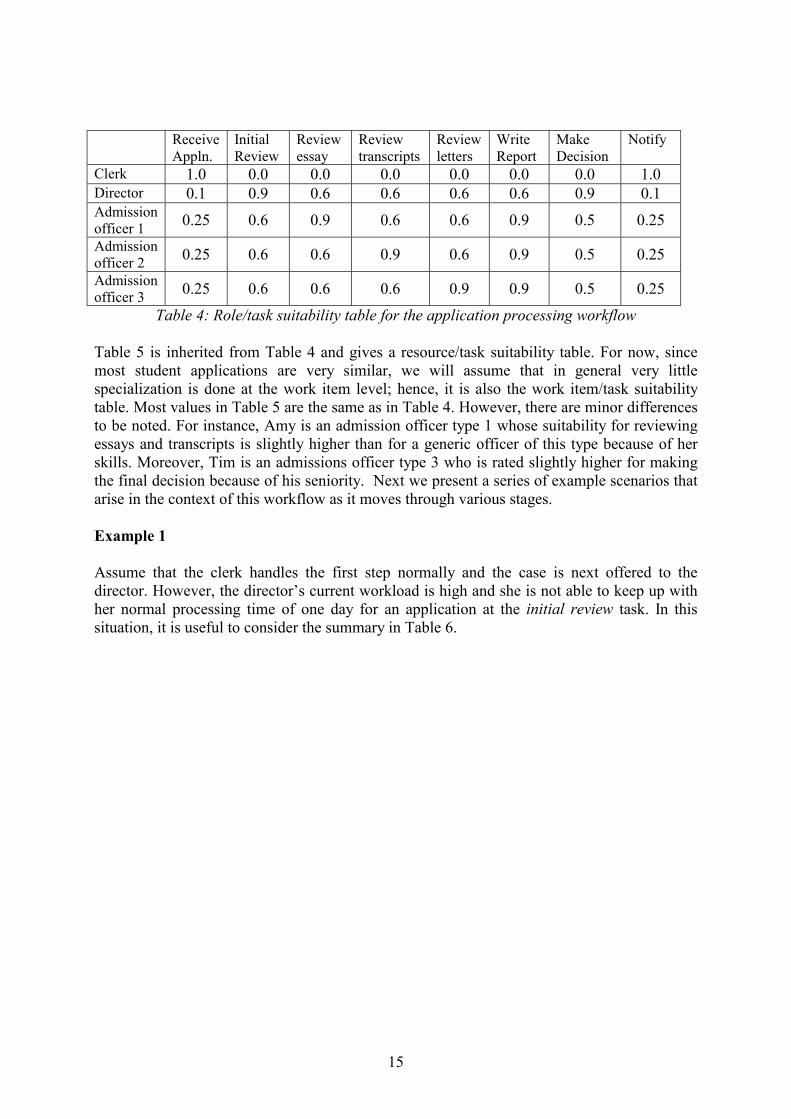
Clerk 1.0 0.0 0.0 0.0 0.0 0.0 0.0 1.0 Director 0.1 0.9 0.6 0.6 0.6 0.6 0.9 0.1 Admissionofficer 1 0.25 0.6 0.9 0.6 0.6 0.9 0.5 0.25 Admissionofficer 2 0.25 0.6 0.6 0.9 0.6 0.9 0.5 0.25 Admissionofficer 3 0.25 0.6 0.6 0.6 0.9 0.9 0.5 0.25
Table 4: Role/task suitability table for the application processing workflow Table 5 is inherited from Table 4 and gives a resource/task suitability table. For now, since most student applications are very similar, we will assume that in general very little specialization is done at the work item level; hence, it is also the work item/task suitability table. Most values in Table 5 are the same as in Table 4. However, there are minor differences to be noted. For instance, Amy is an admission officer type 1 whose suitability for reviewing essays and transcripts is slightly higher than for a generic officer of this type because of her skills. Moreover, Tim is an admissions officer type 3 who is rated slightly higher for making the final decision because of his seniority. Next we present a series of example scenarios that arise in the context of this workflow as it moves through various stages. Example 1 Assume that the clerk handles the first step normally and the case is next offered to the director. However, the director’s current workload is high and she is not able to keep up with her normal processing time of one day for an application at the initial review task. In this situation, it is useful to consider the summary in Table 6.
16
Receive appln.
Initial review
Review essay
Review transcripts
Review letters
Write report
Make decision
Notify
Clerk (Joe) 1.0 0.0 0.0 0.0 0.0 0.0 0.0 1.0 Director (Ann) 0.1 0.9 0.6 0.6 0.6 0.6 0.9 0.1 Admissionofficer 1 (Amy)
0.25 0.7 0.9 0.7 0.7 0.9 0.5 0.25
Admissionofficer 2 (Dan)
0.25 0.6 0.6 0.9 0.6 0.9 0.5 0.25
Admissionofficer 3 (Tim)
0.25 0.6 0.6 0.6 0.9 0.9 0.6 0.25
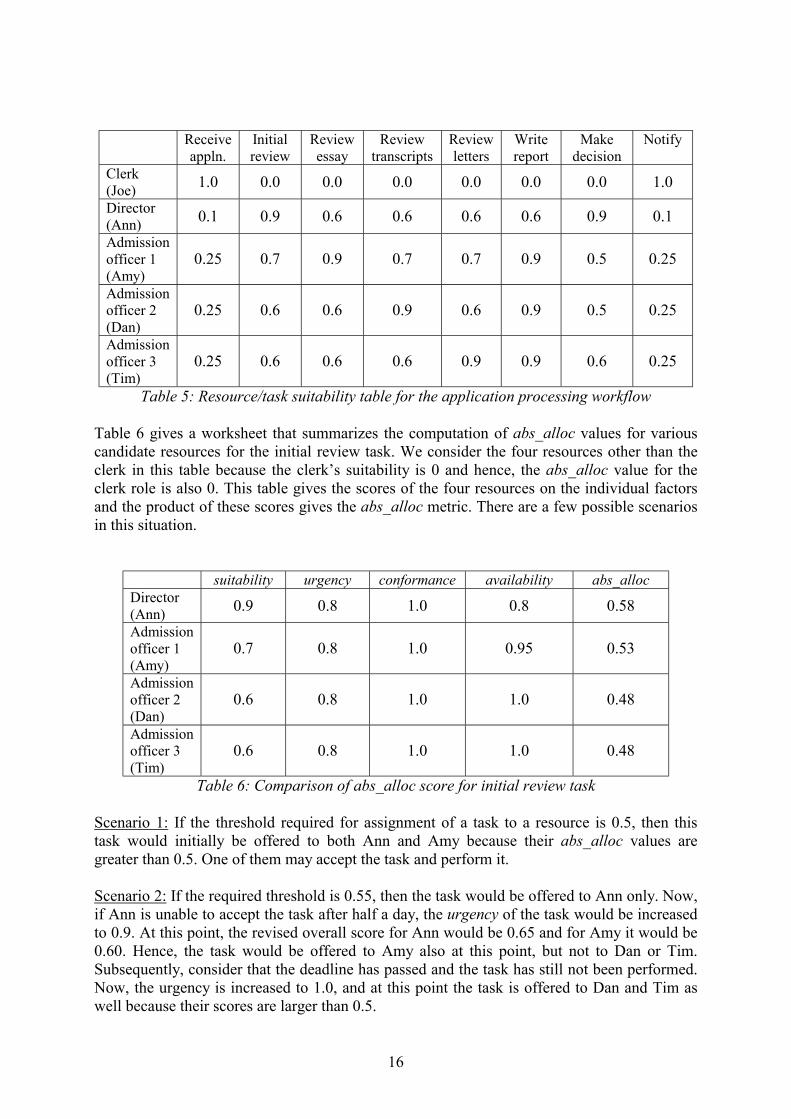
Table 5: Resource/task suitability table for the application processing workflow Table 6 gives a worksheet that summarizes the computation of abs_alloc values for various candidate resources for the initial review task. We consider the four resources other than the clerk in this table because the clerk’s suitability is 0 and hence, the abs_alloc value for the clerk role is also 0. This table gives the scores of the four resources on the individual factors and the product of these scores gives the abs_alloc metric. There are a few possible scenarios in this situation.
suitability urgency conformance availability abs_alloc Director (Ann) 0.9 0.8 1.0 0.8 0.58 Admissionofficer 1 (Amy)
0.7 0.8 1.0 0.95 0.53
Admissionofficer 2 (Dan)
0.6 0.8 1.0 1.0 0.48
Admissionofficer 3 (Tim)
0.6 0.8 1.0 1.0 0.48
Table 6: Comparison of abs_alloc score for initial review task Scenario 1: If the threshold required for assignment of a task to a resource is 0.5, then this task would initially be offered to both Ann and Amy because their abs_alloc values are greater than 0.5. One of them may accept the task and perform it. Scenario 2: If the required threshold is 0.55, then the task would be offered to Ann only. Now, if Ann is unable to accept the task after half a day, the urgency of the task would be increased to 0.9. At this point, the revised overall score for Ann would be 0.65 and for Amy it would be 0.60. Hence, the task would be offered to Amy also at this point, but not to Dan or Tim. Subsequently, consider that the deadline has passed and the task has still not been performed. Now, the urgency is increased to 1.0, and at this point the task is offered to Dan and Tim as well because their scores are larger than 0.5.
17
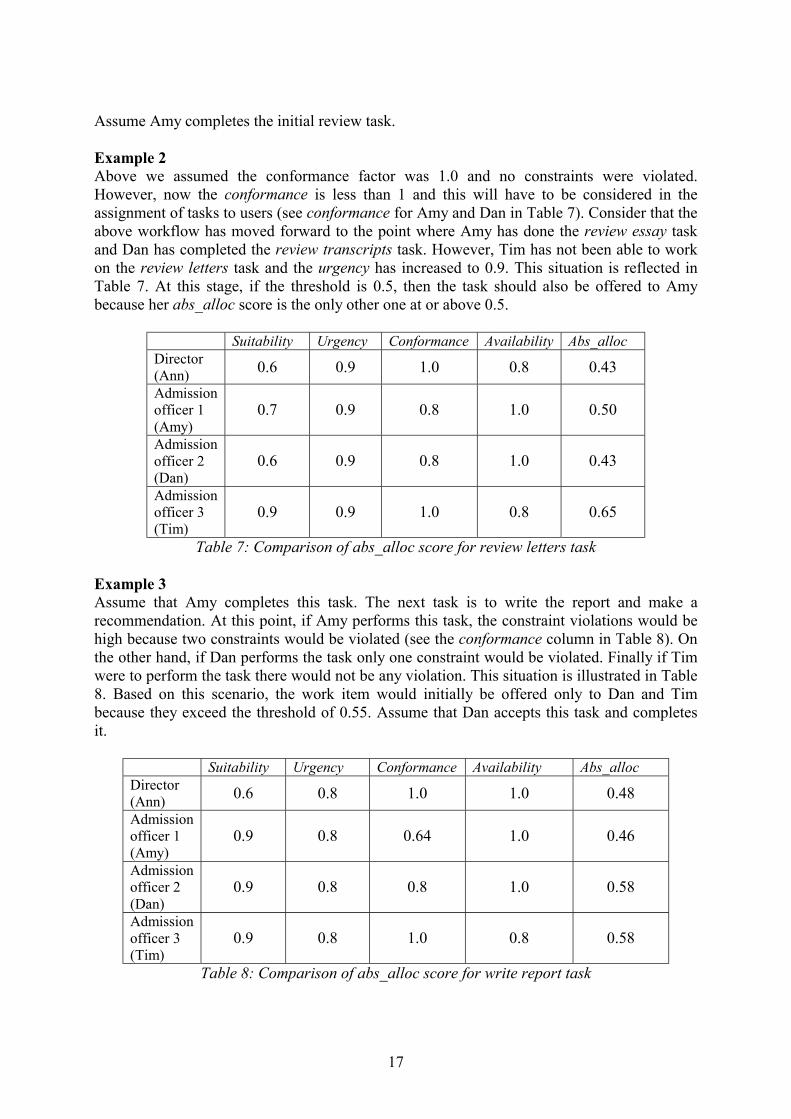
Assume Amy completes the initial review task. Example 2 Above we assumed the conformance factor was 1.0 and no constraints were violated. However, now the conformance is less than 1 and this will have to be considered in the assignment of tasks to users (see conformance for Amy and Dan in Table 7). Consider that the above workflow has moved forward to the point where Amy has done the review essay task and Dan has completed the review transcripts task. However, Tim has not been able to work on the review letters task and the urgency has increased to 0.9. This situation is reflected in Table 7. At this stage, if the threshold is 0.5, then the task should also be offered to Amy because her abs_alloc score is the only other one at or above 0.5.
Suitability Urgency Conformance Availability Abs_alloc Director (Ann) 0.6 0.9 1.0 0.8 0.43 Admissionofficer 1 (Amy)
0.7 0.9 0.8 1.0 0.50
Admissionofficer 2 (Dan)
0.6 0.9 0.8 1.0 0.43
Admissionofficer 3 (Tim)
0.9 0.9 1.0 0.8 0.65
Table 7: Comparison of abs_alloc score for review letters task Example 3 Assume that Amy completes this task. The next task is to write the report and make a recommendation. At this point, if Amy performs this task, the constraint violations would be high because two constraints would be violated (see the conformance column in Table 8). On the other hand, if Dan performs the task only one constraint would be violated. Finally if Tim were to perform the task there would not be any violation. This situation is illustrated in Table 8. Based on this scenario, the work item would initially be offered only to Dan and Tim because they exceed the threshold of 0.55. Assume that Dan accepts this task and completes it.
Suitability Urgency Conformance Availability Abs_alloc Director (Ann) 0.6 0.8 1.0 1.0 0.48 Admissionofficer 1 (Amy)
0.9 0.8 0.64 1.0 0.46
Admissionofficer 2 (Dan)
0.9 0.8 0.8 1.0 0.58
Admissionofficer 3 (Tim)
0.9 0.8 1.0 0.8 0.58
Table 8: Comparison of abs_alloc score for write report task
18
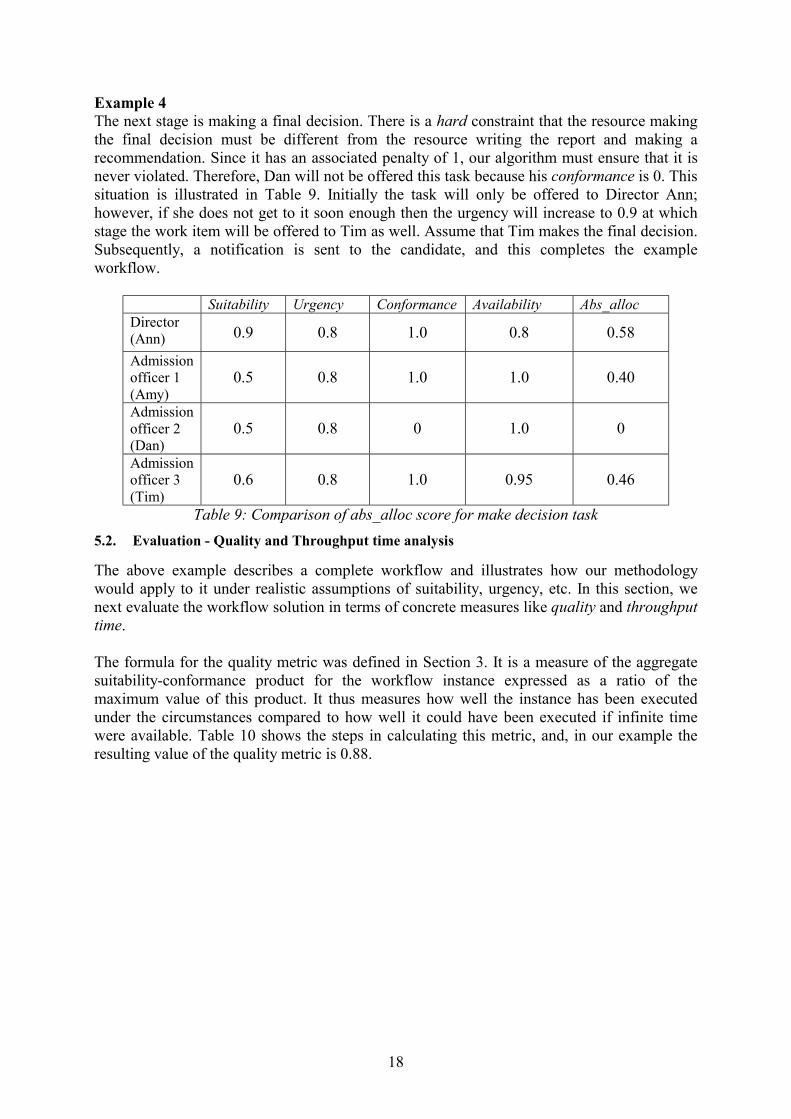
Example 4 The next stage is making a final decision. There is a hard constraint that the resource making the final decision must be different from the resource writing the report and making a recommendation. Since it has an associated penalty of 1, our algorithm must ensure that it is never violated. Therefore, Dan will not be offered this task because his conformance is 0. This situation is illustrated in Table 9. Initially the task will only be offered to Director Ann; however, if she does not get to it soon enough then the urgency will increase to 0.9 at which stage the work item will be offered to Tim as well. Assume that Tim makes the final decision. Subsequently, a notification is sent to the candidate, and this completes the example workflow.
Suitability Urgency Conformance Availability Abs_alloc Director (Ann) 0.9 0.8 1.0 0.8 0.58
Admissionofficer 1 (Amy)
0.5 0.8 1.0 1.0 0.40
Admissionofficer 2 (Dan)
0.5 0.8 0 1.0 0
Admissionofficer 3 (Tim)
0.6 0.8 1.0 0.95 0.46
Table 9: Comparison of abs_alloc score for make decision task 5.2. Evaluation - Quality and Throughput time analysis
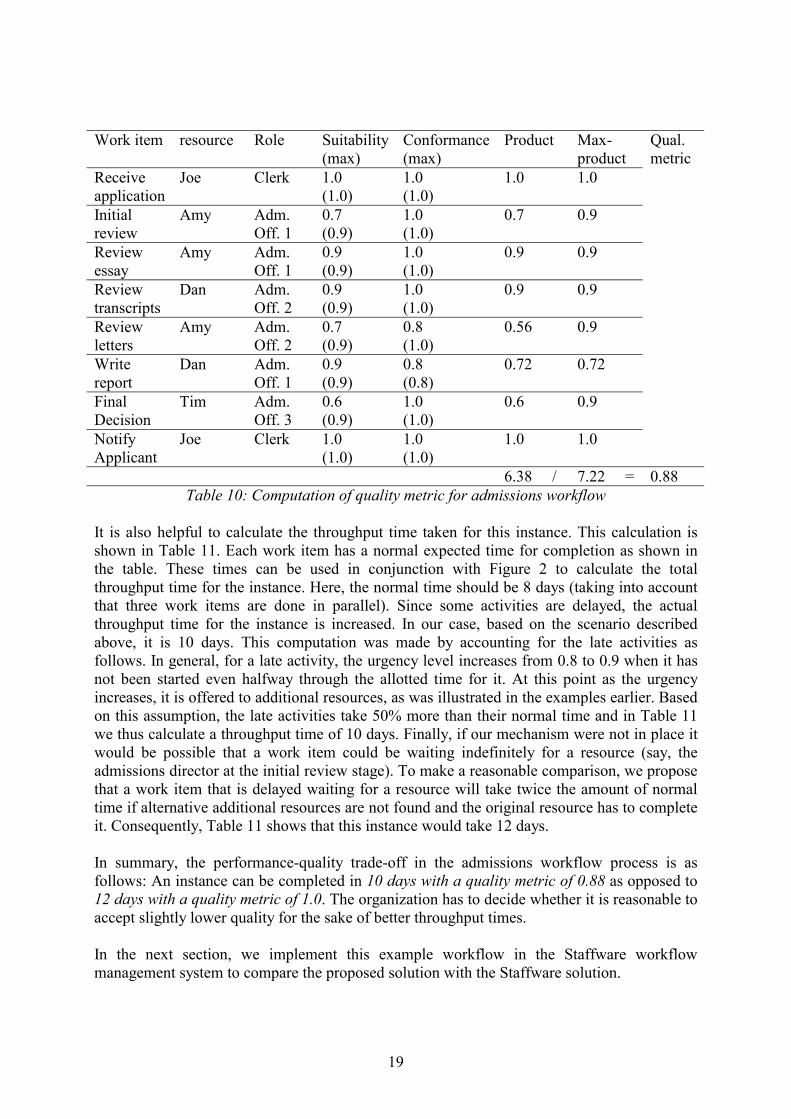
The above example describes a complete workflow and illustrates how our methodology would apply to it under realistic assumptions of suitability, urgency, etc. In this section, we next evaluate the workflow solution in terms of concrete measures like quality and throughput time. The formula for the quality metric was defined in Section 3. It is a measure of the aggregate suitability-conformance product for the workflow instance expressed as a ratio of the maximum value of this product. It thus measures how well the instance has been executed under the circumstances compared to how well it could have been executed if infinite time were available. Table 10 shows the steps in calculating this metric, and, in our example the resulting value of the quality metric is 0.88.
19
Work item resource Role Suitability
(max) Conformance (max)
Product Max-product
Receive application
Joe Clerk 1.0 (1.0)
1.0 (1.0)
1.0 1.0
Initial review
Amy Adm. Off. 1
0.7 (0.9)
1.0 (1.0)
0.7 0.9
Review essay
Amy Adm. Off. 1
0.9 (0.9)
1.0 (1.0)
0.9 0.9
Review transcripts
Dan Adm. Off. 2
0.9 (0.9)
1.0 (1.0)
0.9 0.9
Review letters
Amy Adm. Off. 2
0.7 (0.9)
0.8 (1.0)
0.56 0.9
Write report
Dan Adm. Off. 1
0.9 (0.9)
0.8 (0.8)
0.72 0.72
Final Decision
Tim Adm. Off. 3
0.6 (0.9)
1.0 (1.0)
0.6 0.9
Notify Applicant
Joe Clerk 1.0 (1.0)
1.0 (1.0)
1.0 1.0
Qual. metric
6.38 / 7.22 = 0.88 Table 10: Computation of quality metric for admissions workflow
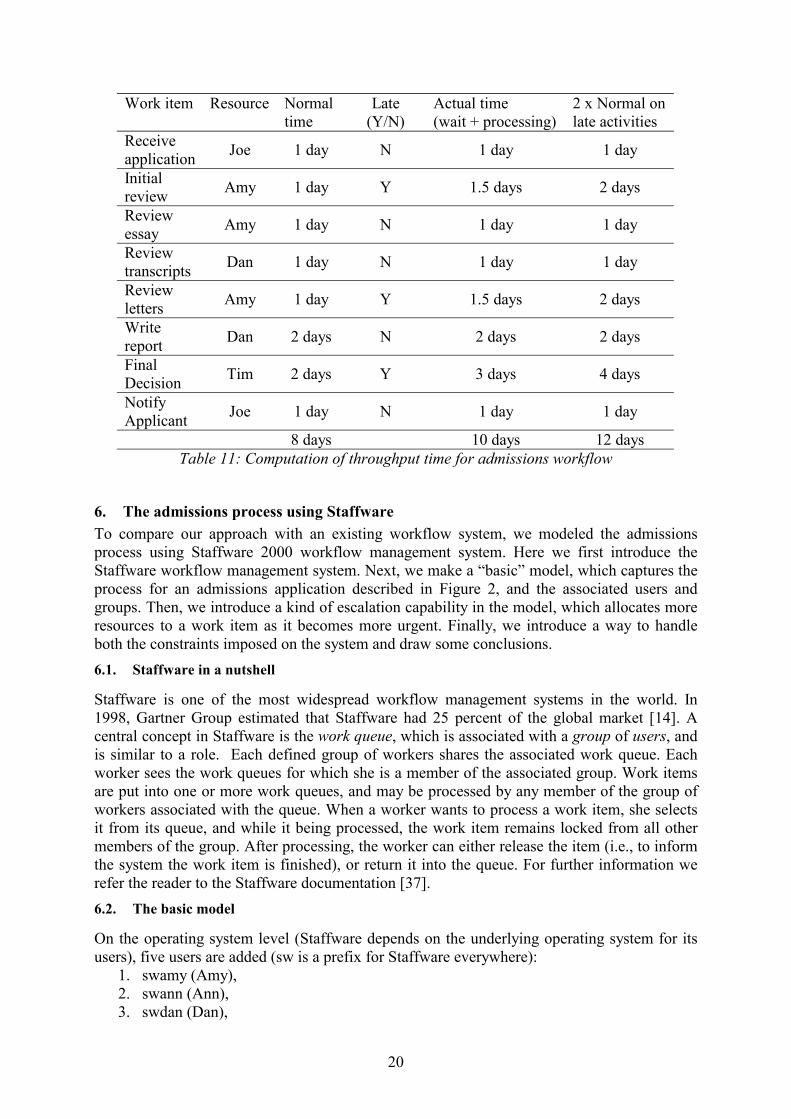
It is also helpful to calculate the throughput time taken for this instance. This calculation is shown in Table 11. Each work item has a normal expected time for completion as shown in the table. These times can be used in conjunction with Figure 2 to calculate the total throughput time for the instance. Here, the normal time should be 8 days (taking into account that three work items are done in parallel). Since some activities are delayed, the actual throughput time for the instance is increased. In our case, based on the scenario described above, it is 10 days. This computation was made by accounting for the late activities as follows. In general, for a late activity, the urgency level increases from 0.8 to 0.9 when it has not been started even halfway through the allotted time for it. At this point as the urgency increases, it is offered to additional resources, as was illustrated in the examples earlier. Based on this assumption, the late activities take 50% more than their normal time and in Table 11 we thus calculate a throughput time of 10 days. Finally, if our mechanism were not in place it would be possible that a work item could be waiting indefinitely for a resource (say, the admissions director at the initial review stage). To make a reasonable comparison, we propose that a work item that is delayed waiting for a resource will take twice the amount of normal time if alternative additional resources are not found and the original resource has to complete it. Consequently, Table 11 shows that this instance would take 12 days. In summary, the performance-quality trade-off in the admissions workflow process is as follows: An instance can be completed in 10 days with a quality metric of 0.88 as opposed to 12 days with a quality metric of 1.0. The organization has to decide whether it is reasonable to accept slightly lower quality for the sake of better throughput times. In the next section, we implement this example workflow in the Staffware workflow management system to compare the proposed solution with the Staffware solution.
20
Work item Resource Normal time
Late (Y/N)
Actual time (wait + processing)
2 x Normal on late activities
Receive application Joe 1 day N 1 day 1 day
Initial review Amy 1 day Y 1.5 days 2 days
Review essay Amy 1 day N 1 day 1 day
Review transcripts Dan 1 day N 1 day 1 day
Review letters Amy 1 day Y 1.5 days 2 days
Write report Dan 2 days N 2 days 2 days
Final Decision Tim 2 days Y 3 days 4 days
Notify Applicant Joe 1 day N 1 day 1 day
8 days 10 days 12 days Table 11: Computation of throughput time for admissions workflow
6. The admissions process using Staffware To compare our approach with an existing workflow system, we modeled the admissions process using Staffware 2000 workflow management system. Here we first introduce the Staffware workflow management system. Next, we make a “basic” model, which captures the process for an admissions application described in Figure 2, and the associated users and groups. Then, we introduce a kind of escalation capability in the model, which allocates more resources to a work item as it becomes more urgent. Finally, we introduce a way to handle both the constraints imposed on the system and draw some conclusions. 6.1. Staffware in a nutshell
Staffware is one of the most widespread workflow management systems in the world. In 1998, Gartner Group estimated that Staffware had 25 percent of the global market [14]. A central concept in Staffware is the work queue, which is associated with a group of users, and is similar to a role. Each defined group of workers shares the associated work queue. Each worker sees the work queues for which she is a member of the associated group. Work items are put into one or more work queues, and may be processed by any member of the group of workers associated with the queue. When a worker wants to process a work item, she selects it from its queue, and while it being processed, the work item remains locked from all other members of the group. After processing, the worker can either release the item (i.e., to inform the system the work item is finished), or return it into the queue. For further information we refer the reader to the Staffware documentation [37]. 6.2. The basic model
On the operating system level (Staffware depends on the underlying operating system for its users), five users are added (sw is a prefix for Staffware everywhere):
1. swamy (Amy), 2. swann (Ann), 3. swdan (Dan),
21
4. swjoe (Joe), and 5. swtim (Tim).
On the Staffware level, six groups (with members in parentheses) are introduced:
1. Clerk (swjoe), 2. Director (swann), 3. Admissions officer 1 (swamy), 4. Admissions officer 2 (swdan), 5. Admissions officer 3 (swtim), and 6. Admissions officer (swamy, swdan, and swtim).
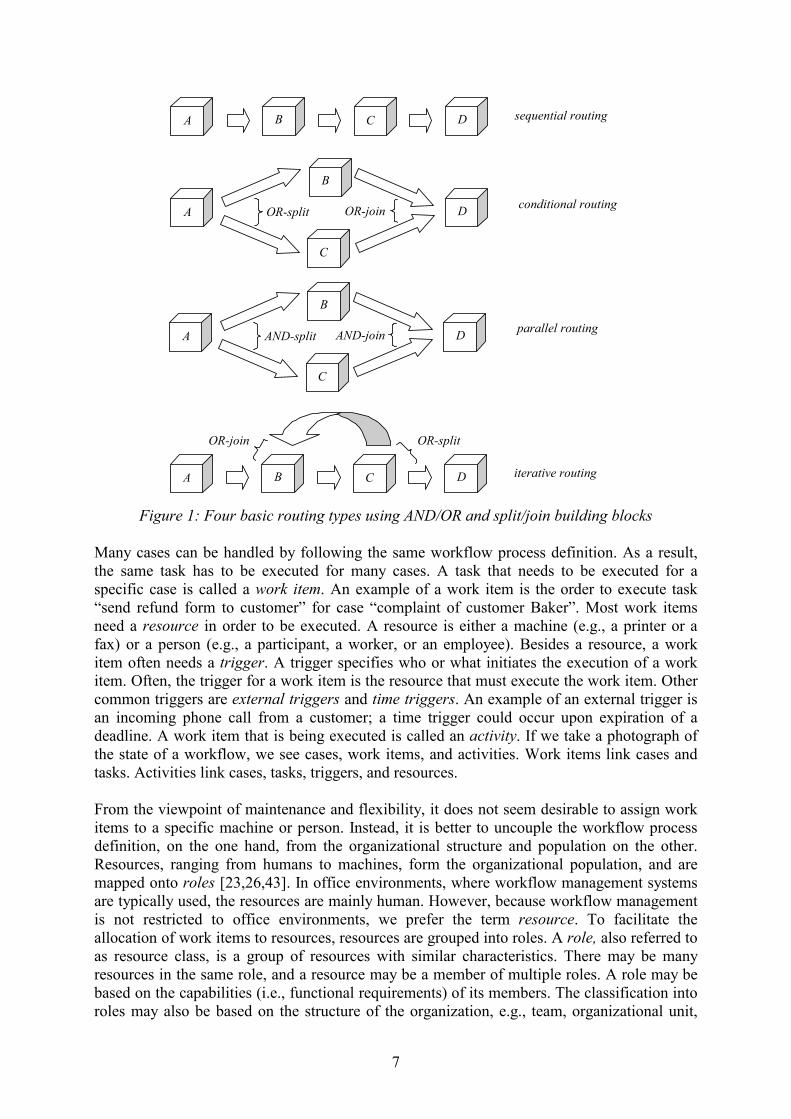
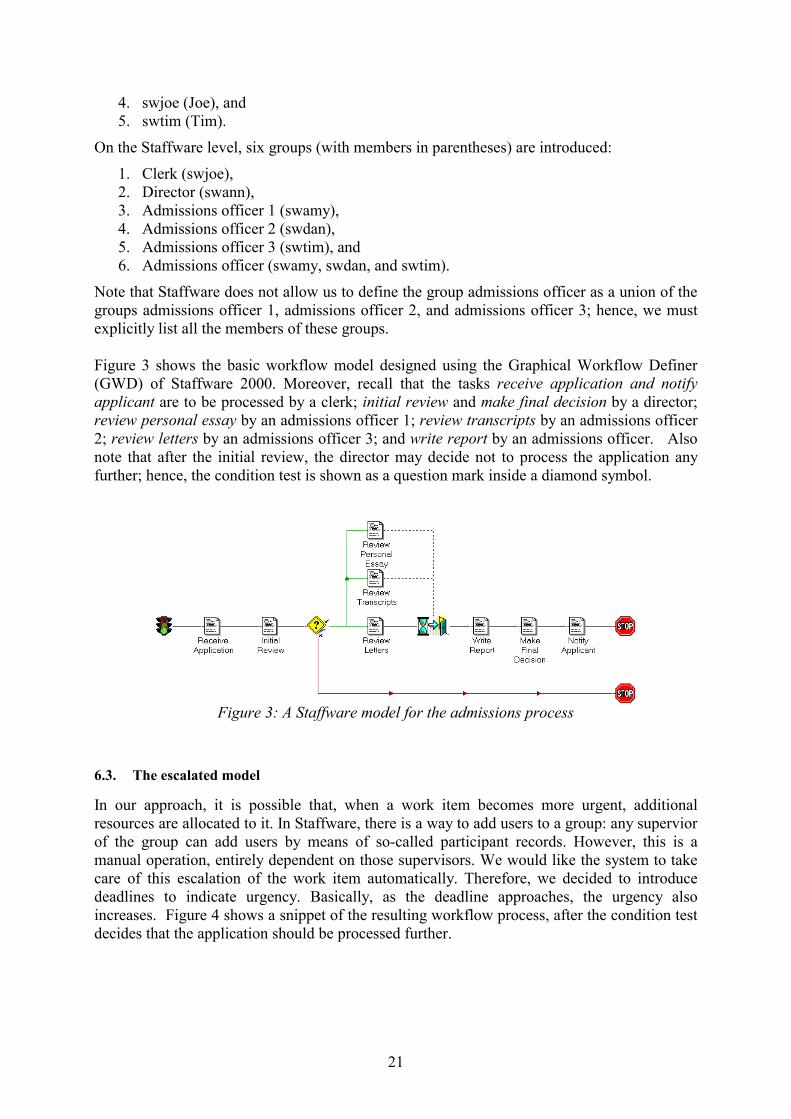
Note that Staffware does not allow us to define the group admissions officer as a union of the groups admissions officer 1, admissions officer 2, and admissions officer 3; hence, we must explicitly list all the members of these groups. Figure 3 shows the basic workflow model designed using the Graphical Workflow Definer (GWD) of Staffware 2000. Moreover, recall that the tasks receive application and notify applicant are to be processed by a clerk; initial review and make final decision by a director; review personal essay by an admissions officer 1; review transcripts by an admissions officer 2; review letters by an admissions officer 3; and write report by an admissions officer. Also note that after the initial review, the director may decide not to process the application any further; hence, the condition test is shown as a question mark inside a diamond symbol.
Figure 3: A Staffware model for the admissions process
6.3. The escalated model
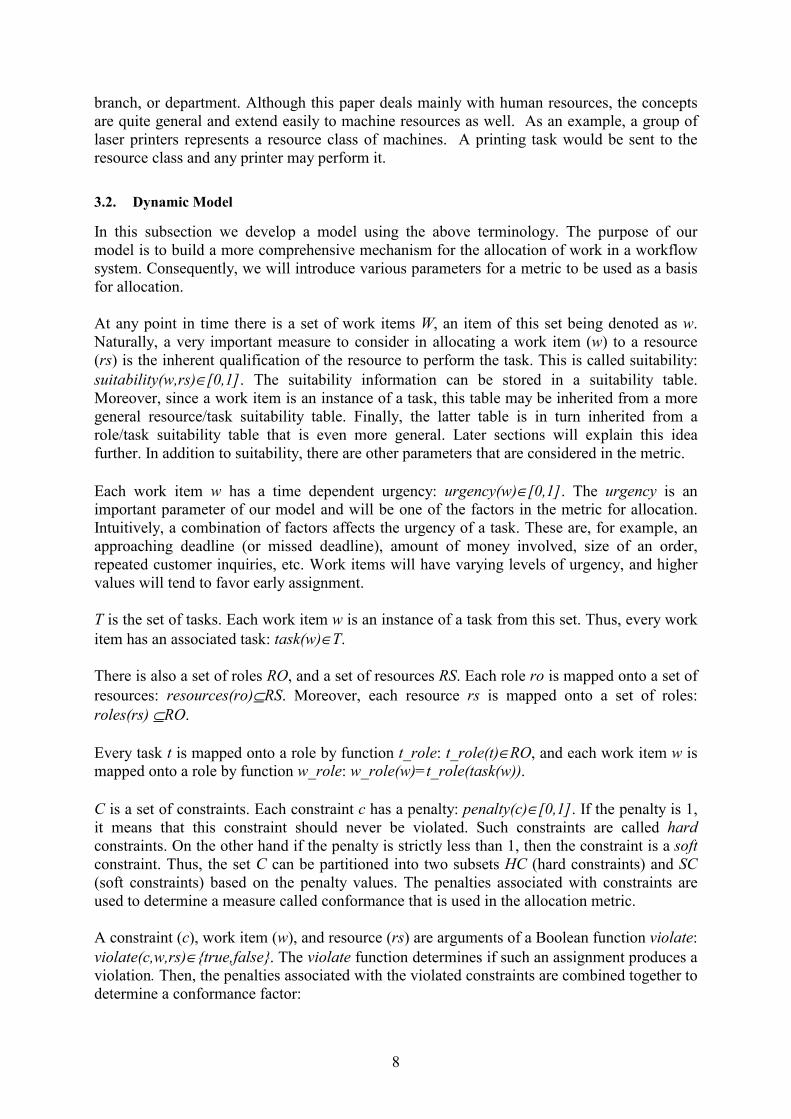
In our approach, it is possible that, when a work item becomes more urgent, additional resources are allocated to it. In Staffware, there is a way to add users to a group: any supervior of the group can add users by means of so-called participant records. However, this is a manual operation, entirely dependent on those supervisors. We would like the system to take care of this escalation of the work item automatically. Therefore, we decided to introduce deadlines to indicate urgency. Basically, as the deadline approaches, the urgency also increases. Figure 4 shows a snippet of the resulting workflow process, after the condition test decides that the application should be processed further.
22
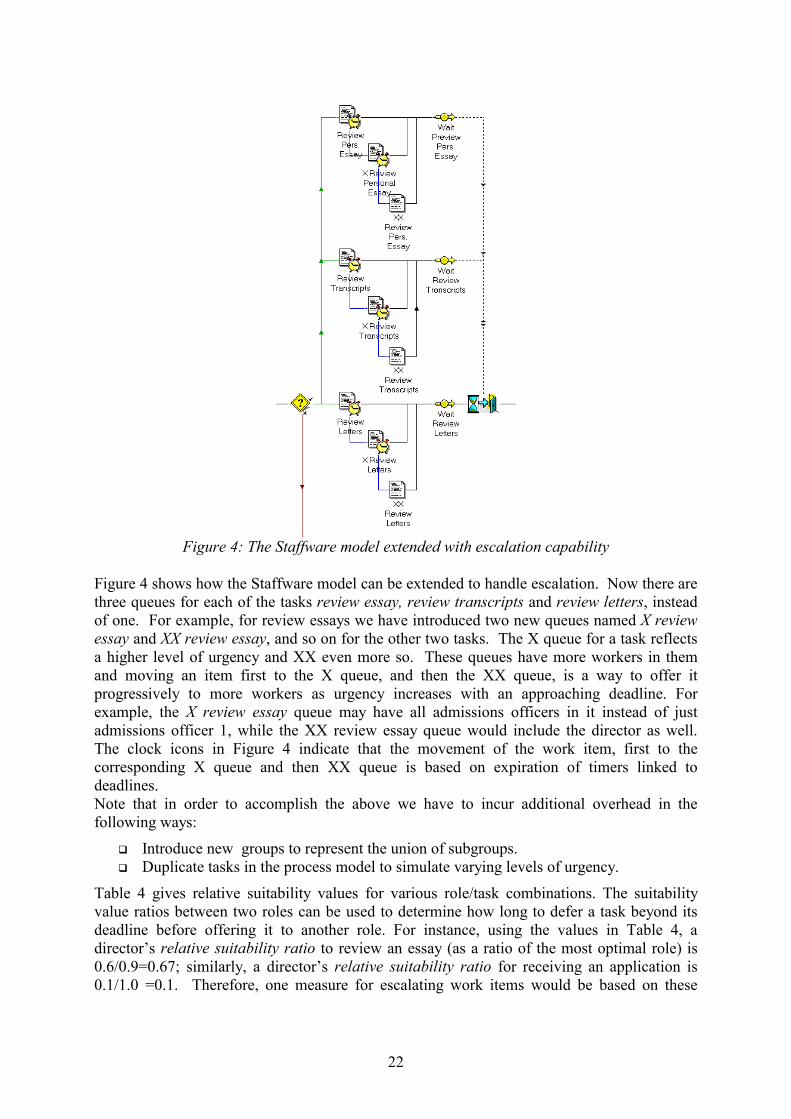
Figure 4: The Staffware model extended with escalation capability
Figure 4 shows how the Staffware model can be extended to handle escalation. Now there are three queues for each of the tasks review essay, review transcripts and review letters, instead of one. For example, for review essays we have introduced two new queues named X review essay and XX review essay, and so on for the other two tasks. The X queue for a task reflects a higher level of urgency and XX even more so. These queues have more workers in them and moving an item first to the X queue, and then the XX queue, is a way to offer it progressively to more workers as urgency increases with an approaching deadline. For example, the X review essay queue may have all admissions officers in it instead of just admissions officer 1, while the XX review essay queue would include the director as well. The clock icons in Figure 4 indicate that the movement of the work item, first to the corresponding X queue and then XX queue is based on expiration of timers linked to deadlines. Note that in order to accomplish the above we have to incur additional overhead in the following ways:
Introduce new groups to represent the union of subgroups. Duplicate tasks in the process model to simulate varying levels of urgency.
Table 4 gives relative suitability values for various role/task combinations. The suitability value ratios between two roles can be used to determine how long to defer a task beyond its deadline before offering it to another role. For instance, using the values in Table 4, a director’s relative suitability ratio to review an essay (as a ratio of the most optimal role) is 0.6/0.9=0.67; similarly, a director’s relative suitability ratio for receiving an application is 0.1/1.0 =0.1. Therefore, one measure for escalating work items would be based on these
23
ratios; i.e., if a review essay item is escalated to a director 1 day after its deadline, a receive application work item would be escalated to her 6.7 days after the deadline. 6.4. Adding constraints in Staffware
This still leaves us with the problem of how to add the two constraints mentioned in Section 5.1 to the model. The first constraint is a hard constraint and easier to model. To model the second constraint (a soft one), we need a way for denying work items to certain users for a certain period of time. For example, if Tim has performed the review personal essay task, he should not be offered the review letters task immediately, or else he will incur a penalty of 0.2. To model the two constraints, we first introduce four case attributes for storing the names of workers who perform specific tasks:
1. R_ESSAY: the worker (if any) who has reviewed the personal essay, 2. R_TRANSCRIPTS: the worker (if any) who has reviewed the transcripts, 3. R_LETTERS: the worker (if any) who has reviewed the letters, and 4. W_REPORT: the worker (if any) who has written the report.
Next, we introduce a script to enforce each constraint.
6.4.1. Constraint 1
The first script should initially deny the make final decision task to the worker who has written the report. This is achieved as follows (for readability we have added comments, starting with a semi-colon, and wrapped lines where necessary, although Staffware might not approve): IF W_REPORT = SW_USER:NAME; if user who has written report tries to access the work item ; then formcontrol(0); abort the processing formcontrol(2); put the work item back in queue for other users messagebox("Constraint violation (1)" ; title of message box ,"You are not allowed to process this work item" ; message , 1; put an exclamation mark icon in the message box , 0); and an OK button ENDIF By associating this script with the make final decision task (using the Initial Form Command feature of Staffware) and setting the value of the case attribute W_REPORT to the worker who wrote the report, the following effect is produced:
Worker W_REPORT is denied this work item. Any other worker is allowed to process the work item.
6.4.2. Constraint 2
The second (soft) constraint is implemented in two parts in Staffware. The first part of the script is similar to the above script of the first constraint: IF ( R_ESSAY = SW_USER:NAME OR R_TRANSCRIPTS = SW_USER:NAME OR R_LETTERS = SW_USER:NAME OR W_REPORT = SW_USER:NAME ) AND SW_IP_VALUE > 48 ; SW_IP_VALUE is the priority number of the current work item formcontrol(0) formcontrol(2)
24
messagebox("Constraint violation (2)" ,"You are not allowed to process this work item unless the priority drops below 49" , 1 , 0) ENDIF Thus, a worker who has reviewed the personal essay, reviewed the transcripts, reviewed the letters, or written the report, is only allowed to take up the work item if it is urgent enough (i.e., the priority value is below 49); otherwise, she gets a message denying her access to it. The numeric priority values in Staffware decrease with time because lower numeric values represent greater urgency, with the highest urgency for a value of 1. It is possible in this way to adjust the rate of decrease of priority values such that an item that has not been accepted will progressively become available to more and more workers as the priority value drops (corresponding to an increase in urgency). The second part of the script given below sets the case attributes. Note that RPE is an abbreviation for the review personal essay task, XRPE is the escalated RPE task, and so on. Moreover, RT and RL are abbreviations for review transcripts and review letters tasks. IF (SW_STEPNAME = "RPE" OR SW_STEPNAME = "XRPE" OR SW_STEPNAME = "XXRPE") R_ESSAY := SW_USER:NAME ELSEIF (SW_STEPNAME = "RT" OR SW_STEPNAME = "XRT" OR SW_STEPNAME = "XXRT") R_TRANSCRIPTS := SW_USER:NAME ELSEIF (SW_STEPNAME = "RL" OR SW_STEPNAME = "XRL" OR SW_STEPNAME = "XXRL") R_LETTERS := SW_USER:NAME ELSE W_REPORT := SW_USER:NAME ENDIF This script is associated with the review essay, review transcript, review letters and write report tasks so that it is activated when an attempt is made to perform any of those tasks. Note that this script sets the case attribute W_REPORT needed by the first constraint for the make final decision task. 6.5. Discussion
In this section, we turn to evaluate the Staffware model and compare it with our work distribution approach described earlier. Basically, Staffware has several shortcomings. Because Staffware lacks the notion of composite groups (e.g. unions of other groups), one must define every possible group explicitly. For an example as small as ours, containing only five roles, this is still manageable since we had altogether 9 groups. However, for a real-life example, this may easily result in a combinatorial explosion and become impractical. To model the escalation of work items, we had to duplicate tasks and create multiple work item queues corresponding to higher levels of escalation (e.g., RPE, XRPE, XXRPE, etc.). This raises consistency issues because all these tasks are identical and changing one task would involve changing the escalated versions also. Moreover, the increase in urgency had to be captured by the fall in priority values with time. Hence, this is not a very “clean” implementation. Moreover, Staffware could model other aspects of the desired functionality only in an artificial way that does not scale well. The constraints to capture the effect of penalties and
25
urgencies had to be contrived and are less than satisfactory. Thus, the workers were able to select certain work items but were later denied access to them when they tried to process them, unless the urgency increased beyond a threshold. On the other hand, in our proposal it is possible to model the effect of penalties and urgencies in a more accurate manner. Another shortcoming of the Staffware model is that it does not keep any information about resource availability. As a result, a work item may be allocated to an absent or otherwise unavailable worker and an available worker may not see it until a deadline has expired. We did not even model the information of Table 5 (Resource/task suitability table) in Staffware. This would lead to even more groups and more escalation steps in the model. Furthermore, in the Staffware model, there is no such thing as a resource-specific threshold: an overloaded member of a group will see the same work item as a relatively idle member. It is interesting to evaluate the Staffware model using the scenario described by Table 11. Using the approach presented in Section 5, the actual throughput time is 10 days. If the Staffware model is used under similar circumstances, the actual throughput time is at least 11 days. The increase in throughput time is explained by the fact that the review of the letters takes more time because we have to wait for Amy’s penalty to expire before someone else can access this task. Similarly, the writing of the report takes more time as well since Dan’s penalty has to expire. In all, it takes at least one more day to handle the case.
The problems indicated show that Staffware lacks the flexibility of our proposed approach in several ways and is not really suitable to model full scale, real-life work distribution problems.
7. Simulation In this section we compare our work distribution strategies with two of the best known strategies: Push and Pull (cf. Section 1). Consequently, we briefly summarize the various strategies, list the assumptions that were made, and briefly describe the simulation methodology. Finally, we give the simulation results in terms of throughput times and the quality metric, and discuss them. 7.1. Strategies
For testing our approach, we simulated the following five strategies: 1. Push: a work item w is visible only to those resources rs that have maximal suitability
for it. 2. Pull: a work item w is visible to all resources rs. 3. Typical: a work item w is visible to resource rs iff abs_alloc(w, rs) exceeds a threshold
value of 0.5. This represents a typical resource. 4. Receptive: a work item w is visible to resource rs iff abs_alloc(w, rs) exceeds a
threshold value lower than the typical, e.g., 0.4. This indicates a more receptive resource.
5. Selective: a work item w is visible to resource rs iff abs_alloc(w, rs) exceeds a threshold value higher than the typical, e.g., 0.6. This indicates a more selective resource than the typical resource.
7.2. Assumptions
For the simulation model several assumptions were made as follows: The arrival process is Poisson. The service times are Beta-distributed. Table 12 gives the mean, minimum and maximum service times for various tasks. 5% of the applications are rejected after the initial review.
26
The initial urgency is 0.8, and it is increased to 1.0 in two increments of 0.1, each after one-half day intervals. An idle resource selects the oldest item from its inbox (if non-empty) and starts processing it.
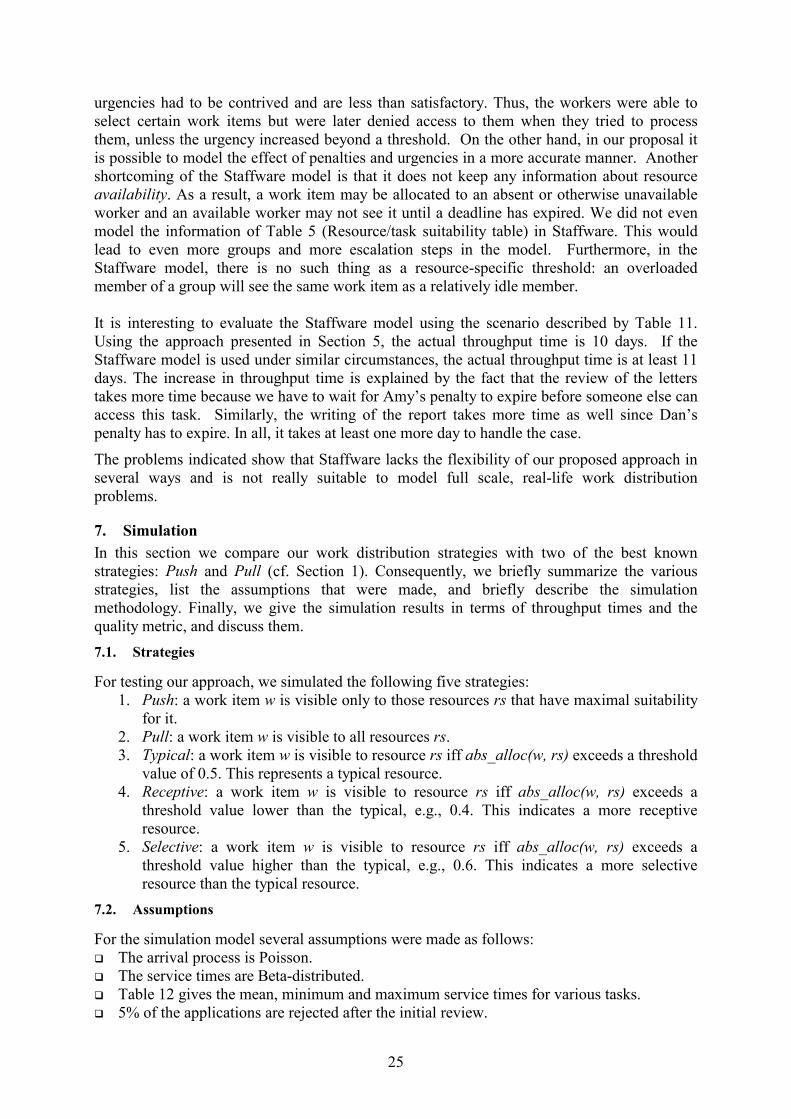
Task Mean Minimum Maximum ReceiveApplication 1 day 0.5 day 1.5 days InitialReview 1 day 0.5 day 1.5 days Review Essay 1 day 0.5 day 1.5 days Review Transcripts 1 day 0.5 day 1.5 days Review Letters 1 day 0.5 day 1.5 days Write Report 2 days 1.5 days 2.5 days Make Decisions 3 days 2.5 days 3.5 days NotifyApplicant 1 day 0.5 day 1.5 days
Table 12: Mean, minimum and maximum distribution times 7.3. Simulation model
The simulation model was built and run using the ExSpect 6.2 tool [7]. The platform was a PC with a Pentium 500Mhz processor, 256MB of memory, running Windows NT 4.0. A single simulation consists of 10 sub-runs, each one year long. The first sub-run is a start-up run and is discarded. 7.4. Simulation results
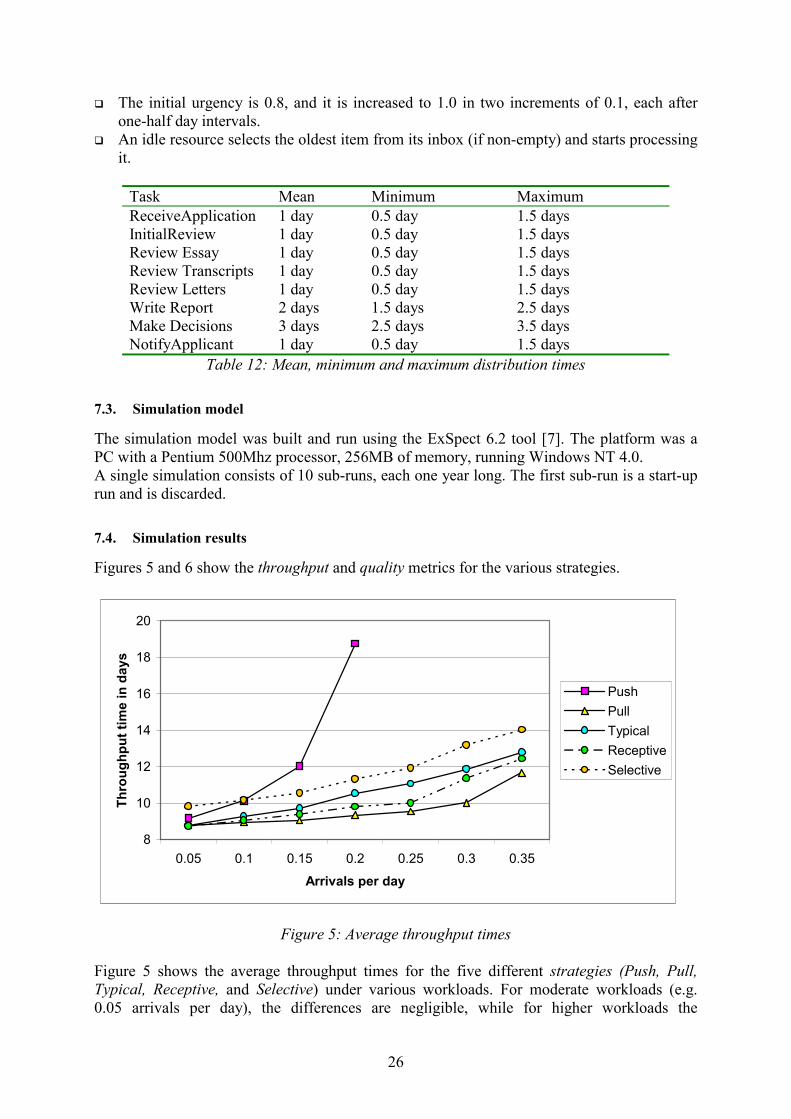
Figures 5 and 6 show the throughput and quality metrics for the various strategies.
8
10
12
14
16
18
20
0.05 0.1 0.15 0.2 0.25 0.3 0.35
Arrivals per day
Thro
ughp
ut ti
me
in d
ays
PushPullTypicalReceptiveSelective
Figure 5: Average throughput times
Figure 5 shows the average throughput times for the five different strategies (Push, Pull, Typical, Receptive, and Selective) under various workloads. For moderate workloads (e.g. 0.05 arrivals per day), the differences are negligible, while for higher workloads the
27
differences are very significant. In particular, the Push strategy performs very poorly when the arrival rate increases beyond 0.15.
0.50.550.6
0.650.7
0.750.8
0.850.9
0.951
0.05 0.1 0.15 0.2 0.25 0.3 0.35
Arrivals per day
Qua
lity
PushPullTypicalReceptiveSelective
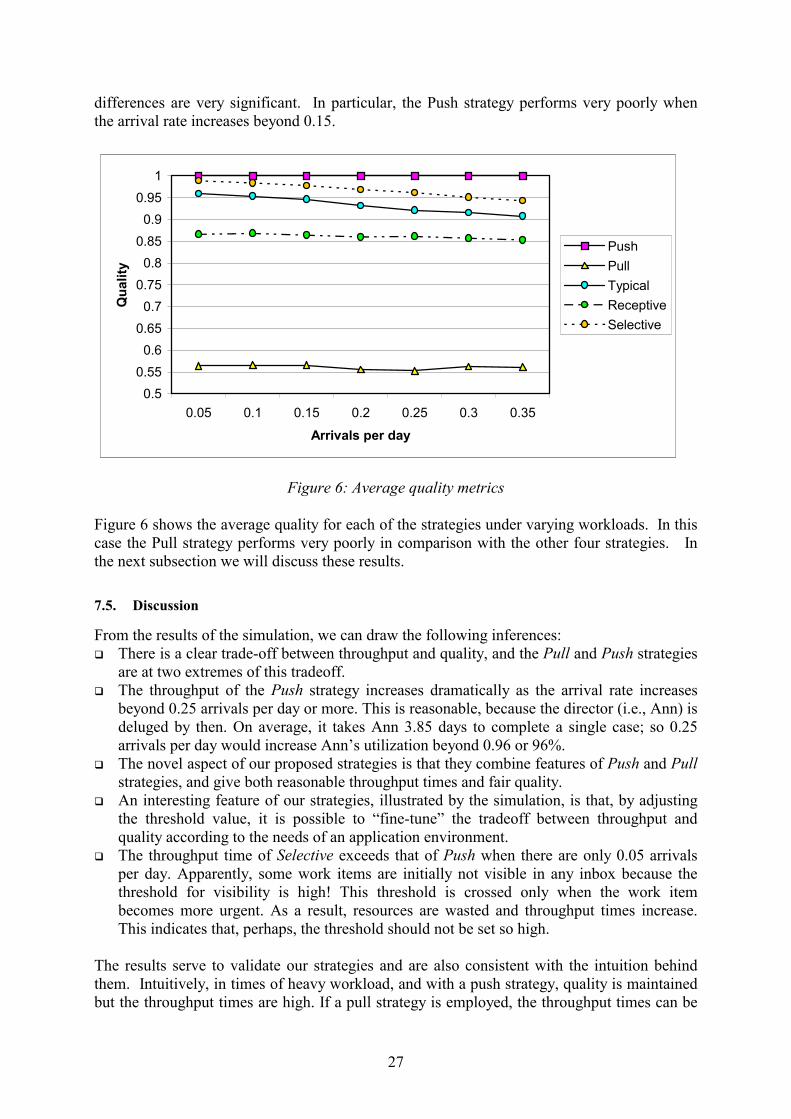
Figure 6: Average quality metrics
Figure 6 shows the average quality for each of the strategies under varying workloads. In this case the Pull strategy performs very poorly in comparison with the other four strategies. In the next subsection we will discuss these results. 7.5. Discussion
From the results of the simulation, we can draw the following inferences: There is a clear trade-off between throughput and quality, and the Pull and Push strategies are at two extremes of this tradeoff. The throughput of the Push strategy increases dramatically as the arrival rate increases beyond 0.25 arrivals per day or more. This is reasonable, because the director (i.e., Ann) is deluged by then. On average, it takes Ann 3.85 days to complete a single case; so 0.25 arrivals per day would increase Ann’s utilization beyond 0.96 or 96%. The novel aspect of our proposed strategies is that they combine features of Push and Pull strategies, and give both reasonable throughput times and fair quality. An interesting feature of our strategies, illustrated by the simulation, is that, by adjusting the threshold value, it is possible to “fine-tune” the tradeoff between throughput and quality according to the needs of an application environment. The throughput time of Selective exceeds that of Push when there are only 0.05 arrivals per day. Apparently, some work items are initially not visible in any inbox because the threshold for visibility is high! This threshold is crossed only when the work item becomes more urgent. As a result, resources are wasted and throughput times increase. This indicates that, perhaps, the threshold should not be set so high.
The results serve to validate our strategies and are also consistent with the intuition behind them. Intuitively, in times of heavy workload, and with a push strategy, quality is maintained but the throughput times are high. If a pull strategy is employed, the throughput times can be
28
reduced but the resulting quality is lower (this is also the case in times of moderate workloads). Choosing the right threshold value, i.e., being as receptive as necessary, provides a compromise between quality and performance. This is consistent with the results of the simulation. It should be noted that, in the simulation model, we used the abs_alloc factor to determine the suitability of a resource for a work item. We could have used the alloc factor instead, but since for each work item at least four resources are suitable, the difference would be small. If alloc factor were used, then both throughput times and quality metrics would be slightly lower (since abs_alloc ≤ alloc).
8. Conclusion This paper introduced a novel and more sophisticated mechanism to distribute work than the ones that are currently employed in workflow systems. Compared to existing workflow management systems that provide pure push or pull approaches, the mechanism allows on-the-fly balancing of security and performance considerations. It integrates work distribution and delegation into a common framework, thus obviating the need for a separate delegation mechanism. As a “proof of concept” the mechanism was compared with existing approaches using a realistic scenario implemented using Staffware. This comparison shows that even a state of the art workflow system falls short in modeling dynamic work distribution strategies. Furthermore, a simulation model was implemented to validate the new strategies and compare them with the push and pull approaches. The results of the simulation study clearly show that: (1) the push and pull approaches lie at two extreme points of the tradeoff between performance and quality; and, (2) the proposed mechanism allows us to fine-tune this trade-off according to the needs of an application by combining features of push and pull strategies nicely. At this point, we do not have any data from the actual system use. Hence, only simulation and laboratory experiments were conducted to compare our work distribution mechanisms with the traditional techniques used by contemporary systems. The results of these experiments are encouraging, and we would like to see the workflow vendors support this approach. A practical concern is the fact that more information is required to configure the workflow management system properly. For example, without real-world data about the suitability of workers, it is hard for the system to make useful decisions. Collecting such data may initially create additional effort for the management of an organization that wishes to adopt this approach. However, it is a one-time exercise, and, besides, using the crude mechanisms of contemporary workflow management systems also creates various problems. Workers are forced to find ad hoc, temporary solutions, thus creating extra work and jeopardizing consistency of quality. Therefore, we expect that using more refined work distribution methods such as the ones presented in this paper will improve overall managerial effectiveness. Acknowledgments The first author gratefully acknowledges support and hospitality of the research institute BETA and the Faculty of Technology and Management, University of Eindhoven, The Netherlands. We also thank the editor and the anonymous referees for their useful comments and suggestions.
29
9. References 1. Aalst, W.M.P. van der. The application of Petri nets to workflow management. The
Journal of Circuits, Systems and Computers, 8, 1 (1998), 21-66. 2. Aalst, W.M.P. van der; Desel, J.; and Oberweis, A. (ed.). Business Process Management:
Models, Techniques, and Empirical Studies, volume 1806 of Lecture Notes in Computer Science. Berlin: Springer-Verlag, 2000.
3. Abbot, K.R.; and Sarin, S.K.. Experiences with workflow management: Issues for the next generation. Proceedings of the ACM Conference on Computer Supported Cooperative Work (CSCW'94), Chapel Hill, North Carolina (1994), 113-120.
4. Ardhaldjian, R.; and Fahner, M. Using simulation in the business process reengineering effort. Industrial engineering, (July 1993), 60-61.
5. Atluri, V.; and Huang W.K. An extended Petri net model for supporting workflows in a multilevel secure environment. Proceedings of the 10th IFIP WG 11.3 Workshop on Database Security (1996), 199-216.
6. Atluri, V.; Huang, W.-K.; and Bertino, E. An execution model for multilevel secure workflows. 11th IFIP Working Conference on Database Security (August 1997), 151-165
7. Bakkenist Management Consultants. ExSpect WWW page. http://www.exspect.com/, 1999.
8. Baskett, F.; Chandy, K.M.; Muntz, R.R.; and Palacios, F.G. Open, closed and mixed networks of queues with different classes of customers. Journal of the Association of Computing Machinery, 22, 2 (1975), 248-260.
9. Bertino, E.; Ferrari, E.; and Atluri, V. Specification and enforcement of authorization constraints in workflow management systems. ACM Transactions on Information and System Security, 2, 1 (February 1999), 65-104.
10.Bussler, C.; and Jablonski, S. Policy resolution for workflow management. Proceedings 28th Hawaii International Conference on System Sciences Conference (January 1995).
11. Buzacott, J.A. Commonalities in reengineered business processes: models and issues. Management Science, 42, 5 (1996), 768-782.
12.Buzacott, J.A.; and Yao, D.D. On queuing networks of flexible manufacturing systems. Queuing Systems, 1 (1986), 29-66.
13.Casati, F.; Grefen, P.; Pernici, B.; Pozzi, G.; and Sánchez, G. WIDE: Workflow Model and Architecture. CTIT Technical Report 96-19. University of Twente, 1996.
14.Casonato, R. Gartner Group Research Note 00057684, Production-Class Workflow: A View of the Market, Gartner Group, http://www.gartner.com, 1998.
15.Castano, S.; and Fugini, M. Rules and patterns for security in workflow systems. Proceedings of the IFIP WG 11.3 Working Conference on Database Security (August 1998), 59-74
16.Dijk, N.M. van. Queueing Networks and Product Forms: A Systems Approach. Chichester: John Wiley and Sons, 1993.
17.Dourish, P; Holmes, J.; MacLean, A.; Marqvardsen, P; and Zbyslaw, A. Freeflow:Mediating between Representation and Action in Workflow Systems. Proceedings of the ACM Conference on Computer-Supported Cooperative Work (CSCW'96), (1996), New York: ACM, 190-198.
18.Ferraiolo, D. F.; and Kuhn, D.R. Role-Based Access Control. In 15th National Computer Security Conference. NIST/NSA, 554-563, 1992.
30
19.Ferraiolo, D. F.; Cugini, J.; and Kuhn, D.R. Role-based access control: features and motivation. Proceedings of the 11th Annual Computer Security Applications Conference (1995). IEEE Computer Society Press, 241-248.
20.Grinter, R.E. Workflow Systems: Occasions for Success and Failure Computer Supported Cooperative Work, 9, 2 (2000), 189-214.
21.Hammer, M.; and Champy, J. Reengineering the corporation. London: Nicolas Brealey Publishing,, 1993.
22.Hansen, G.A. Automated Business Process Reengineering: Using the Power of Visual Simulation Strategies to Improve Performance and Profit. Englewood Cliffs: Prentice-Hall, 1997.
23.Jablonski, S.; and Bussler, C. Workflow Management: Modeling Concepts, Architecture, and Implementation. London: International Thomson Computer Press, 1996.
24.Johansson, H.J.; McHugh, P.; Pendlebury, A.J.; and Wheeler, W.A. Business Process Reengineering: Breakpoint Strategies for Market Dominance. New York: John Wiley and Sons, 1993.
25.Kleinrock, L. Queueing Systems, Volume 1: Theory. New York: John Wiley and Sons, 1975.
26.Lawrence, P. (ed.). Workflow Handbook 1997, Workflow Management Coalition. New York: John Wiley and Sons, 1997.
27.Manganelli, R.L.; and Klein, M.K. The Reengineering Handbook: A Step-by-step Guide to Business Transformation. New York: AMACOM, 1996.
28.Morris D.; and Brandon, J. Reengineering your business. New York: McGraw-Hill, 1993. 29.Nyanchama, M.; and Osborn, S.L. The role graph model and conflict of interest. ACM
Transaction on Information and System Security, 1 (1999), 3-33. 30.Pallas Athena. Protos 4.0. http://www.pallas.nl/, 1999. 31.Poyssick, G.; and Hannaford, S. Workflow Reengineering. Mountain View, CA: Adobe
Press, 1996. 32.Reijers, H.A.; and Aalst, W.M.P. van der. Short-term simulation: bridging the gap between
operational control and strategic decision making. Proceedings of the IASTED International Conference on Modeling and Simulation (1999), 417-421.
33.Ross, S.M. A Course in Simulation. London: Collier Macmillan, 1990. 34.Sandhu, R.S.; Coyne, E.J.; Feinstein, H.L.; and Youman, C.E. Role-based access control
models. IEEE Computer, 29, 2 (1996), 38-47. 35.Sandhu, R.S.; Bhamidipati V.; and Manuawer, Q. The ARBAC97 model for role-based
administration of roles. ACM Transactions on Information and System Security, 2, 1 (February 1999), 105-135.
36.Simon, R. and Zurko, M. E. Separation of duty in role-based environments. Proceedings of the 10th Computer Security Foundations Workshop (1997), 183-194.
37.Staffware. Staffware GWD Procedure’s Guide, Version 8, Issue 2. Berkshire, UK: Staffware plc, 1999.
38.Suchman, L. Do Categories have Politics? Computer Supported Cooperative Work, 2, 3 (1994), 177-190.
39.Winograd, T. Categories, Disciplines, and Coordination? Computer Supported Cooperative Work, 2, 3(1994), 191-197.
31
40.Winograd, T; and Flores, F. Understanding Computers and Cognition: A New Foundation for Design. Norwood, NJ: Ablex Publishing Corporation, 1986.
41.Wirth, N. What can we do about the unnecessary diversity of notation for syntactic definitions. Communications of the ACM, 20, 11 (1977), 822-823.
42.Zapf, M.; and Heinzl, A. Evaluation of generic process design patterns: An experimental study. Lecture Notes in Computer Science, 1806 (2000), 83-98.
43.zur Mühlen, M. Resource modeling in workflow applications. Proceedings of the 1999 Workflow Management Conference (November 1999), 137-153.
44.zur Mühlen, M. Evaluation of workflow management systems using meta models. Proceedings of the 32nd Hawaii International Conference on System Sciences (1999).
32
Bio sketches Akhil Kumar is currently a visiting researcher at Bell Labs, Murray Hill, NJ, on leave from University of Colorado, Boulder, where he is on the faculty of the College of Business. He holds a Ph.D. in Information Systems from University of California, Berkeley. In the past, he has served on the faculty at Cornell University and also worked in industry. He has published nearly fifty scholarly papers in top journals and leading international conferences in the database, and distributed and intelligent information systems areas. His current research efforts are focused in workflow systems and electronic commerce. Wil M.P. van der Aalst is a full professor of Information Systems and head of the Department of Information and Technology of the Faculty of Technology Management of Eindhoven University of Technology. He is also a part-time full professor at the Computing Science department of the same university and has been working as a part-time consultant for Bakkenist for several years. His research interests are information systems, simulation, Petri nets, process models, workflow management systems, verification techniques, enterprise resource planning systems, computer supported cooperative work, and interorganizational business processes. Eric M.W. Verbeek is a scientific programmer of the Department of Information and Technology of the Faculty of Technology Management of Eindhoven University of Technology. For several years he has been working on the tools ExSpect (a Petri-net-based specification tool) and Woflan (a Petri-net-based workflow analysis tool). His main research interests are Petri nets, workflow management systems, and business process design.